Embed Size (px)
Citation preview

1
EZEAGU, CASMIR U
(PG/M.Sc/11/58652)
Nwamarah Uche
Digitally Signed by: Content manager’s Name
DN : CN = Weabmaster’s name
O= University of Nigeria, Nsukka
OU = Innovation Centre
Faculty of Biological Sciences
Department of Biochemistry
ANTIDIABETIC AND ANTIOXIDANT EFFECTS OF BRYOPHYLLUM
PINNATUM IN ALLOXAN-
INDUCED DIABETIC RATS
2
CHAPTER ONE
INTRODUCTION
Tropical forests are biologically lavished with diverse ecosystem of plants whose
potential value as natural pharmacy is yet to be discovered (Cohen-Kohler, 2007). The native
people have for centuries used plants as medicine. There is need to stimulate traditional healers.
Traditional medicine involves the use of herbs, animal parts and minerals in prevention and
treatment of diseases, however, herbal medicine is the most widely used of the three. Right from
the beginning, all or parts of all plant species have been used in medicine. Herbal medicine has
been gaining wide acceptance in recent times. One of the reasons for this trend is the high cost of
orthodox medicines which put the intending beneficiaries beyond the reach of many people
particularly the poor countries (Osujih, 1993; Cohen-Kohler, 2007). There has been the
erroneous impression that herbal medicine has fewer side effects (Larrey, 1994; Chan, 2009).
Although many of the claims ascribed to herbal medicine have not been proven scientifically,
some herbs have been extensively studied, thereby warranting their use as alternative to or
complements of orthodox medicines.
A major criticism associated with the use of herbal medicine is the absence of scientific
evaluation of their safety profiles, since many of them have turned out to be toxic (Ernst, 2005;
Yeung et al., 2008). About 80% of the world population is dependent wholly or partially on
plant-based drugs (WHO, 1996). In Nigeria and most developing countries of the world, rural
and urban dwellers, literate or illiterate rely heavily on herbal preparations for treatment of
various diseases despite availability of orthodox medicine (Nwabuisi, 2002).
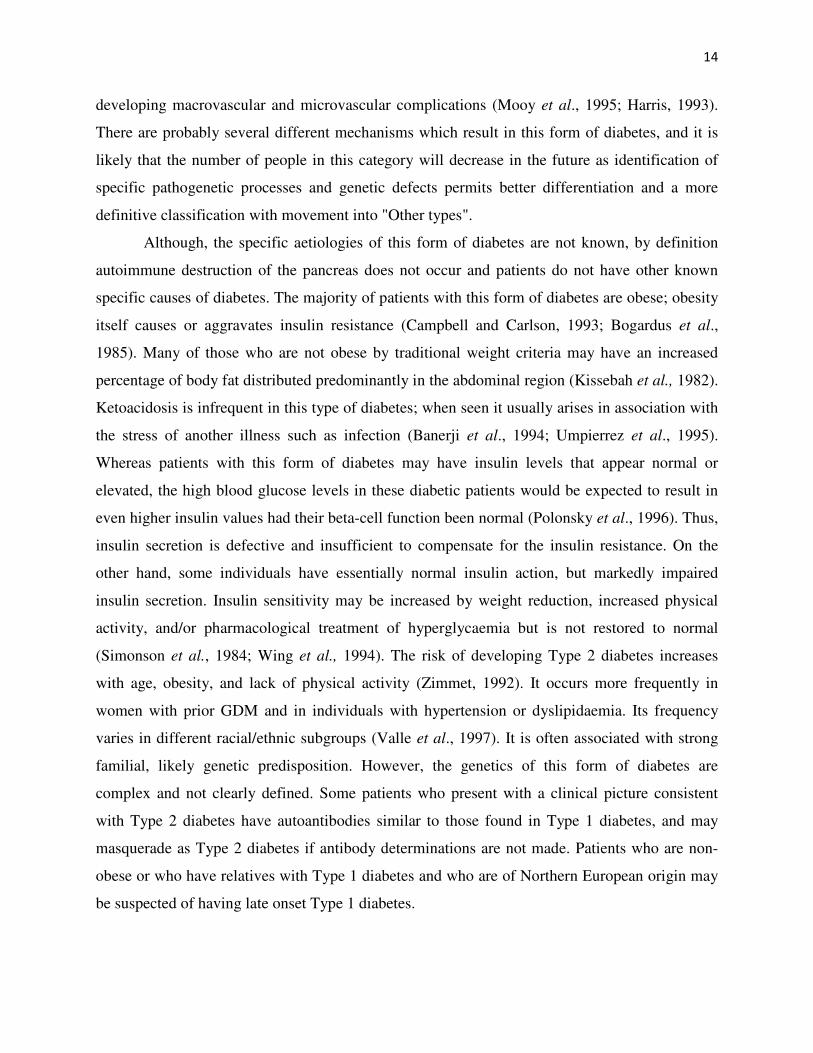
1.1 Bryophyllum pinnatum
Bryophyllum pinnatum is a perennial herb that grows in the wild and used as a traditional
medicinal as well as ornamental plant in tropical Africa, China, Australia, tropical America and
India. The Genus belongs to the family of Crassulaceae and is cultivated as ornamental house
plant on rocks or in the garden (Kulka, 2006). It is commonly called air plant, Canterbury bell,
cathedral bell, life plant and resurrection plant. It is found in many parts of the world largely
because of it is easy to cultivate. This may also be the reason for its extensive use in herbal
medicine. It is commonly found in the Southern part of Nigeria. The plant is a perennial herb
3
with hollow stem. It is 1-1.5 meters high does not have branches. The leaves appear to be the
most valuable part of the plant for medicinal purposes. The lower and uppermost leaves are
simple but the middle ones are usually pinnately compound with 3-5 leaflets, opposite flat and
elliptic blades which are 5-20 cm long and 2-10 cm wide. The margins of the leaves are crenate
and sometimes produce bulbils (Wagner and Sohmer, 1999). The leaves are fleshy dark green
that are distinctly scalloped and trimmed in red. The plant flowers in November-March and fruits
in April. It is astringent, sour in taste, sweet in post digestive effect and has hot potency. It is
well known for its haemostatic and wound healing properties (Kahn et al., 2004). Various
species of B. pinnatum are used medicinally in Indo-China and Philippine islands. It is
naturalized throughout the hot and moist parts of India. The leaves and bark are bitter tonic,
astringent, to the bowels, analgesic, carminative, useful in diarrhea, ulcer and vomiting (Pal et
al., 1999).
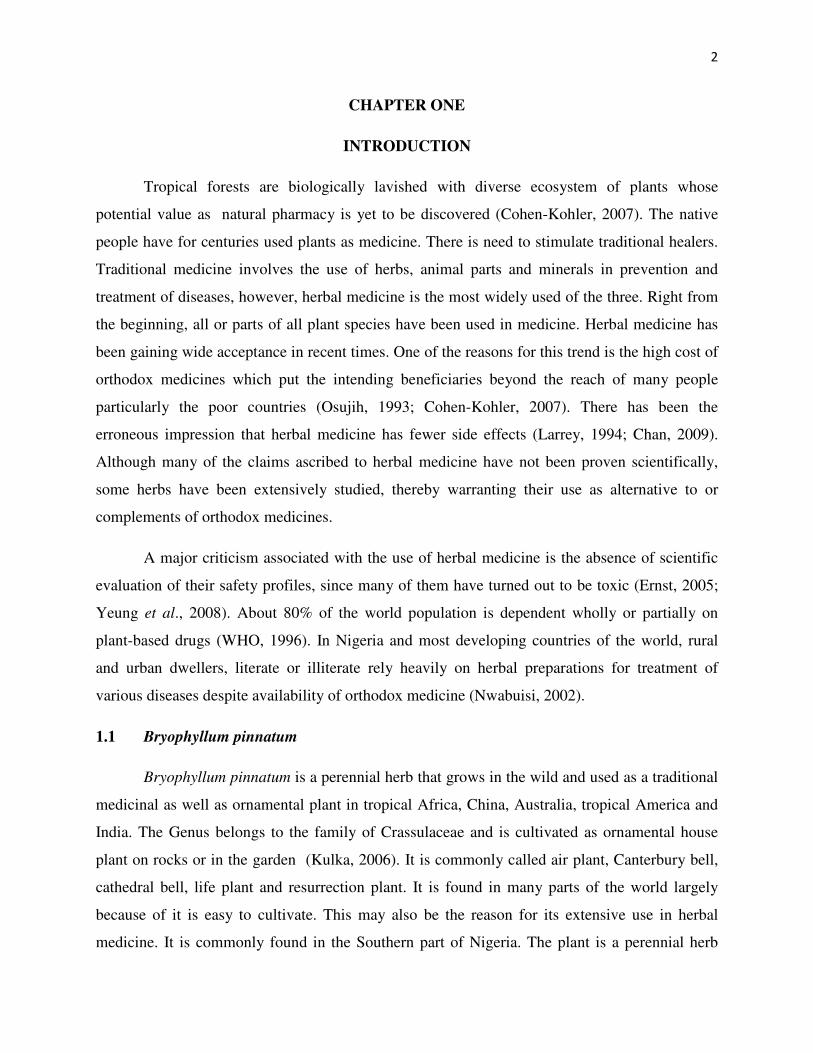
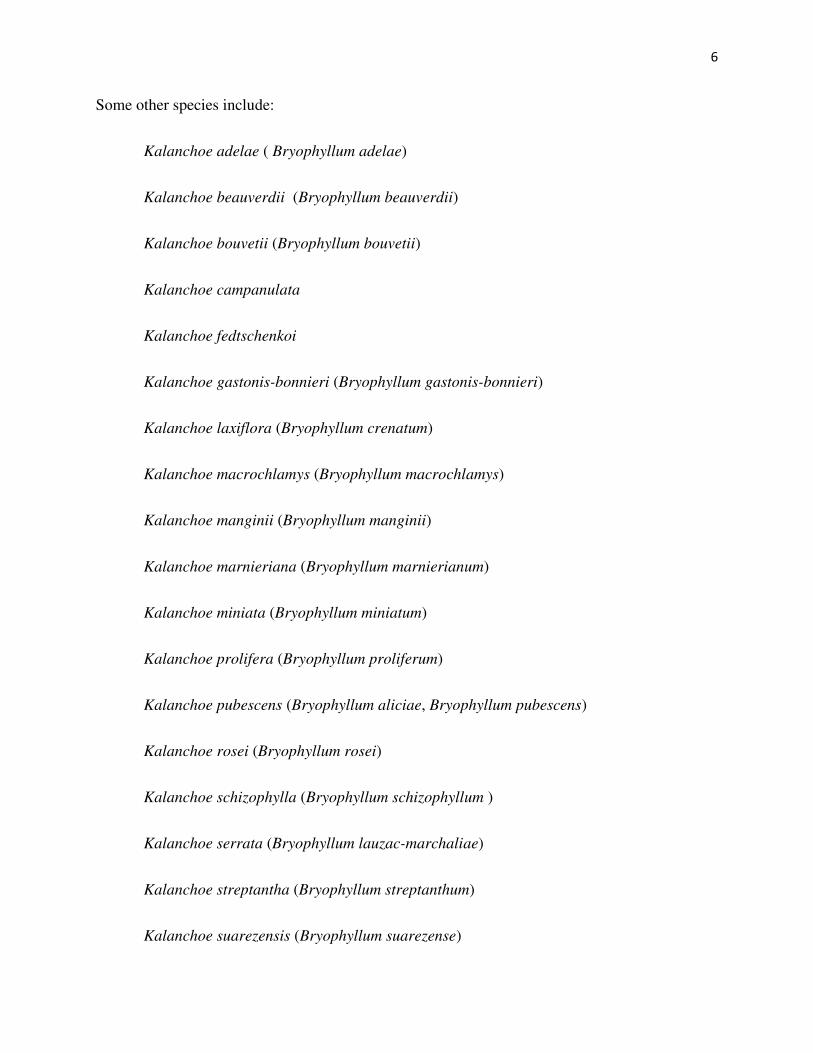
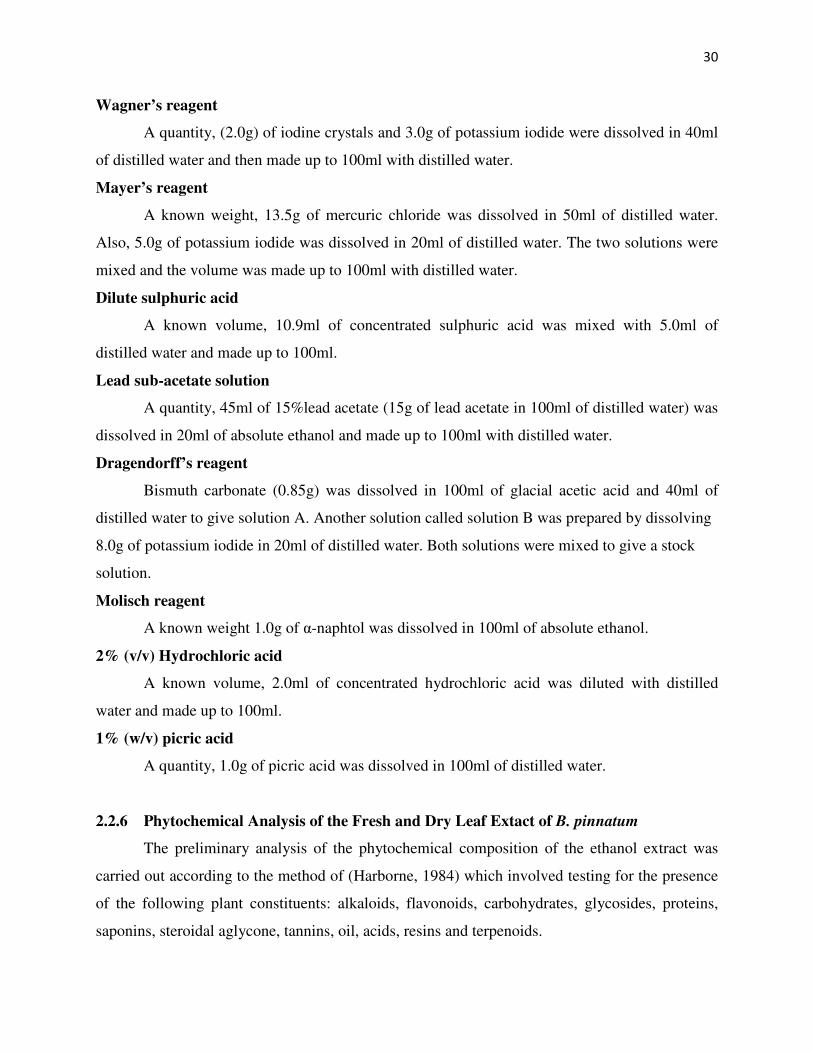
Fig. 1: The plant Bryophyllum pinnatum
(Source: Government Reserved Area (GRA) Nsukka )
4
1.1.1 Morphology of Bryophyllum pinnatum
Bryophyllum is a rapidly-growing succulent herb. The leaves are thick and fleshy,
simple, or compound in pairs, on reddish stems. Plantlets grow from the notches of the leaf
margins, and they can develop either while still attached to the mother plant, or when detached.
The plant can also reproduce from adventitious shoots from the juvenile leaf bases. The flowers
are in paniculate cymes 20–80 cm long, each one pendant on pedicels 1–2.5 cm in length. Each
flower is about 5 cm long and bell-shaped, greenish or yellowish, reddish by the stems, and very
attractive. The plant can form dense stands in disturbed and dry areas. It is especially invasive in
parts of Hawaii that are of low elevation. In Fiji it is a weed of waste places and cultivated fields,
and along roadsides, naturalized on rocky coasts and slopes, and sometimes in dry forest.
Bryophyllum pinnatum is heterolytic expressing both simple and compound leaf
morphology simultaneously. During the initial growth of B pinatum, the apical meristem or
growth tip of undifferentiated tissue produces juvenile leaves at the base at the base of the plant.
These leaves remain juvenile even as the stem continues to elongate and other leaves are
produced (Wagner and Sohner, 1999). These leaves at the bottom of the plant are old in age
which indicates that they are the first on the plant but still juvenile in terms of their phase of
development. As B. pinnatum continues to grow into adult phase, the apical meristem produces
adult leaves. These leaves are young in age but are adult with regard to their phase of
development. Bryophyllum pinnatum produces simple leaf morphology at its early stage of
development and compound leaf morphology at the adult phase of development (Wagner and
Sohner, 1999).
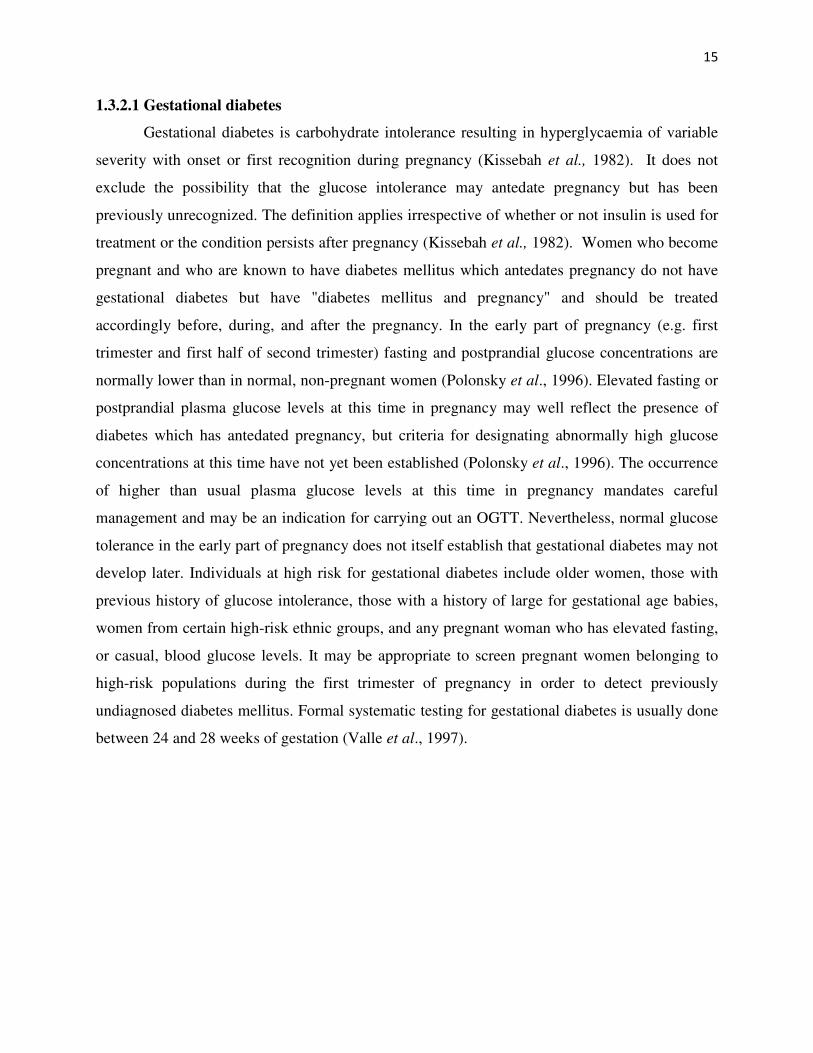
1.1. 2 Taxonomy of Bryophyllum pinnatum.
Kingdom: Plantae.
Subkingdom: Tracheobionta (vascular plants).
Superdivision: Spermatophyta (seed plants).
Division: Magnoliophyta (flowering plants).
Class: Magnoliopsida (dicotyledons)
5
Order: Saxfragales.
Family: Crassulaceae (stone crop family).
Genus: Bryophyllum
Botanical Name: Bryophyllum pinnatum. Synonym: (Kalanchoe pinnatum)
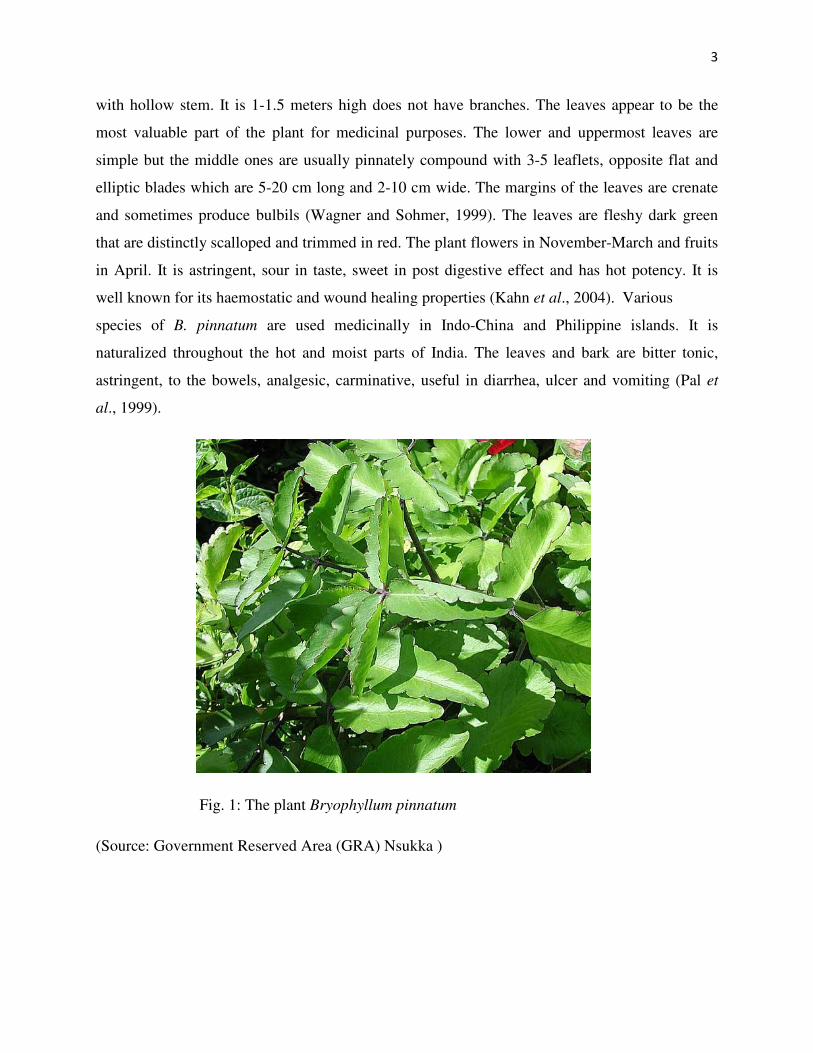
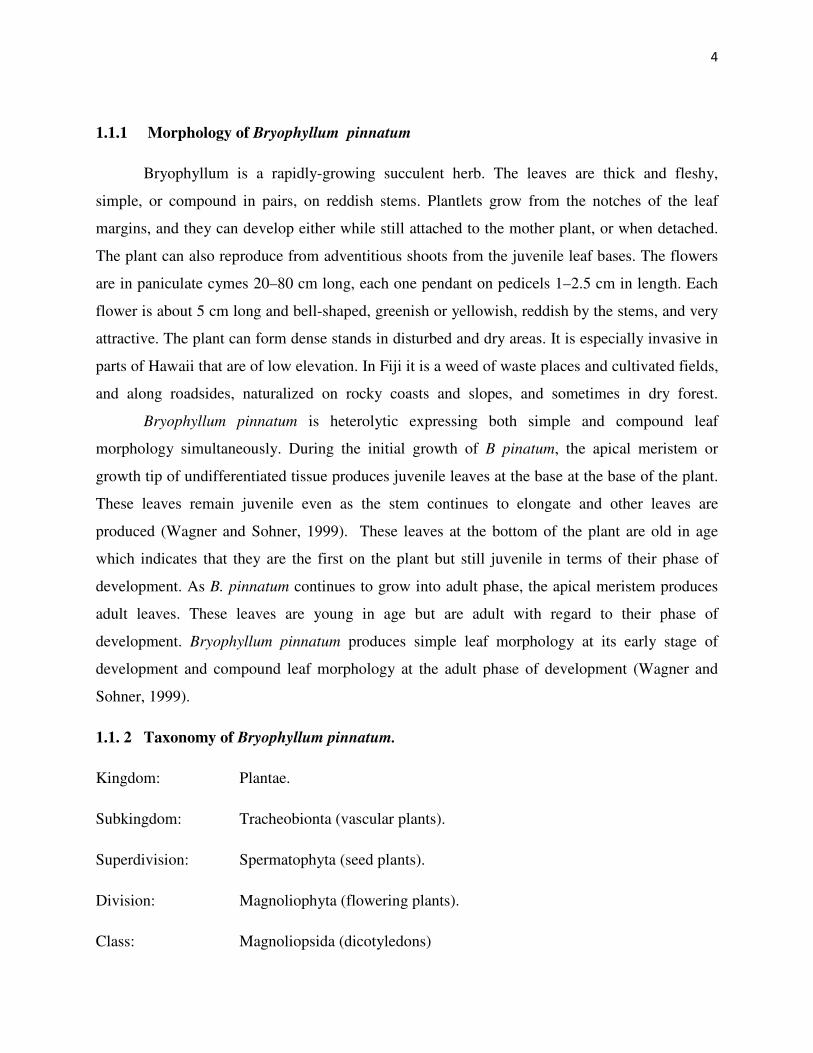
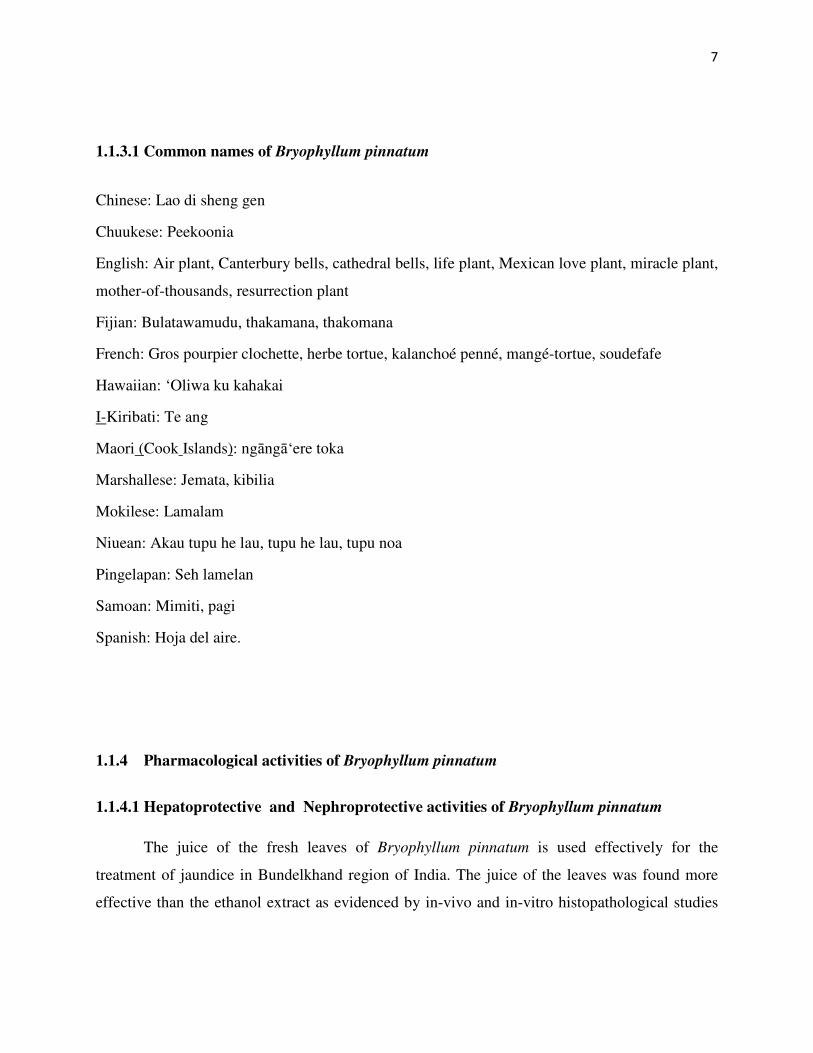
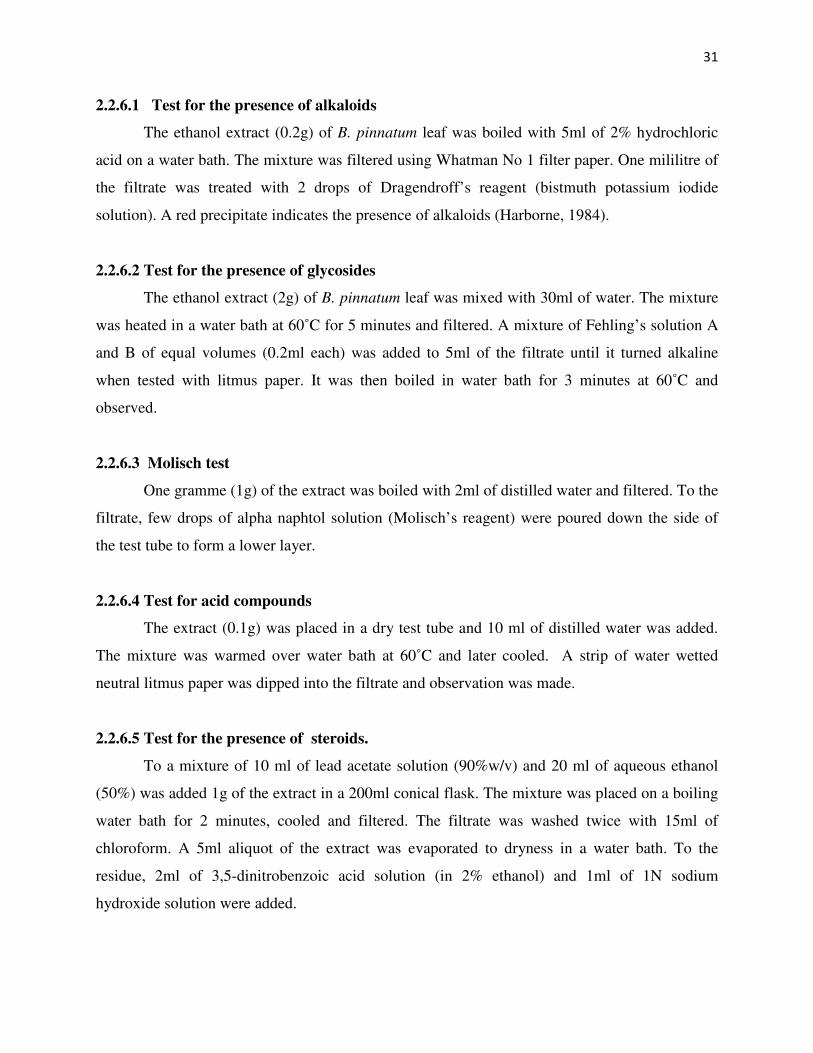
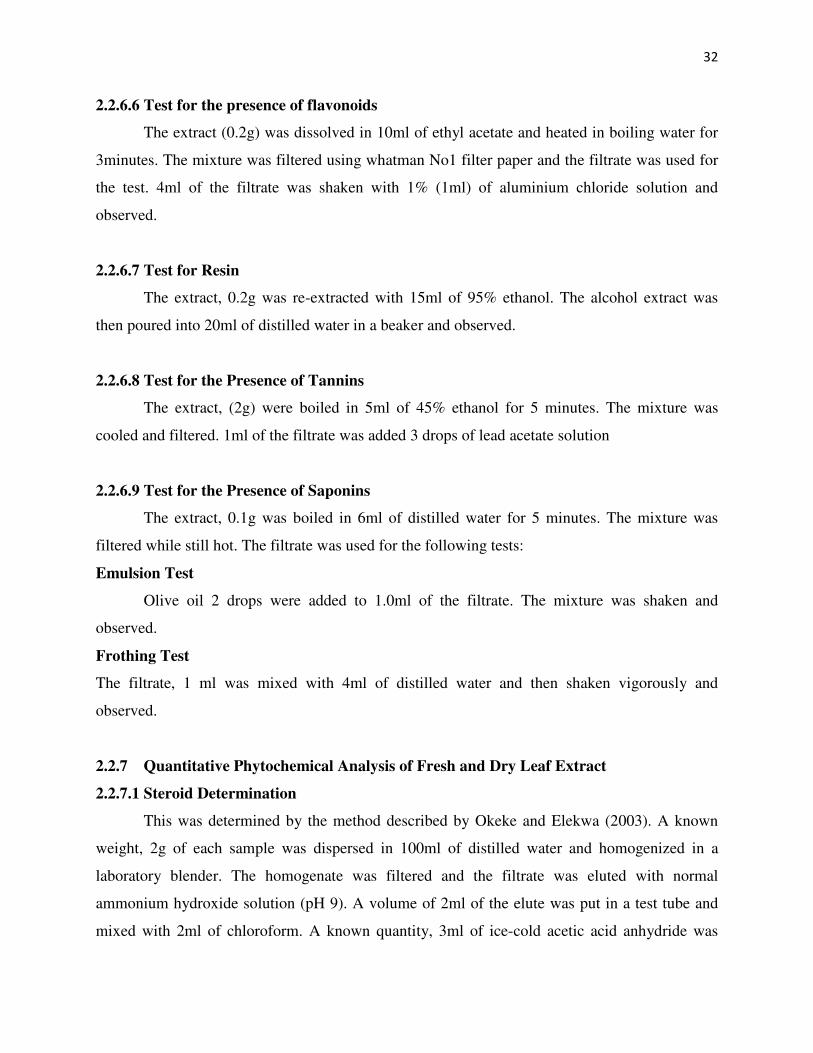
Fig 2: Bryophyllum pinnatum leaf
1.1.3 Geographical distribution of Bryophyllum pinnatum
Bryophyllum pinnatum is the air plant, miracle or life plant is a native to Madagascar. It is
a popular houseplant and has become naturalized in temperate regions of Asia, the pacific and
Caribbean, Australia, Newzealand, West Indies, Macaronesia, Galapagos, Polynesia and Hawaii.
It is widely distributed in Philippines and it is known as katakataka which means astonishing or
remarkable. Much of the reason for the widespread naturalization of this plant can be traced to its
popularity as a garden plant. The group is notable for vegetatively growing small plantlets on the
fringes of the leaves which eventually drop off and root. These plantlets arise from mitosis of
meristematic type tissue in notches in the leaves (Wagner and Sohner, 1999).
6
Some other species include:
Kalanchoe adelae ( Bryophyllum adelae)
Kalanchoe beauverdii (Bryophyllum beauverdii)
Kalanchoe bouvetii (Bryophyllum bouvetii)
Kalanchoe campanulata
Kalanchoe fedtschenkoi
Kalanchoe gastonis-bonnieri (Bryophyllum gastonis-bonnieri)
Kalanchoe laxiflora (Bryophyllum crenatum)
Kalanchoe macrochlamys (Bryophyllum macrochlamys)
Kalanchoe manginii (Bryophyllum manginii)
Kalanchoe marnieriana (Bryophyllum marnierianum)
Kalanchoe miniata (Bryophyllum miniatum)
Kalanchoe prolifera (Bryophyllum proliferum)
Kalanchoe pubescens (Bryophyllum aliciae, Bryophyllum pubescens)
Kalanchoe rosei (Bryophyllum rosei)
Kalanchoe schizophylla (Bryophyllum schizophyllum )
Kalanchoe serrata (Bryophyllum lauzac-marchaliae)
Kalanchoe streptantha (Bryophyllum streptanthum)
Kalanchoe suarezensis (Bryophyllum suarezense)
7
1.1.3.1 Common names of Bryophyllum pinnatum
Chinese: Lao di sheng gen
Chuukese: Peekoonia
English: Air plant, Canterbury bells, cathedral bells, life plant, Mexican love plant, miracle plant,
mother-of-thousands, resurrection plant
Fijian: Bulatawamudu, thakamana, thakomana
French: Gros pourpier clochette, herbe tortue, kalanchoé penné, mangé-tortue, soudefafe
Hawaiian: ‘Oliwa ku kahakai
I-Kiribati: Te ang
Maori (Cook Islands): ngāngā‘ere toka
Marshallese: Jemata, kibilia
Mokilese: Lamalam
Niuean: Akau tupu he lau, tupu he lau, tupu noa
Pingelapan: Seh lamelan
Samoan: Mimiti, pagi
Spanish: Hoja del aire.
1.1.4 Pharmacological activities of Bryophyllum pinnatum
1.1.4.1 Hepatoprotective and Nephroprotective activities of Bryophyllum pinnatum
The juice of the fresh leaves of Bryophyllum pinnatum is used effectively for the
treatment of jaundice in Bundelkhand region of India. The juice of the leaves was found more
effective than the ethanol extract as evidenced by in-vivo and in-vitro histopathological studies
8
for hepatoprotective activity of the plant leaves in folk medicine for jaundice (Yadav and Dixit,
2003).
1.1.4.2 Antimutagenic activity
The plant has potent antihistamine and antiallergic activity (Nassis et al., 1992). The
methanol extract of the leaves has also been reported to have histamine receptor (H1) antagonism
in the ileum, peripheral vasculature and bronchial muscle. The methanol extract also protect
against chemically induced anaphylactic reactions and death by selectively blocking histamine
receptors in the lungs (Nassis et al., 1992; Pal et al., 1999).
1.1.4.3 Antihypertensive activity of Bryophyllum pinnatum
The herb possesses hypotensive activity and this lends credence to the folkloric use of the
herb in the management of hypertension (Ojewole, 2002). The plant is commonly used in the
management of all types and grades of hypertension by some Yorubas of the western Nigeria.
Calcium is the most abundant macroelement present in the plant. Normal extracellular calcium
concentrations are necessary for blood coagulation and for the integrity of intracellular cement
substances (Okaka and Okaka, 2001). The low sodium content of B. pinnatum might be an added
advantage due to the direct relationship of sodium intake with hypertension on human (Dahl,
1972). The effects of aqueous and methanol leaf extracts were examined on arterial blood
pressures and heart rates of normal and spontaneously hypertensive rats using invasive and non-
invasive techniques. Both the extracts produced dose-related significant decreases in arterial
blood pressures and heart rates of anaesthetized normotensive and hypertensive rats. The
hypotensive effects of the extracts were more pronounced in the hypertensive than normotensive
rats (Ojewole, 2002).
1.1.4.4 Analgesic, Anti-inflammatory and wound healing activity of Bryophyllum pinnatum
The high saponin content justifies the use of the plant extracts to stop bleeding and in
treating wounds. Saponin has the property of precipitating and coagulating red blood cells. Some
of the characteristics of saponin include formation of foams in aqueous solution, haemolytic
activity, cholesterol binding properties and bitterness. These properties bestow high medicinal
activities on the extracts of Bryophyllum pinnatum (Khan et al., 2004). Tannins have astringent
9
properties, hasten the healing of wounds and inflamed mucous membranes. These perhaps
explain why traditional medicine healers in southern Nigerian often use herb in treating wounds
and burns. Aqueous extract of Bryophyllum pinnatum can demonstrate strong analgesic potency
comparable in time and dose dependent manner to a non steroidal anti-inflammatory drug (Igwe
and Akunyili, 2005).
1.1.5 Indigenous Uses of Bryophyllum pinnatum
The Creoles in America use the slightly roasted leaves in the treatment of cancer,
inflammations and a leaf infusion for fever. The Palikur in India mix the leaf juice with coconut
oil and then rub it on the fore head for migraines and headache. In Mexico and Nicaragua, it is
used to promote menstruation and assist in child birth (Gwehenberger et al., 2004). In Nigeria
and other West African countries, its fleshy leaves are frequently used as a herbal remedy for an
array of human disorders including: boils, wounds, bruises, insect bites, arthritis, rheumatism,
headaches and body pains (Khan et al., 2004). It is employed in the treatment of kidney stones,
gastric ulcers, burns, skin disorders and edema of the legs (Da Silva et al., 1995). Externally, the
pulp of the leaves or the juice is applied on traumatic injuries to arrest the bleeding as it contracts
the minute arterioles and promote the healing without leaving a scar. The herb is highly
recommended in bleeding disorder, piles and menorrhagia (Dalziel, 1937).
1.2 Diabetes Mellitus
The term diabetes mellitus describes a metabolic disorder of multiple aetiology
characterized by chronic hyperglycemia with disturbances of carbohydrate fat and protein
metabolism resulting from defects in insulin secretion, insulin action, or both (Sundaram, 1996).
Translated from ancient Greek, diabetes mellitus means 'honey sweet flow' and this stemmed
from a time in which tasting a patient's urine was still part of the physician's diagnostic
repertoire. The effects of diabetes mellitus include long-term damage, dysfunction and failure of
various organs.
1.2.1 Symptoms of Diabetes Mellitus
Diabetes mellitus may present with characteristic symptoms such as thirst, polyuria,
blurring of vision, and weight loss. In its most severe forms, ketoacidosis or a non-ketotic
10
hyperosmolar state may develop and lead to stupor, coma and, in absence of effective treatment,
death. Often, symptoms are not severe, or may be absent, and consequently hyperglycaemia
sufficient to cause pathological and functional changes may be present for a long time before the
diagnosis is made.
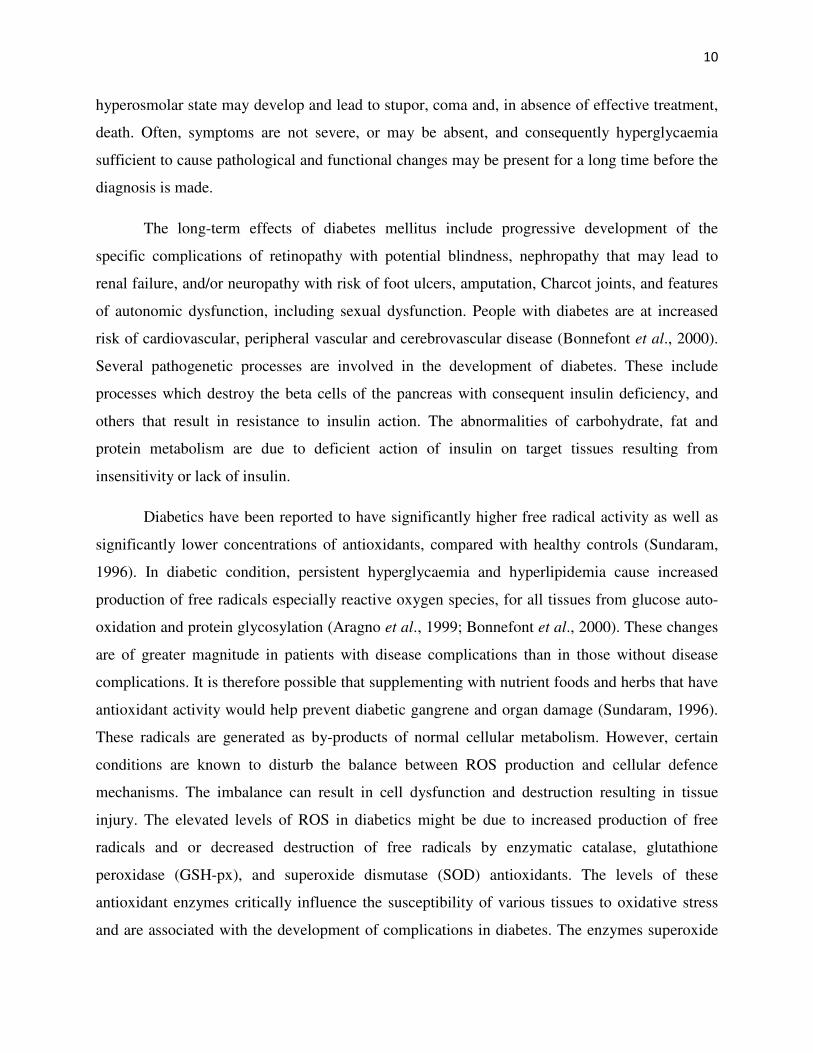
The long-term effects of diabetes mellitus include progressive development of the
specific complications of retinopathy with potential blindness, nephropathy that may lead to
renal failure, and/or neuropathy with risk of foot ulcers, amputation, Charcot joints, and features
of autonomic dysfunction, including sexual dysfunction. People with diabetes are at increased
risk of cardiovascular, peripheral vascular and cerebrovascular disease (Bonnefont et al., 2000).
Several pathogenetic processes are involved in the development of diabetes. These include
processes which destroy the beta cells of the pancreas with consequent insulin deficiency, and
others that result in resistance to insulin action. The abnormalities of carbohydrate, fat and
protein metabolism are due to deficient action of insulin on target tissues resulting from
insensitivity or lack of insulin.
Diabetics have been reported to have significantly higher free radical activity as well as
significantly lower concentrations of antioxidants, compared with healthy controls (Sundaram,
1996). In diabetic condition, persistent hyperglycaemia and hyperlipidemia cause increased
production of free radicals especially reactive oxygen species, for all tissues from glucose auto-
oxidation and protein glycosylation (Aragno et al., 1999; Bonnefont et al., 2000). These changes
are of greater magnitude in patients with disease complications than in those without disease
complications. It is therefore possible that supplementing with nutrient foods and herbs that have
antioxidant activity would help prevent diabetic gangrene and organ damage (Sundaram, 1996).
These radicals are generated as by-products of normal cellular metabolism. However, certain
conditions are known to disturb the balance between ROS production and cellular defence
mechanisms. The imbalance can result in cell dysfunction and destruction resulting in tissue
injury. The elevated levels of ROS in diabetics might be due to increased production of free
radicals and or decreased destruction of free radicals by enzymatic catalase, glutathione
peroxidase (GSH-px), and superoxide dismutase (SOD) antioxidants. The levels of these
antioxidant enzymes critically influence the susceptibility of various tissues to oxidative stress
and are associated with the development of complications in diabetes. The enzymes superoxide
11
dismutase, glutathione peroxidase and catalase activities contribute to eliminate superoxide
anions, hydroxyl radicals and hydrogen peroxide respectively (Soto et al., 2003).
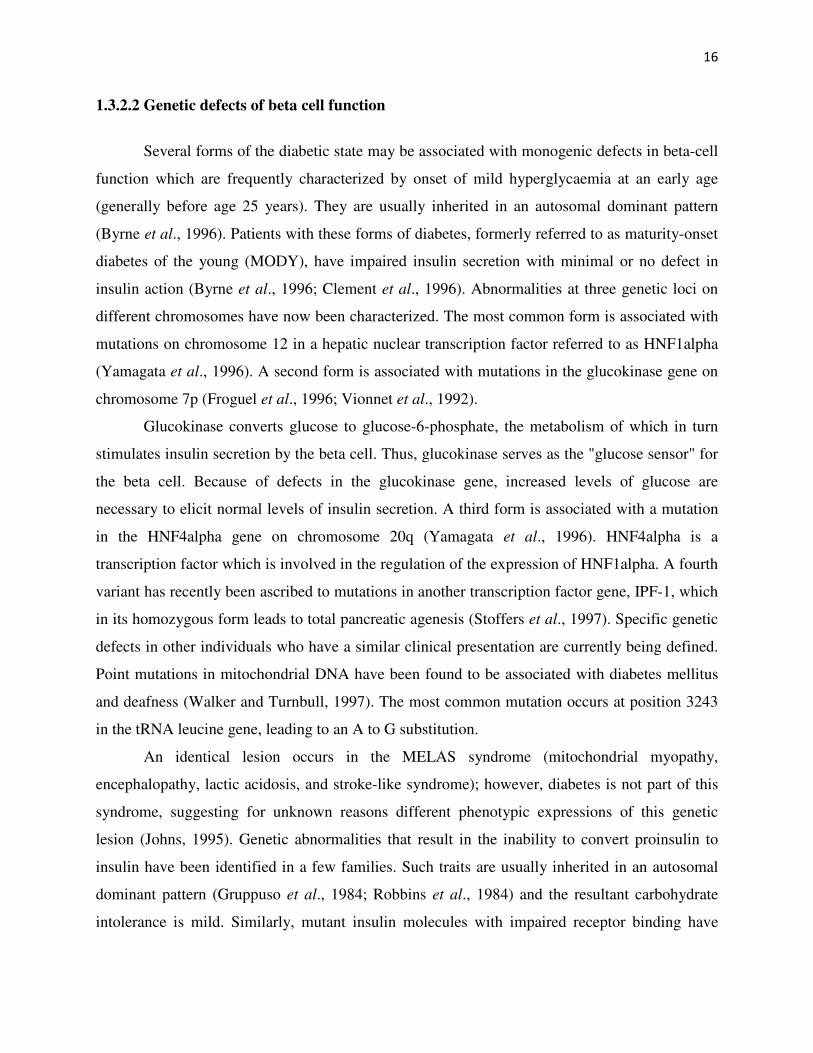
1.2.2 Blood Glucose Regulation
The homeostatic mechanism which keeps the blood glucose concentration in a
remarkably narrow range is composed of several interacting systems of which hormone
regulation is the most important. There are two types of mutually antagonistic metabolic
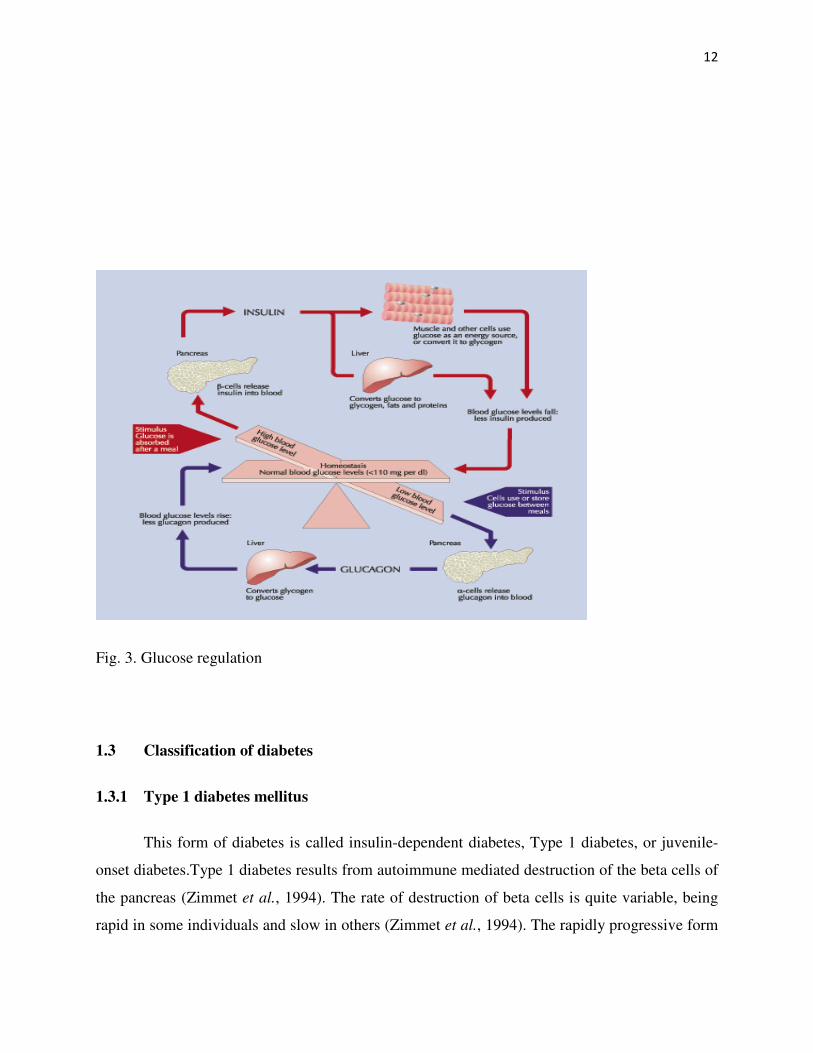
hormones that are affecting blood glucose levels as shown in Fig. 3 below: catabolic hormones
such as glucagon, growth hormone e.g pituitary hormone, glucocorticoid e.g. cortisol,
catecholamines e.g. adrenaline, noradrenaline, dopamine which increases blood glucose; while
anabolic hormone (insulin) decreases blood glucose. The human blood sugar level should be
fairly constant at all times and this is made possible by the action of the two antagonistic
hormones, insulin and glucagon. Both insulin and glucagon are secreted by the pancreas, and
thus are referred to as pancreatic endocrine hormones. It is the production of insulin and
glucagon by the pancreas which determines if a patient has diabetes, hypoglycaemia or some
other sugar problem (John and Henry, 2001).
The inducer for insulin secretion is high blood glucose. Although, there is always low
level of insulin secreted by the pancreas, the amount secreted into the blood increases as the
blood glucose rises. Similarly, as blood glucose falls, the amount of insulin by the beta cells
decreases. Insulin has an effect on number of cells, including muscle, red blood cells and fat
cells. In response to insulin, these cells absorb glucose out of the blood, having the net effect of
lowering the high blood glucose levels into the normal range (John and Henry, 2001). Glucagon
is secreted by the alpha cells of the pancreas in the same pattern as insulin but in opposing
biochemical mechanism. If the blood glucose is high, no glucagon will be secreted. When blood
glucose has decreased such as during period of fasting, more glucagon will be secreted. The
effect of glucagon is to facilitate the release of glucose from the liver cells into the blood stream,
with the net effect of increasing blood glucose. Glucagon also facilitates gluconeogenesis.
12
Fig. 3. Glucose regulation
1.3 Classification of diabetes
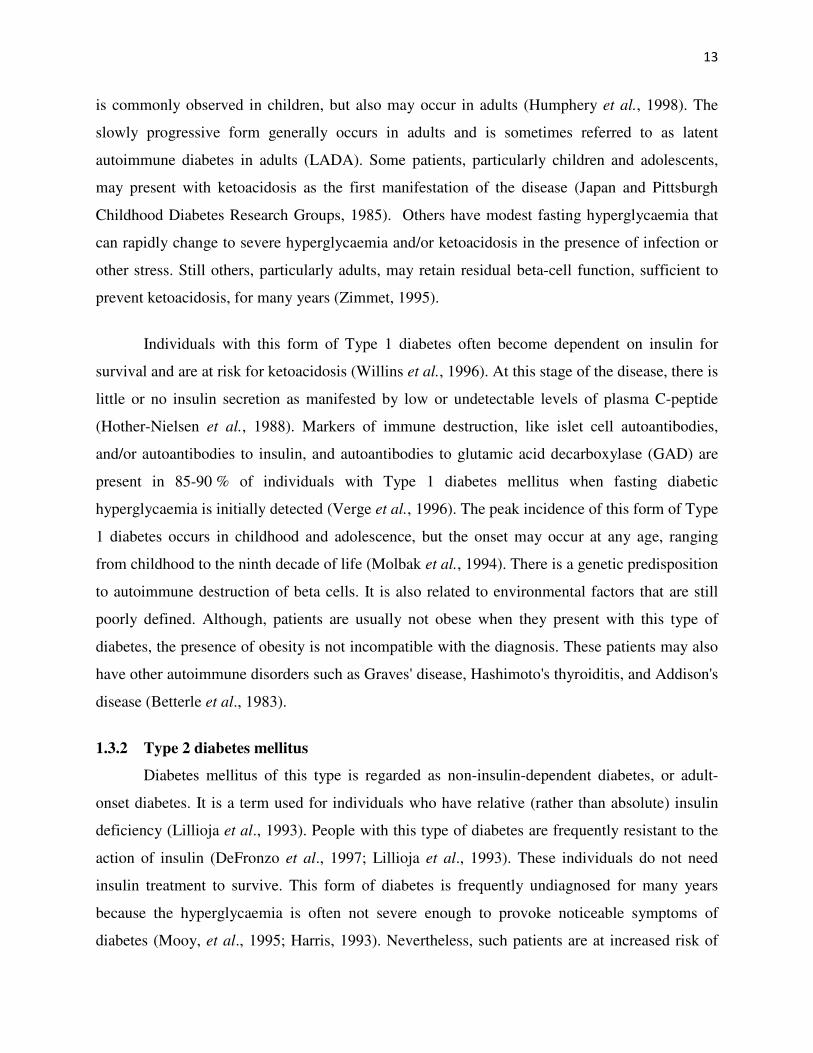
1.3.1 Type 1 diabetes mellitus
This form of diabetes is called insulin-dependent diabetes, Type 1 diabetes, or juvenile-
onset diabetes.Type 1 diabetes results from autoimmune mediated destruction of the beta cells of
the pancreas (Zimmet et al., 1994). The rate of destruction of beta cells is quite variable, being
rapid in some individuals and slow in others (Zimmet et al., 1994). The rapidly progressive form
13
is commonly observed in children, but also may occur in adults (Humphery et al., 1998). The
slowly progressive form generally occurs in adults and is sometimes referred to as latent
autoimmune diabetes in adults (LADA). Some patients, particularly children and adolescents,
may present with ketoacidosis as the first manifestation of the disease (Japan and Pittsburgh
Childhood Diabetes Research Groups, 1985). Others have modest fasting hyperglycaemia that
can rapidly change to severe hyperglycaemia and/or ketoacidosis in the presence of infection or
other stress. Still others, particularly adults, may retain residual beta-cell function, sufficient to
prevent ketoacidosis, for many years (Zimmet, 1995).
Individuals with this form of Type 1 diabetes often become dependent on insulin for
survival and are at risk for ketoacidosis (Willins et al., 1996). At this stage of the disease, there is
little or no insulin secretion as manifested by low or undetectable levels of plasma C-peptide
(Hother-Nielsen et al., 1988). Markers of immune destruction, like islet cell autoantibodies,
and/or autoantibodies to insulin, and autoantibodies to glutamic acid decarboxylase (GAD) are
present in 85-90 % of individuals with Type 1 diabetes mellitus when fasting diabetic
hyperglycaemia is initially detected (Verge et al., 1996). The peak incidence of this form of Type
1 diabetes occurs in childhood and adolescence, but the onset may occur at any age, ranging
from childhood to the ninth decade of life (Molbak et al., 1994). There is a genetic predisposition
to autoimmune destruction of beta cells. It is also related to environmental factors that are still
poorly defined. Although, patients are usually not obese when they present with this type of
diabetes, the presence of obesity is not incompatible with the diagnosis. These patients may also
have other autoimmune disorders such as Graves' disease, Hashimoto's thyroiditis, and Addison's
disease (Betterle et al., 1983).
1.3.2 Type 2 diabetes mellitus
Diabetes mellitus of this type is regarded as non-insulin-dependent diabetes, or adult-
onset diabetes. It is a term used for individuals who have relative (rather than absolute) insulin
deficiency (Lillioja et al., 1993). People with this type of diabetes are frequently resistant to the
action of insulin (DeFronzo et al., 1997; Lillioja et al., 1993). These individuals do not need
insulin treatment to survive. This form of diabetes is frequently undiagnosed for many years
because the hyperglycaemia is often not severe enough to provoke noticeable symptoms of
diabetes (Mooy, et al., 1995; Harris, 1993). Nevertheless, such patients are at increased risk of
14
developing macrovascular and microvascular complications (Mooy et al., 1995; Harris, 1993).
There are probably several different mechanisms which result in this form of diabetes, and it is
likely that the number of people in this category will decrease in the future as identification of
specific pathogenetic processes and genetic defects permits better differentiation and a more
definitive classification with movement into "Other types".
Although, the specific aetiologies of this form of diabetes are not known, by definition
autoimmune destruction of the pancreas does not occur and patients do not have other known
specific causes of diabetes. The majority of patients with this form of diabetes are obese; obesity
itself causes or aggravates insulin resistance (Campbell and Carlson, 1993; Bogardus et al.,
1985). Many of those who are not obese by traditional weight criteria may have an increased
percentage of body fat distributed predominantly in the abdominal region (Kissebah et al., 1982).
Ketoacidosis is infrequent in this type of diabetes; when seen it usually arises in association with
the stress of another illness such as infection (Banerji et al., 1994; Umpierrez et al., 1995).
Whereas patients with this form of diabetes may have insulin levels that appear normal or
elevated, the high blood glucose levels in these diabetic patients would be expected to result in
even higher insulin values had their beta-cell function been normal (Polonsky et al., 1996). Thus,
insulin secretion is defective and insufficient to compensate for the insulin resistance. On the
other hand, some individuals have essentially normal insulin action, but markedly impaired
insulin secretion. Insulin sensitivity may be increased by weight reduction, increased physical
activity, and/or pharmacological treatment of hyperglycaemia but is not restored to normal
(Simonson et al., 1984; Wing et al., 1994). The risk of developing Type 2 diabetes increases
with age, obesity, and lack of physical activity (Zimmet, 1992). It occurs more frequently in
women with prior GDM and in individuals with hypertension or dyslipidaemia. Its frequency
varies in different racial/ethnic subgroups (Valle et al., 1997). It is often associated with strong
familial, likely genetic predisposition. However, the genetics of this form of diabetes are
complex and not clearly defined. Some patients who present with a clinical picture consistent
with Type 2 diabetes have autoantibodies similar to those found in Type 1 diabetes, and may
masquerade as Type 2 diabetes if antibody determinations are not made. Patients who are non-
obese or who have relatives with Type 1 diabetes and who are of Northern European origin may
be suspected of having late onset Type 1 diabetes.
15
1.3.2.1 Gestational diabetes
Gestational diabetes is carbohydrate intolerance resulting in hyperglycaemia of variable
severity with onset or first recognition during pregnancy (Kissebah et al., 1982). It does not
exclude the possibility that the glucose intolerance may antedate pregnancy but has been
previously unrecognized. The definition applies irrespective of whether or not insulin is used for
treatment or the condition persists after pregnancy (Kissebah et al., 1982). Women who become
pregnant and who are known to have diabetes mellitus which antedates pregnancy do not have
gestational diabetes but have "diabetes mellitus and pregnancy" and should be treated
accordingly before, during, and after the pregnancy. In the early part of pregnancy (e.g. first
trimester and first half of second trimester) fasting and postprandial glucose concentrations are
normally lower than in normal, non-pregnant women (Polonsky et al., 1996). Elevated fasting or
postprandial plasma glucose levels at this time in pregnancy may well reflect the presence of
diabetes which has antedated pregnancy, but criteria for designating abnormally high glucose
concentrations at this time have not yet been established (Polonsky et al., 1996). The occurrence
of higher than usual plasma glucose levels at this time in pregnancy mandates careful
management and may be an indication for carrying out an OGTT. Nevertheless, normal glucose
tolerance in the early part of pregnancy does not itself establish that gestational diabetes may not
develop later. Individuals at high risk for gestational diabetes include older women, those with
previous history of glucose intolerance, those with a history of large for gestational age babies,
women from certain high-risk ethnic groups, and any pregnant woman who has elevated fasting,
or casual, blood glucose levels. It may be appropriate to screen pregnant women belonging to
high-risk populations during the first trimester of pregnancy in order to detect previously
undiagnosed diabetes mellitus. Formal systematic testing for gestational diabetes is usually done
between 24 and 28 weeks of gestation (Valle et al., 1997).
16
1.3.2.2 Genetic defects of beta cell function
Several forms of the diabetic state may be associated with monogenic defects in beta-cell
function which are frequently characterized by onset of mild hyperglycaemia at an early age
(generally before age 25 years). They are usually inherited in an autosomal dominant pattern
(Byrne et al., 1996). Patients with these forms of diabetes, formerly referred to as maturity-onset
diabetes of the young (MODY), have impaired insulin secretion with minimal or no defect in
insulin action (Byrne et al., 1996; Clement et al., 1996). Abnormalities at three genetic loci on
different chromosomes have now been characterized. The most common form is associated with
mutations on chromosome 12 in a hepatic nuclear transcription factor referred to as HNF1alpha
(Yamagata et al., 1996). A second form is associated with mutations in the glucokinase gene on
chromosome 7p (Froguel et al., 1996; Vionnet et al., 1992).
Glucokinase converts glucose to glucose-6-phosphate, the metabolism of which in turn
stimulates insulin secretion by the beta cell. Thus, glucokinase serves as the "glucose sensor" for
the beta cell. Because of defects in the glucokinase gene, increased levels of glucose are
necessary to elicit normal levels of insulin secretion. A third form is associated with a mutation
in the HNF4alpha gene on chromosome 20q (Yamagata et al., 1996). HNF4alpha is a
transcription factor which is involved in the regulation of the expression of HNF1alpha. A fourth
variant has recently been ascribed to mutations in another transcription factor gene, IPF-1, which
in its homozygous form leads to total pancreatic agenesis (Stoffers et al., 1997). Specific genetic
defects in other individuals who have a similar clinical presentation are currently being defined.
Point mutations in mitochondrial DNA have been found to be associated with diabetes mellitus
and deafness (Walker and Turnbull, 1997). The most common mutation occurs at position 3243
in the tRNA leucine gene, leading to an A to G substitution.
An identical lesion occurs in the MELAS syndrome (mitochondrial myopathy,
encephalopathy, lactic acidosis, and stroke-like syndrome); however, diabetes is not part of this
syndrome, suggesting for unknown reasons different phenotypic expressions of this genetic
lesion (Johns, 1995). Genetic abnormalities that result in the inability to convert proinsulin to
insulin have been identified in a few families. Such traits are usually inherited in an autosomal
dominant pattern (Gruppuso et al., 1984; Robbins et al., 1984) and the resultant carbohydrate
intolerance is mild. Similarly, mutant insulin molecules with impaired receptor binding have
17
been identified in a few families. These are also associated with autosomal inheritance and either
normal or only mildly impaired carbohydrate metabolism (Haneda et al., 1984; Sanz et al.,
1986).
1.3.2.3 Role of Insulin in Lipid Metabolism
Fat cells respond to insulin within minutes of its administration (Clement et al., 1996).
There will be reduction in the release of fatty acids from fat stores. At the same time there will be
increase in the synthesis of triacylglycerol to increase fat esterification and storage. So the
overall effect is decrease in fatty acids in blood. Insulin inhibits an enzyme called ‘lipase’ in fat
cells. Lipase function is to breakdown fat and release free fatty acids in to the blood. Once its
activity is inhibited by insulin, it no longer releases fatty acids from stored fat. Insulin also
increases the activity of another enzyme called ‘lipoprotein lipase’ in blood vessel endothelial
cells. The function of lipoprotein lipase is to synthesize triacylglycerol using free fatty acids. So
fatty acid levels are decreased. In diabetes there is deficiency of insulin (Campbell and Calson,
1993). The chylomicrons and VLDL (both are types of lipoproteins in blood that carry
triglycerides from intestinal food and liver respectively) are released into blood waiting for the
enzyme lipoprotein lipase to act. Due to insulin deficiency which is needed by it, the enzyme
cannot function to its full extent. This increases triglycerides in blood causing
‘Hypertriglyceridemia’, a type of high cholesterol state. The above mechanism also operates in
type 2 diabetes. In addition there will be some other mechanisms are responsible for
hypertriglyceridemia in type 2 diabetes. In type 2 diabetes, there is insulin resistance state which
is not an ideal condition for the enzyme lipoprotein lipase. And also the type 2 diabetics are
obese, where there will be excess VLDL, related to obesity. VLDL is not metabolized
completely increasing the level of Intermediate density lipoproteins in the blood. (IDL carries
very high cholesterol in them) (Campbell and Calson, 1993).
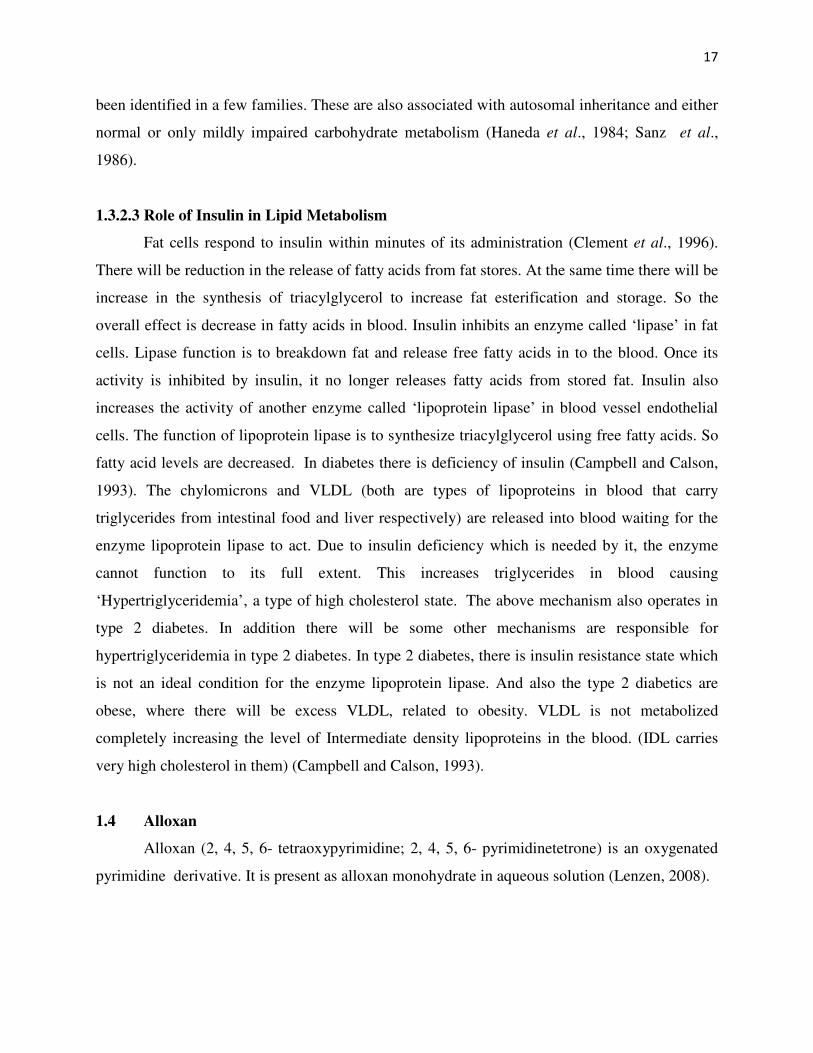
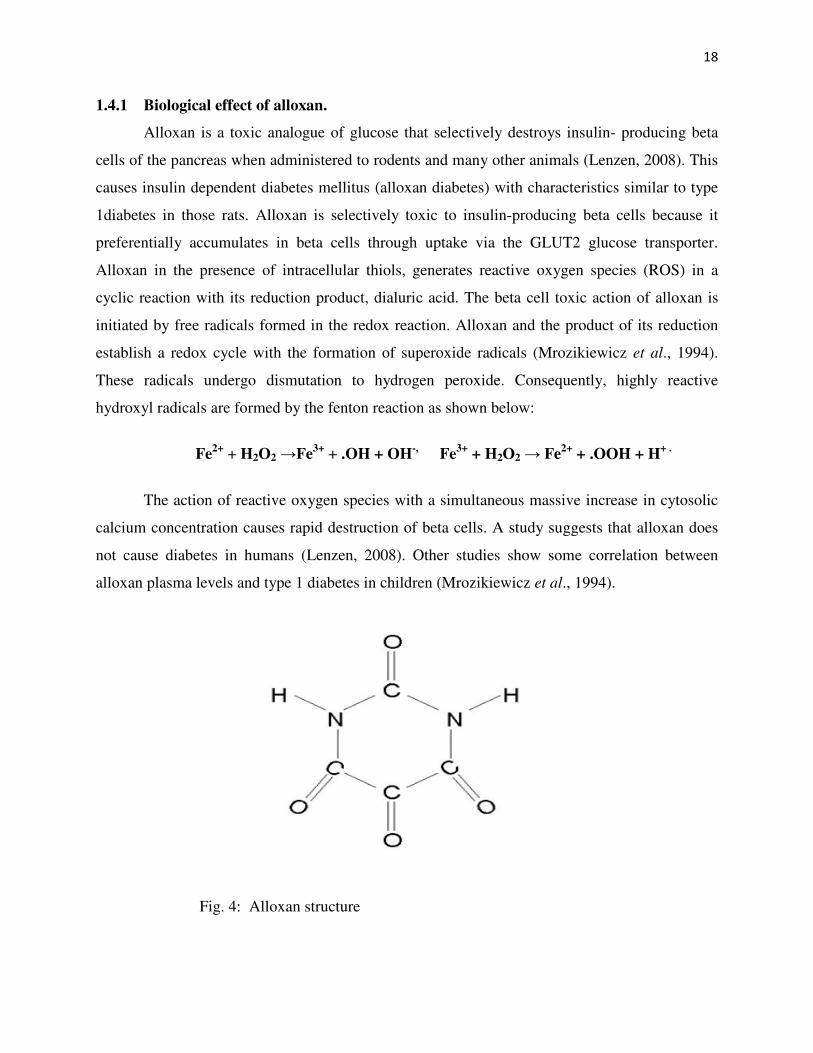
1.4 Alloxan
Alloxan (2, 4, 5, 6- tetraoxypyrimidine; 2, 4, 5, 6- pyrimidinetetrone) is an oxygenated
pyrimidine derivative. It is present as alloxan monohydrate in aqueous solution (Lenzen, 2008).
18
1.4.1 Biological effect of alloxan.
Alloxan is a toxic analogue of glucose that selectively destroys insulin- producing beta
cells of the pancreas when administered to rodents and many other animals (Lenzen, 2008). This
causes insulin dependent diabetes mellitus (alloxan diabetes) with characteristics similar to type
1diabetes in those rats. Alloxan is selectively toxic to insulin-producing beta cells because it
preferentially accumulates in beta cells through uptake via the GLUT2 glucose transporter.
Alloxan in the presence of intracellular thiols, generates reactive oxygen species (ROS) in a
cyclic reaction with its reduction product, dialuric acid. The beta cell toxic action of alloxan is
initiated by free radicals formed in the redox reaction. Alloxan and the product of its reduction
establish a redox cycle with the formation of superoxide radicals (Mrozikiewicz et al., 1994).
These radicals undergo dismutation to hydrogen peroxide. Consequently, highly reactive
hydroxyl radicals are formed by the fenton reaction as shown below:
Fe2+
+ H2O2 →Fe3+
+ .OH + OH-,
Fe3+
+ H2O2 → Fe2+
+ .OOH + H+ .
The action of reactive oxygen species with a simultaneous massive increase in cytosolic
calcium concentration causes rapid destruction of beta cells. A study suggests that alloxan does
not cause diabetes in humans (Lenzen, 2008). Other studies show some correlation between
alloxan plasma levels and type 1 diabetes in children (Mrozikiewicz et al., 1994).
Fig. 4: Alloxan structure
19
1.5 Antioxidants
An antioxidant is a molecule that inhibits the oxidation of other molecules (Helmut,
1997). Oxidation is a chemical reaction that transfers electrons or oxygen from a substance to an
oxidizing agent (Helmut, 1997). Oxidation reactions can produce free radicals. In turn, these
radicals can start chain reactions. When the chain reaction occurs in a cell, it can cause damage
or death to the cell. Antioxidants terminate these chain reactions by removing free radical
intermediates, and inhibit further oxidation reactions. They do this by being oxidized themselves,
so antioxidants are often reducing agents such as thiols, ascorbic acid, or polyphenols (Helmut,
1997). Although initial studies suggested that antioxidant supplements might promote health,
later large clinical trials with a limited number of antioxidants detect no benefit and even
suggested that excess supplementation with certain putative antioxidants may be harmful
(Prabhat et al., 1995; Bjelakovic et al., 2007).
Antioxidants are classified into two broad divisions, depending on whether they are
soluble in water (hydrophilic) or in lipids (hydrophobic). In general, water-soluble antioxidants
react with oxidants in the cell cytosol and the blood plasma, while lipid-soluble antioxidants
protect cell membranes from lipid peroxidation (Helmut, 1997). These compounds may be
synthesized in the body or obtained from the diet. The different antioxidants are present at a wide
range of concentrations in body fluids and tissues, with some such as glutathione or ubiquinone
mostly present within cells, while others such as uric acid are more evenly distributed. Some
antioxidants are only found in a few organisms and these compounds can be important in
pathogens and can be virulence factors (Miller and Britigan, 1997). The relative importance and
interactions between these different antioxidants is a very complex question, with the various
metabolites and enzyme systems having synergistic and interdependent effects on one another
(Chaudiere and Ferrari-Iliou, 1999).
The action of one antioxidant may therefore depend on the proper function of other
members of the antioxidant system. The amount of protection provided by any one antioxidant
will also depend on its concentration, its reactivity towards the particular reactive oxygen species
being considered, and the status of the antioxidants with which it interacts. Some compounds
contribute to antioxidant defense by chelating transition metals and preventing them from
catalyzing the production of free radicals in the cell. Particularly important is the ability to
sequester iron, which is the function of iron-binding proteins such as transferrin and
20
Seleniferritin. Selenium and zinc are commonly referred to as antioxidant nutrients, but these
chemical elements have no antioxidant action themselves and are instead required for the activity
of some antioxidant enzymes (Miller and Britigan, 1997).
1.6 The Oxidative Challenge in Biology
A paradox in metabolism is that, while the vast majority of complex life on Earth requires
oxygen for its existence, oxygen is a highly reactive molecule that damages living organisms by
producing reactive oxygen species (Davies, 1995). Consequently, organisms contain a complex
network of antioxidant metabolites and enzymes that work together to prevent oxidative damage
to cellular components such as DNA, proteins and lipids. In general, antioxidant systems either
prevent these reactive species from being formed, or remove them before they can damage vital
components of the cell (Davies, 1995). However, reactive oxygen species also have useful
cellular functions, such as redox signaling. Thus, the function of antioxidant systems is not to
remove oxidants entirely, but instead to keep them at an optimum level (Rhee, 2006).
The reactive oxygen species produced in cells include hydrogen peroxide (H2O2),
hypochlorous acid (HClO), and free radicals such as the hydroxyl radical (·OH) and the
superoxide anion (O2−) (Valko et al., 2007). The hydroxyl radical is particularly unstable and
will react rapidly and non-specifically with most biological molecules. This species is produced
from hydrogen peroxide in metal-catalyzed redox reactions such as the Fenton reaction (Stohs
and Bagchi, 1995). These oxidants can damage cells by starting chemical chain reactions such
as lipid peroxidation, or by oxidizing DNA or proteins. Damage to DNA can cause mutations
and possibly cancer, if not reversed by DNA repair mechanisms (Nakabeppu et al., 2006) while
damage to proteins causes enzyme inhibition, denaturation and protein degradation (Stadtman,
1992).
The use of oxygen as part of the process for generating metabolic energy produces
reactive oxygen species (Raha and Robinson, 2000). In this process, the superoxide anion is
produced as a by-product of several steps in the electron transport chain. Particularly important
is the reduction of coenzyme Q in complex III, since a highly reactive free radical is formed as
an intermediate (Q·−). This unstable intermediate can lead to electron "leakage", when electrons
jump directly to oxygen and form the superoxide anion, instead of moving through the normal
series of well-controlled reactions of the electron transport chain. Peroxide is also produced
21
from the oxidation of reduced flavoproteins, such as complex I. However, although these
enzymes can produce oxidants, the relative importance of the electron transfer chain to other
processes that generate peroxide is unclear (Seaver and Imlay, 2004). In plants, algae, and
cyanobacteria, reactive oxygen species are also produced during photosynthesis,( Demmig-
Adams, and Adams, 2002) particularly under conditions of high light intensity (Krieger-
Liszkay, 2004).This effect is partly offset by the involvement of carotenoids in photoinhibition,
which involves these antioxidants reacting with over-reduced forms of the photosynthetic
reaction centres to prevent the production of reactive oxygen species ( Kerfeld, 2004).
1.6.1 Pro-oxidant activities
Antioxidants that are reducing agents can also act as pro-oxidants. For example, vitamin
C has antioxidant activity when it reduces oxidizing substances such as hydrogen peroxide
(Duarte and Lunec , 2005). However, it will also reduce metal ions that generate free radicals
through the Fenton reaction (Carr and Frei, 1999; Stohs and Bagchi, 1995).
2 Fe3+ + Ascorbate → 2 Fe2+ + Dehydroascorbate
2 Fe2+ + 2 H2O2 → 2 Fe3+ + 2 OH· + 2 OH−
The relative importance of the antioxidant and pro-oxidant activities of antioxidants are
an area of current research, but vitamin C, which exerts its effects as a vitamin by oxidizing
polypeptides, appears to have a mostly antioxidant action in the human body (Carr and Frei,
1999; Valko et al., 2005). However, less data is available for other dietary antioxidants, such as
vitamin E (Schneider, 2005). or the polyphenols ( Halliwell, 2008 ; Ristow and Zarse, 2010).
Likewise, the pathogenesis of diseases involving hyperuricemia likely involves uric acid's direct
and indirect pro-oxidant properties. That is, paradoxically, agents which are normally considered
antioxidants can act as conditional pro-oxidants and actually increase oxidative stress. Besides
ascorbate, medically important conditional pro-oxidants include uric acid and sulfhydryl amino
acids such as homocysteine. Typically, this involves some transition-series metal such as copper
or iron as catalyst. The potential role of the pro-oxidant role of uric acid in (e.g.) atherosclerosis
and ischemic stroke is considered above. Another example is the postulated role of homocysteine
in atherosclerosis (Valko et al., 2005).
22
1.6.2 Oxidative stress
Oxidative stress represents an imbalance between the systemic manifestation of reactive
oxygen species and a biological system's ability to readily detoxify the reactive intermediates or
to repair the resulting damage (Valko et al., 2005). Disturbances in the normal redox state of
cells can cause toxic effects through the production of peroxides and free radicals that damage all
components of the cell, including proteins, lipids, and DNA. Further, some reactive oxidative
species act as cellular messengers in redox signaling. Thus, oxidative stress can cause disruptions
in normal mechanisms of cellular signaling. In man, oxidative stress is thought to be involved in
the development of many diseases or may exacerbate their symptoms. These include cancer,
Parkinson's disease, Alzheimer's disease (Valko et al., 2007), atherosclerosis, heart failure,
(Singh et al., 1995) myocardial infarction (Ramond et al., 2011) Schizophrenia; (Boskovic et
al., 2011), fragile X syndrome, Sickle Cell Disease (Amer et al., 2006) and chronic fatigue
syndrome (Gwen et al., 2005). However, reactive oxygen species can be beneficial, as they are
used by the immune system as a way to attack and kill pathogens. Short-term oxidative stress
may also be important in prevention of aging by induction of a process named mitohormesis
(Gems and Partridge, 2008). Chemically, oxidative stress is associated with increased production
of oxidizing species or a significant decrease in the effectiveness of antioxidant defenses, such as
glutathione (Schafer and Buettner, 2001). The effects of oxidative stress depend upon the size of
these changes, with a cell being able to overcome small perturbations and regain its original
state. However, more severe oxidative stress can cause cell death and even moderate oxidation
can trigger apoptosis, while more intense stresses may cause necrosis (Lennon et al., 1991).
Production of reactive oxygen species is a particularly destructive aspect of oxidative
stress. Such species include free radicals and peroxides. Some of the less reactive of these
species (such as superoxide) can be converted by oxidoreduction reactions with transition metals
or other redox cycling compounds (including quinones) into more aggressive radical species that
can cause extensive cellular damage. The major portion of long term effects is inflicted by
damage on DNA (Evans and Cooke, 2004).Most of these oxygen-derived species are produced at
a low level by normal aerobic metabolism. Normal cellular defense mechanisms destroy most of
these. Likewise, any damage to cells is constantly repaired. However, under the severe levels of
oxidative stress that cause necrosis, the damage causes ATP depletion, preventing controlled
apoptotic death and causing the cell to simply fall apart (Lee and Shacter, 1999).
23
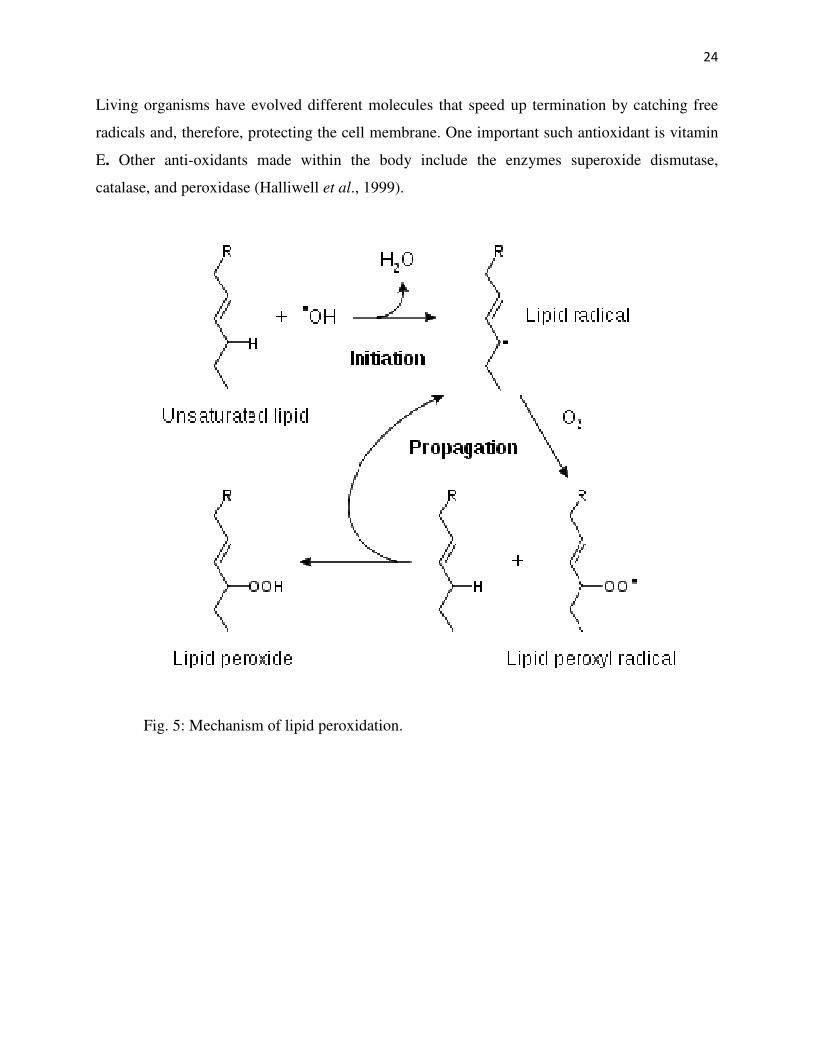
1.6.3 Lipid Peroxidation and Free Radical
Lipid peroxidation refers to the oxidative degradation of lipids. It is the process in which
free radicals "steal" electrons from the lipids in cell membranes, resulting in cell damage. This
process proceeds by a free radical chain reaction mechanism. It most often affects
polyunsaturated fatty acids, because they contain multiple double bonds in between which lie
methylene -CH2- groups that possess especially reactive hydrogen. Peroxidation (auto-oxidation)
is responsible not only for deterioration of food (rancidity) but also for damage to tissue in vivo,
where it may be a source of cancer, inflammatory diseases, atheriosclerosis and aging (Murray et
al., 2003). The deleterious effects are considered to be caused by free radicals (ROO; RO; OH·)
produced during peroxide formation from fatty acids containing interrupted double bonds. As
with any radical reaction, lipid peroxidation is a chain reaction providing continuous supply of
the free radicals that initiate further peroxidation (Halliwell et al., 1999). The reaction consists
of three major steps: initiation, propagation, and termination (Halliwell et al., 1999).
1.6.3.1 Initiation
Initiation is the step in which a fatty acid radical is produced. The most notable initiators
in living cells are reactive oxygen species (ROS), such as OH· and HOO, which combines with a
hydrogen atom to form water and a fatty acid radical (Halliwell et al., 1999).
1.6.3.2 Propagation
The fatty acid radical is not a very stable molecule, so it reacts readily with molecular
oxygen, thereby creating a peroxyl-fatty acid radical. This too is an unstable species that reacts
with another free fatty acid, producing a different fatty acid radical and lipid peroxide, or cyclic
peroxide if it had reacted with itself. This cycle continues, as the new fatty acid radical reacts in
the same way (Halliwell et al., 1999).
1.6.3.3 Termination
When a radical reacts with a non-radical, it always produces another radical, which is
why the process is called a "chain reaction mechanism." The radical reaction stops when two
radicals react and produce a non-radical species. This happens only when the concentration of
radical species is high enough for there to be a high probability of collision of two radicals.
24
Living organisms have evolved different molecules that speed up termination by catching free
radicals and, therefore, protecting the cell membrane. One important such antioxidant is vitamin
E. Other anti-oxidants made within the body include the enzymes superoxide dismutase,
catalase, and peroxidase (Halliwell et al., 1999).
Fig. 5: Mechanism of lipid peroxidation.
25
1.7 Aim and Objectives of the study
1.7.1 Aim of the study
This study aims to investigate the anti-diabetic and anti-oxidant effect of the ethanol
extract of Bryophyllum pinnatum on alloxan-induced diabetic rats.
1.7.2 Research Objectives
This work is designed to achieve the following specific objectives:
(i) To determine the median lethal toxicity (LD50) of the extracts
(ii) To determine the effect of the extract on blood glucose concentration of the rats
(iii) To determine the effect of the extract on lipid profile Total cholesterol, HDL, LDL and
TAG of the rats
(iv) To determine the effect of the extract on the pro- and anti-oxidant potentials of the rats.
(v) To determine the effect of the extract on haematological parameters of the rats.
26
CHAPTER TWO
MATERIALS AND METHODS
2.1 Materials
2.1.1 Equipment/ Apparatus Manufacturer
One touch glucometer Lifescan, USA
PCV tubes Pyrex England
Haematocrit centrifuge Vickas Ltd England
PCV reader Pyrex England
Pasteur pipette Pyrex England
Colorimeter E1 Scientific CO. India
Syringes Mono-ject China
Measuring cylinder Pyrex England
Weighing balance Vickas Ltd England
Refrigerator Haier thermocool China
Beaker Pyrex England
Centrifuge Vickas Ltd England
Micropipette Perfect USA
2.1.2 Reagents/ Chemicals Manufacturer
Alloxan Sigma Aldrich Germany
Glacial acetic acid May and bakers England
Sodium carbonate May and baker England
Sodium chloride BDH England
Trichloroacetic acid Merck Darmstadt Germany
Thiobarbituric acid May and bakers England
Sodium Dodesyl sulphate BDH England
2,4-dinitrophenyl hydrazine Merck Darmstadt Germany
Thiourea solution Randox USA
Cupric sulphate solution Merck Darmstadt Germany
Sulphuric acid BDH England
27
Potassium dichromate Sigma Aldrich Germany
Combined colour reagent QCA Spain
Molisch’s reagent QCA Spain
Ethanol BDH E ngland
Dragenddroff’s reagent Randox USA
Wagner’s reagent Randox USA
Picric acid solution Merck Darmstadt Germany
Ammonia solution BDH E ngland
Fehling’s solution A and B Teco USA
Potassium hydroxide solution Merck Darmstadt Germany
Olive oil Solive oil Nigeria
Ferric chloride Merck Darmstadt Germany
Lead acetate solution Merck Darmstadt Germany
Ethyl acetate BDH England
Aluminium chloride solution BDH England
Chloroform BDH England
1% thiobarbituric acid May and bakers England
Sodium hydroxide May and bakers England
Trition-X Teco USA
Drabkin’s solution Teco USA
Cumen hydroxide QCA Spain
2.1.3 Plant Material
Fresh leaves of Bryophullum pinnatum were collected from GRA in Nsukka LGA of
Enugu State, Nigeria. The leaves were identified by Mr Alfred Ozioko of Bioresources
Development and Conservation Programme (BDCP), Nsukka, Nigeria.
2.1.4 Experimental Animals
A total of twenty-one (21) male albino rats with an average weight of 170±16g were
obtained from the Animal House of Department of Zoology, University of Nigeria, Nsukka. The
animals were acclimatized to laboratory conditions for one week under a standard condition with
28
12 hour light and dark cycles and maintained on a regular feed and water ad libitum. The mice
used for LD50 were 8-10 weeks old with average weight of 16±1.4g
2.2 Methods
2.2.1 Preparation of Extract
Fresh leaves of Bryophyllum pinnatum were plucked and washed with distilled water.
The leaves were spread on a mat in a well ventilated room with regular turning to avoid
decaying. The leaves were shade dried for four weeks after which they were pulverized. One
thousand, one hundred and twenty-five grams (1125g) of dry leaves were coarsely ground. The
ground leaves were soaked for 48 hours in 95% absolute ethanol with occasional shaking after
which they were filtered using muslin sieve. The filtrate was later evaporated to dryness using
rotary evaporator at 60˚C.
2.2.2 Determination of LD50 of the Extract
The Median lethal dose (LD50) of the ethanol extract was determined by the method of
(Lorke, 1983). Six groups of three adult albino-mice each weighing between 13-20g were used
for this experiment. The experiment was divided into two phases. Phase one comprises groups
1-3 and they were administered with 10, 100 and 1000 mg/kg body weight of extract respectively
while phase two comprises groups 4-6 and were administered 1600, 2900 and 5000 mg/kg body
weight of the extract respectively. The extract was dissolved in 3% tween 80 and made up to the
required volume with distilled water and administered orally to the mice according to their
groups. The mice were observed for 24 hours and the number of deaths was recorded. The LD50
was calculated using geometric mean as the square root of the product of the lowest lethal dose
and the highest non-lethal dose.
LD50=√XY
Where X= Highest dose without death,
Y= lowest dose with death.
29
2.2.3 Experimental Design
In this experiment, the rats were divided into seven groups of three rats each. Group 1
was administered 1ml of 3% tween 80 solution which represented the vehicle. The treatment
were carried out using (per oral) orogastric tube (gavage).
Group 1: Normal rats were Non diabetic (negative control), no treatment was given.
Group 2: Positive control, Diabetic rats without treatment.
Group 3: Diabetic rats treated with standard drug (2.5 mg/kg b.w of glibenclamide.
Group 4: Diabetic rats treated with 200 mg/kg body weight of extract
Group 5: Diabetic rats treated with 400 mg/kg body weight of extract.
Group 6: Non diabetic rats treated with 200 mg/kg body weight of extract.
Group 7: Non diabetic rats treated with 400 mg/kg body weight of extract.
2.2.4 Diabetes Mellitus Induction
On the seventh day of acclimatization, the rats were starved overnight prior to induction
of diabetes mellitus with a view to enabling the alloxan to penetrate the vital organs of the rats.
Diabetes was induced by intraperitoneal injection of a single dose of 150mg/kg body weight of
1% alloxan monohydrate dissolved in freshly prepared normal saline. After twenty-four hours,
all the rats that have blood glucose level of 200mg/dl and above were considered diabetic and
were selected for the experiment.
2.2.5 Preparation of reagents for phytochemical analysis
5% (w/v) ferric chloride solution
A quantity, 5.0g of ferric chloride was dissolved in 100ml of distilled water.
Ammonium solution
A known volume, 187.5ml of the stock concentrated ammonium solution was dissolved in
32.5ml of distilled water.
45% (v/v) ethanol
Absolute ethanol, (45ml) was mixed with 55ml of distilled water.
Aluminium chloride solution
Aluminium chloride, (0.5g) was dissolved in 100ml of distilled water.
30
Wagner’s reagent
A quantity, (2.0g) of iodine crystals and 3.0g of potassium iodide were dissolved in 40ml
of distilled water and then made up to 100ml with distilled water.
Mayer’s reagent
A known weight, 13.5g of mercuric chloride was dissolved in 50ml of distilled water.
Also, 5.0g of potassium iodide was dissolved in 20ml of distilled water. The two solutions were
mixed and the volume was made up to 100ml with distilled water.
Dilute sulphuric acid
A known volume, 10.9ml of concentrated sulphuric acid was mixed with 5.0ml of
distilled water and made up to 100ml.
Lead sub-acetate solution
A quantity, 45ml of 15%lead acetate (15g of lead acetate in 100ml of distilled water) was
dissolved in 20ml of absolute ethanol and made up to 100ml with distilled water.
Dragendorff’s reagent
Bismuth carbonate (0.85g) was dissolved in 100ml of glacial acetic acid and 40ml of
distilled water to give solution A. Another solution called solution B was prepared by dissolving
8.0g of potassium iodide in 20ml of distilled water. Both solutions were mixed to give a stock
solution.
Molisch reagent
A known weight 1.0g of α-naphtol was dissolved in 100ml of absolute ethanol.
2% (v/v) Hydrochloric acid
A known volume, 2.0ml of concentrated hydrochloric acid was diluted with distilled
water and made up to 100ml.
1% (w/v) picric acid
A quantity, 1.0g of picric acid was dissolved in 100ml of distilled water.
2.2.6 Phytochemical Analysis of the Fresh and Dry Leaf Extact of B. pinnatum
The preliminary analysis of the phytochemical composition of the ethanol extract was
carried out according to the method of (Harborne, 1984) which involved testing for the presence
of the following plant constituents: alkaloids, flavonoids, carbohydrates, glycosides, proteins,
saponins, steroidal aglycone, tannins, oil, acids, resins and terpenoids.
31
2.2.6.1 Test for the presence of alkaloids
The ethanol extract (0.2g) of B. pinnatum leaf was boiled with 5ml of 2% hydrochloric
acid on a water bath. The mixture was filtered using Whatman No 1 filter paper. One mililitre of
the filtrate was treated with 2 drops of Dragendroff’s reagent (bistmuth potassium iodide
solution). A red precipitate indicates the presence of alkaloids (Harborne, 1984).
2.2.6.2 Test for the presence of glycosides
The ethanol extract (2g) of B. pinnatum leaf was mixed with 30ml of water. The mixture
was heated in a water bath at 60˚C for 5 minutes and filtered. A mixture of Fehling’s solution A
and B of equal volumes (0.2ml each) was added to 5ml of the filtrate until it turned alkaline
when tested with litmus paper. It was then boiled in water bath for 3 minutes at 60˚C and
observed.
2.2.6.3 Molisch test
One gramme (1g) of the extract was boiled with 2ml of distilled water and filtered. To the
filtrate, few drops of alpha naphtol solution (Molisch’s reagent) were poured down the side of
the test tube to form a lower layer.
2.2.6.4 Test for acid compounds
The extract (0.1g) was placed in a dry test tube and 10 ml of distilled water was added.
The mixture was warmed over water bath at 60˚C and later cooled. A strip of water wetted
neutral litmus paper was dipped into the filtrate and observation was made.
2.2.6.5 Test for the presence of steroids.
To a mixture of 10 ml of lead acetate solution (90%w/v) and 20 ml of aqueous ethanol
(50%) was added 1g of the extract in a 200ml conical flask. The mixture was placed on a boiling
water bath for 2 minutes, cooled and filtered. The filtrate was washed twice with 15ml of
chloroform. A 5ml aliquot of the extract was evaporated to dryness in a water bath. To the
residue, 2ml of 3,5-dinitrobenzoic acid solution (in 2% ethanol) and 1ml of 1N sodium
hydroxide solution were added.
32
2.2.6.6 Test for the presence of flavonoids
The extract (0.2g) was dissolved in 10ml of ethyl acetate and heated in boiling water for
3minutes. The mixture was filtered using whatman No1 filter paper and the filtrate was used for
the test. 4ml of the filtrate was shaken with 1% (1ml) of aluminium chloride solution and
observed.
2.2.6.7 Test for Resin
The extract, 0.2g was re-extracted with 15ml of 95% ethanol. The alcohol extract was
then poured into 20ml of distilled water in a beaker and observed.
2.2.6.8 Test for the Presence of Tannins
The extract, (2g) were boiled in 5ml of 45% ethanol for 5 minutes. The mixture was
cooled and filtered. 1ml of the filtrate was added 3 drops of lead acetate solution
2.2.6.9 Test for the Presence of Saponins
The extract, 0.1g was boiled in 6ml of distilled water for 5 minutes. The mixture was
filtered while still hot. The filtrate was used for the following tests:
Emulsion Test
Olive oil 2 drops were added to 1.0ml of the filtrate. The mixture was shaken and
observed.
Frothing Test
The filtrate, 1 ml was mixed with 4ml of distilled water and then shaken vigorously and
observed.
2.2.7 Quantitative Phytochemical Analysis of Fresh and Dry Leaf Extract
2.2.7.1 Steroid Determination
This was determined by the method described by Okeke and Elekwa (2003). A known
weight, 2g of each sample was dispersed in 100ml of distilled water and homogenized in a
laboratory blender. The homogenate was filtered and the filtrate was eluted with normal
ammonium hydroxide solution (pH 9). A volume of 2ml of the elute was put in a test tube and
mixed with 2ml of chloroform. A known quantity, 3ml of ice-cold acetic acid anhydride was
33
added to the mixture in a flask and 2 drops of conc H2SO4 were cautiously added. Standard sterol
solution was prepared and treated as described above. The absorbances of standard and prepared
sample were measured in a spectrophotometer at 420nm.
2.2.7.2 Saponin Determination
Each sample, (1g) was weighed and macerated with 10ml of petroleum ether and
decanted into a beaker. Petroleum ether, (10ml) was decanted into the beaker, mixed with the
filtrate and evaporated to dryness; this was followed by addition of 6ml of ethanol. A fraction of
the resultant mixture 2ml was pipetted into a test tube and this was followed by addition of 2ml
of colour reagent. Absorbance was measured at 550nm after 30 minutes of standing.
2.2.7.3 Flavonoid Determination
This was determined according to the method of Harborne (1998). A portion (5g) of the
sample was refluxed in 50ml of 2M HCl solution for 30 minutes. It was allowed to cool and then
filtered with Whatman No1 filter paper. A measured volume of the extract was treated with equal
volume of ethyl acetate starting with a drop. The solution was filtered into a weighed crucible.
The filtrate was heated to dryness in an oven at 60˚C. The dried crucible was weighed again and
the difference in the weight gave the quantity of flavonoid in the sample.
2.2.7.4 Determination of Reducing Sugar
One gramme of each sample was weighed and macerated with 20ml of distilled water,
boiled for 5minutes and cooled. 1ml of phosphomolybdic acid and 7ml of distilled water were
added and absorbance was measured at 420nm.
2.2.7.5 Alkaloid Determination
The determination of alkaloid was described by Harborne (1998). A quantity (5g) of the
sample was weighed into a 250ml beaker and 200ml of 10% acetic acid in ethanol was added,
covered and allowed to stand for 2 hours. This was filtered and the extract was concentrated on a
water bath to one-quarter of its original volume. Concentrated ammonium hydroxide was added
drop-wise to the extract to obtain the precipitate which was collected and washed with dilute
34
ammonium hydroxide and then filtered. The residue is the alkaloid which was dried and
weighed.
2.2.7.6 Terpenoid Determination
One gramme of the sample was macerated into 50ml of ethanol. The solution was
filtered. The filtrate (2.5ml) was pipetted into a test tube followed by 2.5ml of 5% aqueous
phosphmolibdic acid solution, 2.5ml conc H2SO4 was gradually added, mixed and allowed to
stand for 30minutes. The solution was made up to 12.5ml with ethanol and absorbance was taken
at 700nm.
2.2.7.7 Glycoside Determination
The sample (1g) was added into a test tube and 2.5ml of 15% ethanol was added and
filtered. A known quantity (2.5ml) of chloroform was added and shaken vigorously; the lower
layer was then collected and evaporated to dryness after which 3ml of glacial acetic acid was
added followed by 0.1ml of 5% ferric chloride, 0.25ml of concentrated hydrogen sulphide (H2S).
The setup was shaken and put in the dark for 2hours and absorbance was read at 530nm.
2.2.7.8 Tannin Determination
The method of Swain (1979) was used for the determination of the tannin content of B
pinnatum. A quantity, 0.2g of finely ground sample was measured into a 50ml beaker. A known
volume (20ml) of 50% methanol was added and covered with paraffin and placed in a water bath
at 77-80˚C for 1hr and stirred with a glass rod to prevent bumping. The extract was filtered using
a double layer of Whatman No1 filter paper into a 50ml volumetric flask. Known volumes of
20ml of distilled water, 2.5ml of Folin-Denis reagent and 10ml of 17% Na2CO3 were added and
mixed properly. The mixture was made up to mark with distilled water and allowed to stand for
20 minutes when a bluish colouration developed. Standard tannic acid solutions of range 0-
10ppm were treated similarly as 1ml of sample above. The absorbances of tannic acid standard
solution as well as samples were read after colour development at 760nm. The tannin content
was calculated using the formula:
Tannin (%) = Absorbance of sample ×Average gradient×Dilution factor
Weight of sample × 10000
35
2.2.7.9 Cyanide Determination
The extract, (1g) was macerated with 50ml of distilled water and allowed to stand for 24
hours and filtered. The filtrate (1ml) was pipetted into a test tube and 4ml of alkaline picrate
solution was added, boiled for 5minutes, cooled and absorbance was measured at 490nm.
2.2.7.10 Soluble Carbohydrate Determination
The sample (1g) was macerated with 50ml of distilled water and filtered. Also 1ml of the
filtrate was pipetted into a test tube and 2ml of saturated picric acid was added. Absorbance was
measured at 530nm.
2.2.8 Anti-Diabetic Evaluation
The rats were divided into seven groups of three rats each group. Group one contained
negative control rats which were given 1ml of 3% tween 80 solution. They were administered
1ml of 3% tween 80 solution. Group two were untreated diabetic rats. The extract was
administered daily to group 4-7 for twenty-one days while 2.5 mg/bw of glibenclamide standard
drug was administered to group 3. Blood glucose concentration was measured on weekly interval
to ascertain the hypoglycaemic effect of the extract on the rats being treated. This was done by
slightly cutting the tail vein with a sharp scissors. Blood samples were collected by nipping and
smearing the tail on the indicated portion of glucometer strip until it was fully soaked by blood.
The strip was inserted into the Accu-check glucometer and blood glucose concentration was read
within few seconds. On day 22 the rats were fasted overnight and blood samples collected
through ocular puncture into EDTA bottle for haematological analysis. The blood samples for
lipid profile determination were collected into a plain container without anticoagulant and the
serum obtained. The rats were anaesthetized with chloroform after the collection of blood
samples.
2.2.9 Determination of Haematological Parameters of the Rats
2.2.9.1 Determination of Packed Cell Volume
This was determined by using standard haematological procedure as described by Ochei and
Kolhakar (2005).
Principle: When whole blood is subjected to a centrifugal force for maximum
36
RBC parking, the space occupied by the RBC is measured and expressed as percentage of the
whole blood volume.
Method: Using microhaematocrit method, a well-mixed anticoagulant whole blood was allowed
to enter capillary haematocritn tubes until they are they are 2/3 filled with blood. Blood filling
was done for each tube. One end of each tube was sealed with plastic seal and placed in the
medial groove of the centrifuge, head exactly opposite each other, with sealed end away from the
centre of the centrifuge. All tubes were spun for 5minutes at 3000 revolution per minute (rpm).
The tubes were removed when as soon as the centrifuge had stopped spinning.
Calculation: PCV was obtained for each tube using microhaematocrit-reader by measuring the
height of the RBC column and expressing it as a ratio of the height of the total blood column.
PCV (%) = Height of cell column x 100
Height of total blood column
2.2.9.2 Determination of Haemoglobin (Hb) Concentration
The concentration of haemoglobin was determined by standard haematological procedure
as described by Ochei and Kolhakar (2005).
Principle: Whole blood is added to drabkin’s reagent: a solution containing KCN and
K3Fe(CN)6. KCN converts Hb-Fe²+ (ferrous) to Hb-Fe³+ (ferric) state to form methaemoglobin
complex which combines with KCN to form a stable pigment cyanmethaemoglobin complex.
The colour intensity of this mixture is measured in a spectrophotometer at a wavelength of
540nm (or using a yellow-green filter). The optical density (OD) of the solution is proportional
to the haemoglobin concentration. All forms of Hb (Hb-C, Hb-O, etc) except Hb-S are measured
with this cyanmet-method.
Method: Exactly 5.0ml of Drabkin’s solution was pipetted into two test tubes and a well mixed
sample sample of EDTA blood (0.02ml) was pipetted into these tubes, rinsing the pipette five
times with the reagent, until all the blood has been removed from the pipette. The solutions were
well mixed and allowed to stand at 25˚C for 10 minutes in order to allow the formation of cyan-
methaemoglobin. The mixtures were transferred into cuvettes and read in a spectrophotometer at
a wavelength of 540nm. The drabkin’s reagent in tube 1 was used to blank the machine (setting
the percentage transmittance at 100%). The readings were recorded and transferred into a pre-
calibrated chat and the actual Hb values in g/dl were determined.
37
Calculation: Hb in g/dl = Absorbance of test x conc. Of standard (in mg/dl)
Absorbance of standard
2.2.9.3 Determination of Red Blood Cell (RBC) Counts
Red blood cell (RBC) count was determined using the method of Ochei and Kolhartkar,
(2005).
Principle: When whole blood is diluted with an isotonic fluid, it prevents lysis and facilitates
counting of the red cells. Some isotonic solutions in use include Haymen’s solution, Gower’s
solution or 0.85%NaCl solution.
Method: using the thoma (manual counting) method, anticoagulated blood was drawn up to the
0.5ml mark in the RBC count pipette and diluted to a 101 mark with RBC diluting fluid (1:200
dilution). Dilution was repeated with the replicate tube counting chamber was cleaned; both
pipettes were shaken three times , counting chamber filled (first expelling the first 4 drops of the
mixture, allowing approximately three minutes for RBCs to settle. Red cells were counted using
the counting steps as follows.
1. The filled counting chamber was carefully placed on the microscope stage.
2. Using low power (x10 objective) the large centre square was placed in the middle of the field
of vision and the entire large square was carefully examined for even distribution of RBCs.
3. The high-dry was carefully changed, moving the counting chamber so that the small upper
left corner square (this square is further sub-divided into 16 even smaller squares) is completely
in the field of vision.
4. All the RBCs were counted in the squares, also counting the cells on the two of the margins
but excluding those lying on the other sides.
Calculation: The RBCs (in mm³) =cells counted x correction for volume x correction for
dilution
= RBCs counted in 5 small squares × 200 × 1.0/0.2 (or 50)
=number of RBCs counted in five squares × 104.
2.2.9.4 Determination of Total White Blood Cell (WBC) Count
Total white blood cell (WBC) count was determined using the method of Ochei and
Kolhartkar (2005).
38
Principle: When whole blood is mixed with weak acid solution, it dilutes the blood and
haemolyes the RBCs, enabling the WBCs to be counted.
Method: Manual WBC counting method was used as follows:
Dilution of Blood:
i. The blood specimen was mixed appropriately for one minute; using aspirator and WBC
pipette, blood was drawn to the 0.5 mark in the pipette.
ii. Blood was removed from the outside of the pipette with clean gauze.
iii. Holding the pipette almost vertically, the tip was placed into the counting diluting fluid to
draw it slowly. While gently rotating the pipette, to ensure proper mixing, the diluting fluid was
aspired until it reached 11 mark.
iv. The pipette was placed in a horizontal position and firmly holding the index finger of the
either hand over the opening in the tip of the pipette, aspirator was detached from other end of
the pipette. This is 1:20 dilution.
v. Having completed the dilution of blood, the counting chamber and cover glass were cleaned
with a lint free cloth.
Filling the counting chamber: Approximately, 0.02ml of well mixed EDTA blood sample was
added to 0.38ml of diluted fluid, dispensed into a small container. One of the grids of the
counting chamber was filled with re-mix of the diluted blood sample using a Pasteur pipette
taking care not to overfill the area. The filled area was left undisturbed for two minutes to allow
the WBCs to settle, after which the underside of the chamber was dried and placed on a
microscope stage.
Counting the white blood cells: Using x 10 objective lens with the condenser iris closed
sufficiently to give good contrast, the ruling of the chamber and the white cells were focused
until the cells appeared as small black dots. The cells in the four large squares of the chamber
were then squarely counted.
Calculation; the number of white cells per litre of blood was calculated as follows:
The total number of white cells counted was divided by 2
The number obtained was then divided by 10
The result was then multiplied by 109
39
2.2.9.5 Assay for Lipid Peroxidation
Lipid peroxidation was determined spectrophtometrically by measuring the level of lipid
peroxidation product, malondialdehyde (MDA) as described by Wallin et al. (1993).
Principle:
Malondialdehyde (MDA) reacts with thiobarbituric acid to form red or pink coloured
complex which absorbs maximally at 532nm.
MDA+ 2 TBA -------> MDA: TBA adduct + H20
Reagent preparation
i. 1.0% Thiobarbituric acid (TBA): A quantity, 1.0g of thiobarbituric acid was dissolved in
83ml of distilled water on warming and after dissolution the volume was made up to 100ml with
distilled water.
ii. 25% Trichloroacetic acid (TCA): A quantity, 12.5g of trichloroacetic acid was dissolved in
distilled water and made up to 50ml in volumetric flask with distilled water.
iii. Normal saline solution (NaCl) : A quantity, 0.9g of NaCl was dissolved in 10ml of distilled
water and made up to 100ml with distilled water.
Procedure
To 0.1ml of plasma in a test tube was added 0.45 ml of normal saline and mixed
thoroughly before adding 0.5ml of 25% trichloroacetic acid and 0.5ml of 1% thiobarbituric acid.
The same volume of trichloroacetic acid, and saline was added to the blank. Distilled water
(o.1ml) was added to the blank instead of plasma. Then the mixture was heated in a water bath at
95˚C for 40 mins. Turbidity was removed by centrifugation. The mixture was allowed to cool
before reading the absorbance of the clear supernatant at 532nm against reagent blank at 600 nm.
Thiobarbituric acid reacting substances were quantified as lipid peroxidation products by
referring to the standard curve of MDA concentration.
2.2.9.6 Assay of Catalase Activity
Catalase activity was assayed by the method described by Abei (1983).
40
Principle
The ultraviolet absorption of hydrogen peroxide can be easily measured at 240nm. On the
decomposition of hydrogen peroxide with catalase, the absorption decreases with time and from
this decrease, catalase activity can be measured.
Reagent
a. Phosphate buffer, pH 7.0
b. 0.2M H2O2
c. 5% potassium dichromate
d. Glacial acetic acid
Procedure
Phosphate buffer (2.5ml) was pipetted into a test tube followed by 2ml of hydrogen
peroxide and 0.5ml of serum. To 1ml of portion of the reaction mixture was added 2ml of
bichromate acetic acid reagent. Absorbance was determined at 240nm at every 15 seconds
interval into four places for one minute.
Catalase activity was calculated using the equation below:
Catalytic activity (unit/L) = 0.23 × logA1/A2
0.00693
Where A1 = A 240 at t = 0.
A2=A 240 at t = 15 seconds.
0.23 and 0.00693 are constants.
2.2.9.7 Determination of High Density Lipoprotein (HDL) Concentration
The concentration of high density lipoprotein (HDL) was determined according to the
method of Albers et al. (1978).
Procedure:
A set of clean test tubes (1ml) was set up and 0.3ml of the serum was pipetted into each
of them. One drop of the precipitant solution (dextran sulphate and magnesium acetate) was
added to the serum in each of the test tube, mixed and allowed to stand for 15mins at 25˚C. It
was then centrifuged at 3000 revolutions per minute (rpm) for 10 minutes. A volume of 1ml each
of cholesterol esterase, cholesterol oxidase, peroxidase, buffer (pH 6.8), phenol, 3,5-
41
dichlorophenol, 4-amino antipyrine was added to another set of test tubes labeled standard, blank
and sample test (labeled according to group number). Also 1ml of the supernatant of the
centrifuged samples was added to each of the labeled test tubes. The entire solution was mixed
thoroughly and allowed to stand for 10 minutes at 25˚C. The absorbance of the sample and the
standard against the sample blank was read at a wavelength of 500nm. The HDL cholesterol
content of each sample in mg/dl was calculated using the formula:
Absorbance of the sample × concentration of the standard
Absorbance of the standard
2.2.9.8 Determination of Serum Low Density Lipoprotein Concentration
The concentration of low density lipoprotein (LDL) was determined according to the
method of Assman et al. (1984).
Procedure
The serum (0.2ml) was pipetted into sets of clean labeled test tubes. Three drops of
precipitate solution (polyvinyl sulphate, sodium EDTA, polyethylene glycol, monomethyl ether)
were addedto the serum in the test tubes, mixed properly and allowed to stand for 10minutes at
25˚C. Thereafter the mixture was centrifuged at 3000rpm for 10 minutes. A volume of 1ml each
of cholesterolesterase, cholesterol oxidase, peroxidase, buffer (pH 6.8), phenol, 3,5-
dichlorophenol, 4-amino antipyrine was added to another sets of test tubes labeled standard,
blank and sample test (labeled according to group numbers). Also 0.1ml of the supernatant
sample was added appropriately to the labeled tubes. The entire solution was mixed thoroughly
and allowed to stand for 10 minutes at 25˚C, after which 0.1ml of the standard (equivalent to
200mg/dl of cholesterol) was added to the test tube labeled standard, mixed thoroughly and
allowed to stand for 10 minutes at 25˚C. the absorbance of the sample and the standard against
the sample blank was read at a wavelength of 505nm. The cholesterol content of the supernatant
was calculated using the formula:
Absorbance of the sample × concentration of the standard
Absorbance of the standard.
The LDL-cholesterol concentration was calculated using the relationship:
42
LDL (mg/dl) = Total cholesterol ˗ 1.5 × supernatant cholesterol (Assman et al., 1984).
2.2.9.9 Determination of Serum Total Cholesterol Concentration
Total cholesterol concentration was determined according to the method of Allain et al.
(1974).
Procedure
The serum (0.2ml) was pipetted into sets of clean labeled test tubes, 3 drops of precipitant
solution (polyvinyl sulphate, sodium EDTA, poly ethylene glycol monomethyl ester) was added
to the serum in the test tube, mixed properly and allowed to stand at 25˚C. The mixture was
centrifuged at 3000rpm for 10 minutes. A volume of 1ml each of cholesterol esterase, cholesterol
oxidase, peroxidase, pipes buffer (pH 6.8), phenol, 3,5-dichlorophenol, 4-amino antipyrine was
added to another set of test tubes labeled standard , blank and sample test labeled according to
group numbers. Also 0.1ml of the supernatant derived from the centrifugation of the precipitant
sample mixture was added appropriately to the test tubes. The entire media was mixed
thoroughly and allowed to stand for 10 minutes at 25˚C after which 0.1ml of the standard
(equivalent to 200mg/dl cholesterol) was added to the test tube labeled standard, mixed well and
allowed to stand for 10 minutes at 25˚C. the absorbance of the sample and the standard against
the sample blank was read at a wavelength of 505nm. The cholesterol content of the supernatant
was calculated using the formula:
Absorbance of the sample × concentration of the standard
Absorbance of the standard
2.2.9.10 Determination of Triacylglycerol (TAG) Concentration
Triacylglycerol concentration was determined by the method of Bucalo and David
(1973).
Procedure
A known volume, 1ml each of 4-chlorophenol, 4-amino antipyrine, ATP, MgCl2, glycerol
kinase, glycerol-3-phosphate oxidase, peroxidase and lipase was pipetted into a set of test tubes
labeled standard, blank and sample test. Also, 1ml of the supernatant derived from the
43
centrifugation of precipitate sample mixture was added appropriately to the labelled test tubes.
The entire media were mixed thoroughly and allowed to stand for 10 minutes at 25˚C, after
which 0.1ml of the standard solution was added to the test tube labelled standard, mixed
thoroughly and was allowed to stand for 10 minutes at 25˚C. The absorbance of the sample and
the standard against the reagent blank was read at a wavelength of 500nm.
The triacylglycerol content of each of the supernatants was calculated using the formula:
Absorbance of the sample × concentration of the standard
Absorbance of the standard
2.3 Statistical Analysis
Statistical analysis was determined using one way analysis of variance (ANOVA)
together with post Hoc test (multiple comparisons) i.e. LSD using statistical package for social
sciences. Data obtained from the test groups (mean of triple determination ± SD) were compared
with their respective controls and the differences were considered significant at p<0.05.
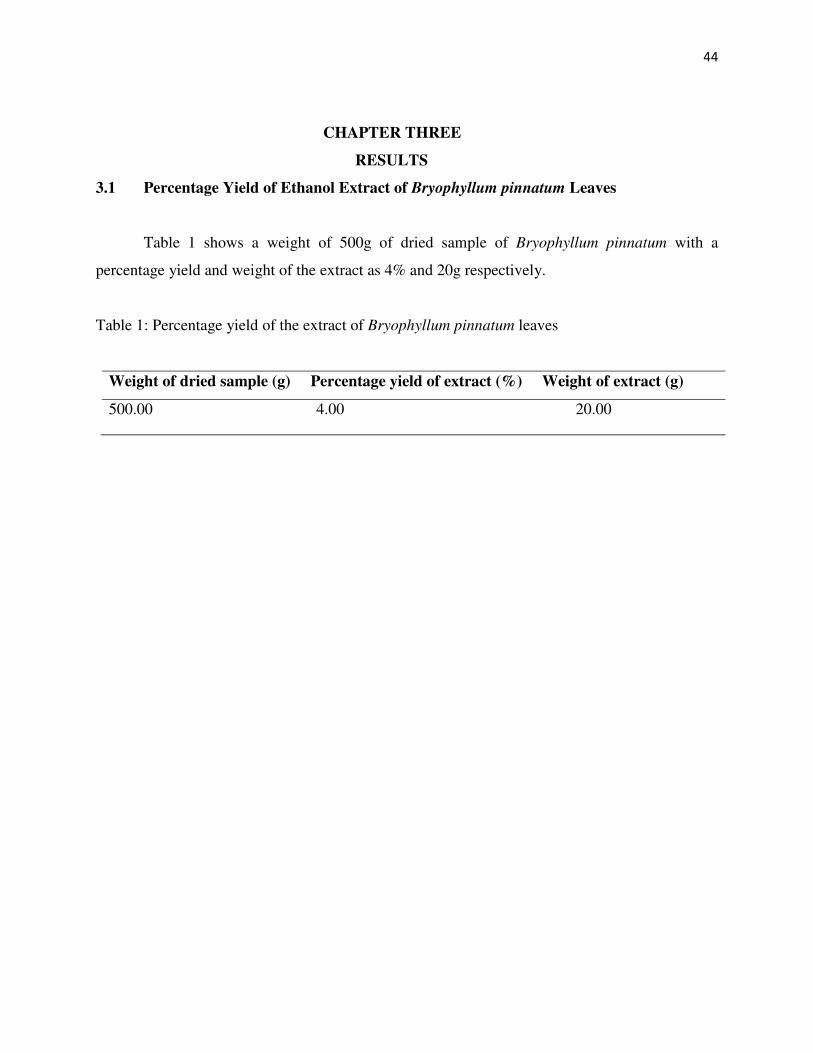
44
CHAPTER THREE
RESULTS
3.1 Percentage Yield of Ethanol Extract of Bryophyllum pinnatum Leaves
Table 1 shows a weight of 500g of dried sample of Bryophyllum pinnatum with a
percentage yield and weight of the extract as 4% and 20g respectively.
Table 1: Percentage yield of the extract of Bryophyllum pinnatum leaves
Weight of dried sample (g) Percentage yield of extract (%) Weight of extract (g)
500.00 4.00 20.00
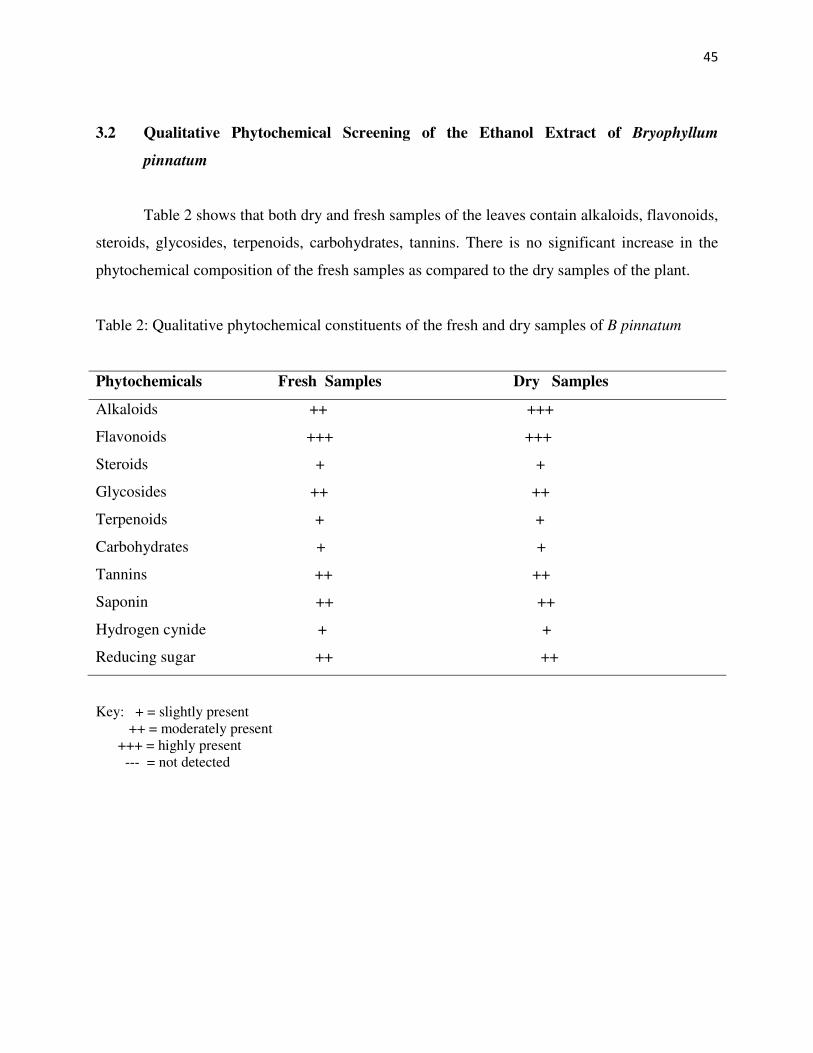
45
3.2 Qualitative Phytochemical Screening of the Ethanol Extract of Bryophyllum
pinnatum
Table 2 shows that both dry and fresh samples of the leaves contain alkaloids, flavonoids,
steroids, glycosides, terpenoids, carbohydrates, tannins. There is no significant increase in the
phytochemical composition of the fresh samples as compared to the dry samples of the plant.
Table 2: Qualitative phytochemical constituents of the fresh and dry samples of B pinnatum
Phytochemicals Fresh Samples Dry Samples
Alkaloids ++ +++
Flavonoids +++ +++
Steroids + +
Glycosides ++ ++
Terpenoids + +
Carbohydrates + +
Tannins ++ ++
Saponin ++ ++
Hydrogen cynide + +
Reducing sugar ++ ++
Key: + = slightly present ++ = moderately present +++ = highly present --- = not detected
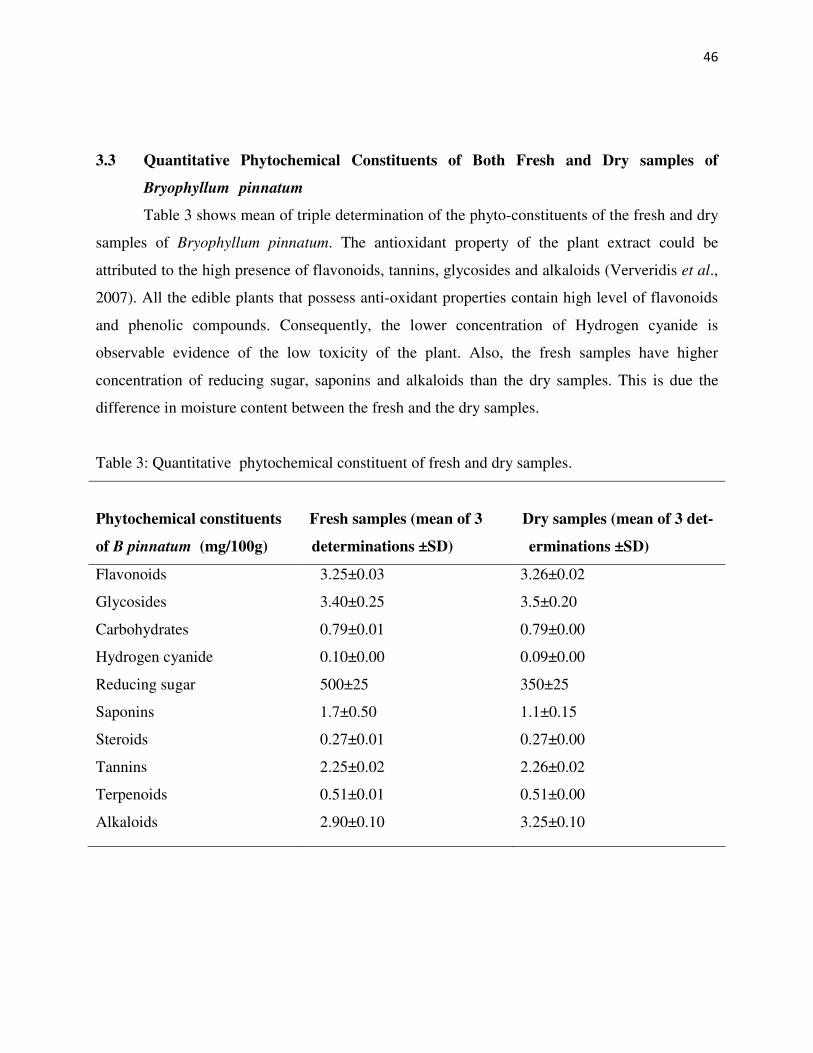
46
3.3 Quantitative Phytochemical Constituents of Both Fresh and Dry samples of
Bryophyllum pinnatum
Table 3 shows mean of triple determination of the phyto-constituents of the fresh and dry
samples of Bryophyllum pinnatum. The antioxidant property of the plant extract could be
attributed to the high presence of flavonoids, tannins, glycosides and alkaloids (Ververidis et al.,
2007). All the edible plants that possess anti-oxidant properties contain high level of flavonoids
and phenolic compounds. Consequently, the lower concentration of Hydrogen cyanide is
observable evidence of the low toxicity of the plant. Also, the fresh samples have higher
concentration of reducing sugar, saponins and alkaloids than the dry samples. This is due the
difference in moisture content between the fresh and the dry samples.
Table 3: Quantitative phytochemical constituent of fresh and dry samples.
Phytochemical constituents Fresh samples (mean of 3 Dry samples (mean of 3 det-
of B pinnatum (mg/100g) determinations ±SD) erminations ±SD)
Flavonoids
Glycosides
Carbohydrates
Hydrogen cyanide
Reducing sugar
Saponins
Steroids
Tannins
Terpenoids
Alkaloids
3.25±0.03
3.40±0.25
0.79±0.01
0.10±0.00
500±25
1.7±0.50
0.27±0.01
2.25±0.02
0.51±0.01
2.90±0.10
3.26±0.02
3.5±0.20
0.79±0.00
0.09±0.00
350±25
1.1±0.15
0.27±0.00
2.26±0.02
0.51±0.00
3.25±0.10
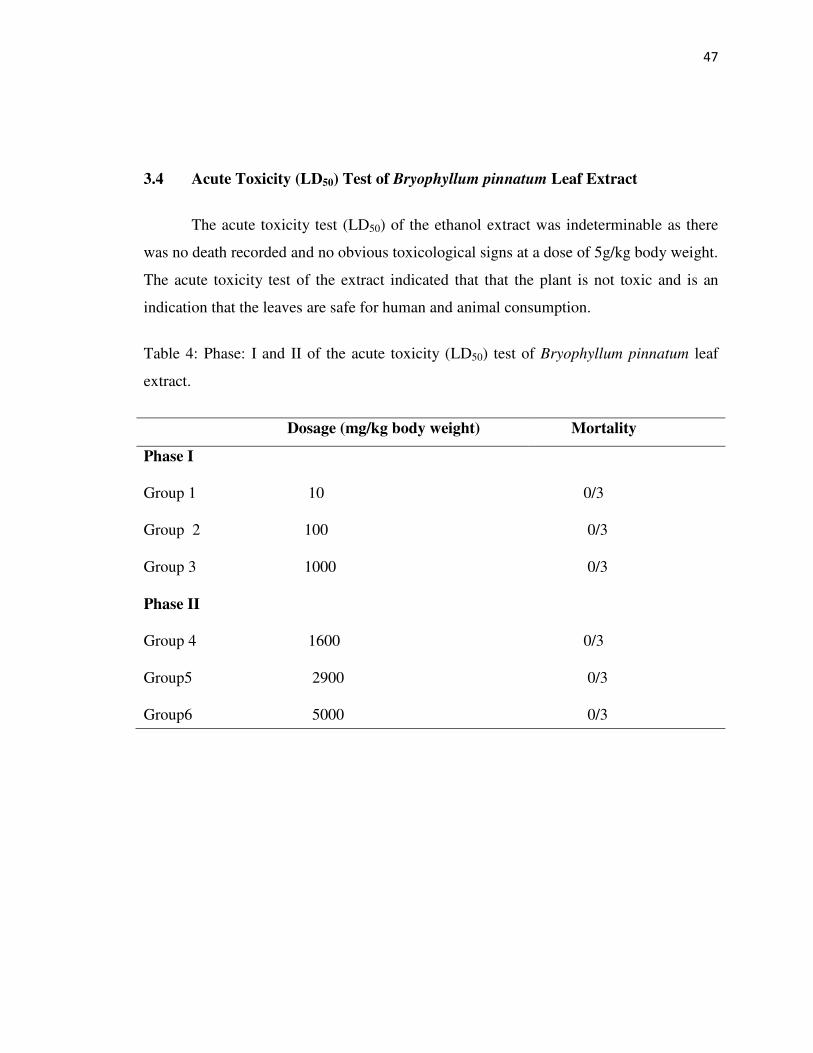
47
3.4 Acute Toxicity (LD50) Test of Bryophyllum pinnatum Leaf Extract
The acute toxicity test (LD50) of the ethanol extract was indeterminable as there
was no death recorded and no obvious toxicological signs at a dose of 5g/kg body weight.
The acute toxicity test of the extract indicated that that the plant is not toxic and is an
indication that the leaves are safe for human and animal consumption.
Table 4: Phase: I and II of the acute toxicity (LD50) test of Bryophyllum pinnatum leaf
extract.
Dosage (mg/kg body weight) Mortality
Phase I
Group 1 10 0/3
Group 2 100 0/3
Group 3 1000 0/3
Phase II
Group 4 1600 0/3
Group5 2900 0/3
Group6 5000 0/3
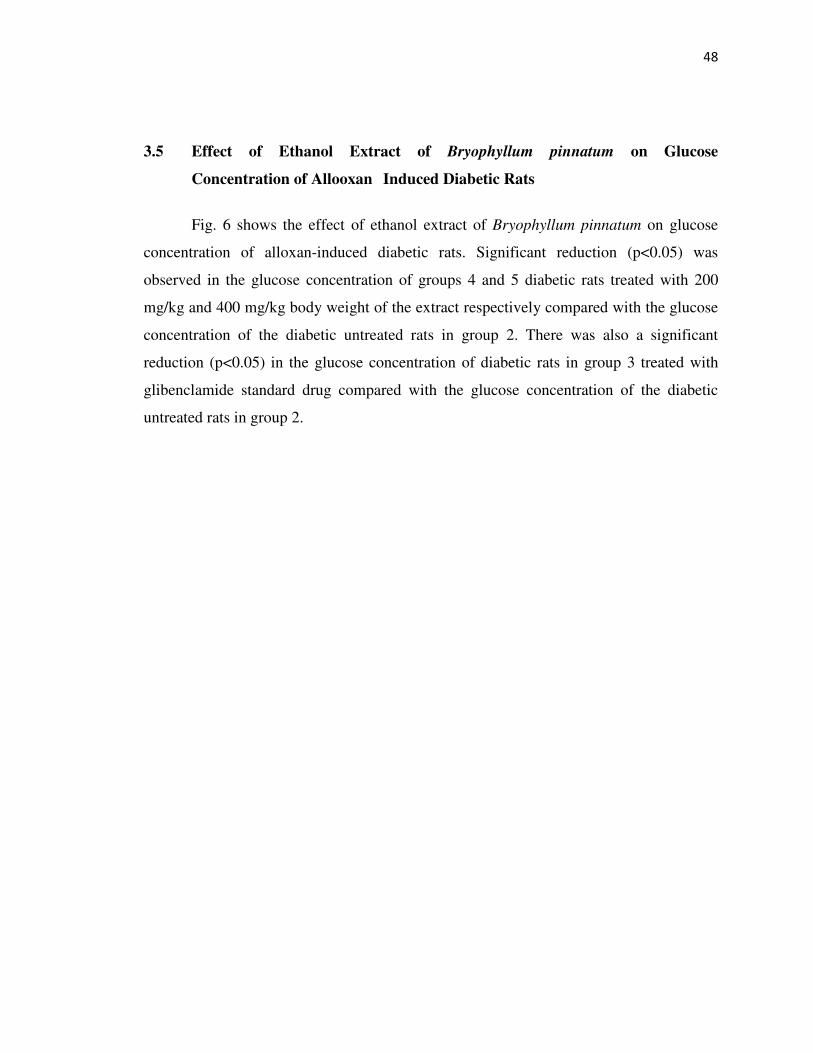
48
3.5 Effect of Ethanol Extract of Bryophyllum pinnatum on Glucose
Concentration of Allooxan Induced Diabetic Rats
Fig. 6 shows the effect of ethanol extract of Bryophyllum pinnatum on glucose
concentration of alloxan-induced diabetic rats. Significant reduction (p<0.05) was
observed in the glucose concentration of groups 4 and 5 diabetic rats treated with 200
mg/kg and 400 mg/kg body weight of the extract respectively compared with the glucose
concentration of the diabetic untreated rats in group 2. There was also a significant
reduction (p<0.05) in the glucose concentration of diabetic rats in group 3 treated with
glibenclamide standard drug compared with the glucose concentration of the diabetic
untreated rats in group 2.
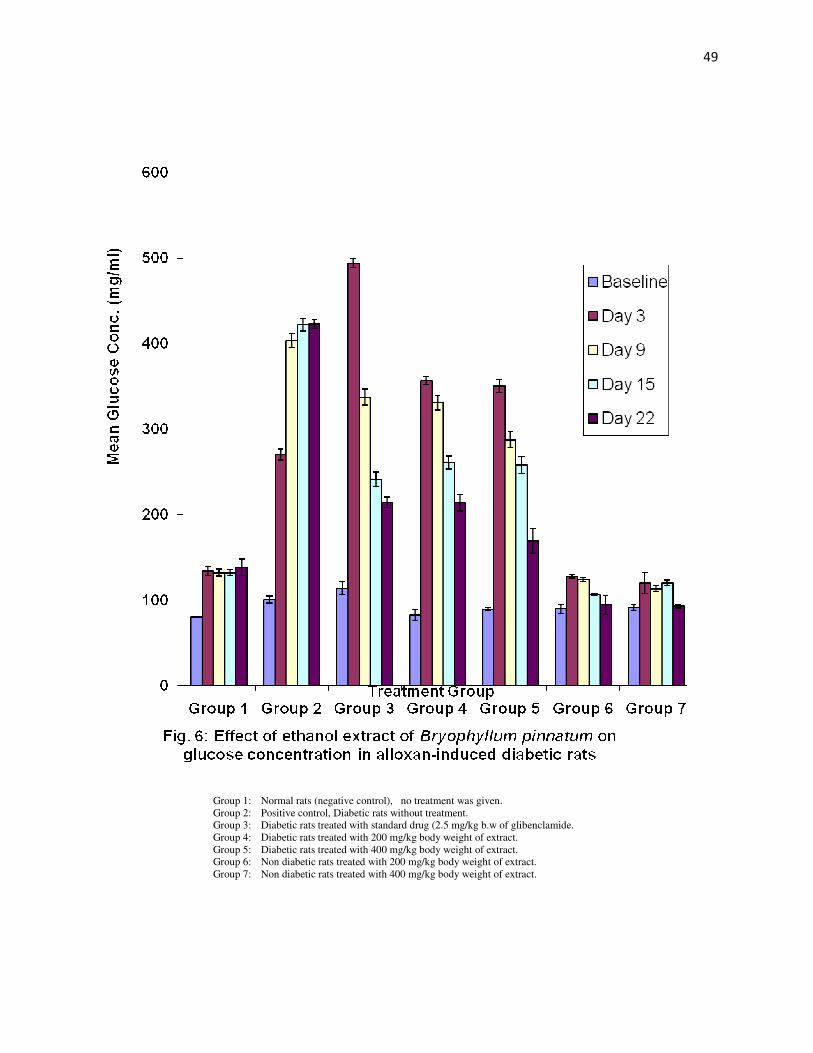
49
Group 1: Normal rats (negative control), no treatment was given. Group 2: Positive control, Diabetic rats without treatment. Group 3: Diabetic rats treated with standard drug (2.5 mg/kg b.w of glibenclamide. Group 4: Diabetic rats treated with 200 mg/kg body weight of extract. Group 5: Diabetic rats treated with 400 mg/kg body weight of extract. Group 6: Non diabetic rats treated with 200 mg/kg body weight of extract. Group 7: Non diabetic rats treated with 400 mg/kg body weight of extract.
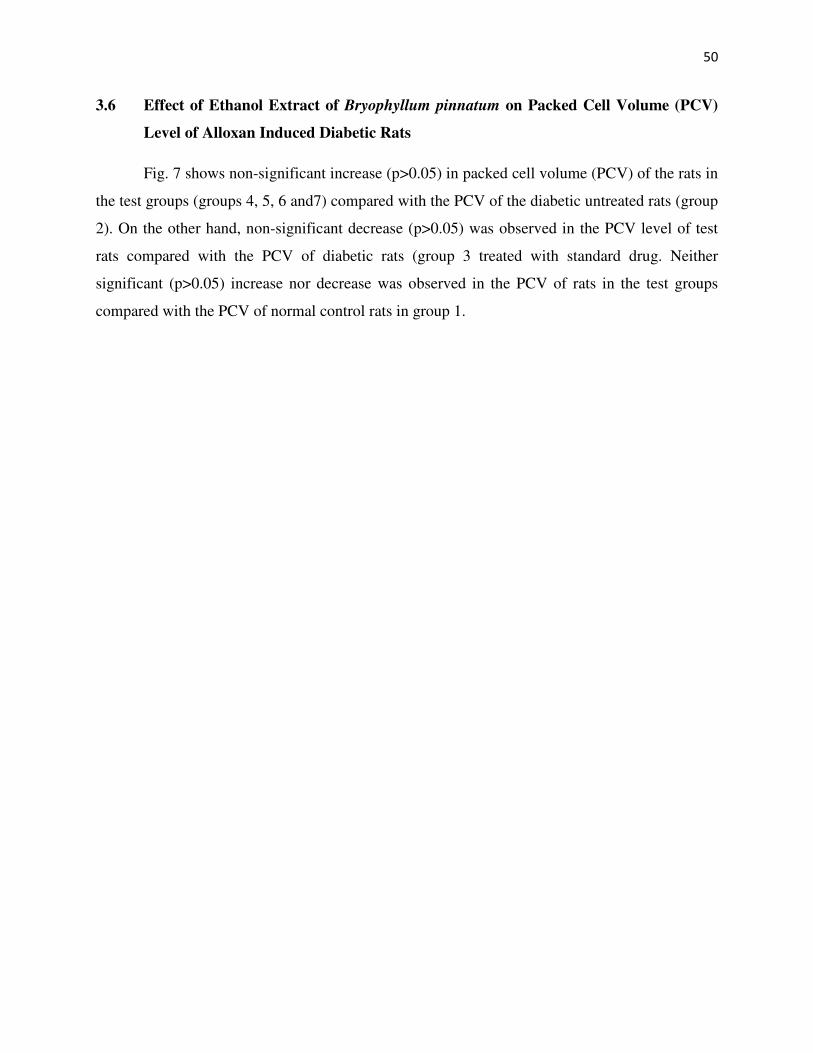
50
3.6 Effect of Ethanol Extract of Bryophyllum pinnatum on Packed Cell Volume (PCV)
Level of Alloxan Induced Diabetic Rats
Fig. 7 shows non-significant increase (p>0.05) in packed cell volume (PCV) of the rats in
the test groups (groups 4, 5, 6 and7) compared with the PCV of the diabetic untreated rats (group
2). On the other hand, non-significant decrease (p>0.05) was observed in the PCV level of test
rats compared with the PCV of diabetic rats (group 3 treated with standard drug. Neither
significant (p>0.05) increase nor decrease was observed in the PCV of rats in the test groups
compared with the PCV of normal control rats in group 1.
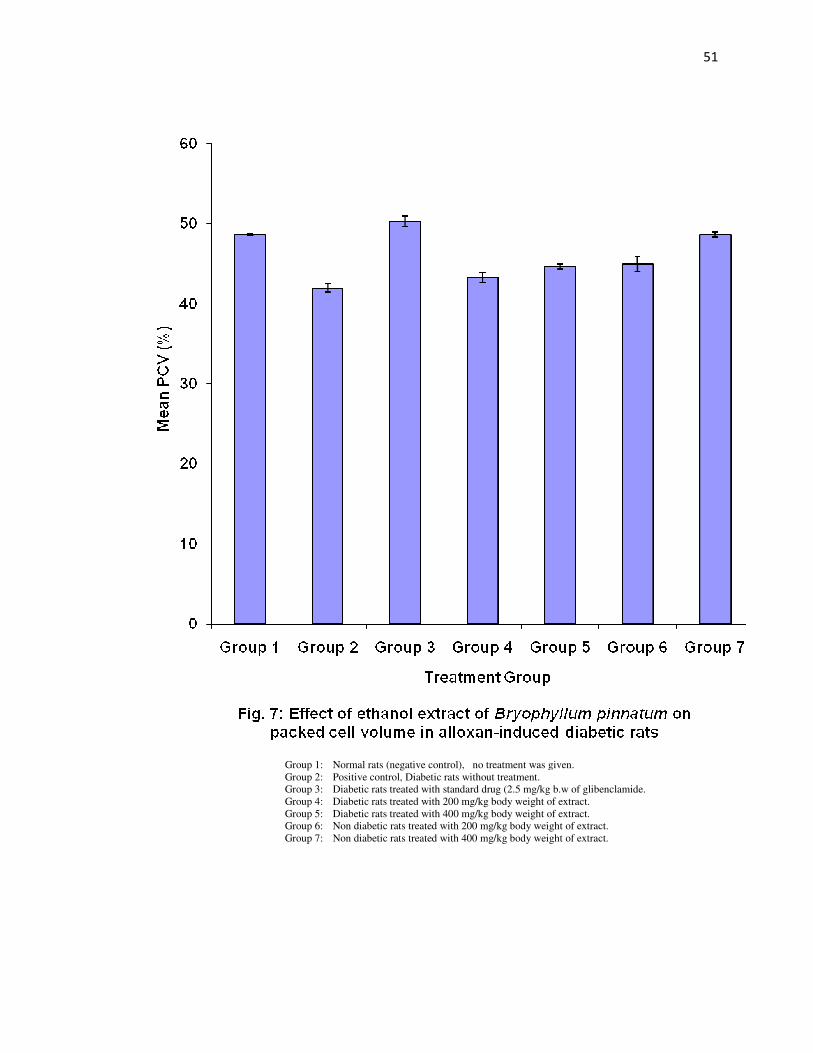
51
Group 1: Normal rats (negative control), no treatment was given. Group 2: Positive control, Diabetic rats without treatment. Group 3: Diabetic rats treated with standard drug (2.5 mg/kg b.w of glibenclamide. Group 4: Diabetic rats treated with 200 mg/kg body weight of extract. Group 5: Diabetic rats treated with 400 mg/kg body weight of extract. Group 6: Non diabetic rats treated with 200 mg/kg body weight of extract. Group 7: Non diabetic rats treated with 400 mg/kg body weight of extract.
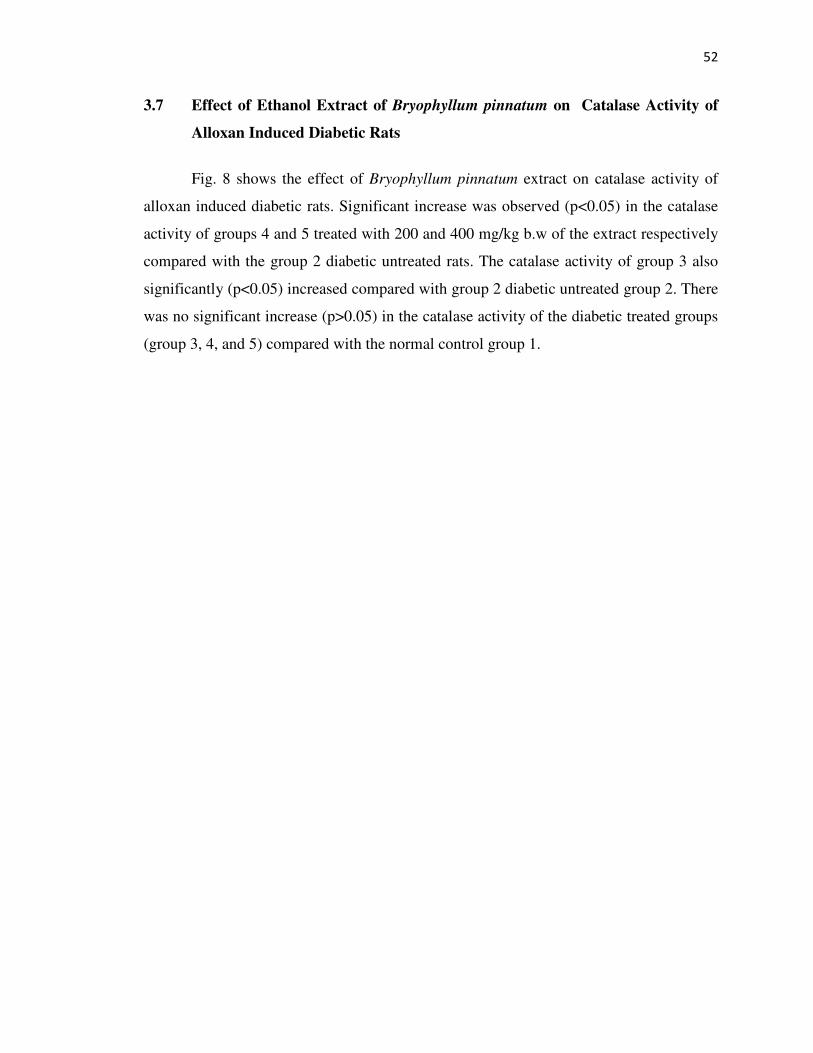
52
3.7 Effect of Ethanol Extract of Bryophyllum pinnatum on Catalase Activity of
Alloxan Induced Diabetic Rats
Fig. 8 shows the effect of Bryophyllum pinnatum extract on catalase activity of
alloxan induced diabetic rats. Significant increase was observed (p<0.05) in the catalase
activity of groups 4 and 5 treated with 200 and 400 mg/kg b.w of the extract respectively
compared with the group 2 diabetic untreated rats. The catalase activity of group 3 also
significantly (p<0.05) increased compared with group 2 diabetic untreated group 2. There
was no significant increase (p>0.05) in the catalase activity of the diabetic treated groups
(group 3, 4, and 5) compared with the normal control group 1.
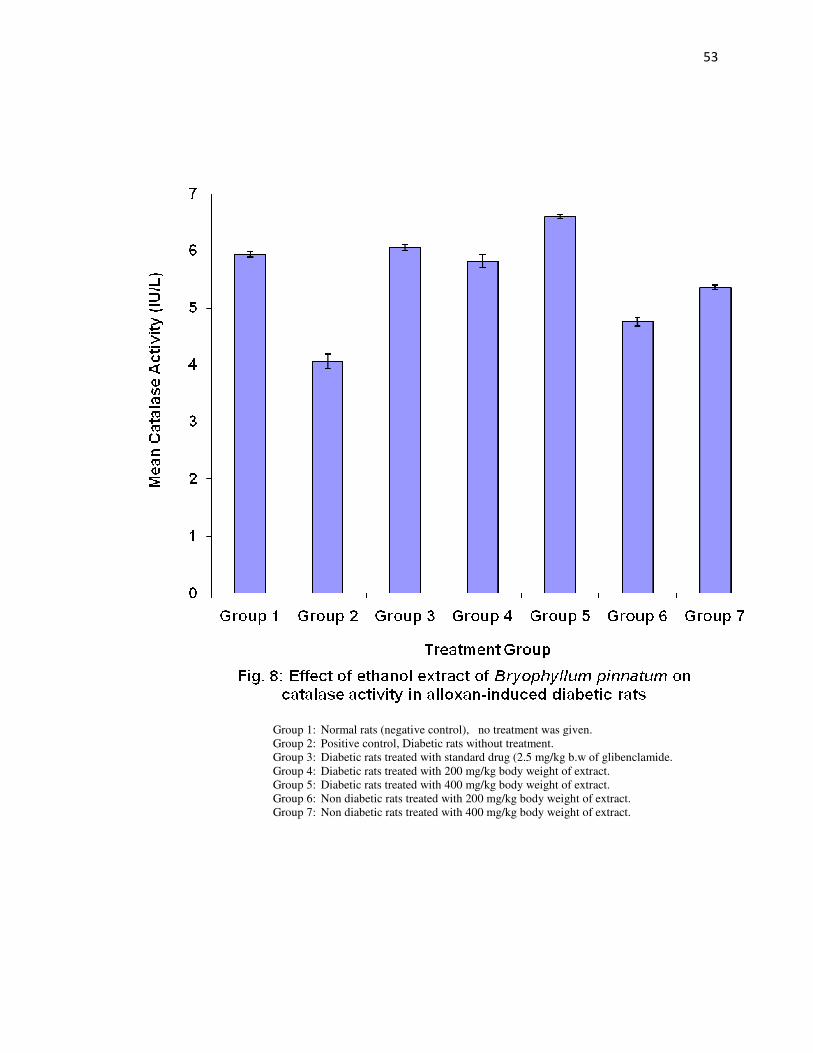
53
Group 1: Normal rats (negative control), no treatment was given. Group 2: Positive control, Diabetic rats without treatment. Group 3: Diabetic rats treated with standard drug (2.5 mg/kg b.w of glibenclamide. Group 4: Diabetic rats treated with 200 mg/kg body weight of extract. Group 5: Diabetic rats treated with 400 mg/kg body weight of extract. Group 6: Non diabetic rats treated with 200 mg/kg body weight of extract. Group 7: Non diabetic rats treated with 400 mg/kg body weight of extract.
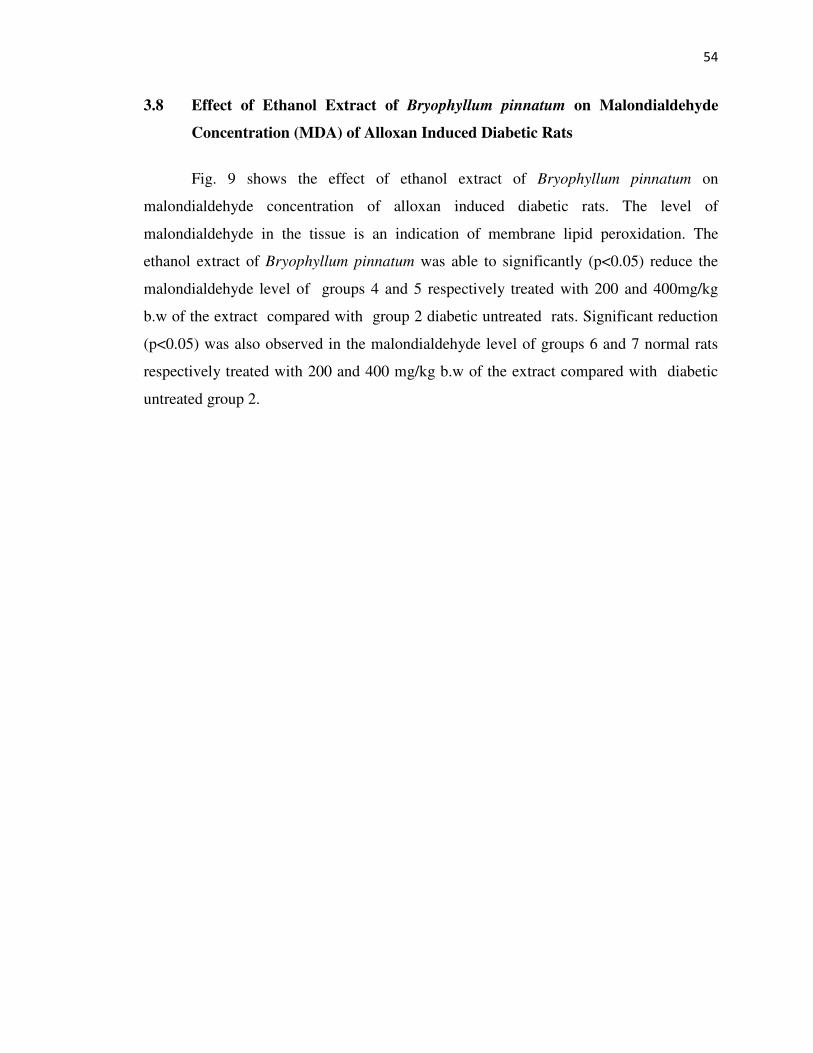
54
3.8 Effect of Ethanol Extract of Bryophyllum pinnatum on Malondialdehyde
Concentration (MDA) of Alloxan Induced Diabetic Rats
Fig. 9 shows the effect of ethanol extract of Bryophyllum pinnatum on
malondialdehyde concentration of alloxan induced diabetic rats. The level of
malondialdehyde in the tissue is an indication of membrane lipid peroxidation. The
ethanol extract of Bryophyllum pinnatum was able to significantly (p<0.05) reduce the
malondialdehyde level of groups 4 and 5 respectively treated with 200 and 400mg/kg
b.w of the extract compared with group 2 diabetic untreated rats. Significant reduction
(p<0.05) was also observed in the malondialdehyde level of groups 6 and 7 normal rats
respectively treated with 200 and 400 mg/kg b.w of the extract compared with diabetic
untreated group 2.
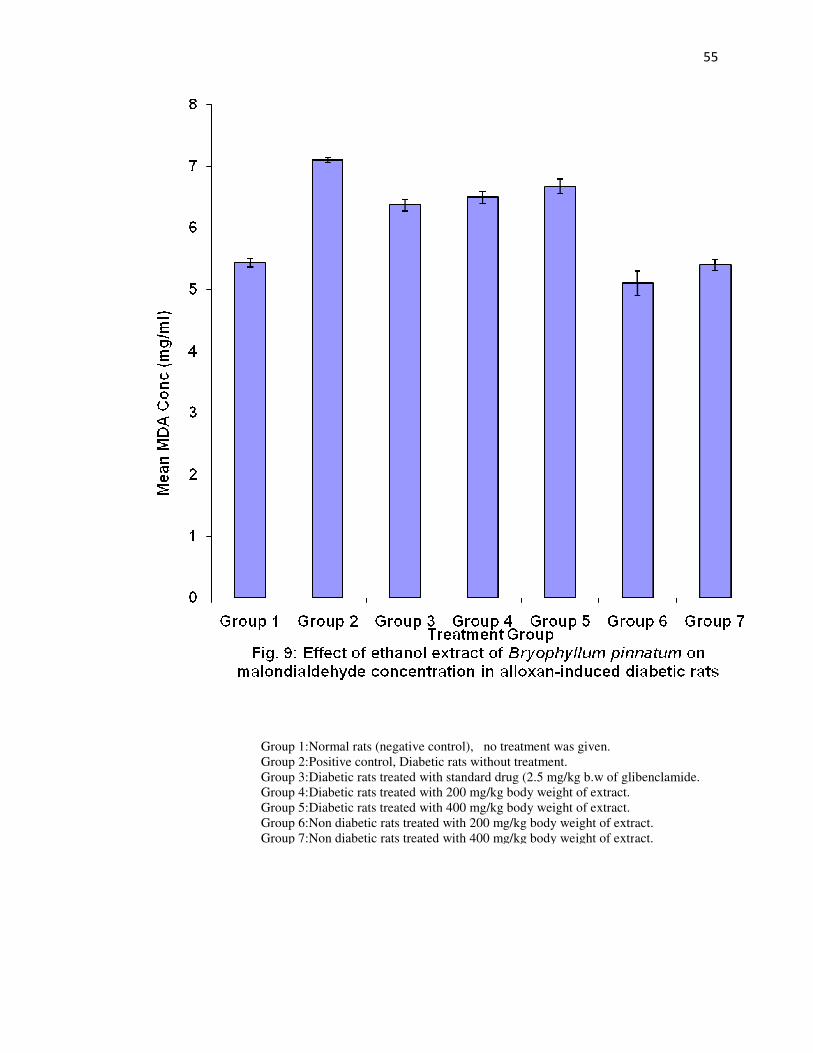
55
Group 1: Normal rats (negative control), no treatment was given. Group 2: Positive control, Diabetic rats without treatment. Group 3: Diabetic rats treated with standard drug (2.5 mg/kg b.w of glibenclamide. Group 4: Diabetic rats treated with 200 mg/kg body weight of extract. Group 5: Diabetic rats treated with 400 mg/kg body weight of extract. Group 6: Non diabetic rats treated with 200 mg/kg body weight of extract. Group 7: Non diabetic rats treated with 400 mg/kg body weight of extract.
56
3.9 Effect of Ethanol Extract of Bryophyllum pinnatum on Haemoglobin
Concentration of Alloxan Induced Diabetic Rats
Fig. 10 shows the effect of the extract on haemoglobin concentration of alloxan
induced diabetic rats. The extract was able to significantly (p<0.05) increase the
haemoglobin concentration of the treated groups 4, 5, 6 and 7 compared with the diabetic
untreated group 2. The reduction in haemoglobin concentration of group 2 might be due
to glycosylation of the red cells which prevented the possibility of binding of the haem
molecule. There is no significant increase between groups 6 and 7 normal rats
respectively treated with 200 and 400 mg/kg b.w of the extract compared with group 1
normal control.
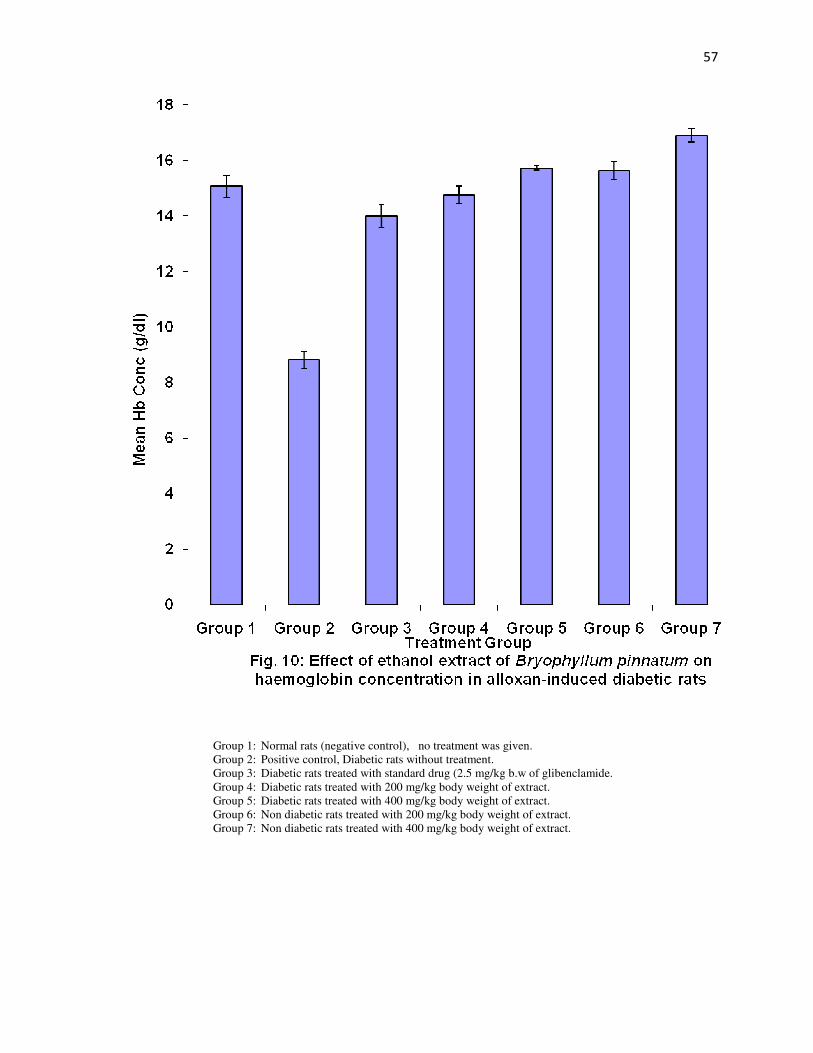
57
Group 1: Normal rats (negative control), no treatment was given. Group 2: Positive control, Diabetic rats without treatment. Group 3: Diabetic rats treated with standard drug (2.5 mg/kg b.w of glibenclamide. Group 4: Diabetic rats treated with 200 mg/kg body weight of extract. Group 5: Diabetic rats treated with 400 mg/kg body weight of extract. Group 6: Non diabetic rats treated with 200 mg/kg body weight of extract. Group 7: Non diabetic rats treated with 400 mg/kg body weight of extract.
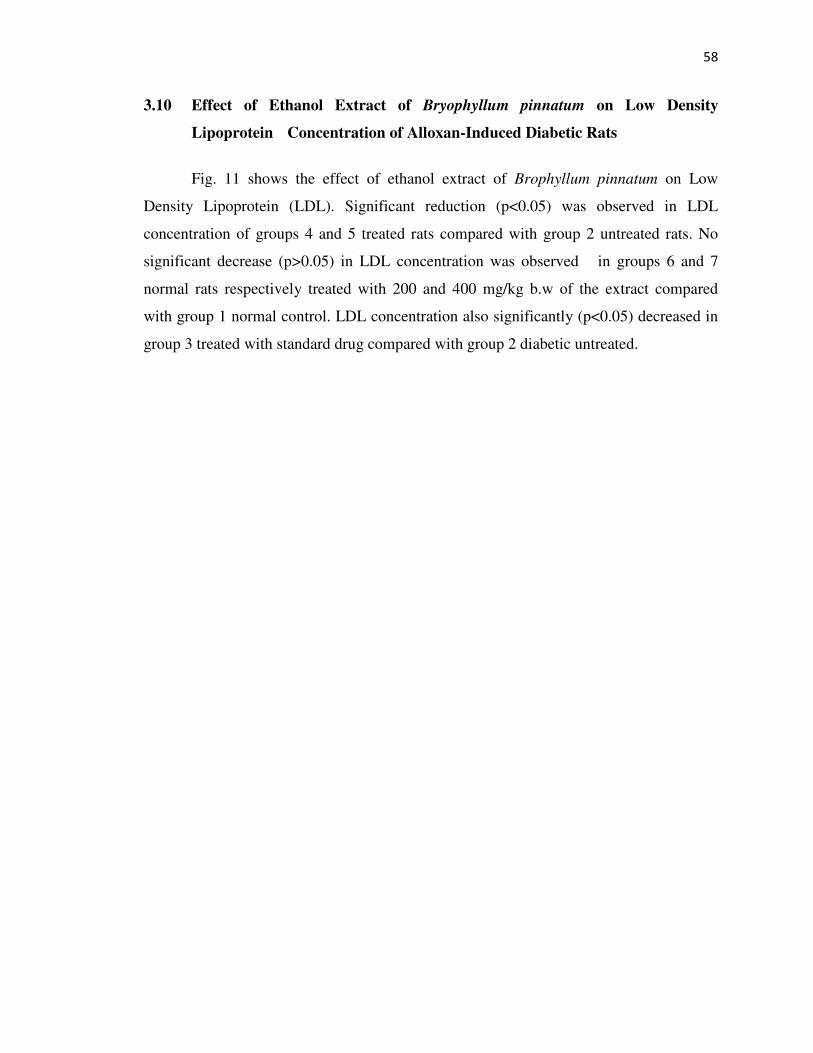
58
3.10 Effect of Ethanol Extract of Bryophyllum pinnatum on Low Density
Lipoprotein Concentration of Alloxan-Induced Diabetic Rats
Fig. 11 shows the effect of ethanol extract of Brophyllum pinnatum on Low
Density Lipoprotein (LDL). Significant reduction (p<0.05) was observed in LDL
concentration of groups 4 and 5 treated rats compared with group 2 untreated rats. No
significant decrease (p>0.05) in LDL concentration was observed in groups 6 and 7
normal rats respectively treated with 200 and 400 mg/kg b.w of the extract compared
with group 1 normal control. LDL concentration also significantly (p<0.05) decreased in
group 3 treated with standard drug compared with group 2 diabetic untreated.
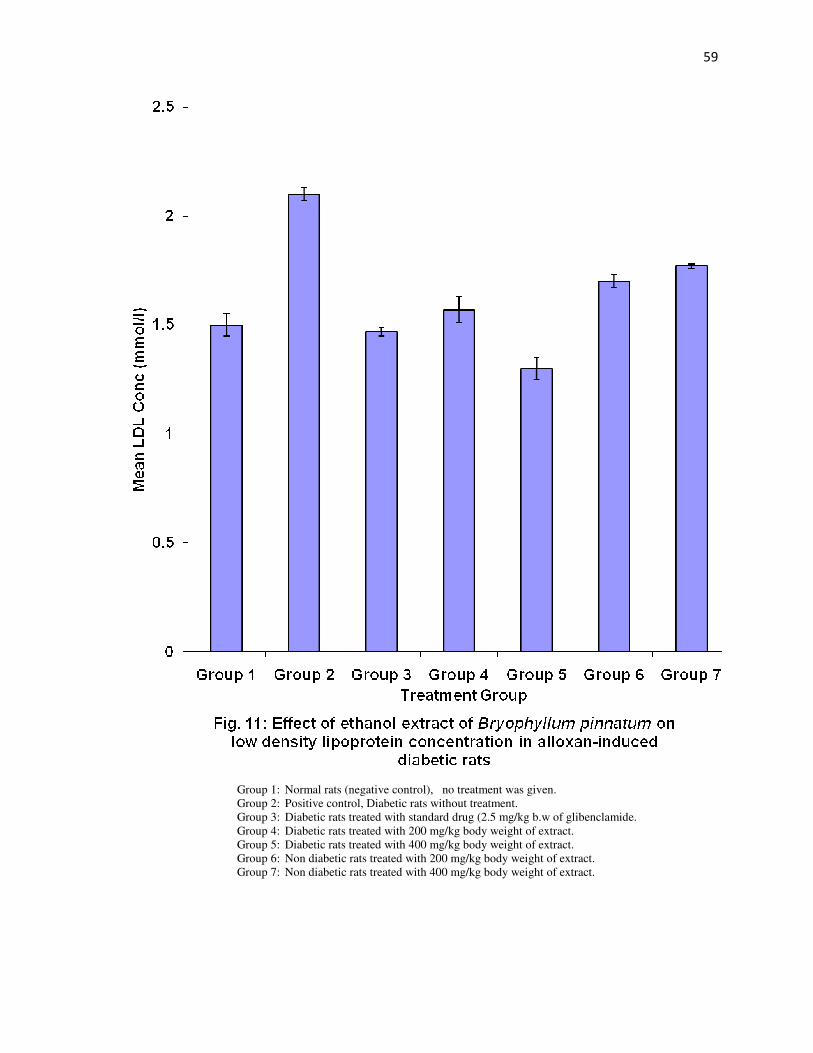
59
Group 1: Normal rats (negative control), no treatment was given. Group 2: Positive control, Diabetic rats without treatment. Group 3: Diabetic rats treated with standard drug (2.5 mg/kg b.w of glibenclamide. Group 4: Diabetic rats treated with 200 mg/kg body weight of extract. Group 5: Diabetic rats treated with 400 mg/kg body weight of extract. Group 6: Non diabetic rats treated with 200 mg/kg body weight of extract. Group 7: Non diabetic rats treated with 400 mg/kg body weight of extract.
60
3.11 Effect of Ethanol Extract of Bryophyllum pinnatum on Red Blood Cell of
Alloxan Induced Diabetic Rats
Fig. 12 shows the effect of ethanol extract of Bryophyllum pinnatum on the red
blood cell concentration of alloxan induced diabetic rats. There was no significant
increase (p>0.05) in the red blood cell concentration of the treated groups (groups 4 and
5) compared with diabetic untreated group 2. Significant increase (p<0.05) was observed
in group 3 treated with standard drug compared with group 2 untreated rats. There was no
significant increase (p>0.05) in groups 6 and 7 compared with group 1 normal control.
61
Group 1: Normal rats (negative control), no treatment was given. Group 2: Positive control, Diabetic rats without treatment. Group 3: Diabetic rats treated with standard drug (2.5 mg/kg b.w of glibenclamide. Group 4: Diabetic rats treated with 200 mg/kg body weight of extract. Group 5: Diabetic rats treated with 400 mg/kg body weight of extract. Group 6: Non diabetic rats treated with 200 mg/kg body weight of extract. Group 7: Non diabetic rats treated with 400 mg/kg body weight of extract.
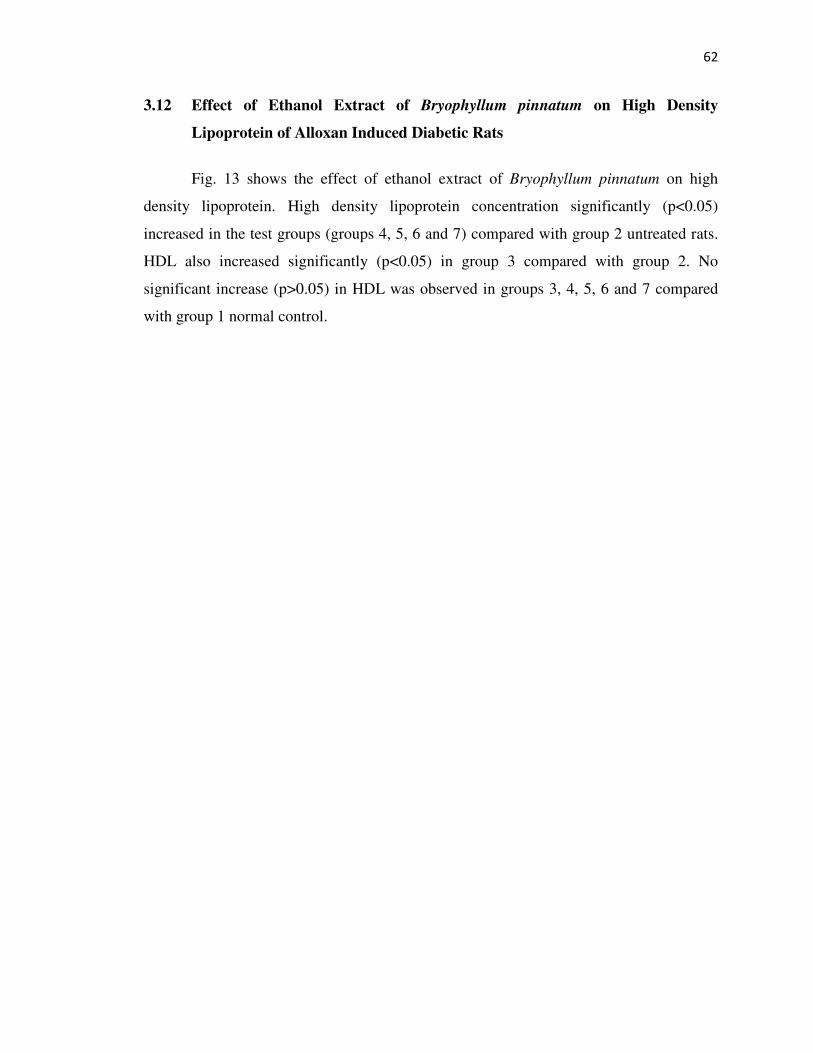
62
3.12 Effect of Ethanol Extract of Bryophyllum pinnatum on High Density
Lipoprotein of Alloxan Induced Diabetic Rats
Fig. 13 shows the effect of ethanol extract of Bryophyllum pinnatum on high
density lipoprotein. High density lipoprotein concentration significantly (p<0.05)
increased in the test groups (groups 4, 5, 6 and 7) compared with group 2 untreated rats.
HDL also increased significantly (p<0.05) in group 3 compared with group 2. No
significant increase (p>0.05) in HDL was observed in groups 3, 4, 5, 6 and 7 compared
with group 1 normal control.
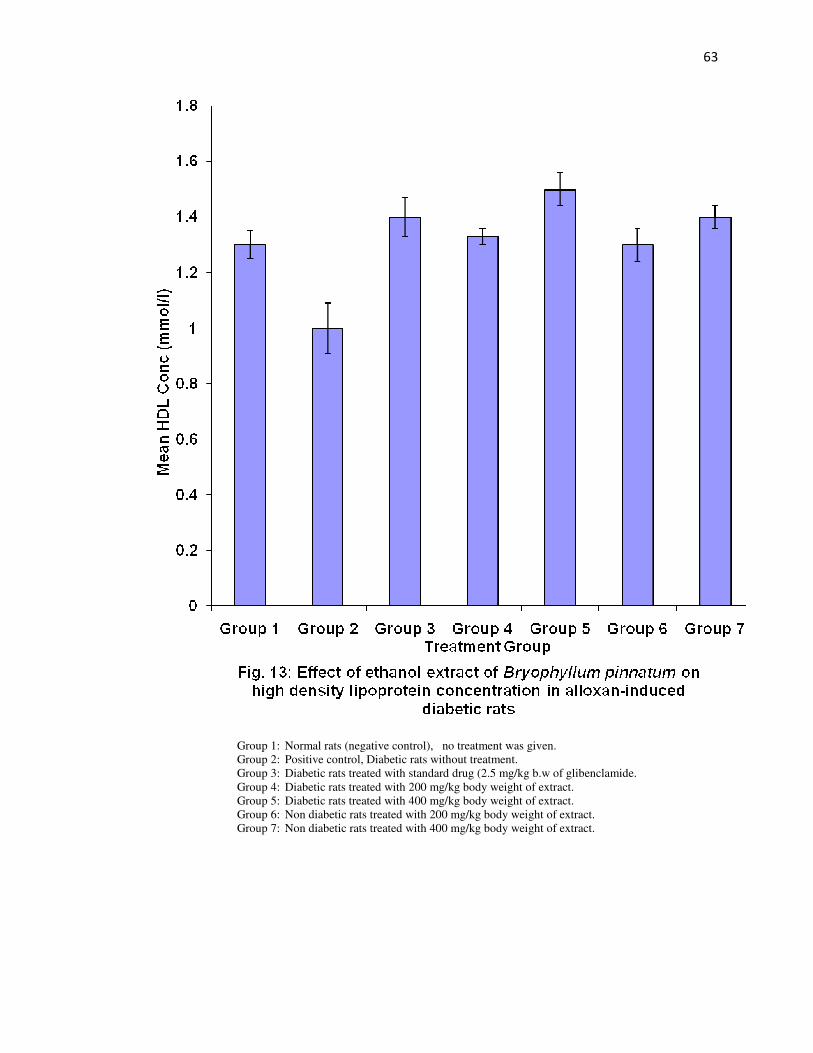
63
Group 1: Normal rats (negative control), no treatment was given. Group 2: Positive control, Diabetic rats without treatment. Group 3: Diabetic rats treated with standard drug (2.5 mg/kg b.w of glibenclamide. Group 4: Diabetic rats treated with 200 mg/kg body weight of extract. Group 5: Diabetic rats treated with 400 mg/kg body weight of extract. Group 6: Non diabetic rats treated with 200 mg/kg body weight of extract. Group 7: Non diabetic rats treated with 400 mg/kg body weight of extract.
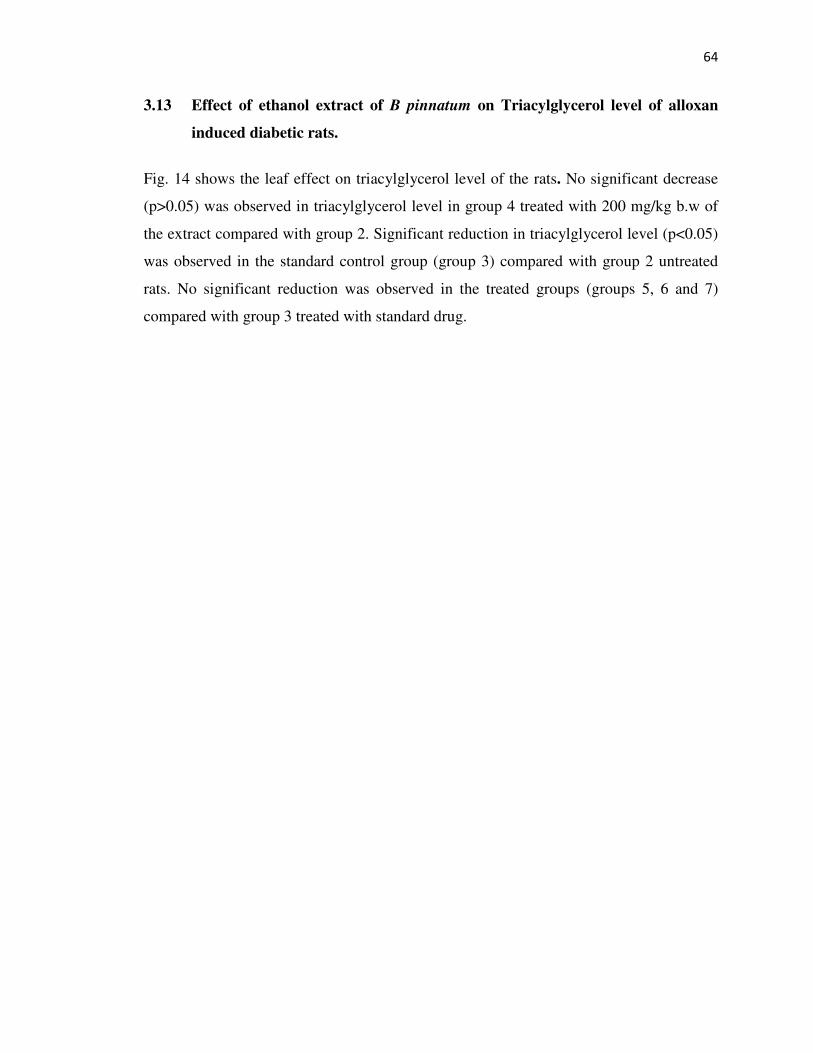
64
3.13 Effect of ethanol extract of B pinnatum on Triacylglycerol level of alloxan
induced diabetic rats.
Fig. 14 shows the leaf effect on triacylglycerol level of the rats. No significant decrease
(p>0.05) was observed in triacylglycerol level in group 4 treated with 200 mg/kg b.w of
the extract compared with group 2. Significant reduction in triacylglycerol level (p<0.05)
was observed in the standard control group (group 3) compared with group 2 untreated
rats. No significant reduction was observed in the treated groups (groups 5, 6 and 7)
compared with group 3 treated with standard drug.
65
Group 1: Normal rats (negative control), no treatment was given. Group 2: Positive control, Diabetic rats without treatment. Group 3: Diabetic rats treated with standard drug (2.5 mg/kg b.w of glibenclamide. Group 4: Diabetic rats treated with 200 mg/kg body weight of extract. Group 5: Diabetic rats treated with 400 mg/kg body weight of extract. Group 6: Non diabetic rats treated with 200 mg/kg body weight of extract. Group 7: Non diabetic rats treated with 400 mg/kg body weight of extract.
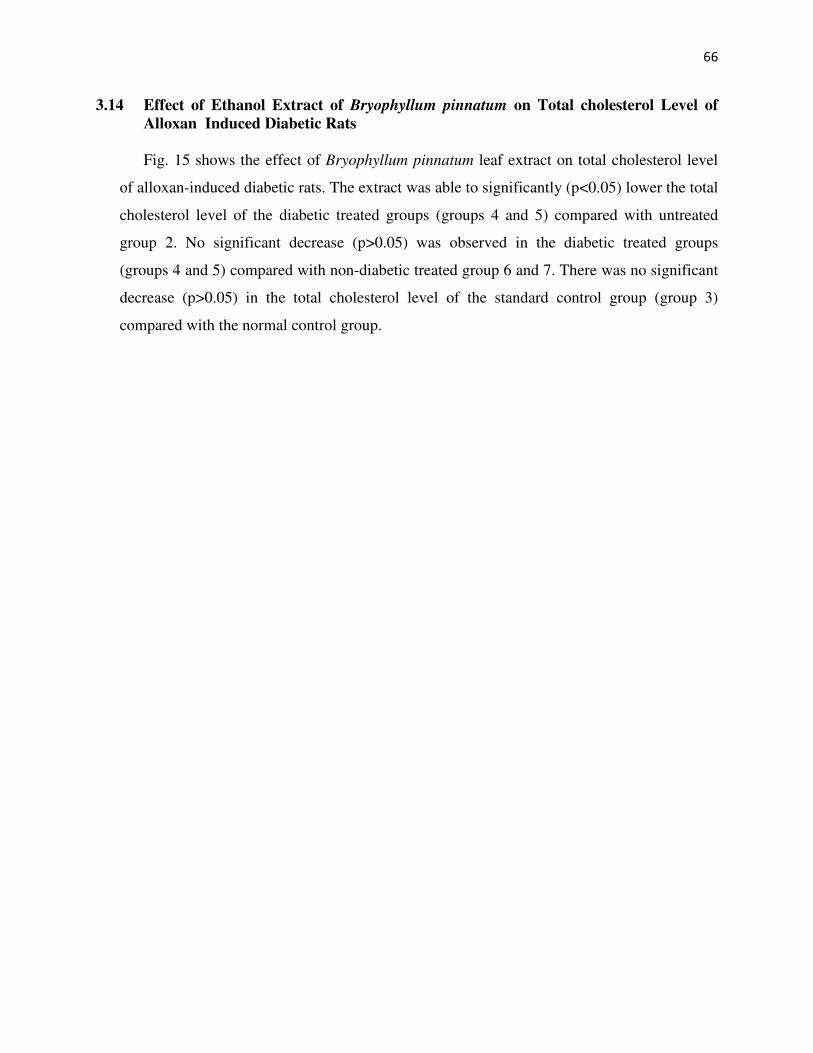
66
3.14 Effect of Ethanol Extract of Bryophyllum pinnatum on Total cholesterol Level of
Alloxan Induced Diabetic Rats
Fig. 15 shows the effect of Bryophyllum pinnatum leaf extract on total cholesterol level
of alloxan-induced diabetic rats. The extract was able to significantly (p<0.05) lower the total
cholesterol level of the diabetic treated groups (groups 4 and 5) compared with untreated
group 2. No significant decrease (p>0.05) was observed in the diabetic treated groups
(groups 4 and 5) compared with non-diabetic treated group 6 and 7. There was no significant
decrease (p>0.05) in the total cholesterol level of the standard control group (group 3)
compared with the normal control group.
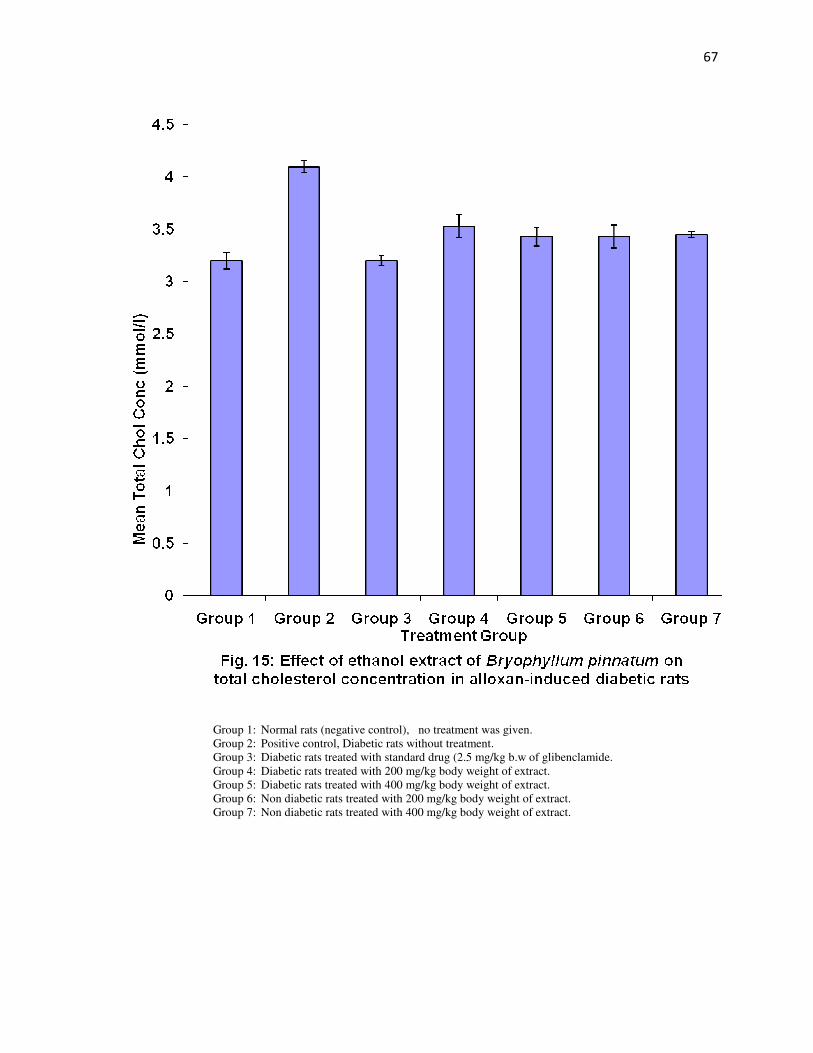
67
Group 1: Normal rats (negative control), no treatment was given. Group 2: Positive control, Diabetic rats without treatment. Group 3: Diabetic rats treated with standard drug (2.5 mg/kg b.w of glibenclamide. Group 4: Diabetic rats treated with 200 mg/kg body weight of extract. Group 5: Diabetic rats treated with 400 mg/kg body weight of extract. Group 6: Non diabetic rats treated with 200 mg/kg body weight of extract. Group 7: Non diabetic rats treated with 400 mg/kg body weight of extract.
68
3.15 Effect of Ethanol Extract of Bryophyllum pinnatum on Total White Blood Cell Level of
Alloxan Induced Diabetic Rats
Fig. 16 shows the effect of the extract of Bryophyllum pinnatum on total white blood cell level of
alloxan induced diabetic rats. The extract significantly (p<0.05) reduced the number of white blood cell
count in those diabetic groups (groups 4 and 5) treated with the extract compared with group 2untreated
rats. The standard control group treated with glibenclamide also decreased significantly (p<0.05)
compared with group 2 diabetic untreated.
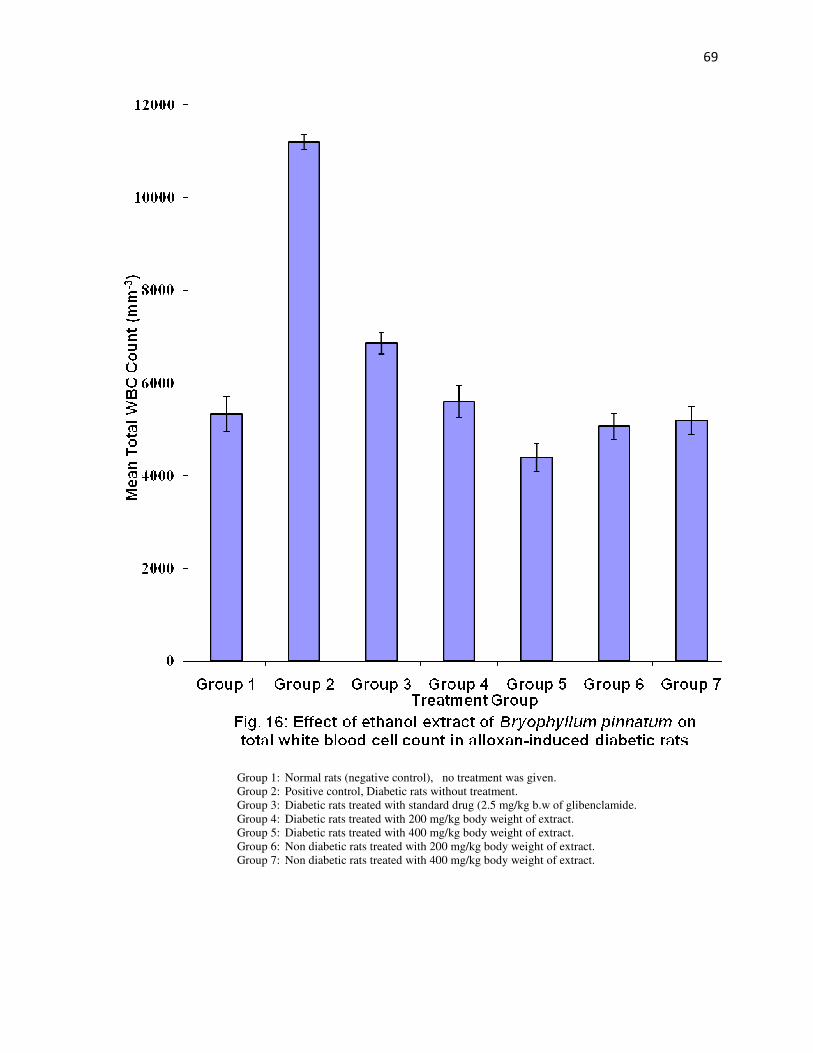
69
Group 1: Normal rats (negative control), no treatment was given. Group 2: Positive control, Diabetic rats without treatment. Group 3: Diabetic rats treated with standard drug (2.5 mg/kg b.w of glibenclamide. Group 4: Diabetic rats treated with 200 mg/kg body weight of extract. Group 5: Diabetic rats treated with 400 mg/kg body weight of extract. Group 6: Non diabetic rats treated with 200 mg/kg body weight of extract. Group 7: Non diabetic rats treated with 400 mg/kg body weight of extract.
70
CHAPTER FOUR
DISCUSSION
4.1 Discussion
This study is a report of the effects of ethanol extract of Bryophyllum pinnatum on
alloxan-induced diabetic rats. Diabetes mellitus is a chronic disorder caused by partial or
complete insulin deficiency, which produces inadequate glucose metabolism and leads to acute
and chronic complications. Premature and extensive arteriosclerosis involving renal, peripheral
and cardiovascular vessels remain the major complications of diabetes mellitus
(Thirunavukkarasu et al., 2003). Currently, the management of diabetes mainly involves
lowering of blood glucose level by the use of biguanides, sulphonylureas, diphenyalanine
derivatives, thiazolidinediones and glucosidase inhibitors in addition to insulin. However, due to
some side effects, the efficacies of these compounds are debatable. There is therefore a demand
for new compounds for the management of diabetes (Thirunavukkarasu et al., 2003). Hence,
plants have been suggested as a rich, yet unexplored, source of potentially useful antidiabetic
active ingredients. However, only a few have been subjected to detailed scientific investigation
due to lack of mechanism-based available in-vitro assays (Saxena and Vikram, 2004).
The phytochemical composition of the ethanol extracts of the leaves of Bryothyllum
pinnatum indicated the abundance of many secondary metabolites including flavonoids,
alkaloids, tannins, saponins, glycosides, etc. From the results, flavonoids, glycosides, alkaloids,
and tannins were found in higher amounts in both dry and fresh samples while steroids, hydrogen
cyanides and carbohydrates were found in very low concentration in both samples. Also,
reducing sugar, saponins, terpenoids and glycosides were moderately high in both samples.
There is no significant difference (p>0.05) between the quantitative phytochemical constituents
of the dry and fresh samples. The flavonoids, saponins and alkaloids are said to have medicinal
properties in animal (Living stone et al., 1997). However, in high concentrations, these
secondary metabolites are toxic and may impair body metabolism (Wieslaw et al., 1999). The
results of the phytochemical composition of Bryophyllum pinnatum is in consistent with the
finding of Puri and Baral, (1998) and consequently suggested that the plant extract might be
responsible for reducing the blood glucose concentration in alloxan-induced diabetic rats.
71
The acute toxicity (LD50) test of ethanol leaf extract indicated that the plant leaves were
not toxic. The result showed that no casualty was recorded at a dose as high as 5000 mg/kg body
weight. This is an indication that the leaves are relatively safe for human and animal
consumptions. The results of the effect of different doses of the extract showed that the extract
was active in reducing the blood glucose concentration in normal rats but cannot induce
hypoglycaemia. This reveals an indication that the plant extract could be use in the treatment of
other metabolic disease without any side effect on the normal glucose metabolism. The
antihyperglycaemic effect of Bryophyllum pinnatum leaf extract on alloxan–induced diabetic rats
showed that the extract significantly (p< 0. 05) reduced the glucose level of the test rats in a
dose-dependent manner. It further revealed that 2.5 mg/kg b.w of glibenclamide (standard drug)
significantly (p< 0.05) reduced the blood glucose concentration compared with the blood
glucose level of group 4 and 5 rats treated with graded doses of the extract. Administration of
Bryophyllum pinnatum leaf extract led to significant reduction (p<0.05) in blood glucose level,
which is consistent with the report of (Latha and Pari, 2003) and Badole et al. (2006) which
showed that graded doses of the extract were responsible for lowering of the blood glucose level
in diabetic subjects.
Diabetic rats were observed to have significant increases in plasma lipid concentrations
which are responsible for several cardiovascular disorders (Alarcon- Aguilair et al., 2002). The
high lipid levels observed in diabetic rats might be due to the increased mobilization of free fatty
acids from peripheral deports and could also be attributed to lipolysis (Nikkhila and Kekki,
1973). The levels of serum lipids are usually elevated in diabetes thereby damaging the insulin-
secreting cells of the pancreas (Best and Tylor, 1989). Since the pancreas of the alloxan-induced
diabetic rat was partially destroyed, the possible mechanisms by which the blood glucose
concentrations of the groups treated by the extract might be reduced is through potentiation of
pancreatic secretion of insulin from the intact beta cells of the islets of langerhans (Suba et al.,
2004) coupled with extra pancreatic mechanisms like glycogenolysis and enhanced glycogenesis
by the liver and or enhanced transport of blood glucose to peripheral tissues. Bryophyllum
pinnatum leaf extract was investigated act to by stimulating the secretion of insulin from the beta
cells by a mechanism similar to that of oral hypoglycemic agents by depolarization of islets
membrane which consequently alters ion influx or affecting reports responsible for insulin
secretagogues. This was in consistent with the findings of Trivedi et al. (2004). The results were
72
comparable with that of glibenclamide, which acts by stimulation of insulin release (Hardy and
McNuthy, 1997) thus further confirming that the extract lowers the blood glucose level by
pancreatic regulation. The anti-diabetic effect of the extract can also be attributed to the presence
of flavonoids. It was reported that flavonoids constitute the active biological principles of most
medicinal plants with hypoglycamic and anti-diabetic activities. Flavonoids facilitate the
incorporation of fatty acids into triglycerides in the liver and adipose tissue (Best and Tylor,
1989). It is well known that LDL plays an important role in arteriosclerosis and Results show
that oral administration of ethanol extract of Bryophyllum pinnatum for 21 days significantly
(p<0.05) reduced LDL concentration and hyperglycaemia. Polonged diabetes mellitus is a risk
factor for coronary heart diseases. This abnormally high level of serum lipids is mainly due to
the uninhibited actions of lipoic enzymes on the fat depot mainly due to lack of insulin (Ei-soud
et al., 2007). Under normal condition insulin activates the enzyme lipoprotein lipase, which
hydrolyses triglycerides. However in diabetic state, lipoprotein lipase is not activated due to
insulin deficiency resulting in hypertriglyceridemia. Alteration of serum lipid profile is known to
occur in diabetes and this is likely to increase the risk of coronary heart diseases. A significant
reduction (p<0.05) in serum lipids particularly the LDL, and triacylglycerol achieved through the
administration of the extract was considered as being beneficial for the long term prognosis of
the disease (Chattopadhay and Bandyopadhay 2005). The ethanol extract of Bryophyllum
pinnatum leaves produced significant beneficial effects in the lipid profile in the treated diabetic
rats, significantly reducing (p<0.05) total cholesterol, low density lipoprotein and triacylglycerol
whereas high density lipoprotein was significantly increased (p<0.05) compared with untreated
diabetic rats.
The decrease in cholesterol and LDL levels achieved by the administration of
Bryophyllum pinnatum leaf extract indicates a possible protection against hypercholesterolemia
with its complications. Insulin deficiency may also be responsible for dyslipidaemia because
insulin has an inhibitory action on 3-hydroxy-3-methylglutaryl coenzyme A (HMG–COA)
reductase, a key rate limiting enzyme responsible for the metabolism of cholesterol rich LDL
particles.
Lipid peroxidation is one of the characteristic features of chronic diabetes (Satheesh and
Pari 2004). In this study, a significant increase (p<0.05) in the concentration of malondiadehyde
(MDA), the product of lipid peroxidation was observed in the diabetic rats but a significant
73
reduction (p<0.05) of MDA was observed in the diabetic rats treated with Bryophyllum pinnatum
ethanol leaf extract. The treatment of diabetic rats with Bryophyllum pinnatum extract could have
likely regenerated the β-cells of the pancreas and potentiation of insulin secretion from the
surviving β-cells. The increase in insulin secretion and the consequent decrease in blood glucose
level may lead to inhibition of lipid peroxidation and control lipolytic enzymes (Odetola et al.,
2006). The beta cells of the pancreas are susceptible to damage caused by oxygen free radicals
since the antioxidant defense system is weak under diabetic condition (Gorray et al., 1993).
Higher levels of lipid peroxides and lower level of catalase activities indicate oxidative
stress. The levels of antioxidant defense system are always diminishing in alloxan-induced
diabetic rats (Prince and Menon, 1998) which correlates with (Fig. 8) group 2 diabetic untreated
rats. Calatase is a haemoprotein which catalyses the reduction of hydrogen peroxides and
protects the tissues from damage from reactive hydroxyl radicals. A reduction in catalase activity
results in a number of superoxide anion radicals and hydrogen peroxides. It was observed that
the treatment of alloxan-induced diabetic rats with the extract of Bryophyllum pinnatum leaf
extract significantly increased (P< 0.05) the catalase activity of the treated rats when compared
with the untreated rats (Fig. 8).
The red blood cell count showed no significant increase (p > 0.05) in the level of red
blood cell of diabetic rats treated with graded doses of the extract compared with the group 2
diabetic untreated rats. This might suggest that the leaf of Bryophyllum pinnatum cannot be used
as a blood booster. However, there were significant increase (p<0.05) in the normal rats treated
with the extract when compared with untreated rats.
Packed cell volume (PCV) can be used as a screening tool for anaemia and can also
indicate the degree of fluid loss during dehydration. The treatment of alloxan-induced diabetic
rats with the leaf extract increased the PCV levels of the treated rats but the increase was non
significant (p> 0.05).
Haemoglobin is an oxygen carrying pigment in the red cells. Treatment of the diabetic
rats with graded doses of the extract significantly (p< 0.05) increased the haemoglobin
concentration of the diabetic rats when compared with the diabetic untreated rats. The reduction
in haemoglobin level of the diabetic but untreated rats might be due to glycosylation of the red
blood cells which prevent its frequent interaction with the haem components (Hanis et al., 1984).
74
The total white blood cell count determines the body’s ability to fight infections. The
treatment of alloxan-induced diabetic rats with the ethanol extract of Bryophyllum pinnatum
significantly reduced (P< 0.05) the total white cell count of treated rats as shown in figure 16
when compared with the diabetic untreated rats. The elevation of the total white blood cells in
the diabetic untreated rats is an indication of inflammation, acute infection or tissue damage.
4.2 Conclusion
The result of the present study has shown that the ethanol extract of Bryophyllum
pinnatum had hypoglycemic effect and the 200 and 400 mg/kg body weight of the extract
possessed efficacy that compared effectively with the reference drug (glibenclamide). The
extract equally had significant decrease (p<0.05) on lipid profile such as low density lipoprotein,
triacylglycerol and total cholesterol and significant increase (p<0.05) in high density lipoprotein
cholesterol implying that the extract could be utilized in management of heart-related diseases.
Catalase activity also increased significantly (p<0.05) while malondialdehyde concentration
reduced significantly (p<0.05) in the test groups treated with graded doses of the extract thus
justifying its use in the treatment and management of diabetes mellitus and its related
complications at the traditional level among the people of the south Western and south Eastern
Nigeria and many other countries of the world.
4.3 Suggestions for Further Studies
These are based on my findings from the literature and not a follow up from my work.
(a) Neuropharmacological effects of aqueous leaf extract of Bryophyllum pinnatum in
experimental animals.
(b) Antiulcer activity of methanol extract of Bryophyllum pinnatum in rats.
(c) Effect of Bryophyllum pinnatum versus fenoterol on uterine contractility.
(d) Analgesic effects of aqueous extract of Bryophyllum pinnatum in experimental animals.
(e) Neurosedative and muscle relactant activities of aqueous extract of Bryophyllum pinnatum in
experimental animals.
75
REFERENCES
Abei, H.E. (1983). Catalase. In: Methods of Enzymatic Analysis. 3rd edn. pp 273-285.
Alarcon-Aguilair, F.J., Campos-Sepulveda, A.E., Xolalopa-Molina, S., Hernadez-Galicia, E. and Roman-Ramos, R. (2002). Hypoglycaemic activity of Ibervillea sonorare root in healthy and diabetic rats. Pharmacological Biology, 40:570-575.
Albers, J.J., Warnick, G.R., and Cheung, M.C. (1978). Dertermination of High Density Lipoprptein. Lipids., 13:926-932.
Allain, C.C., Poon, L.S., Chan, C.S.G., Richmond,W. and Fu, P.C. (1974). Enzymatic determination of serum cholesterol. Clinical chemistry, 20: 470-475.
Amer, J., Ghoti, H., Rachmilewitz, E., Koren, A., Levin, C. and Fibach, E. (2006). "Red blood cells, platelets and polymorphonuclear neutrophils of patients with sickle cell disease exhibit oxidative stress that can be ameliorated by antioxidants". British Journal of
Haematology, 132 (1): 108–113.
Aragno, M., Tamagn, E., Gato, V., Parola, S.Danni, O. and Boccuzzi, G (1999). Dehydroepiandrosterone protects tissues of streptozotocin-treated rats against oxidative stress. Free Radical Biology Medicine, 26 (11/12): 1467-147 4 Assman, G., Jab, H.U., and Hormert, U. (1984). LDL- Cholesterol determination in blood following precipitation of LDL with polyvinyl sulphate. Clinical Chemistry Acta., 140:77-84 Badole, S., Patel, N., Bodhankar, S., Jain, B. and Bhardwaj, S. (2006). Antihyperglycaemic activity of aqueous leaf extract of Cocculus hirsutus in alloxan induced diabetic mice. Indian Journal of Pharmacology, 38: 49-53.
Banerji, M. A., Chaiken, R. I., Huey, H., Tuomi, T., Norin, A. J. and MacKay, I. R. (1994).GAD antibody negative NIDDM in adult black subjects with diabetic ketoacidosis andincreased frequency of human leukocyte antigen DR3 and DR4: flatbush diabetes. Diabetes, 43: 741-45.
Berges, R.R., Windeler, J., Trampisch, H.J. and Senge, T.H. (1995). Randomized, placebo- controlled, double-blind clinical trial of beta-sitosterol in patients with benign prostatic hyperplacia. Lancet, 345: 1529-1532.
76
Best, C.H and Tylor, N.B. (1989). Biological Effect of Insulin. In: Williams, W. (Editors): Physiological Basis of Medical Practice. Cambridge University Press, London pp 878- 890. Betterle, C., Zanette, F., Pedini, B., Presotto, F., Rapp, L.B and Monsciotti, C.M. (1983). Clinical and subclinical organ-specific autoimmune manifestations in type 1 (insulin- dependent) diabetic patients and their first-degree relatives. Diabetologia, 26: 431-36. Bjelakovic, G., Nikolova, D., Gluud, L.L., Simonetti, R.G and Glud, C. (2007). "Mortality in randomized trials of antioxidant supplements for primary and secondary prevention: systematic review and meta-analysis". Journal of American Medical Association, 297 (8): 842–857. Bogardus, C., Lillioja S., Mott, D. M., Hollenbeck, C. and Reaven, G. (1985). Relationship between degree of obesity and in vivo insulin action in man. American Journal of
Physiology, 248: 286- 291. Bonnefont, R.D., Jaudon, M.C., Bastard, J.P. and Delattre, J. (2000). Consequences of the diabetic status on the oxidant/antioxidant balance. Diabetes Metabolism, 26: 163-176. Boskovic, M., Vovk, T., Kores Plesnicar, B. and Grabnar, I. (2011). "Oxidative stress in Schizophrenia". Current Neuropharmacology, 9 (2): 301–312. Bucalo, G., and David, H. (1973). Quantitative determination of serum triacylglycerol by use of enzymes. Clinical chemistry, 19: 476-482. Byrne, M.M, Sturis, J., Menzel, S., Yamagata, K., Fajans, S.S. and Dronsfield, M.J. (1996). Altered insulin secretory response to glucose in diabetic and nondiabetic subjects with mutation in the diabetes susceptibility gene MODY 3 on chromosome 20. Diabetes, 45: 1503-1510. Campbell, P.J. and Carlson, M.G. (1993). Impact of obesity on insulin action in NIDDM. Diabetes. 42: 405-410.
Carr, A. and Frei, B. (1999). "Does vitamin C act as a pro-oxidant under physiological conditions?". Journal of the Federation of American Society for Experimental Biology13 (9): 1007–1024. Chan, T.Y.K. (2009). Potential risks associated with the use of herbal anti-obesity products .Drug Safe, 32: 453-456. Chattopadhay, R.F. and Bandyopadhay, M. (2005). Effect of Azadirachta indica leaf extract on serum lipid profile changes in normal and streptozotocin induced diabetic rats. African
Journal of Biomadical Research, 8: 101-104.
77
Chaudiere, J. and Ferrari-Iliou, R. (1999). "Intracellular Antioxidants: From chemical to biochemical mechanisms". Food and Chemical Toxicology, 37 (9–10): 949–962. Clement, K., Pueyo, M.E., Vaxillaire, M., Rakotoambinina, B., Thuillier, F. and Passa, P. (1996). Assessment of insulin sensitivity in glucokinase-deficient subjects. Diabetologia, 39: 82- 90. Cohen-Kohler, J.C. (2007). The morally uncomfortableglobal drug gap. Clinical Pharmacology and Therapeutics.,84:610-614. Dahl, L.K. (1972). Salt and Hypertension. American Journal of Clinical Nutrition, 25: 231-238.
Dalziel, J.M. (1937). The Useful Plants of West Tropical Africa. London. Crown Agents for the Colonies. 28-29. Demmig-Adams and Adams, W. (2002). Antioxidants in photosynthesis and human nutrition. Science., 298 (5601): 2149-2153. Da-Silva, S.A., Costa, S.S., Mendonca. S.C., Silva, E.M., Moraes, V.L. and Rossi Bergmann, B. (1995). Therapeutic effect of oral Kalanchoe pinnata leaf extract in murine leishmaniasis. Acta Tropica, 60 (3): 201-210. Davies, K.J. (1995). "Oxidative stress: The paradox of aerobic life". Biochemical Society
Symposia, 61: 1–31. De-Fronzo, R.A., Bonadonna, R.C. and Ferrannini, E.(1997). Pathogenesis of NIDDM. In: Alberti K.G.M.M, Zimmet P, DeFronzo R.A, Eds. International Textbook of Diabetes
Mellitus, 2nd Edn.: John Wiley, 1997, Chichester. pp 635-712. Duarte, T.L and Lunec, J. (2005). "Review: When is an antioxidant not an antioxidant? A review of novel actions and reactions of vitamin C". Free Radical Research, 39 (7): 671–86. Ei-soud, N.H., Khalil, M.Y., Oraby, F.S. and Farrag, A.R. (2007). Antidiabetic effects of fenugreek alkaloid extract in streptozotocin induced hypoglycaemic rats. Journal of
Applied Sciences., 3:1073-1083.
Ernst, E. (2005). The efficacy of herbal medicine-anoverview. Fundamental Clinical Pharmacology, 19: 405-409. Evans, M.D and Cooke, M.S (2004). "Factors contributing to the outcome of oxidative damage to nucleic acids". Bioessays, 26 (5): 533–542.
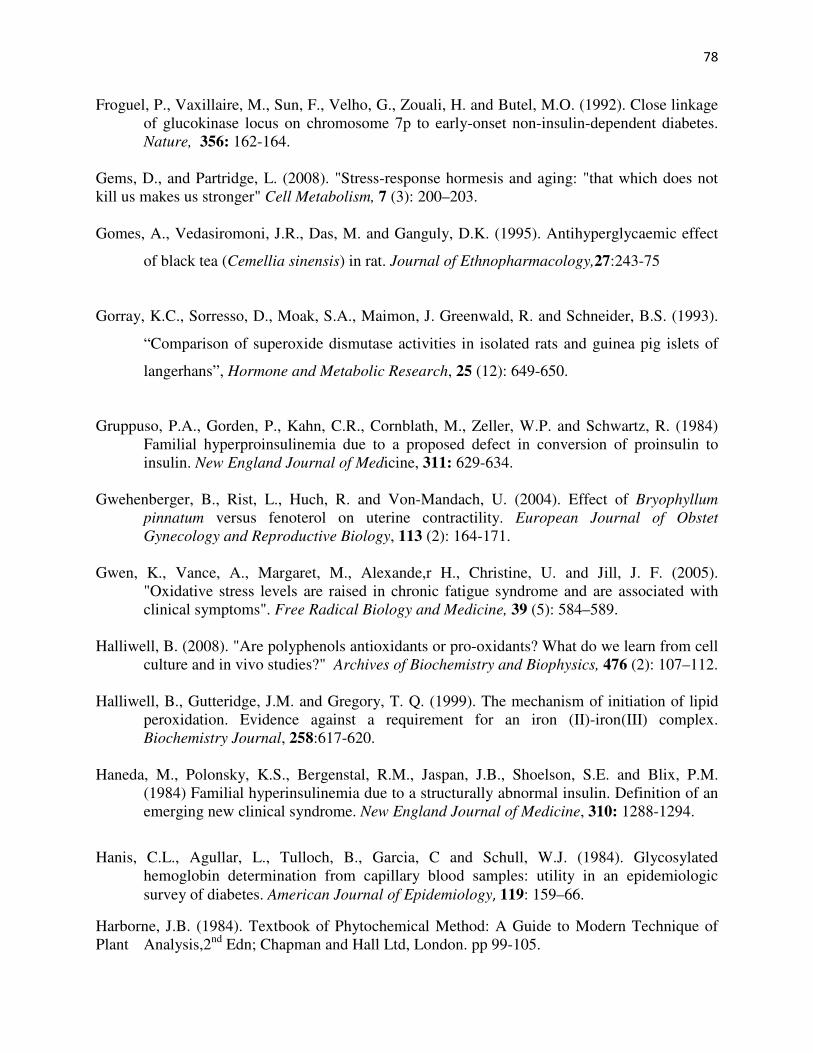
78
Froguel, P., Vaxillaire, M., Sun, F., Velho, G., Zouali, H. and Butel, M.O. (1992). Close linkage of glucokinase locus on chromosome 7p to early-onset non-insulin-dependent diabetes. Nature, 356: 162-164.
Gems, D., and Partridge, L. (2008). "Stress-response hormesis and aging: "that which does not kill us makes us stronger" Cell Metabolism, 7 (3): 200–203. Gomes, A., Vedasiromoni, J.R., Das, M. and Ganguly, D.K. (1995). Antihyperglycaemic effect
of black tea (Cemellia sinensis) in rat. Journal of Ethnopharmacology,27:243-75
Gorray, K.C., Sorresso, D., Moak, S.A., Maimon, J. Greenwald, R. and Schneider, B.S. (1993).
“Comparison of superoxide dismutase activities in isolated rats and guinea pig islets of
langerhans”, Hormone and Metabolic Research, 25 (12): 649-650.
Gruppuso, P.A., Gorden, P., Kahn, C.R., Cornblath, M., Zeller, W.P. and Schwartz, R. (1984) Familial hyperproinsulinemia due to a proposed defect in conversion of proinsulin to insulin. New England Journal of Medicine, 311: 629-634. Gwehenberger, B., Rist, L., Huch, R. and Von-Mandach, U. (2004). Effect of Bryophyllum
pinnatum versus fenoterol on uterine contractility. European Journal of Obstet
Gynecology and Reproductive Biology, 113 (2): 164-171. Gwen, K., Vance, A., Margaret, M., Alexande,r H., Christine, U. and Jill, J. F. (2005). "Oxidative stress levels are raised in chronic fatigue syndrome and are associated with clinical symptoms". Free Radical Biology and Medicine, 39 (5): 584–589. Halliwell, B. (2008). "Are polyphenols antioxidants or pro-oxidants? What do we learn from cell culture and in vivo studies?" Archives of Biochemistry and Biophysics, 476 (2): 107–112. Halliwell, B., Gutteridge, J.M. and Gregory, T. Q. (1999). The mechanism of initiation of lipid peroxidation. Evidence against a requirement for an iron (II)-iron(III) complex. Biochemistry Journal, 258:617-620. Haneda, M., Polonsky, K.S., Bergenstal, R.M., Jaspan, J.B., Shoelson, S.E. and Blix, P.M. (1984) Familial hyperinsulinemia due to a structurally abnormal insulin. Definition of an emerging new clinical syndrome. New England Journal of Medicine, 310: 1288-1294.
Hanis, C.L., Agullar, L., Tulloch, B., Garcia, C and Schull, W.J. (1984). Glycosylated hemoglobin determination from capillary blood samples: utility in an epidemiologic
survey of diabetes. American Journal of Epidemiology, 119: 159–66.
Harborne, J.B. (1984). Textbook of Phytochemical Method: A Guide to Modern Technique of Plant Analysis,2nd Edn; Chapman and Hall Ltd, London. pp 99-105.
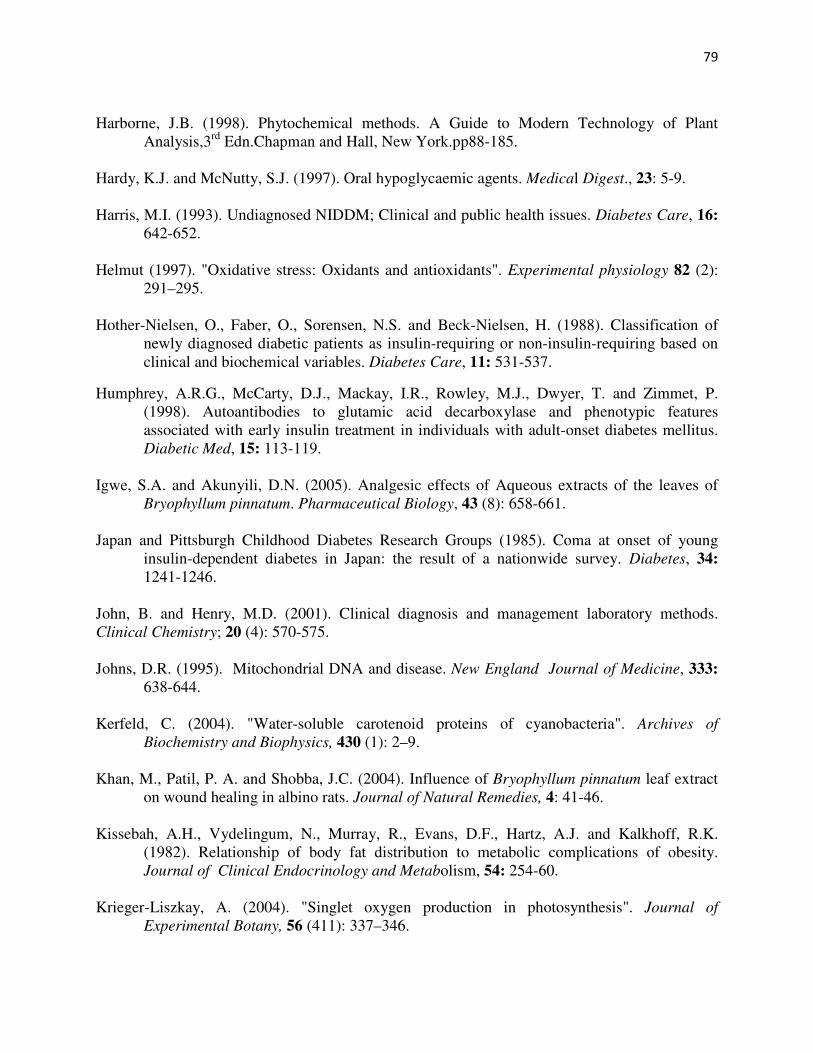
79
Harborne, J.B. (1998). Phytochemical methods. A Guide to Modern Technology of Plant Analysis,3rd Edn.Chapman and Hall, New York.pp88-185. Hardy, K.J. and McNutty, S.J. (1997). Oral hypoglycaemic agents. Medical Digest., 23: 5-9. Harris, M.I. (1993). Undiagnosed NIDDM; Clinical and public health issues. Diabetes Care, 16: 642-652. Helmut (1997). "Oxidative stress: Oxidants and antioxidants". Experimental physiology 82 (2): 291–295. Hother-Nielsen, O., Faber, O., Sorensen, N.S. and Beck-Nielsen, H. (1988). Classification of newly diagnosed diabetic patients as insulin-requiring or non-insulin-requiring based on clinical and biochemical variables. Diabetes Care, 11: 531-537.
Humphrey, A.R.G., McCarty, D.J., Mackay, I.R., Rowley, M.J., Dwyer, T. and Zimmet, P. (1998). Autoantibodies to glutamic acid decarboxylase and phenotypic features associated with early insulin treatment in individuals with adult-onset diabetes mellitus. Diabetic Med, 15: 113-119. Igwe, S.A. and Akunyili, D.N. (2005). Analgesic effects of Aqueous extracts of the leaves of Bryophyllum pinnatum. Pharmaceutical Biology, 43 (8): 658-661. Japan and Pittsburgh Childhood Diabetes Research Groups (1985). Coma at onset of young insulin-dependent diabetes in Japan: the result of a nationwide survey. Diabetes, 34: 1241-1246. John, B. and Henry, M.D. (2001). Clinical diagnosis and management laboratory methods. Clinical Chemistry; 20 (4): 570-575. Johns, D.R. (1995). Mitochondrial DNA and disease. New England Journal of Medicine, 333: 638-644. Kerfeld, C. (2004). "Water-soluble carotenoid proteins of cyanobacteria". Archives of
Biochemistry and Biophysics, 430 (1): 2–9. Khan, M., Patil, P. A. and Shobba, J.C. (2004). Influence of Bryophyllum pinnatum leaf extract on wound healing in albino rats. Journal of Natural Remedies, 4: 41-46. Kissebah, A.H., Vydelingum, N., Murray, R., Evans, D.F., Hartz, A.J. and Kalkhoff, R.K. (1982). Relationship of body fat distribution to metabolic complications of obesity. Journal of Clinical Endocrinology and Metabolism, 54: 254-60. Krieger-Liszkay, A. (2004). "Singlet oxygen production in photosynthesis". Journal of
Experimental Botany, 56 (411): 337–346.
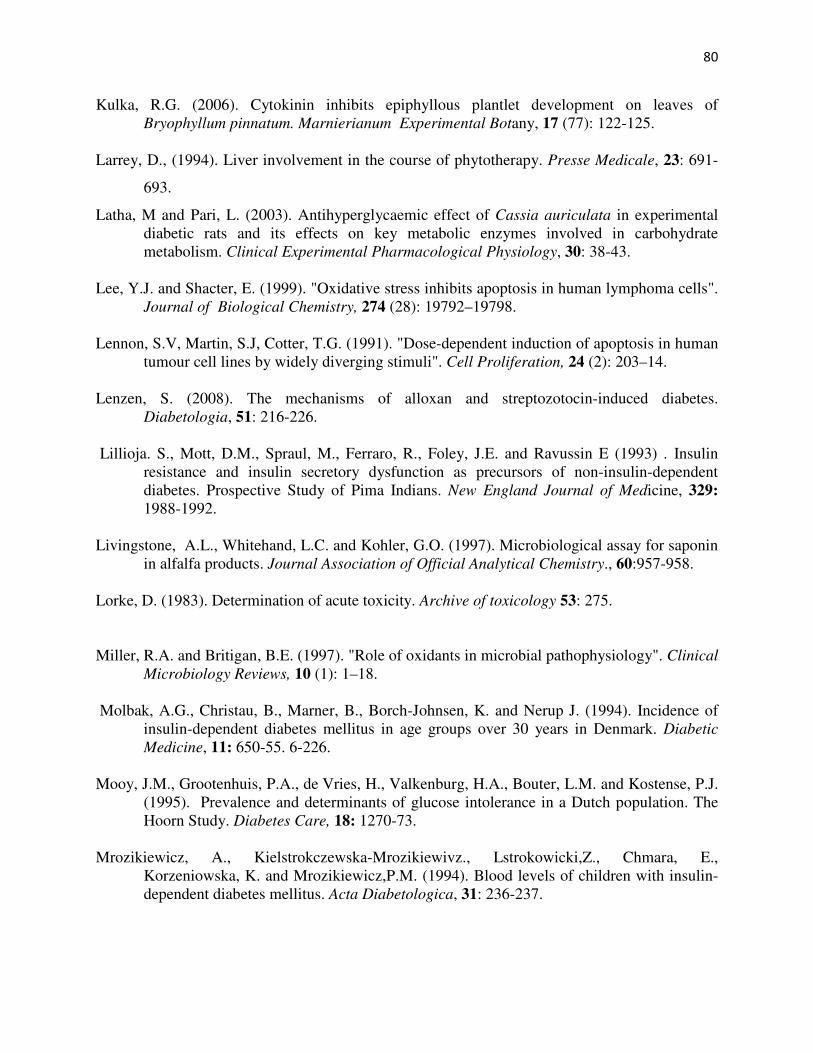
80
Kulka, R.G. (2006). Cytokinin inhibits epiphyllous plantlet development on leaves of Bryophyllum pinnatum. Marnierianum Experimental Botany, 17 (77): 122-125. Larrey, D., (1994). Liver involvement in the course of phytotherapy. Presse Medicale, 23: 691-
693.
Latha, M and Pari, L. (2003). Antihyperglycaemic effect of Cassia auriculata in experimental diabetic rats and its effects on key metabolic enzymes involved in carbohydrate metabolism. Clinical Experimental Pharmacological Physiology, 30: 38-43. Lee, Y.J. and Shacter, E. (1999). "Oxidative stress inhibits apoptosis in human lymphoma cells". Journal of Biological Chemistry, 274 (28): 19792–19798. Lennon, S.V, Martin, S.J, Cotter, T.G. (1991). "Dose-dependent induction of apoptosis in human tumour cell lines by widely diverging stimuli". Cell Proliferation, 24 (2): 203–14. Lenzen, S. (2008). The mechanisms of alloxan and streptozotocin-induced diabetes. Diabetologia, 51: 216-226. Lillioja. S., Mott, D.M., Spraul, M., Ferraro, R., Foley, J.E. and Ravussin E (1993) . Insulin resistance and insulin secretory dysfunction as precursors of non-insulin-dependent diabetes. Prospective Study of Pima Indians. New England Journal of Medicine, 329: 1988-1992. Livingstone, A.L., Whitehand, L.C. and Kohler, G.O. (1997). Microbiological assay for saponin in alfalfa products. Journal Association of Official Analytical Chemistry., 60:957-958. Lorke, D. (1983). Determination of acute toxicity. Archive of toxicology 53: 275.
Miller, R.A. and Britigan, B.E. (1997). "Role of oxidants in microbial pathophysiology". Clinical
Microbiology Reviews, 10 (1): 1–18. Molbak, A.G., Christau, B., Marner, B., Borch-Johnsen, K. and Nerup J. (1994). Incidence of insulin-dependent diabetes mellitus in age groups over 30 years in Denmark. Diabetic
Medicine, 11: 650-55. 6-226. Mooy, J.M., Grootenhuis, P.A., de Vries, H., Valkenburg, H.A., Bouter, L.M. and Kostense, P.J. (1995). Prevalence and determinants of glucose intolerance in a Dutch population. The Hoorn Study. Diabetes Care, 18: 1270-73. Mrozikiewicz, A., Kielstrokczewska-Mrozikiewivz., Lstrokowicki,Z., Chmara, E., Korzeniowska, K. and Mrozikiewicz,P.M. (1994). Blood levels of children with insulin- dependent diabetes mellitus. Acta Diabetologica, 31: 236-237.
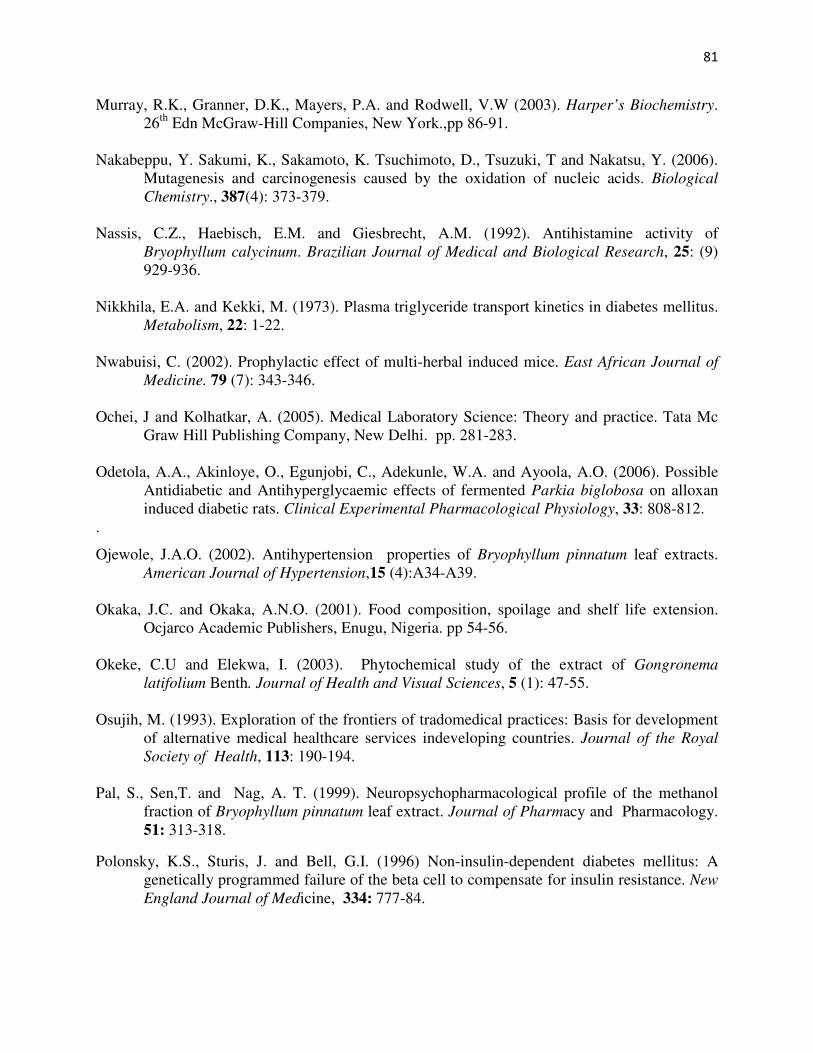
81
Murray, R.K., Granner, D.K., Mayers, P.A. and Rodwell, V.W (2003). Harper’s Biochemistry. 26th Edn McGraw-Hill Companies, New York.,pp 86-91. Nakabeppu, Y. Sakumi, K., Sakamoto, K. Tsuchimoto, D., Tsuzuki, T and Nakatsu, Y. (2006). Mutagenesis and carcinogenesis caused by the oxidation of nucleic acids. Biological
Chemistry., 387(4): 373-379. Nassis, C.Z., Haebisch, E.M. and Giesbrecht, A.M. (1992). Antihistamine activity of Bryophyllum calycinum. Brazilian Journal of Medical and Biological Research, 25: (9) 929-936. Nikkhila, E.A. and Kekki, M. (1973). Plasma triglyceride transport kinetics in diabetes mellitus. Metabolism, 22: 1-22. Nwabuisi, C. (2002). Prophylactic effect of multi-herbal induced mice. East African Journal of
Medicine. 79 (7): 343-346. Ochei, J and Kolhatkar, A. (2005). Medical Laboratory Science: Theory and practice. Tata Mc Graw Hill Publishing Company, New Delhi. pp. 281-283. Odetola, A.A., Akinloye, O., Egunjobi, C., Adekunle, W.A. and Ayoola, A.O. (2006). Possible Antidiabetic and Antihyperglycaemic effects of fermented Parkia biglobosa on alloxan induced diabetic rats. Clinical Experimental Pharmacological Physiology, 33: 808-812. .
Ojewole, J.A.O. (2002). Antihypertension properties of Bryophyllum pinnatum leaf extracts. American Journal of Hypertension,15 (4):A34-A39. Okaka, J.C. and Okaka, A.N.O. (2001). Food composition, spoilage and shelf life extension. Ocjarco Academic Publishers, Enugu, Nigeria. pp 54-56. Okeke, C.U and Elekwa, I. (2003). Phytochemical study of the extract of Gongronema
latifolium Benth. Journal of Health and Visual Sciences, 5 (1): 47-55. Osujih, M. (1993). Exploration of the frontiers of tradomedical practices: Basis for development of alternative medical healthcare services indeveloping countries. Journal of the Royal
Society of Health, 113: 190-194. Pal, S., Sen,T. and Nag, A. T. (1999). Neuropsychopharmacological profile of the methanol fraction of Bryophyllum pinnatum leaf extract. Journal of Pharmacy and Pharmacology. 51: 313-318.
Polonsky, K.S., Sturis, J. and Bell, G.I. (1996) Non-insulin-dependent diabetes mellitus: A genetically programmed failure of the beta cell to compensate for insulin resistance. New
England Journal of Medicine, 334: 777-84.
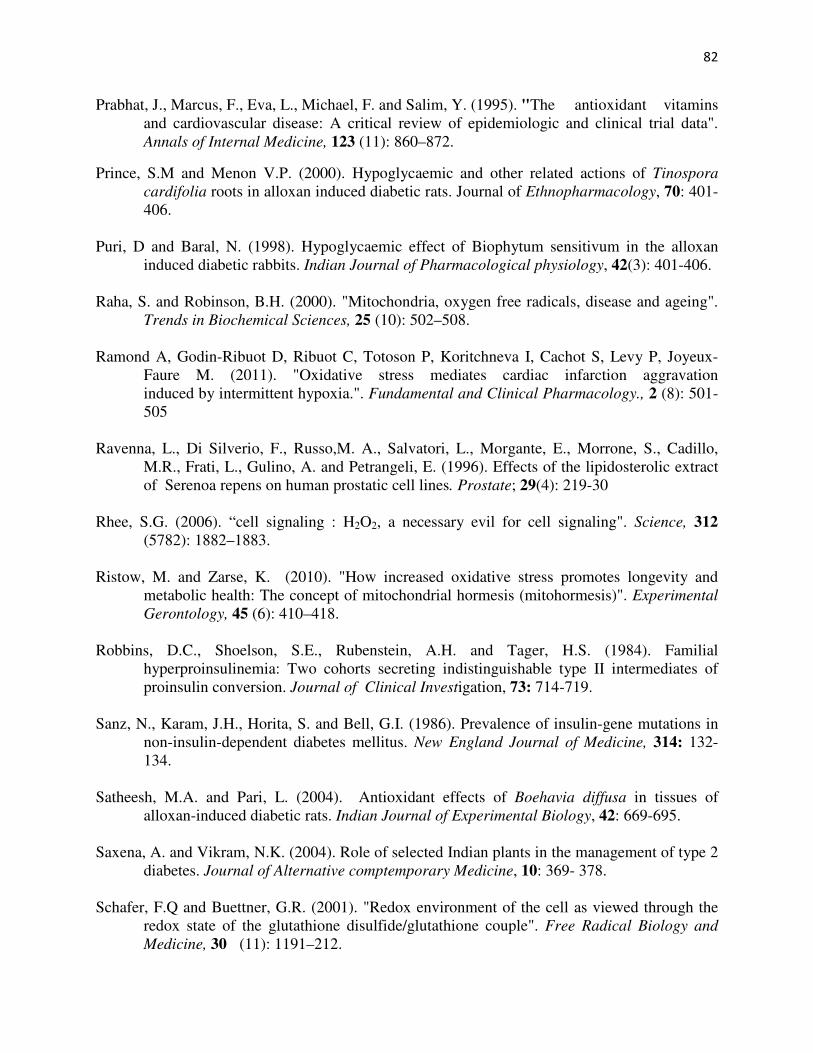
82
Prabhat, J., Marcus, F., Eva, L., Michael, F. and Salim, Y. (1995). "The antioxidant vitamins and cardiovascular disease: A critical review of epidemiologic and clinical trial data". Annals of Internal Medicine, 123 (11): 860–872.
Prince, S.M and Menon V.P. (2000). Hypoglycaemic and other related actions of Tinospora
cardifolia roots in alloxan induced diabetic rats. Journal of Ethnopharmacology, 70: 401- 406. Puri, D and Baral, N. (1998). Hypoglycaemic effect of Biophytum sensitivum in the alloxan induced diabetic rabbits. Indian Journal of Pharmacological physiology, 42(3): 401-406. Raha, S. and Robinson, B.H. (2000). "Mitochondria, oxygen free radicals, disease and ageing". Trends in Biochemical Sciences, 25 (10): 502–508. Ramond A, Godin-Ribuot D, Ribuot C, Totoson P, Koritchneva I, Cachot S, Levy P, Joyeux- Faure M. (2011). "Oxidative stress mediates cardiac infarction aggravation induced by intermittent hypoxia.". Fundamental and Clinical Pharmacology., 2 (8): 501- 505 Ravenna, L., Di Silverio, F., Russo,M. A., Salvatori, L., Morgante, E., Morrone, S., Cadillo, M.R., Frati, L., Gulino, A. and Petrangeli, E. (1996). Effects of the lipidosterolic extract of Serenoa repens on human prostatic cell lines. Prostate; 29(4): 219-30 Rhee, S.G. (2006). “cell signaling : H2O2, a necessary evil for cell signaling". Science, 312 (5782): 1882–1883. Ristow, M. and Zarse, K. (2010). "How increased oxidative stress promotes longevity and metabolic health: The concept of mitochondrial hormesis (mitohormesis)". Experimental
Gerontology, 45 (6): 410–418. Robbins, D.C., Shoelson, S.E., Rubenstein, A.H. and Tager, H.S. (1984). Familial hyperproinsulinemia: Two cohorts secreting indistinguishable type II intermediates of proinsulin conversion. Journal of Clinical Investigation, 73: 714-719. Sanz, N., Karam, J.H., Horita, S. and Bell, G.I. (1986). Prevalence of insulin-gene mutations in non-insulin-dependent diabetes mellitus. New England Journal of Medicine, 314: 132- 134. Satheesh, M.A. and Pari, L. (2004). Antioxidant effects of Boehavia diffusa in tissues of
alloxan-induced diabetic rats. Indian Journal of Experimental Biology, 42: 669-695. Saxena, A. and Vikram, N.K. (2004). Role of selected Indian plants in the management of type 2 diabetes. Journal of Alternative comptemporary Medicine, 10: 369- 378. Schafer, F.Q and Buettner, G.R. (2001). "Redox environment of the cell as viewed through the redox state of the glutathione disulfide/glutathione couple". Free Radical Biology and
Medicine, 30 (11): 1191–212.
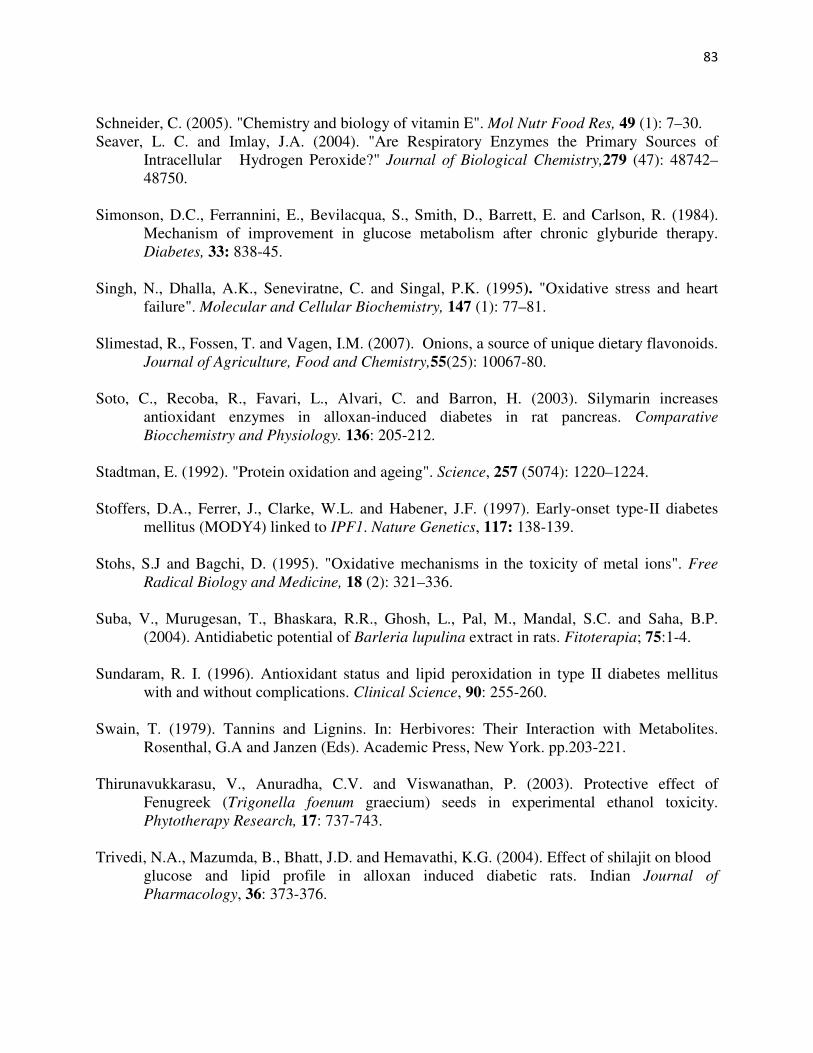
83
Schneider, C. (2005). "Chemistry and biology of vitamin E". Mol Nutr Food Res, 49 (1): 7–30. Seaver, L. C. and Imlay, J.A. (2004). "Are Respiratory Enzymes the Primary Sources of Intracellular Hydrogen Peroxide?" Journal of Biological Chemistry,279 (47): 48742– 48750. Simonson, D.C., Ferrannini, E., Bevilacqua, S., Smith, D., Barrett, E. and Carlson, R. (1984). Mechanism of improvement in glucose metabolism after chronic glyburide therapy. Diabetes, 33: 838-45. Singh, N., Dhalla, A.K., Seneviratne, C. and Singal, P.K. (1995). "Oxidative stress and heart failure". Molecular and Cellular Biochemistry, 147 (1): 77–81. Slimestad, R., Fossen, T. and Vagen, I.M. (2007). Onions, a source of unique dietary flavonoids. Journal of Agriculture, Food and Chemistry,55(25): 10067-80. Soto, C., Recoba, R., Favari, L., Alvari, C. and Barron, H. (2003). Silymarin increases antioxidant enzymes in alloxan-induced diabetes in rat pancreas. Comparative Biocchemistry and Physiology. 136: 205-212. Stadtman, E. (1992). "Protein oxidation and ageing". Science, 257 (5074): 1220–1224. Stoffers, D.A., Ferrer, J., Clarke, W.L. and Habener, J.F. (1997). Early-onset type-II diabetes mellitus (MODY4) linked to IPF1. Nature Genetics, 117: 138-139. Stohs, S.J and Bagchi, D. (1995). "Oxidative mechanisms in the toxicity of metal ions". Free
Radical Biology and Medicine, 18 (2): 321–336. Suba, V., Murugesan, T., Bhaskara, R.R., Ghosh, L., Pal, M., Mandal, S.C. and Saha, B.P. (2004). Antidiabetic potential of Barleria lupulina extract in rats. Fitoterapia; 75:1-4. Sundaram, R. I. (1996). Antioxidant status and lipid peroxidation in type II diabetes mellitus with and without complications. Clinical Science, 90: 255-260. Swain, T. (1979). Tannins and Lignins. In: Herbivores: Their Interaction with Metabolites. Rosenthal, G.A and Janzen (Eds). Academic Press, New York. pp.203-221. Thirunavukkarasu, V., Anuradha, C.V. and Viswanathan, P. (2003). Protective effect of Fenugreek (Trigonella foenum graecium) seeds in experimental ethanol toxicity. Phytotherapy Research, 17: 737-743. Trivedi, N.A., Mazumda, B., Bhatt, J.D. and Hemavathi, K.G. (2004). Effect of shilajit on blood glucose and lipid profile in alloxan induced diabetic rats. Indian Journal of
Pharmacology, 36: 373-376.
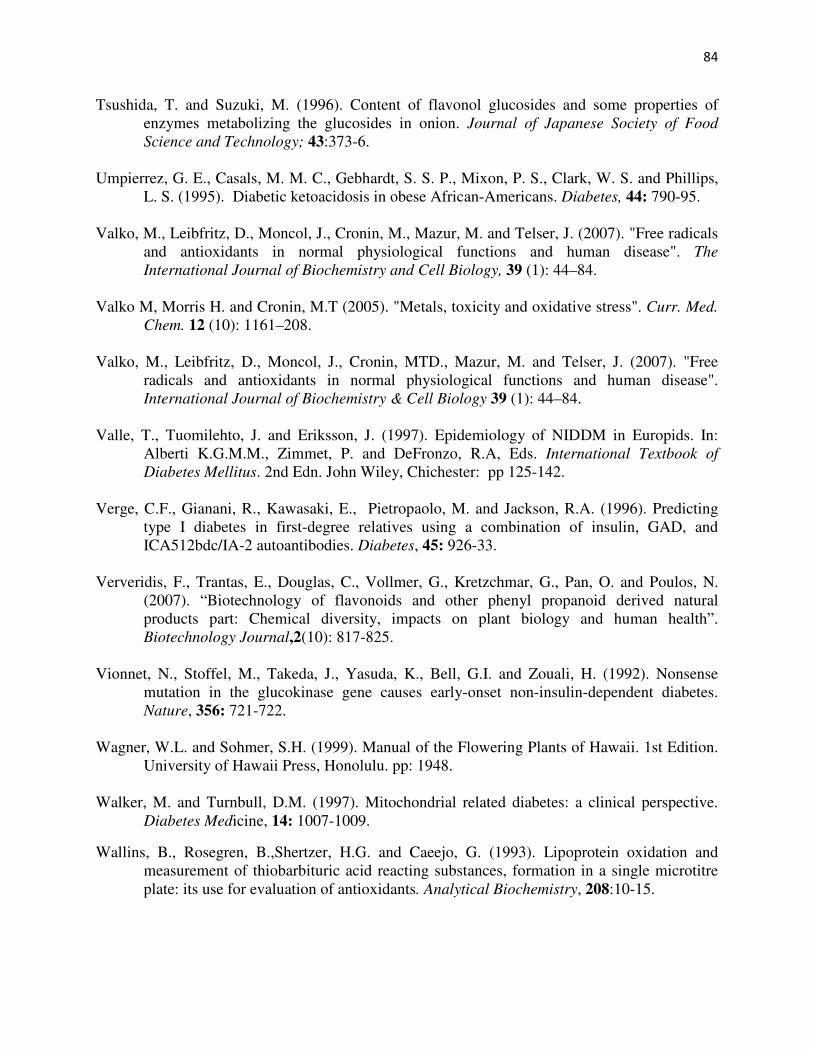
84
Tsushida, T. and Suzuki, M. (1996). Content of flavonol glucosides and some properties of enzymes metabolizing the glucosides in onion. Journal of Japanese Society of Food
Science and Technology; 43:373-6. Umpierrez, G. E., Casals, M. M. C., Gebhardt, S. S. P., Mixon, P. S., Clark, W. S. and Phillips, L. S. (1995). Diabetic ketoacidosis in obese African-Americans. Diabetes, 44: 790-95. Valko, M., Leibfritz, D., Moncol, J., Cronin, M., Mazur, M. and Telser, J. (2007). "Free radicals
and antioxidants in normal physiological functions and human disease". The
International Journal of Biochemistry and Cell Biology, 39 (1): 44–84. Valko M, Morris H. and Cronin, M.T (2005). "Metals, toxicity and oxidative stress". Curr. Med.
Chem. 12 (10): 1161–208. Valko, M., Leibfritz, D., Moncol, J., Cronin, MTD., Mazur, M. and Telser, J. (2007). "Free radicals and antioxidants in normal physiological functions and human disease". International Journal of Biochemistry & Cell Biology 39 (1): 44–84. Valle, T., Tuomilehto, J. and Eriksson, J. (1997). Epidemiology of NIDDM in Europids. In: Alberti K.G.M.M., Zimmet, P. and DeFronzo, R.A, Eds. International Textbook of
Diabetes Mellitus. 2nd Edn. John Wiley, Chichester: pp 125-142. Verge, C.F., Gianani, R., Kawasaki, E., Pietropaolo, M. and Jackson, R.A. (1996). Predicting type I diabetes in first-degree relatives using a combination of insulin, GAD, and ICA512bdc/IA-2 autoantibodies. Diabetes, 45: 926-33. Ververidis, F., Trantas, E., Douglas, C., Vollmer, G., Kretzchmar, G., Pan, O. and Poulos, N. (2007). “Biotechnology of flavonoids and other phenyl propanoid derived natural products part: Chemical diversity, impacts on plant biology and human health”. Biotechnology Journal,2(10): 817-825. Vionnet, N., Stoffel, M., Takeda, J., Yasuda, K., Bell, G.I. and Zouali, H. (1992). Nonsense mutation in the glucokinase gene causes early-onset non-insulin-dependent diabetes. Nature, 356: 721-722. Wagner, W.L. and Sohmer, S.H. (1999). Manual of the Flowering Plants of Hawaii. 1st Edition. University of Hawaii Press, Honolulu. pp: 1948. Walker, M. and Turnbull, D.M. (1997). Mitochondrial related diabetes: a clinical perspective. Diabetes Medicine, 14: 1007-1009.
Wallins, B., Rosegren, B.,Shertzer, H.G. and Caeejo, G. (1993). Lipoprotein oxidation and measurement of thiobarbituric acid reacting substances, formation in a single microtitre plate: its use for evaluation of antioxidants. Analytical Biochemistry, 208:10-15.
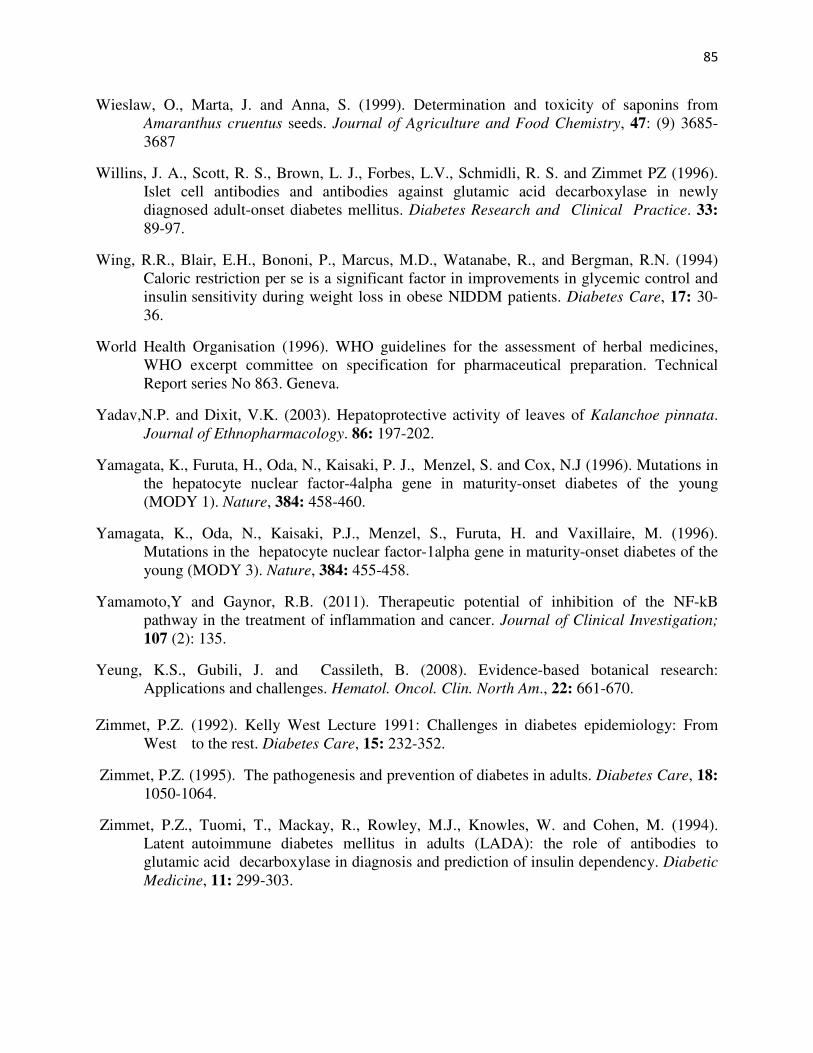
85
Wieslaw, O., Marta, J. and Anna, S. (1999). Determination and toxicity of saponins from Amaranthus cruentus seeds. Journal of Agriculture and Food Chemistry, 47: (9) 3685- 3687
Willins, J. A., Scott, R. S., Brown, L. J., Forbes, L.V., Schmidli, R. S. and Zimmet PZ (1996). Islet cell antibodies and antibodies against glutamic acid decarboxylase in newly diagnosed adult-onset diabetes mellitus. Diabetes Research and Clinical Practice. 33: 89-97.
Wing, R.R., Blair, E.H., Bononi, P., Marcus, M.D., Watanabe, R., and Bergman, R.N. (1994) Caloric restriction per se is a significant factor in improvements in glycemic control and insulin sensitivity during weight loss in obese NIDDM patients. Diabetes Care, 17: 30- 36.
World Health Organisation (1996). WHO guidelines for the assessment of herbal medicines, WHO excerpt committee on specification for pharmaceutical preparation. Technical Report series No 863. Geneva.
Yadav,N.P. and Dixit, V.K. (2003). Hepatoprotective activity of leaves of Kalanchoe pinnata. Journal of Ethnopharmacology. 86: 197-202.
Yamagata, K., Furuta, H., Oda, N., Kaisaki, P. J., Menzel, S. and Cox, N.J (1996). Mutations in the hepatocyte nuclear factor-4alpha gene in maturity-onset diabetes of the young (MODY 1). Nature, 384: 458-460.
Yamagata, K., Oda, N., Kaisaki, P.J., Menzel, S., Furuta, H. and Vaxillaire, M. (1996). Mutations in the hepatocyte nuclear factor-1alpha gene in maturity-onset diabetes of the young (MODY 3). Nature, 384: 455-458.
Yamamoto,Y and Gaynor, R.B. (2011). Therapeutic potential of inhibition of the NF-kB pathway in the treatment of inflammation and cancer. Journal of Clinical Investigation; 107 (2): 135.
Yeung, K.S., Gubili, J. and Cassileth, B. (2008). Evidence-based botanical research: Applications and challenges. Hematol. Oncol. Clin. North Am., 22: 661-670. Zimmet, P.Z. (1992). Kelly West Lecture 1991: Challenges in diabetes epidemiology: From West to the rest. Diabetes Care, 15: 232-352.
Zimmet, P.Z. (1995). The pathogenesis and prevention of diabetes in adults. Diabetes Care, 18: 1050-1064.
Zimmet, P.Z., Tuomi, T., Mackay, R., Rowley, M.J., Knowles, W. and Cohen, M. (1994). Latent autoimmune diabetes mellitus in adults (LADA): the role of antibodies to glutamic acid decarboxylase in diagnosis and prediction of insulin dependency. Diabetic
Medicine, 11: 299-303.