Embed Size (px)
Citation preview

SIRG Grant Project:Enabling Continental Scale Water Resources Management: Adding Value to State and Federal Agency Large Heterogeneous Data Sets
Faculty Advisors:Loring Nies, School of Civil Engineering
Chad Jafvert, School of Civil EngineeringSi Luo, Department of Computer Sciences
Julia Wiener, ESE Student
ProblemWhat is the river´s water use rate?When you withdraw water downstream, was it
previously used upstream? If so, how much are we reusing the water of the rivers? How many times?
What would this imply in terms of inter-jurisdiction regulation/ collaboration/ ?
Study case: Mississippi River
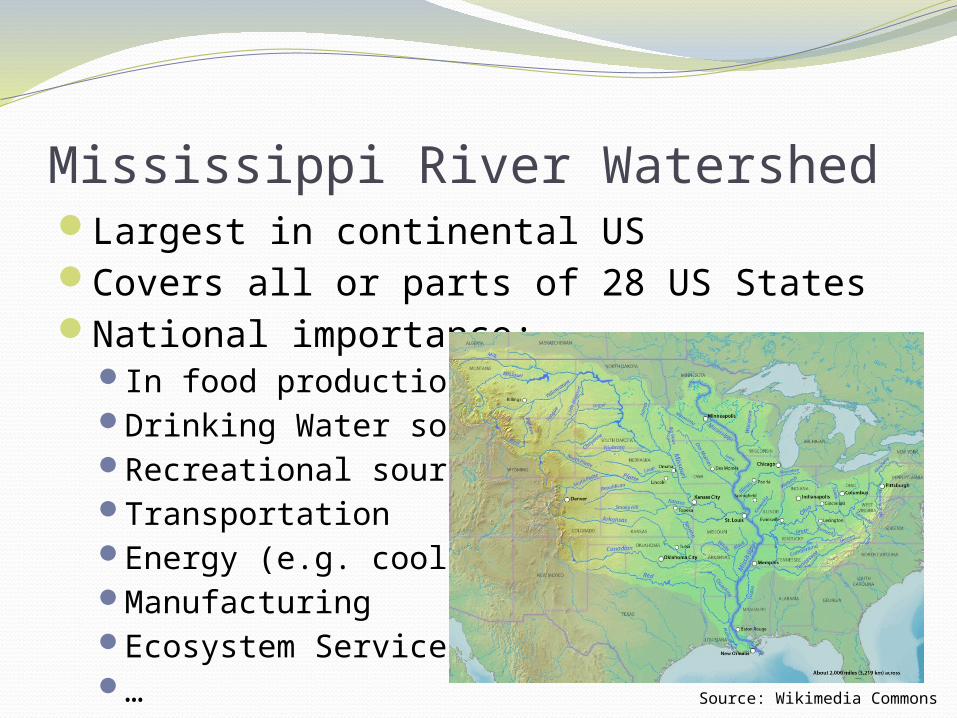
Mississippi River WatershedLargest in continental USCovers all or parts of 28 US StatesNational importance:
In food productionDrinking Water sourceRecreational sourceTransportationEnergy (e.g. cooling)ManufacturingEcosystem Services… Source: Wikimedia Commons
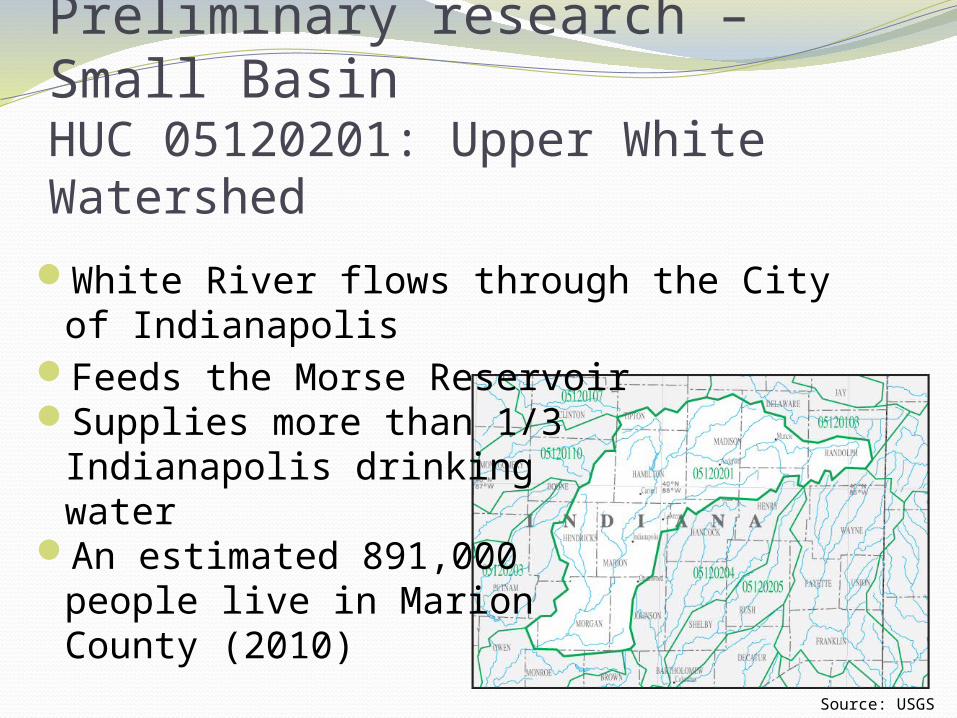
Preliminary research – Small BasinHUC 05120201: Upper White Watershed
White River flows through the City of IndianapolisFeeds the Morse ReservoirSupplies more than 1/3
Indianapolis drinking water
An estimated 891,000 people live in Marion County (2010)
Source: USGS
MethodologyAsses water reuse by:
Determining volume of water input into streams and river water bodies that occurs through facility discharges. Includes all NPDES permitted facilities.
Determining the volume of water extracted from lotic sources. Include all drinking water plants and industries that use surface water.
Evaluate the relationship between discharges-withdrawals and surface waters stream flow.
Work at different HUC LevelsTake USGS Gauging station stream flow measures as reference
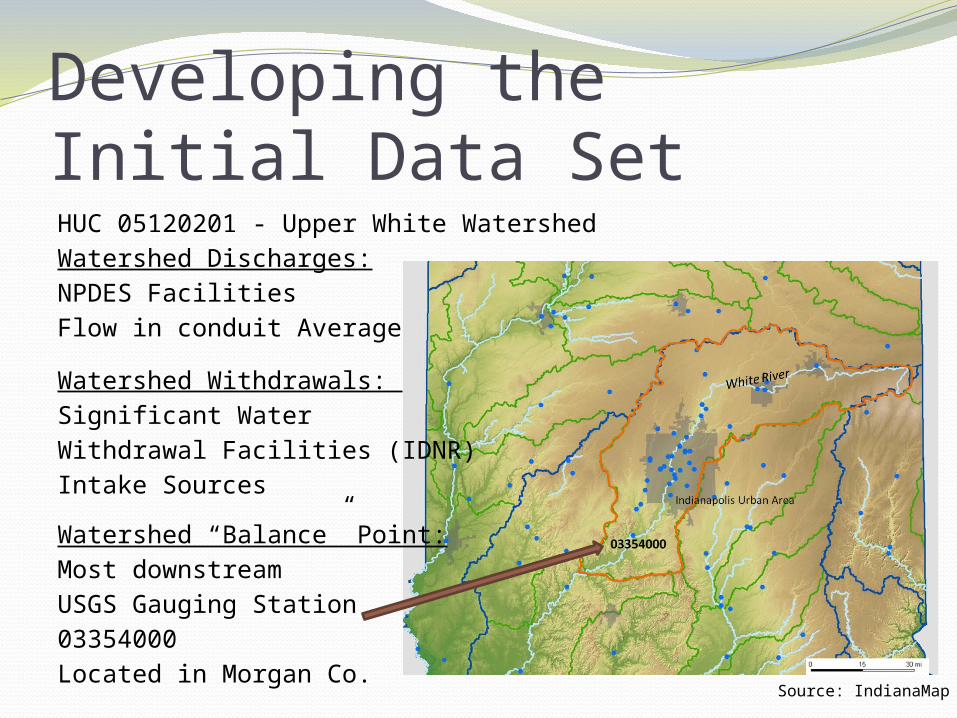
Developing the Initial Data Set HUC 05120201 - Upper White WatershedWatershed Discharges: NPDES FacilitiesFlow in conduit Average
Watershed Withdrawals: Significant Water Withdrawal Facilities (IDNR)Intake Sources
Watershed “Balance” Point: Most downstream USGS Gauging Station03354000 Located in Morgan Co. Source: IndianaMap
JanFe
bM
arApr
May
Jun JulAug
Sep
Oct NovDec
Discharg
es - AVE
With
drawals
Balance = D
- W0
1000
2000
3000
4000
5000
6000
7000
8000
9000
4291 4509
7056
4789
3532 3669
1760
945573 542 652
2613
1253
309944
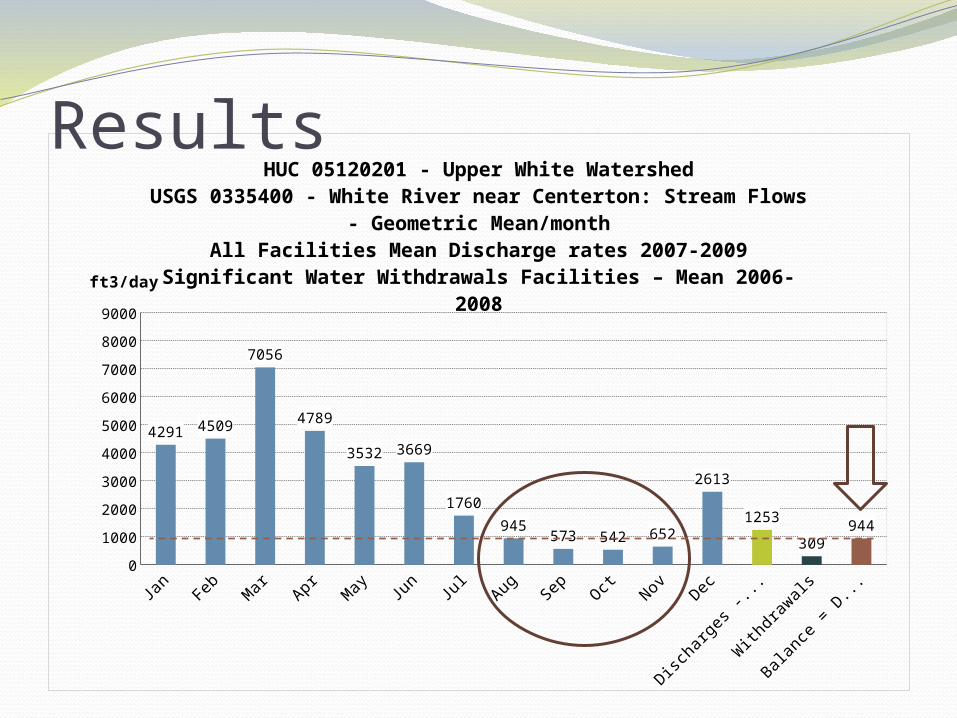
HUC 05120201 - Upper White WatershedUSGS 0335400 - White River near Centerton: Stream Flows - Geometric
Mean/monthAll Facilities Mean Discharge rates 2007-2009
Significant Water Withdrawals Facilities – Mean 2006-2008
ft3/day
Results
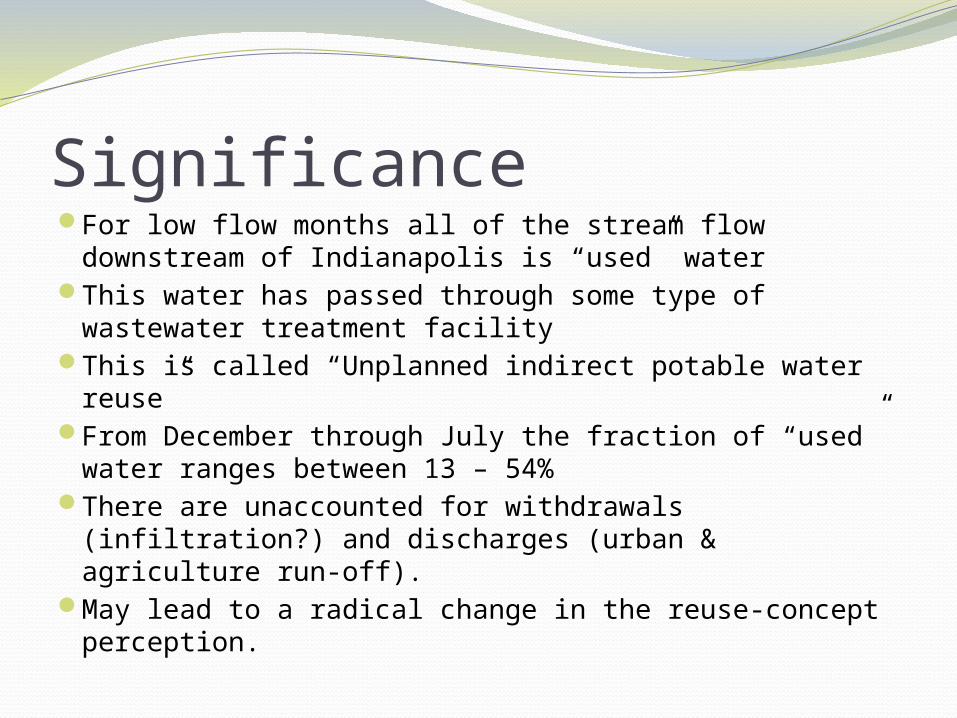
SignificanceFor low flow months all of the stream flow downstream of
Indianapolis is “used” waterThis water has passed through some type of wastewater
treatment facilityThis is called “Unplanned indirect potable water reuse”From December through July the fraction of “used” water
ranges between 13 – 54%There are unaccounted for withdrawals (infiltration?) and
discharges (urban & agriculture run-off).May lead to a radical change in the reuse-concept perception.
Issues to ManageMassive amount of water data collected and archived
continuouslyLittle coordination, integration or organization of the
heterogeneous data sets There is a need to enable a wider and more research-
oriented access to large-scale water resources data
DatabasesDataECHODNR (Withdrawals – Indiana)USGSGIS dataNHD Plus -> Provides some integration but in GIS formatEPA GIS Water data