Embed Size (px)
Citation preview

FACT SHEET - OCTOBER 2021
Scheme Page No
Parag Parikh Flexi Cap Fund
Parag Parikh Tax Saver Fund
Parag Parikh Conservative Hybrid Fund
Parag Parikh Liquid Fund
2
4
6
8
REITsInvITs
TA
X
(Please visit Page 2)
Foreign equity investment
The fund invests in foreign equity securities Since investors in PPFCF look for capital investment and returns in Rupee
terms PPFCF also looks at delivering in Rupee terms PPFCF hedges most of the currency exposure using currency
futures
Outlook
About Parag Parikh Flexi Cap Fund
Parag Parikh Flexi Cap Fund (PPFCF) is an open ended equity oriented scheme with flexibility to invest a minimum of
65 in Indian equities and up to 35 in overseas equity security and domestic debt money market securities
We continue to look at individual investments on their own merits and will not hesitate to invest if an opportunity looks
attractive As usual our investment stance does not depend much on the macro-economic situation but is focussed on
individual companies We have about 291 in cash holdings debt amp money market instruments and arbitrage
positions which can be deployed in long term investments at appropriate levels
The core portfolio consists of equity investments made with a long term outlook and the factors considered while
investing are quality of management quality of the sector and the business (return on capital entry barriers capital
intensity use of debt growth prospects etc) and the valuation of the companies The endeavor of the fund
management team is to identify opportunities for long term investments However there are times when the opportunities
are not attractive enough While waiting for attractive opportunities the fund invests in arbitrage opportunities between
the cash and futures equity markets and special situations arbitrage where open offers delisting merger events have
been announced Investments are also made in money market debt securities while waiting for deployment in core
equity investments
Portfolio Disclosure
- Above figures are annualised- Risk free rate assumed to be 342 (FBIL Overnight MIBOR as on 29th Oct 2021)
Name of the fund Parag Parikh Flexi Cap Fund
Investment Objective
Type of the Scheme
Date of Allotment May 24 2013
Entry Load Not Applicable
Exit Load
Benchmark Index NIFTY 500 (TRI)
To seek to generate long-term capital growth from an actively managed portfolio primarily of Equity and Equity Related Securities Scheme shall invest in Indian equities foreign equities and related instruments and debt securities
An open ended dynamic Equity scheme investing across large cap mid cap small cap Stocks
Name of the Fund
Managers
Assets Under Management
(AUM) as on Oct 31 2021
` Crores1693115Average AUM
for the Month
` 1721955 Crores
Net Asset Value (NAV) as
on Oct 29 2021
Regular Plan 502712
Direct Plan 531438
2 for redemption within 365 days
1 for redemption between 366 - 730 days
Nil for redemption beyond 730 days
Month End Expense RatioRegular Plan 185
Direct Plan 083
Including additional expenses and GST on management fees Total Expense ratio is as on last business day of the month
Minimum
Application
Amount
New Purchase ` 1000 Additional Purchase ` 1000
Monthly SIP ` 1000Quarterly SIP ` 3000
Beta 072
1769
139
1756
2899
Standard Deviation
Sharpe Ratio
Portfolio Turnover (excl Equity Arbitrage)
Portfolio Turnover (incl Equity Arbitrage)
Mr Rajeev Thakkar - Equity Fund Manager (Since Inception)
Mr Raj Mehta - Debt Fund Manager (Since January 27 2016)
Mr Raunak Onkar - Fund Manager Dedicatedfor Overseas Securities (Since Inception)
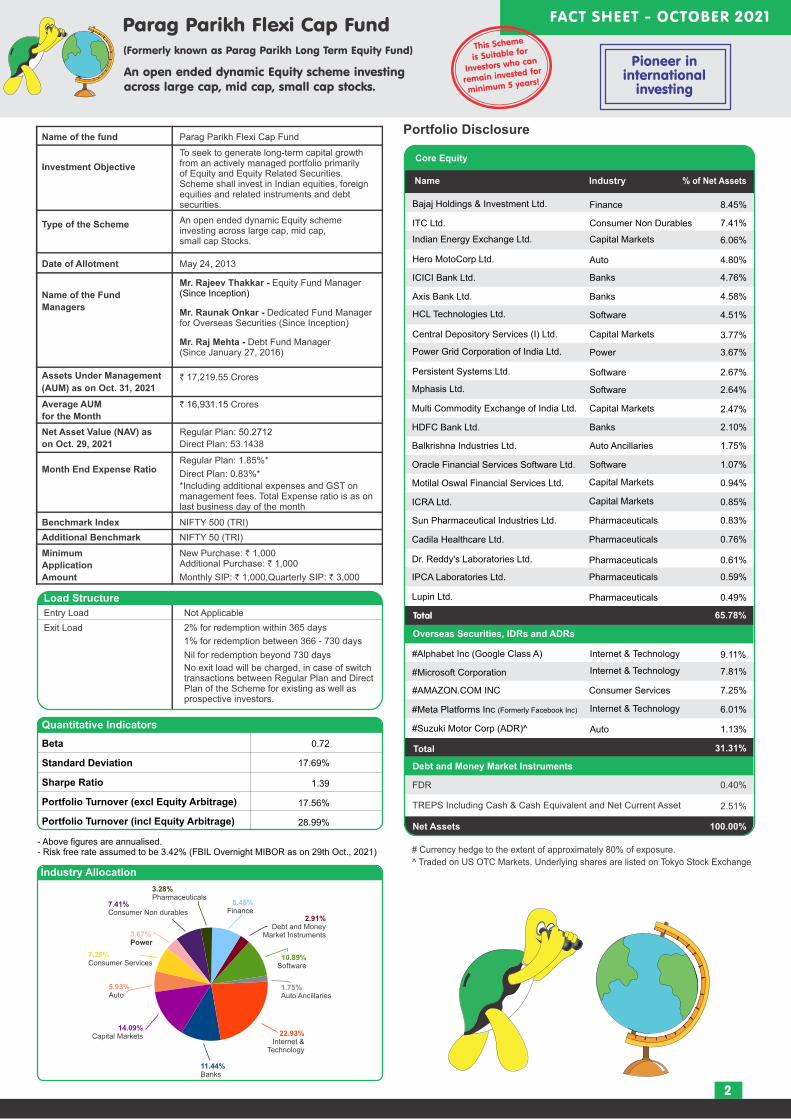
Currency hedge to the extent of approximately 80 of exposure
^ Traded on US OTC Markets Underlying shares are listed on Tokyo Stock ExchangeIndustry Allocation
Load Structure
Quantitative Indicators
FACT SHEET - OCTOBER 2021
2
(Formerly known as Parag Parikh Long Term Equity Fund)
Core Equity
Name Industry of Net Assets
Overseas Securities IDRs and ADRs
Total 3131
Debt and Money Market Instruments
TREPS Including Cash amp Cash Equivalent and Net Current Asset
040FDR
251
Net Assets 10000
Parag Parikh Flexi Cap Fund
An open ended dynamic Equity scheme investing across large cap mid cap small cap stocks
Additional Benchmark NIFTY 50 (TRI)
Pioneer in international
investing
Alphabet Inc (Google Class A) Internet amp Technology
Microsoft Corporation Internet amp Technology
Meta Platforms Inc (Formerly Facebook Inc) Internet amp Technology
AMAZONCOM INC Consumer Services
Suzuki Motor Corp (ADR)^ Auto
No exit load will be charged in case of switch transactions between Regular Plan and Direct Plan of the Scheme for existing as well as prospective investors
Total 6578Arbitrage
Tata Motors Ltd
045
042
037
028
005
Bharti Airtel Ltd
Cipla Ltd
Kotak Mahindra Bank Ltd
Maruti Suzuki India Ltd
Tata Steel Ltd
089
Hedged by offsetting derivative position
Finance 845
ITC Ltd 741
Indian Energy Exchange Ltd Capital Markets 606
Auto 480
ICICI Bank Ltd Banks 476
Axis Bank Ltd Banks 458
HCL Technologies Ltd Software 451
Central Depository Services (I) Ltd Capital Markets 377
Power Grid Corporation of India Ltd Power 367
Persistent Systems Ltd Software 267
Software 264
Multi Commodity Exchange of India Ltd Capital Markets 247
HDFC Bank Ltd Banks 210
Auto Ancillaries 175
Oracle Financial Services Software Ltd Software 107
Capital Markets 094
ICRA Ltd Capital Markets 085
Sun Pharmaceutical Industries Ltd Pharmaceuticals 083
Pharmaceuticals 076
Pharmaceuticals 061
IPCA Laboratories Ltd Pharmaceuticals 059
Pharmaceuticals 049
911
781
725
601
113
Bajaj Holdings amp Investment Ltd
Consumer Non Durables
Hero MotoCorp Ltd
Mphasis Ltd
Balkrishna Industries Ltd
Motilal Oswal Financial Services Ltd
Cadila Healthcare Ltd
Dr Reddys Laboratories Ltd
Lupin Ltd
328Pharmaceuticals
2293Internet amp
Technology
593 Auto
741Consumer Non durables
1089Software
175Auto Ancillaries
291Debt and Money
Market Instruments
725Consumer Services
845Finance
1144Banks
1409Capital Markets
367Power
FACT SHEET - OCTOBER 2021
3
Note
Different plans shall have different expense structures
Scheme returns shown are for regular plan
Past performance may or may not be sustained in the future
Greater than 1 year returns are CAGR returns
Data presented here is upto the last calendar month
We have our Skin in the Game
Parag Parikh Flexi Cap Fund
An open ended dynamic Equity scheme investing across large cap mid cap small cap stocks
Since Inception (May 24 2013) 2109 1623 1515 50271 35566 32876
October 30 2020 to October 29 2021 (Last 1 year) 6160 5928 5372 16139 15908 15354
October 31 2018 to October 29 2021 (Last 3 year) 2988 2124 2082 21894 17812 17625
October 28 2016 to October 29 2021 (Last 5 year) 2178 1635 1681 26815 21335 21761
Since Inception fromJune 1 2013
October 30 2020 to October 29 2021 (Last 1 year)
October 31 2018 to October 29 2021 (Last 3 year)
October 28 2016 to October 29 2021 (Last 5 year)
Total Amount Invested
Market value of Investment (Regular Plan)
(Regular Plan) Returns (Annualised) ()
Nifty 500 (TRI) Returns (Annualised) ()
Nifty 50 (TRI) Returns (Annualised) ()
1020000 120000 360000 600000
2703388 153765 629577 1189292
2214 5661 4003 2781
1705 4454 3067 2055
1638 4083 2848 2032
Oct 30 2020 to Oct 29 2021Since Inception
CAGR Scheme 2109Nifty 5001623Nifty 50 1515
Scheme 6160 Nifty 500 5928Nifty 50 5372
PPFCF Returns Benchmark Returns (Nifty 500 (TRI)) Nifty 50 (TRI) Returns
PPFCF Vs Benchmark Indices
00
50
100
150
200
250
300
350
400
00
50
100
150
200
250
300
350
400
Oct
20
Nov2
0
Dec2
0
Jan21
Feb21
Mar
21
Apr2
1
May2
1
June21
July
21
Aug21
Sept2
1
Oct
20
Lumpsum Investment Performance (Compounded annual returns)
Scheme
PPFCF(Regular)
NIFTY 500(TRI)
NIFTY 50(TRI)
PPFCF
Additional Benchmark
(Regular)
NIFTY 50(TRI)
NIFTY 500(TRI)
The combined holding of Insiders in Parag Parikh Flexi Cap Fund amounts
to For more details ` 26068 Crores of AUM as at October 29 2021
Since inception returns are calculated on Rs 10 (allotment price)
Source Internal sources
Lumpsum Investment Performance (Compounded annual returns)
Scheme
PPFCF(Regular)
NIFTY 500(TRI)
NIFTY 50(TRI)
PPFCF
Additional Benchmark
(Regular)
NIFTY 50(TRI)
NIFTY 500(TRI)
PPFCF
(Direct)
PPFCF(Direct)
SIP Investment Performance (Assumption `10000- is invested on the first of every month)
Total Amount Invested
Market value of Investment (Regular Plan)
Market value of Investment (Direct Plan)
(Regular Plan) Returns (Annualised) ()
(Direct Plan) Returns (Annualised) ()
NIFTY 500 (TRI) Returns (Annualised) ()
NIFTY 50 Returns (Annualised) ()(TRI)
Since inception returns are calculated on Rs 10 (allotment price)
Since Inception (May 24 2013) 2109 1623 1515 50271 35566 32876
Oct 30 2020 to Oct 29 2021 (Last 1 year) 6160 5928 5372 16139 15908 15354
Oct 31 2018 to Oct 29 2021 (Last 3 year) 2988 2124 2082 21894 17812 17625
Oct 28 2016 to Oct 29 2021 (Last 5 year) 2178 1635 1681 26815 21335 21761
2189
6324
3105
2272
53144
16302
22492
27861
Since Inception fromJune 1 2013
October 30 2020 to October 29 2021 (Last 1 year)
October 31 2018 to October 29 2021 (Last 3 year)
October 28 2016 to October 29 2021 (Last 5 year)
1020000 120000 360000 600000
2703388 153765 629577 1189292
2214 5661 4003 2781
1705 4454 3067 2055
1638 4083 2848 2032
2808037
2299
154661
5821
639851
4130
1218403
2883
Total number of units held in Parag Parikh Flexi Cap Fund as per SEBI Circular relating to Alignment of interest of Key Employees (Designated Employees) of Asset Management Companies (AMCs) with the unitholders of the Mutual Fund Schemes (dated April 28 2021 read with September 20 2021) as at 31-10-2021
60568945Parag Parikh Flexi Cap Fund - Direct Plan
Scheme Units AUM (in Rs)
1139718
Portfolio Disclosure
- Above figures are annualised
- Since the fund has not completed 3 years other quantitative indicators are not
shown as per AMFI Best Practice Guidelines
Name of the fund Parag Parikh Tax Saver Fund
Investment Objective
Type of the Scheme
Date of Allotment July 24 2019
Benchmark Index NIFTY 500 (TRI)
To seek to generate long-term capital appreciation through a diversified portfolio of equity and equity related instruments
An open ended equity linked savings scheme with a statutory lock in of3 years and tax benefit
Name of the Fund
Managers
Assets Under Management
(AUM) as on Oct 31 2021
` 32589 CroresAverage AUM
for the Month
` 32383 Crores
Net Asset Value (NAV) as
on Oct 29 2021
Regular Plan 183787
Direct Plan 188982
Month End Expense RatioRegular Plan 228
Direct Plan 098
Including additional expenses and GST on management fees Total Expense ratio is as on last business day of the month
Minimum
Application
Amount
New Purchase ` 500 and in multiples of ` 500Additional Purchase ` 500 and in
Monthly SIP ` 1000Quarterly SIP ` 3000
Portfolio Turnover 479
Mr Rajeev Thakkar - Equity Fund Manager (Since Inception)
Mr Raj Mehta - Debt Fund Manager (Since Inception)
Mr Raunak Onkar - Co Fund Manager (Since Inception)
Industry Allocation
Entry Load Not Applicable
Not ApplicableExit Load
Load Structure
Quantitative Indicators
FACT SHEET - OCTOBER 2021
4
Core Equity
Name Industry of Net Assets
Net Assets 10000
Debt and Money Market Instruments
Total
TREPS Including Cash amp Cash Equivalent and Net Current Asset
1064Debt and Money MarketInstruments
8936
Additional Benchmark NIFTY 50 (TRI)
An open ended equity linked saving scheme with a statutory lock in of3 years and tax benefit
TA
X
Finance 899
ITC Ltd 760
Indian Energy Exchange Ltd Capital Markets 640
Auto 526
HCL Technologies Ltd Software 506
Software 504
Auto 504
Power Grid Corporation of India Ltd Power 500
ICICI Bank Ltd Banks 498
Software 495
Axis Bank Ltd Banks 472
Auto Ancillaries 349
Central Depository Services (I) Ltd Capital Markets 340
Persistent Systems Ltd Software 291
Multi Commodity Exchange of India Ltd Capital Markets 257
Software 252
HDFC Bank Ltd Banks 243
CCL Products (India) Ltd 207
ICRA Ltd Capital Markets 178
Capital Markets 102
Oracle Financial Services Software Ltd Software 102
Sun Pharmaceutical Industries Ltd Pharmaceuticals 085
Pharmaceuticals 079
Pharmaceuticals 063
Pharmaceuticals 058
IPCA Laboratories Ltd Pharmaceuticals 026
Bajaj Holdings amp Investment Ltd
Consumer Non Durables
Maruti Suzuki India Ltd
Tata Consultancy Services Ltd
Hero MotoCorp Ltd
Wipro Ltd
Balkrishna Industries Ltd
Mphasis Ltd
Consumer Non Durables
Motilal Oswal Financial Services Ltd
Cadila Healthcare Ltd
Dr Reddys Laboratories Ltd
Lupin Ltd
311Pharmaceuticals
1213Banks
2150Software
1030Auto
967Consumer Non Durables
1064Debt and Money Market Instruments
349Auto Ancillaries
899Finance
1517Capital Markets
500Power
FACT SHEET - OCTOBER 2021
5
Note
Different plans shall have different expense structures
Scheme returns shown are for regular plan
Past performance may or may not be sustained in the future
Data presented here is upto the last calendar month
We have our Skin in the Game
An open ended equity linked saving scheme with a statutory lock in of3 years and tax benefit
Total Amount Invested 280000 120000
Market value of Investment (Regular Plan) 432370 147224
(Regular Plan) Returns (Annualised) () 4061 4507
Nifty 500 (TRI) Returns (Annualised) () 3868 4454
Nifty 50 (TRI) Returns (Annualised) () 3543 4083
Since Inception from July 24 2019
October 30 2020 to October 29 2021 (Last 1 year)
SIP Investment Performance (Assumption ` 10000- is invested on the first of every month)
Since Inception (24 July 2019) 3077 2594 2333 18379 16875 16090
October 30 2020 to October 29 2021 (Last 1 year) 4959 5928 5372 14942 15908 15354
Since Inception (July 24 2019)
CAGR Scheme 3077Nifty 500 2594Nifty 50 2333
Scheme 4959 Nifty 500 5928Nifty 50 5372
PPTSF Returns Benchmark Returns (Nifty 500 (TRI)) Nifty 50 (TRI) Returns
PPTSF Vs Benchmark Indices
60
70
80
90
100
110
120
130
140
60
70
80
90
100
110
120
130
140
Jul1
9A
ug19
Sep 1
9O
ct19
Nov1
9D
ec1
9Ja
n20
Feb20
Mar2
0A
pr2
0M
ay2
0Ju
n20
Jul2
0A
ug20
Sep20
Oct
20
Nov2
0D
ec2
0Ja
n21
Feb21
Mar2
1A
pr2
1M
ay2
1Ju
ne21
July
21
Aug21
Sep21
Oct
21
Oct
20
Nov2
0
Dec2
0
Jan21
Feb21
Mar2
1
Apr2
1
May2
1
June21
July
21
Aug21
Sept2
1
Oct
21
Oct 30 2020 to Oct 29 2021
Date
Scheme Benchmark Value of Investment of Rs 10000-
PPTSF PPTSFNIFTY 500(TRI)
NIFTY 50(TRI)
NIFTY 500(TRI)
NIFTY 50(TRI)
Lumpsum Investment Performance (Compounded annual returns)
AdditionalBenchmark
(Regular) (Regular)
The combined holding of Insiders in Parag Parikh Tax Saver Fund amounts to `781 Crores of AUM as at October 29 2021 For more details
Since inception returns are calculated on Rs 10 (allotment price)
Source Internal sources
Total Amount Invested
Market value of Investment (Regular Plan)
Market value of Investment (Direct Plan)
(Regular Plan) Returns (Annualised) ()
(Direct Plan) Returns (Annualised) ()
NIFTY 500 (TRI) Returns (Annualised) ()
NIFTY 50 Returns (Annualised) ()(TRI)
SIP Investment Performance (Assumption `10000- is invested on the first of every month)
Date
Scheme Benchmark Value of Investment of Rs 10000-
PPTSF PPTSFNIFTY 500(TRI)
NIFTY 50(TRI)
NIFTY 500(TRI)
NIFTY 50(TRI)
Lumpsum Investment Performance (Compounded annual returns)
AdditionalBenchmark
(Regular) (Regular)PPTSF(Direct)
PPTSF(Direct)
Since Inception from July 24 2019
Since inception returns are calculated on Rs 10 (allotment price)
Since Inception (24 July 2019) 3077 2594 2333 18379 16875 16090
October 30 2020 to October 29 2021 (Last 1 year) 4959 5928 5372 14942 15908 15354
3239
5145
18898
15128
October 30 2020 to October 29 2021 (Last 1 year)
280000 120000
432370 147224
4061 4507
3868 4454
3543 4083
439490
4232
148284
4692
Total number of units held in Parag Parikh Tax Saver Fund as per SEBI Circular relating to Alignment of interest of Key Employees (Designated Employees) of Asset Management Companies (AMCs) with the unitholders of the Mutual Fund Schemes (dated April 28 2021 read with September 20 2021) as at 31-10-2021
1450059Parag Parikh Tax Saver Fund - Direct Plan
Scheme Units AUM (in Rs)
76730
Quantitative IndicatorsBeta069Standard Deviation0115Sharpe Ratio053Portfolio Turnover (excl Equity Arbitrage)01192Portfolio Turnover (incl Equity Arbitrage)18617
Portfolio DisclosureName of the fund Parag Parikh Conservative Hybrid Fund
Investment Objective
Type of the Scheme
Date of Allotment 26th May 2021
Benchmark Index CRISIL Hybrid 85+15 - Conservative Index TRI
CRISIL 10 year GILT Index
To generate regular income through investments predominantly in debt and money market instruments The Scheme also seeks to generate long term capital appreciation from the portion of equity investments under the scheme However there is no assurance or guarantee that the investment objective of the Scheme will be realized
An open ended hybrid scheme investing predominantly in debt instruments
Name of theFund Manager
Assets Under
Management (AUM) as onOct 31 2021
Average AUM
for the Month` 50489 Crores
Month End Expense Ratio
Regular Plan 060 Direct Plan 030
Including additional expenses and GST on management fees Total Expense ratio is as on last business day of the month
Additional Benchmark
Minimum
Application
Amount
Quantitive Indicators
Calculated on amount invest in debt securities (including accrued interest) deployment of funds in TREPS amp Reverse Repo and net receivablespayables^YTM is calculated on the basis of annualised yield for all securities
Average Maturity (Years) 643
49004
662
Modified Duration (Years)
Yield to Maturity^
Macaulay duration 50649
Entry Load Not Applicable
Exit Load
Load Structure
FACT SHEET - OCTOBER 2021
Name of Net Assets
Net Assets 10000
6
` 53557 Crores
REITsInvITs Parag Parikh Conservative Hybrid Fund
An open-ended hybrid scheme investing predominantly in debt instruments
DEBT
EQUITYREITs
InvITs
Equity and Equity Related Instruments
770 India Grid Trust 06-May-2028 094b) Government Securities
Units issued by REITs amp InvITsListed awaiting listing on the stock exchanges
Brookfield India REIT
Embassy Office Parks REIT
Mindspace Business Parks REIT
Debt and Money Market Instruments
Name of Net AssetsRatinga)CorporateBondNCD
c) TREPS and Other Receivables and Payables
TREPS Including Cash amp Cash Equivalent and Net Current Asset 186
d) Fixed Deposits
Mr Rajeev Thakkar - Equity Fund Manager (Since Inception)
Mr Raj Mehta - Debt Fund Manager (Since Inception)
Mr Raunak Onkar - Equity Fund Manager (Since Inception)
Net Asset Value (NAV) as
on Oct 29 2021
Regular Plan 103857
Direct Plan 103992
New Purchase 5000 and in multiples of 1 ` `thereafter
Additional Purchase 1000 and in multiples of 1 ` `thereafter
Monthly SIP 1000 and Quarterly SIP 3000` `
10 of the units (ldquothe limitrdquo) may be redeemed without any exit load from the date of allotment1 for redemption within 1 Year and Nil for redemption beyond 1 Year from the date of allotment
CRISIL AAA
1226Sub total
085Sub total
916Sub total
Industry
Name of Net AssetsIndustry
Construction
Construction
Construction
7493Sub total
418
250
248
490 HDFC Bank Ltd (Duration 365 Days) 028
490 HDFC Bank Ltd (Duration 368 Days) 019490 HDFC Bank Ltd (Duration 365 Days) 019
510 Axis Bank Ltd (Duration 367 Days) 019
Power Grid Corporation of India Ltd Power 247
Auto 247Gas 246
Coal India Ltd MineralsMining 243
ITC Ltd 243
563 Government of India 12-Apr-2026 Sovereign 093
Bajaj Auto Ltd
Petronet LNG Ltd
Consumer Non Durables
DEBT
EQUITYREITs
InvITs
Sovereign
Sovereign
834 State Government of Punjab 30-May-2028
808 State Government of Maharashtra 26-Dec-2028
843 State Government of Goa 13-Mar-2029
816 State Government of Rajasthan 09-May-2028
800 State Government of Kerala 11-Apr-2028
792 State Government of Uttar Pradesh 24-Jan-2028
699 State Government of Telangana 10-Jun-2028
788 State Government of Madhya Pradesh 24-Jan-2028
842 State Government of Madhya Pradesh 08-Aug-2028
799 State Government of Punjab 11-Apr-2028
828 State Government of Gujarat 20-Feb-2029
828 State Government of Gujarat 23-Jan-2029
809 State Government of West Bengal 27-Mar-2028
797 State Government of Assam 18-Apr-2028
845 State Government of Uttar Pradesh 27-Feb-2029
808 State Government of Tamil Nadu 26-Dec-2028
815 State Government of Tamil Nadu 09-May-2028
820 State Government of Uttarakhand 09-May-2028
698 State Government of Telangana 22-Apr-2028
865 State Government of Rajasthan 03-Oct-2028
863 State Government of Rajasthan 03-Sep-2028
849 State Government of Uttarakhand 21-Aug-2028
843 State Government of Uttar Pradesh 06-Mar-2029
845 State Government of Uttar Pradesh 27-Jun-2028
841 State Government of Kerala 06-Jun-2028
834 State Government of Tamil Nadu 28-Feb-2028
833 State Government of Kerala 30-May-2028
825 State Government of Tamil Nadu 02-Jan-2029
829 State Government of Haryana 14-Mar-2028
820 State Government of Jammu and Kashmir 30-Jan-2029
813 State Government of Rajasthan 27-Mar-2028
811 State Government of Chhattisgarh 31-Jan-2028
805 State Government of Tamil Nadu 18-Apr-2028
798 State Government of Uttar Pradesh 11-Apr-2028
786 State Government of Haryana 27-Dec-2027
765 State Government of Karnataka 06-Dec-2027
753 State Government of West Bengal 22-Nov-2027
709 State Government of Goa 28-Aug-2029
679 State Government of West Bengal 30-Jun-2028
711 State Government of Tamil Nadu 31-Jul-2029
713 State Government of Kerala 10-Jul-2029
653 State Government of Chhattisgarh 15-Sep-2028
Sovereign
Sovereign
Sovereign
Sovereign
Sovereign
Sovereign
Sovereign
Sovereign
Sovereign
Sovereign
Sovereign
Sovereign
Sovereign
Sovereign
Sovereign
Sovereign
Sovereign
Sovereign
Sovereign
Sovereign
Sovereign
Sovereign
Sovereign
Sovereign
Sovereign
Sovereign
Sovereign
Sovereign
Sovereign
Sovereign
Sovereign
Sovereign
Sovereign
Sovereign
Sovereign
Sovereign
Sovereign
Sovereign
Sovereign
Sovereign
504
500
499
477
398
307
305
303
205
205
202
202
202
200
190
104
103
103
102
102
102
102
102
102
102
102
101
101
101
101
101
101
100
100
100
099
098
095
095
095
094
093
Asset Allocation by Asset Class Asset Allocation by Rating
We have our Skin in the Game
The combined holding of Insiders in Parag Parikh Conservative Hybrid
Fund amounts to For more ` 573 Crores of AUM as at October 29 2021
details please
7
REITsInvITs
Equity
Debt
FACT SHEET - OCTOBER 2021
REITsInvITs
Parag Parikh Conservative Hybrid Fund
An open-ended hybrid scheme investing predominantly in debt instruments
Source Internal sources Source Internal sources
Dividend History - Monthly Income Distribution cum capital Withdrawal option
Record datePayout Date
DirectRetail RetailCorporate Corporate
Regular
30th Aug 2021 01124 01067
Face ValueRegular
10 100100
NAV per Unit (Ex IDCW)
01124 01067
DirectNAV per Unit (Ex IDCW)
100100
RegularNAV per Unit (Cum IDCW)
101167
DirectNAV per Unit (Cum IDCW)
101224
27th Sept 2021 00680 00680 00667 00667 10 101335 101343 102002 102023
7493G sec and SDL
1226Equity and Equity
Related Instruments
271TREPS Fixed Deposit
Net receivables amp Payables and
Net Current Asset094
Corporate Bond
916REITs and InvITs
271TREPS Fixed Deposit and
Net Receivables amp Payables
916REITs and InvITs
7493Sovereign
094AAA
1226Equity and Equity
Related Instruments
Total number of units held in Parag Parikh Conservative Hybrid Fund as per SEBI Circular relating to Alignment of interest of Key Employees (Designated Employees) of Asset Management Companies (AMCs) with the unitholders of the Mutual Fund Schemes (dated April 28 2021 read with September 20 2021) as at 31-10-2021
1965767Parag Parikh Conservative Hybrid Fund - Direct Plan Growth
Scheme Units AUM (in Rs)
194077
th25 Oct 2021 00597 00597 00340 00340 10 101762 101541 102102 102138
Quantitative IndicatorsBeta069Standard Deviation0115Sharpe Ratio053Portfolio Turnover (excl Equity Arbitrage)01192Portfolio Turnover (incl Equity Arbitrage)18617
Portfolio DisclosureName of the fund Parag Parikh Liquid Fund
Investment Objective
Type of the Scheme
Date of Allotment May 11 2018
Benchmark Index CRISIL Liquid fund index
CRISIL 1 Year T-Bill index
To deliver reasonable market related returns with lower risk and high liquidity through judicious investments in money market and debt instruments (Non Guaranteed)
An Open-ended Liquid Scheme
Name of theFund Manager
Mr Raj Mehta
(Since Inception)
Assets Under
Management (AUM) as onOct 31 2021
Average AUM
for the Month` 48 Crores1501
Month End Expense Ratio
Regular Plan 026 Direct Plan 016
Including additional expenses and GST on management fees Total Expense ratio is as on last business day of the month
Additional Benchmark
Minimum
Application
Amount
New Purchase ` 5000
Additional Purchase ` 1000
Monthly SIP ` 1000
NAV Details
Plan
Growth
Daily Reinvestment of Income Distributioncum capital withdrawal option
Weekly Reinvestment of Income Distribution cum capital withdrawal option
Monthly Income Distribution cum capital withdrawal option
Direct Regular
Quantitive Indicators
Computed on the invested amount
Average Maturity (Days) 4274
01106
34460
Modified duration (Years)
Yield to Maturity
Macaulay Duration (Years) 01145
Entry Load Not Applicable
For purpose of levying exit load if subscription (application amp funds) is received
within cut-off time on a day Day 1 shall be considered to be the same day else the
day after the date of allotment of units shall be considered as Day 1
Day of redemption switch from the date
of applicable NAV
Day 1 00070
Day 2 00065
Day 3 00060
Day 4 00055
Day 5 00050
Day 6 00045
Day 7 onwards 00000
Exit load as a ofredemption
switch proceeds
Exit Load
Load Structure
FACT SHEET - OCTOBER 2021
a) Debt and Money Market Instruments
Name Rating of Net AssetsSovereign
Sovereign
Sovereign
Sovereign
Sovereign
Sovereign
Sovereign
Sovereign
Sovereign
Sovereign
b) Government Securities
e) Fixed Deposits
Net Assets 10000
d) TREPS and Other Receivables and Payables
TREPS Including Net ReceivablesPayables and Net Current Asset 475
FDR 057
11745668 11703612
Sovereign
10005404
10014319
10034328
10005404
10014154
10034163
8
Sovereign
` 01 Crores1495
Sovereign
879 Government of India 08-Nov-2021 937Sovereign
Dividend History - Monthly Income Distribution cum capital Withdrawal option
Record datePayout Date
DirectRetail RetailCorporate Corporate
Regular
30th Aug 2021 ` 31956 ` 30988
Face Value
1000
Regular
10030000` 31956 ` 30988
NAV per Unit (Ex IDCW)
Direct
NAV per Unit (Ex IDCW)
10030000
Regular
NAV per Unit (Cum IDCW)
10060988
Direct
NAV per Unit (Cum IDCW)
10061956
27th Sept 2021 ` 22916 ` 22147 1000` 22916 ` 22147 10030000 10030000 10052147 10052916
Quarterly SIP ` 3000-
Dividend History - Monthly Income Distribution cum capital Withdrawal option
Record datePayout Date
DirectRetail RetailCorporate Corporate
Regular
c) Commercial Paper
d) Certificate of Deposit
National Bank for Agriculture and Rural Development 10-Jun-2021
A1+ 077Axis Bank Ltd 10-Jun-2021
A1+ 077
A1+ 036
28th June 2021 ` 248 ` 24` 248 ` 24
National Bank for Agriculture and Rural Development 31-Aug-2021
26th July 2021 ` 254 ` 246` 254 ` 246
30th Aug 2021 ` 319 ` 309` 319 ` 309
Face Value
1000
1000
1000
Prevailing NAV
10060034
10053757
10053176
91 DAY T-BILL 13-Jan-2022 830
91 DAY T-BILL 20-Jan-2022 830
91 DAY T-BILL 04-Nov-2021 669
182 DAY T-BILL 18-Nov-2021 668
182 DAY T-BILL 25-Nov-2021 667
91 DAY T-BILL 02-Dec-2021 667
182 DAY T-BILL 09-Dec-2021 667
182 DAY T-BILL 16-Dec-2021 666
91 DAY T-BILL 23-Dec-2021 666
182 DAY T-BILL 30-Dec-2021 665
91 DAY T-BILL 06-Jan-2022 665
182 DAY T-BILL 23-Dec-2021 333
182 DAY T-BILL 02-Dec-2021 267
870 State Government of Kerala 25-Jan-2022
c) State Government Securities
271Sovereign
th25 Oct 2021 ` 24257 ` 23485 1000` 24257 ` 23485 10030000 10030000 10053485 10054257
Note
Different plans shall have different expense structures
Scheme returns shown are for regular plan
Past performance may or may not be sustained in the future
Greater than 1 year returns are CAGR returns
Data presented here is upto the last calendar month
We have our Skin in the Game
Asset Allocation by Asset Class Asset Allocation by Rating
FACT SHEET - OCTOBER 2021
Less than 1 year returns are simple annualised returns
The combined holding of Insiders in Parag Parikh Liquid Fund amounts to
` 4495 Crores of AUM as at October 29 2021 For more details please
9
Source Internal sources Source Internal sources
Date
Scheme Benchmark Additional Benchmark Value of Investment of Rs 10000-
CRISIL 1 year T-bill Index
557 602
285 -058
291 060
335 143
355 351
PPLF (Regular)
CRISIL Liquid Fund Index
PPLF (Regular)
CRISIL Liquid Fund Index
CRISIL 1 year T-bill Index
Lumpsum Investment Performance (Compounded annual returns)
11704
10005
10013
10026
10305
12075 12254
10005 9999
10014 10003
10028 10012
10357 10353
524 601 11365 11658 11915
Since inception returns are calculated on Rs 1000 (allotment price)
463
266
272
303
303
435
Since Inception (11 May 2018)
October 24 2021 to October 31 2021 (Last 7 Days)
October 14 2021 to October 31 2021 (Last 15 days)
September 30 2021 to October 31 2021 (Last 1 Month)
October 29 2020 to October 31 2021 (Last 1 year)
October 31 2018 to October 31 2021 (Last 3 year)
Date
Scheme Benchmark Additional Benchmark Value of Investment of Rs 10000-
CRISIL 1 year T-bill Index
PPLF (Regular)
PPLF (Direct)
PPLF (Direct)
CRISIL Liquid Fund Index
PPLF (Regular)
CRISIL Liquid Fund Index
CRISIL 1 year T-bill Index
Lumpsum Investment Performance (Compounded annual returns)
Since inception returns are calculated on Rs 1000 (allotment price)
557 602
285 -058
291 060
335 143
355 351
11704
10005
10013
10026
10305
12075 12254
10005 9999
10014 10003
10028 10012
10357 10353
524 601 11365 11658 11915
463
266
272
303
303
435
Since Inception (11 May 2018)
Oct 24 2021 to Oct 31 2021 (Last 7 Days)
Oct 14 2021 to Oct 31 2021 (Last 15 days)
Sept 30 2021 to Oct 31 2021 (Last 1 Month)
Oct 29 2020 to Oct 31 2021 (Last 1 year)
Oct 31 2018 to Oct 31 2021 (Last 3 year)
474
276
282
313
314
446
11746
10005
10013
10027
10315
11400
8260Treasury Bills
1208G Sec
532TREPS Fixed Deposit
Net receivables amp Payables and
Net Current Asset
9468Sovereign
532TREPS Fixed Deposit and
Net Receivables amp Payables
Sovereign
A1+
TREPS Fixed Deposit and Net receivables amp Payables
Total number of units held in Parag Parikh Liquid Fund as per SEBI Circular relating to Alignment of interest of Key Employees (Designated Employees) of Asset Management Companies (AMCs) with the unitholders of the Mutual Fund Schemes (dated April 28 2021 read with September 20 2021) as at 31-10-2021
5425534Parag Parikh Liquid Fund Direct Plan Growth
Scheme Units AUM (in Rs)
4620
FACT SHEET - OCTOBER 2021
10
Scheme Date of Allotment Date
Value of investment of Rs 10000-
NIFTY 500 (TRI) NIFTY 50 (TRI) NIFTY 500 (TRI)
th24 May 2013
Since Inception 2109 1623 1515 50271 35566 32876
1 Year 6160 5928 5372 16139 15908 15354
3 Year 2988 2124 2082 21894 17812 17625
5 Year 2178 1635 1681 26815 21335 21761
th24 July 2019
Since Inception 3077 2594 2333 18379 16875 16090
1 Year 4959 5928 5372 14942 15908 15354
3 Year NA NA NA NA NA NA
5 Year NA NA NA NA NA NA
Scheme Return
Benchmark Return ()
Additional Benchmark Return
()
Scheme Return (Rs)
NIFTY 50 (TRI)
Parag Parikh
Flexi Cap
Fund
Parag Parikh
Tax Saver
Fund
Fund Manager Name Mr Rajeev Thakkar
Mr Rajeev Thakkar Manages two schemes of PPFAS Mutual Fund
Fund Manager Name Mr Raunak Onkar
Mr Raunak Onkar Manages two schemes of PPFAS Mutual Fund
Fund Manager Name Mr Raj Mehta
Mr Raj Mehta Manages three schemes of PPFAS Mutual Fund
Scheme Date of Allotment Date
Value of investment of Rs 10000-
CRISIL Liquid Fund Index
th11 May 2018
Since Inception 463 557 602 11704 12075 12254
1 Year 303 355 351 10305 10357 10353
3 Year 435 524 601 11365 11658 11915
5 Year NA NA NA NA NA NA
Scheme Return
Benchmark Return ()
Additional Benchmark Return
()
Crisil Liquid Fund Index
CRISIL 1 year T-bill
IndexScheme Return
(Rs) CRISIL 1 Year
T-bill Index
Parag ParikhLiquid Fund
Since inception returns are calculated on Rs 10 (allotment price)
Since inception returns are calculated on Rs 1000 (allotment price)
Past Performance may or may not be sustained in future
The performance details provided herein are of regular plan growth option Regular and Direct Plans have different expense structure
Direct Plan shall have a lower expense ratio excluding distribution expenses commission expenses etc
All 3 Fund Managers also manage Parag Parikh Conservative Hybrid Fund since May 28 2021 However performance of the scheme
has not been included because It has not yet completed six months duration since inception
Scheme Date of Allotment Date
Value of investment of Rs 10000-
NIFTY 500 (TRI) NIFTY 50 (TRI) NIFTY 500 (TRI)
th24 May 2013
Since Inception 2109 1623 1515 50271 35566 32876
1 Year 6160 5928 5372 16139 15908 15354
3 Year 2988 2124 2082 21894 17812 17625
5 Year 2178 1635 1681 26815 21335 21761
th24 July 2019
Since Inception 3077 2594 2333 18379 16875 16090
1 Year 4959 5928 5372 14942 15908 15354
3 Year NA NA NA NA NA NA
5 Year NA NA NA NA NA NA
Scheme Return
Benchmark Return ()
Additional Benchmark Return
()
Scheme Return (Rs)
NIFTY 50 (TRI)
Parag Parikh
Flexi Cap
Fund
Parag Parikh
Tax Saver
Fund
FACT SHEET - OCTOBER 2021
11
Parag Parikh Flexi Cap Fund
Investors understand that their principalwill be at very high risk
woL
High
tearedoM
Very High
ot woL
etaredoM
Moderately High
Low Very High
Investors should consult their financial advisers if in doubt about whether the
product is suitable for them
Parag Parikh Tax Saver Fund
Investors understand that their principalwill be at very high risk
woL
High
tearedoM
Very High
ot woL
etaredoM
Moderately High
Low Very HighInvestors should consult their financial advisers if in doubt about whether the product is suitable for them
This product is suitable for investors who are seeking
Long term capital appreciation
Investment predominantly in equity and equity related securities
This Product is suitable for investors who are seeking
The investment objective of the Scheme is to seek to generate long-term capital growth from an
actively managed portfolio primarily of Equity and Equity Related Securities Scheme shall invest
in Indian equitiesforeign equities and related instruments and debt securities
Parag Parikh Conservative Hybrid Fund
This product is suitable for investors who are seeking
Long term capital appreciation from the portion of equity investments under the scheme
Investors should consult their financial advisers if in doubt about whether the product
is suitable for them
To generate regular income through investments predominantly in debt and money market
instruments
Investors understand that their principalwill be at moderately high risk
Investors understand that their principalwill be at low risk
woL
High
tearedoM
Very High
ot woL
etaredoM
Moderately High
Low Very High
Parag Parikh Liquid Fund
This product is suitable for investors who are seeking
Investors should consult their financial advisers if in doubt about
whether the product is suitable for them
Income over short term
Investments in Debtmoney market instruments
Riskometer
Riskometer
Riskometer
Riskometer
Investors understand that their principalwill be at very high risk
woL
High
etaredoM
Very H
i gh
ot
woL
etaredoM
Moderately High
Low Very High
Investors should consult their financial advisers if in doubt about whether the product is suitable for them
Parag Parikh Flexi Cap Fund
Schemersquos Riskometer
woL
High
etaredoM
Very H
i gh
ot
woL
etaredoM
Moderately High
Low Very High
Benchmarkrsquos Riskometer (Nifty 500 TRI)
This Product is suitable for investors who are seeking
The investment objective of the Scheme
is to seek to generate long-term capital
growth from an actively managed portfolio
primarily of Equity and Equity Related
Securities Scheme shall invest in Indian
equities foreign equities and related
instruments and debt securities
Long term capital appreciation
Investment predominantly in equity
and equity related securities
Investors understand that their principalwill be at very high risk
woL
High
etaredoM
Very H
i gh
ot
woL
etaredoM
Moderately High
Low Very High
Investors should consult their financial advisers if in doubt about whether the product is suitable for them
Schemersquos Riskometer
woL
High
etaredoM
Very H
i gh
ot
woL
etaredoM
Moderately High
Low Very High
Benchmarkrsquos Riskometer (Nifty 500 TRI)
This Product is suitable for investors who are seeking
Investors should consult their financial advisers if in doubt about whether the product is suitable for them
Schemersquos RiskometerBenchmarkrsquos Riskometer
(CRISIL Hybrid 85+15 Conservative Index TRI)
This Product is suitable for investors who are seeking
To generate regular income through
investments predominantly in debt and
money market instruments
Long term capital appreciation from the portion of equity investments under the scheme Investors understand that their principal
will be at moderately high risk
Investors understand that their principalwill be at low to moderate risk
woL
High
etaredoM
Very H
i gh
ot
woL
etaredoM
Moderately High
Low Very High
Income over short term
Investments in Debtmoney
market instruments
Investors should consult their financial advisers if in doubt about whether the product is suitable for them
Schemersquos RiskometerBenchmarkrsquos Riskometer
(CRISIL Liquid Fund Index)
This Product is suitable for investors who are seeking
woL
High
etaredoM
Very H
i gh
ot
woL
etaredoM
Moderately High
Low Very High
Parag Parikh Tax Saver Fund
Parag Parikh Conservative Hybrid Fund
Parag Parikh Liquid Fund
There is no assurance that the investment objective of the Scheme will be realized and the scheme does not assure or guarantee any returns
REITs amp InvITs
Equity Investments
Fixed Income Investments
Asset allocation
Type of Instruments Normal Allocation ( of Net Assets) Risk Profile
DEBT
EQUITYREITs
InvITs
Parag Parikh Conservative Hybrid FundAn open-ended hybrid scheme investing predominantly in debt instruments
Debt and money market instruments
Equities and equity related instruments
REITsInvITs
Note
We recommend it to those
Investors should consult their financial advisers if in doubt about whether the product is suitable for them
Investment Team Details
Mr Raunak Onkar Mr Rajeev Thakkar Mr Raj Mehta
Your Distributor Financial Advisor will help you with the investing procedure
`
`
`
`
`
This product is suitable for investors who are seeking
Investors should consult their financial advisers if in doubt about whether the product is suitable for them Investors understand that their principal
will be at moderately high risk
Riskometer
Note
How to invest
Visit ---gt Distributors -----gt Create a foliowwwamcppfascom
Note Please visit the website address for latest Riskometer updates ----gt Statutory Disclosures ---gt Product Label of the Schemeshttpswwwamcppfascom
Note
PPFAS Asset Management Private Limited
MF Utilities
BSE Star MF
NSE
ICEX
Definitions
Fund Manager
This is the minimum investment amount for a new investor in a mutual fund scheme
Minimum additional amount This is the minimum investment amount for an existing investor in a mutual fund scheme
SIP
NAV
Benchmark
Entry Load
Exit Load
Standard Deviation
Sharpe Ratio
Beta
AUM
Holdings
Nature of Scheme
Portfolio Turnover Ratio
Yield to Maturity (YTM)
Modified Duration
Total Expense ratio
An employee of the asset management company such as a mutual fund or life insurer who manages investment of the scheme
He is usually part of a larger team of fund managers and research analysts
Application amount for fresh subscription
SIP or systematic investment plan work on the principle of making periodic investments of a fixed sum It works similar to a recurring
bank deposit For instance an investor may opt for an SIP that invests 500 every 15 ` th of the month in an equity fund for a period of three years
The NAV or the net asset value is the total asset value per unit of the mutual fund after deducting all related and permissible expenses The NAV
is calculated at the end of every business day It is the value at which the investor enters or exits the mutual fund
A group of securities usually a market index whose performance is used as a standard or benchmark to measure investment performance of
mutual funds among other investments Some typical benchmark include the Nifty Sensex BSE 200 BSE 500 10-year Gsec
A mutual fund may have a sales charge or load at the time of entry andor exit to compensate the distributoragent Entry load is charged at the
time an investor purchase the units of a mutual fund The entry load is added to the prevailing NAV at the time of investment For instance if the
NAV is ` 100 and the entry load is 1 the investor will enter the fund at Rs 101
Exit load is charged at the time of redeeming (or transferring an investment between schemes) The exit load percentage is deducted from the
NAV at the time of redemption (or transfer between schemes) This amount goes to the respective scheme and gets added to the AUM of that Scheme
Standard deviation is a statistical measure of the range of an investmentrsquos performance When a mutual fund Scheme has a high standard deviation its
range of performance is wide implying greater volatility
The Sharpe Ratio named after its founder the Nobel Laureate William Sharpe is a measure of risk-adjusted returns It is calculated using standard
deviation and excess return to determine reward per unit of risk
Beta is a measure of an investments volatility vis-a-vis the market Beta of less than 1 means that the security will be less volatile than the market
A beta of greater than 1 implies that the securitys price will be more volatile than the market
AUM or assets under management refers to the recent updated cumulative market value of investments managed by a mutual fund or any
investment firm
The holding or the portfolio is a mutual funds latest or updated reported statement of investmentssecurities These are usually displayed in term
of percentage to net assets or the rupee value or both The objective is to give investors an idea of where their money is being invested by the
fund manager
The investment objective and underlying investments determine the nature of the mutual fund scheme For instance a mutual fund that aims at
generating capital appreciation by investing in stock markets is an equity fund or growth fund Likewise a mutual fund that aims at capital
preservation by investing in debt markets is a debt fund or income fund Each of these categories may have sub-categories
A measure of how frequently assets within a fund are bought and sold by the managers Portfolio turnover is calculated by taking either the total
amount of new securities purchased or the amount of securities sold - whichever is less - over a particular period divided by the total net asset
value (NAV) of the fund The measurement is usually reported for a 12-month time period
The yield to maturity (YTM) of a bond or other fixed-interest security such as gilts is the (theoretical) internal rate of return (IRR overall interest rate) earned by an investor who buys the bond today at the market price assuming that the bond is held until maturity and that all coupon and principal payments are made on schedule
Modified duration is a formula that expresses the measurable change in the value of a security in response to a change in interest rates Modified duration follows the concept that interest rates and bond prices move in opposite directions
The total expense ratio (TER) is a measure of the total cost of a fund to the investor Total costs may include various fees (purchase redemption auditing) and other expenses The TER calculated by dividing the total annual cost by the fundstotal assets averaged over that year is denoted as a percentage
FACT SHEET - OCTOBER 2021
Toll Free 1800-266-7790 | Email mfppfascom
Call 1800-266-7790 (Toll Free) or 91-22-61406538 | E-Mail partnersppfascom
Registered Office 8182 8th Floor Sakhar Bhavan Ramnath Goenka Marg 230 Nariman Point Mumbai - 400 021 INDIA
Portfolio Disclosure
- Above figures are annualised- Risk free rate assumed to be 342 (FBIL Overnight MIBOR as on 29th Oct 2021)
Name of the fund Parag Parikh Flexi Cap Fund
Investment Objective
Type of the Scheme
Date of Allotment May 24 2013
Entry Load Not Applicable
Exit Load
Benchmark Index NIFTY 500 (TRI)
To seek to generate long-term capital growth from an actively managed portfolio primarily of Equity and Equity Related Securities Scheme shall invest in Indian equities foreign equities and related instruments and debt securities
An open ended dynamic Equity scheme investing across large cap mid cap small cap Stocks
Name of the Fund
Managers
Assets Under Management
(AUM) as on Oct 31 2021
` Crores1693115Average AUM
for the Month
` 1721955 Crores
Net Asset Value (NAV) as
on Oct 29 2021
Regular Plan 502712
Direct Plan 531438
2 for redemption within 365 days
1 for redemption between 366 - 730 days
Nil for redemption beyond 730 days
Month End Expense RatioRegular Plan 185
Direct Plan 083
Including additional expenses and GST on management fees Total Expense ratio is as on last business day of the month
Minimum
Application
Amount
New Purchase ` 1000 Additional Purchase ` 1000
Monthly SIP ` 1000Quarterly SIP ` 3000
Beta 072
1769
139
1756
2899
Standard Deviation
Sharpe Ratio
Portfolio Turnover (excl Equity Arbitrage)
Portfolio Turnover (incl Equity Arbitrage)
Mr Rajeev Thakkar - Equity Fund Manager (Since Inception)
Mr Raj Mehta - Debt Fund Manager (Since January 27 2016)
Mr Raunak Onkar - Fund Manager Dedicatedfor Overseas Securities (Since Inception)
Currency hedge to the extent of approximately 80 of exposure
^ Traded on US OTC Markets Underlying shares are listed on Tokyo Stock ExchangeIndustry Allocation
Load Structure
Quantitative Indicators
FACT SHEET - OCTOBER 2021
2
(Formerly known as Parag Parikh Long Term Equity Fund)
Core Equity
Name Industry of Net Assets
Overseas Securities IDRs and ADRs
Total 3131
Debt and Money Market Instruments
TREPS Including Cash amp Cash Equivalent and Net Current Asset
040FDR
251
Net Assets 10000
Parag Parikh Flexi Cap Fund
An open ended dynamic Equity scheme investing across large cap mid cap small cap stocks
Additional Benchmark NIFTY 50 (TRI)
Pioneer in international
investing
Alphabet Inc (Google Class A) Internet amp Technology
Microsoft Corporation Internet amp Technology
Meta Platforms Inc (Formerly Facebook Inc) Internet amp Technology
AMAZONCOM INC Consumer Services
Suzuki Motor Corp (ADR)^ Auto
No exit load will be charged in case of switch transactions between Regular Plan and Direct Plan of the Scheme for existing as well as prospective investors
Total 6578Arbitrage
Tata Motors Ltd
045
042
037
028
005
Bharti Airtel Ltd
Cipla Ltd
Kotak Mahindra Bank Ltd
Maruti Suzuki India Ltd
Tata Steel Ltd
089
Hedged by offsetting derivative position
Finance 845
ITC Ltd 741
Indian Energy Exchange Ltd Capital Markets 606
Auto 480
ICICI Bank Ltd Banks 476
Axis Bank Ltd Banks 458
HCL Technologies Ltd Software 451
Central Depository Services (I) Ltd Capital Markets 377
Power Grid Corporation of India Ltd Power 367
Persistent Systems Ltd Software 267
Software 264
Multi Commodity Exchange of India Ltd Capital Markets 247
HDFC Bank Ltd Banks 210
Auto Ancillaries 175
Oracle Financial Services Software Ltd Software 107
Capital Markets 094
ICRA Ltd Capital Markets 085
Sun Pharmaceutical Industries Ltd Pharmaceuticals 083
Pharmaceuticals 076
Pharmaceuticals 061
IPCA Laboratories Ltd Pharmaceuticals 059
Pharmaceuticals 049
911
781
725
601
113
Bajaj Holdings amp Investment Ltd
Consumer Non Durables
Hero MotoCorp Ltd
Mphasis Ltd
Balkrishna Industries Ltd
Motilal Oswal Financial Services Ltd
Cadila Healthcare Ltd
Dr Reddys Laboratories Ltd
Lupin Ltd
328Pharmaceuticals
2293Internet amp
Technology
593 Auto
741Consumer Non durables
1089Software
175Auto Ancillaries
291Debt and Money
Market Instruments
725Consumer Services
845Finance
1144Banks
1409Capital Markets
367Power
FACT SHEET - OCTOBER 2021
3
Note
Different plans shall have different expense structures
Scheme returns shown are for regular plan
Past performance may or may not be sustained in the future
Greater than 1 year returns are CAGR returns
Data presented here is upto the last calendar month
We have our Skin in the Game
Parag Parikh Flexi Cap Fund
An open ended dynamic Equity scheme investing across large cap mid cap small cap stocks
Since Inception (May 24 2013) 2109 1623 1515 50271 35566 32876
October 30 2020 to October 29 2021 (Last 1 year) 6160 5928 5372 16139 15908 15354
October 31 2018 to October 29 2021 (Last 3 year) 2988 2124 2082 21894 17812 17625
October 28 2016 to October 29 2021 (Last 5 year) 2178 1635 1681 26815 21335 21761
Since Inception fromJune 1 2013
October 30 2020 to October 29 2021 (Last 1 year)
October 31 2018 to October 29 2021 (Last 3 year)
October 28 2016 to October 29 2021 (Last 5 year)
Total Amount Invested
Market value of Investment (Regular Plan)
(Regular Plan) Returns (Annualised) ()
Nifty 500 (TRI) Returns (Annualised) ()
Nifty 50 (TRI) Returns (Annualised) ()
1020000 120000 360000 600000
2703388 153765 629577 1189292
2214 5661 4003 2781
1705 4454 3067 2055
1638 4083 2848 2032
Oct 30 2020 to Oct 29 2021Since Inception
CAGR Scheme 2109Nifty 5001623Nifty 50 1515
Scheme 6160 Nifty 500 5928Nifty 50 5372
PPFCF Returns Benchmark Returns (Nifty 500 (TRI)) Nifty 50 (TRI) Returns
PPFCF Vs Benchmark Indices
00
50
100
150
200
250
300
350
400
00
50
100
150
200
250
300
350
400
Oct
20
Nov2
0
Dec2
0
Jan21
Feb21
Mar
21
Apr2
1
May2
1
June21
July
21
Aug21
Sept2
1
Oct
20
Lumpsum Investment Performance (Compounded annual returns)
Scheme
PPFCF(Regular)
NIFTY 500(TRI)
NIFTY 50(TRI)
PPFCF
Additional Benchmark
(Regular)
NIFTY 50(TRI)
NIFTY 500(TRI)
The combined holding of Insiders in Parag Parikh Flexi Cap Fund amounts
to For more details ` 26068 Crores of AUM as at October 29 2021
Since inception returns are calculated on Rs 10 (allotment price)
Source Internal sources
Lumpsum Investment Performance (Compounded annual returns)
Scheme
PPFCF(Regular)
NIFTY 500(TRI)
NIFTY 50(TRI)
PPFCF
Additional Benchmark
(Regular)
NIFTY 50(TRI)
NIFTY 500(TRI)
PPFCF
(Direct)
PPFCF(Direct)
SIP Investment Performance (Assumption `10000- is invested on the first of every month)
Total Amount Invested
Market value of Investment (Regular Plan)
Market value of Investment (Direct Plan)
(Regular Plan) Returns (Annualised) ()
(Direct Plan) Returns (Annualised) ()
NIFTY 500 (TRI) Returns (Annualised) ()
NIFTY 50 Returns (Annualised) ()(TRI)
Since inception returns are calculated on Rs 10 (allotment price)
Since Inception (May 24 2013) 2109 1623 1515 50271 35566 32876
Oct 30 2020 to Oct 29 2021 (Last 1 year) 6160 5928 5372 16139 15908 15354
Oct 31 2018 to Oct 29 2021 (Last 3 year) 2988 2124 2082 21894 17812 17625
Oct 28 2016 to Oct 29 2021 (Last 5 year) 2178 1635 1681 26815 21335 21761
2189
6324
3105
2272
53144
16302
22492
27861
Since Inception fromJune 1 2013
October 30 2020 to October 29 2021 (Last 1 year)
October 31 2018 to October 29 2021 (Last 3 year)
October 28 2016 to October 29 2021 (Last 5 year)
1020000 120000 360000 600000
2703388 153765 629577 1189292
2214 5661 4003 2781
1705 4454 3067 2055
1638 4083 2848 2032
2808037
2299
154661
5821
639851
4130
1218403
2883
Total number of units held in Parag Parikh Flexi Cap Fund as per SEBI Circular relating to Alignment of interest of Key Employees (Designated Employees) of Asset Management Companies (AMCs) with the unitholders of the Mutual Fund Schemes (dated April 28 2021 read with September 20 2021) as at 31-10-2021
60568945Parag Parikh Flexi Cap Fund - Direct Plan
Scheme Units AUM (in Rs)
1139718
Portfolio Disclosure
- Above figures are annualised
- Since the fund has not completed 3 years other quantitative indicators are not
shown as per AMFI Best Practice Guidelines
Name of the fund Parag Parikh Tax Saver Fund
Investment Objective
Type of the Scheme
Date of Allotment July 24 2019
Benchmark Index NIFTY 500 (TRI)
To seek to generate long-term capital appreciation through a diversified portfolio of equity and equity related instruments
An open ended equity linked savings scheme with a statutory lock in of3 years and tax benefit
Name of the Fund
Managers
Assets Under Management
(AUM) as on Oct 31 2021
` 32589 CroresAverage AUM
for the Month
` 32383 Crores
Net Asset Value (NAV) as
on Oct 29 2021
Regular Plan 183787
Direct Plan 188982
Month End Expense RatioRegular Plan 228
Direct Plan 098
Including additional expenses and GST on management fees Total Expense ratio is as on last business day of the month
Minimum
Application
Amount
New Purchase ` 500 and in multiples of ` 500Additional Purchase ` 500 and in
Monthly SIP ` 1000Quarterly SIP ` 3000
Portfolio Turnover 479
Mr Rajeev Thakkar - Equity Fund Manager (Since Inception)
Mr Raj Mehta - Debt Fund Manager (Since Inception)
Mr Raunak Onkar - Co Fund Manager (Since Inception)
Industry Allocation
Entry Load Not Applicable
Not ApplicableExit Load
Load Structure
Quantitative Indicators
FACT SHEET - OCTOBER 2021
4
Core Equity
Name Industry of Net Assets
Net Assets 10000
Debt and Money Market Instruments
Total
TREPS Including Cash amp Cash Equivalent and Net Current Asset
1064Debt and Money MarketInstruments
8936
Additional Benchmark NIFTY 50 (TRI)
An open ended equity linked saving scheme with a statutory lock in of3 years and tax benefit
TA
X
Finance 899
ITC Ltd 760
Indian Energy Exchange Ltd Capital Markets 640
Auto 526
HCL Technologies Ltd Software 506
Software 504
Auto 504
Power Grid Corporation of India Ltd Power 500
ICICI Bank Ltd Banks 498
Software 495
Axis Bank Ltd Banks 472
Auto Ancillaries 349
Central Depository Services (I) Ltd Capital Markets 340
Persistent Systems Ltd Software 291
Multi Commodity Exchange of India Ltd Capital Markets 257
Software 252
HDFC Bank Ltd Banks 243
CCL Products (India) Ltd 207
ICRA Ltd Capital Markets 178
Capital Markets 102
Oracle Financial Services Software Ltd Software 102
Sun Pharmaceutical Industries Ltd Pharmaceuticals 085
Pharmaceuticals 079
Pharmaceuticals 063
Pharmaceuticals 058
IPCA Laboratories Ltd Pharmaceuticals 026
Bajaj Holdings amp Investment Ltd
Consumer Non Durables
Maruti Suzuki India Ltd
Tata Consultancy Services Ltd
Hero MotoCorp Ltd
Wipro Ltd
Balkrishna Industries Ltd
Mphasis Ltd
Consumer Non Durables
Motilal Oswal Financial Services Ltd
Cadila Healthcare Ltd
Dr Reddys Laboratories Ltd
Lupin Ltd
311Pharmaceuticals
1213Banks
2150Software
1030Auto
967Consumer Non Durables
1064Debt and Money Market Instruments
349Auto Ancillaries
899Finance
1517Capital Markets
500Power
FACT SHEET - OCTOBER 2021
5
Note
Different plans shall have different expense structures
Scheme returns shown are for regular plan
Past performance may or may not be sustained in the future
Data presented here is upto the last calendar month
We have our Skin in the Game
An open ended equity linked saving scheme with a statutory lock in of3 years and tax benefit
Total Amount Invested 280000 120000
Market value of Investment (Regular Plan) 432370 147224
(Regular Plan) Returns (Annualised) () 4061 4507
Nifty 500 (TRI) Returns (Annualised) () 3868 4454
Nifty 50 (TRI) Returns (Annualised) () 3543 4083
Since Inception from July 24 2019
October 30 2020 to October 29 2021 (Last 1 year)
SIP Investment Performance (Assumption ` 10000- is invested on the first of every month)
Since Inception (24 July 2019) 3077 2594 2333 18379 16875 16090
October 30 2020 to October 29 2021 (Last 1 year) 4959 5928 5372 14942 15908 15354
Since Inception (July 24 2019)
CAGR Scheme 3077Nifty 500 2594Nifty 50 2333
Scheme 4959 Nifty 500 5928Nifty 50 5372
PPTSF Returns Benchmark Returns (Nifty 500 (TRI)) Nifty 50 (TRI) Returns
PPTSF Vs Benchmark Indices
60
70
80
90
100
110
120
130
140
60
70
80
90
100
110
120
130
140
Jul1
9A
ug19
Sep 1
9O
ct19
Nov1
9D
ec1
9Ja
n20
Feb20
Mar2
0A
pr2
0M
ay2
0Ju
n20
Jul2
0A
ug20
Sep20
Oct
20
Nov2
0D
ec2
0Ja
n21
Feb21
Mar2
1A
pr2
1M
ay2
1Ju
ne21
July
21
Aug21
Sep21
Oct
21
Oct
20
Nov2
0
Dec2
0
Jan21
Feb21
Mar2
1
Apr2
1
May2
1
June21
July
21
Aug21
Sept2
1
Oct
21
Oct 30 2020 to Oct 29 2021
Date
Scheme Benchmark Value of Investment of Rs 10000-
PPTSF PPTSFNIFTY 500(TRI)
NIFTY 50(TRI)
NIFTY 500(TRI)
NIFTY 50(TRI)
Lumpsum Investment Performance (Compounded annual returns)
AdditionalBenchmark
(Regular) (Regular)
The combined holding of Insiders in Parag Parikh Tax Saver Fund amounts to `781 Crores of AUM as at October 29 2021 For more details
Since inception returns are calculated on Rs 10 (allotment price)
Source Internal sources
Total Amount Invested
Market value of Investment (Regular Plan)
Market value of Investment (Direct Plan)
(Regular Plan) Returns (Annualised) ()
(Direct Plan) Returns (Annualised) ()
NIFTY 500 (TRI) Returns (Annualised) ()
NIFTY 50 Returns (Annualised) ()(TRI)
SIP Investment Performance (Assumption `10000- is invested on the first of every month)
Date
Scheme Benchmark Value of Investment of Rs 10000-
PPTSF PPTSFNIFTY 500(TRI)
NIFTY 50(TRI)
NIFTY 500(TRI)
NIFTY 50(TRI)
Lumpsum Investment Performance (Compounded annual returns)
AdditionalBenchmark
(Regular) (Regular)PPTSF(Direct)
PPTSF(Direct)
Since Inception from July 24 2019
Since inception returns are calculated on Rs 10 (allotment price)
Since Inception (24 July 2019) 3077 2594 2333 18379 16875 16090
October 30 2020 to October 29 2021 (Last 1 year) 4959 5928 5372 14942 15908 15354
3239
5145
18898
15128
October 30 2020 to October 29 2021 (Last 1 year)
280000 120000
432370 147224
4061 4507
3868 4454
3543 4083
439490
4232
148284
4692
Total number of units held in Parag Parikh Tax Saver Fund as per SEBI Circular relating to Alignment of interest of Key Employees (Designated Employees) of Asset Management Companies (AMCs) with the unitholders of the Mutual Fund Schemes (dated April 28 2021 read with September 20 2021) as at 31-10-2021
1450059Parag Parikh Tax Saver Fund - Direct Plan
Scheme Units AUM (in Rs)
76730
Quantitative IndicatorsBeta069Standard Deviation0115Sharpe Ratio053Portfolio Turnover (excl Equity Arbitrage)01192Portfolio Turnover (incl Equity Arbitrage)18617
Portfolio DisclosureName of the fund Parag Parikh Conservative Hybrid Fund
Investment Objective
Type of the Scheme
Date of Allotment 26th May 2021
Benchmark Index CRISIL Hybrid 85+15 - Conservative Index TRI
CRISIL 10 year GILT Index
To generate regular income through investments predominantly in debt and money market instruments The Scheme also seeks to generate long term capital appreciation from the portion of equity investments under the scheme However there is no assurance or guarantee that the investment objective of the Scheme will be realized
An open ended hybrid scheme investing predominantly in debt instruments
Name of theFund Manager
Assets Under
Management (AUM) as onOct 31 2021
Average AUM
for the Month` 50489 Crores
Month End Expense Ratio
Regular Plan 060 Direct Plan 030
Including additional expenses and GST on management fees Total Expense ratio is as on last business day of the month
Additional Benchmark
Minimum
Application
Amount
Quantitive Indicators
Calculated on amount invest in debt securities (including accrued interest) deployment of funds in TREPS amp Reverse Repo and net receivablespayables^YTM is calculated on the basis of annualised yield for all securities
Average Maturity (Years) 643
49004
662
Modified Duration (Years)
Yield to Maturity^
Macaulay duration 50649
Entry Load Not Applicable
Exit Load
Load Structure
FACT SHEET - OCTOBER 2021
Name of Net Assets
Net Assets 10000
6
` 53557 Crores
REITsInvITs Parag Parikh Conservative Hybrid Fund
An open-ended hybrid scheme investing predominantly in debt instruments
DEBT
EQUITYREITs
InvITs
Equity and Equity Related Instruments
770 India Grid Trust 06-May-2028 094b) Government Securities
Units issued by REITs amp InvITsListed awaiting listing on the stock exchanges
Brookfield India REIT
Embassy Office Parks REIT
Mindspace Business Parks REIT
Debt and Money Market Instruments
Name of Net AssetsRatinga)CorporateBondNCD
c) TREPS and Other Receivables and Payables
TREPS Including Cash amp Cash Equivalent and Net Current Asset 186
d) Fixed Deposits
Mr Rajeev Thakkar - Equity Fund Manager (Since Inception)
Mr Raj Mehta - Debt Fund Manager (Since Inception)
Mr Raunak Onkar - Equity Fund Manager (Since Inception)
Net Asset Value (NAV) as
on Oct 29 2021
Regular Plan 103857
Direct Plan 103992
New Purchase 5000 and in multiples of 1 ` `thereafter
Additional Purchase 1000 and in multiples of 1 ` `thereafter
Monthly SIP 1000 and Quarterly SIP 3000` `
10 of the units (ldquothe limitrdquo) may be redeemed without any exit load from the date of allotment1 for redemption within 1 Year and Nil for redemption beyond 1 Year from the date of allotment
CRISIL AAA
1226Sub total
085Sub total
916Sub total
Industry
Name of Net AssetsIndustry
Construction
Construction
Construction
7493Sub total
418
250
248
490 HDFC Bank Ltd (Duration 365 Days) 028
490 HDFC Bank Ltd (Duration 368 Days) 019490 HDFC Bank Ltd (Duration 365 Days) 019
510 Axis Bank Ltd (Duration 367 Days) 019
Power Grid Corporation of India Ltd Power 247
Auto 247Gas 246
Coal India Ltd MineralsMining 243
ITC Ltd 243
563 Government of India 12-Apr-2026 Sovereign 093
Bajaj Auto Ltd
Petronet LNG Ltd
Consumer Non Durables
DEBT
EQUITYREITs
InvITs
Sovereign
Sovereign
834 State Government of Punjab 30-May-2028
808 State Government of Maharashtra 26-Dec-2028
843 State Government of Goa 13-Mar-2029
816 State Government of Rajasthan 09-May-2028
800 State Government of Kerala 11-Apr-2028
792 State Government of Uttar Pradesh 24-Jan-2028
699 State Government of Telangana 10-Jun-2028
788 State Government of Madhya Pradesh 24-Jan-2028
842 State Government of Madhya Pradesh 08-Aug-2028
799 State Government of Punjab 11-Apr-2028
828 State Government of Gujarat 20-Feb-2029
828 State Government of Gujarat 23-Jan-2029
809 State Government of West Bengal 27-Mar-2028
797 State Government of Assam 18-Apr-2028
845 State Government of Uttar Pradesh 27-Feb-2029
808 State Government of Tamil Nadu 26-Dec-2028
815 State Government of Tamil Nadu 09-May-2028
820 State Government of Uttarakhand 09-May-2028
698 State Government of Telangana 22-Apr-2028
865 State Government of Rajasthan 03-Oct-2028
863 State Government of Rajasthan 03-Sep-2028
849 State Government of Uttarakhand 21-Aug-2028
843 State Government of Uttar Pradesh 06-Mar-2029
845 State Government of Uttar Pradesh 27-Jun-2028
841 State Government of Kerala 06-Jun-2028
834 State Government of Tamil Nadu 28-Feb-2028
833 State Government of Kerala 30-May-2028
825 State Government of Tamil Nadu 02-Jan-2029
829 State Government of Haryana 14-Mar-2028
820 State Government of Jammu and Kashmir 30-Jan-2029
813 State Government of Rajasthan 27-Mar-2028
811 State Government of Chhattisgarh 31-Jan-2028
805 State Government of Tamil Nadu 18-Apr-2028
798 State Government of Uttar Pradesh 11-Apr-2028
786 State Government of Haryana 27-Dec-2027
765 State Government of Karnataka 06-Dec-2027
753 State Government of West Bengal 22-Nov-2027
709 State Government of Goa 28-Aug-2029
679 State Government of West Bengal 30-Jun-2028
711 State Government of Tamil Nadu 31-Jul-2029
713 State Government of Kerala 10-Jul-2029
653 State Government of Chhattisgarh 15-Sep-2028
Sovereign
Sovereign
Sovereign
Sovereign
Sovereign
Sovereign
Sovereign
Sovereign
Sovereign
Sovereign
Sovereign
Sovereign
Sovereign
Sovereign
Sovereign
Sovereign
Sovereign
Sovereign
Sovereign
Sovereign
Sovereign
Sovereign
Sovereign
Sovereign
Sovereign
Sovereign
Sovereign
Sovereign
Sovereign
Sovereign
Sovereign
Sovereign
Sovereign
Sovereign
Sovereign
Sovereign
Sovereign
Sovereign
Sovereign
Sovereign
504
500
499
477
398
307
305
303
205
205
202
202
202
200
190
104
103
103
102
102
102
102
102
102
102
102
101
101
101
101
101
101
100
100
100
099
098
095
095
095
094
093
Asset Allocation by Asset Class Asset Allocation by Rating
We have our Skin in the Game
The combined holding of Insiders in Parag Parikh Conservative Hybrid
Fund amounts to For more ` 573 Crores of AUM as at October 29 2021
details please
7
REITsInvITs
Equity
Debt
FACT SHEET - OCTOBER 2021
REITsInvITs
Parag Parikh Conservative Hybrid Fund
An open-ended hybrid scheme investing predominantly in debt instruments
Source Internal sources Source Internal sources
Dividend History - Monthly Income Distribution cum capital Withdrawal option
Record datePayout Date
DirectRetail RetailCorporate Corporate
Regular
30th Aug 2021 01124 01067
Face ValueRegular
10 100100
NAV per Unit (Ex IDCW)
01124 01067
DirectNAV per Unit (Ex IDCW)
100100
RegularNAV per Unit (Cum IDCW)
101167
DirectNAV per Unit (Cum IDCW)
101224
27th Sept 2021 00680 00680 00667 00667 10 101335 101343 102002 102023
7493G sec and SDL
1226Equity and Equity
Related Instruments
271TREPS Fixed Deposit
Net receivables amp Payables and
Net Current Asset094
Corporate Bond
916REITs and InvITs
271TREPS Fixed Deposit and
Net Receivables amp Payables
916REITs and InvITs
7493Sovereign
094AAA
1226Equity and Equity
Related Instruments
Total number of units held in Parag Parikh Conservative Hybrid Fund as per SEBI Circular relating to Alignment of interest of Key Employees (Designated Employees) of Asset Management Companies (AMCs) with the unitholders of the Mutual Fund Schemes (dated April 28 2021 read with September 20 2021) as at 31-10-2021
1965767Parag Parikh Conservative Hybrid Fund - Direct Plan Growth
Scheme Units AUM (in Rs)
194077
th25 Oct 2021 00597 00597 00340 00340 10 101762 101541 102102 102138
Quantitative IndicatorsBeta069Standard Deviation0115Sharpe Ratio053Portfolio Turnover (excl Equity Arbitrage)01192Portfolio Turnover (incl Equity Arbitrage)18617
Portfolio DisclosureName of the fund Parag Parikh Liquid Fund
Investment Objective
Type of the Scheme
Date of Allotment May 11 2018
Benchmark Index CRISIL Liquid fund index
CRISIL 1 Year T-Bill index
To deliver reasonable market related returns with lower risk and high liquidity through judicious investments in money market and debt instruments (Non Guaranteed)
An Open-ended Liquid Scheme
Name of theFund Manager
Mr Raj Mehta
(Since Inception)
Assets Under
Management (AUM) as onOct 31 2021
Average AUM
for the Month` 48 Crores1501
Month End Expense Ratio
Regular Plan 026 Direct Plan 016
Including additional expenses and GST on management fees Total Expense ratio is as on last business day of the month
Additional Benchmark
Minimum
Application
Amount
New Purchase ` 5000
Additional Purchase ` 1000
Monthly SIP ` 1000
NAV Details
Plan
Growth
Daily Reinvestment of Income Distributioncum capital withdrawal option
Weekly Reinvestment of Income Distribution cum capital withdrawal option
Monthly Income Distribution cum capital withdrawal option
Direct Regular
Quantitive Indicators
Computed on the invested amount
Average Maturity (Days) 4274
01106
34460
Modified duration (Years)
Yield to Maturity
Macaulay Duration (Years) 01145
Entry Load Not Applicable
For purpose of levying exit load if subscription (application amp funds) is received
within cut-off time on a day Day 1 shall be considered to be the same day else the
day after the date of allotment of units shall be considered as Day 1
Day of redemption switch from the date
of applicable NAV
Day 1 00070
Day 2 00065
Day 3 00060
Day 4 00055
Day 5 00050
Day 6 00045
Day 7 onwards 00000
Exit load as a ofredemption
switch proceeds
Exit Load
Load Structure
FACT SHEET - OCTOBER 2021
a) Debt and Money Market Instruments
Name Rating of Net AssetsSovereign
Sovereign
Sovereign
Sovereign
Sovereign
Sovereign
Sovereign
Sovereign
Sovereign
Sovereign
b) Government Securities
e) Fixed Deposits
Net Assets 10000
d) TREPS and Other Receivables and Payables
TREPS Including Net ReceivablesPayables and Net Current Asset 475
FDR 057
11745668 11703612
Sovereign
10005404
10014319
10034328
10005404
10014154
10034163
8
Sovereign
` 01 Crores1495
Sovereign
879 Government of India 08-Nov-2021 937Sovereign
Dividend History - Monthly Income Distribution cum capital Withdrawal option
Record datePayout Date
DirectRetail RetailCorporate Corporate
Regular
30th Aug 2021 ` 31956 ` 30988
Face Value
1000
Regular
10030000` 31956 ` 30988
NAV per Unit (Ex IDCW)
Direct
NAV per Unit (Ex IDCW)
10030000
Regular
NAV per Unit (Cum IDCW)
10060988
Direct
NAV per Unit (Cum IDCW)
10061956
27th Sept 2021 ` 22916 ` 22147 1000` 22916 ` 22147 10030000 10030000 10052147 10052916
Quarterly SIP ` 3000-
Dividend History - Monthly Income Distribution cum capital Withdrawal option
Record datePayout Date
DirectRetail RetailCorporate Corporate
Regular
c) Commercial Paper
d) Certificate of Deposit
National Bank for Agriculture and Rural Development 10-Jun-2021
A1+ 077Axis Bank Ltd 10-Jun-2021
A1+ 077
A1+ 036
28th June 2021 ` 248 ` 24` 248 ` 24
National Bank for Agriculture and Rural Development 31-Aug-2021
26th July 2021 ` 254 ` 246` 254 ` 246
30th Aug 2021 ` 319 ` 309` 319 ` 309
Face Value
1000
1000
1000
Prevailing NAV
10060034
10053757
10053176
91 DAY T-BILL 13-Jan-2022 830
91 DAY T-BILL 20-Jan-2022 830
91 DAY T-BILL 04-Nov-2021 669
182 DAY T-BILL 18-Nov-2021 668
182 DAY T-BILL 25-Nov-2021 667
91 DAY T-BILL 02-Dec-2021 667
182 DAY T-BILL 09-Dec-2021 667
182 DAY T-BILL 16-Dec-2021 666
91 DAY T-BILL 23-Dec-2021 666
182 DAY T-BILL 30-Dec-2021 665
91 DAY T-BILL 06-Jan-2022 665
182 DAY T-BILL 23-Dec-2021 333
182 DAY T-BILL 02-Dec-2021 267
870 State Government of Kerala 25-Jan-2022
c) State Government Securities
271Sovereign
th25 Oct 2021 ` 24257 ` 23485 1000` 24257 ` 23485 10030000 10030000 10053485 10054257
Note
Different plans shall have different expense structures
Scheme returns shown are for regular plan
Past performance may or may not be sustained in the future
Greater than 1 year returns are CAGR returns
Data presented here is upto the last calendar month
We have our Skin in the Game
Asset Allocation by Asset Class Asset Allocation by Rating
FACT SHEET - OCTOBER 2021
Less than 1 year returns are simple annualised returns
The combined holding of Insiders in Parag Parikh Liquid Fund amounts to
` 4495 Crores of AUM as at October 29 2021 For more details please
9
Source Internal sources Source Internal sources
Date
Scheme Benchmark Additional Benchmark Value of Investment of Rs 10000-
CRISIL 1 year T-bill Index
557 602
285 -058
291 060
335 143
355 351
PPLF (Regular)
CRISIL Liquid Fund Index
PPLF (Regular)
CRISIL Liquid Fund Index
CRISIL 1 year T-bill Index
Lumpsum Investment Performance (Compounded annual returns)
11704
10005
10013
10026
10305
12075 12254
10005 9999
10014 10003
10028 10012
10357 10353
524 601 11365 11658 11915
Since inception returns are calculated on Rs 1000 (allotment price)
463
266
272
303
303
435
Since Inception (11 May 2018)
October 24 2021 to October 31 2021 (Last 7 Days)
October 14 2021 to October 31 2021 (Last 15 days)
September 30 2021 to October 31 2021 (Last 1 Month)
October 29 2020 to October 31 2021 (Last 1 year)
October 31 2018 to October 31 2021 (Last 3 year)
Date
Scheme Benchmark Additional Benchmark Value of Investment of Rs 10000-
CRISIL 1 year T-bill Index
PPLF (Regular)
PPLF (Direct)
PPLF (Direct)
CRISIL Liquid Fund Index
PPLF (Regular)
CRISIL Liquid Fund Index
CRISIL 1 year T-bill Index
Lumpsum Investment Performance (Compounded annual returns)
Since inception returns are calculated on Rs 1000 (allotment price)
557 602
285 -058
291 060
335 143
355 351
11704
10005
10013
10026
10305
12075 12254
10005 9999
10014 10003
10028 10012
10357 10353
524 601 11365 11658 11915
463
266
272
303
303
435
Since Inception (11 May 2018)
Oct 24 2021 to Oct 31 2021 (Last 7 Days)
Oct 14 2021 to Oct 31 2021 (Last 15 days)
Sept 30 2021 to Oct 31 2021 (Last 1 Month)
Oct 29 2020 to Oct 31 2021 (Last 1 year)
Oct 31 2018 to Oct 31 2021 (Last 3 year)
474
276
282
313
314
446
11746
10005
10013
10027
10315
11400
8260Treasury Bills
1208G Sec
532TREPS Fixed Deposit
Net receivables amp Payables and
Net Current Asset
9468Sovereign
532TREPS Fixed Deposit and
Net Receivables amp Payables
Sovereign
A1+
TREPS Fixed Deposit and Net receivables amp Payables
Total number of units held in Parag Parikh Liquid Fund as per SEBI Circular relating to Alignment of interest of Key Employees (Designated Employees) of Asset Management Companies (AMCs) with the unitholders of the Mutual Fund Schemes (dated April 28 2021 read with September 20 2021) as at 31-10-2021
5425534Parag Parikh Liquid Fund Direct Plan Growth
Scheme Units AUM (in Rs)
4620
FACT SHEET - OCTOBER 2021
10
Scheme Date of Allotment Date
Value of investment of Rs 10000-
NIFTY 500 (TRI) NIFTY 50 (TRI) NIFTY 500 (TRI)
th24 May 2013
Since Inception 2109 1623 1515 50271 35566 32876
1 Year 6160 5928 5372 16139 15908 15354
3 Year 2988 2124 2082 21894 17812 17625
5 Year 2178 1635 1681 26815 21335 21761
th24 July 2019
Since Inception 3077 2594 2333 18379 16875 16090
1 Year 4959 5928 5372 14942 15908 15354
3 Year NA NA NA NA NA NA
5 Year NA NA NA NA NA NA
Scheme Return
Benchmark Return ()
Additional Benchmark Return
()
Scheme Return (Rs)
NIFTY 50 (TRI)
Parag Parikh
Flexi Cap
Fund
Parag Parikh
Tax Saver
Fund
Fund Manager Name Mr Rajeev Thakkar
Mr Rajeev Thakkar Manages two schemes of PPFAS Mutual Fund
Fund Manager Name Mr Raunak Onkar
Mr Raunak Onkar Manages two schemes of PPFAS Mutual Fund
Fund Manager Name Mr Raj Mehta
Mr Raj Mehta Manages three schemes of PPFAS Mutual Fund
Scheme Date of Allotment Date
Value of investment of Rs 10000-
CRISIL Liquid Fund Index
th11 May 2018
Since Inception 463 557 602 11704 12075 12254
1 Year 303 355 351 10305 10357 10353
3 Year 435 524 601 11365 11658 11915
5 Year NA NA NA NA NA NA
Scheme Return
Benchmark Return ()
Additional Benchmark Return
()
Crisil Liquid Fund Index
CRISIL 1 year T-bill
IndexScheme Return
(Rs) CRISIL 1 Year
T-bill Index
Parag ParikhLiquid Fund
Since inception returns are calculated on Rs 10 (allotment price)
Since inception returns are calculated on Rs 1000 (allotment price)
Past Performance may or may not be sustained in future
The performance details provided herein are of regular plan growth option Regular and Direct Plans have different expense structure
Direct Plan shall have a lower expense ratio excluding distribution expenses commission expenses etc
All 3 Fund Managers also manage Parag Parikh Conservative Hybrid Fund since May 28 2021 However performance of the scheme
has not been included because It has not yet completed six months duration since inception
Scheme Date of Allotment Date
Value of investment of Rs 10000-
NIFTY 500 (TRI) NIFTY 50 (TRI) NIFTY 500 (TRI)
th24 May 2013
Since Inception 2109 1623 1515 50271 35566 32876
1 Year 6160 5928 5372 16139 15908 15354
3 Year 2988 2124 2082 21894 17812 17625
5 Year 2178 1635 1681 26815 21335 21761
th24 July 2019
Since Inception 3077 2594 2333 18379 16875 16090
1 Year 4959 5928 5372 14942 15908 15354
3 Year NA NA NA NA NA NA
5 Year NA NA NA NA NA NA
Scheme Return
Benchmark Return ()
Additional Benchmark Return
()
Scheme Return (Rs)
NIFTY 50 (TRI)
Parag Parikh
Flexi Cap
Fund
Parag Parikh
Tax Saver
Fund
Scheme Date of Allotment Date
Value of investment of Rs 10000-
NIFTY 500 (TRI) NIFTY 50 (TRI) NIFTY 500 (TRI)
th24 May 2013
Since Inception 2109 1623 1515 50271 35566 32876
1 Year 6160 5928 5372 16139 15908 15354
3 Year 2988 2124 2082 21894 17812 17625
5 Year 2178 1635 1681 26815 21335 21761
th24 July 2019
Since Inception 3077 2594 2333 18379 16875 16090
1 Year 4959 5928 5372 14942 15908 15354
3 Year NA NA NA NA NA NA
5 Year NA NA NA NA NA NA
Scheme Return
Benchmark Return ()
Additional Benchmark Return
()
Scheme Return (Rs)
NIFTY 50 (TRI)
Parag Parikh
Flexi Cap
Fund
Parag Parikh
Tax Saver
Fund
FACT SHEET - OCTOBER 2021
11
Parag Parikh Flexi Cap Fund
Investors understand that their principalwill be at very high risk
woL
High
tearedoM
Very High
ot woL
etaredoM
Moderately High
Low Very High
Investors should consult their financial advisers if in doubt about whether the
product is suitable for them
Parag Parikh Tax Saver Fund
Investors understand that their principalwill be at very high risk
woL
High
tearedoM
Very High
ot woL
etaredoM
Moderately High
Low Very HighInvestors should consult their financial advisers if in doubt about whether the product is suitable for them
This product is suitable for investors who are seeking
Long term capital appreciation
Investment predominantly in equity and equity related securities
This Product is suitable for investors who are seeking
The investment objective of the Scheme is to seek to generate long-term capital growth from an
actively managed portfolio primarily of Equity and Equity Related Securities Scheme shall invest
in Indian equitiesforeign equities and related instruments and debt securities
Parag Parikh Conservative Hybrid Fund
This product is suitable for investors who are seeking
Long term capital appreciation from the portion of equity investments under the scheme
Investors should consult their financial advisers if in doubt about whether the product
is suitable for them
To generate regular income through investments predominantly in debt and money market
instruments
Investors understand that their principalwill be at moderately high risk
Investors understand that their principalwill be at low risk
woL
High
tearedoM
Very High
ot woL
etaredoM
Moderately High
Low Very High
Parag Parikh Liquid Fund
This product is suitable for investors who are seeking
Investors should consult their financial advisers if in doubt about
whether the product is suitable for them
Income over short term
Investments in Debtmoney market instruments
Riskometer
Riskometer
Riskometer
Riskometer
Investors understand that their principalwill be at very high risk
woL
High
etaredoM
Very H
i gh
ot
woL
etaredoM
Moderately High
Low Very High
Investors should consult their financial advisers if in doubt about whether the product is suitable for them
Parag Parikh Flexi Cap Fund
Schemersquos Riskometer
woL
High
etaredoM
Very H
i gh
ot
woL
etaredoM
Moderately High
Low Very High
Benchmarkrsquos Riskometer (Nifty 500 TRI)
This Product is suitable for investors who are seeking
The investment objective of the Scheme
is to seek to generate long-term capital
growth from an actively managed portfolio
primarily of Equity and Equity Related
Securities Scheme shall invest in Indian
equities foreign equities and related
instruments and debt securities
Long term capital appreciation
Investment predominantly in equity
and equity related securities
Investors understand that their principalwill be at very high risk
woL
High
etaredoM
Very H
i gh
ot
woL
etaredoM
Moderately High
Low Very High
Investors should consult their financial advisers if in doubt about whether the product is suitable for them
Schemersquos Riskometer
woL
High
etaredoM
Very H
i gh
ot
woL
etaredoM
Moderately High
Low Very High
Benchmarkrsquos Riskometer (Nifty 500 TRI)
This Product is suitable for investors who are seeking
Investors should consult their financial advisers if in doubt about whether the product is suitable for them
Schemersquos RiskometerBenchmarkrsquos Riskometer
(CRISIL Hybrid 85+15 Conservative Index TRI)
This Product is suitable for investors who are seeking
To generate regular income through
investments predominantly in debt and
money market instruments
Long term capital appreciation from the portion of equity investments under the scheme Investors understand that their principal
will be at moderately high risk
Investors understand that their principalwill be at low to moderate risk
woL
High
etaredoM
Very H
i gh
ot
woL
etaredoM
Moderately High
Low Very High
Income over short term
Investments in Debtmoney
market instruments
Investors should consult their financial advisers if in doubt about whether the product is suitable for them
Schemersquos RiskometerBenchmarkrsquos Riskometer
(CRISIL Liquid Fund Index)
This Product is suitable for investors who are seeking
woL
High
etaredoM
Very H
i gh
ot
woL
etaredoM
Moderately High
Low Very High
Parag Parikh Tax Saver Fund
Parag Parikh Conservative Hybrid Fund
Parag Parikh Liquid Fund
There is no assurance that the investment objective of the Scheme will be realized and the scheme does not assure or guarantee any returns
REITs amp InvITs
Equity Investments
Fixed Income Investments
Asset allocation
Type of Instruments Normal Allocation ( of Net Assets) Risk Profile
DEBT
EQUITYREITs
InvITs
Parag Parikh Conservative Hybrid FundAn open-ended hybrid scheme investing predominantly in debt instruments
Debt and money market instruments
Equities and equity related instruments
REITsInvITs
Note
We recommend it to those
Investors should consult their financial advisers if in doubt about whether the product is suitable for them
Investment Team Details
Mr Raunak Onkar Mr Rajeev Thakkar Mr Raj Mehta
Your Distributor Financial Advisor will help you with the investing procedure
`
`
`
`
`
This product is suitable for investors who are seeking
Investors should consult their financial advisers if in doubt about whether the product is suitable for them Investors understand that their principal
will be at moderately high risk
Riskometer
Note
How to invest
Visit ---gt Distributors -----gt Create a foliowwwamcppfascom
Note Please visit the website address for latest Riskometer updates ----gt Statutory Disclosures ---gt Product Label of the Schemeshttpswwwamcppfascom
Note
PPFAS Asset Management Private Limited
MF Utilities
BSE Star MF
NSE
ICEX
Definitions
Fund Manager
This is the minimum investment amount for a new investor in a mutual fund scheme
Minimum additional amount This is the minimum investment amount for an existing investor in a mutual fund scheme
SIP
NAV
Benchmark
Entry Load
Exit Load
Standard Deviation
Sharpe Ratio
Beta
AUM
Holdings
Nature of Scheme
Portfolio Turnover Ratio
Yield to Maturity (YTM)
Modified Duration
Total Expense ratio
An employee of the asset management company such as a mutual fund or life insurer who manages investment of the scheme
He is usually part of a larger team of fund managers and research analysts
Application amount for fresh subscription
SIP or systematic investment plan work on the principle of making periodic investments of a fixed sum It works similar to a recurring
bank deposit For instance an investor may opt for an SIP that invests 500 every 15 ` th of the month in an equity fund for a period of three years
The NAV or the net asset value is the total asset value per unit of the mutual fund after deducting all related and permissible expenses The NAV
is calculated at the end of every business day It is the value at which the investor enters or exits the mutual fund
A group of securities usually a market index whose performance is used as a standard or benchmark to measure investment performance of
mutual funds among other investments Some typical benchmark include the Nifty Sensex BSE 200 BSE 500 10-year Gsec
A mutual fund may have a sales charge or load at the time of entry andor exit to compensate the distributoragent Entry load is charged at the
time an investor purchase the units of a mutual fund The entry load is added to the prevailing NAV at the time of investment For instance if the
NAV is ` 100 and the entry load is 1 the investor will enter the fund at Rs 101
Exit load is charged at the time of redeeming (or transferring an investment between schemes) The exit load percentage is deducted from the
NAV at the time of redemption (or transfer between schemes) This amount goes to the respective scheme and gets added to the AUM of that Scheme
Standard deviation is a statistical measure of the range of an investmentrsquos performance When a mutual fund Scheme has a high standard deviation its
range of performance is wide implying greater volatility
The Sharpe Ratio named after its founder the Nobel Laureate William Sharpe is a measure of risk-adjusted returns It is calculated using standard
deviation and excess return to determine reward per unit of risk
Beta is a measure of an investments volatility vis-a-vis the market Beta of less than 1 means that the security will be less volatile than the market
A beta of greater than 1 implies that the securitys price will be more volatile than the market
AUM or assets under management refers to the recent updated cumulative market value of investments managed by a mutual fund or any
investment firm
The holding or the portfolio is a mutual funds latest or updated reported statement of investmentssecurities These are usually displayed in term
of percentage to net assets or the rupee value or both The objective is to give investors an idea of where their money is being invested by the
fund manager
The investment objective and underlying investments determine the nature of the mutual fund scheme For instance a mutual fund that aims at
generating capital appreciation by investing in stock markets is an equity fund or growth fund Likewise a mutual fund that aims at capital
preservation by investing in debt markets is a debt fund or income fund Each of these categories may have sub-categories
A measure of how frequently assets within a fund are bought and sold by the managers Portfolio turnover is calculated by taking either the total
amount of new securities purchased or the amount of securities sold - whichever is less - over a particular period divided by the total net asset
value (NAV) of the fund The measurement is usually reported for a 12-month time period
The yield to maturity (YTM) of a bond or other fixed-interest security such as gilts is the (theoretical) internal rate of return (IRR overall interest rate) earned by an investor who buys the bond today at the market price assuming that the bond is held until maturity and that all coupon and principal payments are made on schedule
Modified duration is a formula that expresses the measurable change in the value of a security in response to a change in interest rates Modified duration follows the concept that interest rates and bond prices move in opposite directions
The total expense ratio (TER) is a measure of the total cost of a fund to the investor Total costs may include various fees (purchase redemption auditing) and other expenses The TER calculated by dividing the total annual cost by the fundstotal assets averaged over that year is denoted as a percentage
FACT SHEET - OCTOBER 2021
Toll Free 1800-266-7790 | Email mfppfascom
Call 1800-266-7790 (Toll Free) or 91-22-61406538 | E-Mail partnersppfascom
Registered Office 8182 8th Floor Sakhar Bhavan Ramnath Goenka Marg 230 Nariman Point Mumbai - 400 021 INDIA
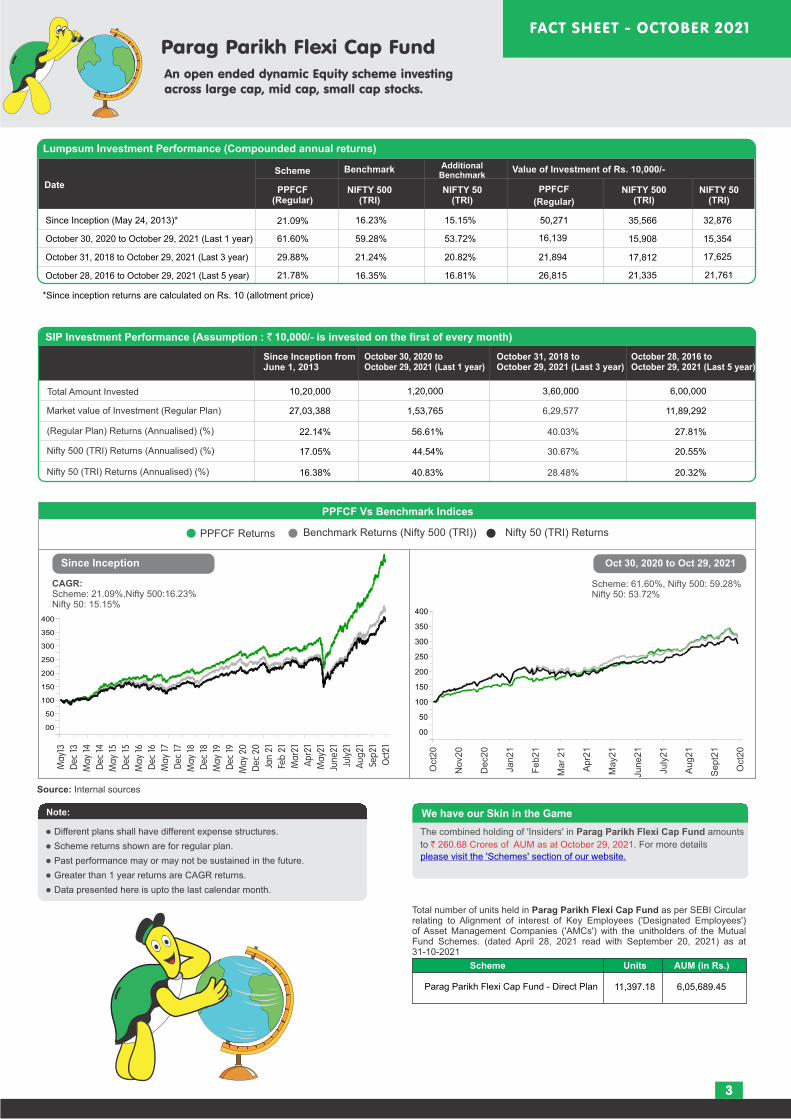
FACT SHEET - OCTOBER 2021
3
Note
Different plans shall have different expense structures
Scheme returns shown are for regular plan
Past performance may or may not be sustained in the future
Greater than 1 year returns are CAGR returns
Data presented here is upto the last calendar month
We have our Skin in the Game
Parag Parikh Flexi Cap Fund
An open ended dynamic Equity scheme investing across large cap mid cap small cap stocks
Since Inception (May 24 2013) 2109 1623 1515 50271 35566 32876
October 30 2020 to October 29 2021 (Last 1 year) 6160 5928 5372 16139 15908 15354
October 31 2018 to October 29 2021 (Last 3 year) 2988 2124 2082 21894 17812 17625
October 28 2016 to October 29 2021 (Last 5 year) 2178 1635 1681 26815 21335 21761
Since Inception fromJune 1 2013
October 30 2020 to October 29 2021 (Last 1 year)
October 31 2018 to October 29 2021 (Last 3 year)
October 28 2016 to October 29 2021 (Last 5 year)
Total Amount Invested
Market value of Investment (Regular Plan)
(Regular Plan) Returns (Annualised) ()
Nifty 500 (TRI) Returns (Annualised) ()
Nifty 50 (TRI) Returns (Annualised) ()
1020000 120000 360000 600000
2703388 153765 629577 1189292
2214 5661 4003 2781
1705 4454 3067 2055
1638 4083 2848 2032
Oct 30 2020 to Oct 29 2021Since Inception
CAGR Scheme 2109Nifty 5001623Nifty 50 1515
Scheme 6160 Nifty 500 5928Nifty 50 5372
PPFCF Returns Benchmark Returns (Nifty 500 (TRI)) Nifty 50 (TRI) Returns
PPFCF Vs Benchmark Indices
00
50
100
150
200
250
300
350
400
00
50
100
150
200
250
300
350
400
Oct
20
Nov2
0
Dec2
0
Jan21
Feb21
Mar
21
Apr2
1
May2
1
June21
July
21
Aug21
Sept2
1
Oct
20
Lumpsum Investment Performance (Compounded annual returns)
Scheme
PPFCF(Regular)
NIFTY 500(TRI)
NIFTY 50(TRI)
PPFCF
Additional Benchmark
(Regular)
NIFTY 50(TRI)
NIFTY 500(TRI)
The combined holding of Insiders in Parag Parikh Flexi Cap Fund amounts
to For more details ` 26068 Crores of AUM as at October 29 2021
Since inception returns are calculated on Rs 10 (allotment price)
Source Internal sources
Lumpsum Investment Performance (Compounded annual returns)
Scheme
PPFCF(Regular)
NIFTY 500(TRI)
NIFTY 50(TRI)
PPFCF
Additional Benchmark
(Regular)
NIFTY 50(TRI)
NIFTY 500(TRI)
PPFCF
(Direct)
PPFCF(Direct)
SIP Investment Performance (Assumption `10000- is invested on the first of every month)
Total Amount Invested
Market value of Investment (Regular Plan)
Market value of Investment (Direct Plan)
(Regular Plan) Returns (Annualised) ()
(Direct Plan) Returns (Annualised) ()
NIFTY 500 (TRI) Returns (Annualised) ()
NIFTY 50 Returns (Annualised) ()(TRI)
Since inception returns are calculated on Rs 10 (allotment price)
Since Inception (May 24 2013) 2109 1623 1515 50271 35566 32876
Oct 30 2020 to Oct 29 2021 (Last 1 year) 6160 5928 5372 16139 15908 15354
Oct 31 2018 to Oct 29 2021 (Last 3 year) 2988 2124 2082 21894 17812 17625
Oct 28 2016 to Oct 29 2021 (Last 5 year) 2178 1635 1681 26815 21335 21761
2189
6324
3105
2272
53144
16302
22492
27861
Since Inception fromJune 1 2013
October 30 2020 to October 29 2021 (Last 1 year)
October 31 2018 to October 29 2021 (Last 3 year)
October 28 2016 to October 29 2021 (Last 5 year)
1020000 120000 360000 600000
2703388 153765 629577 1189292
2214 5661 4003 2781
1705 4454 3067 2055
1638 4083 2848 2032
2808037
2299
154661
5821
639851
4130
1218403
2883
Total number of units held in Parag Parikh Flexi Cap Fund as per SEBI Circular relating to Alignment of interest of Key Employees (Designated Employees) of Asset Management Companies (AMCs) with the unitholders of the Mutual Fund Schemes (dated April 28 2021 read with September 20 2021) as at 31-10-2021
60568945Parag Parikh Flexi Cap Fund - Direct Plan
Scheme Units AUM (in Rs)
1139718
Portfolio Disclosure
- Above figures are annualised
- Since the fund has not completed 3 years other quantitative indicators are not
shown as per AMFI Best Practice Guidelines
Name of the fund Parag Parikh Tax Saver Fund
Investment Objective
Type of the Scheme
Date of Allotment July 24 2019
Benchmark Index NIFTY 500 (TRI)
To seek to generate long-term capital appreciation through a diversified portfolio of equity and equity related instruments
An open ended equity linked savings scheme with a statutory lock in of3 years and tax benefit
Name of the Fund
Managers
Assets Under Management
(AUM) as on Oct 31 2021
` 32589 CroresAverage AUM
for the Month
` 32383 Crores
Net Asset Value (NAV) as
on Oct 29 2021
Regular Plan 183787
Direct Plan 188982
Month End Expense RatioRegular Plan 228
Direct Plan 098
Including additional expenses and GST on management fees Total Expense ratio is as on last business day of the month
Minimum
Application
Amount
New Purchase ` 500 and in multiples of ` 500Additional Purchase ` 500 and in
Monthly SIP ` 1000Quarterly SIP ` 3000
Portfolio Turnover 479
Mr Rajeev Thakkar - Equity Fund Manager (Since Inception)
Mr Raj Mehta - Debt Fund Manager (Since Inception)
Mr Raunak Onkar - Co Fund Manager (Since Inception)
Industry Allocation
Entry Load Not Applicable
Not ApplicableExit Load
Load Structure
Quantitative Indicators
FACT SHEET - OCTOBER 2021
4
Core Equity
Name Industry of Net Assets
Net Assets 10000
Debt and Money Market Instruments
Total
TREPS Including Cash amp Cash Equivalent and Net Current Asset
1064Debt and Money MarketInstruments
8936
Additional Benchmark NIFTY 50 (TRI)
An open ended equity linked saving scheme with a statutory lock in of3 years and tax benefit
TA
X
Finance 899
ITC Ltd 760
Indian Energy Exchange Ltd Capital Markets 640
Auto 526
HCL Technologies Ltd Software 506
Software 504
Auto 504
Power Grid Corporation of India Ltd Power 500
ICICI Bank Ltd Banks 498
Software 495
Axis Bank Ltd Banks 472
Auto Ancillaries 349
Central Depository Services (I) Ltd Capital Markets 340
Persistent Systems Ltd Software 291
Multi Commodity Exchange of India Ltd Capital Markets 257
Software 252
HDFC Bank Ltd Banks 243
CCL Products (India) Ltd 207
ICRA Ltd Capital Markets 178
Capital Markets 102
Oracle Financial Services Software Ltd Software 102
Sun Pharmaceutical Industries Ltd Pharmaceuticals 085
Pharmaceuticals 079
Pharmaceuticals 063
Pharmaceuticals 058
IPCA Laboratories Ltd Pharmaceuticals 026
Bajaj Holdings amp Investment Ltd
Consumer Non Durables
Maruti Suzuki India Ltd
Tata Consultancy Services Ltd
Hero MotoCorp Ltd
Wipro Ltd
Balkrishna Industries Ltd
Mphasis Ltd
Consumer Non Durables
Motilal Oswal Financial Services Ltd
Cadila Healthcare Ltd
Dr Reddys Laboratories Ltd
Lupin Ltd
311Pharmaceuticals
1213Banks
2150Software
1030Auto
967Consumer Non Durables
1064Debt and Money Market Instruments
349Auto Ancillaries
899Finance
1517Capital Markets
500Power
FACT SHEET - OCTOBER 2021
5
Note
Different plans shall have different expense structures
Scheme returns shown are for regular plan
Past performance may or may not be sustained in the future
Data presented here is upto the last calendar month
We have our Skin in the Game
An open ended equity linked saving scheme with a statutory lock in of3 years and tax benefit
Total Amount Invested 280000 120000
Market value of Investment (Regular Plan) 432370 147224
(Regular Plan) Returns (Annualised) () 4061 4507
Nifty 500 (TRI) Returns (Annualised) () 3868 4454
Nifty 50 (TRI) Returns (Annualised) () 3543 4083
Since Inception from July 24 2019
October 30 2020 to October 29 2021 (Last 1 year)
SIP Investment Performance (Assumption ` 10000- is invested on the first of every month)
Since Inception (24 July 2019) 3077 2594 2333 18379 16875 16090
October 30 2020 to October 29 2021 (Last 1 year) 4959 5928 5372 14942 15908 15354
Since Inception (July 24 2019)
CAGR Scheme 3077Nifty 500 2594Nifty 50 2333
Scheme 4959 Nifty 500 5928Nifty 50 5372
PPTSF Returns Benchmark Returns (Nifty 500 (TRI)) Nifty 50 (TRI) Returns
PPTSF Vs Benchmark Indices
60
70
80
90
100
110
120
130
140
60
70
80
90
100
110
120
130
140
Jul1
9A
ug19
Sep 1
9O
ct19
Nov1
9D
ec1
9Ja
n20
Feb20
Mar2
0A
pr2
0M
ay2
0Ju
n20
Jul2
0A
ug20
Sep20
Oct
20
Nov2
0D
ec2
0Ja
n21
Feb21
Mar2
1A
pr2
1M
ay2
1Ju
ne21
July
21
Aug21
Sep21
Oct
21
Oct
20
Nov2
0
Dec2
0
Jan21
Feb21
Mar2
1
Apr2
1
May2
1
June21
July
21
Aug21
Sept2
1
Oct
21
Oct 30 2020 to Oct 29 2021
Date
Scheme Benchmark Value of Investment of Rs 10000-
PPTSF PPTSFNIFTY 500(TRI)
NIFTY 50(TRI)
NIFTY 500(TRI)
NIFTY 50(TRI)
Lumpsum Investment Performance (Compounded annual returns)
AdditionalBenchmark
(Regular) (Regular)
The combined holding of Insiders in Parag Parikh Tax Saver Fund amounts to `781 Crores of AUM as at October 29 2021 For more details
Since inception returns are calculated on Rs 10 (allotment price)
Source Internal sources
Total Amount Invested
Market value of Investment (Regular Plan)
Market value of Investment (Direct Plan)
(Regular Plan) Returns (Annualised) ()
(Direct Plan) Returns (Annualised) ()
NIFTY 500 (TRI) Returns (Annualised) ()
NIFTY 50 Returns (Annualised) ()(TRI)
SIP Investment Performance (Assumption `10000- is invested on the first of every month)
Date
Scheme Benchmark Value of Investment of Rs 10000-
PPTSF PPTSFNIFTY 500(TRI)
NIFTY 50(TRI)
NIFTY 500(TRI)
NIFTY 50(TRI)
Lumpsum Investment Performance (Compounded annual returns)
AdditionalBenchmark
(Regular) (Regular)PPTSF(Direct)
PPTSF(Direct)
Since Inception from July 24 2019
Since inception returns are calculated on Rs 10 (allotment price)
Since Inception (24 July 2019) 3077 2594 2333 18379 16875 16090
October 30 2020 to October 29 2021 (Last 1 year) 4959 5928 5372 14942 15908 15354
3239
5145
18898
15128
October 30 2020 to October 29 2021 (Last 1 year)
280000 120000
432370 147224
4061 4507
3868 4454
3543 4083
439490
4232
148284
4692
Total number of units held in Parag Parikh Tax Saver Fund as per SEBI Circular relating to Alignment of interest of Key Employees (Designated Employees) of Asset Management Companies (AMCs) with the unitholders of the Mutual Fund Schemes (dated April 28 2021 read with September 20 2021) as at 31-10-2021
1450059Parag Parikh Tax Saver Fund - Direct Plan
Scheme Units AUM (in Rs)
76730
Quantitative IndicatorsBeta069Standard Deviation0115Sharpe Ratio053Portfolio Turnover (excl Equity Arbitrage)01192Portfolio Turnover (incl Equity Arbitrage)18617
Portfolio DisclosureName of the fund Parag Parikh Conservative Hybrid Fund
Investment Objective
Type of the Scheme
Date of Allotment 26th May 2021
Benchmark Index CRISIL Hybrid 85+15 - Conservative Index TRI
CRISIL 10 year GILT Index
To generate regular income through investments predominantly in debt and money market instruments The Scheme also seeks to generate long term capital appreciation from the portion of equity investments under the scheme However there is no assurance or guarantee that the investment objective of the Scheme will be realized
An open ended hybrid scheme investing predominantly in debt instruments
Name of theFund Manager
Assets Under
Management (AUM) as onOct 31 2021
Average AUM
for the Month` 50489 Crores
Month End Expense Ratio
Regular Plan 060 Direct Plan 030
Including additional expenses and GST on management fees Total Expense ratio is as on last business day of the month
Additional Benchmark
Minimum
Application
Amount
Quantitive Indicators
Calculated on amount invest in debt securities (including accrued interest) deployment of funds in TREPS amp Reverse Repo and net receivablespayables^YTM is calculated on the basis of annualised yield for all securities
Average Maturity (Years) 643
49004
662
Modified Duration (Years)
Yield to Maturity^
Macaulay duration 50649
Entry Load Not Applicable
Exit Load
Load Structure
FACT SHEET - OCTOBER 2021
Name of Net Assets
Net Assets 10000
6
` 53557 Crores
REITsInvITs Parag Parikh Conservative Hybrid Fund
An open-ended hybrid scheme investing predominantly in debt instruments
DEBT
EQUITYREITs
InvITs
Equity and Equity Related Instruments
770 India Grid Trust 06-May-2028 094b) Government Securities
Units issued by REITs amp InvITsListed awaiting listing on the stock exchanges
Brookfield India REIT
Embassy Office Parks REIT
Mindspace Business Parks REIT
Debt and Money Market Instruments
Name of Net AssetsRatinga)CorporateBondNCD
c) TREPS and Other Receivables and Payables
TREPS Including Cash amp Cash Equivalent and Net Current Asset 186
d) Fixed Deposits
Mr Rajeev Thakkar - Equity Fund Manager (Since Inception)
Mr Raj Mehta - Debt Fund Manager (Since Inception)
Mr Raunak Onkar - Equity Fund Manager (Since Inception)
Net Asset Value (NAV) as
on Oct 29 2021
Regular Plan 103857
Direct Plan 103992
New Purchase 5000 and in multiples of 1 ` `thereafter
Additional Purchase 1000 and in multiples of 1 ` `thereafter
Monthly SIP 1000 and Quarterly SIP 3000` `
10 of the units (ldquothe limitrdquo) may be redeemed without any exit load from the date of allotment1 for redemption within 1 Year and Nil for redemption beyond 1 Year from the date of allotment
CRISIL AAA
1226Sub total
085Sub total
916Sub total
Industry
Name of Net AssetsIndustry
Construction
Construction
Construction
7493Sub total
418
250
248
490 HDFC Bank Ltd (Duration 365 Days) 028
490 HDFC Bank Ltd (Duration 368 Days) 019490 HDFC Bank Ltd (Duration 365 Days) 019
510 Axis Bank Ltd (Duration 367 Days) 019
Power Grid Corporation of India Ltd Power 247
Auto 247Gas 246
Coal India Ltd MineralsMining 243
ITC Ltd 243
563 Government of India 12-Apr-2026 Sovereign 093
Bajaj Auto Ltd
Petronet LNG Ltd
Consumer Non Durables
DEBT
EQUITYREITs
InvITs
Sovereign
Sovereign
834 State Government of Punjab 30-May-2028
808 State Government of Maharashtra 26-Dec-2028
843 State Government of Goa 13-Mar-2029
816 State Government of Rajasthan 09-May-2028
800 State Government of Kerala 11-Apr-2028
792 State Government of Uttar Pradesh 24-Jan-2028
699 State Government of Telangana 10-Jun-2028
788 State Government of Madhya Pradesh 24-Jan-2028
842 State Government of Madhya Pradesh 08-Aug-2028
799 State Government of Punjab 11-Apr-2028
828 State Government of Gujarat 20-Feb-2029
828 State Government of Gujarat 23-Jan-2029
809 State Government of West Bengal 27-Mar-2028
797 State Government of Assam 18-Apr-2028
845 State Government of Uttar Pradesh 27-Feb-2029
808 State Government of Tamil Nadu 26-Dec-2028
815 State Government of Tamil Nadu 09-May-2028
820 State Government of Uttarakhand 09-May-2028
698 State Government of Telangana 22-Apr-2028
865 State Government of Rajasthan 03-Oct-2028
863 State Government of Rajasthan 03-Sep-2028
849 State Government of Uttarakhand 21-Aug-2028
843 State Government of Uttar Pradesh 06-Mar-2029
845 State Government of Uttar Pradesh 27-Jun-2028
841 State Government of Kerala 06-Jun-2028
834 State Government of Tamil Nadu 28-Feb-2028
833 State Government of Kerala 30-May-2028
825 State Government of Tamil Nadu 02-Jan-2029
829 State Government of Haryana 14-Mar-2028
820 State Government of Jammu and Kashmir 30-Jan-2029
813 State Government of Rajasthan 27-Mar-2028
811 State Government of Chhattisgarh 31-Jan-2028
805 State Government of Tamil Nadu 18-Apr-2028
798 State Government of Uttar Pradesh 11-Apr-2028
786 State Government of Haryana 27-Dec-2027
765 State Government of Karnataka 06-Dec-2027
753 State Government of West Bengal 22-Nov-2027
709 State Government of Goa 28-Aug-2029
679 State Government of West Bengal 30-Jun-2028
711 State Government of Tamil Nadu 31-Jul-2029
713 State Government of Kerala 10-Jul-2029
653 State Government of Chhattisgarh 15-Sep-2028
Sovereign
Sovereign
Sovereign
Sovereign
Sovereign
Sovereign
Sovereign
Sovereign
Sovereign
Sovereign
Sovereign
Sovereign
Sovereign
Sovereign
Sovereign
Sovereign
Sovereign
Sovereign
Sovereign
Sovereign
Sovereign
Sovereign
Sovereign
Sovereign
Sovereign
Sovereign
Sovereign
Sovereign
Sovereign
Sovereign
Sovereign
Sovereign
Sovereign
Sovereign
Sovereign
Sovereign
Sovereign
Sovereign
Sovereign
Sovereign
504
500
499
477
398
307
305
303
205
205
202
202
202
200
190
104
103
103
102
102
102
102
102
102
102
102
101
101
101
101
101
101
100
100
100
099
098
095
095
095
094
093
Asset Allocation by Asset Class Asset Allocation by Rating
We have our Skin in the Game
The combined holding of Insiders in Parag Parikh Conservative Hybrid
Fund amounts to For more ` 573 Crores of AUM as at October 29 2021
details please
7
REITsInvITs
Equity
Debt
FACT SHEET - OCTOBER 2021
REITsInvITs
Parag Parikh Conservative Hybrid Fund
An open-ended hybrid scheme investing predominantly in debt instruments
Source Internal sources Source Internal sources
Dividend History - Monthly Income Distribution cum capital Withdrawal option
Record datePayout Date
DirectRetail RetailCorporate Corporate
Regular
30th Aug 2021 01124 01067
Face ValueRegular
10 100100
NAV per Unit (Ex IDCW)
01124 01067
DirectNAV per Unit (Ex IDCW)
100100
RegularNAV per Unit (Cum IDCW)
101167
DirectNAV per Unit (Cum IDCW)
101224
27th Sept 2021 00680 00680 00667 00667 10 101335 101343 102002 102023
7493G sec and SDL
1226Equity and Equity
Related Instruments
271TREPS Fixed Deposit
Net receivables amp Payables and
Net Current Asset094
Corporate Bond
916REITs and InvITs
271TREPS Fixed Deposit and
Net Receivables amp Payables
916REITs and InvITs
7493Sovereign
094AAA
1226Equity and Equity
Related Instruments
Total number of units held in Parag Parikh Conservative Hybrid Fund as per SEBI Circular relating to Alignment of interest of Key Employees (Designated Employees) of Asset Management Companies (AMCs) with the unitholders of the Mutual Fund Schemes (dated April 28 2021 read with September 20 2021) as at 31-10-2021
1965767Parag Parikh Conservative Hybrid Fund - Direct Plan Growth
Scheme Units AUM (in Rs)
194077
th25 Oct 2021 00597 00597 00340 00340 10 101762 101541 102102 102138
Quantitative IndicatorsBeta069Standard Deviation0115Sharpe Ratio053Portfolio Turnover (excl Equity Arbitrage)01192Portfolio Turnover (incl Equity Arbitrage)18617
Portfolio DisclosureName of the fund Parag Parikh Liquid Fund
Investment Objective
Type of the Scheme
Date of Allotment May 11 2018
Benchmark Index CRISIL Liquid fund index
CRISIL 1 Year T-Bill index
To deliver reasonable market related returns with lower risk and high liquidity through judicious investments in money market and debt instruments (Non Guaranteed)
An Open-ended Liquid Scheme
Name of theFund Manager
Mr Raj Mehta
(Since Inception)
Assets Under
Management (AUM) as onOct 31 2021
Average AUM
for the Month` 48 Crores1501
Month End Expense Ratio
Regular Plan 026 Direct Plan 016
Including additional expenses and GST on management fees Total Expense ratio is as on last business day of the month
Additional Benchmark
Minimum
Application
Amount
New Purchase ` 5000
Additional Purchase ` 1000
Monthly SIP ` 1000
NAV Details
Plan
Growth
Daily Reinvestment of Income Distributioncum capital withdrawal option
Weekly Reinvestment of Income Distribution cum capital withdrawal option
Monthly Income Distribution cum capital withdrawal option
Direct Regular
Quantitive Indicators
Computed on the invested amount
Average Maturity (Days) 4274
01106
34460
Modified duration (Years)
Yield to Maturity
Macaulay Duration (Years) 01145
Entry Load Not Applicable
For purpose of levying exit load if subscription (application amp funds) is received
within cut-off time on a day Day 1 shall be considered to be the same day else the
day after the date of allotment of units shall be considered as Day 1
Day of redemption switch from the date
of applicable NAV
Day 1 00070
Day 2 00065
Day 3 00060
Day 4 00055
Day 5 00050
Day 6 00045
Day 7 onwards 00000
Exit load as a ofredemption
switch proceeds
Exit Load
Load Structure
FACT SHEET - OCTOBER 2021
a) Debt and Money Market Instruments
Name Rating of Net AssetsSovereign
Sovereign
Sovereign
Sovereign
Sovereign
Sovereign
Sovereign
Sovereign
Sovereign
Sovereign
b) Government Securities
e) Fixed Deposits
Net Assets 10000
d) TREPS and Other Receivables and Payables
TREPS Including Net ReceivablesPayables and Net Current Asset 475
FDR 057
11745668 11703612
Sovereign
10005404
10014319
10034328
10005404
10014154
10034163
8
Sovereign
` 01 Crores1495
Sovereign
879 Government of India 08-Nov-2021 937Sovereign
Dividend History - Monthly Income Distribution cum capital Withdrawal option
Record datePayout Date
DirectRetail RetailCorporate Corporate
Regular
30th Aug 2021 ` 31956 ` 30988
Face Value
1000
Regular
10030000` 31956 ` 30988
NAV per Unit (Ex IDCW)
Direct
NAV per Unit (Ex IDCW)
10030000
Regular
NAV per Unit (Cum IDCW)
10060988
Direct
NAV per Unit (Cum IDCW)
10061956
27th Sept 2021 ` 22916 ` 22147 1000` 22916 ` 22147 10030000 10030000 10052147 10052916
Quarterly SIP ` 3000-
Dividend History - Monthly Income Distribution cum capital Withdrawal option
Record datePayout Date
DirectRetail RetailCorporate Corporate
Regular
c) Commercial Paper
d) Certificate of Deposit
National Bank for Agriculture and Rural Development 10-Jun-2021
A1+ 077Axis Bank Ltd 10-Jun-2021
A1+ 077
A1+ 036
28th June 2021 ` 248 ` 24` 248 ` 24
National Bank for Agriculture and Rural Development 31-Aug-2021
26th July 2021 ` 254 ` 246` 254 ` 246
30th Aug 2021 ` 319 ` 309` 319 ` 309
Face Value
1000
1000
1000
Prevailing NAV
10060034
10053757
10053176
91 DAY T-BILL 13-Jan-2022 830
91 DAY T-BILL 20-Jan-2022 830
91 DAY T-BILL 04-Nov-2021 669
182 DAY T-BILL 18-Nov-2021 668
182 DAY T-BILL 25-Nov-2021 667
91 DAY T-BILL 02-Dec-2021 667
182 DAY T-BILL 09-Dec-2021 667
182 DAY T-BILL 16-Dec-2021 666
91 DAY T-BILL 23-Dec-2021 666
182 DAY T-BILL 30-Dec-2021 665
91 DAY T-BILL 06-Jan-2022 665
182 DAY T-BILL 23-Dec-2021 333
182 DAY T-BILL 02-Dec-2021 267
870 State Government of Kerala 25-Jan-2022
c) State Government Securities
271Sovereign
th25 Oct 2021 ` 24257 ` 23485 1000` 24257 ` 23485 10030000 10030000 10053485 10054257
Note
Different plans shall have different expense structures
Scheme returns shown are for regular plan
Past performance may or may not be sustained in the future
Greater than 1 year returns are CAGR returns
Data presented here is upto the last calendar month
We have our Skin in the Game
Asset Allocation by Asset Class Asset Allocation by Rating
FACT SHEET - OCTOBER 2021
Less than 1 year returns are simple annualised returns
The combined holding of Insiders in Parag Parikh Liquid Fund amounts to
` 4495 Crores of AUM as at October 29 2021 For more details please
9
Source Internal sources Source Internal sources
Date
Scheme Benchmark Additional Benchmark Value of Investment of Rs 10000-
CRISIL 1 year T-bill Index
557 602
285 -058
291 060
335 143
355 351
PPLF (Regular)
CRISIL Liquid Fund Index
PPLF (Regular)
CRISIL Liquid Fund Index
CRISIL 1 year T-bill Index
Lumpsum Investment Performance (Compounded annual returns)
11704
10005
10013
10026
10305
12075 12254
10005 9999
10014 10003
10028 10012
10357 10353
524 601 11365 11658 11915
Since inception returns are calculated on Rs 1000 (allotment price)
463
266
272
303
303
435
Since Inception (11 May 2018)
October 24 2021 to October 31 2021 (Last 7 Days)
October 14 2021 to October 31 2021 (Last 15 days)
September 30 2021 to October 31 2021 (Last 1 Month)
October 29 2020 to October 31 2021 (Last 1 year)
October 31 2018 to October 31 2021 (Last 3 year)
Date
Scheme Benchmark Additional Benchmark Value of Investment of Rs 10000-
CRISIL 1 year T-bill Index
PPLF (Regular)
PPLF (Direct)
PPLF (Direct)
CRISIL Liquid Fund Index
PPLF (Regular)
CRISIL Liquid Fund Index
CRISIL 1 year T-bill Index
Lumpsum Investment Performance (Compounded annual returns)
Since inception returns are calculated on Rs 1000 (allotment price)
557 602
285 -058
291 060
335 143
355 351
11704
10005
10013
10026
10305
12075 12254
10005 9999
10014 10003
10028 10012
10357 10353
524 601 11365 11658 11915
463
266
272
303
303
435
Since Inception (11 May 2018)
Oct 24 2021 to Oct 31 2021 (Last 7 Days)
Oct 14 2021 to Oct 31 2021 (Last 15 days)
Sept 30 2021 to Oct 31 2021 (Last 1 Month)
Oct 29 2020 to Oct 31 2021 (Last 1 year)
Oct 31 2018 to Oct 31 2021 (Last 3 year)
474
276
282
313
314
446
11746
10005
10013
10027
10315
11400
8260Treasury Bills
1208G Sec
532TREPS Fixed Deposit
Net receivables amp Payables and
Net Current Asset
9468Sovereign
532TREPS Fixed Deposit and
Net Receivables amp Payables
Sovereign
A1+
TREPS Fixed Deposit and Net receivables amp Payables
Total number of units held in Parag Parikh Liquid Fund as per SEBI Circular relating to Alignment of interest of Key Employees (Designated Employees) of Asset Management Companies (AMCs) with the unitholders of the Mutual Fund Schemes (dated April 28 2021 read with September 20 2021) as at 31-10-2021
5425534Parag Parikh Liquid Fund Direct Plan Growth
Scheme Units AUM (in Rs)
4620
FACT SHEET - OCTOBER 2021
10
Scheme Date of Allotment Date
Value of investment of Rs 10000-
NIFTY 500 (TRI) NIFTY 50 (TRI) NIFTY 500 (TRI)
th24 May 2013
Since Inception 2109 1623 1515 50271 35566 32876
1 Year 6160 5928 5372 16139 15908 15354
3 Year 2988 2124 2082 21894 17812 17625
5 Year 2178 1635 1681 26815 21335 21761
th24 July 2019
Since Inception 3077 2594 2333 18379 16875 16090
1 Year 4959 5928 5372 14942 15908 15354
3 Year NA NA NA NA NA NA
5 Year NA NA NA NA NA NA
Scheme Return
Benchmark Return ()
Additional Benchmark Return
()
Scheme Return (Rs)
NIFTY 50 (TRI)
Parag Parikh
Flexi Cap
Fund
Parag Parikh
Tax Saver
Fund
Fund Manager Name Mr Rajeev Thakkar
Mr Rajeev Thakkar Manages two schemes of PPFAS Mutual Fund
Fund Manager Name Mr Raunak Onkar
Mr Raunak Onkar Manages two schemes of PPFAS Mutual Fund
Fund Manager Name Mr Raj Mehta
Mr Raj Mehta Manages three schemes of PPFAS Mutual Fund
Scheme Date of Allotment Date
Value of investment of Rs 10000-
CRISIL Liquid Fund Index
th11 May 2018
Since Inception 463 557 602 11704 12075 12254
1 Year 303 355 351 10305 10357 10353
3 Year 435 524 601 11365 11658 11915
5 Year NA NA NA NA NA NA
Scheme Return
Benchmark Return ()
Additional Benchmark Return
()
Crisil Liquid Fund Index
CRISIL 1 year T-bill
IndexScheme Return
(Rs) CRISIL 1 Year
T-bill Index
Parag ParikhLiquid Fund
Since inception returns are calculated on Rs 10 (allotment price)
Since inception returns are calculated on Rs 1000 (allotment price)
Past Performance may or may not be sustained in future
The performance details provided herein are of regular plan growth option Regular and Direct Plans have different expense structure
Direct Plan shall have a lower expense ratio excluding distribution expenses commission expenses etc
All 3 Fund Managers also manage Parag Parikh Conservative Hybrid Fund since May 28 2021 However performance of the scheme
has not been included because It has not yet completed six months duration since inception
Scheme Date of Allotment Date
Value of investment of Rs 10000-
NIFTY 500 (TRI) NIFTY 50 (TRI) NIFTY 500 (TRI)
th24 May 2013
Since Inception 2109 1623 1515 50271 35566 32876
1 Year 6160 5928 5372 16139 15908 15354
3 Year 2988 2124 2082 21894 17812 17625
5 Year 2178 1635 1681 26815 21335 21761
th24 July 2019
Since Inception 3077 2594 2333 18379 16875 16090
1 Year 4959 5928 5372 14942 15908 15354
3 Year NA NA NA NA NA NA
5 Year NA NA NA NA NA NA
Scheme Return
Benchmark Return ()
Additional Benchmark Return
()
Scheme Return (Rs)
NIFTY 50 (TRI)
Parag Parikh
Flexi Cap
Fund
Parag Parikh
Tax Saver
Fund
Scheme Date of Allotment Date
Value of investment of Rs 10000-
NIFTY 500 (TRI) NIFTY 50 (TRI) NIFTY 500 (TRI)
th24 May 2013
Since Inception 2109 1623 1515 50271 35566 32876
1 Year 6160 5928 5372 16139 15908 15354
3 Year 2988 2124 2082 21894 17812 17625
5 Year 2178 1635 1681 26815 21335 21761
th24 July 2019
Since Inception 3077 2594 2333 18379 16875 16090
1 Year 4959 5928 5372 14942 15908 15354
3 Year NA NA NA NA NA NA
5 Year NA NA NA NA NA NA
Scheme Return
Benchmark Return ()
Additional Benchmark Return
()
Scheme Return (Rs)
NIFTY 50 (TRI)
Parag Parikh
Flexi Cap
Fund
Parag Parikh
Tax Saver
Fund
FACT SHEET - OCTOBER 2021
11
Parag Parikh Flexi Cap Fund
Investors understand that their principalwill be at very high risk
woL
High
tearedoM
Very High
ot woL
etaredoM
Moderately High
Low Very High
Investors should consult their financial advisers if in doubt about whether the
product is suitable for them
Parag Parikh Tax Saver Fund
Investors understand that their principalwill be at very high risk
woL
High
tearedoM
Very High
ot woL
etaredoM
Moderately High
Low Very HighInvestors should consult their financial advisers if in doubt about whether the product is suitable for them
This product is suitable for investors who are seeking
Long term capital appreciation
Investment predominantly in equity and equity related securities
This Product is suitable for investors who are seeking
The investment objective of the Scheme is to seek to generate long-term capital growth from an
actively managed portfolio primarily of Equity and Equity Related Securities Scheme shall invest
in Indian equitiesforeign equities and related instruments and debt securities
Parag Parikh Conservative Hybrid Fund
This product is suitable for investors who are seeking
Long term capital appreciation from the portion of equity investments under the scheme
Investors should consult their financial advisers if in doubt about whether the product
is suitable for them
To generate regular income through investments predominantly in debt and money market
instruments
Investors understand that their principalwill be at moderately high risk
Investors understand that their principalwill be at low risk
woL
High
tearedoM
Very High
ot woL
etaredoM
Moderately High
Low Very High
Parag Parikh Liquid Fund
This product is suitable for investors who are seeking
Investors should consult their financial advisers if in doubt about
whether the product is suitable for them
Income over short term
Investments in Debtmoney market instruments
Riskometer
Riskometer
Riskometer
Riskometer
Investors understand that their principalwill be at very high risk
woL
High
etaredoM
Very H
i gh
ot
woL
etaredoM
Moderately High
Low Very High
Investors should consult their financial advisers if in doubt about whether the product is suitable for them
Parag Parikh Flexi Cap Fund
Schemersquos Riskometer
woL
High
etaredoM
Very H
i gh
ot
woL
etaredoM
Moderately High
Low Very High
Benchmarkrsquos Riskometer (Nifty 500 TRI)
This Product is suitable for investors who are seeking
The investment objective of the Scheme
is to seek to generate long-term capital
growth from an actively managed portfolio
primarily of Equity and Equity Related
Securities Scheme shall invest in Indian
equities foreign equities and related
instruments and debt securities
Long term capital appreciation
Investment predominantly in equity
and equity related securities
Investors understand that their principalwill be at very high risk
woL
High
etaredoM
Very H
i gh
ot
woL
etaredoM
Moderately High
Low Very High
Investors should consult their financial advisers if in doubt about whether the product is suitable for them
Schemersquos Riskometer
woL
High
etaredoM
Very H
i gh
ot
woL
etaredoM
Moderately High
Low Very High
Benchmarkrsquos Riskometer (Nifty 500 TRI)
This Product is suitable for investors who are seeking
Investors should consult their financial advisers if in doubt about whether the product is suitable for them
Schemersquos RiskometerBenchmarkrsquos Riskometer
(CRISIL Hybrid 85+15 Conservative Index TRI)
This Product is suitable for investors who are seeking
To generate regular income through
investments predominantly in debt and
money market instruments
Long term capital appreciation from the portion of equity investments under the scheme Investors understand that their principal
will be at moderately high risk
Investors understand that their principalwill be at low to moderate risk
woL
High
etaredoM
Very H
i gh
ot
woL
etaredoM
Moderately High
Low Very High
Income over short term
Investments in Debtmoney
market instruments
Investors should consult their financial advisers if in doubt about whether the product is suitable for them
Schemersquos RiskometerBenchmarkrsquos Riskometer
(CRISIL Liquid Fund Index)
This Product is suitable for investors who are seeking
woL
High
etaredoM
Very H
i gh
ot
woL
etaredoM
Moderately High
Low Very High
Parag Parikh Tax Saver Fund
Parag Parikh Conservative Hybrid Fund
Parag Parikh Liquid Fund
There is no assurance that the investment objective of the Scheme will be realized and the scheme does not assure or guarantee any returns
REITs amp InvITs
Equity Investments
Fixed Income Investments
Asset allocation
Type of Instruments Normal Allocation ( of Net Assets) Risk Profile
DEBT
EQUITYREITs
InvITs
Parag Parikh Conservative Hybrid FundAn open-ended hybrid scheme investing predominantly in debt instruments
Debt and money market instruments
Equities and equity related instruments
REITsInvITs
Note
We recommend it to those
Investors should consult their financial advisers if in doubt about whether the product is suitable for them
Investment Team Details
Mr Raunak Onkar Mr Rajeev Thakkar Mr Raj Mehta
Your Distributor Financial Advisor will help you with the investing procedure
`
`
`
`
`
This product is suitable for investors who are seeking
Investors should consult their financial advisers if in doubt about whether the product is suitable for them Investors understand that their principal
will be at moderately high risk
Riskometer
Note
How to invest
Visit ---gt Distributors -----gt Create a foliowwwamcppfascom
Note Please visit the website address for latest Riskometer updates ----gt Statutory Disclosures ---gt Product Label of the Schemeshttpswwwamcppfascom
Note
PPFAS Asset Management Private Limited
MF Utilities
BSE Star MF
NSE
ICEX
Definitions
Fund Manager
This is the minimum investment amount for a new investor in a mutual fund scheme
Minimum additional amount This is the minimum investment amount for an existing investor in a mutual fund scheme
SIP
NAV
Benchmark
Entry Load
Exit Load
Standard Deviation
Sharpe Ratio
Beta
AUM
Holdings
Nature of Scheme
Portfolio Turnover Ratio
Yield to Maturity (YTM)
Modified Duration
Total Expense ratio
An employee of the asset management company such as a mutual fund or life insurer who manages investment of the scheme
He is usually part of a larger team of fund managers and research analysts
Application amount for fresh subscription
SIP or systematic investment plan work on the principle of making periodic investments of a fixed sum It works similar to a recurring
bank deposit For instance an investor may opt for an SIP that invests 500 every 15 ` th of the month in an equity fund for a period of three years
The NAV or the net asset value is the total asset value per unit of the mutual fund after deducting all related and permissible expenses The NAV
is calculated at the end of every business day It is the value at which the investor enters or exits the mutual fund
A group of securities usually a market index whose performance is used as a standard or benchmark to measure investment performance of
mutual funds among other investments Some typical benchmark include the Nifty Sensex BSE 200 BSE 500 10-year Gsec
A mutual fund may have a sales charge or load at the time of entry andor exit to compensate the distributoragent Entry load is charged at the
time an investor purchase the units of a mutual fund The entry load is added to the prevailing NAV at the time of investment For instance if the
NAV is ` 100 and the entry load is 1 the investor will enter the fund at Rs 101
Exit load is charged at the time of redeeming (or transferring an investment between schemes) The exit load percentage is deducted from the
NAV at the time of redemption (or transfer between schemes) This amount goes to the respective scheme and gets added to the AUM of that Scheme
Standard deviation is a statistical measure of the range of an investmentrsquos performance When a mutual fund Scheme has a high standard deviation its
range of performance is wide implying greater volatility
The Sharpe Ratio named after its founder the Nobel Laureate William Sharpe is a measure of risk-adjusted returns It is calculated using standard
deviation and excess return to determine reward per unit of risk
Beta is a measure of an investments volatility vis-a-vis the market Beta of less than 1 means that the security will be less volatile than the market
A beta of greater than 1 implies that the securitys price will be more volatile than the market
AUM or assets under management refers to the recent updated cumulative market value of investments managed by a mutual fund or any
investment firm
The holding or the portfolio is a mutual funds latest or updated reported statement of investmentssecurities These are usually displayed in term
of percentage to net assets or the rupee value or both The objective is to give investors an idea of where their money is being invested by the
fund manager
The investment objective and underlying investments determine the nature of the mutual fund scheme For instance a mutual fund that aims at
generating capital appreciation by investing in stock markets is an equity fund or growth fund Likewise a mutual fund that aims at capital
preservation by investing in debt markets is a debt fund or income fund Each of these categories may have sub-categories
A measure of how frequently assets within a fund are bought and sold by the managers Portfolio turnover is calculated by taking either the total
amount of new securities purchased or the amount of securities sold - whichever is less - over a particular period divided by the total net asset
value (NAV) of the fund The measurement is usually reported for a 12-month time period
The yield to maturity (YTM) of a bond or other fixed-interest security such as gilts is the (theoretical) internal rate of return (IRR overall interest rate) earned by an investor who buys the bond today at the market price assuming that the bond is held until maturity and that all coupon and principal payments are made on schedule
Modified duration is a formula that expresses the measurable change in the value of a security in response to a change in interest rates Modified duration follows the concept that interest rates and bond prices move in opposite directions
The total expense ratio (TER) is a measure of the total cost of a fund to the investor Total costs may include various fees (purchase redemption auditing) and other expenses The TER calculated by dividing the total annual cost by the fundstotal assets averaged over that year is denoted as a percentage
FACT SHEET - OCTOBER 2021
Toll Free 1800-266-7790 | Email mfppfascom
Call 1800-266-7790 (Toll Free) or 91-22-61406538 | E-Mail partnersppfascom
Registered Office 8182 8th Floor Sakhar Bhavan Ramnath Goenka Marg 230 Nariman Point Mumbai - 400 021 INDIA
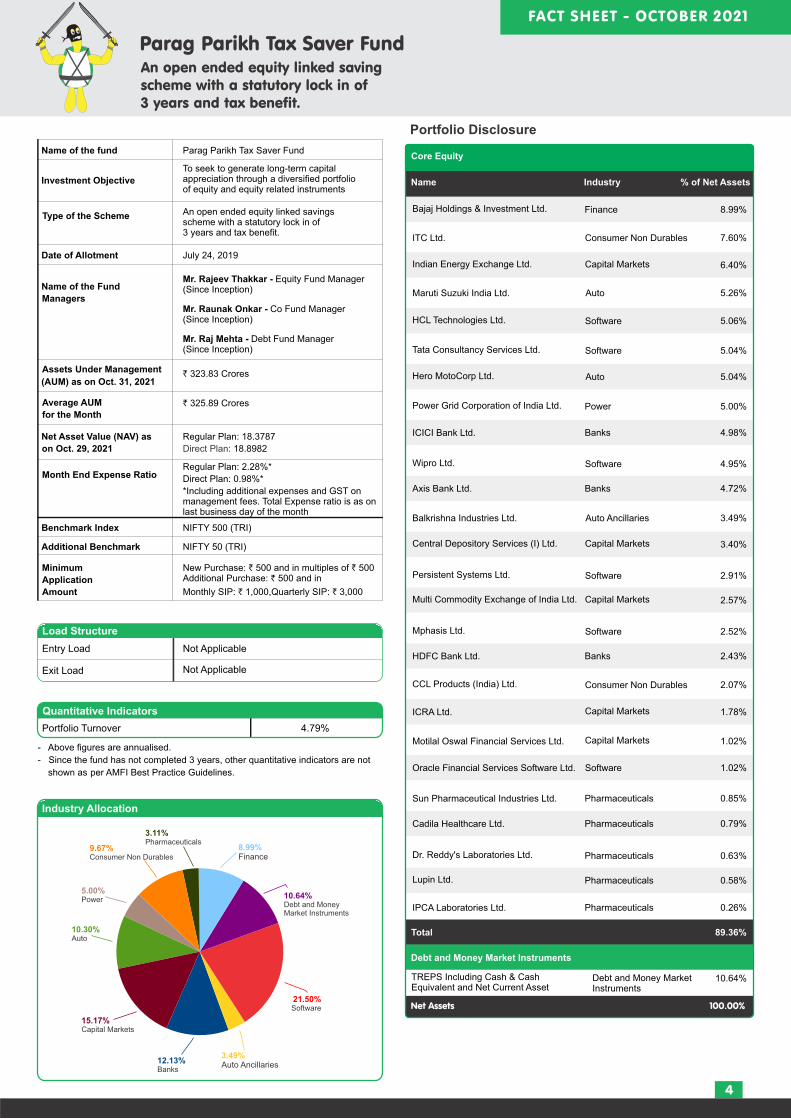
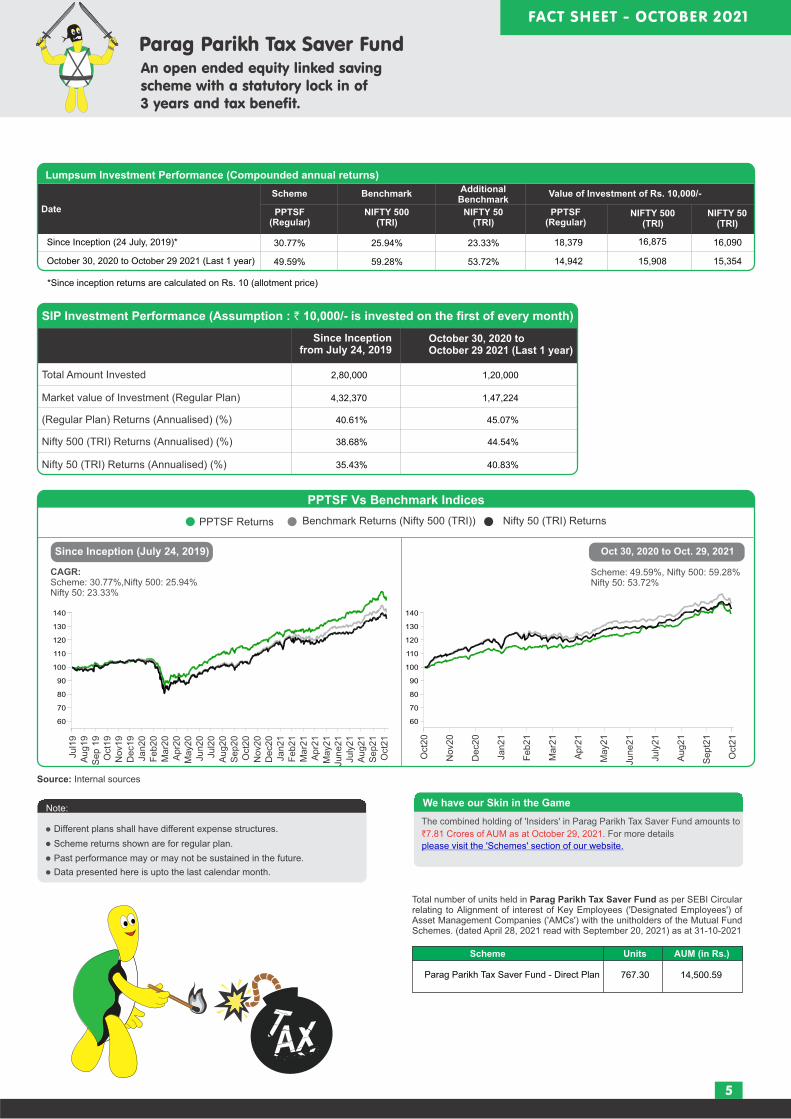
FACT SHEET - OCTOBER 2021
5
Note
Different plans shall have different expense structures
Scheme returns shown are for regular plan
Past performance may or may not be sustained in the future
Data presented here is upto the last calendar month
We have our Skin in the Game
An open ended equity linked saving scheme with a statutory lock in of3 years and tax benefit
Total Amount Invested 280000 120000
Market value of Investment (Regular Plan) 432370 147224
(Regular Plan) Returns (Annualised) () 4061 4507
Nifty 500 (TRI) Returns (Annualised) () 3868 4454
Nifty 50 (TRI) Returns (Annualised) () 3543 4083
Since Inception from July 24 2019
October 30 2020 to October 29 2021 (Last 1 year)
SIP Investment Performance (Assumption ` 10000- is invested on the first of every month)
Since Inception (24 July 2019) 3077 2594 2333 18379 16875 16090
October 30 2020 to October 29 2021 (Last 1 year) 4959 5928 5372 14942 15908 15354
Since Inception (July 24 2019)
CAGR Scheme 3077Nifty 500 2594Nifty 50 2333
Scheme 4959 Nifty 500 5928Nifty 50 5372
PPTSF Returns Benchmark Returns (Nifty 500 (TRI)) Nifty 50 (TRI) Returns
PPTSF Vs Benchmark Indices
60
70
80
90
100
110
120
130
140
60
70
80
90
100
110
120
130
140
Jul1
9A
ug19
Sep 1
9O
ct19
Nov1
9D
ec1
9Ja
n20
Feb20
Mar2
0A
pr2
0M
ay2
0Ju
n20
Jul2
0A
ug20
Sep20
Oct
20
Nov2
0D
ec2
0Ja
n21
Feb21
Mar2
1A
pr2
1M
ay2
1Ju
ne21
July
21
Aug21
Sep21
Oct
21
Oct
20
Nov2
0
Dec2
0
Jan21
Feb21
Mar2
1
Apr2
1
May2
1
June21
July
21
Aug21
Sept2
1
Oct
21
Oct 30 2020 to Oct 29 2021
Date
Scheme Benchmark Value of Investment of Rs 10000-
PPTSF PPTSFNIFTY 500(TRI)
NIFTY 50(TRI)
NIFTY 500(TRI)
NIFTY 50(TRI)
Lumpsum Investment Performance (Compounded annual returns)
AdditionalBenchmark
(Regular) (Regular)
The combined holding of Insiders in Parag Parikh Tax Saver Fund amounts to `781 Crores of AUM as at October 29 2021 For more details
Since inception returns are calculated on Rs 10 (allotment price)
Source Internal sources
Total Amount Invested
Market value of Investment (Regular Plan)
Market value of Investment (Direct Plan)
(Regular Plan) Returns (Annualised) ()
(Direct Plan) Returns (Annualised) ()
NIFTY 500 (TRI) Returns (Annualised) ()
NIFTY 50 Returns (Annualised) ()(TRI)
SIP Investment Performance (Assumption `10000- is invested on the first of every month)
Date
Scheme Benchmark Value of Investment of Rs 10000-
PPTSF PPTSFNIFTY 500(TRI)
NIFTY 50(TRI)
NIFTY 500(TRI)
NIFTY 50(TRI)
Lumpsum Investment Performance (Compounded annual returns)
AdditionalBenchmark
(Regular) (Regular)PPTSF(Direct)
PPTSF(Direct)
Since Inception from July 24 2019
Since inception returns are calculated on Rs 10 (allotment price)
Since Inception (24 July 2019) 3077 2594 2333 18379 16875 16090
October 30 2020 to October 29 2021 (Last 1 year) 4959 5928 5372 14942 15908 15354
3239
5145
18898
15128
October 30 2020 to October 29 2021 (Last 1 year)
280000 120000
432370 147224
4061 4507
3868 4454
3543 4083
439490
4232
148284
4692
Total number of units held in Parag Parikh Tax Saver Fund as per SEBI Circular relating to Alignment of interest of Key Employees (Designated Employees) of Asset Management Companies (AMCs) with the unitholders of the Mutual Fund Schemes (dated April 28 2021 read with September 20 2021) as at 31-10-2021
1450059Parag Parikh Tax Saver Fund - Direct Plan
Scheme Units AUM (in Rs)
76730
Quantitative IndicatorsBeta069Standard Deviation0115Sharpe Ratio053Portfolio Turnover (excl Equity Arbitrage)01192Portfolio Turnover (incl Equity Arbitrage)18617
Portfolio DisclosureName of the fund Parag Parikh Conservative Hybrid Fund
Investment Objective
Type of the Scheme
Date of Allotment 26th May 2021
Benchmark Index CRISIL Hybrid 85+15 - Conservative Index TRI
CRISIL 10 year GILT Index
To generate regular income through investments predominantly in debt and money market instruments The Scheme also seeks to generate long term capital appreciation from the portion of equity investments under the scheme However there is no assurance or guarantee that the investment objective of the Scheme will be realized
An open ended hybrid scheme investing predominantly in debt instruments
Name of theFund Manager
Assets Under
Management (AUM) as onOct 31 2021
Average AUM
for the Month` 50489 Crores
Month End Expense Ratio
Regular Plan 060 Direct Plan 030
Including additional expenses and GST on management fees Total Expense ratio is as on last business day of the month
Additional Benchmark
Minimum
Application
Amount
Quantitive Indicators
Calculated on amount invest in debt securities (including accrued interest) deployment of funds in TREPS amp Reverse Repo and net receivablespayables^YTM is calculated on the basis of annualised yield for all securities
Average Maturity (Years) 643
49004
662
Modified Duration (Years)
Yield to Maturity^
Macaulay duration 50649
Entry Load Not Applicable
Exit Load
Load Structure
FACT SHEET - OCTOBER 2021
Name of Net Assets
Net Assets 10000
6
` 53557 Crores
REITsInvITs Parag Parikh Conservative Hybrid Fund
An open-ended hybrid scheme investing predominantly in debt instruments
DEBT
EQUITYREITs
InvITs
Equity and Equity Related Instruments
770 India Grid Trust 06-May-2028 094b) Government Securities
Units issued by REITs amp InvITsListed awaiting listing on the stock exchanges
Brookfield India REIT
Embassy Office Parks REIT
Mindspace Business Parks REIT
Debt and Money Market Instruments
Name of Net AssetsRatinga)CorporateBondNCD
c) TREPS and Other Receivables and Payables
TREPS Including Cash amp Cash Equivalent and Net Current Asset 186
d) Fixed Deposits
Mr Rajeev Thakkar - Equity Fund Manager (Since Inception)
Mr Raj Mehta - Debt Fund Manager (Since Inception)
Mr Raunak Onkar - Equity Fund Manager (Since Inception)
Net Asset Value (NAV) as
on Oct 29 2021
Regular Plan 103857
Direct Plan 103992
New Purchase 5000 and in multiples of 1 ` `thereafter
Additional Purchase 1000 and in multiples of 1 ` `thereafter
Monthly SIP 1000 and Quarterly SIP 3000` `
10 of the units (ldquothe limitrdquo) may be redeemed without any exit load from the date of allotment1 for redemption within 1 Year and Nil for redemption beyond 1 Year from the date of allotment
CRISIL AAA
1226Sub total
085Sub total
916Sub total
Industry
Name of Net AssetsIndustry
Construction
Construction
Construction
7493Sub total
418
250
248
490 HDFC Bank Ltd (Duration 365 Days) 028
490 HDFC Bank Ltd (Duration 368 Days) 019490 HDFC Bank Ltd (Duration 365 Days) 019
510 Axis Bank Ltd (Duration 367 Days) 019
Power Grid Corporation of India Ltd Power 247
Auto 247Gas 246
Coal India Ltd MineralsMining 243
ITC Ltd 243
563 Government of India 12-Apr-2026 Sovereign 093
Bajaj Auto Ltd
Petronet LNG Ltd
Consumer Non Durables
DEBT
EQUITYREITs
InvITs
Sovereign
Sovereign
834 State Government of Punjab 30-May-2028
808 State Government of Maharashtra 26-Dec-2028
843 State Government of Goa 13-Mar-2029
816 State Government of Rajasthan 09-May-2028
800 State Government of Kerala 11-Apr-2028
792 State Government of Uttar Pradesh 24-Jan-2028
699 State Government of Telangana 10-Jun-2028
788 State Government of Madhya Pradesh 24-Jan-2028
842 State Government of Madhya Pradesh 08-Aug-2028
799 State Government of Punjab 11-Apr-2028
828 State Government of Gujarat 20-Feb-2029
828 State Government of Gujarat 23-Jan-2029
809 State Government of West Bengal 27-Mar-2028
797 State Government of Assam 18-Apr-2028
845 State Government of Uttar Pradesh 27-Feb-2029
808 State Government of Tamil Nadu 26-Dec-2028
815 State Government of Tamil Nadu 09-May-2028
820 State Government of Uttarakhand 09-May-2028
698 State Government of Telangana 22-Apr-2028
865 State Government of Rajasthan 03-Oct-2028
863 State Government of Rajasthan 03-Sep-2028
849 State Government of Uttarakhand 21-Aug-2028
843 State Government of Uttar Pradesh 06-Mar-2029
845 State Government of Uttar Pradesh 27-Jun-2028
841 State Government of Kerala 06-Jun-2028
834 State Government of Tamil Nadu 28-Feb-2028
833 State Government of Kerala 30-May-2028
825 State Government of Tamil Nadu 02-Jan-2029
829 State Government of Haryana 14-Mar-2028
820 State Government of Jammu and Kashmir 30-Jan-2029
813 State Government of Rajasthan 27-Mar-2028
811 State Government of Chhattisgarh 31-Jan-2028
805 State Government of Tamil Nadu 18-Apr-2028
798 State Government of Uttar Pradesh 11-Apr-2028
786 State Government of Haryana 27-Dec-2027
765 State Government of Karnataka 06-Dec-2027
753 State Government of West Bengal 22-Nov-2027
709 State Government of Goa 28-Aug-2029
679 State Government of West Bengal 30-Jun-2028
711 State Government of Tamil Nadu 31-Jul-2029
713 State Government of Kerala 10-Jul-2029
653 State Government of Chhattisgarh 15-Sep-2028
Sovereign
Sovereign
Sovereign
Sovereign
Sovereign
Sovereign
Sovereign
Sovereign
Sovereign
Sovereign
Sovereign
Sovereign
Sovereign
Sovereign
Sovereign
Sovereign
Sovereign
Sovereign
Sovereign
Sovereign
Sovereign
Sovereign
Sovereign
Sovereign
Sovereign
Sovereign
Sovereign
Sovereign
Sovereign
Sovereign
Sovereign
Sovereign
Sovereign
Sovereign
Sovereign
Sovereign
Sovereign
Sovereign
Sovereign
Sovereign
504
500
499
477
398
307
305
303
205
205
202
202
202
200
190
104
103
103
102
102
102
102
102
102
102
102
101
101
101
101
101
101
100
100
100
099
098
095
095
095
094
093
Asset Allocation by Asset Class Asset Allocation by Rating
We have our Skin in the Game
The combined holding of Insiders in Parag Parikh Conservative Hybrid
Fund amounts to For more ` 573 Crores of AUM as at October 29 2021
details please
7
REITsInvITs
Equity
Debt
FACT SHEET - OCTOBER 2021
REITsInvITs
Parag Parikh Conservative Hybrid Fund
An open-ended hybrid scheme investing predominantly in debt instruments
Source Internal sources Source Internal sources
Dividend History - Monthly Income Distribution cum capital Withdrawal option
Record datePayout Date
DirectRetail RetailCorporate Corporate
Regular
30th Aug 2021 01124 01067
Face ValueRegular
10 100100
NAV per Unit (Ex IDCW)
01124 01067
DirectNAV per Unit (Ex IDCW)
100100
RegularNAV per Unit (Cum IDCW)
101167
DirectNAV per Unit (Cum IDCW)
101224
27th Sept 2021 00680 00680 00667 00667 10 101335 101343 102002 102023
7493G sec and SDL
1226Equity and Equity
Related Instruments
271TREPS Fixed Deposit
Net receivables amp Payables and
Net Current Asset094
Corporate Bond
916REITs and InvITs
271TREPS Fixed Deposit and
Net Receivables amp Payables
916REITs and InvITs
7493Sovereign
094AAA
1226Equity and Equity
Related Instruments
Total number of units held in Parag Parikh Conservative Hybrid Fund as per SEBI Circular relating to Alignment of interest of Key Employees (Designated Employees) of Asset Management Companies (AMCs) with the unitholders of the Mutual Fund Schemes (dated April 28 2021 read with September 20 2021) as at 31-10-2021
1965767Parag Parikh Conservative Hybrid Fund - Direct Plan Growth
Scheme Units AUM (in Rs)
194077
th25 Oct 2021 00597 00597 00340 00340 10 101762 101541 102102 102138
Quantitative IndicatorsBeta069Standard Deviation0115Sharpe Ratio053Portfolio Turnover (excl Equity Arbitrage)01192Portfolio Turnover (incl Equity Arbitrage)18617
Portfolio DisclosureName of the fund Parag Parikh Liquid Fund
Investment Objective
Type of the Scheme
Date of Allotment May 11 2018
Benchmark Index CRISIL Liquid fund index
CRISIL 1 Year T-Bill index
To deliver reasonable market related returns with lower risk and high liquidity through judicious investments in money market and debt instruments (Non Guaranteed)
An Open-ended Liquid Scheme
Name of theFund Manager
Mr Raj Mehta
(Since Inception)
Assets Under
Management (AUM) as onOct 31 2021
Average AUM
for the Month` 48 Crores1501
Month End Expense Ratio
Regular Plan 026 Direct Plan 016
Including additional expenses and GST on management fees Total Expense ratio is as on last business day of the month
Additional Benchmark
Minimum
Application
Amount
New Purchase ` 5000
Additional Purchase ` 1000
Monthly SIP ` 1000
NAV Details
Plan
Growth
Daily Reinvestment of Income Distributioncum capital withdrawal option
Weekly Reinvestment of Income Distribution cum capital withdrawal option
Monthly Income Distribution cum capital withdrawal option
Direct Regular
Quantitive Indicators
Computed on the invested amount
Average Maturity (Days) 4274
01106
34460
Modified duration (Years)
Yield to Maturity
Macaulay Duration (Years) 01145
Entry Load Not Applicable
For purpose of levying exit load if subscription (application amp funds) is received
within cut-off time on a day Day 1 shall be considered to be the same day else the
day after the date of allotment of units shall be considered as Day 1
Day of redemption switch from the date
of applicable NAV
Day 1 00070
Day 2 00065
Day 3 00060
Day 4 00055
Day 5 00050
Day 6 00045
Day 7 onwards 00000
Exit load as a ofredemption
switch proceeds
Exit Load
Load Structure
FACT SHEET - OCTOBER 2021
a) Debt and Money Market Instruments
Name Rating of Net AssetsSovereign
Sovereign
Sovereign
Sovereign
Sovereign
Sovereign
Sovereign
Sovereign
Sovereign
Sovereign
b) Government Securities
e) Fixed Deposits
Net Assets 10000
d) TREPS and Other Receivables and Payables
TREPS Including Net ReceivablesPayables and Net Current Asset 475
FDR 057
11745668 11703612
Sovereign
10005404
10014319
10034328
10005404
10014154
10034163
8
Sovereign
` 01 Crores1495
Sovereign
879 Government of India 08-Nov-2021 937Sovereign
Dividend History - Monthly Income Distribution cum capital Withdrawal option
Record datePayout Date
DirectRetail RetailCorporate Corporate
Regular
30th Aug 2021 ` 31956 ` 30988
Face Value
1000
Regular
10030000` 31956 ` 30988
NAV per Unit (Ex IDCW)
Direct
NAV per Unit (Ex IDCW)
10030000
Regular
NAV per Unit (Cum IDCW)
10060988
Direct
NAV per Unit (Cum IDCW)
10061956
27th Sept 2021 ` 22916 ` 22147 1000` 22916 ` 22147 10030000 10030000 10052147 10052916
Quarterly SIP ` 3000-
Dividend History - Monthly Income Distribution cum capital Withdrawal option
Record datePayout Date
DirectRetail RetailCorporate Corporate
Regular
c) Commercial Paper
d) Certificate of Deposit
National Bank for Agriculture and Rural Development 10-Jun-2021
A1+ 077Axis Bank Ltd 10-Jun-2021
A1+ 077
A1+ 036
28th June 2021 ` 248 ` 24` 248 ` 24
National Bank for Agriculture and Rural Development 31-Aug-2021
26th July 2021 ` 254 ` 246` 254 ` 246
30th Aug 2021 ` 319 ` 309` 319 ` 309
Face Value
1000
1000
1000
Prevailing NAV
10060034
10053757
10053176
91 DAY T-BILL 13-Jan-2022 830
91 DAY T-BILL 20-Jan-2022 830
91 DAY T-BILL 04-Nov-2021 669
182 DAY T-BILL 18-Nov-2021 668
182 DAY T-BILL 25-Nov-2021 667
91 DAY T-BILL 02-Dec-2021 667
182 DAY T-BILL 09-Dec-2021 667
182 DAY T-BILL 16-Dec-2021 666
91 DAY T-BILL 23-Dec-2021 666
182 DAY T-BILL 30-Dec-2021 665
91 DAY T-BILL 06-Jan-2022 665
182 DAY T-BILL 23-Dec-2021 333
182 DAY T-BILL 02-Dec-2021 267
870 State Government of Kerala 25-Jan-2022
c) State Government Securities
271Sovereign
th25 Oct 2021 ` 24257 ` 23485 1000` 24257 ` 23485 10030000 10030000 10053485 10054257
Note
Different plans shall have different expense structures
Scheme returns shown are for regular plan
Past performance may or may not be sustained in the future
Greater than 1 year returns are CAGR returns
Data presented here is upto the last calendar month
We have our Skin in the Game
Asset Allocation by Asset Class Asset Allocation by Rating
FACT SHEET - OCTOBER 2021
Less than 1 year returns are simple annualised returns
The combined holding of Insiders in Parag Parikh Liquid Fund amounts to
` 4495 Crores of AUM as at October 29 2021 For more details please
9
Source Internal sources Source Internal sources
Date
Scheme Benchmark Additional Benchmark Value of Investment of Rs 10000-
CRISIL 1 year T-bill Index
557 602
285 -058
291 060
335 143
355 351
PPLF (Regular)
CRISIL Liquid Fund Index
PPLF (Regular)
CRISIL Liquid Fund Index
CRISIL 1 year T-bill Index
Lumpsum Investment Performance (Compounded annual returns)
11704
10005
10013
10026
10305
12075 12254
10005 9999
10014 10003
10028 10012
10357 10353
524 601 11365 11658 11915
Since inception returns are calculated on Rs 1000 (allotment price)
463
266
272
303
303
435
Since Inception (11 May 2018)
October 24 2021 to October 31 2021 (Last 7 Days)
October 14 2021 to October 31 2021 (Last 15 days)
September 30 2021 to October 31 2021 (Last 1 Month)
October 29 2020 to October 31 2021 (Last 1 year)
October 31 2018 to October 31 2021 (Last 3 year)
Date
Scheme Benchmark Additional Benchmark Value of Investment of Rs 10000-
CRISIL 1 year T-bill Index
PPLF (Regular)
PPLF (Direct)
PPLF (Direct)
CRISIL Liquid Fund Index
PPLF (Regular)
CRISIL Liquid Fund Index
CRISIL 1 year T-bill Index
Lumpsum Investment Performance (Compounded annual returns)
Since inception returns are calculated on Rs 1000 (allotment price)
557 602
285 -058
291 060
335 143
355 351
11704
10005
10013
10026
10305
12075 12254
10005 9999
10014 10003
10028 10012
10357 10353
524 601 11365 11658 11915
463
266
272
303
303
435
Since Inception (11 May 2018)
Oct 24 2021 to Oct 31 2021 (Last 7 Days)
Oct 14 2021 to Oct 31 2021 (Last 15 days)
Sept 30 2021 to Oct 31 2021 (Last 1 Month)
Oct 29 2020 to Oct 31 2021 (Last 1 year)
Oct 31 2018 to Oct 31 2021 (Last 3 year)
474
276
282
313
314
446
11746
10005
10013
10027
10315
11400
8260Treasury Bills
1208G Sec
532TREPS Fixed Deposit
Net receivables amp Payables and
Net Current Asset
9468Sovereign
532TREPS Fixed Deposit and
Net Receivables amp Payables
Sovereign
A1+
TREPS Fixed Deposit and Net receivables amp Payables
Total number of units held in Parag Parikh Liquid Fund as per SEBI Circular relating to Alignment of interest of Key Employees (Designated Employees) of Asset Management Companies (AMCs) with the unitholders of the Mutual Fund Schemes (dated April 28 2021 read with September 20 2021) as at 31-10-2021
5425534Parag Parikh Liquid Fund Direct Plan Growth
Scheme Units AUM (in Rs)
4620
FACT SHEET - OCTOBER 2021
10
Scheme Date of Allotment Date
Value of investment of Rs 10000-
NIFTY 500 (TRI) NIFTY 50 (TRI) NIFTY 500 (TRI)
th24 May 2013
Since Inception 2109 1623 1515 50271 35566 32876
1 Year 6160 5928 5372 16139 15908 15354
3 Year 2988 2124 2082 21894 17812 17625
5 Year 2178 1635 1681 26815 21335 21761
th24 July 2019
Since Inception 3077 2594 2333 18379 16875 16090
1 Year 4959 5928 5372 14942 15908 15354
3 Year NA NA NA NA NA NA
5 Year NA NA NA NA NA NA
Scheme Return
Benchmark Return ()
Additional Benchmark Return
()
Scheme Return (Rs)
NIFTY 50 (TRI)
Parag Parikh
Flexi Cap
Fund
Parag Parikh
Tax Saver
Fund
Fund Manager Name Mr Rajeev Thakkar
Mr Rajeev Thakkar Manages two schemes of PPFAS Mutual Fund
Fund Manager Name Mr Raunak Onkar
Mr Raunak Onkar Manages two schemes of PPFAS Mutual Fund
Fund Manager Name Mr Raj Mehta
Mr Raj Mehta Manages three schemes of PPFAS Mutual Fund
Scheme Date of Allotment Date
Value of investment of Rs 10000-
CRISIL Liquid Fund Index
th11 May 2018
Since Inception 463 557 602 11704 12075 12254
1 Year 303 355 351 10305 10357 10353
3 Year 435 524 601 11365 11658 11915
5 Year NA NA NA NA NA NA
Scheme Return
Benchmark Return ()
Additional Benchmark Return
()
Crisil Liquid Fund Index
CRISIL 1 year T-bill
IndexScheme Return
(Rs) CRISIL 1 Year
T-bill Index
Parag ParikhLiquid Fund
Since inception returns are calculated on Rs 10 (allotment price)
Since inception returns are calculated on Rs 1000 (allotment price)
Past Performance may or may not be sustained in future
The performance details provided herein are of regular plan growth option Regular and Direct Plans have different expense structure
Direct Plan shall have a lower expense ratio excluding distribution expenses commission expenses etc
All 3 Fund Managers also manage Parag Parikh Conservative Hybrid Fund since May 28 2021 However performance of the scheme
has not been included because It has not yet completed six months duration since inception
Scheme Date of Allotment Date
Value of investment of Rs 10000-
NIFTY 500 (TRI) NIFTY 50 (TRI) NIFTY 500 (TRI)
th24 May 2013
Since Inception 2109 1623 1515 50271 35566 32876
1 Year 6160 5928 5372 16139 15908 15354
3 Year 2988 2124 2082 21894 17812 17625
5 Year 2178 1635 1681 26815 21335 21761
th24 July 2019
Since Inception 3077 2594 2333 18379 16875 16090
1 Year 4959 5928 5372 14942 15908 15354
3 Year NA NA NA NA NA NA
5 Year NA NA NA NA NA NA
Scheme Return
Benchmark Return ()
Additional Benchmark Return
()
Scheme Return (Rs)
NIFTY 50 (TRI)
Parag Parikh
Flexi Cap
Fund
Parag Parikh
Tax Saver
Fund
Scheme Date of Allotment Date
Value of investment of Rs 10000-
NIFTY 500 (TRI) NIFTY 50 (TRI) NIFTY 500 (TRI)
th24 May 2013
Since Inception 2109 1623 1515 50271 35566 32876
1 Year 6160 5928 5372 16139 15908 15354
3 Year 2988 2124 2082 21894 17812 17625
5 Year 2178 1635 1681 26815 21335 21761
th24 July 2019
Since Inception 3077 2594 2333 18379 16875 16090
1 Year 4959 5928 5372 14942 15908 15354
3 Year NA NA NA NA NA NA
5 Year NA NA NA NA NA NA
Scheme Return
Benchmark Return ()
Additional Benchmark Return
()
Scheme Return (Rs)
NIFTY 50 (TRI)
Parag Parikh
Flexi Cap
Fund
Parag Parikh
Tax Saver
Fund
FACT SHEET - OCTOBER 2021
11
Parag Parikh Flexi Cap Fund
Investors understand that their principalwill be at very high risk
woL
High
tearedoM
Very High
ot woL
etaredoM
Moderately High
Low Very High
Investors should consult their financial advisers if in doubt about whether the
product is suitable for them
Parag Parikh Tax Saver Fund
Investors understand that their principalwill be at very high risk
woL
High
tearedoM
Very High
ot woL
etaredoM
Moderately High
Low Very HighInvestors should consult their financial advisers if in doubt about whether the product is suitable for them
This product is suitable for investors who are seeking
Long term capital appreciation
Investment predominantly in equity and equity related securities
This Product is suitable for investors who are seeking
The investment objective of the Scheme is to seek to generate long-term capital growth from an
actively managed portfolio primarily of Equity and Equity Related Securities Scheme shall invest
in Indian equitiesforeign equities and related instruments and debt securities
Parag Parikh Conservative Hybrid Fund
This product is suitable for investors who are seeking
Long term capital appreciation from the portion of equity investments under the scheme
Investors should consult their financial advisers if in doubt about whether the product
is suitable for them
To generate regular income through investments predominantly in debt and money market
instruments
Investors understand that their principalwill be at moderately high risk
Investors understand that their principalwill be at low risk
woL
High
tearedoM
Very High
ot woL
etaredoM
Moderately High
Low Very High
Parag Parikh Liquid Fund
This product is suitable for investors who are seeking
Investors should consult their financial advisers if in doubt about
whether the product is suitable for them
Income over short term
Investments in Debtmoney market instruments
Riskometer
Riskometer
Riskometer
Riskometer
Investors understand that their principalwill be at very high risk
woL
High
etaredoM
Very H
i gh
ot
woL
etaredoM
Moderately High
Low Very High
Investors should consult their financial advisers if in doubt about whether the product is suitable for them
Parag Parikh Flexi Cap Fund
Schemersquos Riskometer
woL
High
etaredoM
Very H
i gh
ot
woL
etaredoM
Moderately High
Low Very High
Benchmarkrsquos Riskometer (Nifty 500 TRI)
This Product is suitable for investors who are seeking
The investment objective of the Scheme
is to seek to generate long-term capital
growth from an actively managed portfolio
primarily of Equity and Equity Related
Securities Scheme shall invest in Indian
equities foreign equities and related
instruments and debt securities
Long term capital appreciation
Investment predominantly in equity
and equity related securities
Investors understand that their principalwill be at very high risk
woL
High
etaredoM
Very H
i gh
ot
woL
etaredoM
Moderately High
Low Very High
Investors should consult their financial advisers if in doubt about whether the product is suitable for them
Schemersquos Riskometer
woL
High
etaredoM
Very H
i gh
ot
woL
etaredoM
Moderately High
Low Very High
Benchmarkrsquos Riskometer (Nifty 500 TRI)
This Product is suitable for investors who are seeking
Investors should consult their financial advisers if in doubt about whether the product is suitable for them
Schemersquos RiskometerBenchmarkrsquos Riskometer
(CRISIL Hybrid 85+15 Conservative Index TRI)
This Product is suitable for investors who are seeking
To generate regular income through
investments predominantly in debt and
money market instruments
Long term capital appreciation from the portion of equity investments under the scheme Investors understand that their principal
will be at moderately high risk
Investors understand that their principalwill be at low to moderate risk
woL
High
etaredoM
Very H
i gh
ot
woL
etaredoM
Moderately High
Low Very High
Income over short term
Investments in Debtmoney
market instruments
Investors should consult their financial advisers if in doubt about whether the product is suitable for them
Schemersquos RiskometerBenchmarkrsquos Riskometer
(CRISIL Liquid Fund Index)
This Product is suitable for investors who are seeking
woL
High
etaredoM
Very H
i gh
ot
woL
etaredoM
Moderately High
Low Very High
Parag Parikh Tax Saver Fund
Parag Parikh Conservative Hybrid Fund
Parag Parikh Liquid Fund
There is no assurance that the investment objective of the Scheme will be realized and the scheme does not assure or guarantee any returns
REITs amp InvITs
Equity Investments
Fixed Income Investments
Asset allocation
Type of Instruments Normal Allocation ( of Net Assets) Risk Profile
DEBT
EQUITYREITs
InvITs
Parag Parikh Conservative Hybrid FundAn open-ended hybrid scheme investing predominantly in debt instruments
Debt and money market instruments
Equities and equity related instruments
REITsInvITs
Note
We recommend it to those
Investors should consult their financial advisers if in doubt about whether the product is suitable for them
Investment Team Details
Mr Raunak Onkar Mr Rajeev Thakkar Mr Raj Mehta
Your Distributor Financial Advisor will help you with the investing procedure
`
`
`
`
`
This product is suitable for investors who are seeking
Investors should consult their financial advisers if in doubt about whether the product is suitable for them Investors understand that their principal
will be at moderately high risk
Riskometer
Note
How to invest
Visit ---gt Distributors -----gt Create a foliowwwamcppfascom
Note Please visit the website address for latest Riskometer updates ----gt Statutory Disclosures ---gt Product Label of the Schemeshttpswwwamcppfascom
Note
PPFAS Asset Management Private Limited
MF Utilities
BSE Star MF
NSE
ICEX
Definitions
Fund Manager
This is the minimum investment amount for a new investor in a mutual fund scheme
Minimum additional amount This is the minimum investment amount for an existing investor in a mutual fund scheme
SIP
NAV
Benchmark
Entry Load
Exit Load
Standard Deviation
Sharpe Ratio
Beta
AUM
Holdings
Nature of Scheme
Portfolio Turnover Ratio
Yield to Maturity (YTM)
Modified Duration
Total Expense ratio
An employee of the asset management company such as a mutual fund or life insurer who manages investment of the scheme
He is usually part of a larger team of fund managers and research analysts
Application amount for fresh subscription
SIP or systematic investment plan work on the principle of making periodic investments of a fixed sum It works similar to a recurring
bank deposit For instance an investor may opt for an SIP that invests 500 every 15 ` th of the month in an equity fund for a period of three years
The NAV or the net asset value is the total asset value per unit of the mutual fund after deducting all related and permissible expenses The NAV
is calculated at the end of every business day It is the value at which the investor enters or exits the mutual fund
A group of securities usually a market index whose performance is used as a standard or benchmark to measure investment performance of
mutual funds among other investments Some typical benchmark include the Nifty Sensex BSE 200 BSE 500 10-year Gsec
A mutual fund may have a sales charge or load at the time of entry andor exit to compensate the distributoragent Entry load is charged at the
time an investor purchase the units of a mutual fund The entry load is added to the prevailing NAV at the time of investment For instance if the
NAV is ` 100 and the entry load is 1 the investor will enter the fund at Rs 101
Exit load is charged at the time of redeeming (or transferring an investment between schemes) The exit load percentage is deducted from the
NAV at the time of redemption (or transfer between schemes) This amount goes to the respective scheme and gets added to the AUM of that Scheme
Standard deviation is a statistical measure of the range of an investmentrsquos performance When a mutual fund Scheme has a high standard deviation its
range of performance is wide implying greater volatility
The Sharpe Ratio named after its founder the Nobel Laureate William Sharpe is a measure of risk-adjusted returns It is calculated using standard
deviation and excess return to determine reward per unit of risk
Beta is a measure of an investments volatility vis-a-vis the market Beta of less than 1 means that the security will be less volatile than the market
A beta of greater than 1 implies that the securitys price will be more volatile than the market
AUM or assets under management refers to the recent updated cumulative market value of investments managed by a mutual fund or any
investment firm
The holding or the portfolio is a mutual funds latest or updated reported statement of investmentssecurities These are usually displayed in term
of percentage to net assets or the rupee value or both The objective is to give investors an idea of where their money is being invested by the
fund manager
The investment objective and underlying investments determine the nature of the mutual fund scheme For instance a mutual fund that aims at
generating capital appreciation by investing in stock markets is an equity fund or growth fund Likewise a mutual fund that aims at capital
preservation by investing in debt markets is a debt fund or income fund Each of these categories may have sub-categories
A measure of how frequently assets within a fund are bought and sold by the managers Portfolio turnover is calculated by taking either the total
amount of new securities purchased or the amount of securities sold - whichever is less - over a particular period divided by the total net asset
value (NAV) of the fund The measurement is usually reported for a 12-month time period
The yield to maturity (YTM) of a bond or other fixed-interest security such as gilts is the (theoretical) internal rate of return (IRR overall interest rate) earned by an investor who buys the bond today at the market price assuming that the bond is held until maturity and that all coupon and principal payments are made on schedule
Modified duration is a formula that expresses the measurable change in the value of a security in response to a change in interest rates Modified duration follows the concept that interest rates and bond prices move in opposite directions
The total expense ratio (TER) is a measure of the total cost of a fund to the investor Total costs may include various fees (purchase redemption auditing) and other expenses The TER calculated by dividing the total annual cost by the fundstotal assets averaged over that year is denoted as a percentage
FACT SHEET - OCTOBER 2021
Toll Free 1800-266-7790 | Email mfppfascom
Call 1800-266-7790 (Toll Free) or 91-22-61406538 | E-Mail partnersppfascom
Registered Office 8182 8th Floor Sakhar Bhavan Ramnath Goenka Marg 230 Nariman Point Mumbai - 400 021 INDIA
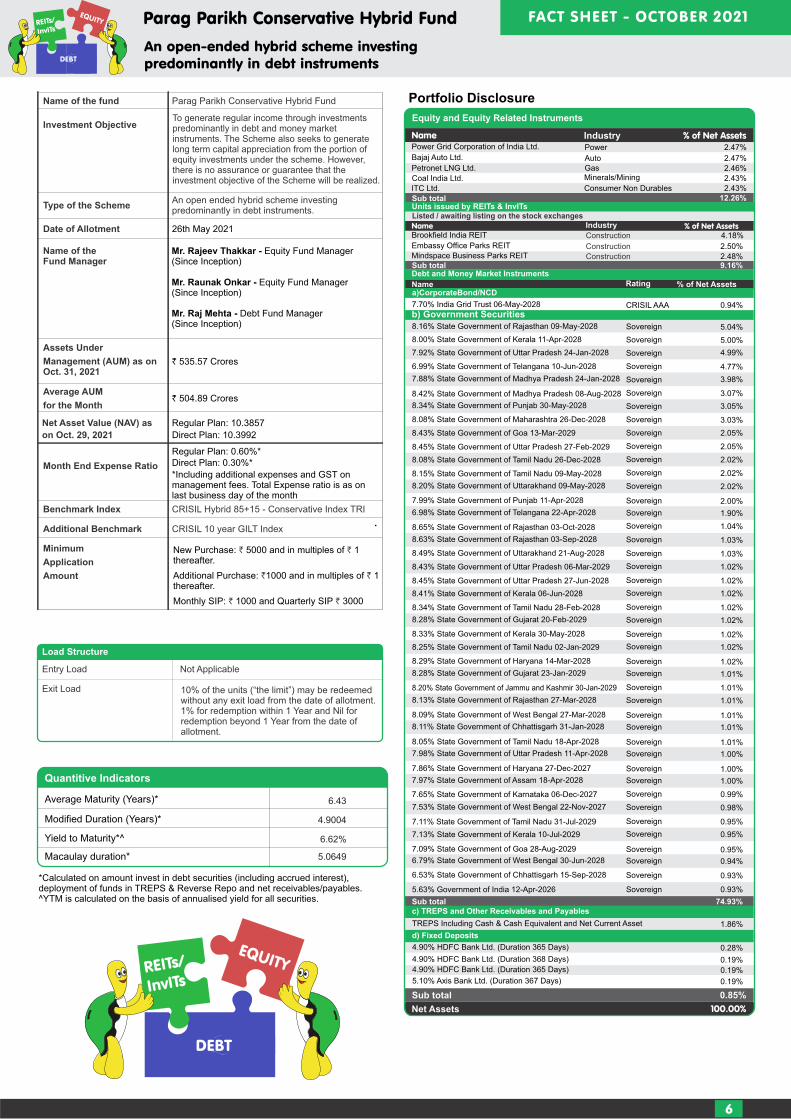
Quantitative IndicatorsBeta069Standard Deviation0115Sharpe Ratio053Portfolio Turnover (excl Equity Arbitrage)01192Portfolio Turnover (incl Equity Arbitrage)18617
Portfolio DisclosureName of the fund Parag Parikh Conservative Hybrid Fund
Investment Objective
Type of the Scheme
Date of Allotment 26th May 2021
Benchmark Index CRISIL Hybrid 85+15 - Conservative Index TRI
CRISIL 10 year GILT Index
To generate regular income through investments predominantly in debt and money market instruments The Scheme also seeks to generate long term capital appreciation from the portion of equity investments under the scheme However there is no assurance or guarantee that the investment objective of the Scheme will be realized
An open ended hybrid scheme investing predominantly in debt instruments
Name of theFund Manager
Assets Under
Management (AUM) as onOct 31 2021
Average AUM
for the Month` 50489 Crores
Month End Expense Ratio
Regular Plan 060 Direct Plan 030
Including additional expenses and GST on management fees Total Expense ratio is as on last business day of the month
Additional Benchmark
Minimum
Application
Amount
Quantitive Indicators
Calculated on amount invest in debt securities (including accrued interest) deployment of funds in TREPS amp Reverse Repo and net receivablespayables^YTM is calculated on the basis of annualised yield for all securities
Average Maturity (Years) 643
49004
662
Modified Duration (Years)
Yield to Maturity^
Macaulay duration 50649
Entry Load Not Applicable
Exit Load
Load Structure
FACT SHEET - OCTOBER 2021
Name of Net Assets
Net Assets 10000
6
` 53557 Crores
REITsInvITs Parag Parikh Conservative Hybrid Fund
An open-ended hybrid scheme investing predominantly in debt instruments
DEBT
EQUITYREITs
InvITs
Equity and Equity Related Instruments
770 India Grid Trust 06-May-2028 094b) Government Securities
Units issued by REITs amp InvITsListed awaiting listing on the stock exchanges
Brookfield India REIT
Embassy Office Parks REIT
Mindspace Business Parks REIT
Debt and Money Market Instruments
Name of Net AssetsRatinga)CorporateBondNCD
c) TREPS and Other Receivables and Payables
TREPS Including Cash amp Cash Equivalent and Net Current Asset 186
d) Fixed Deposits
Mr Rajeev Thakkar - Equity Fund Manager (Since Inception)
Mr Raj Mehta - Debt Fund Manager (Since Inception)
Mr Raunak Onkar - Equity Fund Manager (Since Inception)
Net Asset Value (NAV) as
on Oct 29 2021
Regular Plan 103857
Direct Plan 103992
New Purchase 5000 and in multiples of 1 ` `thereafter
Additional Purchase 1000 and in multiples of 1 ` `thereafter
Monthly SIP 1000 and Quarterly SIP 3000` `
10 of the units (ldquothe limitrdquo) may be redeemed without any exit load from the date of allotment1 for redemption within 1 Year and Nil for redemption beyond 1 Year from the date of allotment
CRISIL AAA
1226Sub total
085Sub total
916Sub total
Industry
Name of Net AssetsIndustry
Construction
Construction
Construction
7493Sub total
418
250
248
490 HDFC Bank Ltd (Duration 365 Days) 028
490 HDFC Bank Ltd (Duration 368 Days) 019490 HDFC Bank Ltd (Duration 365 Days) 019
510 Axis Bank Ltd (Duration 367 Days) 019
Power Grid Corporation of India Ltd Power 247
Auto 247Gas 246
Coal India Ltd MineralsMining 243
ITC Ltd 243
563 Government of India 12-Apr-2026 Sovereign 093
Bajaj Auto Ltd
Petronet LNG Ltd
Consumer Non Durables
DEBT
EQUITYREITs
InvITs
Sovereign
Sovereign
834 State Government of Punjab 30-May-2028
808 State Government of Maharashtra 26-Dec-2028
843 State Government of Goa 13-Mar-2029
816 State Government of Rajasthan 09-May-2028
800 State Government of Kerala 11-Apr-2028
792 State Government of Uttar Pradesh 24-Jan-2028
699 State Government of Telangana 10-Jun-2028
788 State Government of Madhya Pradesh 24-Jan-2028
842 State Government of Madhya Pradesh 08-Aug-2028
799 State Government of Punjab 11-Apr-2028
828 State Government of Gujarat 20-Feb-2029
828 State Government of Gujarat 23-Jan-2029
809 State Government of West Bengal 27-Mar-2028
797 State Government of Assam 18-Apr-2028
845 State Government of Uttar Pradesh 27-Feb-2029
808 State Government of Tamil Nadu 26-Dec-2028
815 State Government of Tamil Nadu 09-May-2028
820 State Government of Uttarakhand 09-May-2028
698 State Government of Telangana 22-Apr-2028
865 State Government of Rajasthan 03-Oct-2028
863 State Government of Rajasthan 03-Sep-2028
849 State Government of Uttarakhand 21-Aug-2028
843 State Government of Uttar Pradesh 06-Mar-2029
845 State Government of Uttar Pradesh 27-Jun-2028
841 State Government of Kerala 06-Jun-2028
834 State Government of Tamil Nadu 28-Feb-2028
833 State Government of Kerala 30-May-2028
825 State Government of Tamil Nadu 02-Jan-2029
829 State Government of Haryana 14-Mar-2028
820 State Government of Jammu and Kashmir 30-Jan-2029
813 State Government of Rajasthan 27-Mar-2028
811 State Government of Chhattisgarh 31-Jan-2028
805 State Government of Tamil Nadu 18-Apr-2028
798 State Government of Uttar Pradesh 11-Apr-2028
786 State Government of Haryana 27-Dec-2027
765 State Government of Karnataka 06-Dec-2027
753 State Government of West Bengal 22-Nov-2027
709 State Government of Goa 28-Aug-2029
679 State Government of West Bengal 30-Jun-2028
711 State Government of Tamil Nadu 31-Jul-2029
713 State Government of Kerala 10-Jul-2029
653 State Government of Chhattisgarh 15-Sep-2028
Sovereign
Sovereign
Sovereign
Sovereign
Sovereign
Sovereign
Sovereign
Sovereign
Sovereign
Sovereign
Sovereign
Sovereign
Sovereign
Sovereign
Sovereign
Sovereign
Sovereign
Sovereign
Sovereign
Sovereign
Sovereign
Sovereign
Sovereign
Sovereign
Sovereign
Sovereign
Sovereign
Sovereign
Sovereign
Sovereign
Sovereign
Sovereign
Sovereign
Sovereign
Sovereign
Sovereign
Sovereign
Sovereign
Sovereign
Sovereign
504
500
499
477
398
307
305
303
205
205
202
202
202
200
190
104
103
103
102
102
102
102
102
102
102
102
101
101
101
101
101
101
100
100
100
099
098
095
095
095
094
093
Asset Allocation by Asset Class Asset Allocation by Rating
We have our Skin in the Game
The combined holding of Insiders in Parag Parikh Conservative Hybrid
Fund amounts to For more ` 573 Crores of AUM as at October 29 2021
details please
7
REITsInvITs
Equity
Debt
FACT SHEET - OCTOBER 2021
REITsInvITs
Parag Parikh Conservative Hybrid Fund
An open-ended hybrid scheme investing predominantly in debt instruments
Source Internal sources Source Internal sources
Dividend History - Monthly Income Distribution cum capital Withdrawal option
Record datePayout Date
DirectRetail RetailCorporate Corporate
Regular
30th Aug 2021 01124 01067
Face ValueRegular
10 100100
NAV per Unit (Ex IDCW)
01124 01067
DirectNAV per Unit (Ex IDCW)
100100
RegularNAV per Unit (Cum IDCW)
101167
DirectNAV per Unit (Cum IDCW)
101224
27th Sept 2021 00680 00680 00667 00667 10 101335 101343 102002 102023
7493G sec and SDL
1226Equity and Equity
Related Instruments
271TREPS Fixed Deposit
Net receivables amp Payables and
Net Current Asset094
Corporate Bond
916REITs and InvITs
271TREPS Fixed Deposit and
Net Receivables amp Payables
916REITs and InvITs
7493Sovereign
094AAA
1226Equity and Equity
Related Instruments
Total number of units held in Parag Parikh Conservative Hybrid Fund as per SEBI Circular relating to Alignment of interest of Key Employees (Designated Employees) of Asset Management Companies (AMCs) with the unitholders of the Mutual Fund Schemes (dated April 28 2021 read with September 20 2021) as at 31-10-2021
1965767Parag Parikh Conservative Hybrid Fund - Direct Plan Growth
Scheme Units AUM (in Rs)
194077
th25 Oct 2021 00597 00597 00340 00340 10 101762 101541 102102 102138
Quantitative IndicatorsBeta069Standard Deviation0115Sharpe Ratio053Portfolio Turnover (excl Equity Arbitrage)01192Portfolio Turnover (incl Equity Arbitrage)18617
Portfolio DisclosureName of the fund Parag Parikh Liquid Fund
Investment Objective
Type of the Scheme
Date of Allotment May 11 2018
Benchmark Index CRISIL Liquid fund index
CRISIL 1 Year T-Bill index
To deliver reasonable market related returns with lower risk and high liquidity through judicious investments in money market and debt instruments (Non Guaranteed)
An Open-ended Liquid Scheme
Name of theFund Manager
Mr Raj Mehta
(Since Inception)
Assets Under
Management (AUM) as onOct 31 2021
Average AUM
for the Month` 48 Crores1501
Month End Expense Ratio
Regular Plan 026 Direct Plan 016
Including additional expenses and GST on management fees Total Expense ratio is as on last business day of the month
Additional Benchmark
Minimum
Application
Amount
New Purchase ` 5000
Additional Purchase ` 1000
Monthly SIP ` 1000
NAV Details
Plan
Growth
Daily Reinvestment of Income Distributioncum capital withdrawal option
Weekly Reinvestment of Income Distribution cum capital withdrawal option
Monthly Income Distribution cum capital withdrawal option
Direct Regular
Quantitive Indicators
Computed on the invested amount
Average Maturity (Days) 4274
01106
34460
Modified duration (Years)
Yield to Maturity
Macaulay Duration (Years) 01145
Entry Load Not Applicable
For purpose of levying exit load if subscription (application amp funds) is received
within cut-off time on a day Day 1 shall be considered to be the same day else the
day after the date of allotment of units shall be considered as Day 1
Day of redemption switch from the date
of applicable NAV
Day 1 00070
Day 2 00065
Day 3 00060
Day 4 00055
Day 5 00050
Day 6 00045
Day 7 onwards 00000
Exit load as a ofredemption
switch proceeds
Exit Load
Load Structure
FACT SHEET - OCTOBER 2021
a) Debt and Money Market Instruments
Name Rating of Net AssetsSovereign
Sovereign
Sovereign
Sovereign
Sovereign
Sovereign
Sovereign
Sovereign
Sovereign
Sovereign
b) Government Securities
e) Fixed Deposits
Net Assets 10000
d) TREPS and Other Receivables and Payables
TREPS Including Net ReceivablesPayables and Net Current Asset 475
FDR 057
11745668 11703612
Sovereign
10005404
10014319
10034328
10005404
10014154
10034163
8
Sovereign
` 01 Crores1495
Sovereign
879 Government of India 08-Nov-2021 937Sovereign
Dividend History - Monthly Income Distribution cum capital Withdrawal option
Record datePayout Date
DirectRetail RetailCorporate Corporate
Regular
30th Aug 2021 ` 31956 ` 30988
Face Value
1000
Regular
10030000` 31956 ` 30988
NAV per Unit (Ex IDCW)
Direct
NAV per Unit (Ex IDCW)
10030000
Regular
NAV per Unit (Cum IDCW)
10060988
Direct
NAV per Unit (Cum IDCW)
10061956
27th Sept 2021 ` 22916 ` 22147 1000` 22916 ` 22147 10030000 10030000 10052147 10052916
Quarterly SIP ` 3000-
Dividend History - Monthly Income Distribution cum capital Withdrawal option
Record datePayout Date
DirectRetail RetailCorporate Corporate
Regular
c) Commercial Paper
d) Certificate of Deposit
National Bank for Agriculture and Rural Development 10-Jun-2021
A1+ 077Axis Bank Ltd 10-Jun-2021
A1+ 077
A1+ 036
28th June 2021 ` 248 ` 24` 248 ` 24
National Bank for Agriculture and Rural Development 31-Aug-2021
26th July 2021 ` 254 ` 246` 254 ` 246
30th Aug 2021 ` 319 ` 309` 319 ` 309
Face Value
1000
1000
1000
Prevailing NAV
10060034
10053757
10053176
91 DAY T-BILL 13-Jan-2022 830
91 DAY T-BILL 20-Jan-2022 830
91 DAY T-BILL 04-Nov-2021 669
182 DAY T-BILL 18-Nov-2021 668
182 DAY T-BILL 25-Nov-2021 667
91 DAY T-BILL 02-Dec-2021 667
182 DAY T-BILL 09-Dec-2021 667
182 DAY T-BILL 16-Dec-2021 666
91 DAY T-BILL 23-Dec-2021 666
182 DAY T-BILL 30-Dec-2021 665
91 DAY T-BILL 06-Jan-2022 665
182 DAY T-BILL 23-Dec-2021 333
182 DAY T-BILL 02-Dec-2021 267
870 State Government of Kerala 25-Jan-2022
c) State Government Securities
271Sovereign
th25 Oct 2021 ` 24257 ` 23485 1000` 24257 ` 23485 10030000 10030000 10053485 10054257
Note
Different plans shall have different expense structures
Scheme returns shown are for regular plan
Past performance may or may not be sustained in the future
Greater than 1 year returns are CAGR returns
Data presented here is upto the last calendar month
We have our Skin in the Game
Asset Allocation by Asset Class Asset Allocation by Rating
FACT SHEET - OCTOBER 2021
Less than 1 year returns are simple annualised returns
The combined holding of Insiders in Parag Parikh Liquid Fund amounts to
` 4495 Crores of AUM as at October 29 2021 For more details please
9
Source Internal sources Source Internal sources
Date
Scheme Benchmark Additional Benchmark Value of Investment of Rs 10000-
CRISIL 1 year T-bill Index
557 602
285 -058
291 060
335 143
355 351
PPLF (Regular)
CRISIL Liquid Fund Index
PPLF (Regular)
CRISIL Liquid Fund Index
CRISIL 1 year T-bill Index
Lumpsum Investment Performance (Compounded annual returns)
11704
10005
10013
10026
10305
12075 12254
10005 9999
10014 10003
10028 10012
10357 10353
524 601 11365 11658 11915
Since inception returns are calculated on Rs 1000 (allotment price)
463
266
272
303
303
435
Since Inception (11 May 2018)
October 24 2021 to October 31 2021 (Last 7 Days)
October 14 2021 to October 31 2021 (Last 15 days)
September 30 2021 to October 31 2021 (Last 1 Month)
October 29 2020 to October 31 2021 (Last 1 year)
October 31 2018 to October 31 2021 (Last 3 year)
Date
Scheme Benchmark Additional Benchmark Value of Investment of Rs 10000-
CRISIL 1 year T-bill Index
PPLF (Regular)
PPLF (Direct)
PPLF (Direct)
CRISIL Liquid Fund Index
PPLF (Regular)
CRISIL Liquid Fund Index
CRISIL 1 year T-bill Index
Lumpsum Investment Performance (Compounded annual returns)
Since inception returns are calculated on Rs 1000 (allotment price)
557 602
285 -058
291 060
335 143
355 351
11704
10005
10013
10026
10305
12075 12254
10005 9999
10014 10003
10028 10012
10357 10353
524 601 11365 11658 11915
463
266
272
303
303
435
Since Inception (11 May 2018)
Oct 24 2021 to Oct 31 2021 (Last 7 Days)
Oct 14 2021 to Oct 31 2021 (Last 15 days)
Sept 30 2021 to Oct 31 2021 (Last 1 Month)
Oct 29 2020 to Oct 31 2021 (Last 1 year)
Oct 31 2018 to Oct 31 2021 (Last 3 year)
474
276
282
313
314
446
11746
10005
10013
10027
10315
11400
8260Treasury Bills
1208G Sec
532TREPS Fixed Deposit
Net receivables amp Payables and
Net Current Asset
9468Sovereign
532TREPS Fixed Deposit and
Net Receivables amp Payables
Sovereign
A1+
TREPS Fixed Deposit and Net receivables amp Payables
Total number of units held in Parag Parikh Liquid Fund as per SEBI Circular relating to Alignment of interest of Key Employees (Designated Employees) of Asset Management Companies (AMCs) with the unitholders of the Mutual Fund Schemes (dated April 28 2021 read with September 20 2021) as at 31-10-2021
5425534Parag Parikh Liquid Fund Direct Plan Growth
Scheme Units AUM (in Rs)
4620
FACT SHEET - OCTOBER 2021
10
Scheme Date of Allotment Date
Value of investment of Rs 10000-
NIFTY 500 (TRI) NIFTY 50 (TRI) NIFTY 500 (TRI)
th24 May 2013
Since Inception 2109 1623 1515 50271 35566 32876
1 Year 6160 5928 5372 16139 15908 15354
3 Year 2988 2124 2082 21894 17812 17625
5 Year 2178 1635 1681 26815 21335 21761
th24 July 2019
Since Inception 3077 2594 2333 18379 16875 16090
1 Year 4959 5928 5372 14942 15908 15354
3 Year NA NA NA NA NA NA
5 Year NA NA NA NA NA NA
Scheme Return
Benchmark Return ()
Additional Benchmark Return
()
Scheme Return (Rs)
NIFTY 50 (TRI)
Parag Parikh
Flexi Cap
Fund
Parag Parikh
Tax Saver
Fund
Fund Manager Name Mr Rajeev Thakkar
Mr Rajeev Thakkar Manages two schemes of PPFAS Mutual Fund
Fund Manager Name Mr Raunak Onkar
Mr Raunak Onkar Manages two schemes of PPFAS Mutual Fund
Fund Manager Name Mr Raj Mehta
Mr Raj Mehta Manages three schemes of PPFAS Mutual Fund
Scheme Date of Allotment Date
Value of investment of Rs 10000-
CRISIL Liquid Fund Index
th11 May 2018
Since Inception 463 557 602 11704 12075 12254
1 Year 303 355 351 10305 10357 10353
3 Year 435 524 601 11365 11658 11915
5 Year NA NA NA NA NA NA
Scheme Return
Benchmark Return ()
Additional Benchmark Return
()
Crisil Liquid Fund Index
CRISIL 1 year T-bill
IndexScheme Return
(Rs) CRISIL 1 Year
T-bill Index
Parag ParikhLiquid Fund
Since inception returns are calculated on Rs 10 (allotment price)
Since inception returns are calculated on Rs 1000 (allotment price)
Past Performance may or may not be sustained in future
The performance details provided herein are of regular plan growth option Regular and Direct Plans have different expense structure
Direct Plan shall have a lower expense ratio excluding distribution expenses commission expenses etc
All 3 Fund Managers also manage Parag Parikh Conservative Hybrid Fund since May 28 2021 However performance of the scheme
has not been included because It has not yet completed six months duration since inception
Scheme Date of Allotment Date
Value of investment of Rs 10000-
NIFTY 500 (TRI) NIFTY 50 (TRI) NIFTY 500 (TRI)
th24 May 2013
Since Inception 2109 1623 1515 50271 35566 32876
1 Year 6160 5928 5372 16139 15908 15354
3 Year 2988 2124 2082 21894 17812 17625
5 Year 2178 1635 1681 26815 21335 21761
th24 July 2019
Since Inception 3077 2594 2333 18379 16875 16090
1 Year 4959 5928 5372 14942 15908 15354
3 Year NA NA NA NA NA NA
5 Year NA NA NA NA NA NA
Scheme Return
Benchmark Return ()
Additional Benchmark Return
()
Scheme Return (Rs)
NIFTY 50 (TRI)
Parag Parikh
Flexi Cap
Fund
Parag Parikh
Tax Saver
Fund
Scheme Date of Allotment Date
Value of investment of Rs 10000-
NIFTY 500 (TRI) NIFTY 50 (TRI) NIFTY 500 (TRI)
th24 May 2013
Since Inception 2109 1623 1515 50271 35566 32876
1 Year 6160 5928 5372 16139 15908 15354
3 Year 2988 2124 2082 21894 17812 17625
5 Year 2178 1635 1681 26815 21335 21761
th24 July 2019
Since Inception 3077 2594 2333 18379 16875 16090
1 Year 4959 5928 5372 14942 15908 15354
3 Year NA NA NA NA NA NA
5 Year NA NA NA NA NA NA
Scheme Return
Benchmark Return ()
Additional Benchmark Return
()
Scheme Return (Rs)
NIFTY 50 (TRI)
Parag Parikh
Flexi Cap
Fund
Parag Parikh
Tax Saver
Fund
FACT SHEET - OCTOBER 2021
11
Parag Parikh Flexi Cap Fund
Investors understand that their principalwill be at very high risk
woL
High
tearedoM
Very High
ot woL
etaredoM
Moderately High
Low Very High
Investors should consult their financial advisers if in doubt about whether the
product is suitable for them
Parag Parikh Tax Saver Fund
Investors understand that their principalwill be at very high risk
woL
High
tearedoM
Very High
ot woL
etaredoM
Moderately High
Low Very HighInvestors should consult their financial advisers if in doubt about whether the product is suitable for them
This product is suitable for investors who are seeking
Long term capital appreciation
Investment predominantly in equity and equity related securities
This Product is suitable for investors who are seeking
The investment objective of the Scheme is to seek to generate long-term capital growth from an
actively managed portfolio primarily of Equity and Equity Related Securities Scheme shall invest
in Indian equitiesforeign equities and related instruments and debt securities
Parag Parikh Conservative Hybrid Fund
This product is suitable for investors who are seeking
Long term capital appreciation from the portion of equity investments under the scheme
Investors should consult their financial advisers if in doubt about whether the product
is suitable for them
To generate regular income through investments predominantly in debt and money market
instruments
Investors understand that their principalwill be at moderately high risk
Investors understand that their principalwill be at low risk
woL
High
tearedoM
Very High
ot woL
etaredoM
Moderately High
Low Very High
Parag Parikh Liquid Fund
This product is suitable for investors who are seeking
Investors should consult their financial advisers if in doubt about
whether the product is suitable for them
Income over short term
Investments in Debtmoney market instruments
Riskometer
Riskometer
Riskometer
Riskometer
Investors understand that their principalwill be at very high risk
woL
High
etaredoM
Very H
i gh
ot
woL
etaredoM
Moderately High
Low Very High
Investors should consult their financial advisers if in doubt about whether the product is suitable for them
Parag Parikh Flexi Cap Fund
Schemersquos Riskometer
woL
High
etaredoM
Very H
i gh
ot
woL
etaredoM
Moderately High
Low Very High
Benchmarkrsquos Riskometer (Nifty 500 TRI)
This Product is suitable for investors who are seeking
The investment objective of the Scheme
is to seek to generate long-term capital
growth from an actively managed portfolio
primarily of Equity and Equity Related
Securities Scheme shall invest in Indian
equities foreign equities and related
instruments and debt securities
Long term capital appreciation
Investment predominantly in equity
and equity related securities
Investors understand that their principalwill be at very high risk
woL
High
etaredoM
Very H
i gh
ot
woL
etaredoM
Moderately High
Low Very High
Investors should consult their financial advisers if in doubt about whether the product is suitable for them
Schemersquos Riskometer
woL
High
etaredoM
Very H
i gh
ot
woL
etaredoM
Moderately High
Low Very High
Benchmarkrsquos Riskometer (Nifty 500 TRI)
This Product is suitable for investors who are seeking
Investors should consult their financial advisers if in doubt about whether the product is suitable for them
Schemersquos RiskometerBenchmarkrsquos Riskometer
(CRISIL Hybrid 85+15 Conservative Index TRI)
This Product is suitable for investors who are seeking
To generate regular income through
investments predominantly in debt and
money market instruments
Long term capital appreciation from the portion of equity investments under the scheme Investors understand that their principal
will be at moderately high risk
Investors understand that their principalwill be at low to moderate risk
woL
High
etaredoM
Very H
i gh
ot
woL
etaredoM
Moderately High
Low Very High
Income over short term
Investments in Debtmoney
market instruments
Investors should consult their financial advisers if in doubt about whether the product is suitable for them
Schemersquos RiskometerBenchmarkrsquos Riskometer
(CRISIL Liquid Fund Index)
This Product is suitable for investors who are seeking
woL
High
etaredoM
Very H
i gh
ot
woL
etaredoM
Moderately High
Low Very High
Parag Parikh Tax Saver Fund
Parag Parikh Conservative Hybrid Fund
Parag Parikh Liquid Fund
There is no assurance that the investment objective of the Scheme will be realized and the scheme does not assure or guarantee any returns
REITs amp InvITs
Equity Investments
Fixed Income Investments
Asset allocation
Type of Instruments Normal Allocation ( of Net Assets) Risk Profile
DEBT
EQUITYREITs
InvITs
Parag Parikh Conservative Hybrid FundAn open-ended hybrid scheme investing predominantly in debt instruments
Debt and money market instruments
Equities and equity related instruments
REITsInvITs
Note
We recommend it to those
Investors should consult their financial advisers if in doubt about whether the product is suitable for them
Investment Team Details
Mr Raunak Onkar Mr Rajeev Thakkar Mr Raj Mehta
Your Distributor Financial Advisor will help you with the investing procedure
`
`
`
`
`
This product is suitable for investors who are seeking
Investors should consult their financial advisers if in doubt about whether the product is suitable for them Investors understand that their principal
will be at moderately high risk
Riskometer
Note
How to invest
Visit ---gt Distributors -----gt Create a foliowwwamcppfascom
Note Please visit the website address for latest Riskometer updates ----gt Statutory Disclosures ---gt Product Label of the Schemeshttpswwwamcppfascom
Note
PPFAS Asset Management Private Limited
MF Utilities
BSE Star MF
NSE
ICEX
Definitions
Fund Manager
This is the minimum investment amount for a new investor in a mutual fund scheme
Minimum additional amount This is the minimum investment amount for an existing investor in a mutual fund scheme
SIP
NAV
Benchmark
Entry Load
Exit Load
Standard Deviation
Sharpe Ratio
Beta
AUM
Holdings
Nature of Scheme
Portfolio Turnover Ratio
Yield to Maturity (YTM)
Modified Duration
Total Expense ratio
An employee of the asset management company such as a mutual fund or life insurer who manages investment of the scheme
He is usually part of a larger team of fund managers and research analysts
Application amount for fresh subscription
SIP or systematic investment plan work on the principle of making periodic investments of a fixed sum It works similar to a recurring
bank deposit For instance an investor may opt for an SIP that invests 500 every 15 ` th of the month in an equity fund for a period of three years
The NAV or the net asset value is the total asset value per unit of the mutual fund after deducting all related and permissible expenses The NAV
is calculated at the end of every business day It is the value at which the investor enters or exits the mutual fund
A group of securities usually a market index whose performance is used as a standard or benchmark to measure investment performance of
mutual funds among other investments Some typical benchmark include the Nifty Sensex BSE 200 BSE 500 10-year Gsec
A mutual fund may have a sales charge or load at the time of entry andor exit to compensate the distributoragent Entry load is charged at the
time an investor purchase the units of a mutual fund The entry load is added to the prevailing NAV at the time of investment For instance if the
NAV is ` 100 and the entry load is 1 the investor will enter the fund at Rs 101
Exit load is charged at the time of redeeming (or transferring an investment between schemes) The exit load percentage is deducted from the
NAV at the time of redemption (or transfer between schemes) This amount goes to the respective scheme and gets added to the AUM of that Scheme
Standard deviation is a statistical measure of the range of an investmentrsquos performance When a mutual fund Scheme has a high standard deviation its
range of performance is wide implying greater volatility
The Sharpe Ratio named after its founder the Nobel Laureate William Sharpe is a measure of risk-adjusted returns It is calculated using standard
deviation and excess return to determine reward per unit of risk
Beta is a measure of an investments volatility vis-a-vis the market Beta of less than 1 means that the security will be less volatile than the market
A beta of greater than 1 implies that the securitys price will be more volatile than the market
AUM or assets under management refers to the recent updated cumulative market value of investments managed by a mutual fund or any
investment firm
The holding or the portfolio is a mutual funds latest or updated reported statement of investmentssecurities These are usually displayed in term
of percentage to net assets or the rupee value or both The objective is to give investors an idea of where their money is being invested by the
fund manager
The investment objective and underlying investments determine the nature of the mutual fund scheme For instance a mutual fund that aims at
generating capital appreciation by investing in stock markets is an equity fund or growth fund Likewise a mutual fund that aims at capital
preservation by investing in debt markets is a debt fund or income fund Each of these categories may have sub-categories
A measure of how frequently assets within a fund are bought and sold by the managers Portfolio turnover is calculated by taking either the total
amount of new securities purchased or the amount of securities sold - whichever is less - over a particular period divided by the total net asset
value (NAV) of the fund The measurement is usually reported for a 12-month time period
The yield to maturity (YTM) of a bond or other fixed-interest security such as gilts is the (theoretical) internal rate of return (IRR overall interest rate) earned by an investor who buys the bond today at the market price assuming that the bond is held until maturity and that all coupon and principal payments are made on schedule
Modified duration is a formula that expresses the measurable change in the value of a security in response to a change in interest rates Modified duration follows the concept that interest rates and bond prices move in opposite directions
The total expense ratio (TER) is a measure of the total cost of a fund to the investor Total costs may include various fees (purchase redemption auditing) and other expenses The TER calculated by dividing the total annual cost by the fundstotal assets averaged over that year is denoted as a percentage
FACT SHEET - OCTOBER 2021
Toll Free 1800-266-7790 | Email mfppfascom
Call 1800-266-7790 (Toll Free) or 91-22-61406538 | E-Mail partnersppfascom
Registered Office 8182 8th Floor Sakhar Bhavan Ramnath Goenka Marg 230 Nariman Point Mumbai - 400 021 INDIA
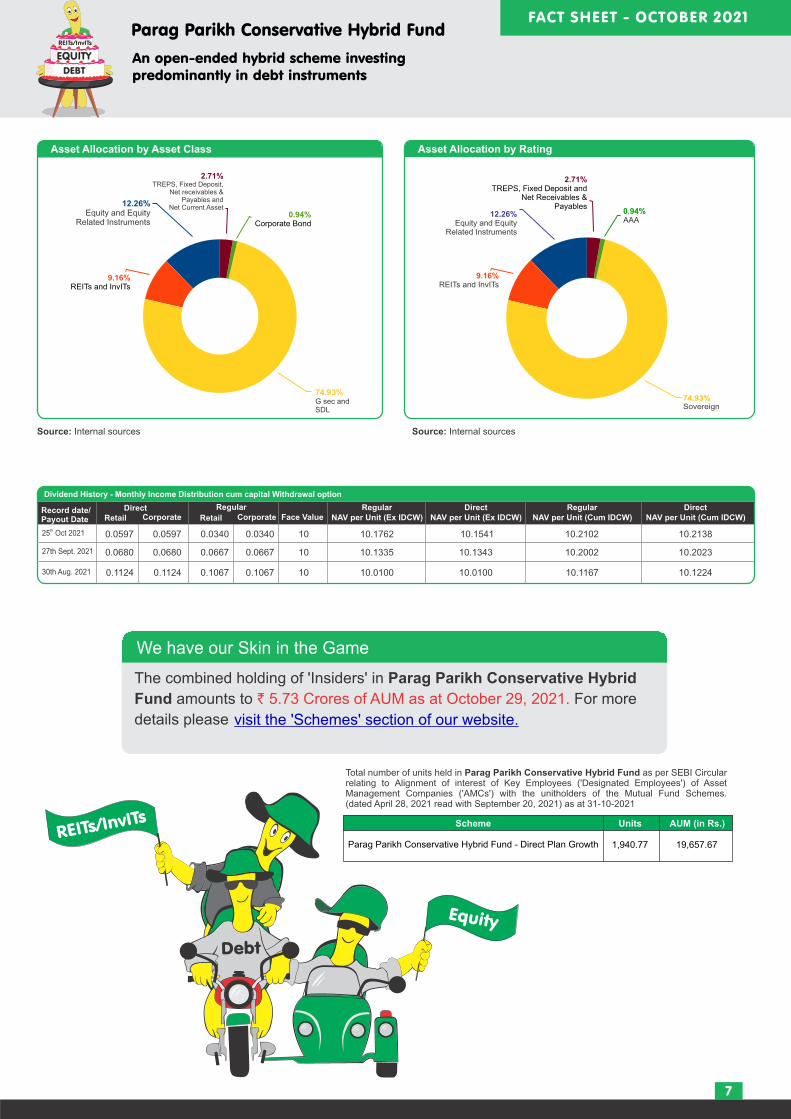
Asset Allocation by Asset Class Asset Allocation by Rating
We have our Skin in the Game
The combined holding of Insiders in Parag Parikh Conservative Hybrid
Fund amounts to For more ` 573 Crores of AUM as at October 29 2021
details please
7
REITsInvITs
Equity
Debt
FACT SHEET - OCTOBER 2021
REITsInvITs
Parag Parikh Conservative Hybrid Fund
An open-ended hybrid scheme investing predominantly in debt instruments
Source Internal sources Source Internal sources
Dividend History - Monthly Income Distribution cum capital Withdrawal option
Record datePayout Date
DirectRetail RetailCorporate Corporate
Regular
30th Aug 2021 01124 01067
Face ValueRegular
10 100100
NAV per Unit (Ex IDCW)
01124 01067
DirectNAV per Unit (Ex IDCW)
100100
RegularNAV per Unit (Cum IDCW)
101167
DirectNAV per Unit (Cum IDCW)
101224
27th Sept 2021 00680 00680 00667 00667 10 101335 101343 102002 102023
7493G sec and SDL
1226Equity and Equity
Related Instruments
271TREPS Fixed Deposit
Net receivables amp Payables and
Net Current Asset094
Corporate Bond
916REITs and InvITs
271TREPS Fixed Deposit and
Net Receivables amp Payables
916REITs and InvITs
7493Sovereign
094AAA
1226Equity and Equity
Related Instruments
Total number of units held in Parag Parikh Conservative Hybrid Fund as per SEBI Circular relating to Alignment of interest of Key Employees (Designated Employees) of Asset Management Companies (AMCs) with the unitholders of the Mutual Fund Schemes (dated April 28 2021 read with September 20 2021) as at 31-10-2021
1965767Parag Parikh Conservative Hybrid Fund - Direct Plan Growth
Scheme Units AUM (in Rs)
194077
th25 Oct 2021 00597 00597 00340 00340 10 101762 101541 102102 102138
Quantitative IndicatorsBeta069Standard Deviation0115Sharpe Ratio053Portfolio Turnover (excl Equity Arbitrage)01192Portfolio Turnover (incl Equity Arbitrage)18617
Portfolio DisclosureName of the fund Parag Parikh Liquid Fund
Investment Objective
Type of the Scheme
Date of Allotment May 11 2018
Benchmark Index CRISIL Liquid fund index
CRISIL 1 Year T-Bill index
To deliver reasonable market related returns with lower risk and high liquidity through judicious investments in money market and debt instruments (Non Guaranteed)
An Open-ended Liquid Scheme
Name of theFund Manager
Mr Raj Mehta
(Since Inception)
Assets Under
Management (AUM) as onOct 31 2021
Average AUM
for the Month` 48 Crores1501
Month End Expense Ratio
Regular Plan 026 Direct Plan 016
Including additional expenses and GST on management fees Total Expense ratio is as on last business day of the month
Additional Benchmark
Minimum
Application
Amount
New Purchase ` 5000
Additional Purchase ` 1000
Monthly SIP ` 1000
NAV Details
Plan
Growth
Daily Reinvestment of Income Distributioncum capital withdrawal option
Weekly Reinvestment of Income Distribution cum capital withdrawal option
Monthly Income Distribution cum capital withdrawal option
Direct Regular
Quantitive Indicators
Computed on the invested amount
Average Maturity (Days) 4274
01106
34460
Modified duration (Years)
Yield to Maturity
Macaulay Duration (Years) 01145
Entry Load Not Applicable
For purpose of levying exit load if subscription (application amp funds) is received
within cut-off time on a day Day 1 shall be considered to be the same day else the
day after the date of allotment of units shall be considered as Day 1
Day of redemption switch from the date
of applicable NAV
Day 1 00070
Day 2 00065
Day 3 00060
Day 4 00055
Day 5 00050
Day 6 00045
Day 7 onwards 00000
Exit load as a ofredemption
switch proceeds
Exit Load
Load Structure
FACT SHEET - OCTOBER 2021
a) Debt and Money Market Instruments
Name Rating of Net AssetsSovereign
Sovereign
Sovereign
Sovereign
Sovereign
Sovereign
Sovereign
Sovereign
Sovereign
Sovereign
b) Government Securities
e) Fixed Deposits
Net Assets 10000
d) TREPS and Other Receivables and Payables
TREPS Including Net ReceivablesPayables and Net Current Asset 475
FDR 057
11745668 11703612
Sovereign
10005404
10014319
10034328
10005404
10014154
10034163
8
Sovereign
` 01 Crores1495
Sovereign
879 Government of India 08-Nov-2021 937Sovereign
Dividend History - Monthly Income Distribution cum capital Withdrawal option
Record datePayout Date
DirectRetail RetailCorporate Corporate
Regular
30th Aug 2021 ` 31956 ` 30988
Face Value
1000
Regular
10030000` 31956 ` 30988
NAV per Unit (Ex IDCW)
Direct
NAV per Unit (Ex IDCW)
10030000
Regular
NAV per Unit (Cum IDCW)
10060988
Direct
NAV per Unit (Cum IDCW)
10061956
27th Sept 2021 ` 22916 ` 22147 1000` 22916 ` 22147 10030000 10030000 10052147 10052916
Quarterly SIP ` 3000-
Dividend History - Monthly Income Distribution cum capital Withdrawal option
Record datePayout Date
DirectRetail RetailCorporate Corporate
Regular
c) Commercial Paper
d) Certificate of Deposit
National Bank for Agriculture and Rural Development 10-Jun-2021
A1+ 077Axis Bank Ltd 10-Jun-2021
A1+ 077
A1+ 036
28th June 2021 ` 248 ` 24` 248 ` 24
National Bank for Agriculture and Rural Development 31-Aug-2021
26th July 2021 ` 254 ` 246` 254 ` 246
30th Aug 2021 ` 319 ` 309` 319 ` 309
Face Value
1000
1000
1000
Prevailing NAV
10060034
10053757
10053176
91 DAY T-BILL 13-Jan-2022 830
91 DAY T-BILL 20-Jan-2022 830
91 DAY T-BILL 04-Nov-2021 669
182 DAY T-BILL 18-Nov-2021 668
182 DAY T-BILL 25-Nov-2021 667
91 DAY T-BILL 02-Dec-2021 667
182 DAY T-BILL 09-Dec-2021 667
182 DAY T-BILL 16-Dec-2021 666
91 DAY T-BILL 23-Dec-2021 666
182 DAY T-BILL 30-Dec-2021 665
91 DAY T-BILL 06-Jan-2022 665
182 DAY T-BILL 23-Dec-2021 333
182 DAY T-BILL 02-Dec-2021 267
870 State Government of Kerala 25-Jan-2022
c) State Government Securities
271Sovereign
th25 Oct 2021 ` 24257 ` 23485 1000` 24257 ` 23485 10030000 10030000 10053485 10054257
Note
Different plans shall have different expense structures
Scheme returns shown are for regular plan
Past performance may or may not be sustained in the future
Greater than 1 year returns are CAGR returns
Data presented here is upto the last calendar month
We have our Skin in the Game
Asset Allocation by Asset Class Asset Allocation by Rating
FACT SHEET - OCTOBER 2021
Less than 1 year returns are simple annualised returns
The combined holding of Insiders in Parag Parikh Liquid Fund amounts to
` 4495 Crores of AUM as at October 29 2021 For more details please
9
Source Internal sources Source Internal sources
Date
Scheme Benchmark Additional Benchmark Value of Investment of Rs 10000-
CRISIL 1 year T-bill Index
557 602
285 -058
291 060
335 143
355 351
PPLF (Regular)
CRISIL Liquid Fund Index
PPLF (Regular)
CRISIL Liquid Fund Index
CRISIL 1 year T-bill Index
Lumpsum Investment Performance (Compounded annual returns)
11704
10005
10013
10026
10305
12075 12254
10005 9999
10014 10003
10028 10012
10357 10353
524 601 11365 11658 11915
Since inception returns are calculated on Rs 1000 (allotment price)
463
266
272
303
303
435
Since Inception (11 May 2018)
October 24 2021 to October 31 2021 (Last 7 Days)
October 14 2021 to October 31 2021 (Last 15 days)
September 30 2021 to October 31 2021 (Last 1 Month)
October 29 2020 to October 31 2021 (Last 1 year)
October 31 2018 to October 31 2021 (Last 3 year)
Date
Scheme Benchmark Additional Benchmark Value of Investment of Rs 10000-
CRISIL 1 year T-bill Index
PPLF (Regular)
PPLF (Direct)
PPLF (Direct)
CRISIL Liquid Fund Index
PPLF (Regular)
CRISIL Liquid Fund Index
CRISIL 1 year T-bill Index
Lumpsum Investment Performance (Compounded annual returns)
Since inception returns are calculated on Rs 1000 (allotment price)
557 602
285 -058
291 060
335 143
355 351
11704
10005
10013
10026
10305
12075 12254
10005 9999
10014 10003
10028 10012
10357 10353
524 601 11365 11658 11915
463
266
272
303
303
435
Since Inception (11 May 2018)
Oct 24 2021 to Oct 31 2021 (Last 7 Days)
Oct 14 2021 to Oct 31 2021 (Last 15 days)
Sept 30 2021 to Oct 31 2021 (Last 1 Month)
Oct 29 2020 to Oct 31 2021 (Last 1 year)
Oct 31 2018 to Oct 31 2021 (Last 3 year)
474
276
282
313
314
446
11746
10005
10013
10027
10315
11400
8260Treasury Bills
1208G Sec
532TREPS Fixed Deposit
Net receivables amp Payables and
Net Current Asset
9468Sovereign
532TREPS Fixed Deposit and
Net Receivables amp Payables
Sovereign
A1+
TREPS Fixed Deposit and Net receivables amp Payables
Total number of units held in Parag Parikh Liquid Fund as per SEBI Circular relating to Alignment of interest of Key Employees (Designated Employees) of Asset Management Companies (AMCs) with the unitholders of the Mutual Fund Schemes (dated April 28 2021 read with September 20 2021) as at 31-10-2021
5425534Parag Parikh Liquid Fund Direct Plan Growth
Scheme Units AUM (in Rs)
4620
FACT SHEET - OCTOBER 2021
10
Scheme Date of Allotment Date
Value of investment of Rs 10000-
NIFTY 500 (TRI) NIFTY 50 (TRI) NIFTY 500 (TRI)
th24 May 2013
Since Inception 2109 1623 1515 50271 35566 32876
1 Year 6160 5928 5372 16139 15908 15354
3 Year 2988 2124 2082 21894 17812 17625
5 Year 2178 1635 1681 26815 21335 21761
th24 July 2019
Since Inception 3077 2594 2333 18379 16875 16090
1 Year 4959 5928 5372 14942 15908 15354
3 Year NA NA NA NA NA NA
5 Year NA NA NA NA NA NA
Scheme Return
Benchmark Return ()
Additional Benchmark Return
()
Scheme Return (Rs)
NIFTY 50 (TRI)
Parag Parikh
Flexi Cap
Fund
Parag Parikh
Tax Saver
Fund
Fund Manager Name Mr Rajeev Thakkar
Mr Rajeev Thakkar Manages two schemes of PPFAS Mutual Fund
Fund Manager Name Mr Raunak Onkar
Mr Raunak Onkar Manages two schemes of PPFAS Mutual Fund
Fund Manager Name Mr Raj Mehta
Mr Raj Mehta Manages three schemes of PPFAS Mutual Fund
Scheme Date of Allotment Date
Value of investment of Rs 10000-
CRISIL Liquid Fund Index
th11 May 2018
Since Inception 463 557 602 11704 12075 12254
1 Year 303 355 351 10305 10357 10353
3 Year 435 524 601 11365 11658 11915
5 Year NA NA NA NA NA NA
Scheme Return
Benchmark Return ()
Additional Benchmark Return
()
Crisil Liquid Fund Index
CRISIL 1 year T-bill
IndexScheme Return
(Rs) CRISIL 1 Year
T-bill Index
Parag ParikhLiquid Fund
Since inception returns are calculated on Rs 10 (allotment price)
Since inception returns are calculated on Rs 1000 (allotment price)
Past Performance may or may not be sustained in future
The performance details provided herein are of regular plan growth option Regular and Direct Plans have different expense structure
Direct Plan shall have a lower expense ratio excluding distribution expenses commission expenses etc
All 3 Fund Managers also manage Parag Parikh Conservative Hybrid Fund since May 28 2021 However performance of the scheme
has not been included because It has not yet completed six months duration since inception
Scheme Date of Allotment Date
Value of investment of Rs 10000-
NIFTY 500 (TRI) NIFTY 50 (TRI) NIFTY 500 (TRI)
th24 May 2013
Since Inception 2109 1623 1515 50271 35566 32876
1 Year 6160 5928 5372 16139 15908 15354
3 Year 2988 2124 2082 21894 17812 17625
5 Year 2178 1635 1681 26815 21335 21761
th24 July 2019
Since Inception 3077 2594 2333 18379 16875 16090
1 Year 4959 5928 5372 14942 15908 15354
3 Year NA NA NA NA NA NA
5 Year NA NA NA NA NA NA
Scheme Return
Benchmark Return ()
Additional Benchmark Return
()
Scheme Return (Rs)
NIFTY 50 (TRI)
Parag Parikh
Flexi Cap
Fund
Parag Parikh
Tax Saver
Fund
Scheme Date of Allotment Date
Value of investment of Rs 10000-
NIFTY 500 (TRI) NIFTY 50 (TRI) NIFTY 500 (TRI)
th24 May 2013
Since Inception 2109 1623 1515 50271 35566 32876
1 Year 6160 5928 5372 16139 15908 15354
3 Year 2988 2124 2082 21894 17812 17625
5 Year 2178 1635 1681 26815 21335 21761
th24 July 2019
Since Inception 3077 2594 2333 18379 16875 16090
1 Year 4959 5928 5372 14942 15908 15354
3 Year NA NA NA NA NA NA
5 Year NA NA NA NA NA NA
Scheme Return
Benchmark Return ()
Additional Benchmark Return
()
Scheme Return (Rs)
NIFTY 50 (TRI)
Parag Parikh
Flexi Cap
Fund
Parag Parikh
Tax Saver
Fund
FACT SHEET - OCTOBER 2021
11
Parag Parikh Flexi Cap Fund
Investors understand that their principalwill be at very high risk
woL
High
tearedoM
Very High
ot woL
etaredoM
Moderately High
Low Very High
Investors should consult their financial advisers if in doubt about whether the
product is suitable for them
Parag Parikh Tax Saver Fund
Investors understand that their principalwill be at very high risk
woL
High
tearedoM
Very High
ot woL
etaredoM
Moderately High
Low Very HighInvestors should consult their financial advisers if in doubt about whether the product is suitable for them
This product is suitable for investors who are seeking
Long term capital appreciation
Investment predominantly in equity and equity related securities
This Product is suitable for investors who are seeking
The investment objective of the Scheme is to seek to generate long-term capital growth from an
actively managed portfolio primarily of Equity and Equity Related Securities Scheme shall invest
in Indian equitiesforeign equities and related instruments and debt securities
Parag Parikh Conservative Hybrid Fund
This product is suitable for investors who are seeking
Long term capital appreciation from the portion of equity investments under the scheme
Investors should consult their financial advisers if in doubt about whether the product
is suitable for them
To generate regular income through investments predominantly in debt and money market
instruments
Investors understand that their principalwill be at moderately high risk
Investors understand that their principalwill be at low risk
woL
High
tearedoM
Very High
ot woL
etaredoM
Moderately High
Low Very High
Parag Parikh Liquid Fund
This product is suitable for investors who are seeking
Investors should consult their financial advisers if in doubt about
whether the product is suitable for them
Income over short term
Investments in Debtmoney market instruments
Riskometer
Riskometer
Riskometer
Riskometer
Investors understand that their principalwill be at very high risk
woL
High
etaredoM
Very H
i gh
ot
woL
etaredoM
Moderately High
Low Very High
Investors should consult their financial advisers if in doubt about whether the product is suitable for them
Parag Parikh Flexi Cap Fund
Schemersquos Riskometer
woL
High
etaredoM
Very H
i gh
ot
woL
etaredoM
Moderately High
Low Very High
Benchmarkrsquos Riskometer (Nifty 500 TRI)
This Product is suitable for investors who are seeking
The investment objective of the Scheme
is to seek to generate long-term capital
growth from an actively managed portfolio
primarily of Equity and Equity Related
Securities Scheme shall invest in Indian
equities foreign equities and related
instruments and debt securities
Long term capital appreciation
Investment predominantly in equity
and equity related securities
Investors understand that their principalwill be at very high risk
woL
High
etaredoM
Very H
i gh
ot
woL
etaredoM
Moderately High
Low Very High
Investors should consult their financial advisers if in doubt about whether the product is suitable for them
Schemersquos Riskometer
woL
High
etaredoM
Very H
i gh
ot
woL
etaredoM
Moderately High
Low Very High
Benchmarkrsquos Riskometer (Nifty 500 TRI)
This Product is suitable for investors who are seeking
Investors should consult their financial advisers if in doubt about whether the product is suitable for them
Schemersquos RiskometerBenchmarkrsquos Riskometer
(CRISIL Hybrid 85+15 Conservative Index TRI)
This Product is suitable for investors who are seeking
To generate regular income through
investments predominantly in debt and
money market instruments
Long term capital appreciation from the portion of equity investments under the scheme Investors understand that their principal
will be at moderately high risk
Investors understand that their principalwill be at low to moderate risk
woL
High
etaredoM
Very H
i gh
ot
woL
etaredoM
Moderately High
Low Very High
Income over short term
Investments in Debtmoney
market instruments
Investors should consult their financial advisers if in doubt about whether the product is suitable for them
Schemersquos RiskometerBenchmarkrsquos Riskometer
(CRISIL Liquid Fund Index)
This Product is suitable for investors who are seeking
woL
High
etaredoM
Very H
i gh
ot
woL
etaredoM
Moderately High
Low Very High
Parag Parikh Tax Saver Fund
Parag Parikh Conservative Hybrid Fund
Parag Parikh Liquid Fund
There is no assurance that the investment objective of the Scheme will be realized and the scheme does not assure or guarantee any returns
REITs amp InvITs
Equity Investments
Fixed Income Investments
Asset allocation
Type of Instruments Normal Allocation ( of Net Assets) Risk Profile
DEBT
EQUITYREITs
InvITs
Parag Parikh Conservative Hybrid FundAn open-ended hybrid scheme investing predominantly in debt instruments
Debt and money market instruments
Equities and equity related instruments
REITsInvITs
Note
We recommend it to those
Investors should consult their financial advisers if in doubt about whether the product is suitable for them
Investment Team Details
Mr Raunak Onkar Mr Rajeev Thakkar Mr Raj Mehta
Your Distributor Financial Advisor will help you with the investing procedure
`
`
`
`
`
This product is suitable for investors who are seeking
Investors should consult their financial advisers if in doubt about whether the product is suitable for them Investors understand that their principal
will be at moderately high risk
Riskometer
Note
How to invest
Visit ---gt Distributors -----gt Create a foliowwwamcppfascom
Note Please visit the website address for latest Riskometer updates ----gt Statutory Disclosures ---gt Product Label of the Schemeshttpswwwamcppfascom
Note
PPFAS Asset Management Private Limited
MF Utilities
BSE Star MF
NSE
ICEX
Definitions
Fund Manager
This is the minimum investment amount for a new investor in a mutual fund scheme
Minimum additional amount This is the minimum investment amount for an existing investor in a mutual fund scheme
SIP
NAV
Benchmark
Entry Load
Exit Load
Standard Deviation
Sharpe Ratio
Beta
AUM
Holdings
Nature of Scheme
Portfolio Turnover Ratio
Yield to Maturity (YTM)
Modified Duration
Total Expense ratio
An employee of the asset management company such as a mutual fund or life insurer who manages investment of the scheme
He is usually part of a larger team of fund managers and research analysts
Application amount for fresh subscription
SIP or systematic investment plan work on the principle of making periodic investments of a fixed sum It works similar to a recurring
bank deposit For instance an investor may opt for an SIP that invests 500 every 15 ` th of the month in an equity fund for a period of three years
The NAV or the net asset value is the total asset value per unit of the mutual fund after deducting all related and permissible expenses The NAV
is calculated at the end of every business day It is the value at which the investor enters or exits the mutual fund
A group of securities usually a market index whose performance is used as a standard or benchmark to measure investment performance of
mutual funds among other investments Some typical benchmark include the Nifty Sensex BSE 200 BSE 500 10-year Gsec
A mutual fund may have a sales charge or load at the time of entry andor exit to compensate the distributoragent Entry load is charged at the
time an investor purchase the units of a mutual fund The entry load is added to the prevailing NAV at the time of investment For instance if the
NAV is ` 100 and the entry load is 1 the investor will enter the fund at Rs 101
Exit load is charged at the time of redeeming (or transferring an investment between schemes) The exit load percentage is deducted from the
NAV at the time of redemption (or transfer between schemes) This amount goes to the respective scheme and gets added to the AUM of that Scheme
Standard deviation is a statistical measure of the range of an investmentrsquos performance When a mutual fund Scheme has a high standard deviation its
range of performance is wide implying greater volatility
The Sharpe Ratio named after its founder the Nobel Laureate William Sharpe is a measure of risk-adjusted returns It is calculated using standard
deviation and excess return to determine reward per unit of risk
Beta is a measure of an investments volatility vis-a-vis the market Beta of less than 1 means that the security will be less volatile than the market
A beta of greater than 1 implies that the securitys price will be more volatile than the market
AUM or assets under management refers to the recent updated cumulative market value of investments managed by a mutual fund or any
investment firm
The holding or the portfolio is a mutual funds latest or updated reported statement of investmentssecurities These are usually displayed in term
of percentage to net assets or the rupee value or both The objective is to give investors an idea of where their money is being invested by the
fund manager
The investment objective and underlying investments determine the nature of the mutual fund scheme For instance a mutual fund that aims at
generating capital appreciation by investing in stock markets is an equity fund or growth fund Likewise a mutual fund that aims at capital
preservation by investing in debt markets is a debt fund or income fund Each of these categories may have sub-categories
A measure of how frequently assets within a fund are bought and sold by the managers Portfolio turnover is calculated by taking either the total
amount of new securities purchased or the amount of securities sold - whichever is less - over a particular period divided by the total net asset
value (NAV) of the fund The measurement is usually reported for a 12-month time period
The yield to maturity (YTM) of a bond or other fixed-interest security such as gilts is the (theoretical) internal rate of return (IRR overall interest rate) earned by an investor who buys the bond today at the market price assuming that the bond is held until maturity and that all coupon and principal payments are made on schedule
Modified duration is a formula that expresses the measurable change in the value of a security in response to a change in interest rates Modified duration follows the concept that interest rates and bond prices move in opposite directions
The total expense ratio (TER) is a measure of the total cost of a fund to the investor Total costs may include various fees (purchase redemption auditing) and other expenses The TER calculated by dividing the total annual cost by the fundstotal assets averaged over that year is denoted as a percentage
FACT SHEET - OCTOBER 2021
Toll Free 1800-266-7790 | Email mfppfascom
Call 1800-266-7790 (Toll Free) or 91-22-61406538 | E-Mail partnersppfascom
Registered Office 8182 8th Floor Sakhar Bhavan Ramnath Goenka Marg 230 Nariman Point Mumbai - 400 021 INDIA
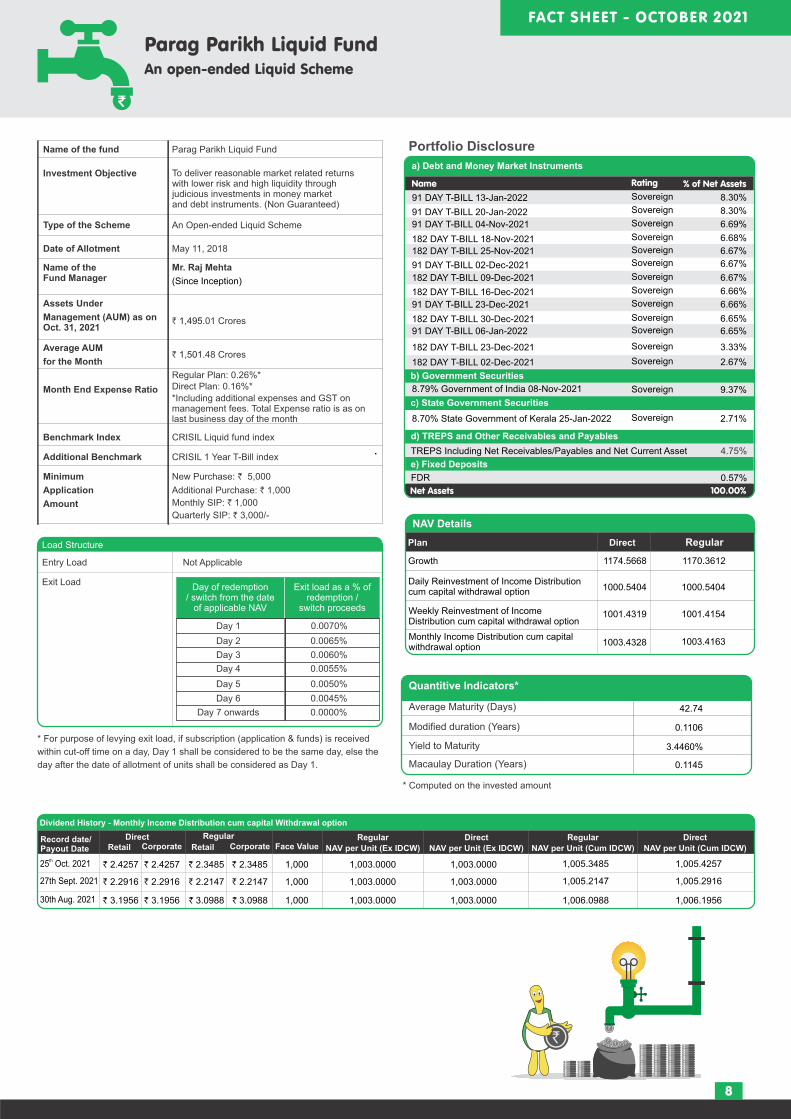
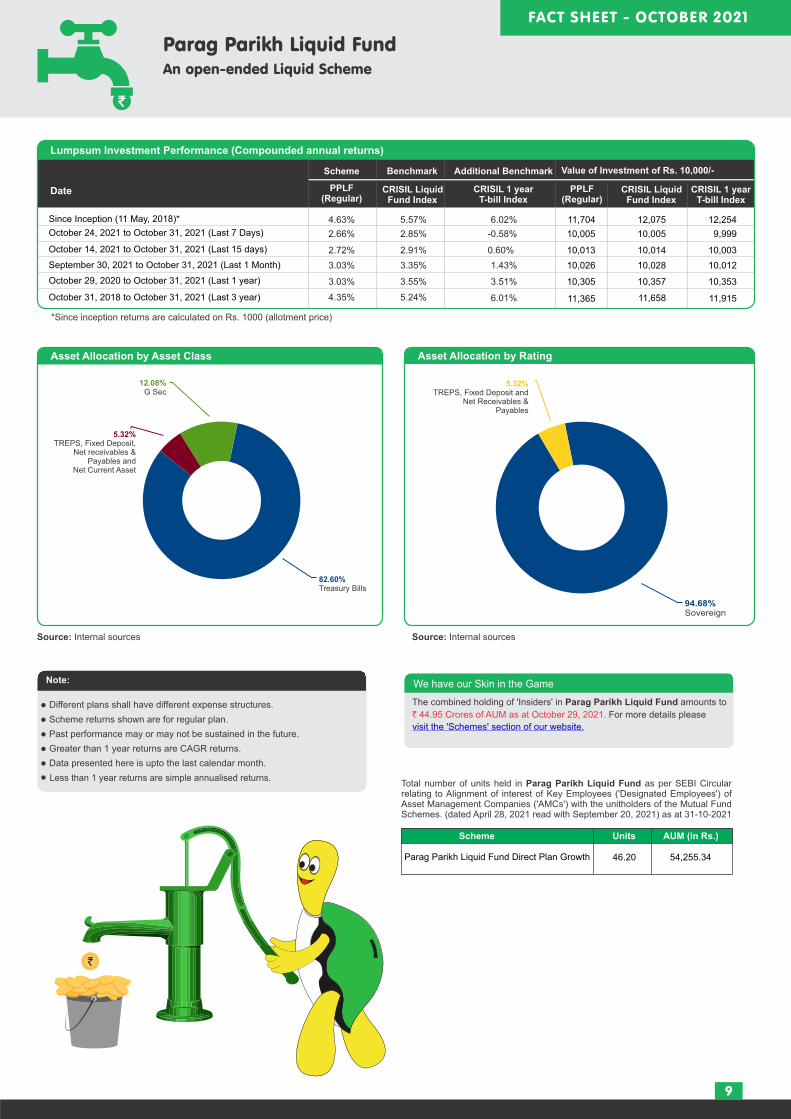
Note
Different plans shall have different expense structures
Scheme returns shown are for regular plan
Past performance may or may not be sustained in the future
Greater than 1 year returns are CAGR returns
Data presented here is upto the last calendar month
We have our Skin in the Game
Asset Allocation by Asset Class Asset Allocation by Rating
FACT SHEET - OCTOBER 2021
Less than 1 year returns are simple annualised returns
The combined holding of Insiders in Parag Parikh Liquid Fund amounts to
` 4495 Crores of AUM as at October 29 2021 For more details please
9
Source Internal sources Source Internal sources
Date
Scheme Benchmark Additional Benchmark Value of Investment of Rs 10000-
CRISIL 1 year T-bill Index
557 602
285 -058
291 060
335 143
355 351
PPLF (Regular)
CRISIL Liquid Fund Index
PPLF (Regular)
CRISIL Liquid Fund Index
CRISIL 1 year T-bill Index
Lumpsum Investment Performance (Compounded annual returns)
11704
10005
10013
10026
10305
12075 12254
10005 9999
10014 10003
10028 10012
10357 10353
524 601 11365 11658 11915
Since inception returns are calculated on Rs 1000 (allotment price)
463
266
272
303
303
435
Since Inception (11 May 2018)
October 24 2021 to October 31 2021 (Last 7 Days)
October 14 2021 to October 31 2021 (Last 15 days)
September 30 2021 to October 31 2021 (Last 1 Month)
October 29 2020 to October 31 2021 (Last 1 year)
October 31 2018 to October 31 2021 (Last 3 year)
Date
Scheme Benchmark Additional Benchmark Value of Investment of Rs 10000-
CRISIL 1 year T-bill Index
PPLF (Regular)
PPLF (Direct)
PPLF (Direct)
CRISIL Liquid Fund Index
PPLF (Regular)
CRISIL Liquid Fund Index
CRISIL 1 year T-bill Index
Lumpsum Investment Performance (Compounded annual returns)
Since inception returns are calculated on Rs 1000 (allotment price)
557 602
285 -058
291 060
335 143
355 351
11704
10005
10013
10026
10305
12075 12254
10005 9999
10014 10003
10028 10012
10357 10353
524 601 11365 11658 11915
463
266
272
303
303
435
Since Inception (11 May 2018)
Oct 24 2021 to Oct 31 2021 (Last 7 Days)
Oct 14 2021 to Oct 31 2021 (Last 15 days)
Sept 30 2021 to Oct 31 2021 (Last 1 Month)
Oct 29 2020 to Oct 31 2021 (Last 1 year)
Oct 31 2018 to Oct 31 2021 (Last 3 year)
474
276
282
313
314
446
11746
10005
10013
10027
10315
11400
8260Treasury Bills
1208G Sec
532TREPS Fixed Deposit
Net receivables amp Payables and
Net Current Asset
9468Sovereign
532TREPS Fixed Deposit and
Net Receivables amp Payables
Sovereign
A1+
TREPS Fixed Deposit and Net receivables amp Payables
Total number of units held in Parag Parikh Liquid Fund as per SEBI Circular relating to Alignment of interest of Key Employees (Designated Employees) of Asset Management Companies (AMCs) with the unitholders of the Mutual Fund Schemes (dated April 28 2021 read with September 20 2021) as at 31-10-2021
5425534Parag Parikh Liquid Fund Direct Plan Growth
Scheme Units AUM (in Rs)
4620
FACT SHEET - OCTOBER 2021
10
Scheme Date of Allotment Date
Value of investment of Rs 10000-
NIFTY 500 (TRI) NIFTY 50 (TRI) NIFTY 500 (TRI)
th24 May 2013
Since Inception 2109 1623 1515 50271 35566 32876
1 Year 6160 5928 5372 16139 15908 15354
3 Year 2988 2124 2082 21894 17812 17625
5 Year 2178 1635 1681 26815 21335 21761
th24 July 2019
Since Inception 3077 2594 2333 18379 16875 16090
1 Year 4959 5928 5372 14942 15908 15354
3 Year NA NA NA NA NA NA
5 Year NA NA NA NA NA NA
Scheme Return
Benchmark Return ()
Additional Benchmark Return
()
Scheme Return (Rs)
NIFTY 50 (TRI)
Parag Parikh
Flexi Cap
Fund
Parag Parikh
Tax Saver
Fund
Fund Manager Name Mr Rajeev Thakkar
Mr Rajeev Thakkar Manages two schemes of PPFAS Mutual Fund
Fund Manager Name Mr Raunak Onkar
Mr Raunak Onkar Manages two schemes of PPFAS Mutual Fund
Fund Manager Name Mr Raj Mehta
Mr Raj Mehta Manages three schemes of PPFAS Mutual Fund
Scheme Date of Allotment Date
Value of investment of Rs 10000-
CRISIL Liquid Fund Index
th11 May 2018
Since Inception 463 557 602 11704 12075 12254
1 Year 303 355 351 10305 10357 10353
3 Year 435 524 601 11365 11658 11915
5 Year NA NA NA NA NA NA
Scheme Return
Benchmark Return ()
Additional Benchmark Return
()
Crisil Liquid Fund Index
CRISIL 1 year T-bill
IndexScheme Return
(Rs) CRISIL 1 Year
T-bill Index
Parag ParikhLiquid Fund
Since inception returns are calculated on Rs 10 (allotment price)
Since inception returns are calculated on Rs 1000 (allotment price)
Past Performance may or may not be sustained in future
The performance details provided herein are of regular plan growth option Regular and Direct Plans have different expense structure
Direct Plan shall have a lower expense ratio excluding distribution expenses commission expenses etc
All 3 Fund Managers also manage Parag Parikh Conservative Hybrid Fund since May 28 2021 However performance of the scheme
has not been included because It has not yet completed six months duration since inception
Scheme Date of Allotment Date
Value of investment of Rs 10000-
NIFTY 500 (TRI) NIFTY 50 (TRI) NIFTY 500 (TRI)
th24 May 2013
Since Inception 2109 1623 1515 50271 35566 32876
1 Year 6160 5928 5372 16139 15908 15354
3 Year 2988 2124 2082 21894 17812 17625
5 Year 2178 1635 1681 26815 21335 21761
th24 July 2019
Since Inception 3077 2594 2333 18379 16875 16090
1 Year 4959 5928 5372 14942 15908 15354
3 Year NA NA NA NA NA NA
5 Year NA NA NA NA NA NA
Scheme Return
Benchmark Return ()
Additional Benchmark Return
()
Scheme Return (Rs)
NIFTY 50 (TRI)
Parag Parikh
Flexi Cap
Fund
Parag Parikh
Tax Saver
Fund
Scheme Date of Allotment Date
Value of investment of Rs 10000-
NIFTY 500 (TRI) NIFTY 50 (TRI) NIFTY 500 (TRI)
th24 May 2013
Since Inception 2109 1623 1515 50271 35566 32876
1 Year 6160 5928 5372 16139 15908 15354
3 Year 2988 2124 2082 21894 17812 17625
5 Year 2178 1635 1681 26815 21335 21761
th24 July 2019
Since Inception 3077 2594 2333 18379 16875 16090
1 Year 4959 5928 5372 14942 15908 15354
3 Year NA NA NA NA NA NA
5 Year NA NA NA NA NA NA
Scheme Return
Benchmark Return ()
Additional Benchmark Return
()
Scheme Return (Rs)
NIFTY 50 (TRI)
Parag Parikh
Flexi Cap
Fund
Parag Parikh
Tax Saver
Fund
FACT SHEET - OCTOBER 2021
11
Parag Parikh Flexi Cap Fund
Investors understand that their principalwill be at very high risk
woL
High
tearedoM
Very High
ot woL
etaredoM
Moderately High
Low Very High
Investors should consult their financial advisers if in doubt about whether the
product is suitable for them
Parag Parikh Tax Saver Fund
Investors understand that their principalwill be at very high risk
woL
High
tearedoM
Very High
ot woL
etaredoM
Moderately High
Low Very HighInvestors should consult their financial advisers if in doubt about whether the product is suitable for them
This product is suitable for investors who are seeking
Long term capital appreciation
Investment predominantly in equity and equity related securities
This Product is suitable for investors who are seeking
The investment objective of the Scheme is to seek to generate long-term capital growth from an
actively managed portfolio primarily of Equity and Equity Related Securities Scheme shall invest
in Indian equitiesforeign equities and related instruments and debt securities
Parag Parikh Conservative Hybrid Fund
This product is suitable for investors who are seeking
Long term capital appreciation from the portion of equity investments under the scheme
Investors should consult their financial advisers if in doubt about whether the product
is suitable for them
To generate regular income through investments predominantly in debt and money market
instruments
Investors understand that their principalwill be at moderately high risk
Investors understand that their principalwill be at low risk
woL
High
tearedoM
Very High
ot woL
etaredoM
Moderately High
Low Very High
Parag Parikh Liquid Fund
This product is suitable for investors who are seeking
Investors should consult their financial advisers if in doubt about
whether the product is suitable for them
Income over short term
Investments in Debtmoney market instruments
Riskometer
Riskometer
Riskometer
Riskometer
Investors understand that their principalwill be at very high risk
woL
High
etaredoM
Very H
i gh
ot
woL
etaredoM
Moderately High
Low Very High
Investors should consult their financial advisers if in doubt about whether the product is suitable for them
Parag Parikh Flexi Cap Fund
Schemersquos Riskometer
woL
High
etaredoM
Very H
i gh
ot
woL
etaredoM
Moderately High
Low Very High
Benchmarkrsquos Riskometer (Nifty 500 TRI)
This Product is suitable for investors who are seeking
The investment objective of the Scheme
is to seek to generate long-term capital
growth from an actively managed portfolio
primarily of Equity and Equity Related
Securities Scheme shall invest in Indian
equities foreign equities and related
instruments and debt securities
Long term capital appreciation
Investment predominantly in equity
and equity related securities
Investors understand that their principalwill be at very high risk
woL
High
etaredoM
Very H
i gh
ot
woL
etaredoM
Moderately High
Low Very High
Investors should consult their financial advisers if in doubt about whether the product is suitable for them
Schemersquos Riskometer
woL
High
etaredoM
Very H
i gh
ot
woL
etaredoM
Moderately High
Low Very High
Benchmarkrsquos Riskometer (Nifty 500 TRI)
This Product is suitable for investors who are seeking
Investors should consult their financial advisers if in doubt about whether the product is suitable for them
Schemersquos RiskometerBenchmarkrsquos Riskometer
(CRISIL Hybrid 85+15 Conservative Index TRI)
This Product is suitable for investors who are seeking
To generate regular income through
investments predominantly in debt and
money market instruments
Long term capital appreciation from the portion of equity investments under the scheme Investors understand that their principal
will be at moderately high risk
Investors understand that their principalwill be at low to moderate risk
woL
High
etaredoM
Very H
i gh
ot
woL
etaredoM
Moderately High
Low Very High
Income over short term
Investments in Debtmoney
market instruments
Investors should consult their financial advisers if in doubt about whether the product is suitable for them
Schemersquos RiskometerBenchmarkrsquos Riskometer
(CRISIL Liquid Fund Index)
This Product is suitable for investors who are seeking
woL
High
etaredoM
Very H
i gh
ot
woL
etaredoM
Moderately High
Low Very High
Parag Parikh Tax Saver Fund
Parag Parikh Conservative Hybrid Fund
Parag Parikh Liquid Fund
There is no assurance that the investment objective of the Scheme will be realized and the scheme does not assure or guarantee any returns
REITs amp InvITs
Equity Investments
Fixed Income Investments
Asset allocation
Type of Instruments Normal Allocation ( of Net Assets) Risk Profile
DEBT
EQUITYREITs
InvITs
Parag Parikh Conservative Hybrid FundAn open-ended hybrid scheme investing predominantly in debt instruments
Debt and money market instruments
Equities and equity related instruments
REITsInvITs
Note
We recommend it to those
Investors should consult their financial advisers if in doubt about whether the product is suitable for them
Investment Team Details
Mr Raunak Onkar Mr Rajeev Thakkar Mr Raj Mehta
Your Distributor Financial Advisor will help you with the investing procedure
`
`
`
`
`
This product is suitable for investors who are seeking
Investors should consult their financial advisers if in doubt about whether the product is suitable for them Investors understand that their principal
will be at moderately high risk
Riskometer
Note
How to invest
Visit ---gt Distributors -----gt Create a foliowwwamcppfascom
Note Please visit the website address for latest Riskometer updates ----gt Statutory Disclosures ---gt Product Label of the Schemeshttpswwwamcppfascom
Note
PPFAS Asset Management Private Limited
MF Utilities
BSE Star MF
NSE
ICEX
Definitions
Fund Manager
This is the minimum investment amount for a new investor in a mutual fund scheme
Minimum additional amount This is the minimum investment amount for an existing investor in a mutual fund scheme
SIP
NAV
Benchmark
Entry Load
Exit Load
Standard Deviation
Sharpe Ratio
Beta
AUM
Holdings
Nature of Scheme
Portfolio Turnover Ratio
Yield to Maturity (YTM)
Modified Duration
Total Expense ratio
An employee of the asset management company such as a mutual fund or life insurer who manages investment of the scheme
He is usually part of a larger team of fund managers and research analysts
Application amount for fresh subscription
SIP or systematic investment plan work on the principle of making periodic investments of a fixed sum It works similar to a recurring
bank deposit For instance an investor may opt for an SIP that invests 500 every 15 ` th of the month in an equity fund for a period of three years
The NAV or the net asset value is the total asset value per unit of the mutual fund after deducting all related and permissible expenses The NAV
is calculated at the end of every business day It is the value at which the investor enters or exits the mutual fund
A group of securities usually a market index whose performance is used as a standard or benchmark to measure investment performance of
mutual funds among other investments Some typical benchmark include the Nifty Sensex BSE 200 BSE 500 10-year Gsec
A mutual fund may have a sales charge or load at the time of entry andor exit to compensate the distributoragent Entry load is charged at the
time an investor purchase the units of a mutual fund The entry load is added to the prevailing NAV at the time of investment For instance if the
NAV is ` 100 and the entry load is 1 the investor will enter the fund at Rs 101
Exit load is charged at the time of redeeming (or transferring an investment between schemes) The exit load percentage is deducted from the
NAV at the time of redemption (or transfer between schemes) This amount goes to the respective scheme and gets added to the AUM of that Scheme
Standard deviation is a statistical measure of the range of an investmentrsquos performance When a mutual fund Scheme has a high standard deviation its
range of performance is wide implying greater volatility
The Sharpe Ratio named after its founder the Nobel Laureate William Sharpe is a measure of risk-adjusted returns It is calculated using standard
deviation and excess return to determine reward per unit of risk
Beta is a measure of an investments volatility vis-a-vis the market Beta of less than 1 means that the security will be less volatile than the market
A beta of greater than 1 implies that the securitys price will be more volatile than the market
AUM or assets under management refers to the recent updated cumulative market value of investments managed by a mutual fund or any
investment firm
The holding or the portfolio is a mutual funds latest or updated reported statement of investmentssecurities These are usually displayed in term
of percentage to net assets or the rupee value or both The objective is to give investors an idea of where their money is being invested by the
fund manager
The investment objective and underlying investments determine the nature of the mutual fund scheme For instance a mutual fund that aims at
generating capital appreciation by investing in stock markets is an equity fund or growth fund Likewise a mutual fund that aims at capital
preservation by investing in debt markets is a debt fund or income fund Each of these categories may have sub-categories
A measure of how frequently assets within a fund are bought and sold by the managers Portfolio turnover is calculated by taking either the total
amount of new securities purchased or the amount of securities sold - whichever is less - over a particular period divided by the total net asset
value (NAV) of the fund The measurement is usually reported for a 12-month time period
The yield to maturity (YTM) of a bond or other fixed-interest security such as gilts is the (theoretical) internal rate of return (IRR overall interest rate) earned by an investor who buys the bond today at the market price assuming that the bond is held until maturity and that all coupon and principal payments are made on schedule
Modified duration is a formula that expresses the measurable change in the value of a security in response to a change in interest rates Modified duration follows the concept that interest rates and bond prices move in opposite directions
The total expense ratio (TER) is a measure of the total cost of a fund to the investor Total costs may include various fees (purchase redemption auditing) and other expenses The TER calculated by dividing the total annual cost by the fundstotal assets averaged over that year is denoted as a percentage
FACT SHEET - OCTOBER 2021
Toll Free 1800-266-7790 | Email mfppfascom
Call 1800-266-7790 (Toll Free) or 91-22-61406538 | E-Mail partnersppfascom
Registered Office 8182 8th Floor Sakhar Bhavan Ramnath Goenka Marg 230 Nariman Point Mumbai - 400 021 INDIA
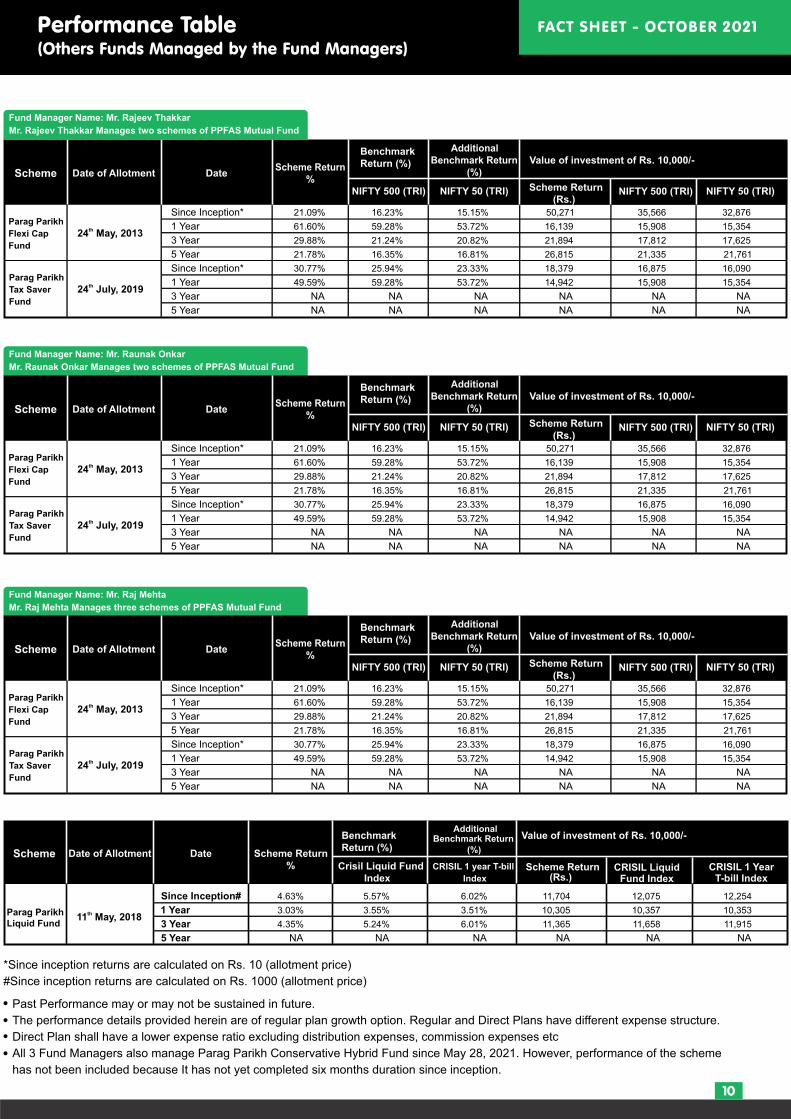
FACT SHEET - OCTOBER 2021
10
Scheme Date of Allotment Date
Value of investment of Rs 10000-
NIFTY 500 (TRI) NIFTY 50 (TRI) NIFTY 500 (TRI)
th24 May 2013
Since Inception 2109 1623 1515 50271 35566 32876
1 Year 6160 5928 5372 16139 15908 15354
3 Year 2988 2124 2082 21894 17812 17625
5 Year 2178 1635 1681 26815 21335 21761
th24 July 2019
Since Inception 3077 2594 2333 18379 16875 16090
1 Year 4959 5928 5372 14942 15908 15354
3 Year NA NA NA NA NA NA
5 Year NA NA NA NA NA NA
Scheme Return
Benchmark Return ()
Additional Benchmark Return
()
Scheme Return (Rs)
NIFTY 50 (TRI)
Parag Parikh
Flexi Cap
Fund
Parag Parikh
Tax Saver
Fund
Fund Manager Name Mr Rajeev Thakkar
Mr Rajeev Thakkar Manages two schemes of PPFAS Mutual Fund
Fund Manager Name Mr Raunak Onkar
Mr Raunak Onkar Manages two schemes of PPFAS Mutual Fund
Fund Manager Name Mr Raj Mehta
Mr Raj Mehta Manages three schemes of PPFAS Mutual Fund
Scheme Date of Allotment Date
Value of investment of Rs 10000-
CRISIL Liquid Fund Index
th11 May 2018
Since Inception 463 557 602 11704 12075 12254
1 Year 303 355 351 10305 10357 10353
3 Year 435 524 601 11365 11658 11915
5 Year NA NA NA NA NA NA
Scheme Return
Benchmark Return ()
Additional Benchmark Return
()
Crisil Liquid Fund Index
CRISIL 1 year T-bill
IndexScheme Return
(Rs) CRISIL 1 Year
T-bill Index
Parag ParikhLiquid Fund
Since inception returns are calculated on Rs 10 (allotment price)
Since inception returns are calculated on Rs 1000 (allotment price)
Past Performance may or may not be sustained in future
The performance details provided herein are of regular plan growth option Regular and Direct Plans have different expense structure
Direct Plan shall have a lower expense ratio excluding distribution expenses commission expenses etc
All 3 Fund Managers also manage Parag Parikh Conservative Hybrid Fund since May 28 2021 However performance of the scheme
has not been included because It has not yet completed six months duration since inception
Scheme Date of Allotment Date
Value of investment of Rs 10000-
NIFTY 500 (TRI) NIFTY 50 (TRI) NIFTY 500 (TRI)
th24 May 2013
Since Inception 2109 1623 1515 50271 35566 32876
1 Year 6160 5928 5372 16139 15908 15354
3 Year 2988 2124 2082 21894 17812 17625
5 Year 2178 1635 1681 26815 21335 21761
th24 July 2019
Since Inception 3077 2594 2333 18379 16875 16090
1 Year 4959 5928 5372 14942 15908 15354
3 Year NA NA NA NA NA NA
5 Year NA NA NA NA NA NA
Scheme Return
Benchmark Return ()
Additional Benchmark Return
()
Scheme Return (Rs)
NIFTY 50 (TRI)
Parag Parikh
Flexi Cap
Fund
Parag Parikh
Tax Saver
Fund
Scheme Date of Allotment Date
Value of investment of Rs 10000-
NIFTY 500 (TRI) NIFTY 50 (TRI) NIFTY 500 (TRI)
th24 May 2013
Since Inception 2109 1623 1515 50271 35566 32876
1 Year 6160 5928 5372 16139 15908 15354
3 Year 2988 2124 2082 21894 17812 17625
5 Year 2178 1635 1681 26815 21335 21761
th24 July 2019
Since Inception 3077 2594 2333 18379 16875 16090
1 Year 4959 5928 5372 14942 15908 15354
3 Year NA NA NA NA NA NA
5 Year NA NA NA NA NA NA
Scheme Return
Benchmark Return ()
Additional Benchmark Return
()
Scheme Return (Rs)
NIFTY 50 (TRI)
Parag Parikh
Flexi Cap
Fund
Parag Parikh
Tax Saver
Fund
FACT SHEET - OCTOBER 2021
11
Parag Parikh Flexi Cap Fund
Investors understand that their principalwill be at very high risk
woL
High
tearedoM
Very High
ot woL
etaredoM
Moderately High
Low Very High
Investors should consult their financial advisers if in doubt about whether the
product is suitable for them
Parag Parikh Tax Saver Fund
Investors understand that their principalwill be at very high risk
woL
High
tearedoM
Very High
ot woL
etaredoM
Moderately High
Low Very HighInvestors should consult their financial advisers if in doubt about whether the product is suitable for them
This product is suitable for investors who are seeking
Long term capital appreciation
Investment predominantly in equity and equity related securities
This Product is suitable for investors who are seeking
The investment objective of the Scheme is to seek to generate long-term capital growth from an
actively managed portfolio primarily of Equity and Equity Related Securities Scheme shall invest
in Indian equitiesforeign equities and related instruments and debt securities
Parag Parikh Conservative Hybrid Fund
This product is suitable for investors who are seeking
Long term capital appreciation from the portion of equity investments under the scheme
Investors should consult their financial advisers if in doubt about whether the product
is suitable for them
To generate regular income through investments predominantly in debt and money market
instruments
Investors understand that their principalwill be at moderately high risk
Investors understand that their principalwill be at low risk
woL
High
tearedoM
Very High
ot woL
etaredoM
Moderately High
Low Very High
Parag Parikh Liquid Fund
This product is suitable for investors who are seeking
Investors should consult their financial advisers if in doubt about
whether the product is suitable for them
Income over short term
Investments in Debtmoney market instruments
Riskometer
Riskometer
Riskometer
Riskometer
Investors understand that their principalwill be at very high risk
woL
High
etaredoM
Very H
i gh
ot
woL
etaredoM
Moderately High
Low Very High
Investors should consult their financial advisers if in doubt about whether the product is suitable for them
Parag Parikh Flexi Cap Fund
Schemersquos Riskometer
woL
High
etaredoM
Very H
i gh
ot
woL
etaredoM
Moderately High
Low Very High
Benchmarkrsquos Riskometer (Nifty 500 TRI)
This Product is suitable for investors who are seeking
The investment objective of the Scheme
is to seek to generate long-term capital
growth from an actively managed portfolio
primarily of Equity and Equity Related
Securities Scheme shall invest in Indian
equities foreign equities and related
instruments and debt securities
Long term capital appreciation
Investment predominantly in equity
and equity related securities
Investors understand that their principalwill be at very high risk
woL
High
etaredoM
Very H
i gh
ot
woL
etaredoM
Moderately High
Low Very High
Investors should consult their financial advisers if in doubt about whether the product is suitable for them
Schemersquos Riskometer
woL
High
etaredoM
Very H
i gh
ot
woL
etaredoM
Moderately High
Low Very High
Benchmarkrsquos Riskometer (Nifty 500 TRI)
This Product is suitable for investors who are seeking
Investors should consult their financial advisers if in doubt about whether the product is suitable for them
Schemersquos RiskometerBenchmarkrsquos Riskometer
(CRISIL Hybrid 85+15 Conservative Index TRI)
This Product is suitable for investors who are seeking
To generate regular income through
investments predominantly in debt and
money market instruments
Long term capital appreciation from the portion of equity investments under the scheme Investors understand that their principal
will be at moderately high risk
Investors understand that their principalwill be at low to moderate risk
woL
High
etaredoM
Very H
i gh
ot
woL
etaredoM
Moderately High
Low Very High
Income over short term
Investments in Debtmoney
market instruments
Investors should consult their financial advisers if in doubt about whether the product is suitable for them
Schemersquos RiskometerBenchmarkrsquos Riskometer
(CRISIL Liquid Fund Index)
This Product is suitable for investors who are seeking
woL
High
etaredoM
Very H
i gh
ot
woL
etaredoM
Moderately High
Low Very High
Parag Parikh Tax Saver Fund
Parag Parikh Conservative Hybrid Fund
Parag Parikh Liquid Fund
There is no assurance that the investment objective of the Scheme will be realized and the scheme does not assure or guarantee any returns
REITs amp InvITs
Equity Investments
Fixed Income Investments
Asset allocation
Type of Instruments Normal Allocation ( of Net Assets) Risk Profile
DEBT
EQUITYREITs
InvITs
Parag Parikh Conservative Hybrid FundAn open-ended hybrid scheme investing predominantly in debt instruments
Debt and money market instruments
Equities and equity related instruments
REITsInvITs
Note
We recommend it to those
Investors should consult their financial advisers if in doubt about whether the product is suitable for them
Investment Team Details
Mr Raunak Onkar Mr Rajeev Thakkar Mr Raj Mehta
Your Distributor Financial Advisor will help you with the investing procedure
`
`
`
`
`
This product is suitable for investors who are seeking
Investors should consult their financial advisers if in doubt about whether the product is suitable for them Investors understand that their principal
will be at moderately high risk
Riskometer
Note
How to invest
Visit ---gt Distributors -----gt Create a foliowwwamcppfascom
Note Please visit the website address for latest Riskometer updates ----gt Statutory Disclosures ---gt Product Label of the Schemeshttpswwwamcppfascom
Note
PPFAS Asset Management Private Limited
MF Utilities
BSE Star MF
NSE
ICEX
Definitions
Fund Manager
This is the minimum investment amount for a new investor in a mutual fund scheme
Minimum additional amount This is the minimum investment amount for an existing investor in a mutual fund scheme
SIP
NAV
Benchmark
Entry Load
Exit Load
Standard Deviation
Sharpe Ratio
Beta
AUM
Holdings
Nature of Scheme
Portfolio Turnover Ratio
Yield to Maturity (YTM)
Modified Duration
Total Expense ratio
An employee of the asset management company such as a mutual fund or life insurer who manages investment of the scheme
He is usually part of a larger team of fund managers and research analysts
Application amount for fresh subscription
SIP or systematic investment plan work on the principle of making periodic investments of a fixed sum It works similar to a recurring
bank deposit For instance an investor may opt for an SIP that invests 500 every 15 ` th of the month in an equity fund for a period of three years
The NAV or the net asset value is the total asset value per unit of the mutual fund after deducting all related and permissible expenses The NAV
is calculated at the end of every business day It is the value at which the investor enters or exits the mutual fund
A group of securities usually a market index whose performance is used as a standard or benchmark to measure investment performance of
mutual funds among other investments Some typical benchmark include the Nifty Sensex BSE 200 BSE 500 10-year Gsec
A mutual fund may have a sales charge or load at the time of entry andor exit to compensate the distributoragent Entry load is charged at the
time an investor purchase the units of a mutual fund The entry load is added to the prevailing NAV at the time of investment For instance if the
NAV is ` 100 and the entry load is 1 the investor will enter the fund at Rs 101
Exit load is charged at the time of redeeming (or transferring an investment between schemes) The exit load percentage is deducted from the
NAV at the time of redemption (or transfer between schemes) This amount goes to the respective scheme and gets added to the AUM of that Scheme
Standard deviation is a statistical measure of the range of an investmentrsquos performance When a mutual fund Scheme has a high standard deviation its
range of performance is wide implying greater volatility
The Sharpe Ratio named after its founder the Nobel Laureate William Sharpe is a measure of risk-adjusted returns It is calculated using standard
deviation and excess return to determine reward per unit of risk
Beta is a measure of an investments volatility vis-a-vis the market Beta of less than 1 means that the security will be less volatile than the market
A beta of greater than 1 implies that the securitys price will be more volatile than the market
AUM or assets under management refers to the recent updated cumulative market value of investments managed by a mutual fund or any
investment firm
The holding or the portfolio is a mutual funds latest or updated reported statement of investmentssecurities These are usually displayed in term
of percentage to net assets or the rupee value or both The objective is to give investors an idea of where their money is being invested by the
fund manager
The investment objective and underlying investments determine the nature of the mutual fund scheme For instance a mutual fund that aims at
generating capital appreciation by investing in stock markets is an equity fund or growth fund Likewise a mutual fund that aims at capital
preservation by investing in debt markets is a debt fund or income fund Each of these categories may have sub-categories
A measure of how frequently assets within a fund are bought and sold by the managers Portfolio turnover is calculated by taking either the total
amount of new securities purchased or the amount of securities sold - whichever is less - over a particular period divided by the total net asset
value (NAV) of the fund The measurement is usually reported for a 12-month time period
The yield to maturity (YTM) of a bond or other fixed-interest security such as gilts is the (theoretical) internal rate of return (IRR overall interest rate) earned by an investor who buys the bond today at the market price assuming that the bond is held until maturity and that all coupon and principal payments are made on schedule
Modified duration is a formula that expresses the measurable change in the value of a security in response to a change in interest rates Modified duration follows the concept that interest rates and bond prices move in opposite directions
The total expense ratio (TER) is a measure of the total cost of a fund to the investor Total costs may include various fees (purchase redemption auditing) and other expenses The TER calculated by dividing the total annual cost by the fundstotal assets averaged over that year is denoted as a percentage
FACT SHEET - OCTOBER 2021
Toll Free 1800-266-7790 | Email mfppfascom
Call 1800-266-7790 (Toll Free) or 91-22-61406538 | E-Mail partnersppfascom
Registered Office 8182 8th Floor Sakhar Bhavan Ramnath Goenka Marg 230 Nariman Point Mumbai - 400 021 INDIA
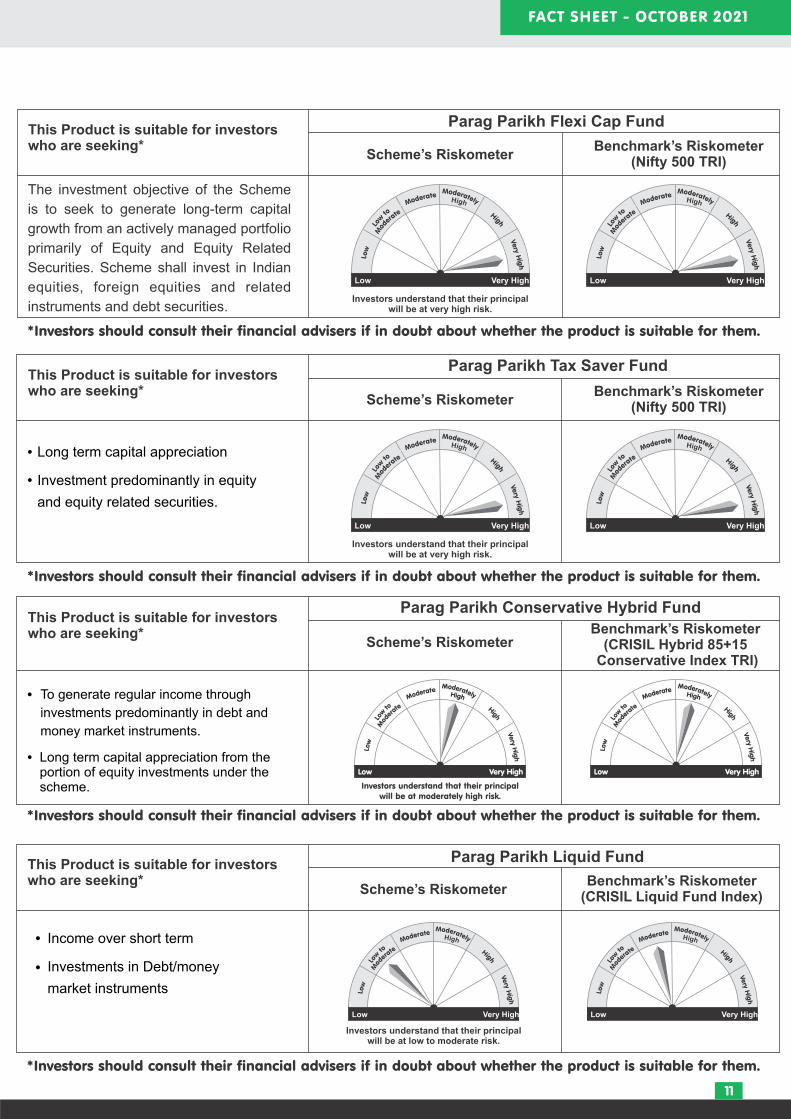
FACT SHEET - OCTOBER 2021
11
Parag Parikh Flexi Cap Fund
Investors understand that their principalwill be at very high risk
woL
High
tearedoM
Very High
ot woL
etaredoM
Moderately High
Low Very High
Investors should consult their financial advisers if in doubt about whether the
product is suitable for them
Parag Parikh Tax Saver Fund
Investors understand that their principalwill be at very high risk
woL
High
tearedoM
Very High
ot woL
etaredoM
Moderately High
Low Very HighInvestors should consult their financial advisers if in doubt about whether the product is suitable for them
This product is suitable for investors who are seeking
Long term capital appreciation
Investment predominantly in equity and equity related securities
This Product is suitable for investors who are seeking
The investment objective of the Scheme is to seek to generate long-term capital growth from an
actively managed portfolio primarily of Equity and Equity Related Securities Scheme shall invest
in Indian equitiesforeign equities and related instruments and debt securities
Parag Parikh Conservative Hybrid Fund
This product is suitable for investors who are seeking
Long term capital appreciation from the portion of equity investments under the scheme
Investors should consult their financial advisers if in doubt about whether the product
is suitable for them
To generate regular income through investments predominantly in debt and money market
instruments
Investors understand that their principalwill be at moderately high risk
Investors understand that their principalwill be at low risk
woL
High
tearedoM
Very High
ot woL
etaredoM
Moderately High
Low Very High
Parag Parikh Liquid Fund
This product is suitable for investors who are seeking
Investors should consult their financial advisers if in doubt about
whether the product is suitable for them
Income over short term
Investments in Debtmoney market instruments
Riskometer
Riskometer
Riskometer
Riskometer
Investors understand that their principalwill be at very high risk
woL
High
etaredoM
Very H
i gh
ot
woL
etaredoM
Moderately High
Low Very High
Investors should consult their financial advisers if in doubt about whether the product is suitable for them
Parag Parikh Flexi Cap Fund
Schemersquos Riskometer
woL
High
etaredoM
Very H
i gh
ot
woL
etaredoM
Moderately High
Low Very High
Benchmarkrsquos Riskometer (Nifty 500 TRI)
This Product is suitable for investors who are seeking
The investment objective of the Scheme
is to seek to generate long-term capital
growth from an actively managed portfolio
primarily of Equity and Equity Related
Securities Scheme shall invest in Indian
equities foreign equities and related
instruments and debt securities
Long term capital appreciation
Investment predominantly in equity
and equity related securities
Investors understand that their principalwill be at very high risk
woL
High
etaredoM
Very H
i gh
ot
woL
etaredoM
Moderately High
Low Very High
Investors should consult their financial advisers if in doubt about whether the product is suitable for them
Schemersquos Riskometer
woL
High
etaredoM
Very H
i gh
ot
woL
etaredoM
Moderately High
Low Very High
Benchmarkrsquos Riskometer (Nifty 500 TRI)
This Product is suitable for investors who are seeking
Investors should consult their financial advisers if in doubt about whether the product is suitable for them
Schemersquos RiskometerBenchmarkrsquos Riskometer
(CRISIL Hybrid 85+15 Conservative Index TRI)
This Product is suitable for investors who are seeking
To generate regular income through
investments predominantly in debt and
money market instruments
Long term capital appreciation from the portion of equity investments under the scheme Investors understand that their principal
will be at moderately high risk
Investors understand that their principalwill be at low to moderate risk
woL
High
etaredoM
Very H
i gh
ot
woL
etaredoM
Moderately High
Low Very High
Income over short term
Investments in Debtmoney
market instruments
Investors should consult their financial advisers if in doubt about whether the product is suitable for them
Schemersquos RiskometerBenchmarkrsquos Riskometer
(CRISIL Liquid Fund Index)
This Product is suitable for investors who are seeking
woL
High
etaredoM
Very H
i gh
ot
woL
etaredoM
Moderately High
Low Very High
Parag Parikh Tax Saver Fund
Parag Parikh Conservative Hybrid Fund
Parag Parikh Liquid Fund
There is no assurance that the investment objective of the Scheme will be realized and the scheme does not assure or guarantee any returns
REITs amp InvITs
Equity Investments
Fixed Income Investments
Asset allocation
Type of Instruments Normal Allocation ( of Net Assets) Risk Profile
DEBT
EQUITYREITs
InvITs
Parag Parikh Conservative Hybrid FundAn open-ended hybrid scheme investing predominantly in debt instruments
Debt and money market instruments
Equities and equity related instruments
REITsInvITs
Note
We recommend it to those
Investors should consult their financial advisers if in doubt about whether the product is suitable for them
Investment Team Details
Mr Raunak Onkar Mr Rajeev Thakkar Mr Raj Mehta
Your Distributor Financial Advisor will help you with the investing procedure
`
`
`
`
`
This product is suitable for investors who are seeking
Investors should consult their financial advisers if in doubt about whether the product is suitable for them Investors understand that their principal
will be at moderately high risk
Riskometer
Note
How to invest
Visit ---gt Distributors -----gt Create a foliowwwamcppfascom
Note Please visit the website address for latest Riskometer updates ----gt Statutory Disclosures ---gt Product Label of the Schemeshttpswwwamcppfascom
Note
PPFAS Asset Management Private Limited
MF Utilities
BSE Star MF
NSE
ICEX
Definitions
Fund Manager
This is the minimum investment amount for a new investor in a mutual fund scheme
Minimum additional amount This is the minimum investment amount for an existing investor in a mutual fund scheme
SIP
NAV
Benchmark
Entry Load
Exit Load
Standard Deviation
Sharpe Ratio
Beta
AUM
Holdings
Nature of Scheme
Portfolio Turnover Ratio
Yield to Maturity (YTM)
Modified Duration
Total Expense ratio
An employee of the asset management company such as a mutual fund or life insurer who manages investment of the scheme
He is usually part of a larger team of fund managers and research analysts
Application amount for fresh subscription
SIP or systematic investment plan work on the principle of making periodic investments of a fixed sum It works similar to a recurring
bank deposit For instance an investor may opt for an SIP that invests 500 every 15 ` th of the month in an equity fund for a period of three years
The NAV or the net asset value is the total asset value per unit of the mutual fund after deducting all related and permissible expenses The NAV
is calculated at the end of every business day It is the value at which the investor enters or exits the mutual fund
A group of securities usually a market index whose performance is used as a standard or benchmark to measure investment performance of
mutual funds among other investments Some typical benchmark include the Nifty Sensex BSE 200 BSE 500 10-year Gsec
A mutual fund may have a sales charge or load at the time of entry andor exit to compensate the distributoragent Entry load is charged at the
time an investor purchase the units of a mutual fund The entry load is added to the prevailing NAV at the time of investment For instance if the
NAV is ` 100 and the entry load is 1 the investor will enter the fund at Rs 101
Exit load is charged at the time of redeeming (or transferring an investment between schemes) The exit load percentage is deducted from the
NAV at the time of redemption (or transfer between schemes) This amount goes to the respective scheme and gets added to the AUM of that Scheme
Standard deviation is a statistical measure of the range of an investmentrsquos performance When a mutual fund Scheme has a high standard deviation its
range of performance is wide implying greater volatility
The Sharpe Ratio named after its founder the Nobel Laureate William Sharpe is a measure of risk-adjusted returns It is calculated using standard
deviation and excess return to determine reward per unit of risk
Beta is a measure of an investments volatility vis-a-vis the market Beta of less than 1 means that the security will be less volatile than the market
A beta of greater than 1 implies that the securitys price will be more volatile than the market
AUM or assets under management refers to the recent updated cumulative market value of investments managed by a mutual fund or any
investment firm
The holding or the portfolio is a mutual funds latest or updated reported statement of investmentssecurities These are usually displayed in term
of percentage to net assets or the rupee value or both The objective is to give investors an idea of where their money is being invested by the
fund manager
The investment objective and underlying investments determine the nature of the mutual fund scheme For instance a mutual fund that aims at
generating capital appreciation by investing in stock markets is an equity fund or growth fund Likewise a mutual fund that aims at capital
preservation by investing in debt markets is a debt fund or income fund Each of these categories may have sub-categories
A measure of how frequently assets within a fund are bought and sold by the managers Portfolio turnover is calculated by taking either the total
amount of new securities purchased or the amount of securities sold - whichever is less - over a particular period divided by the total net asset
value (NAV) of the fund The measurement is usually reported for a 12-month time period
The yield to maturity (YTM) of a bond or other fixed-interest security such as gilts is the (theoretical) internal rate of return (IRR overall interest rate) earned by an investor who buys the bond today at the market price assuming that the bond is held until maturity and that all coupon and principal payments are made on schedule
Modified duration is a formula that expresses the measurable change in the value of a security in response to a change in interest rates Modified duration follows the concept that interest rates and bond prices move in opposite directions
The total expense ratio (TER) is a measure of the total cost of a fund to the investor Total costs may include various fees (purchase redemption auditing) and other expenses The TER calculated by dividing the total annual cost by the fundstotal assets averaged over that year is denoted as a percentage
FACT SHEET - OCTOBER 2021
Toll Free 1800-266-7790 | Email mfppfascom
Call 1800-266-7790 (Toll Free) or 91-22-61406538 | E-Mail partnersppfascom
Registered Office 8182 8th Floor Sakhar Bhavan Ramnath Goenka Marg 230 Nariman Point Mumbai - 400 021 INDIA
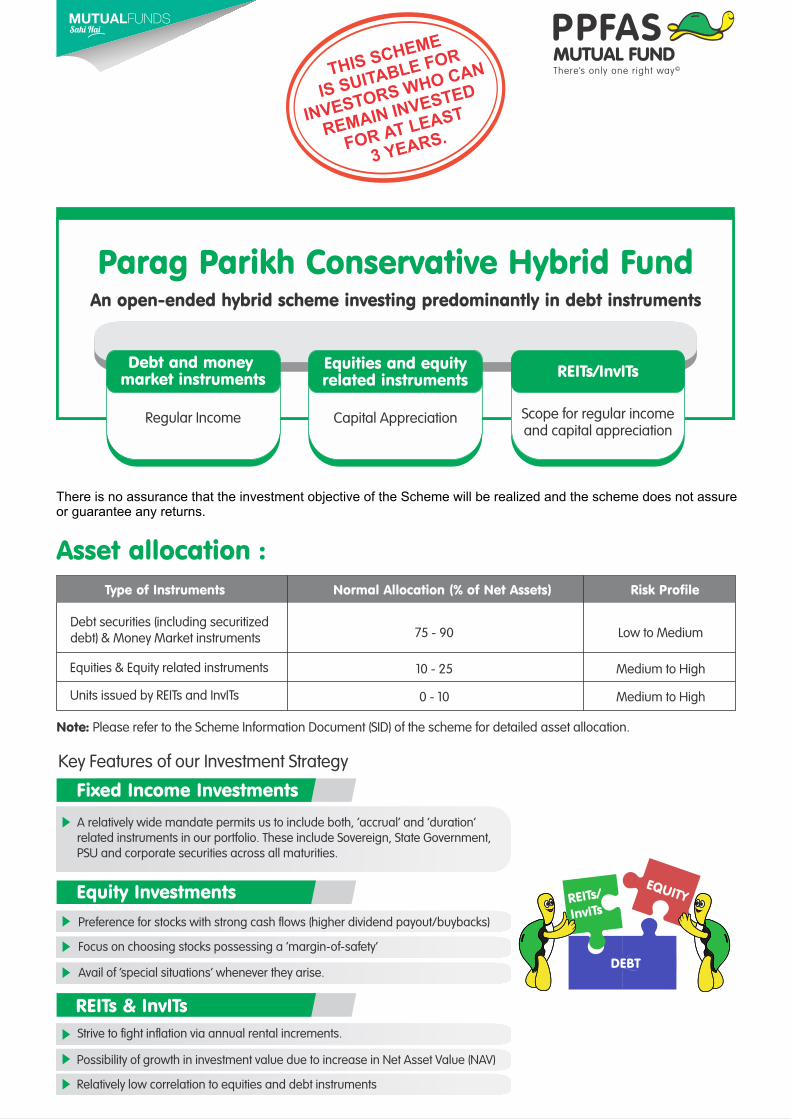
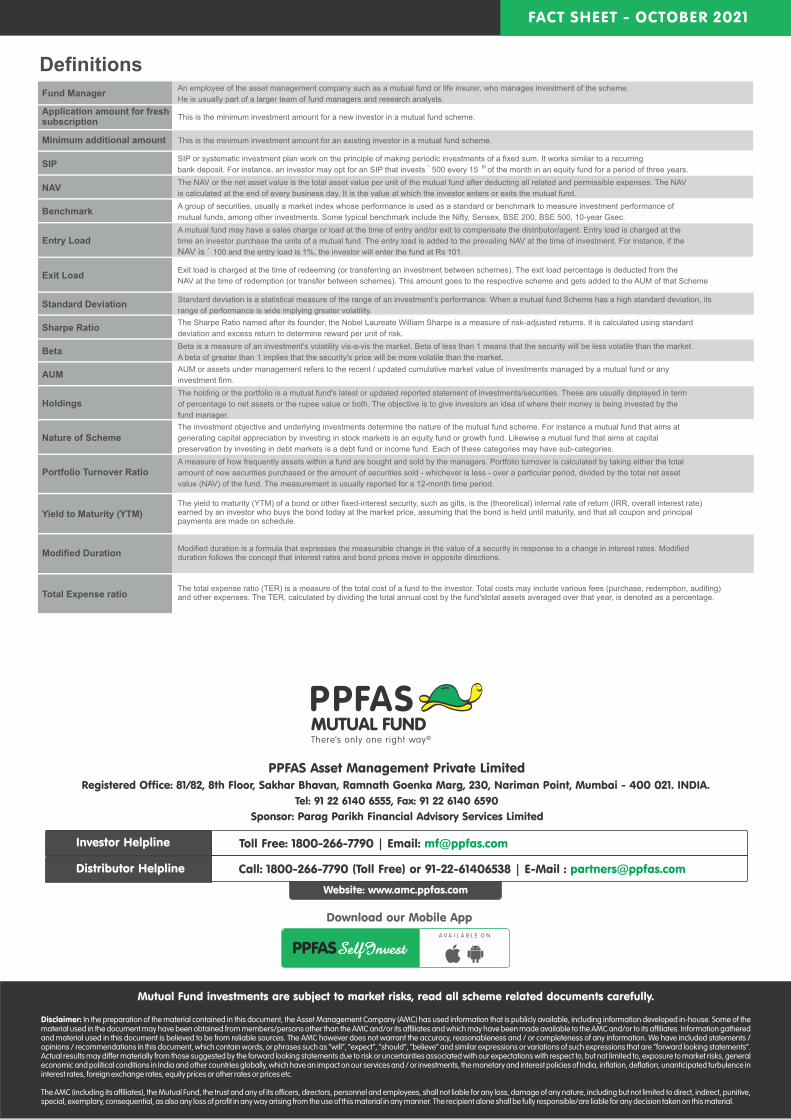