Embed Size (px)
Citation preview

Factsheet for DP&L Stuart Station NPDES Permit Renewal, October 2008 Page 1
National Pollutant Discharge Elimination System (NPDES) Permit Program
F A C T S H E E T
Regarding an NPDES Permit To Discharge to Waters of the State of Ohio
for Dayton Power & Light J. M. Stuart Station
Public Notice No.: 08-11-015 OEPA Permit No.: 0IB00049*ND
Public Notice Date: November 7, 2008 Application No.: OH0004316 Comment Period Ends: December 7, 2008
Name and Address of Facility Where
Name and Address of Applicant: Discharge Occurs:
Dayton Power & Light J. M. Stuart Station Dayton Power & Light J. M. Stuart Station
P.O. Box 468 State Route 52, 4 miles east of Aberdeen Aberdeen, Ohio 45101 Aberdeen, Ohio 45101
Adams County
Receiving Water: Little Three Mile Creek Subsequent
Ohio River Stream Network: the Ohio River
Introduction
Development of a Fact Sheet for NPDES permits is required by Title 40 of the Code of Federal Regulations, Section 124.8 and 124.56. This document fulfills the requirements established in those
regulations by providing the information necessary to inform the public of actions proposed by the Ohio
Environmental Protection Agency, as well as the methods by which the public can participate in the process of finalizing those actions.
This Fact Sheet is prepared in order to document the technical basis and risk management decisions that
are considered in the determination of water quality based NPDES Permit effluent limitations. The technical basis for the Fact Sheet may consist of evaluations of promulgated effluent guidelines and other
treatment-technology based standards, existing effluent quality, instream biological, chemical and
physical conditions, and the allocations of pollutants to meet Ohio Water Quality Standards. This Fact Sheet details the discretionary decision-making process empowered to the director by the Clean Water
Act and Ohio Water Pollution Control Law (ORC 6111). Decisions to award variances to Water Quality
Standards or promulgated effluent guidelines for economic or technological reasons will also be justified in the Fact Sheet where necessary.
Effluent limits based on available treatment technologies are required by Section 301(b) of the Clean
Water Act. Many of these have already been established by U.S. EPA in the effluent guideline regulations (a.k.a. categorical regulations) for industry categories in 40 CFR Parts 405-499. Technology-
based regulations for publicly-owned treatment works are listed in the Secondary Treatment Regulations

Page 2 Factsheet for DP&L Stuart Station NPDES Permit Renewal, October 2008
(40 CFR Part 133). If regulations have not been established for a category of dischargers, the director
may establish technology-based limits based on best professional judgment (BPJ).
Ohio EPA reviews the need for water-quality-based limits on a pollutant-by-pollutant basis. Wasteload allocations are used to develop these limits based on the pollutants that have been detected in the
discharge, and the receiving water’s assimilative capacity. The assimilative capacity depends on the flow
in the water receiving the discharge, and the concentration of the pollutant upstream. The greater the upstream flow, and the lower the upstream concentration, the greater the assimilative capacity is.
Assimilative capacity may represent dilution (as in allocations for metals), or it may also incorporate the
break-down of pollutants in the receiving water (as in allocations for oxygen-demanding materials).
The need for water-quality-based limits is determined by comparing the wasteload allocation for a
pollutant to a measure of the effluent quality. The measure of effluent quality is called PEQ - Projected
Effluent Quality. This is a statistical measure of the average and maximum effluent values for a pollutant. As with any statistical method, the more data that exists for a given pollutant, the more likely that PEQ
will match the actual observed data. If there is a small data set for a given pollutant, the highest measured
value is multiplied by a statistical factor to obtain a PEQ; for example if only one sample exists, the factor is 6.2, for two samples - 3.8, for three samples - 3.0. The factors continue to decline as samples sizes
increase. These factors are intended to account for effluent variability, but if the pollutant concentrations
are fairly constant, these factors may make PEQ appear larger than it would be shown to be if more
sample results existed.
Summary of Proposed Permit Conditions
A draft permit for the Dayton Power & Light Stuart Station was public noticed in August 2007. That
permit was not finalized, and the draft permit proposed with this factsheet replaces the earlier draft permit. With few exceptions, the monitoring requirements and limits in this draft permit are the same as
those proposed in the August 2007 draft permit. Monitoring for fathead minnows at outfall 013 has been
removed from this draft permit.
This draft permit also includes a compliance schedule for the submittal of a plan to limit public access to
the thermal mixing zone in Little Threemile Creek and the confluence of Little Threemile Creek with the
Ohio River.
This permit renewal is proposed for a term of approximately three and one-half years, expiring in July
2012.
Factsheet for DP&L Stuart Station NPDES Permit Renewal, October 2008 Page 3
Table of Contents
Page Introduction ............................................................................................................................................. 1
Summary of Permit Conditions ................................................................................................................ 2
Table of Contents .................................................................................................................................... 3
Procedures for Participation in the Formulation of Final Determinations .................................................. 6
Location of Discharge/Receiving Water Use Classification ...................................................................... 7
Facility Description ................................................................................................................................. 8
Description of Existing Discharge ........................................................................................................... 8
FGD Waste Treatment System............................................................................................................... 11
Assessment of Impact of Discharge on Receiving Waters ..................................................................... 12
Development of Water Quality-Based Effluent Limits ........................................................................... 15
Parameter Selection ............................................................................................................................... 15
Wasteload Allocation ............................................................................................................................ 16
Reasonable Potential ............................................................................................................................. 16
Comparison of PEQ Data ...................................................................................................................... 16
Whole Effluent Toxicity WLA .............................................................................................................. 17
Effluent Limits / Hazard Management Decisions ................................................................................... 17
Other Requirements ............................................................................................................................... 21
Schedule of Compliance ........................................................................................................................ 22
Whole Effluent Toxicity Reasonable Potential ....................................................................................... 23
List of Figures Figure 1. Location of DP&L Stuart Station. ............................................................................................ 7
Figure 2. Wastewater Flow Diagram. .................................................................................................... 10
Figure 3. Water Temperature at Outfall 001. ......................................................................................... 12

Page 4 Factsheet for DP&L Stuart Station NPDES Permit Renewal, October 2008
Table of Contents (continued)
Figure 4. Temperature Gradient: Ohio River ......................................................................................... 15
Figure 5. Ohio River Study Area........................................................................................................... 15
List of Tables Table 1. Description of Dayton Power & Light Stuart Station Outfalls .................................................... 9
Table 2. Flow Rates for DP&L Stuart Station Outfalls ......................................................................... 11
Table 3. Reported Permit Violations: January 2002 – February 2007 ................................................... 11
Table 4. Acute Toxicity Test Results for Ceriodaphnia dubia ............................................................... 23
Table 5 Effluent Concentrations Based Upon Renewal Application and Ohio EPA Data ...................... 24
Table 6. Supplemental Sampling Data: January – March 2007 .............................................................. 29
Table 7. Effluent Characterization and Decision Criteria: 2002 - 2006 .................................................. 30
Table 8. Effluent Data for DP&L Stuart Station .................................................................................... 37
Table 9. Effluent Data for Stuart Station: 2003 – 2007 ........................................................................ 41
Table 10. Water Quality Criteria in the Study Area ............................................................................... 42
Table 11. Background Water Quality and Discharger Flow ................................................................... 43
Table 12-xxx. Summary of Effluent Limits to Maintain Applicable Water Quality Criteria
Table 12-012. ...for Outfall 012 ......................................................................................................... 44 Table 12-013. ...for Outfall 013 ......................................................................................................... 44
Table 12-001. ...for Outfall 001 ......................................................................................................... 45
Table 12-002. ...for Outfall 002 ......................................................................................................... 45 Table 12-020. ...for Outfall 020 ......................................................................................................... 45
Table 12-609. ...for Outfall 609 ......................................................................................................... 46
Table 13-xxx. Parameter Assessment
Table 13-012. Parameter Assessment for Outfall 012 ......................................................................... 47
Table 13-013. Parameter Assessment for Outfall 013 ......................................................................... 48
Table 13-001. Parameter Assessment for Outfall 001 ......................................................................... 49 Table 13-002. Parameter Assessment for Outfall 002 ......................................................................... 50
Table 13-020. Parameter Assessment for Outfall 020 ......................................................................... 51
Table 13-609. Parameter Assessment for Outfall 609 ......................................................................... 52

Factsheet for DP&L Stuart Station NPDES Permit Renewal, October 2008 Page 5
Table of Contents (continued)
Table 14-xxx. Final Effluent Limits and Monitoring Requirements
Table 14-001. Final Effluent Limits and Monitoring Requirements for Outfalls 001and 002 .............. 53
Table 14-012. Final Effluent Limits and Monitoring Requirements for Outfall 012 ........................... 53
Table 14-013. Final Effluent Limits and Monitoring Requirements for Outfall 013 ........................... 54 Table 14-019. Final Effluent Limits and Monitoring Requirements for Outfall 019 ........................... 54
Table 14-020. Final Effluent Limits and Monitoring Requirements for Outfall 020 ........................... 55
Table 14-021. Final Effluent Limits and Monitoring Requirements for Outfall 021 ........................... 55
Table 14-602. Final Effluent Limits and Monitoring Requirements for Outfall 602 ........................... 55
Table 14-603. Final Effluent Limits and Monitoring Requirements for Outfall 603 ........................... 56 Table 14-609. Final Effluent Limits and Monitoring Requirements for Outfall 609 ........................... 57
Attachment A. Federal Effluent Guidelines Applicable to Dayton Power & Light Stuart Station .......... 58
Page 6 Factsheet for DP&L Stuart Station NPDES Permit Renewal, October 2008
Procedures for Participation in the Formulation of Final Determinations
The draft action shall be issued as a final action unless the Director revises the draft after consideration of the record of a public meeting or written comments, or upon disapproval by the Administrator of the U.S.
Environmental Protection Agency.
Within thirty days of the date of the Public Notice, any person may request or petition for a public meeting for presentation of evidence, statements or opinions. The purpose of the public meeting is to
obtain additional evidence. Statements concerning the issues raised by the party requesting the meeting
are invited. Evidence may be presented by the applicant, the state, and other parties, and following presentation of such evidence other interested persons may present testimony of facts or statements of
opinion.
Requests for public meetings shall be in writing and shall state the action of the Director objected to, the
questions to be considered, and the reasons the action is contested. Such requests should be addressed to:
Legal Records Section
Ohio Environmental Protection Agency
Lazarus Government Center P.O. Box 1049
Columbus, Ohio 43216-1049
Interested persons are invited to submit written comments upon the discharge permit. Comments should
be submitted in person or by mail no later than 30 days after the date of this Public Notice. Deliver or
mail all comments to:
Ohio Environmental Protection Agency Attention: Division of Surface Water
Water Resource Management Section
Lazarus Government Center
P.O. Box 1049 Columbus, Ohio 43216-1049
The OEPA permit number and Public Notice numbers should appear on each page of any submitted
comments. All comments received no later than 30 days after the date of the Public Notice will be
considered.
The application, fact sheet, public notice, permit including effluent limitations, special conditions,
comments received and other documents are available for inspection and may be copied at a cost of 25
cents per page at the Ohio Environmental Protection Agency at the address shown above any time between the hours of 8:00 a.m. and 5:00 p.m., Monday through Friday. Copies of the Public Notice are
available at no charge at the same address.

Factsheet for DP&L Stuart Station NPDES Permit Renewal, October 2008 Page 7
Location of Discharge/Receiving Water Use Classification
The Dayton Power & Light Stuart Station (or DP&L Stuart Station) is located in the southwest corner of Adams County, on the Ohio River four miles east of Aberdeen, Ohio. The majority of the outfalls
discharge into Little Threemile Creek which empties into the Ohio River at approximately River Mile
(RM) 405.7. The remaining outfalls discharge directly into the Ohio River and Buzzard’s Roost Creek.
(Buzzard’s Roost Creek is a small tributary of the Ohio River which discharges into the Ohio River at approximately RM 403.4. This segment of the Ohio River is described by Ohio EPA River Code 25-200,
U.S. EPA River Reach # 05090201-020, and the Interior Plateau (IP) Ecoregion. The Ohio River is
presently designated for the following uses: Warmwater Habitat (WWH), Agricultural Water Supply (AWS), Industrial Water Supply (IWS), Public Water Supply (PWS) and Bathing Waters (BW). Figure 1
shows the location of the DP&L Stuart Station and the facility’s outfalls.
Figure 1. Location of DP&L Stuart Station
This segment of Little Threemile Creek is described by Ohio EPA River Code 10-050, U.S. EPA River Reach #05090201-020, and the Interior Plateau (IP) Ecoregion. Little Threemile Creek is presently
designated for the following uses: Warmwater Habitat (WWH), Agricultural Water Supply (AWS),
Industrial Water Supply (IWS), Primary Contact Recreation (PCR).
This segment of Buzzard’s Roost Creek is described by Ohio EPA River Code 25-200, U.S. EPA River
Reach #05090201-020, and the Interior Plateau (IP) Ecoregion. Buzzard’s Roost Creek is presently
designated for the following uses: Warmwater Habitat (WWH), Agricultural Water Supply (AWS), Industrial Water Supply (IWS), Primary Contact Recreation (PCR).
Use designations define the goals and expectations for a waterbody. These goals are set for aquatic life protection, recreation use and water supply use, and are defined in the Ohio Water Quality Standards, or

Page 8 Factsheet for DP&L Stuart Station NPDES Permit Renewal, October 2008
the Ohio Administrative Code (OAC 3745-1-07). The use designations for individual waterbodies are
listed in rules -08 through -32 of the OAC. Once the goals are set, numeric water quality standards are
developed to protect these uses; higher quality uses typically have more protective water quality criteria.
Use designations for aquatic life protection include habitats for coldwater fish and macroinvertebrates,
warmwater aquatic life and waters with exceptional communities of warmwater organisms. These uses
all meet the goals of the federal Clean Water Act. Ohio Water Quality Standards (WQS) also include aquatic life use designations for waterbodies which can not meet the Clean Water Act goals because of
human-caused conditions that can not be remedied without causing fundamental changes to land use and
widespread economic impact. The dredging and clearing of some small streams to support agricultural or
urban drainage is the most common of these conditions. These streams are given Modified Warmwater or Limited Resource Water designations.
Recreation uses are defined by the depth of the waterbody and the potential for wading or swimming. Uses are defined for bathing waters, swimming/canoeing (Primary Contact) and wading only (Secondary
Contact - generally waters too shallow for swimming or canoeing). Water supply uses are defined by the
actual or potential use of the waterbody. Public Water Supply designations apply near existing water intakes so that waters are safe to drink with standard treatment. Most other waters are designated for
agricultural and industrial water supply.
Facility Description
The DP&L Stuart Station, which is jointly owned by the Dayton Power & Light Company, Cincinnati
Gas & Electric, and Columbus Southern Electric, is a coal-fired steam-electric generating station. This
facility is involved in the generation, transmission, and distribution of electric power. The total generating
capacity is 2400 megawatts of electricity.
The DP&L Stuart Station’s processes generate wastewaters which are regulated by the federal effluent
guidelines (FEGs) listed in 40 CFR Part 423, Steam Electric Power Generating Point Source Category. The process operations at this facility are also defined by the standard industrial classification (SIC)
category 4911 - Electric Services.
Description of Existing Discharge
The DP&L Stuart Station has a total of four non-storm water outfalls which discharge directly to Little
Threemile Creek. Outfalls 001 and 002 discharge once-through cooling water from boiler units 1, 2, and
3 at locations that are approximately one mile from the mouth of Little Threemile Creek. (See Table 1.)
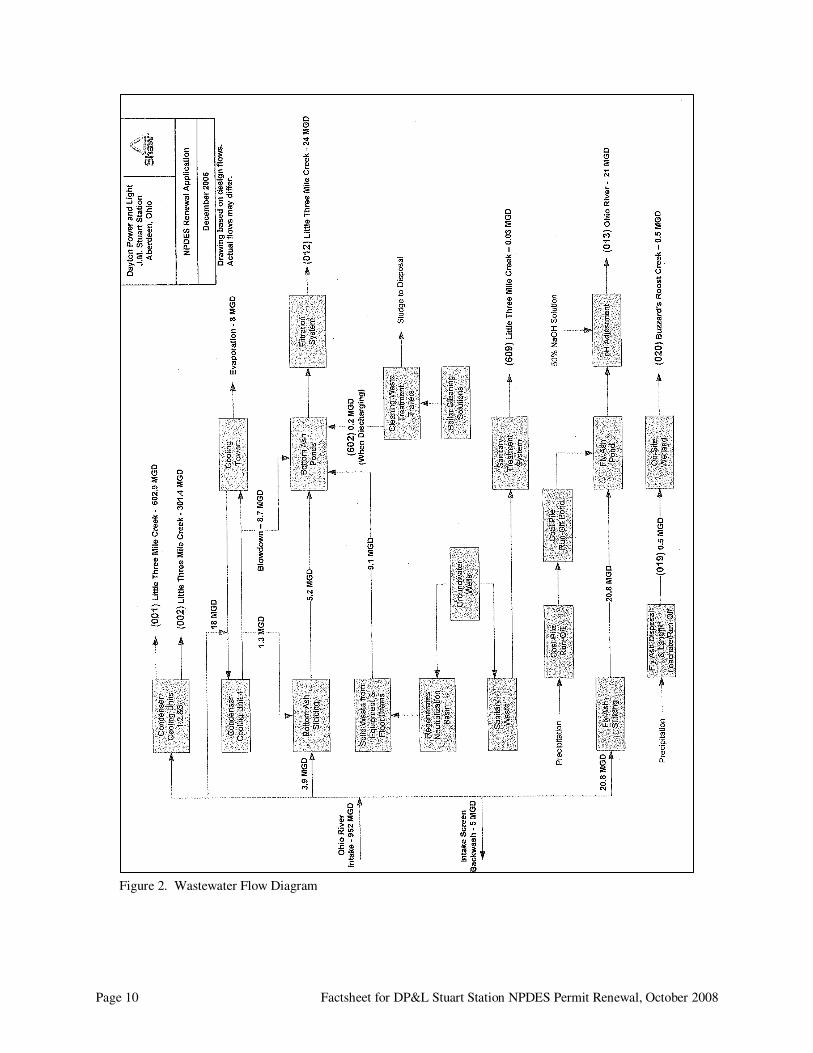
Outfall 012 also discharges to Little Threemile Creek downstream from outfalls 001 and 002, and discharges the wastewater from the bottom ash pond, which receives bottom ash sluice, cooling tower
blowdown, waste water from the oil/water separators, and some storm water. The bottom ash pond
provides sedimentation, and three filters provide treatment using ground walnut hulls as a filter medium immediately prior to the discharge to Little Threemile Creek. Figure 2 on page 10 shows a schematic
diagram of the wastewater flows at the Stuart Station.

Factsheet for DP&L Stuart Station NPDES Permit Renewal, October 2008 Page 9
Table 1. Description of Dayton Power & Light Stuart Station Outfalls
Outfall # Type of Wastewater Treatment System Used Discharge Location
001
Non-contact cooling water
from condensers for generating
units 1 and 2
None Little Threemile Creek
002
Non-contact cooling water
from condenser for generating
units 3
None Little Threemile Creek
012
Cooling tower blowdown,
bottom ash pond discharge,
storm water, oil/water separator wastewater
- Sedimentation
- Filtration Little Threemile Creek
013 Fly ash pond discharge and
coal pile runoff
- Sedimentation
- Neutralization Ohio River
019
Fly ash disposal facility storm
water collection pond discharge
to wetlands, landfill runoff
- Sedimentation
Outfall 020
020 Wetlands effluent discharge
(from outfall 019) None Buzzard’s Roost Creek
602 Chemical metal cleaning waste
treatment discharge
- Rapid sand filtration
- Coagulation
- Neutralization
Outfall 012
609 Sanitary sewage treatment
plant
- Extended aeration
- Disinfection Little Threemile Creek
003, 004,
005, 009,
and 010
Storm water None Little Threemile Creek
016, 017,
and 018 Storm water None Ohio River
Outfall 609 conveys treated sanitary wastewater to Little Threemile Creek between outfalls 002 and
outfall 012. Storm water flow combines with the discharge from outfall 609 just before entering Little Threemile Creek. The fly ash pond discharges through outfall 013 directly to the Ohio River at
approximately RM 403.5, just downstream from the confluence of Buzzard’s Roost Creek. Outfall 019
discharges to a wetland which flows through outfall 020 into Buzzard’s Roost Creek near its mouth, and receives storm water and landfill leachate from the fly ash landfill facility. Storm water outfalls 016, 017,
and 018 discharge to the Ohio River. Outfall 009 discharges to Little Threemile Creek.
The DP&L Stuart Station operates a water intake structure located in the Ohio River at RM 404.7, approximately one mile upstream from the confluence of Little Threemile Creek.
Page 10 Factsheet for DP&L Stuart Station NPDES Permit Renewal, October 2008
Figure 2. Wastewater Flow Diagram
Factsheet for DP&L Stuart Station NPDES Permit Renewal, October 2008 Page 11
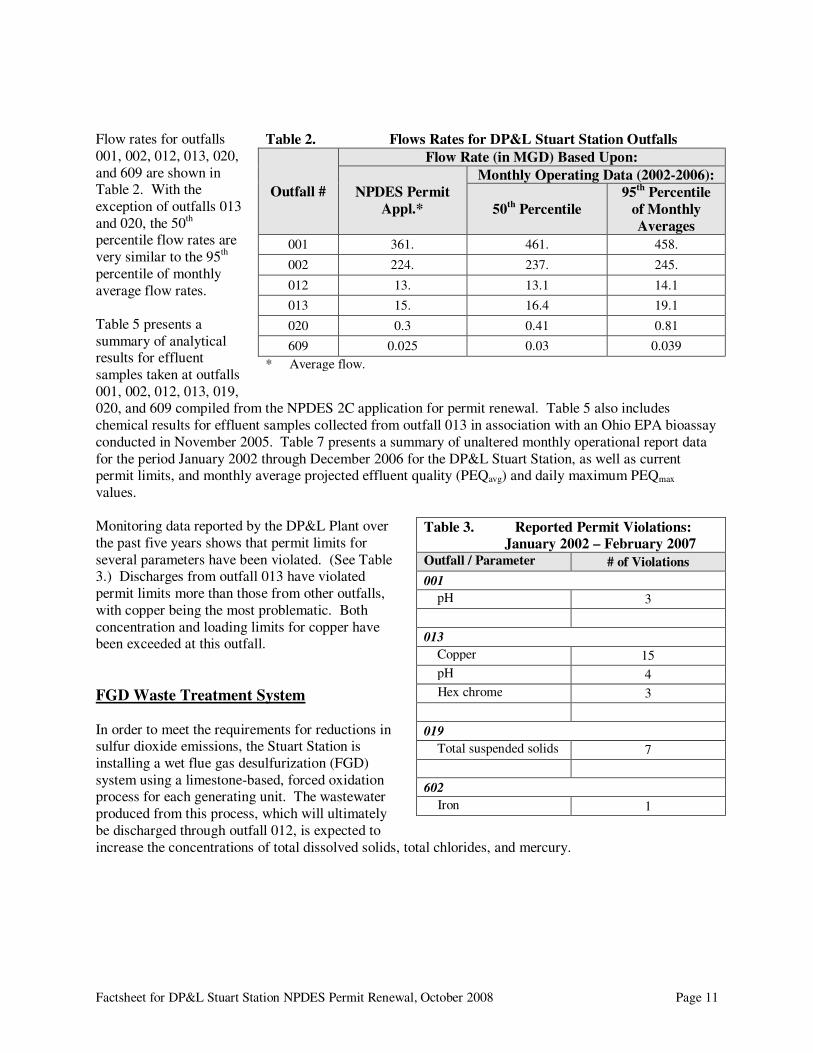
Flow rates for outfalls
001, 002, 012, 013, 020,
and 609 are shown in Table 2. With the
exception of outfalls 013
and 020, the 50th
percentile flow rates are
very similar to the 95th
percentile of monthly
average flow rates.
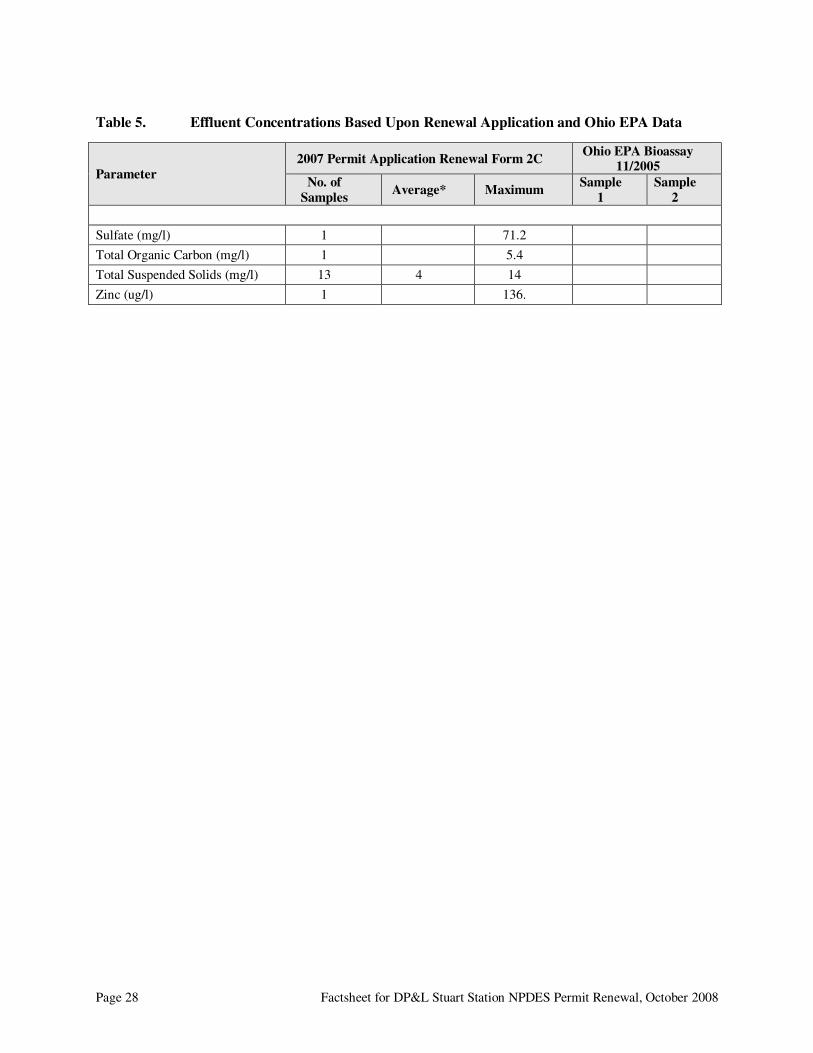
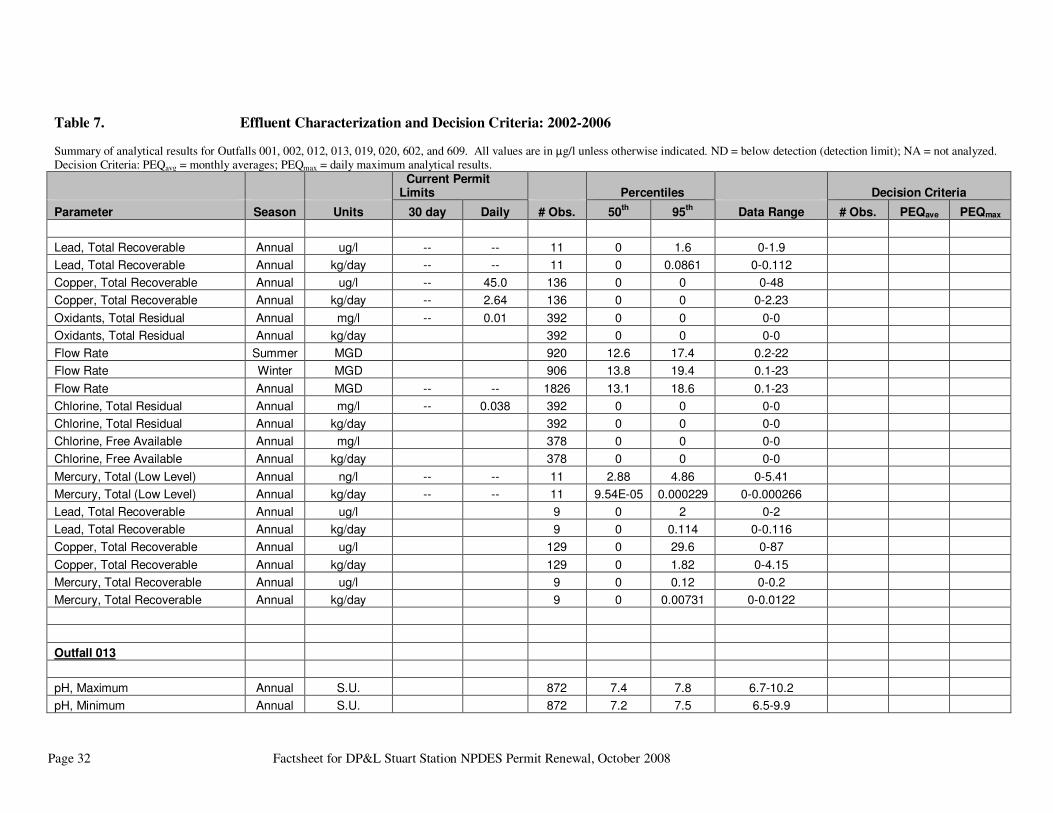
Table 5 presents a
summary of analytical results for effluent
samples taken at outfalls
001, 002, 012, 013, 019, 020, and 609 compiled from the NPDES 2C application for permit renewal. Table 5 also includes
chemical results for effluent samples collected from outfall 013 in association with an Ohio EPA bioassay
conducted in November 2005. Table 7 presents a summary of unaltered monthly operational report data
for the period January 2002 through December 2006 for the DP&L Stuart Station, as well as current permit limits, and monthly average projected effluent quality (PEQavg) and daily maximum PEQmax
values.
Monitoring data reported by the DP&L Plant over
the past five years shows that permit limits for
several parameters have been violated. (See Table 3.) Discharges from outfall 013 have violated
permit limits more than those from other outfalls,
with copper being the most problematic. Both
concentration and loading limits for copper have been exceeded at this outfall.
FGD Waste Treatment System
In order to meet the requirements for reductions in sulfur dioxide emissions, the Stuart Station is
installing a wet flue gas desulfurization (FGD)
system using a limestone-based, forced oxidation process for each generating unit. The wastewater
produced from this process, which will ultimately
be discharged through outfall 012, is expected to
increase the concentrations of total dissolved solids, total chlorides, and mercury.
Table 2. Flows Rates for DP&L Stuart Station Outfalls
Outfall #
Flow Rate (in MGD) Based Upon:
NPDES Permit
Appl.*
Monthly Operating Data (2002-2006):
50th
Percentile
95th
Percentile
of Monthly
Averages
001 361. 461. 458.
002 224. 237. 245.
012 13. 13.1 14.1
013 15. 16.4 19.1
020 0.3 0.41 0.81
609 0.025 0.03 0.039
* Average flow.
Table 3. Reported Permit Violations: January 2002 – February 2007 Outfall / Parameter # of Violations
001
pH 3
013
Copper 15
pH 4
Hex chrome 3
019
Total suspended solids 7
602
Iron 1

Page 12 Factsheet for DP&L Stuart Station NPDES Permit Renewal, October 2008
Assessment of Impact of Discharge on Receiving Waters
The primary continuing concern regarding the discharges from the DP&L Plant is the impact of the effluent temperature and the quantity of heat discharged at outfalls 001 and 002. Effluent temperatures,
temperatures in Little Threemile Creek, and temperatures in the Ohio River at the confluence of Little
Threemile Creek routinely exceed 40EC. (104EF.) during the summer, and occasionally are greater than
50EC. (122EF.) The maximum effluent temperature reported by the Stuart Station from January 1, 2002
through December 31, 2006 was 57EC., or 135EF. Temperatures at outfall 001 exceeded 104ºF. on 611 days and exceeded 122ºF. on 41 days during this same time period. At outfall 002, the temperatures of
104ºF. and 122ºF. were exceeded 580 and 21 times, respectively. Figure 3 below shows the discharge
temperatures for outfall 001 from 2002 through 2006. (The temperature pattern for outfall 002 is very
similar to that shown for outfall 001.) The thermal plume from these discharges usually remains near the surface of the water, and has been observed to extend across the entire width of the Ohio River.
The average combined flow discharged from outfalls 001 and 002 is approximately 1100 cubic feet per second (cfs), which exceeds 10 percent of the Ohio River low flow, or 9800 cfs.
1 Given the high
temperatures and relatively large volume of flow from the Stuart Station, the total thermal load discharged
is quite significant when compared to the Ohio River low flow.
Likely due to these high
temperatures and
thermal load, biological sampling by the Ohio
River Valley Water
Sanitation Commission (ORSANCO) in this area
of the Ohio River during
the summers of 1999 and 2000 found much lower
numbers of fish and fish
species in the immediate
vicinity of the Little Threemile Creek
confluence compared to
upstream sites. Although no biological
sampling has been conducted in Little Threemile Creek, it is unlikely that fish or other indigenous aquatic
life can survive in this stream during summer months when the instream temperatures are often above
98EF.2 In contrast, fish are apparently overly abundant in Little Threemile Creek and in the Ohio River
near Little Threemile Creek during winter months due to the attraction of warm water.
1The low flow as used in this context is defined as the 7Q10 flow, or the lowest seven-day average flow
which occurs only once every ten years.
2 The maximum allowable temperature in Ohio’s water quality standards is 98EF. for limited resource
waters. Temperatures above 98EF. can be considered toxic to aquatic life.
Figure 3. Water Temperature at Outfall 001
Water Temperature
0
20
40
60
80
100
120
140
4/19/2001 9/1/2002 1/14/2004 5/28/2005 10/10/2006 2/22/2008
Date
Deg
rees (
F)

Factsheet for DP&L Stuart Station NPDES Permit Renewal, October 2008 Page 13
As part of a routine sampling effort on June 28, 2007, ORSANCO encountered extremely high
temperatures (107.8 Fº) in the mainstem of the Ohio River immediately downstream from the Stuart
Station discharge. In addition, very few fish were caught for biological sampling and dead fish were
observed in the area as well. ORSANCO, in consultation with Ohio EPA, proceeded to develop a plan for more intensive sampling at sites both upstream and downstream from the discharge. Temperature and
biological sampling were then conducted on three separate dates: August 9th, August 30th, and
September 24th.
The results of ORSANCO’s sampling show that:
• The average temperatures of upstream reference sites in the Ohio River ranged from 84.6 Fº on
August 9th to 76.8 Fº on September 24th, while the surface temperature at the Stuart Station discharge ranged from 119.5 Fº to 98.2 Fº on the corresponding dates.
• On each of the three
sampling dates, ORSANCO
observed the thermal plume extending to the Kentucky
shore, where temperatures
above 95 Fº and 86 Fº were measured on August 9th and
September 24th,
respectively. (See Figure 4
for a depiction of the thermal plume measured on
August 9th at the surface,
and at depths of one and two below the surface.)
• The sampling conducted on
August 9th suggested that
the primary impact of the thermal discharge is
confined to the top ten feet
of the water column. In
addition, downstream sampling showed that the
thermal plume was fully
mixed within the water column beyond two miles
and four miles from the
discharge, on August 9th
and September 24th, respectively.
• Elevated temperatures were
observed in the river and
along both the Ohio and Kentucky shores at a
distance of 4.5 miles
downstream on August 9th and eleven miles
Figure 4. Temperature gradient observed on 8/09/07 in the vicinity of the J. M. Stuart
discharge (ORM 405.7) at the surface, 1 ft and, 2 ft depth contours. Temperature gradients
are shown in 1°C increments (colors labeled). Cross-section refers to locations were
temperature data was collect (1 = Ohio shore 5 ft contour, 3 = mid-channel, 5 = Kentucky
shore 5 ft contour). Water flow is from left to right.

Page 14 Factsheet for DP&L Stuart Station NPDES Permit Renewal, October 2008
downstream on September 24th.
• Only one downstream site scored below the Ohio River Fish Index (ORFIn), however, all of the
downstream sites scored significantly lower than the upstream reference zones.
ORSANCO’s biological data indicates that the 316(a) requirements of a “…balanced, indigenous community…” of aquatic organisms is not attained in the Ohio River downstream from the Stuart Station
during summer months. During summer months, fish and aquatic life avoid an area downstream of
DP&L, while in winter months, the fish and other aquatic life return and are attracted to the warmer temperatures. Historical data indicates that balanced, indigenous communities have not been present
during warm weather months in lower Little Threemile Creek since the Stuart Plant was built.
Finally, rule 3745-1-04 of the Ohio Administrative Code requires that all waters of the state, to every extent practicable and possible, are “free from” substances which:
$ adversely affect aquatic life; $ are unsightly or cause degradation;
$ create a nuisance; or
$ are rapidly lethal in the mixing zone.
Ohio EPA has had concerns that conditions in Little Threemile Creek and the Ohio River resulting from
the high discharge temperatures may violate all four of the “free from” criteria. Temperatures above
98EF. adversely affect aquatic life, and in fact, can be rapidly lethal to fish. The high temperatures and associated floating scum from thermophilic bacteria in Little Threemile Creek can be unsightly during the summer months. In addition, the high temperatures in the Ohio River are a nuisance and a potential
health hazard. Boating in a river having a plume of water which is frequently greater than 104EF. and
possibly as high as 130EF. is not desirable and is possibly unsafe to anyone who comes in contact with
that water (e.g., people swimming as a result of a boating accident).
In September 2007, the ORSANCO sent a comment letter on the August 2007 draft NPDES permit for
the Stuart Station stating the following:
“…we believe that the discharge causing such temperatures may be in conflict with the
Commission’s 2006 Pollution Control Standards, Section V.A.2.d, which states that cooling
water discharges will not result in conditions harmful to humans in the event of a temporary exposure, or Section V.I. B, which states that conditions within the mixing zone shall not be
injurious to human health.”
In order to address these concerns, DP&L was required to conduct a thermal discharge study under the
terms and conditions of the existing NPDES permit for the Stuart Station. DP&L was required to
evaluate the technical feasibility and economic reasonableness of methods other than cooling towers for reducing the temperature of the mixing zone in the Ohio River resulting from outfalls 001 and 002. A
number of alternatives, each of which would improve the mixing characteristics of the discharge, were
examined to determine the predicted reduction in thermal plume surface area and volume. These
alternatives included:
• reducing the size of the opening for the weir from Little Threemile Creek to the Ohio River;
• increasing the flow rate from outfalls 001 and 002 above the amounts needed for cooling; and
• several diffuser options.

Factsheet for DP&L Stuart Station NPDES Permit Renewal, October 2008 Page 15
Scenarios which resulted in greater reductions in the size of the thermal plume were selected for further
evaluation to determine the biological effects of a reduced thermal plume, and the estimated cost of each
scenario. Although biological impacts are reduced substantially by some of the scenarios, the study
concludes that none of the alternatives are cost effective.
Development of Water
Quality-Based Effluent
Limits
Determining appropriate
effluent concentrations is a
multiple-step process in which
parameters are identified as likely to be discharged by a
facility, evaluated with respect
to Ohio water quality criteria, and examined to determine the
likelihood that the existing
effluent could violate the
calculated limits. The available assimilative
capacity was distributed
between the outfalls using the CONSWLA water quality
model. The study area is
shown in Figure 5.
Parameter Selection
Effluent data for the Stuart
Station were used to determine what parameters should undergo wasteload allocation. The sources of effluent data are as follows:
Self-monitoring data January 2001 - December 2007
Ohio EPA data November 2005 2c data 2007 NPDES Permit Renewal Application
The effluent data were checked for outliers and none were identified. This data is evaluated statistically, and Projected Effluent Quality (PEQ) values are calculated for each pollutant. PEQavg values represent
the 95th percentile of monthly average data, and PEQmax values represent the 95
th percentile of all data
points. The average and maximum projected effluent quality (PEQ) values are presented in Table 8. For a
summary of the screening results, refer to the parameter groupings on pages 47 through 52.
PEQ values are used according to Ohio rules to compare to applicable WQS and allowable WLA values
for each pollutant evaluated. Initially, PEQ values are compared to the applicable average and maximum WQS. If both PEQ values are less than 25 percent of the applicable WQS, the parameter does not have
the reasonable potential to cause or contribute to exceedances of WQS, and no wasteload allocation is
Figure 5. Ohio River Study Area
020
013
609
012
Little Threemile
Flow
Ohio River
002
001
Intake

Page 16 Factsheet for DP&L Stuart Station NPDES Permit Renewal, October 2008
done for that parameter. If either the PEQavg or PEQmax is greater than 25 percent of the applicable WQS,
a wasteload allocation is conducted to determine whether the parameter exhibits reasonable potential (and
needs to be limited) or if monitoring is required.
Wasteload Allocation
For those parameters that require a wasteload allocation (WLA), the results are based on the uses assigned
to the receiving waterbody in OAC 3745-1. The applicable waterbody uses for this facility’s discharge and the associated stream design flows are as follows:
Aquatic life (WWH)
Toxics (metals, organics, etc.) Average 10% of annual 7Q10 Maximum 1% of annual 7Q10
NH3-N toxicity Average 10% of annual 7Q10
Agricultural Water Supply 10% of harmonic mean flow Human Health (nondrinking) 10% of harmonic mean flow
Allocations are developed using a percentage of stream design flow, and allocations cannot exceed the Inside Mixing Zone Maximum criteria. The data used in the WLA are listed in Tables 10 and 11. The
wasteload allocation results to maintain all applicable criteria are presented in Tables 12-012 through
12-609. For purposes of developing the waste load allocations, outfalls 001, 002, 609, and 012 were
modelled as discharges to Little Threemile Creek in the backwaters of the Ohio River; therefore, these outfalls were treated as direct discharges to the Ohio River. However, under normal conditions, the
flow in Little Threemile Creek upstream from outfalls 609 and 012 consists of the cooling water
discharges from outfalls 001 and 002 and a small amount from the upper watershed of the creek. The water in Little Threemile Creek would not normally include backwaters of the Ohio River, especially
during low flow events for the Ohio River.
Reasonable Potential
After appropriate effluent limits are calculated by wasteload allocation, the lowest most restrictive
average and maximum values are selected from Tables 12-012 through 12-609 and are referred to as
Preliminary Effluent Limits (PELavg and PELmax respectively). The reasonable potential of the discharger to exceed the wasteload allocation (PEL values) is determined by comparing the PEQavg (Tables 8 and 9)
to the PELavg and the PEQmax to the PELmax for each parameter. Based on this comparison, each
parameter is placed in a defined “group”. Parameters that do not have a water quality standard (WQS) or do not require a WLA based on the initial screening are assigned to either group 1 or 2. Parameters are
assigned to group 3, 4, or 5 depending on how close the PEQ value is to the allocated value or PEL. The
groupings listed in Tables 13-012 through 13-609 reflect the reasonable potential hazard assessment done
according to WLA procedures.
Comparison of PEQ Data
The draft permit which was public noticed in August 2007 used January 2001 through December 2005 as
the period of record for calculation of PEQs and determination of reasonable potential. Table 8 reflects
this period of record. For this draft permit, PEQ values have been re-calculated using January 2003

Factsheet for DP&L Stuart Station NPDES Permit Renewal, October 2008 Page 17
through December 2007 as the period of record, and these results are shown in Table 9. The reasonable
potential analysis has also been re-done with this draft permit, and changes from the August 2007 draft
permit are noted in the parameter assessment tables – Tables 13-001, 13-002, 13-012, 13-013, 13-020,
and 13-609.
Whole Effluent Toxicity WLA
Whole effluent toxicity or “WET” is the total toxic effect of an effluent on aquatic life measured directly
with a toxicity test. Acute WET measures short term effects of the effluent while chronic WET measures
longer term and potentially more subtle effects of the effluent.
Water Quality Standards for WET are expressed in Ohio’s narrative “free from” WQS rule (OAC 3745-1-
04(D)). These “free froms” are translated into toxicity units (TUs) by the associated WQS
Implementation Rule (OAC 3745-2-09). Wasteload allocations can then be calculated using TUs as if they were water quality criteria.
AET calculations are similar to aquatic life criteria wasteload allocation calculations. The AET
calculations for chronic toxicity are similar to those for determining average aquatic life waste load allocations. In accordance with the Rule 3745-2-09 of the OAC, the AET for acute toxicity is set equal to
1.0 TUa. For the Stuart Station, the wasteload allocations are as follows:
Outfall 020 0.3 TUa 1683 TUc
Outfall 013 0.3 TUa 37 TUc
Outfall 001 0.3 TUa 2.54 TUc Outfall 002 0.3 TUa 5.75 TUc
Outfall 609 0.3 TUa 43558 TUc
Outfall 012 0.3 TUa 101 TUc
When the calculated acute AET is less than 1.0 TUa, Allowable Effluent Toxicity is defined as:
Dilution Ratio Allowable Effluent Toxicity (downstream flow to discharger flow) (percent effects in 100% effluent)
up to 2 to 1 30
greater than 2 to 1 but less than 2.7 to 1 40
2.7 to 1 to 3.3 to 1 50
The AET is 30 percent effects in 100 percent effluent based on the dilution ratio of 1 to 1.
Effluent Limits/Hazard Management Decisions
The final effluent limits are determined by evaluating the groupings in conjunction with other
applicable rules and regulations. Tables 14-001, 14-012, 14-013, 14-019, 14-020, 14-602, and 14-609
show the draft NPDES limits and monitoring requirements for the DP&L Stuart Station.
Federal and State laws/regulation require that dischargers meet both treatment-technology-based limits
and any more stringent standards needed to comply with state WQS. Permit limits are based on the more restrictive of the two. Treatment-technology-based limits for the Stuart Station, found in 40 CFR
Page 18 Factsheet for DP&L Stuart Station NPDES Permit Renewal, October 2008
Part 423, Steam Electric Power Generating Point Source Category, are based on the milligrams of
pollutant allowed to be discharged per liter. (See Attachment A on page 58.)
The DP&L Stuart Station’s NPDES permit application did not request an increase in loadings of currently permitted pollutants. As a result, an anti-degradation review is not required and has not been
performed in association with this permit renewal. Detailed discussion of the limits and monitoring
requirements for each outfall are shown below.
Outfalls 001 and 002: Table 14-001
Monitoring for water temperature, pH, total residual oxidants, flow rate, total residual chlorine, and duration of chlorination/bromination at these outfalls have been continued in the draft permit.
Total residual chlorine includes a limit of 0.2 milligrams per liter (mg/l), which allows chlorination
at this outfall for not more than two hours each day, and is based upon the Federal Effluent Guidelines for steam-electric power plants and studies which have been conducted examining the
instream toxicity of chlorine. The limit of 0.05 mg/l for total residual oxidants, which is based
upon best professional judgement regarding the relative toxicity of bromine, is included in the draft permit to allow the DP&L Stuart Station to discharge bromine or bromine and chlorine
compounds for not more than two hours per day. The pH limits are based upon the Ohio water
quality criteria.
Although Ohio EPA continues to have concerns regarding the high temperatures of the cooling
water discharged from these outfalls, available data appears to show that the thermal plume does
not jeopardize the “…projection and propagation of a balanced, indigenous population of shellfish, fish, and wildlife in and on the body of water…” [Section 316(a) of the Clean Water Act] over
the long term (beyond the summer season). As a result, the Section 316(a) variance for the Stuart
Station will be continued in the renewed permit, allowing water temperatures in the Ohio River mixing zone to exceed water quality standards.
The draft permit also continues the thermal load limit of 11,000 million BTU per hour in order to
protect the Ohio River. The thermal load will continue to be reported individually for each cooling water discharge (outfalls 001 and 002). However, the sum of thermal loads is also reported under
calculated outfall 021 which also includes the thermal load limit.
Several additional parameters with water quality criteria were detected in the effluent from outfall
001 (barium, copper, and zinc) and outfall 002 (barium, copper, nickel, and zinc) but were not
allocated since the concentration of the pollutant was less than 110 percent of its concentration in the
intake water.1 This determination has been made in accordance with Rule 3745-2-06 of the Ohio
Administrative Code, and has been based upon the data reported in the NPDES 2C permit renewal
application and supplemental sampling conducted by the Stuart Station in January through March of 2007. (See Tables 5 and 6.)
Outfall 012: Table 14-012
The Ohio EPA risk assessment places copper, mercury (after November 15, 2010), and sulfate in
Group 4. This placement as well as the data in Tables 7, 8, and 9 indicates that limits are not
1A threshold of 110 percent has been used in order to allow for possible sampling and/or analytical error.

Factsheet for DP&L Stuart Station NPDES Permit Renewal, October 2008 Page 19
required for these parameters, however, monitoring is recommended for Group 4 parameters, and
has been included. The draft permit requires DP&L to continue using EPA Method 1631 (or use
Method 245.7) for analysis of mercury. The existing limit for copper has been removed, but since
the PEQ value for copper is greater than 75 percent of the most stringent waste load allocation, Part II of the permit must include tracking language. This language is required by Ohio
Administrative Code 3745-33-07(A)(2), and specifies that the permittee must notify Ohio EPA in
writing whenever the effluent concentration of copper exceeds the most stringent waste load allocation.
The Ohio EPA risk assessment places zinc, total dissolved residue (or TDS), and total chloride in
Group 3. Monitoring is optional for parameters placed in Group 3, however, the draft permit includes monitoring for zinc since this pollutant continues to be detected. Sampling for TDS and
chloride is also included since the waste stream from the FGD treatment system is ultimately
discharged through this outfall and is expected to have high concentrations of these pollutants.
Limits for total suspended solids, and oil and grease have been continued at this outfall from the
existing permit. These limits are based upon the anti-backsliding provisions in the Ohio Administrative Code, which prevent the imposition of less stringent limits in a permit being
renewed except under certain conditions. In the case of the DP&L permit, none of these
conditions have been met.
Since cooling tower blowdown is discharged at outfall 012, limits for total residual chlorine and
total residual oxidants are proposed to continue. The operation of the cooling tower includes the
use of products which can release chlorine and/or bromine, and these pollutants may be present in the blowdown from the cooling tower.
Limits for pH are continued from the existing permit and are based upon Ohio water quality criteria. Flow rate monitoring is required in accordance with Ohio EPA guidance for determining
sampling frequency for industrial discharges.
Effluent hardness has been used to determine aquatic water quality criteria for copper at this outfall. However, since Ohio EPA is not aware of any recent hardness data, monitoring for
hardness has been added to this outfall in order to provide updated data for future waste load
allocations.
Outfall 013: Table 14-013
The Ohio EPA risk assessment places chromium+6
, nickel, and copper in Group 5 and recommends limits for these parameters. These placements as well as the data in Tables 7, 8, and 9 indicate that
environmental hazards exist for chromium+6
and copper, and limits are necessary to protect water
quality. Limits are proposed to continue for these parameters. Although the wasteload allocation would result in a slightly higher limit for copper (55 ug/l vs. 53 ug/l), the anti-backsliding
requirements of the Ohio Administrative Code require that the more stringent existing limit is
maintained in the new permit.
Nickel is a Group 5 parameter, however, this placement is based upon only one sample which may
not be representative of effluent quality. In order collect sufficient data for a more thorough
assessment of reasonable potential for nickel when the permit is subsequently renewed, monitoring only has been included for this parameter. In addition, a tracking requirement has been included in

Page 20 Factsheet for DP&L Stuart Station NPDES Permit Renewal, October 2008
Part II of the permit in accordance with Ohio Administrative Code 3745-33-07(A)(2) since the
PEQ for nickel is greater than 75 percent of the most stringent waste load allocation.
The Ohio EPA risk assessment places fluoride, sulfate, and mercury (after November 15, 2010) in Group 4. This placement as well as the data in Tables 7, 8, and 9 indicate that environmental
hazards do not exist for these parameters, and limits are not necessary to protect water quality.
However, monitoring is recommended and has been included in the permit. A tracking requirement has been included in Part II of the permit for sulfate in accordance with Ohio
Administrative Code 3745-33-07(A)(2) since the PEQ is greater than 75 percent of the most
stringent waste load allocation. The Stuart Station is required to used a low-level method (EPA
Method 1631 or 245.7) for mercury analysis.
The Ohio EPA risk assessment places ammonia, cadmium, selenium, and zinc, and in group 3;
monitoring is optional for parameters placed in this grouping. Since these parameters have been detected frequently at outfall 013, monitoring is proposed to continue for these pollutants at a
frequency of once per week for ammonia and once per quarter for selenium, zinc, and cadmium.
Concentration limits for total suspended solids (TSS) and oil and grease are continued in the draft
permit, and are based upon Federal Effluent Guidelines for steam-electric generating stations
discharging fly ash transport wastewater. Loading limits for TSS and oil and grease have been
based upon the design flow of 20.8 MGD. Loadings limits for other parameters are based upon a flow rate of 19.1 MGD which represents the PEQ average flow reported for outfall 013 (or
approximately the 95th percentile of the monthly averages for the flow rate).
Biomonitoring as well as whole effluent toxicity limits have been included at this outfall based
upon the results of toxicity testing during the past several years. See page 23 for further discussion
of this issue.
Effluent hardness has been used to determine aquatic water quality criteria for copper at this
outfall. However, since Ohio EPA is not aware of any recent hardness data, monitoring for this
parameter has been added to this outfall in order to provide updated data for future waste load allocations.
Outfall 019: Table 14-019
Limits for total suspended solids have been continued at this outfall from the existing permit, and
are based upon the Federal Effluent Guidelines for steam-electric generating stations.
Outfall 020: Table 14-020
Outfall 020 discharges into Buzzard’s Roost Creek from a wetland. Flow rate and pH monitoring is proposed to continue at outfall 020. In addition, the Ohio EPA risk assessment places sulfate in
Group 5 and recommends limits for this parameter. However, this placement is based upon only
one sample which may not be representative of the effluent quality. As a result, monitoring only has been included in the permit for this parameter in order to provide an adequate dataset for
reasonable potential analysis when the subsequent permit is renewed.

Factsheet for DP&L Stuart Station NPDES Permit Renewal, October 2008 Page 21
Outfall 602: Table 14-602
The draft permit includes limits for total suspended solids, oil and grease, copper, and iron at this
outfall. These requirements are based upon best practicable control technology and best available technology economically achievable for the discharge of metal cleaning wastes. In addition, flow
rate must be monitored in accordance with Ohio EPA guidance for industrial waste discharges.
Outfall 603: Table 14-603
This outfall will discharge wastewater from the FGD waste treatment system. All of the
monitoring requirements at this outfall are based upon requirements at other power plants located in Ohio which have (or are installing) very similar FGD treatment systems.
Outfall 609: Table 14-609
This outfall discharges sanitary wastes from the facility into Little Threemile Creek. Limits for
total suspended solids and CBOD5 are proposed to continue in the draft permit, and are based upon secondary treatment standards. Limits for pH and fecal coliform are also continued from the
existing permit and are based upon Ohio water quality criteria. Monitoring requirements for color,
dissolved oxygen, ammonia, odor, turbidity, and flow rate are all proposed to continue in the draft
permit and are based upon Ohio EPA guidance for industrial discharges.
The Ohio EPA risk assessment places nitrate+nitrite and zinc in Group 5 and recommends limits
for these parameters. These placements as well as the data in Tables 7 and 8 indicate that environmental hazards exist for these pollutants, and limits are necessary to protect water quality.
However, the placement of nitrate+nitrite in Group 5 is based upon only one sample which may
not be representative of effluent quality. As a result, monitoring only has been included in the permit for this parameter in order to provide an adequate dataset for reasonable potential analysis
when the subsequent permit is renewed.
Other Requirements
The intake structure for the Stuart Station includes screens which prevent unwanted debris and trash from entering the facility. When these screens are backwashed, much of this solid waste is deposited
on the stream bank near the intake structure and some of it is discharged directly into the Ohio River.
Part II of the permit requires the facility to “…use best efforts to remove any solid waste deposited on the Ohio River Stream bank…” as a result of the intake operations.
Operator certification requirements have been included in Part II, Items V and W of the permit in accordance with rules adopted in December 2006. These rules require the Stuart Station to have a
Class A wastewater treatment plant operator in charge of the sewage treatment plant operations
discharging through outfall 609 when the permit is renewed or modified after December 21, 2008.
Part II of the permit also includes requirements for signs to be placed at each outfall discharging to the
Ohio River, providing information about the discharge. Signage at outfalls is required pursuant to
Ohio Administrative Code 3745-33-08(A).
A recent addition to rule 3745-33-08(F) of the Ohio Administrative Code requires that permittees
discharging wastewater within ten miles of a downstream public water supply intake located on the

Page 22 Factsheet for DP&L Stuart Station NPDES Permit Renewal, October 2008
same waterway, must develop spill (or bypass) notification procedures in conjunction with the
downstream public water supply operator. Since the City of Maysville, Kentucky operates a public
water supply intake less than ten miles downstream from the Stuart Station, Part II of the draft permit
requires the development of notification procedures within six months after the effective date of the permit.
Under rules which were promulgated July 9, 2004 under Section 316(b) of the federal Clean Water Act (33 U.S.C. section 1326), the permittee was required to collect and/or compile the following
information pertaining to the facility’s cooling water intake structure(s):
- source water physical data [40 CFR 122.21(r)(2)]; - cooling water intake structure data [40 CFR 122.21(r)(3)];
- cooling water system data [40 CFR 122.21(r)(5)]; and
- rates of impingement and/or entrainment of fish and shellfish at the facility’s cooling water intake structure(s) based upon sampling conducted at the facility.
The permit requires all of this information listed above to be submitted with the permittee’s next NPDES permit renewal application unless federal rules are promulgated which require the submittal of
the information at an earlier date. However, DP&L is encouraged to submit the data pertaining to
Section 316(b) prior to the submittal of the next renewal application so that more time is available for
evaluation.
Schedule of Compliance
In response to concerns expressed by Ohio EPA, DP&L submitted a letter dated June 6, 2008 which contained the following statements:
“…DP&L would be willing to eliminate and/or severely restrict public access to the lower portion of Little Threemile Creek (consisting of the discharge channel and the Ohio River shoreline) on
Company-owned property during the months of July – September of each year…DP&L may also
be willing to post signs advising boaters and fishermen not to swim in the immediate area…”
The schedule of compliance in the draft permit requires DP&L to develop a plan for restricting public
access to the mixing zone in order to address concerns with regard to human health impacts from the
thermal discharge. The plan must be developed and submitted to Ohio EPA for review within three months after the effective date of the permit.

Factsheet for DP&L Stuart Station NPDES Permit Renewal, October 2008 Page 23
Whole Effluent Toxicity Reasonable Potential
In compliance with the existing permit, DP&L has been conducting acute toxicity tests using the effluent from
outfall 013. The existing permit also required DP&L to
conduct a plant performance evaluation to determine the
source of the toxicity at this outfall. The company submitted a letter to Ohio EPA dated November 9, 2005
which stated that the plant performance evaluation was
being discontinued based upon DP&L’s belief that the testing showed no evidence of toxicity in effluent from
outfall 013.
DP&L’s testing from October 2004 through August 2008
showed only one result above detection for fathead
minnows (0.6 TUa on October 13, 2004). However, a total
of eight samples showed evidence of acute toxicity based upon the test species Ceriodaphnia dubia. (See Table 4.)
In addition, Ohio EPA conducted a screening bioassay test
in November 2005 which showed evidence of acute toxicity for Ceriodaphnia dubia. The Ohio EPA
composite test resulted in 20 percent mortality for fathead
minnows and 65 percent mortality for Ceriodaphnia
dubia.
Based upon these results and in accordance with rule
3745-33-07 of the Ohio Administrative Code, the discharge from outfall 013 has been placed into
biomonitoring category 1 for Ceriodaphnia dubia. Acute
toxicity limits have been proposed at outfall 013 for Ceriodaphnia dubia. (Monitoring has not been included
for fathead minnows.) In addition, the permit requires
DP&L to conduct a toxicity reduction evaluation (or TRE)
to determine the source of the toxicity and minimize or eliminate its effects.
Table 4. Acute Toxicity Test
Results for Ceriodaphnia Dubia
Sample Date Toxicity Units (or
TUa)
10/13/2004 1.4
2/24/2005 1.0
4/13/2005 0.2
5/18/2005 AA
6/14/2005 AA
7/13/2005 AA
7/20/2005 AA
8/2/2005 AA
8/16/2005 AA
9/7/2005 AA
9/13/2005 AA
9/27/2005 AA
11/15/2005 AA
12/17/2005 1.7
3/8/2006 1.74
6/14/2006 1.57
8/24/2006 AA
12/6/2006 AA
3/21/2007 1.17
6/6/2007 2.73
8/8/2007 AA
12/5/2007 AA
3/12/2008 2
6/11/2008 AA
8/14/2008 AA

Page 24 Factsheet for DP&L Stuart Station NPDES Permit Renewal, October 2008
Table 5. Effluent Concentrations Based Upon Renewal Application and Ohio EPA Data
Parameter
2007 Permit Application Renewal Form 2C Ohio EPA Bioassay
11/2005
No. of
Samples Average* Maximum
Sample
1
Sample
2
Outfall 001
Aluminum (ug/l) 1 4180
Barium (ug/l) 1 93.2
Chem. Oxy. Demand (mg/l) 1 37.2
Copper (ug/l) 1 25.5
Fluoride (mg/l) 1 0.12
Iron (ug/l) 1 7770
Magnesium (mg/l) 1 10.8
Manganese (ug/l) 1 706
Nickel (ug/l) 1 15.5
Nitrate+Nitrite (mg/l) 1 0.857
Nitrogen, Total Org. (mg/l) 1 1.23
Sulfate (mg/l) 1 49.7
Titanium (ug/l) 1 85.3
Total Organic Carbon (mg/l) 1 4.15
Total Suspended Solids (mg/l) 1 179
Zinc (ug/l) 1 95.8
Outfall 002
Aluminum (ug/l) 1 5160
Barium (ug/l) 1 98.6
Chem. Oxy. Demand (mg/l) 1 85
Copper (ug/l) 1 30.3
Fluoride (mg/l) 1 0.12
Iron (ug/l) 1 8410
Magnesium (mg/l) 1 11.2
Manganese (ug/l) 1 679
Nickel (ug/l) 1 17.3
Nitrate+Nitrite (mg/l) 1 0.861
Nitrogen, Total Org. (mg/l) 1 0.896
Sulfate (mg/l) 1 49.6
Titanium (ug/l) 1 150
Total Organic Carbon (mg/l) 1 4.21

Factsheet for DP&L Stuart Station NPDES Permit Renewal, October 2008 Page 25
Table 5. Effluent Concentrations Based Upon Renewal Application and Ohio EPA Data
Parameter
2007 Permit Application Renewal Form 2C Ohio EPA Bioassay
11/2005
No. of
Samples Average* Maximum
Sample
1
Sample
2
Total Suspended Solids (mg/l) 1 186
Zinc (ug/l) 1 115
Outfall 012
Aluminum (ug/l) 1 604
Barium (ug/l) 1 84.3
Boron (ug/l) 1 84
Chem. Oxy. Demand (mg/l) 1 11.9
Copper (ug/l) 1 25
Fluoride (mg/l) 1 0.36
Iron (ug/l) 1 566
Magnesium (mg/l) 1 11.4
Manganese (ug/l) 1 50.2
Mercury (ug/l) 4 0.0021 0.0043
Nitrate+Nitrite (mg/l) 1 0.981
Phenols (ug/l) 1 33
Sulfate (mg/l) 1 117
Titanium (ug/l) 1 23.2
Total Organic Carbon (mg/l) 1 2.1
Total Suspended Solids (mg/l) 150 6 54
Outfall 013
Aluminum (ug/l) 1 170. 272. < 200.
Ammonia (mg/l) 54 0.6 1.7 0.168 0.274
Arsenic (ug/l) 1 < 100. 7.4 6.8
Barium (ug/l) 1 289. 220. 227.
Cadmium (ug/l) 1 < 30. 1.88 1.96
Calcium (mg/l) 68. 70.
Chem. Oxy. Demand (mg/l) 1 < 10.
Chloride (mg/l) 52.6
Fluoride (mg/l) 1 0.47
Hardness (mg/l) 240. 245.

Page 26 Factsheet for DP&L Stuart Station NPDES Permit Renewal, October 2008
Table 5. Effluent Concentrations Based Upon Renewal Application and Ohio EPA Data
Parameter
2007 Permit Application Renewal Form 2C Ohio EPA Bioassay
11/2005
No. of
Samples Average* Maximum
Sample
1
Sample
2
Iron (ug/l) 1 < 100. 98. < 50.
Magnesium (mg/l) 1 13.3 17. 17.
Manganese (ug/l) 1 163. 55. 58.
Mercury (ug/l) 4 0.0033 0.007
Nickel (ug/l) 1 29.8
Nitrate+Nitrite (mg/l) 1 0.865 1.56 1.78
Nitrogen, Total Org. (mg/l) 1 0.8
Oil & Grease (mg/l) 104 0.1 9. 2.3
Phosphorus (mg/l) 1 < 0.1 < 0.010 0.011
Potassium (mg/l) 10. 10.
Selenium (ug/l) 1 < 100. 48.5 49.5
Silver (ug/l) 1 < 40.
Sodium (mg/l) 42. 43.
Strontium (ug/l) 586. 601.
Sulfate (mg/l) 1 180.
Thallium (ug/l) 1 < 100.
TKN (mg/l) 0.36 0.28
Total Dissolved Solids (mg/l) 456. 452.
Total Organic Carbon (mg/l) 1 1.1
Total Suspended Solids (mg/l) 104 5 18.
Zinc (ug/l) 1 102. 87. 86.
Outfall 019
Aluminum (ug/l) 1 1140.
Barium (ug/l) 1 128.
Boron (ug/l) 1 2270.
Chem. Oxy. Demand (mg/l) 1 24.8
Chlorine, Total Res. (mg/l) 1 0.2
Fluoride (mg/l) 1 0.52
Iron (ug/l) 1 1060.
Magnesium (mg/l) 1 33.9
Manganese (ug/l) 1 306.
Molybdenum (ug/l) 1 229.
Nitrogen, Total Org. (mg/l) 1 0.848

Factsheet for DP&L Stuart Station NPDES Permit Renewal, October 2008 Page 27
Table 5. Effluent Concentrations Based Upon Renewal Application and Ohio EPA Data
Parameter
2007 Permit Application Renewal Form 2C Ohio EPA Bioassay
11/2005
No. of
Samples Average* Maximum
Sample
1
Sample
2
Sulfate (mg/l) 1 314.
Titanium (ug/l) 1 47.
Total Organic Carbon (mg/l) 1 5.9
Total Suspended Solids (mg/l) 27 25 59
Outfall 020
Aluminum (ug/l) 1 938.
Barium (ug/l) 1 132.
Boron (ug/l) 1 2440.
Chem. Oxy. Demand (mg/l) 1 20.5
Chlorine, Total Res. (mg/l) 1 0.2
Fluoride (mg/l) 1 0.5
Iron (ug/l) 1 1160.
Magnesium (mg/l) 1 36.
Manganese (ug/l) 1 354.
Molybdenum (ug/l) 1 234.
Sulfate (mg/l) 1 314.
Titanium (ug/l) 1 28.4
Total Organic Carbon (mg/l) 1 5.4
Total Suspended Solids (mg/l) 1 20.
Outfall 609
Ammonia (mg/l) 13 0.1 0.1
Barium (ug/l) 1 28.1
Boron (ug/l) 1 147.
Chem. Oxy. Demand (mg/l) 1 20.5
Fluoride (mg/l) 1 0.2
Iron (ug/l)
Magnesium (mg/l) 1 17.5
Manganese (ug/l) 1 11.7
Nitrate+Nitrite (mg/l) 1 34.6
Nitrogen, Total Org. (mg/l) 1 2.52
Phosphorus (mg/l) 1 8.69
Page 28 Factsheet for DP&L Stuart Station NPDES Permit Renewal, October 2008
Table 5. Effluent Concentrations Based Upon Renewal Application and Ohio EPA Data
Parameter
2007 Permit Application Renewal Form 2C Ohio EPA Bioassay
11/2005
No. of
Samples Average* Maximum
Sample
1
Sample
2
Sulfate (mg/l) 1 71.2
Total Organic Carbon (mg/l) 1 5.4
Total Suspended Solids (mg/l) 13 4 14
Zinc (ug/l) 1 136.

Factsheet for DP&L Stuart Station NPDES Permit Renewal, October 2008 Page 29
Table 6. Supplemental Sampling Data: January – March 2007 (in ug/l)
Station Parameter January February March
31st 1st 3rd 5th 7th 8th 9th 13th 15th 16th 17th 19th
River Intake
Barium 45.3 46.8 44.2 48.4 40.9 43.4 41.2 39.5 49.2 49.6 60 94.3
Copper1 ND ND ND ND ND ND ND ND ND ND 27 ND
Iron 1460 1360 842 907 510 713 454 399 2190 2320 3830 7480
Nickel2 ND ND ND ND ND ND ND ND ND ND ND 12.7
Zinc3 ND ND ND ND ND ND ND ND ND ND ND 94.1
Outfall 001
Barium 45.4 47.2 46.8 49.7 44.8 45.9 40.7 42.1 48.2 51.6 61.3 102
Copper1 ND ND ND ND ND ND ND ND ND ND ND ND
Iron 1300 1240 961 923 739 646 686 585 2470 2650 3760 10400
Nickel2 ND ND ND ND ND ND ND ND ND ND ND 16.5
Zinc3 ND ND ND ND ND ND ND ND ND ND ND 77.4
Outfall 002
Barium 42.8 48.8 44.8 50.5 46.2 45.8 40.6 51.6 47.7 48.3 62.5 94.2
Copper1 ND ND ND ND ND ND ND 22.6 ND ND ND ND
Iron 1300 1360 1120 888 730 674 541 860 2480 2770 3970 6990
Nickel2 ND ND ND ND ND ND ND ND ND ND ND 12.9
Zinc3 ND ND ND ND ND ND ND 1690 ND ND ND 70.5
Outfall 020
Barium 81.4 80.3 88.2 96.8 84.8 82 85 83.6 80.2 78.9 77.1 69.8
Boron 1830 1970 2110 2190 1980 1920 2180 2200 1380 1350 1320 1330
Outfall 609
Zinc 87.4 91.7 114 54.9 113 84.1 73.2 142 181 171 208 149
1 - Detection limit is 20 µg/l 2 - Detection limit is 10 µg/l 3 - Detection limit is 50 µg/l

Page 30 Factsheet for DP&L Stuart Station NPDES Permit Renewal, October 2008
Table 7. Effluent Characterization and Decision Criteria: 2002-2006
Summary of analytical results for Outfalls 001, 002, 012, 013, 019, 020, 602, and 609. All values are in :g/l unless otherwise indicated. ND = below detection (detection limit); NA = not analyzed. Decision Criteria: PEQavg = monthly averages; PEQmax = daily maximum analytical results.
Current Permit Limits Percentiles Decision Criteria
Parameter Season Units 30 day Daily # Obs. 50th
95th
Data Range # Obs. PEQave PEQmax
Outfall 001
Water Temperature Annual C -- -- 863 33 49 13-51
Water Temperature Annual F -- -- 914 92 121 25-131
Thermal Discharge Annual Million BTU/Hr 863 5830 6130 1550-8400
Thermal Discharge Annual Million
BTU/Day -- -- 914 5740 6140 1800-6380
pH Annual S.U. 6.5 <= pH <= 9.0 260 7.8 8.2 6.7-8.5
Oxidants, Total Residual Annual mg/l -- 0.05 115 0 0 0-0
Oxidants, Total Residual Annual kg/day 115 0 0 0-0
Flow Rate Summer MGD 895 477 555 132-671
Flow Rate Winter MGD 882 390 544 93.2-666
Flow Rate Annual MGD -- -- 1777 461 551 93.2-671
Chlorine, Total Residual Annual mg/l -- 0.2 168 0 0 0-0
Chlorine, Total Residual Annual kg/day 168 0 0 0-0
Chlorination/Bromination Duration Annual Minutes Not more than 120 133 120 120 120-120
Outfall 002
Water Temperature Annual C 760 33 49 12-57
Water Temperature Annual F -- -- 869 83 120 12-126
Thermal Discharge Annual Million BTU/Hr 760 2970 3080 662-3270
Thermal Discharge Annual Million
BTU/Day -- -- 802 2900 3070 538-3160

Factsheet for DP&L Stuart Station NPDES Permit Renewal, October 2008 Page 31
Table 7. Effluent Characterization and Decision Criteria: 2002-2006
Summary of analytical results for Outfalls 001, 002, 012, 013, 019, 020, 602, and 609. All values are in :g/l unless otherwise indicated. ND = below detection (detection limit); NA = not analyzed. Decision Criteria: PEQavg = monthly averages; PEQmax = daily maximum analytical results.
Current Permit Limits Percentiles Decision Criteria
Parameter Season Units 30 day Daily # Obs. 50th
95th
Data Range # Obs. PEQave PEQmax
pH Annual S.U. 6.5 <= pH <= 9.0 237 7.9 8.2 7.2-8.5
Oxidants, Total Residual Annual mg/l -- 0.05 109 0 0 0-0
Oxidants, Total Residual Annual kg/day 109 0 0 0-0
Flow Rate Summer MGD 810 240 261 67.7-319
Flow Rate Winter MGD 751 233 265 83.1-468
Flow Rate Annual MGD -- -- 1561 237 264 67.7-468
Chlorine, Total Residual Annual mg/l -- 0.2 149 0 0 0-0
Chlorine, Total Residual Annual kg/day 149 0 0 0-0
Chlorination/Bromination Duration Annual Minutes Not more than 120 121 120 120 120-120
Outfall 012
pH Annual S.U. 6.5 <= pH <= 9.0 768 7.4 8.07 6.1-8.9
Residue, Total Dissolved Annual mg/l 17 314 431 220-463
Residue, Total Dissolved Annual kg/day 17 13800 19400 8660-21600
Total Suspended Solids Annual mg/l 25 75 765 5 22 0-69
Total Suspended Solids Annual kg/day 2176 6529 765 217 1320 0-3990
Oil and Grease, Total Annual mg/l 130 0 2 0-4
Oil and Grease, Total Annual kg/day 130 0 104 0-220 Oil and Grease, Hexane Extr Method Annual mg/l 10 15 130 0 0 0-5 Oil and Grease, Hexane Extr Method Annual kg/day 871 1306 130 0 0 0-248
Chloride, Total Annual mg/l 17 30 55.2 20-56
Chloride, Total Annual kg/day 17 1500 2490 787-2610
Zinc, Total Recoverable Annual ug/l -- -- 20 0 81.6 0-93
Zinc, Total Recoverable Annual kg/day -- -- 20 0 4.32 0-5.49
Page 32 Factsheet for DP&L Stuart Station NPDES Permit Renewal, October 2008
Table 7. Effluent Characterization and Decision Criteria: 2002-2006
Summary of analytical results for Outfalls 001, 002, 012, 013, 019, 020, 602, and 609. All values are in :g/l unless otherwise indicated. ND = below detection (detection limit); NA = not analyzed. Decision Criteria: PEQavg = monthly averages; PEQmax = daily maximum analytical results.
Current Permit Limits Percentiles Decision Criteria
Parameter Season Units 30 day Daily # Obs. 50th
95th
Data Range # Obs. PEQave PEQmax
Lead, Total Recoverable Annual ug/l -- -- 11 0 1.6 0-1.9
Lead, Total Recoverable Annual kg/day -- -- 11 0 0.0861 0-0.112
Copper, Total Recoverable Annual ug/l -- 45.0 136 0 0 0-48
Copper, Total Recoverable Annual kg/day -- 2.64 136 0 0 0-2.23
Oxidants, Total Residual Annual mg/l -- 0.01 392 0 0 0-0
Oxidants, Total Residual Annual kg/day 392 0 0 0-0
Flow Rate Summer MGD 920 12.6 17.4 0.2-22
Flow Rate Winter MGD 906 13.8 19.4 0.1-23
Flow Rate Annual MGD -- -- 1826 13.1 18.6 0.1-23
Chlorine, Total Residual Annual mg/l -- 0.038 392 0 0 0-0
Chlorine, Total Residual Annual kg/day 392 0 0 0-0
Chlorine, Free Available Annual mg/l 378 0 0 0-0
Chlorine, Free Available Annual kg/day 378 0 0 0-0
Mercury, Total (Low Level) Annual ng/l -- -- 11 2.88 4.86 0-5.41
Mercury, Total (Low Level) Annual kg/day -- -- 11 9.54E-05 0.000229 0-0.000266
Lead, Total Recoverable Annual ug/l 9 0 2 0-2
Lead, Total Recoverable Annual kg/day 9 0 0.114 0-0.116
Copper, Total Recoverable Annual ug/l 129 0 29.6 0-87
Copper, Total Recoverable Annual kg/day 129 0 1.82 0-4.15
Mercury, Total Recoverable Annual ug/l 9 0 0.12 0-0.2
Mercury, Total Recoverable Annual kg/day 9 0 0.00731 0-0.0122
Outfall 013
pH, Maximum Annual S.U. 872 7.4 7.8 6.7-10.2
pH, Minimum Annual S.U. 872 7.2 7.5 6.5-9.9

Factsheet for DP&L Stuart Station NPDES Permit Renewal, October 2008 Page 33
Table 7. Effluent Characterization and Decision Criteria: 2002-2006
Summary of analytical results for Outfalls 001, 002, 012, 013, 019, 020, 602, and 609. All values are in :g/l unless otherwise indicated. ND = below detection (detection limit); NA = not analyzed. Decision Criteria: PEQavg = monthly averages; PEQmax = daily maximum analytical results.
Current Permit Limits Percentiles Decision Criteria
Parameter Season Units 30 day Daily # Obs. 50th
95th
Data Range # Obs. PEQave PEQmax
Total Suspended Solids Annual mg/l 30 100 524 5 11.9 1-21
Total Suspended Solids Annual kg/day 2362 7873 524 310 807 23.8-1560
Oil and Grease, Total Annual mg/l 249 0 2 0-7
Oil and Grease, Total Annual kg/day 249 0 118 0-472
Oil and Grease, Hexane Extr Method Annual mg/l 15 20 266 0 0 0-12 Oil and Grease, Hexane Extr Method Annual kg/day 1181 1575 266 0 0 0-1040
Nitrogen, Ammonia (NH3) Summer mg/l -- -- 302 0 1.3 0-2.5
Nitrogen, Ammonia (NH3) Winter mg/l -- -- 338 0 0.117 0-0.3
Nitrogen, Ammonia (NH3) Summer kg/day -- -- 302 0 85.6 0-177
Nitrogen, Ammonia (NH3) Winter kg/day -- -- 338 0 7.24 0-17.7
Selenium, Total Recoverable Annual ug/l -- -- 259 49 111 0-149
Selenium, Total Recoverable Annual kg/day -- -- 259 3.31 7.97 0-11.7
Cadmium, Total (Cd) Annual ug/l 9 2 3.56 0-4
Cadmium, Total (Cd) Annual kg/day 9 0.118 0.21 0-0.236
Zinc, Total Recoverable Annual ug/l -- -- 19 50 84.6 0-90
Zinc, Total Recoverable Annual kg/day -- -- 19 2.18 5.02 0-5.59
Cadmium, Total Recoverable Annual ug/l -- -- 10 2.3 3 0-3
Cadmium, Total Recoverable Annual kg/day -- -- 10 0.136 0.192 0-0.197
Copper, Total Recoverable Annual ug/l -- 53 137 0 50.6 0-70
Copper, Total Recoverable Annual kg/day -- 4.17 137 0 3.1 0-5.04
Chromium, Dissolved Hexavalent Annual ug/l -- 31 263 0 28.9 0-112
Chromium, Dissolved Hexavalent Annual kg/day -- 2.44 263 0 2.12 0-11.2
Flow Rate Summer MGD 838 16.4 23 3.8-23
Flow Rate Winter MGD 820 16.4 20.8 2.1-26.4
Flow Rate Annual MGD -- -- 1658 16.4 20.8 2.1-26.4
Mercury, Total (Low Level) Annual ng/l -- -- 10 2.3 6.01 0.7-7

Page 34 Factsheet for DP&L Stuart Station NPDES Permit Renewal, October 2008
Table 7. Effluent Characterization and Decision Criteria: 2002-2006
Summary of analytical results for Outfalls 001, 002, 012, 013, 019, 020, 602, and 609. All values are in :g/l unless otherwise indicated. ND = below detection (detection limit); NA = not analyzed. Decision Criteria: PEQavg = monthly averages; PEQmax = daily maximum analytical results.
Current Permit Limits Percentiles Decision Criteria
Parameter Season Units 30 day Daily # Obs. 50th
95th
Data Range # Obs. PEQave PEQmax
Mercury, Total (Low Level) Annual kg/day -- -- 10 0.000116 0.000427 0.0000217-0.000435
Acute Toxicity, Ceriodaphnia dubia Annual TUa -- -- 14 0 1.71 0-1.74 Acute Toxicity, Pimephales promelas Annual TUa -- -- 14 0 0.21 0-0.6
pH, Maximum Annual S.U. Not more than 9.0 921 7.4 8.2 6.9-9
pH, Minimum Annual S.U. Not less than 6.5 922 7.3 7.89 6.3-8.5
Lead, Total Recoverable Annual ug/l 9 0 0 0-0
Lead, Total Recoverable Annual kg/day 9 0 0 0-0
Copper, Total Recoverable Annual ug/l 127 0 56.7 0-79
Copper, Total Recoverable Annual kg/day 127 0 4.18 0-6.22
Outfall 019
Total Suspended Solids Annual mg/l 30 100 180 20 44 3.6-67.5
Outfall 020
pH Annual S.U. 112 7.9 8.55 7.2-8.9
Flow Rate Summer MGD 99 0.405 1.08 0.005-1.38
Flow Rate Winter MGD 116 0.405 1.08 0.029-1.4
Flow Rate Annual MGD -- -- 215 0.405 1.08 0.005-1.4
pH, Maximum Annual S.U. Not more than 9.0 111 7.9 8.6 7.2-8.8
pH, Minimum Annual S.U. Not less than 6.5 111 7.9 8.6 7.2-8.8

Factsheet for DP&L Stuart Station NPDES Permit Renewal, October 2008 Page 35
Table 7. Effluent Characterization and Decision Criteria: 2002-2006
Summary of analytical results for Outfalls 001, 002, 012, 013, 019, 020, 602, and 609. All values are in :g/l unless otherwise indicated. ND = below detection (detection limit); NA = not analyzed. Decision Criteria: PEQavg = monthly averages; PEQmax = daily maximum analytical results.
Current Permit Limits Percentiles Decision Criteria
Parameter Season Units 30 day Daily # Obs. 50th
95th
Data Range # Obs. PEQave PEQmax
Outfall 021
Thermal Discharge Annual Million BTU/Hr -- 11000 944 7820 9130 887-9490
Outfall 602
pH Annual S.U. -- -- 54 11.8 12.5 9.7-12.7
Total Suspended Solids Annual mg/l 30 100 18 1 18.5 1-36.7
Oil and Grease, Total Annual mg/l 15 20 15 0 3.16 0-4
Copper, Total (Cu) Annual ug/l 1000 1000 54 0 0 0-0
Iron, Total (Fe) Annual ug/l 1000 1000 54 55 290 0-2090
Flow Rate Summer MGD 11 0.05 0.088 0.014-0.088
Flow Rate Winter MGD 46 0.0595 0.0728 0.01-0.083
Flow Rate Annual MGD -- -- 57 0.059 0.0758 0.01-0.088
Outfall 609
Color, Severity Annual Units -- -- 1436 1 2 1-4
Dissolved Oxygen Summer mg/l -- -- 30 1.4 2.06 0.65-2.2
Dissolved Oxygen Winter mg/l -- -- 31 1.9 4.5 0.2-6.58
pH Annual S.U. 6.5 <= pH <= 9.0 60 7.1 7.31 6.5-7.4
Total Suspended Solids Annual mg/l 30 45 60 2 10.2 0-16
Nitrogen, Ammonia (NH3) Summer mg/l -- -- 29 0 0 0-0.1

Page 36 Factsheet for DP&L Stuart Station NPDES Permit Renewal, October 2008
Table 7. Effluent Characterization and Decision Criteria: 2002-2006
Summary of analytical results for Outfalls 001, 002, 012, 013, 019, 020, 602, and 609. All values are in :g/l unless otherwise indicated. ND = below detection (detection limit); NA = not analyzed. Decision Criteria: PEQavg = monthly averages; PEQmax = daily maximum analytical results.
Current Permit Limits Percentiles Decision Criteria
Parameter Season Units 30 day Daily # Obs. 50th
95th
Data Range # Obs. PEQave PEQmax
Nitrogen, Ammonia (NH3) Winter mg/l -- -- 31 0 1.05 0-2
Odor, Severity Annual Units -- -- 1436 1 1 1-4
Turbidity, Severity Annual Units -- -- 1436 1 2 1-4
Fecal Coliform Annual #/100 ml 1000 2000 28 19.5 137 0-300
Flow Rate Summer MGD 578 0.029 0.0692 0.006-0.131
Flow Rate Winter MGD 559 0.032 0.063 0.004-1.3
Flow Rate Annual MGD -- -- 1137 0.03 0.0662 0.004-1.3
CBOD 5 day Summer mg/l 25 40 29 0 0 0-8
CBOD 5 day Winter mg/l 25 40 30 0 5.55 0-7

Factsheet for DP&L Stuart Station NPDES Permit Renewal, October 2008 Page 37
Table 8. Effluent Data for DP&L Stuart Station
# of # > Average Maximum
Parameter Units Samples MDL PEQ PEQ
Outfall 012
Self-Monitoring Data
Chloride mg/l 5 5 94. 129.
Copper Fg/l 266 33 21. 32.
Lead Fg/l 20 6 1.8 2.5
Mercury Fg/l 7 6 0.006 0.009 TDS mg/l 5 5 777.4 1065.
Chlorine, total res. mg/l 244 0 -- – Chlorine, free available mg/l 531 0 -- --
Zinc Fg/l 20 4 96. 132.
2c Data
Aluminum Fg/l 1 1 2734. 3745.
Barium Fg/l 1 1 382. 523.
Boron Fg/l 1 1 380. 521. Fluoride mg/l 1 1 1.6 2.2
Iron Fg/l 1 1 2562. 3509. Magnesium mg/l 1 1 52. 71.
Manganese Fg/l 1 1 227. 311. NO2+NO3 mg/l 1 1 4.4 6.1
Phenols Fg/l 1 1 149. 205. Sulfate mg/l 1 1 530. 725.
Titanium Fg/l 1 1 105. 144.
Outfall 013
Self-Monitoring Data Ammonia (summer) mg/l 243 37 1.28 1.75
Ammonia (winter) mg/l 203 35 0.08 0.15
Cadmium Fg/l 17 13 3. 4.2
Chromium+6
, diss. Fg/l 265 131 23. 33.
Copper Fg/l 262 64 35. 52.
Mercury Fg/l 6 6 0.007 0.010
Selenium Fg/l 261 257 105. 148.
Zinc Fg/l 18 7 72. 101.

Page 38 Factsheet for DP&L Stuart Station NPDES Permit Renewal, October 2008
Table 8. Effluent Data for DP&L Stuart Station (continued) # of # > Average Maximum
Parameter Units Samples MDL PEQ PEQ
Outfall 013 (continued)
2c Data and Ohio EPA Data
Aluminum Fg/l 3 2 596. 816.
Arsenic Fg/l 3 2 21. 28.
Barium Fg/l 3 1 633. 867. Chloride mg/l 1 1 238. 326.
Fluoride mg/l 1 1 2.1 2.9
Iron Fg/l 3 1 219. 300. Magnesium mg/l 3 3 37. 51.
Manganese Fg/l 3 3 357. 489.
Nickel ug/l 1 1 135. 185. NO2+NO3 mg/l 3 3 3.9 5.3
Phosphorus mg/l 3 1 0.031 0.042
Potassium mg/l 2 2 28. 38. Strontium ug/l 2 2 1667. 2284.
Sulfate mg/l 1 1 815. 1116.
TDS mg/l 2 2 1265. 1733.
Sodium mg/l 2 2 119. 163.
Outfall 001 Self-Monitoring Data
Chlorine, total res. mg/l 149 1 0.03 0.04
2c Data & Supplemental Data
Aluminum Fg/l 1 1 18919. 25916.
Barium Fg/l 13 13 119. 163.
Copper Fg/l 13 1 29.8 40.8. Fluoride mg/l 1 1 0.54 0.74
Iron Fg/l 13 13 8487. 16174. Magnesium mg/l 1 1 49. 67.
Manganese Fg/l 1 1 3195. 4377. Nickel ug/l 13 2 19.3 26.4 NO2+NO3 mg/l 1 1 3.4 5.3
Sulfate mg/l 1 1 225. 308.
Titanium Fg/l 1 1 386. 529.
Zinc Fg/l 13 2 112. 153.

Factsheet for DP&L Stuart Station NPDES Permit Renewal, October 2008 Page 39
Table 8. Effluent Data for DP&L Stuart Station (continued)
# of # > Average Maximum
Parameter Units Samples MDL PEQ PEQ
Outfall 002
Self-Monitoring Data Chlorine, total res. mg/l 135 0 -- --
2c Data & Supplemental Data
Aluminum Fg/l 1 1 23354. 31992.
Barium Fg/l 13 13 115. 158.
Copper Fg/l 13 2 35.4 48.5 Fluoride mg/l 1 1 0.54 0.74
Iron Fg/l 13 13 9823. 13456. Magnesium mg/l 1 1 51. 69.
Manganese Fg/l 1 1 3073. 4210. Nickel ug/l 13 2 20.2 27.7 NO2+NO3 mg/l 1 1 3.9 5.34
Sulfate mg/l 1 1 224. 308.
Titanium Fg/l 1 1 679. 930.
Zinc Fg/l 3 3 370. 5070.
Outfall 020
2c Data & Supplemental Data
Aluminum Fg/l 1 1 4245. 5816.
Barium Fg/l 13 13 154. 211.
Boron Fg/l 13 13 2850. 3904. Chlorine, total res. mg/l 1 1 0.91 1.24
Fluoride mg/l 1 1 2.26 3.10
Iron Fg/l 1 1 5250. 7192. Magnesium mg/l 1 1 163. 223.
Manganese Fg/l 1 1 1602. 2195.
Molybdenum Fg/l 1 1 1059. 1451. Sulfate mg/l 1 1 1421. 1947.
Titanium Fg/l 1 1 128. 176.

Page 40 Factsheet for DP&L Stuart Station NPDES Permit Renewal, October 2008
Table 8. Effluent Data for DP&L Stuart Station (continued) # of # > Average Maximum
Parameter Units Samples MDL PEQ PEQ
Outfall 609
Self-Monitoring Data
Ammonia (summer) mg/l 20 0 -- -- Ammonia (winter) mg/l 15 4 1.2 1.6
2c Data & Supplemental Data
Barium Fg/l 1 1 127. 174.
Boron Fg/l 1 1 665. 911. Fluoride mg/l 1 1 0.91 1.24 Magnesium mg/l 1 1 79. 109.
Manganese Fg/l 1 1 53. 73. NO2+NO3 mg/l 1 1 157. 214.
Phosphorus mg/l 1 1 39. 54.
Sulfate mg/l 1 1 322. 441.
Zinc Fg/l 13 13 243. 333.
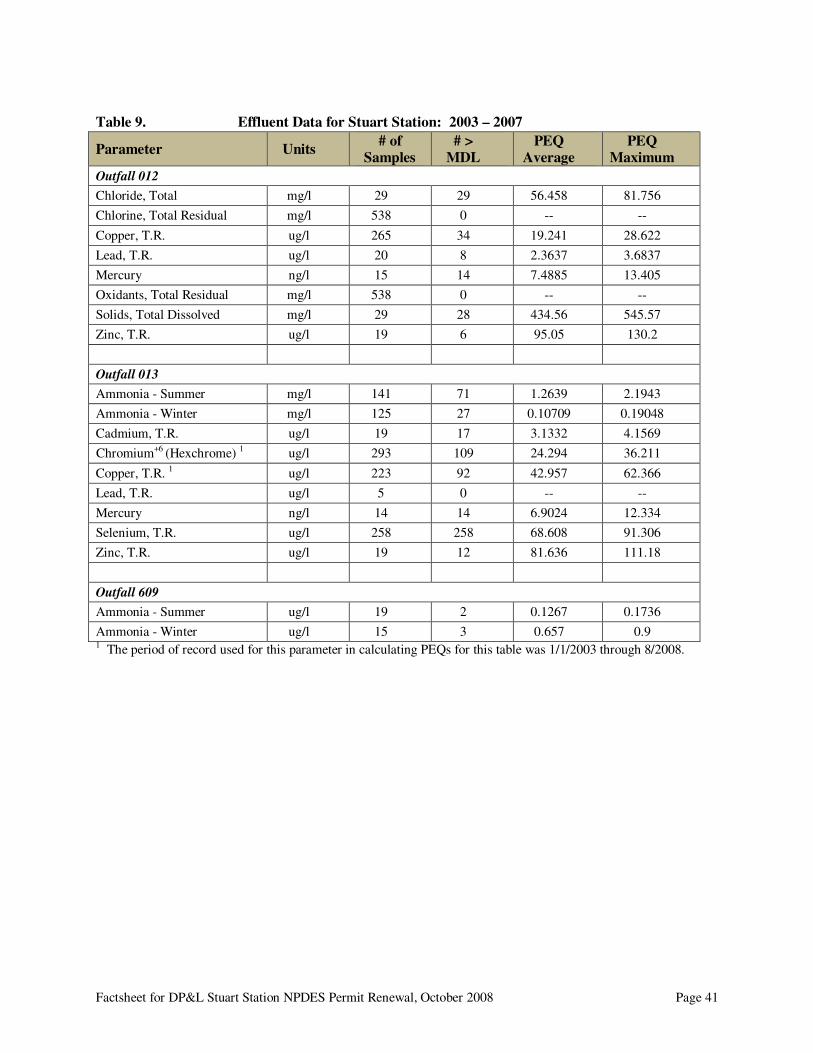
Factsheet for DP&L Stuart Station NPDES Permit Renewal, October 2008 Page 41
Table 9. Effluent Data for Stuart Station: 2003 – 2007
Parameter Units # of
Samples # >
MDL PEQ
Average PEQ
Maximum
Outfall 012
Chloride, Total mg/l 29 29 56.458 81.756
Chlorine, Total Residual mg/l 538 0 -- --
Copper, T.R. ug/l 265 34 19.241 28.622
Lead, T.R. ug/l 20 8 2.3637 3.6837
Mercury ng/l 15 14 7.4885 13.405
Oxidants, Total Residual mg/l 538 0 -- --
Solids, Total Dissolved mg/l 29 28 434.56 545.57
Zinc, T.R. ug/l 19 6 95.05 130.2
Outfall 013
Ammonia - Summer mg/l 141 71 1.2639 2.1943
Ammonia - Winter mg/l 125 27 0.10709 0.19048
Cadmium, T.R. ug/l 19 17 3.1332 4.1569
Chromium+6 (Hexchrome) 1 ug/l 293 109 24.294 36.211
Copper, T.R. 1 ug/l 223 92 42.957 62.366
Lead, T.R. ug/l 5 0 -- --
Mercury ng/l 14 14 6.9024 12.334
Selenium, T.R. ug/l 258 258 68.608 91.306
Zinc, T.R. ug/l 19 12 81.636 111.18
Outfall 609
Ammonia - Summer ug/l 19 2 0.1267 0.1736
Ammonia - Winter ug/l 15 3 0.657 0.9 1 The period of record used for this parameter in calculating PEQs for this table was 1/1/2003 through 8/2008.

Page 42 Factsheet for DP&L Stuart Station NPDES Permit Renewal, October 2008
Table 10. Water Quality Criteria in the Study Area Outside Mixing Zone Criteria Inside Average Maximum Mixing
Human Agri- Aquatic Aquatic Zone
Parameter Units Health culture Life Life Maximum
Ammonia (summer) mg/l – – 1.2 – – Ammonia (winter) mg/l – – 6.6 – –
Arsenic Fg/l 50. 100. 150. 340. 680.
Barium Fg/l -- -- 220. 2000. 4000.
Boron Fg/l -- -- 950. 8500. 17000.
Cadmium Fg/l -- 50. 3.0 6.1 12. Chloride mg/l 250. -- -- -- -- Chlorine, total residual mg/l – – 0.011 0.019 0.038
Chromium+6
, diss. Fg/l – – 11. 16. 31.
Copper A Fg/l 1300. 500. 12. 18. 45.
Copper B Fg/l 1300. 500. 12. 18. 55.
Fluoride mg/l 1.0 2.0 -- -- --
Iron Fg/l – 5000. – – –
Lead Fg/l – 100. 9.1 170. 350.
Molybdenum Fg/l – – 20000. 190000. 370000.
Mercury C Fg/l 0.012 10. 0.91 1.7 3.4
Nickel Fg/l 610. 200. 66. 590. 1200. NO2+NO3 mg/l 10. 100. – – –
Phenols Fg/l 21000. -- 400. 4700. 9400.
Selenium Fg/l 170. 50. 5.0 – –
Strontium Fg/l -- -- 21000. 40000. 81000. Sulfate mg/l 250. – – – –
TDS mg/l -- -- 1500. -- --
Zinc Fg/l 9100. 25000. 150. 150. 300. A Based on instream hardness of 131 mg/l, and effluent hardness of 166 mg/l for outfall 012 B Based on instream hardness of 131 mg/l, and effluent hardness of 204 mg/l for outfall 013
C Bioaccumulative Chemical of Concern (BCC)
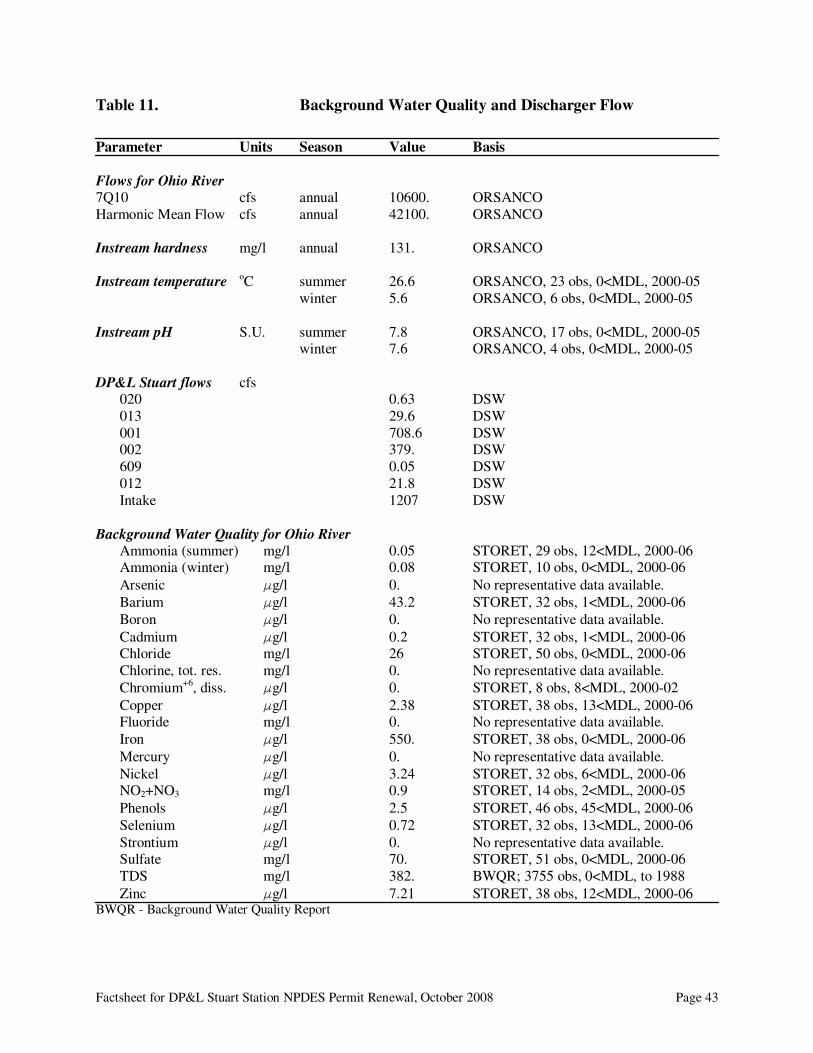
Factsheet for DP&L Stuart Station NPDES Permit Renewal, October 2008 Page 43
Table 11. Background Water Quality and Discharger Flow
Parameter Units Season Value Basis
Flows for Ohio River 7Q10 cfs annual 10600. ORSANCO
Harmonic Mean Flow cfs annual 42100. ORSANCO
Instream hardness mg/l annual 131. ORSANCO
Instream temperature
oC summer 26.6 ORSANCO, 23 obs, 0<MDL, 2000-05
winter 5.6 ORSANCO, 6 obs, 0<MDL, 2000-05
Instream pH S.U. summer 7.8 ORSANCO, 17 obs, 0<MDL, 2000-05 winter 7.6 ORSANCO, 4 obs, 0<MDL, 2000-05
DP&L Stuart flows cfs 020 0.63 DSW
013 29.6 DSW
001 708.6 DSW 002 379. DSW
609 0.05 DSW
012 21.8 DSW
Intake 1207 DSW
Background Water Quality for Ohio River Ammonia (summer) mg/l 0.05 STORET, 29 obs, 12<MDL, 2000-06 Ammonia (winter) mg/l 0.08 STORET, 10 obs, 0<MDL, 2000-06
Arsenic Fg/l 0. No representative data available.
Barium Fg/l 43.2 STORET, 32 obs, 1<MDL, 2000-06
Boron Fg/l 0. No representative data available.
Cadmium Fg/l 0.2 STORET, 32 obs, 1<MDL, 2000-06 Chloride mg/l 26 STORET, 50 obs, 0<MDL, 2000-06
Chlorine, tot. res. mg/l 0. No representative data available.
Chromium+6
, diss. Fg/l 0. STORET, 8 obs, 8<MDL, 2000-02
Copper Fg/l 2.38 STORET, 38 obs, 13<MDL, 2000-06 Fluoride mg/l 0. No representative data available.
Iron Fg/l 550. STORET, 38 obs, 0<MDL, 2000-06
Mercury Fg/l 0. No representative data available.
Nickel Fg/l 3.24 STORET, 32 obs, 6<MDL, 2000-06 NO2+NO3 mg/l 0.9 STORET, 14 obs, 2<MDL, 2000-05
Phenols Fg/l 2.5 STORET, 46 obs, 45<MDL, 2000-06
Selenium Fg/l 0.72 STORET, 32 obs, 13<MDL, 2000-06
Strontium Fg/l 0. No representative data available. Sulfate mg/l 70. STORET, 51 obs, 0<MDL, 2000-06
TDS mg/l 382. BWQR; 3755 obs, 0<MDL, to 1988
Zinc Fg/l 7.21 STORET, 38 obs, 12<MDL, 2000-06 BWQR - Background Water Quality Report

Page 44 Factsheet for DP&L Stuart Station NPDES Permit Renewal, October 2008
Table 12-012. Summary of Effluent Limits to Maintain Applicable
Water Quality Criteria: Outfall 012
------------------- Average ---------------- Maximum Inside Human Agri Aquatic Aquatic Mixing Zone
Parameter Units Health Supply Life Life Maximum
Barium Fg/l -- -- 9020.A 99400.
A 4000.
Boron Fg/l -- -- 92960.A 471000.
A 17000.
Chloride mg/l 23340. -- -- -- --
Copper Fg/l 135100.A 51790.
A 492.
A 797.
A 45.
Fluoride Fg/l 4694. 9388. -- -- --
Iron Fg/l -- 22010. -- -- --
Mercury B
Fg/l 1.2 1041A 46.
A 87.
A 3.4
NO2+NO3 mg/l 44. 466. -- -- --
Phenols Fg/l 5153000.A -- 40110.
A 268400.
A 9400.
Sulfate mg/l 915. -- -- -- --
TDS mg/l -- -- 57280. -- --
Zinc Fg/l 945500.A 2599000.
A 7257.
A 7257.
A 300.
Table 12-013. Summary of Effluent Limits to Maintain Applicable
Water Quality Criteria: Outfall 013 ------------------- Average ---------------- Maximum Inside
Human Agri Aquatic Aquatic Mixing Zone
Parameter Units Health Supply Life Life Maximum Ammonia (summer) mg/l – – 3.5 – --
Ammonia (winter) mg/l – – 19.6 – –
Arsenic Fg/l 7163.A 14330.
A 5525.
A 1565.
A 680.
Barium Fg/l -- -- 6419.A 8861.
A 4000.
Cadmium Fg/l – 7134.A 103.
A 27.
A 12.
Chloride mg/l 23340. -- -- -- --
Chromium+6
, diss. Fg/l – – 405.A 74.
A 31.
Copper Fg/l 135100.A 51790.
A 357.
A 74.
A 55.
Fluoride Fg/l 4694. 9388. -- -- --
Mercury B Fg/l 1.2
1041.
A
34.A 7.8
A 3.4
Nickel Fg/l 4071.A 1322.
A 156. 675. 1200.
NO2+NO3 mg/l 44. 466. -- -- --
Selenium Fg/l 24250. 7060. 158. -- --
Strontium Fg/l -- -- 773027.A 183243.
A 81000.
Sulfate mg/l 915. -- -- -- --
TDS mg/l -- -- 41560. -- --
Zinc Fg/l 945500.A 2599000.
A 5266.
A 664.
A 300.
A Allocation must not exceed the Inside Mixing Zone Maximum. B Bioaccumulative Chemical of Concern (BCC); no mixing zone allowed after 11/15/2010, WQS must be met
at end-of-pipe, unless the requirements for an exception are met as listed in 3745-2-08(L).

Factsheet for DP&L Stuart Station NPDES Permit Renewal, October 2008 Page 45
Table 12-001. Summary of Effluent Limits to Maintain Applicable
Water Quality Criteria: Outfall 001
Average Maximum Inside
Human Agri Aquatic Aquatic Mixing Zone
Parameter Units Health Supply Life Life Maximum
Chlorine, tot. res. Fg/l -- -- 28. 23.
38.
Fluoride Fg/l 4694. 9388. -- -- --
Iron Fg/l -- 22010. -- -- --
Nickel Fg/l 4071.A 1322.
A 156. 675. 1200.
NO2+NO3 mg/l 44. 466. -- -- --
Strontium Fg/l -- -- 52414. 45984. 81000. Sulfate mg/l 915. -- -- -- --
Table 12-002. Summary of Effluent Limits to Maintain Applicable
Water Quality Criteria: Outfall 002
Average Maximum Inside
Human Agri Aquatic Aquatic Mixing Zone Parameter Units Health Supply Life Life Maximum
Fluoride Fg/l 4694. 9388. -- -- --
Iron Fg/l -- 22010. -- -- -- NO2+NO3 mg/l 44. 466. -- -- --
Sulfate mg/l 915. -- -- -- --
Table 12-020. Summary of Effluent Limits to Maintain Applicable
Water Quality Criteria: Outfall 020
Average Maximum Inside
Human Agri Aquatic Aquatic Mixing Zone
Parameter Units Health Supply Life Life Maximum
Barium Fg/l -- -- 6419.A 8861.
A 4000.
Boron Fg/l -- -- 92960.A 471000.
A 17000.
Chlorine, tot. res. Fg/l -- -- 28. 23.
38.
Fluoride Fg/l 4694. 9388. -- -- --
Iron Fg/l – 22010. -- -- -- Sulfate mg/l 915. -- -- -- -- A Allocation must not exceed the Inside Mixing Zone Maximum.

Page 46 Factsheet for DP&L Stuart Station NPDES Permit Renewal, October 2008
Table 12-609. Summary of Effluent Limits to Maintain Applicable
Water Quality Criteria: Outfall 609
Average Maximum Inside
Human Agri Aquatic Aquatic Mixing Zone Parameter Units Health Supply Life Life Maximum
Barium Fg/l -- -- 9020.A 99400.
A 4000.
Boron Fg/l -- -- 92690.A 471000.
A 17000.
Fluoride Fg/l 4694. 9388. -- -- -- NO2+NO3 mg/l 44. 466. -- -- --
Sulfate mg/l 915. -- -- -- --
Zinc Fg/l 945500.A 2599000.
A 7257.
A 7257.
A 300.
A Allocation must not exceed the Inside Mixing Zone Maximum.

Factsheet for DP&L Stuart Station NPDES Permit Renewal, October 2008 Page 47
Table 13-012. Parameter Assessment for Outfall 012
Group 1: Due to a lack of criteria, the following parameters could not be evaluated at this time.
Aluminum Magnesium Manganese
Titanium
Group 2: PEQ < 25% of WQS or all data below minimum detection limit; WLA not required. No limit
recommended, monitoring optional.
No parameters have been placed in this assessment group.
Group 3: PEQmax < 50% of maximum PEL and PEQavg < 50% of average PEL. No limit recommended,
monitoring optional.
Barium Boron Chloride
Fluoride Iron Lead *
Mercury ** NO2+NO3 Phenols
TDS Zinc
Group 4: PEQmax > 50% but <100% of the maximum PEL or PEQavg > 50% but < 100% of the average PEL. Monitoring is appropriate.
Copper (>75%) Mercury *** Sulfate
Group 5: Maximum PEQ > 100% of the maximum PEL or average PEQ > 100% of the average PEL,or either
the average or maximum PEQ is between 75 and 100% of the PEL and certain conditions that increase the risk to the environment are present. Limit recommended.
Limits to Protect Numeric Water Quality Criteria
Applicable Recommended Effluent Limits Parameter Units Period Average Maximum
No parameters fit the criteria of this group.
* Lead becomes a Group 3 parameter based upon using the January 2003 through December 2007 period of record.
** Mercury, which is a bioaccumulative chemical of concern (BCC), has been placed in assessment Group 3 prior to the
phaseout of the use of mixing zones for the development of wasteload allocations for BCCs.
*** Mercury has been placed in assessment Group 4 after the phaseout of the use of mixing zones for the development of
wasteload allocations for BCCs.

Page 48 Factsheet for DP&L Stuart Station NPDES Permit Renewal, October 2008
Table 13-013. Parameter Assessment for Outfall 013
Group 1: Due to a lack of criteria, the following parameters could not be evaluated at this time.
Aluminum Manganese Magnesium
Phosphorus Potassium
Group 2: PEQ < 25% of WQS or all data below minimum detection limit; WLA not required. No limit
recommended, monitoring optional.
Iron Strontium
Group 3: PEQmax < 50% of maximum PEL and PEQavg < 50% of average PEL. No limit recommended, monitoring optional.
Ammonia (summer) Ammonia (winter) Arsenic Barium Cadmium Chloride
Mercury a NO2+NO3 Selenium
b
TDS Zinc
Group 4: PEQmax > 50% but <100% of the maximum PEL or PEQavg > 50% but < 100% of the
average PEL. Monitoring is appropriate.
Fluoride Mercury
c Sulfate (>75%)
Group 5: Maximum PEQ > 100% of the maximum PEL or average PEQ > 100% of the average PEL,or either
the average or maximum PEQ is between 75 and 100% of the PEL and certain conditions that
increase the risk to the environment are present. Limit recommended.
Limits to Protect Numeric Water Quality Criteria
Applicable Recommended Effluent Limits
Parameter Units Period Average Maximum
Chromium+6
, diss. Fg/l annual -- 31.
Copper Fg/l annual -- 55.
Nickel d Fg/l annual 156. 675. a Mercury, which is a bioaccumulative chemical of concern (BCC), has been placed in assessment Group 3 prior to the
phaseout of the use of mixing zones for the development of wasteload allocations for BCCs. b Selenium becomes a Group 3 parameter based upon using the January 2003 through December 2007 period of record. c Mercury has been placed in assessment Group 4 after the phaseout of the use of mixing zones for the development of wasteload allocations for BCCs. d Nickel becomes a Group 5 parameter based upon the loading test [OAC 3745-2-06(B)].

Factsheet for DP&L Stuart Station NPDES Permit Renewal, October 2008 Page 49
Table 13-001. Parameter Assessment for Outfall 001
Group 1: Due to a lack of criteria, the following parameters could not be evaluated at this time.
Aluminum Manganese Magnesium
Titanium
Group 2: PEQ < 25% of WQS or all data below minimum detection limit; WLA not required. No limit
recommended, monitoring optional.
No parameters fit the criteria of this group.
Group 3: PEQmax < 50% of maximum PEL and PEQavg < 50% of average PEL. No limit recommended,
monitoring optional.
Fluoride Iron Nickel
NO2+NO3 Sulfate
Group 4: PEQmax > 50% but <100% of the maximum PEL or PEQavg > 50% but < 100% of the
average PEL. Monitoring is appropriate.
No parameters fit the criteria of this group.
Group 5: Maximum PEQ > 100% of the maximum PEL or average PEQ > 100% of the average PEL,or either the average or maximum PEQ is between 75 and 100% of the PEL and certain conditions that
increase the risk to the environment are present. Limit recommended.
Limits to Protect Numeric Water Quality Criteria
Applicable Recommended Effluent Limits
Parameter Units Period Average Maximum
Chlorine, tot. res. Fg/l annual -- 23.

Page 50 Factsheet for DP&L Stuart Station NPDES Permit Renewal, October 2008
Table 13-002. Parameter Assessment for Outfall 002
Group 1: Due to a lack of criteria, the following parameters could not be evaluated at this time.
Aluminum Manganese Magnesium
Titanium
Group 2: PEQ < 25% of WQS or all data below minimum detection limit; WLA not required. No limit
recommended, monitoring optional.
No parameters fit the criteria of this group.
Group 3: PEQmax < 50% of maximum PEL and PEQavg < 50% of average PEL. No limit recommended,
monitoring optional.
Fluoride Iron NO2+NO3
Sulfate
Group 4: PEQmax > 50% but <100% of the maximum PEL or PEQavg > 50% but < 100% of the
average PEL. Monitoring is appropriate.
No parameters fit the criteria of this group.
Group 5: Maximum PEQ > 100% of the maximum PEL or average PEQ > 100% of the average PEL,or either the average or maximum PEQ is between 75 and 100% of the PEL and certain conditions that
increase the risk to the environment are present. Limit recommended.
No parameters fit the criteria of this group.

Factsheet for DP&L Stuart Station NPDES Permit Renewal, October 2008 Page 51
Table 13-020. Parameter Assessment for Outfall 020
Group 1: Due to a lack of criteria, the following parameters could not be evaluated at this time.
Aluminum Magnesium Manganese
Titanium
Group 2: PEQ < 25% of WQS or all data below minimum detection limit; WLA not required. No limit
recommended, monitoring optional.
Molybdenum
Group 3: PEQmax < 50% of maximum PEL and PEQavg < 50% of average PEL. No limit recommended,
monitoring optional.
Barium Boron Chlorine, tot. res.
Fluoride Iron
Group 4: PEQmax > 50% but <100% of the maximum PEL or PEQavg > 50% but < 100% of the
average PEL. Monitoring is appropriate.
No parameters fit the criteria of this group.
Group 5: Maximum PEQ > 100% of the maximum PEL or average PEQ > 100% of the average PEL,or either the average or maximum PEQ is between 75 and 100% of the PEL and certain conditions that
increase the risk to the environment are present. Limit recommended.
Limits to Protect Numeric Water Quality Criteria
Applicable Recommended Effluent Limits
Parameter Units Period Average Maximum
Sulfate mg/l annual 915. --

Page 52 Factsheet for DP&L Stuart Station NPDES Permit Renewal, October 2008
Table 13-609. Parameter Assessment for Outfall 609
Group 1: Due to a lack of criteria, the following parameters could not be evaluated at this time.
Manganese Magnesium Phosphorus
Group 2: PEQ < 25% of WQS or all data below minimum detection limit; WLA not required. No limit recommended, monitoring optional.
Ammonia (winter)
Group 3: PEQmax < 50% of maximum PEL and PEQavg < 50% of average PEL. No limit recommended,
monitoring optional.
Barium Boron Fluoride
Sulfate
Group 4: PEQmax > 50% but <100% of the maximum PEL or PEQavg > 50% but < 100% of the
average PEL. Monitoring is appropriate.
No parameters fit the criteria of this group.
Group 5: Maximum PEQ > 100% of the maximum PEL or average PEQ > 100% of the average PEL,or either
the average or maximum PEQ is between 75 and 100% of the PEL and certain conditions that increase the risk to the environment are present. Limit recommended.
Limits to Protect Numeric Water Quality Criteria Applicable Recommended Effluent Limits
Parameter Units Period Average Maximum
NO2+NO3 mg/l annual 44. --
Zinc Fg/l annual -- 300.

Factsheet for DP&L Stuart Station NPDES Permit Renewal, October 2008 Page 53
Table 14-001. Final Effluent Limits and Monitoring Requirements for Outfalls 001 and 002
Effluent Limits
Concentration Loading (kg/day)a
30 Day Daily 30 Day Daily
Parameter Units Average Maximum Average Maximum Basisb
Water Temperature EF - - - - - - - - - - - - Monitor - - - - - - - - - - - - - - - Mc / EP
Thermal Discharge MBTU/Hr.d -- -- -- -- M
c /BPJ
pH S.U. - - - - - - - - - - - 6.5 to 9.0 - - - - - - - - - - - - - - - EP/WQS Oxidants, Total Res. mg/l – 0.05 - - EP/BPJ
Flow MGD - - - - - - - - - - - - Monitor - - - - - - - - - - - - - - - Mc
Chlorine, Total Residual mg/l -- 0.2 - - EP/BAT
Chlorination/Bromination Duration minutes – 120 – – EP/BAT
b,c See page 57 for definition of terms and explanation of monitoring requirements. d Million BTU per hour
Table 14-012. Final Effluent Limits and Monitoring Requirements for Outfall 012
Effluent Limits
Concentration Loading (kg/day)a
30 Day Daily 30 Day Daily Parameter Units Average Maximum Average Maximum Basis
b
Residue, Total Diss. mg/l - - - - - - - - - - - - Monitor - - - - - - - - - - - - - - - RP/BPJ Suspended Solids mg/l 25 75 2176 6529 EP/BPJ
Oil and Grease mg/l 10 15 871 1306 EP/BPJ
Sulfate mg/l - - - - - - - - - - - - Monitor - - - - - - - - - - - - - - - RP/WLA
Chloride, Total mg/l - - - - - - - - - - - - Monitor - - - - - - - - - - - - - - - RP/BPJ Hardness mg/l - - - - - - - - - - - - Monitor - - - - - - - - - - - - - - - BPJ
pH S.U. - - - - - - - - - - - 6.5 to 9.0 - - - - - - - - - - - - - - EP/WQS
Copper :g/l - - - - - - - - - - - - Monitor - - - - - - - - - - - - - - - RP Flow rate MGD - - - - - - - - - - - - Monitor - - - - - - - - - - - - - - - M
c /EP
Zinc :g/l - - - - - - - - - - - - Monitor - - - - - - - - - - - - - - - BPJ Oxidants, Total Res. mg/l – 0.01 - - BPJ Chlorine, Total Residual mg/l -- 0.038 - - WQS/BPJ
Mercury ng/l - - - - - - - - - - - - Monitor - - - - - - - - - - - - - - - EP/RP
a Loadings for total suspended solids and oil & grease are based upon a flow rate of 23.0 MGD. b,c See page 57 for definition of terms and explanation of monitoring requirements.

Page 54 Factsheet for DP&L Stuart Station NPDES Permit Renewal, October 2008
Table 14-013. Final Effluent Limits and Monitoring Requirements for Outfall 013
Effluent Limits
Concentration Loading (kg/day)a
30 Day Daily 30 Day Daily
Parameter Units Average Maximum Average Maximum Basisb
Suspended Solids mg/l 30 100 2362 7873 EP/BPT
Oil and Grease mg/l 15 20 1181 1575 EP/BPT Ammonia mg/l - - - - - - - - - - - - Monitor - - - - - - - - - - - - - - - BPJ
Sulfate mg/l - - - - - - - - - - - - Monitor - - - - - - - - - - - - - - - RP
Fluoride mg/l - - - - - - - - - - - - Monitor - - - - - - - - - - - - - - - RP
Selenium :g/l - - - - - - - - - - - - Monitor - - - - - - - - - - - - - - - RP/WLA
Hardness mg/l - - - - - - - - - - - - Monitor - - - - - - - - - - - - - - - BPJ
Nickel :g/l - - - - - - - - - - - - Monitor - - - - - - - - - - - - - - - RP/WLA
Zinc :g/l - - - - - - - - - - - - Monitor - - - - - - - - - - - - - - - RP/WLA
Cadmium :g/l - - - - - - - - - - - - Monitor - - - - - - - - - - - - - - - RP/WLA
Copper :g/l -- 53 -- 3.83 RP/WLA
Chromium+6
:g/l -- 31 -- 2.24 RP/WLA Flow rate MGD - - - - - - - - - - - - Monitor - - - - - - - - - - - - - - - M
c /EP
Mercury ng/l - - - - - - - - - - - - Monitor - - - - - - - - - - - - - - - BPJ Acute Toxicity TUa
Ceriodaphnia dubia -- 1.0 -- -- WET
Fathead minnows -- -- -- -- WET pH S.U. - - - - - - - - - - - 6.5 to 9.0 - - - - - - - - - - - - - - EP/WQS
a Loadings for chromium+6 and copper are based upon a flow rate of 19.1 MGD; loadings for other parameters are based upon a flow rate of 20.8 MGD. b,c See page 57 for definition of terms and explanation of monitoring requirements.
Table 14-019. Final Effluent Limits and Monitoring Requirements for Outfall 019
Effluent Limits Concentration Loading (kg/day)
a
30 Day Daily 30 Day Daily
Parameter Units Average Maximum Average Maximum Basisb
Suspended Solids mg/l 30 100 -- -- EP/BPT
b,c See page 57 for definition of terms and explanation of monitoring requirements.

Factsheet for DP&L Stuart Station NPDES Permit Renewal, October 2008 Page 55
Table 14-020. Final Effluent Limits and Monitoring Requirements for Outfall 020
Effluent Limits
Concentration Loading (kg/day)a
30 Day Daily 30 Day Daily
Parameter Units Average Maximum Average Maximum Basisb
pH S.U. - - - - - - - - - - - 6.0 to 9.0 - - - - - - - - - - - - - - EP/WQS
Sulfate mg/l - - - - - - - - - - - - Monitor - - - - - - - - - - - - - - - RP/WLA Flow rate MGD - - - - - - - - - - - - Monitor - - - - - - - - - - - - - - - M
c /EP
b,c See page 57 for definition of terms and explanation of monitoring requirements.
Table 14-021. Final Effluent Limits and Monitoring Requirements for Outfall 021
Effluent Limits Concentration Loading (kg/day)
a
30 Day Daily 30 Day Daily
Parameter Units Average Maximum Average Maximum Basisb
Thermal Discharge MBTU/Hr.
d -- 11000 -- -- M
c
b,c See page 57 for definition of terms and explanation of monitoring requirements. d Million BTUs per hour
Table 14-602. Final Effluent Limits and Monitoring Requirements for Outfall 602
Effluent Limits Concentration Loading (kg/day)
a
30 Day Daily 30 Day Daily
Parameter Units Average Maximum Average Maximum Basisb
Suspended Solids mg/l 30 100 -- -- EP/BPT
Oil & Grease mg/l 15 20 -- -- EP/BPT
Copper :g/l 1000 1000 -- -- EP/BAT
Iron :g/l 1000 1000 -- -- EP/BAT Flow rate MGD - - - - - - - - - - - - Monitor - - - - - - - - - - - - - - - EP/M
pH S.U. - - - - - - - - - - - - Monitor - - - - - - - - - - - - - - - EP b,c See page 57 for definition of terms and explanation of monitoring requirements.

Page 56 Factsheet for DP&L Stuart Station NPDES Permit Renewal, October 2008
Table 14-603. Final Effluent Limits and Monitoring Requirements for Outfall 603
Effluent Limits
Concentration Loading (kg/day)a
30 Day Daily 30 Day Daily
Parameter Units Average Maximum Average Maximum Basisb
Water Temperature º C - - - - - - - - - - - - Monitor - - - - - - - - - - - - - - - Mc /BPJ
Specific Conductance at 25 ºC Umho - - - - - - - - - - - - Monitor - - - - - - - - - - - - - - - M
c /BPJ
Alkalinity, Total mg/l - - - - - - - - - - - - Monitor - - - - - - - - - - - - - - - Mc /BPJ
Residue, Total Diss. mg/l - - - - - - - - - - - - Monitor - - - - - - - - - - - - - - - Mc /BPJ
Suspended Solids mg/l 30 100 49 163 Mc /BPJ
Chloride, Total mg/l - - - - - - - - - - - - Monitor - - - - - - - - - - - - - - - Mc /BPJ
Sulfate mg/l - - - - - - - - - - - - Monitor - - - - - - - - - - - - - - - Mc /BPJ
Fluoride, Total mg/l - - - - - - - - - - - - Monitor - - - - - - - - - - - - - - - Mc /BPJ
Arsenic, Tot. Rec. :g/l - - - - - - - - - - - - Monitor - - - - - - - - - - - - - - - Mc /BPJ
Iron, Tot. Rec. :g/l - - - - - - - - - - - - Monitor - - - - - - - - - - - - - - - Mc /BPJ
Barium, Tot. Rec. :g/l - - - - - - - - - - - - Monitor - - - - - - - - - - - - - - - Mc /BPJ
Boron, Total :g/l - - - - - - - - - - - - Monitor - - - - - - - - - - - - - - - Mc /BPJ
Manganese, Total :g/l - - - - - - - - - - - - Monitor - - - - - - - - - - - - - - - Mc /BPJ
Zinc, Tot. Rec. :g/l - - - - - - - - - - - - Monitor - - - - - - - - - - - - - - - Mc /BPJ
Cadmium, Tot. Rec. :g/l - - - - - - - - - - - - Monitor - - - - - - - - - - - - - - - Mc /BPJ
Lead, Tot. Rec. :g/l - - - - - - - - - - - - Monitor - - - - - - - - - - - - - - - Mc /BPJ
Chromium, Tot. Rec. :g/l - - - - - - - - - - - - Monitor - - - - - - - - - - - - - - - Mc /BPJ
Copper, Tot. Rec. :g/l - - - - - - - - - - - - Monitor - - - - - - - - - - - - - - - Mc /BPJ
Flow rate MGD - - - - - - - - - - - - Monitor - - - - - - - - - - - - - - - Mc /BPJ
Mercury, Total ng/l - - - - - - - - - - - - Monitor - - - - - - - - - - - - - - - Mc /BPJ
pH S.U. - - - - - - - - 6.0 to 9.0 S.U. - - - - - - - - - - - - - - Mc /BPJ
a Loadings are based upon a flow rate of 0.43 MGD. b,c See page 57 for definition of terms and explanation of monitoring requirements.

Factsheet for DP&L Stuart Station NPDES Permit Renewal, October 2008 Page 57
Table 14-609. Final Effluent Limits and Monitoring Requirements for Outfall 609
Effluent Limits
Concentration Loading (kg/day)a
30 Day Daily 30 Day Daily
Parameter Units Average Maximum Average Maximum Basisb
Color, Severity Units - - - - - - - - - - - - Monitor - - - - - - - - - - - - - - - Mc /EP
Dissolved Oxygen mg/l - - - - - - - - - - - - Monitor - - - - - - - - - - - - - - - Mc /EP
Suspended Solids mg/l 30 45 2.5 3.7 EP/STS
Nitrogen, Ammonia mg/l - - - - - - - - - - - - Monitor - - - - - - - - - - - - - - - Mc /EP
Odor, Severity Units - - - - - - - - - - - - Monitor - - - - - - - - - - - - - - - Mc /EP
Turbidity, Severity Units - - - - - - - - - - - - Monitor - - - - - - - - - - - - - - - Mc /EP
Nitrate+Nitrite mg/l - - - - - - - - - - - - Monitor - - - - - - - - - - - - - - - WLA
Zinc, Tot. Rec. :g/l -- 300 -- 0.025 WLA Fecal Coliform #/100 ml
Summer 1000 2000 -- -- EP/WQS Flow rate MGD - - - - - - - - - - - - Monitor - - - - - - - - - - - - - - - M
c /EP
CBOD5 mg/l 25 40 2.1 3.3 EP/STS
pH S.U. - - - - - - - - 6.5 to 9.0 S.U. - - - - - - - - - - - - - - EP/WQS a Loadings are based upon a flow rate of 0.022 MGD. b,c See below for definition of terms and explanation of monitoring requirements. b Definitions: ABS = Antibacksliding Rule (OAC 3745-33-05(E) and 40 CFR Part 122.44(l));
AD = Antidegradation (OAC 3745-1-05);
BPJ = Best Professional Judgment; EP = Existing Permit for the DP&L Stuart Station;
FEG-BAT = Best Available Control Technology Currently Available, 40 CFR Part
423.13(e); FEG-BPT = Best Practicable Waste Treatment Technology, 40 CFR Part 423.12(b)(3)
and (b)(4);
M = Division of Surface Water Guidance #2, “National Pollutant Discharge
Elimination System: Determination of Sampling Frequency Formula for Industrial Waste Discharges” recommends monitoring for this parameter;
PD = Plant Design Criteria;
RP = Reasonable Potential Procedures (OAC 3745-33-07); STS = Secondary Treatment Standards, 40 CFR Part 133;
316(a) = Water Quality Variance demonstration
WET = Whole Effluent Toxicity (OAC 3745-33-07(B)) ; WLA = Wasteload Allocation procedures (OAC 3745-2);
WLA/IMZM = Wasteload Allocation limited by Inside Mixing Zone Maximum;
WQS = Ohio Water Quality Standards (OAC 3745-1).
c Monitoring of flow and other indicator parameters is specified to assist in the evaluation of effluent
quality and treatment plant performance.

Page 58 Factsheet for DP&L Stuart Station NPDES Pemrit Renewal, October 2008
Attachment A. Federal Effluent Guidelines Applicable to the DP&L Stuart Station
40 CFR 423.12(b)(3) Steam Electric Power Generating Point Source Category Best Practicable Control Technology Available (BPT)
for Low Volume Wastes
------------------- (mg/l) ------------------------
Parameter Daily Maximum 30-Day Average
Total Suspended Solids 100.0 30.0
Oil & Grease 20.0 15.0
40 CFR 423.12(b)(4) Steam Electric Power Generating Point Source Category Best Practicable Control Technology Available (BPT)
for Fly Ash and Bottom Ash Transport Water
------------------- (mg/l) ------------------------
Parameter Daily Maximum 30-Day Average
Total Suspended Solids 100.0 30.0 Oil & Grease 20.0 15.0
40 CFR 423.12(b)(4) Steam Electric Power Generating Point Source Category Best Practicable Control Technology Available (BPT) for Metal-Cleaning Wastes
------------------- (mg/l) ------------------------
Parameter Daily Maximum 30-Day Average Total Suspended Solids 100.0 30.0
Oil & Grease 20.0 15.0
Copper, total 1.0 1.0 Iron, total 1.0 1.0
40 CFR 423.12(b)(4) Steam Electric Power Generating Point Source Category Best Practicable Control Technology Available (BPT)
for Coal Pile Run-off
------------------- (mg/l) ------------------------
Parameter Daily Maximum 30-Day Average Total Suspended Solids 50.0 ---

Factsheet for DP&L Stuart Station NPDES Permit Renewal, October 2008 Page 59
Attachment A. Federal Effluent Guidelines Applicable to the DP&L Stuart Station
(continued)
40 CFR 423.13(b) Steam Electric Power Generating Point Source Category Best Available Technology Economically Achievable (BAT)
------------------- (mg/l) ------------------------
Parameter Daily Maximum 30-Day Average
Total Residual Chlorine 0.20 --