Embed Size (px)
Citation preview

July 29th, 2016FACTSHEET
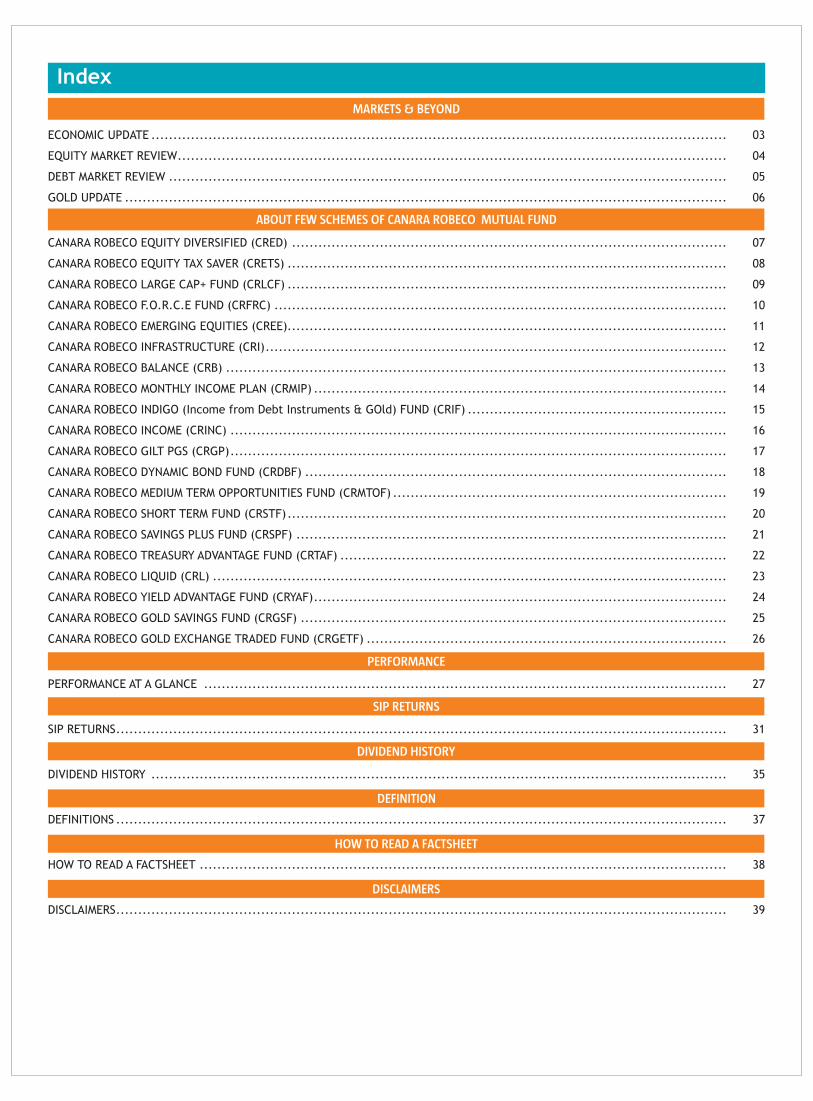
Index
ECONOMIC UPDATE ................................................................................................................................... 03
EQUITY MARKET REVIEW............................................................................................................................. 04
DEBT MARKET REVIEW ............................................................................................................................... 05
GOLD UPDATE ......................................................................................................................................... 06
CANARA ROBECO EQUITY DIVERSIFIED (CRED) ................................................................................................... 07
CANARA ROBECO EQUITY TAX SAVER (CRETS) .................................................................................................... 08
CANARA ROBECO LARGE CAP+ FUND (CRLCF) .................................................................................................... 09
CANARA ROBECO F.O.R.C.E FUND (CRFRC) ....................................................................................................... 10
CANARA ROBECO EMERGING EQUITIES (CREE).................................................................................................... 11
CANARA ROBECO INFRASTRUCTURE (CRI)......................................................................................................... 12
CANARA ROBECO BALANCE (CRB) .................................................................................................................. 13
CANARA ROBECO MONTHLY INCOME PLAN (CRMIP) .............................................................................................. 14
CANARA ROBECO INDIGO (Income from Debt Instruments & GOld) FUND (CRIF) ........................................................... 15
CANARA ROBECO INCOME (CRINC) ................................................................................................................. 16
CANARA ROBECO GILT PGS (CRGP)................................................................................................................. 17
CANARA ROBECO DYNAMIC BOND FUND (CRDBF) ................................................................................................ 18
CANARA ROBECO MEDIUM TERM OPPORTUNITIES FUND (CRMTOF) ............................................................................ 19
CANARA ROBECO SHORT TERM FUND (CRSTF).................................................................................................... 20
CANARA ROBECO SAVINGS PLUS FUND (CRSPF) .................................................................................................. 21
CANARA ROBECO TREASURY ADVANTAGE FUND (CRTAF) ........................................................................................ 22
CANARA ROBECO LIQUID (CRL) ..................................................................................................................... 23
CANARA ROBECO YIELD ADVANTAGE FUND (CRYAF).............................................................................................. 24
CANARA ROBECO GOLD SAVINGS FUND (CRGSF) ................................................................................................. 25
CANARA ROBECO GOLD EXCHANGE TRADED FUND (CRGETF) .................................................................................. 26
PERFORMANCE AT A GLANCE ....................................................................................................................... 27
SIP RETURNS........................................................................................................................................... 31
DIVIDEND HISTORY ................................................................................................................................... 35
DEFINITIONS ........................................................................................................................................... 37
HOW TO READ A FACTSHEET ........................................................................................................................ 38
DISCLAIMERS........................................................................................................................................... 39
ABOUT FEW SCHEMES OF CANARA ROBECO MUTUAL FUND
PERFORMANCE
DIVIDEND HISTORY
DEFINITION
MARKETS & BEYOND
SIP RETURNS
HOW TO READ A FACTSHEET
DISCLAIMERS

Economic Update
In the month of July'16, global events drove domestic markets. While the world was still recovering from Brexit, US jobs data positively surprised the market participants. During the month, the Indian equity markets were lifted by positive global cues from the European markets, and were also supported by a strong rupee and falling crude oil prices. Domestically, WPI continued its inflationary trend while there was a marginal uptick in CPI while IIP showed sharp rebound. The markets sentiments were further boosted by abundant rainfall over the Indian Subcontinent, and the decision of the Union Cabinet to make key changes to the GST Constitutional Amendment Bill so as to enable the passage through the Parliament.
The benchmark indices, Nifty 50 and S&P BSE Sensex rose by 4.23% & 3.90% respectively despite interim volatility seen post United Kingdom's exit from EU. Better than expected Q1FY17 Corporate Earnings reported by Indian companies were instrumental in improving the sentiments of the market participants. The Q1FY17 corporate earnings result season has begun and so far the results are in line with and in some companies exceeded our expectations. We believe that the earnings are likely to remain static for Corporate India in the near term & pick –up is expected in the FY18.
Industrial production grew by 1.2% in May'16 as against a dismal growth of -1.3% seen in Apr'16 after seeing a contraction in the previous month, mainly due to uptick in consumer durables output. On the sectoral side, Mining rose by 1.3%, Manufacturing by 0.7% and Electricity by 4.7%. On the use-based front, Basic goods registered annual growth of 3.9%, Intermediate goods of 3.6% and Consumer goods of 1.1%. Only Capital goods disappointed coming in at -12.4%.
India's consumer price inflation (CPI) surged to 22 month high of 5.77% in Jun'16 after surging to 22-month while industrial output grew at a measly 1.2%, dashing hopes of RBI cutting rates in the August'16 policy review. India Wholesale inflation, as measured by the wholesale price index (WPI), rose to 1.62% in Jun'16 from 0.79% in May'16.
India's current account deficit (CAD) narrowed sharply to $0.3 Billion, or 0.1% of GDP, in the fourth quarter of 2015-16 from $7.1 Billion, or 1.3%, in third quarter, on account of lower trade gap. Exports grew 1.27% in June to $22.6 billion while imports continued to contract for the 19th month in a row, down 7.3% to $30.7 billion. In the Q1FY17 (April-June) of the fiscal year, India's exports contracted 2.1% to $65.3 billion while its imports dropped 14.5% to $84.5 billion, leaving a trade deficit of $19.2 billion.
=On domestic front, market participants are expected to keenly track the announcements of corporate earnings.
=Another key event to watch out will be the stance of the US Fed in the coming months, which might govern the direction of FII flows to India.
=The decision of the Union Cabinet to make key changes to the GST Constitutional Amendment Bill has brought about fresh hopes of the clearance of the Bill in the monsoon session of the parliament. The event of this happening might have a cascading effect on the Indian Economy.
=The turmoil in Europe is likely to have impact on commodities and currency. The movement in both these parameters is likely to be followed by market participants
=Progress of monsoon and its impact on inflation would be key element tracked by RBI to decide on the interest rate trajectory.
=The selection of the new RBI governor will be keenly watched by the market participants. Looking at the way how effectively the current governor has handled the issues of inflation and liquidity in his tenure, the decision of selecting the next governor may be observed from the financial and sentimental perspective. The early formation of the Monetary Policy Committee (MPC) is likely positive for investor confidence
Source:
# Department of Commerce^ mospi.nic.in^^ ICRA* Bloomberg
Market Performance*:
IIP^:
Inflation^^:
Current Account Deficit narrowed; Exports grow#:
Triggers:
3
(as on July 29,2016)

Equity Market Review
Mr. Ravi Gopalakrishnan
Head - Equities
The month of July'16 saw positive sentiments favouring Indian equity markets. On global footing, strong US job data and improved economic performance suggested a possibility of rate hike in 2016. The increased expectations of further stimulus in Japan and ~15% drop in crude oil prices also served as positive cues for the equity market. Domestically, the good progress in monsoon, better-than-expected corporate earnings, robust FPI inflows and Union Cabinet's approval to key changes to the GST Constitutional Amendment Bill resulted in positive momentum in the market.
The benchmark indices s viz. S&P BSE Sensex & Nifty 50 gained 3.9% and 4.23% respectively in last day of June'16. The month even saw S&P BSE Mid-cap index & S&P BSE Small-cap index rising by 8.06%% & 4.31% respectively.
The rally was seen across major sectors; except IT and Media. The top gainers were S&P BSE India Metal, S&P BSE India Oil & Gas and S&P BSE India Auto.
India's industrial production showed a sharp rebound in the month of May'16, registering a growth of 1.2% against negative 0.84% growth in April'16. On sectoral side, growth was driven by electricity which clocked in a growth of 4.7%, while manufacturing and mining grew by 0.7% and 1.3% respectively. On used based classification Basic goods and Intermediate goods registered a growth of 3.9% and 3.6% respectively while capital goods registered a growth of -12.4% during May'16. The Consumer durable and Consumer non-durables recorded growth of 6% and -2.2% respectively, with overall growth in consumer goods being 1.1%.
India's manufacturing sector represented by Nikkei India Manufacturing PMI recorded a print of 51.7 in June'16 against 50.7 in May'16, signifying an overall improvement in the sector. The growth in order book and improvement in output were the factors that led to the upward movement in the PMI.
Nikkei India Services Business Activity Index which tracks changes in activity at service companies on a monthly basis fell marginally to 50.3 in Jun'16 from previous month's 51.0. The dip in service PMI indicates a slower pace of expansion. However a fractional increase in employment was seen in month of June'16. The decline in Services sector for third consecutive month raises concern about sustainability of the economic upturn.
The month saw FPIs (Foreign Portfolio Investors) increasing exposure to the tune of ~Rs. 9130* crs. On the other hand, mutual funds reduced their equity exposure to the tune of ~Rs.293 crs.
Equity markets continue to track the developments of global markets. The data flow from US economy might give some indication regarding Fed's decision on rate hike and intermittent impact on FPI flows. Brexit could be another factor that might have a deferred impact on the direction of global equity markets. Further, the risk of an economic slowdown in China & the possibility of it devaluing its currency can add to the volatility. The fall in crude oil prices is a positive for India; however any further fall might have an adverse effect.
On domestic front, the progress of monsoon is positive which might help in improving the rural demand. This coupled with implementation of 7th Pay Commission would likely benefit the consumer discretionary demand. The ongoing discussions on GST have buoyed expectations of the bill getting cleared in the current session of the parliament.
The Q1FY17 earnings season so far has been positive and we expect acceleration in earnings from FY18. We believe that when the earnings cycle starts to revive, P/E multiples should expand and hence there is significant upside left in the markets.
Long term investors should take advantage of any volatility and use it as an opportunity to add to the equity exposure as India remains one of the very few economies which have a stable currency and healthy economic growth potential. Any positive trigger in the global economy would lead to a sharp run up in Indian equities.
Source:
^MOSPI$ Markit Economics*ICRA MFI Explorer
Market Performance*
IIP^
$Growth
FPI Inflows*
Outlook
4
(as on July 29,2016)

Debt Market Review
On the back of global risk-on and falling yields, the month of July'16 witnessed India's 10-year bond yield nearing 2013 lows. The key factors that attributed to the rally in bond market were the domestic liquidity turning to positive from neutral and sharp decline in global yields including US treasury yields after the UK's decision to leave the European Union did not negatively impact the market sentiment as was expected. Since the Brexit vote, Indian 10 year g-sec yields have fallen 31 basis points. While the investors chose safer havens as an immediate reaction of the event, they returned to emerging market realising that the impact would take some time, especially India. This can be seen by positive FII flows in the Indian debt markets. Also, the aggressive open market operations (OMO) by RBI and restrained primary supply of G-Secs contributed to the moderation in yields. Towards the end of the month, the 10 year benchmark yield softened a meaningful 28 bps to 7.17% as against the last month's close of 7.45%. The fiscal deficit for the 1st three months constituted 61.1% of the budget estimates for FY2017 and stood at Rs 3.26 lakh cr, compared to 51.6% in the corresponding period of FY2016.The rupee strengthened against the USD, settling at 66.9950 in July'16 as against 67.5250 in June'16.
CPI inflation for the month of June'16 increased marginally at 5.77% as against 5.76% in the month of May'16. The increase in prices of food articles and increase in prices of manufactured products has been the primary contributor to the elevated CPI inflation. WPI based inflation for June'16 continued to increase at 1.62% y-o-y compared with 0.79% for the previous month. Rise in prices of manufactured products including the food item also added significantly to the overall rise in WPI inflation. However, more than abundant monsoon covering majority of the country augurs well towards tempering of inflation going into 3QFY17.
Slump in oil prices, uncertainty over Japan's stimulus package and status quo maintained by US Fed kept market on the edge. In lieu of current economic condition prevalent in Japan, the government is expected to focus more on fiscal policy and structural overhauls in trying to defeat deflation. The overall increase in global crude output has dragged the global oil prices down by ~15% to $42.46/barrel by the end of July'16 from $49.68/barrel at the end of June'16. The US Fed kept its benchmark rate unchanged in it s latest FOMC meeting maintaining it in the range of 0.25% - 0.50%. US Fed however acknowledged the improved macros and job data, indicating a rate hike possibility in near future. However, a large section of market participants expect US FED to remain on hold for rest of 2016, though there is a probability of rate hike in Dec'16
Due to the uncertainties witnessed across the economies and domestic volatility, RBI kept the interest rate unchanged during its last bi-monthly policy and it's the stance on monetary policy still remains accommodative. The recent rise in CPI inflation may prevent RBI for any cut in August policy as well, though expected drop in inflation by end of 2016 is likely to open room for further rate cuts.
The macroeconomic and financial developments and the progress of monsoon and its impact on inflation would be the key element which RBI would monitor to decide on reducing the interest rate and there could be a possibility of rate cut in 2nd half of FY2017. Also, the appointment of the new governor would be crucial event in the trajectory of interest rate.
With the liquidity targeting framework of RBI, to bring systemic liquidity to “neutral” seems to pan out well; it could translate into the transmission of rates by banks and would impact positively to the bond markets.
In the dynamic global environment with dovish commentary from US Fed and other central banks and EU event, India remains relatively resilient. The macroeconomic stability and gradual pick-up in growth may help FPI Inflow in the Indian debt market.
While further policy rate cuts are likely limited, better transmission and liquidity stance, might lead to lowering of rates in medium term period. In short term, markets are expected to remain volatile due to global headwinds. We expect 10Y G-Sec to remain in the range of 7.10-7.30% range in the near term.
Source: ~ MOSPI
Food prices, the key driver for Inflation ~:
Event impacting the economies around the globe:
Outlook:
Mr. Avnish JainHead - Fixed Income
5
(as on July 29,2016)

Gold Update
Overview:
Outlook:
Gold prices resumed its positive momentum into July 2016 as it rose for the second consecutive month in a row to close at $1351 per troy ounce, up 2.2% on a month-on-month basis. The markets remained in the risk off mode as the surprising Brexit vote helped support the yellow metal prices throughout the month. The US Dollar Index however dipped by 0.6% during the month to 95.53. Better economic data from US led to gold prices moving lower from its intra month high of $1370 levels. Gold prices in domestic currency terms underperformed the dollar price of gold as rupee appreciated by 0.8% to close at 67.0 against the US Dollar. The gold prices in rupee terms closed at 30939 per 10 grams, up 1.31% with the discounts on gold prices improving from around 5% at the end of June 2016 to less than 4% by July 2016.
The Labor market in the US painted a positive picture with non-farm payrolls rising by 287,000 in June 2016 much ahead of expectations of 170,000. The improvement in the Labor Participation Rate overshadowed the rise in unemployment rate as investors factored in a higher probability of at least one US rate hike in 2016. The higher than expected inflation reading during the month also complimented the positive sentiment on the US economic recovery. However, gold prices found renewed support on the back of weaker than expected US second-quarter GDP data released towards the end of the month. The second quarter US GDP disappointed as it rose by only 1.2% against expectations of a 2.5% gain.
The July 2016 FOMC (Federal Open Market Committee) meeting saw the Federal Reserve refrain from hiking the federal funds rate. The decision was unanimous with only one committee member dissenting. While the language in the statement was largely upbeat about the economy, the committee stated its concerns on the lack of inflation and fears about weak corporate spending and kept the doors for a September rate hike open. International issues such as Brexit were an important factor in both June and July FOMC meetings. The BOJ expanded stimulus at the July 28-29 meeting by doubling purchases of exchange-traded funds (ETF), yielding to pressure from the government and market for bolder action, but the move fell short of market expectations.
After the verdict of the Brexit referendum, the market had factored in a lower probability of a Fed rate hike this year. However, the recent spate of positive economic data releases in the United States has led to market participants turning slightly more optimistic of the rate hike chances in 2016. While the odds for a rate hike in September 2016 were zero at the start of the month, the probability for a rate hike in September 2016 improved to 18% by the end of July 2016. Gold prices are expected to be driven by the rate hike expectations in the coming months with a rising probability leading to a negative impact on gold prices.
The recent Brexit verdict has unfolded the contagion risk within the European region which could go out of control and creates a strong case for flight to safety in to US treasuries and Gold. Globally, total gold ETF (exchange-traded fund) holdings are estimated to have crossed 2,000 tonnes as of the end of July, the highest level since July 2013. The UK referendum outcome has significantly changed the near-term outlook for Europe and Gold. It could turn out to be the turning point for Gold prices as it opens up a period of high economic and political uncertainty, the solution for which is both complicated and time consuming.
What complicates the conditions further is the rise in the popularity of anti-euro political representations across the region as can be seen from the recent poll results in most regions. While Italy and Hungary have referendums on certain internal issues lined up in October 2016; France & Netherlands select their leaders before April 2017. The uncertainty around the election of the US President is also favouring Gold prices at the moment as it is an evenly divided contest. The yellow metal places itself as a key diversifier amidst the political uncertainty and resulting economic crisis. Lower interest rates as a popular economic policy comes as a corollary to such uncertainty which has been seen from the recent past. While many economies are operating at ZIRP (Zero Interest Rate Policy), Japan & some parts of Europe in fact, are operating at NIRP (Negative Interest Rate Policy) with the objective of stimulating growth and inflation within their respective regions.
Gold's role as an inflation hedge is well documented globally and domestically (Refer to Chart of the Month). Thus, Gold seems to be in a sweet spot where uncertainty (both political and economic) triggers the initial rush towards safer assets and inflation arising on account of loose monetary policies will help sustain higher prices over the long term. However, gold prices are expected to remain volatile as market participants track the changing probability of an interest rate hike in US. Any drop in prices is expected to be temporary and can be seen as an attractive entry point for a long term allocation to the asset class.
Source: Bloomberg.
Chart of the Month:
'AU'some Fact of the Month:
Almost 40% of all the gold ever mined in history came from South Africa over just the last 130 years. It still holds the world's 3rd largest unmined reserves, behind Australia and Russia.
(Source: www.visualcapitalist.com)
6
(as on July 29,2016)
Source: Bloomberg
Annual Retu
rns
(%)

$Source ICRA MFI Explorer (for remaining disclaimer Please refer page no. 39) = # Monthend AUM as on 29.07.2016 = ^The expense ratios mentioned for the schemes excludes additional service tax on investment management fees.= for disclaimers. Please refer page no. 39
PRODUCT POSITIONING
Canara Robeco Equity Diversified follows a predominantly bottom-up investment approach with a focus on fundamentally sound companies which are likely to deliver superior capital appreciation over the long-term. The fund has a predominant focus on large caps with select high conviction mid cap ideas. The fund provides a blend of 'Growth' and 'Value' style of investing.
INVESTMENT STYLE
Growth Value Blend
Large Cap Mid Cap Small Cap
Diversified Thematic Sector
PORTFOLIO
Name of the Instruments % to NAV
Equities 98.41Listed 98.30Banks 22.62HDFC Bank Ltd 7.38Yes Bank Ltd 3.43ICICI Bank Ltd 2.86IndusInd Bank Ltd 2.85State Bank of India 2.59Bank of Baroda 1.29Lakshmi Vilas Bank Ltd 1.17Axis Bank Ltd 1.05
Petroleum Products 9.24Hindustan Petroleum Corporation Ltd 3.20Reliance Industries Ltd 3.14Indian Oil Corporation Ltd 1.79Castrol India Ltd 1.11
Finance 8.25Bajaj Finserv Ltd 1.85Max Financial Services Ltd 1.56Cholamandalam Investment & Finance Co Ltd 1.41Ujjivan Financial Services Ltd 1.21Capital First Ltd 1.21Bharat Financial Inclusion Ltd 1.01
Auto 7.97Tata Motors Ltd 2.40Maruti Suzuki India Ltd 1.54Mahindra & Mahindra Ltd 1.48Escorts Ltd 1.27Eicher Motors Ltd 1.07Hero MotoCorp Ltd 0.21
Pharmaceuticals 6.52Sun Pharmaceutical Industries Ltd 3.79Divi’s Laboratories Ltd 1.12Strides Shasun Ltd 0.84Aurobindo Pharma Ltd 0.77
Cement 5.92Ultratech Cement Ltd 3.48The Ramco Cements Ltd 1.42Dalmia Bharat Ltd 1.02
Software 5.67Infosys Ltd 4.45HCL Technologies Ltd 0.79Take Solutions Ltd 0.43
Industrial Capital Goods 4.52Bharat Electronics Ltd 1.10Honeywell Automation India Ltd 1.05Texmaco Rail & Engineering Ltd 1.03Praj Industries Ltd 0.93Sanghvi Movers Ltd 0.41
Auto Ancillaries 4.10WABCO India Ltd 1.64Bosch Ltd 1.39Motherson Sumi Systems Ltd 1.07
Consumer Non Durables 3.75Emami Ltd 1.47Britannia Industries Ltd 1.23Asian Paints Ltd 1.05
Construction Project 3.74Larsen & Toubro Ltd 1.01KEC International Ltd 0.94Ashoka Buildcon Ltd 0.90Engineers India Ltd 0.89
Chemicals 3.69Atul Ltd 1.41Solar Industries India Ltd 1.17Pidilite Industries Ltd 0.60Gujarat Fluorochemicals Ltd 0.51
Transportation 3.43Blue Dart Express Ltd 1.57Transport Corporation of India Ltd 1.09Gateway Distriparks Ltd 0.77
Industrial Products 2.06Timken India Ltd 1.14Bharat Forge Ltd 0.92
Construction 1.99Kajaria Ceramics Ltd 1.02PNC Infratech Ltd 0.97
Engineering Services 1.57VA Tech Wabag Ltd 1.57
Gas 1.24Indraprastha Gas Ltd 1.24
Media & Entertainment 1.02Zee Entertainment Enterprises Ltd 1.02
Textile Products 1.00K.P.R. Mill Ltd 1.00
Unlisted 0.11Ferrous Metals 0.11Kudremukh Iron Ore Co Ltd 0.11
Money Market Instruments 0.63CBLO 0.63
Net Current Assets 0.96
Grand Total ( Net Asset) 100.00
CANARA ROBECO EQUITY DIVERSIFIED (CRED)
lCapital appreciation over long term
lInvestment predominantly in equity and equity related securities
This product is suitable for investors who are seeking*:
*Investors should consult their financial advisers if in doubt whether the product is suitable for them
7
Investors understand that their principalwill be at Moderately High Risk
$QUANTITATIVE INFORMATION
Standard Deviation 17.75
Portfolio Beta 1.03
Portfolio Turnover Ratio 0.87 times
R-Squared 0.93
Sharpe Ratio 0.59
FUND INFORMATION
CATEGORY: Open Ended Equity Scheme
SCHEME OBJECTIVE: To generate capital appreciation by investing in equity and equity related securities. However, there can be no assurance that the investment objective of the scheme will be realized.
NAV: (as on July 29, 2016)Direct Plan - Dividend Option ` 42.64Regular Plan - Dividend Option ` 33.20Direct Plan - Growth Option ` 98.59Regular Plan - Growth Option ` 96.75
DATE OF ALLOTMENT: September 16, 2003
ASSET ALLOCATION:
Equity and equity related instruments: 85% -100%.
Money Market instruments : 0% - 15%
MINIMUM INVESTMENT:
Lumpsum: ̀ 5000 in multiples of ̀ 1 thereafter
Subsequent purchases: Minimum amount of ` 1,000 and multiples of ̀ 1 thereafter.
SIP/STP/SWP: For monthly frequency - ` 1000 and in multiples of ̀ 1 thereafter
For quarterly frequency - ̀ 2000 and in multiples of ̀ 1 thereafter
PLANS / OPTIONS :
Regular Plan- Growth Option Regular Plan- Dividend Reinvestment Option/ Payout Option
Direct Plan- Growth OptionDirect Plan- Dividend Reinvestment Option/ Payout Option
ENTRY LOAD: Nil
EXPENSE RATIO^:
Regular Plan : 2.37%
Direct Plan : 1.78%
BENCHMARK: S&P BSE 200
FUND MANAGER: 1) Mr. Ravi Gopalakrishnan2) Mr. Shridatta Bhandwaldar
TOTAL EXPERIENCE: 1) 23 Years2) 10 Years
MANAGING THIS FUND: 1) Since 16-Sep-122) Since 5-July-16
#Monthend AUM : 774.00 Crores
Monthly AVG AUM : ` 753.75 Crores
EXIT LOAD:
1% - If redeemed/switched out within 1 year from the date of allotment, Nil - if redeemed/switched out after 1 year from the date of allotment.
`
(as on July 29,2016)
RISKOMETER

$ (for remaining disclaimer Please refer page no. 39) Monthend AUM as on 29.07.2016 = ^The expense ratios mentioned for the schemes excludes additional service tax on investment management fees.
=Please refer page no. 39 for disclaimers.
Source ICRA MFI Explorer = #
CANARA ROBECO EQUITY TAX SAVER (CRETS)
PRODUCT POSITIONING
Canara Robeco Equity Tax Saver is an ELSS with a 3
year lock-in period providing Tax Benefits under Sec
80 C of Income Tax Act. The fund benefits from long
term investing due to its lock-in. The portfolio
consists of both large and mid cap stocks with a
'Growth' style of investing.
PORTFOLIO
Name of the Instruments % to NAV
Equities 95.73Listed 95.73Banks 20.71HDFC Bank Ltd 8.02IndusInd Bank Ltd 4.04Kotak Mahindra Bank Ltd 2.17ICICI Bank Ltd 2.16State Bank of India 1.85Axis Bank Ltd 1.11Yes Bank Ltd 0.87Bank of Baroda 0.49
Petroleum Products 9.95Hindustan Petroleum Corporation Ltd 3.79Reliance Industries Ltd 2.62Indian Oil Corporation Ltd 2.39Castrol India Ltd 1.15
Consumer Non Durables 8.80Glaxosmithkline Consumer Healthcare Ltd 2.79Britannia Industries Ltd 2.62Parag Milk Foods Ltd 1.04Marico Ltd 0.85Emami Ltd 0.73CCL Products (India) Ltd 0.40Dabur India Ltd 0.37
Software 8.21Infosys Ltd 6.33Oracle Financial Services Software Ltd 1.88
Pharmaceuticals 7.99Divi’s Laboratories Ltd 2.12Sun Pharmaceutical Industries Ltd 2.12Aurobindo Pharma Ltd 1.97Strides Shasun Ltd 0.91Hikal Ltd 0.87
Industrial Products 4.96Bharat Forge Ltd 1.82Timken India Ltd 1.62FAG Bearings India Ltd 0.98Greaves Cotton Ltd 0.54
Auto 4.61Tata Motors Ltd A (DVR) 2.84Mahindra & Mahindra Ltd 1.05Tvs Motor Company Ltd 0.52Force Motors Ltd 0.20
Chemicals 3.93Atul Ltd 1.72Solar Industries India Ltd 1.55Camlin Fine Sciences Ltd 0.66
Cement 3.82Ultratech Cement Ltd 3.30The Ramco Cements Ltd 0.52
Transportation 3.76Container Corporation Of India Ltd 1.47Blue Dart Express Ltd 1.39Gateway Distriparks Ltd 0.90
Construction Project 3.40Ashoka Buildcon Ltd 1.54KEC International Ltd 1.04NCC Ltd 0.41Sadbhav Engineering Ltd 0.41
Industrial Capital Goods 2.05Texmaco Rail & Engineering Ltd 1.17Honeywell Automation India Ltd 0.88
Auto Ancillaries 1.92WABCO India Ltd 1.51Precision Camshafts Ltd 0.41
Construction 1.77Ahluwalia Contracts (India) Ltd 1.02Kajaria Ceramics Ltd 0.75
Finance 1.53Credit Analysis and Research Ltd 1.01Cholamandalam Investment & Finance Co Ltd 0.52
Hotels, Resorts And Other Recreational Activities 1.44The Indian Hotels Co Ltd 1.44
Gas 1.39Indraprastha Gas Ltd 1.39
Pesticides 1.19Bayer Cropscience Ltd 1.19
Telecom - Services 1.08Tata Communications Ltd 1.08
Media & Entertainment 1.05Zee Entertainment Enterprises Ltd 0.74Dish TV India Ltd 0.31
Engineering Services 1.00VA Tech Wabag Ltd 1.00
Fertilisers 0.92Coromandel International Ltd 0.92
Oil 0.25Oil & Natural Gas Corporation Ltd 0.25
Money Market Instruments 3.91CBLO 3.91
Net Current Assets 0.36
Grand Total ( Net Asset) 100.00
lCapital appreciation over long term
lInvestment in equity and equity related securities
This product is suitable for investors who are seeking*:
*Investors should consult their financial advisers if in doubt whether the product is suitable for them
8
Investors understand that their principalwill be at Moderately High Risk
$QUANTITATIVE INFORMATION
Standard Deviation 17.44
Portfolio Beta 1.00
Portfolio Turnover Ratio 0.52 times
R-Squared 0.92
Sharpe Ratio 0.72
FUND INFORMATION
CATEGORY: Open Ended Equity Linked Tax Saving Scheme
SCHEME OBJECTIVE:
(ELSS Scheme) Seeking to provide long term capital appreciation by predominantly investing in equities and to facilitate the subscribers to seek tax benefits as provided under Section 80 C of the Income Tax Act, 1961. However, there can be no assurance that the investment objective of the scheme will be realized.
NAV: (as on July 29, 2016)Direct Plan - Dividend Option ` 32.48Regular Plan - Dividend Option ` 23.95Direct Plan - Growth Option ` 48.65Regular Plan - Growth Option ` 47.86
DATE OF ALLOTMENT: March 31, 1993
ASSET ALLOCATION:
Equity and equity related instruments: 80%-100%.
Money Market instruments : 0% - 20%.
MINIMUM INVESTMENT:
Lumpsum: ̀ 500 in multiples of ̀ 1 thereafter
Subsequent purchases: Minimum amount of ` 500 and multiples of ̀ 1 thereafter.
SIP/STP/SWP: For monthly frequency - ` 500 and in multiples of ̀ 1 thereafter
For quarterly frequency - ` 1000 and in multiples of ̀ 1 thereafter
PLANS / OPTIONS :
Regular Plan- Growth Option Regular Plan- Dividend Payout Option
Direct Plan- Growth OptionDirect Plan- Dividend Payout Option
ENTRY LOAD: Nil
EXPENSE RATIO^:
Regular Plan : 2.37%
Direct Plan : 1.76%
BENCHMARK: S&P BSE 100
FUND MANAGER: Mr. Yogesh Patil
TOTAL EXPERIENCE: 13 Years
MANAGING THIS FUND: Since 1-Apr-16
#Monthend AUM : ` 841.60 Crores
Monthly AVG AUM : ` 827.98 Crores
EXIT LOAD: Nil
(as on July 29,2016)
RISKOMETER
$ (for remaining disclaimer Please refer page no. 39) Monthend AUM as on 29.07.2016= ^The expense ratios mentioned for the schemes excludes additional service tax on investment management fees.= Please refer page no. 39 for disclaimers.
Source ICRA MFI Explorer = #
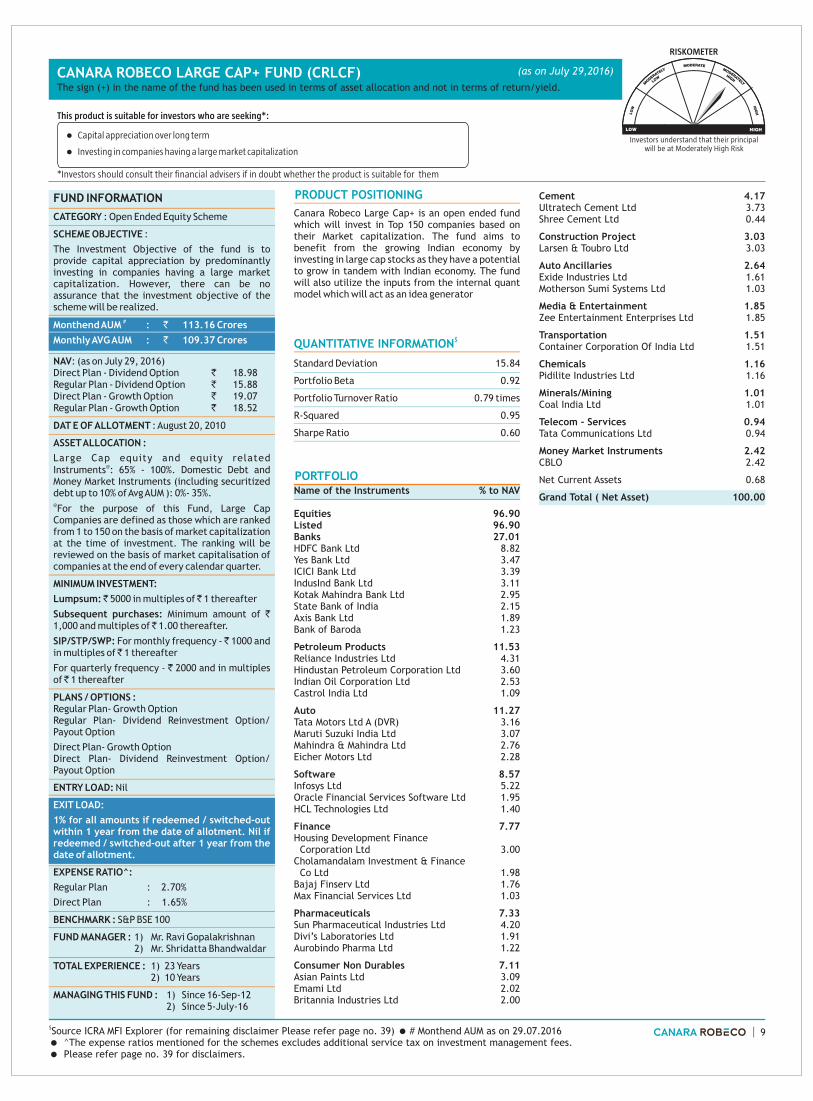
CANARA ROBECO LARGE CAP+ FUND (CRLCF)The sign (+) in the name of the fund has been used in terms of asset allocation and not in terms of return/yield.
PRODUCT POSITIONING
Canara Robeco Large Cap+ is an open ended fund which will invest in Top 150 companies based on their Market capitalization. The fund aims to benefit from the growing Indian economy by investing in large cap stocks as they have a potential to grow in tandem with Indian economy. The fund will also utilize the inputs from the internal quant model which will act as an idea generator
PORTFOLIO Name of the Instruments % to NAV
Equities 96.90Listed 96.90Banks 27.01HDFC Bank Ltd 8.82Yes Bank Ltd 3.47ICICI Bank Ltd 3.39IndusInd Bank Ltd 3.11Kotak Mahindra Bank Ltd 2.95State Bank of India 2.15Axis Bank Ltd 1.89Bank of Baroda 1.23
Petroleum Products 11.53Reliance Industries Ltd 4.31Hindustan Petroleum Corporation Ltd 3.60Indian Oil Corporation Ltd 2.53Castrol India Ltd 1.09
Auto 11.27Tata Motors Ltd A (DVR) 3.16Maruti Suzuki India Ltd 3.07Mahindra & Mahindra Ltd 2.76Eicher Motors Ltd 2.28
Software 8.57Infosys Ltd 5.22Oracle Financial Services Software Ltd 1.95HCL Technologies Ltd 1.40
Finance 7.77Housing Development Finance Corporation Ltd 3.00Cholamandalam Investment & Finance Co Ltd 1.98Bajaj Finserv Ltd 1.76Max Financial Services Ltd 1.03
Pharmaceuticals 7.33Sun Pharmaceutical Industries Ltd 4.20Divi’s Laboratories Ltd 1.91Aurobindo Pharma Ltd 1.22
Consumer Non Durables 7.11Asian Paints Ltd 3.09Emami Ltd 2.02Britannia Industries Ltd 2.00
Cement 4.17Ultratech Cement Ltd 3.73Shree Cement Ltd 0.44
Construction Project 3.03Larsen & Toubro Ltd 3.03
Auto Ancillaries 2.64Exide Industries Ltd 1.61Motherson Sumi Systems Ltd 1.03
Media & Entertainment 1.85Zee Entertainment Enterprises Ltd 1.85
Transportation 1.51Container Corporation Of India Ltd 1.51
Chemicals 1.16Pidilite Industries Ltd 1.16
Minerals/Mining 1.01Coal India Ltd 1.01
Telecom - Services 0.94Tata Communications Ltd 0.94
Money Market Instruments 2.42CBLO 2.42
Net Current Assets 0.68
Grand Total ( Net Asset) 100.00
lCapital appreciation over long term
lInvesting in companies having a large market capitalization
This product is suitable for investors who are seeking*:
*Investors should consult their financial advisers if in doubt whether the product is suitable for them
9
Investors understand that their principalwill be at Moderately High Risk
$QUANTITATIVE INFORMATION
Standard Deviation 15.84
Portfolio Beta 0.92
Portfolio Turnover Ratio 0.79 times
R-Squared 0.95
Sharpe Ratio 0.60
(as on July 29,2016)
FUND INFORMATION
CATEGORY : Open Ended Equity Scheme
SCHEME OBJECTIVE :
The Investment Objective of the fund is to provide capital appreciation by predominantly investing in companies having a large market capitalization. However, there can be no assurance that the investment objective of the scheme will be realized.
NAV: (as on July 29, 2016)Direct Plan - Dividend Option ` 18.98Regular Plan - Dividend Option ` 15.88Direct Plan - Growth Option ` 19.07Regular Plan - Growth Option ` 18.52
DAT E OF ALLOTMENT : August 20, 2010
ASSET ALLOCATION :
Large Cap equity and equity related @Instruments : 65% - 100%. Domestic Debt and
Money Market Instruments (including securitized debt up to 10% of Avg AUM ): 0%- 35%.@For the purpose of this Fund, Large Cap Companies are defined as those which are ranked from 1 to 150 on the basis of market capitalization at the time of investment. The ranking will be reviewed on the basis of market capitalisation of companies at the end of every calendar quarter.
MINIMUM INVESTMENT:
Lumpsum: ̀ 5000 in multiples of ̀ 1 thereafter
Subsequent purchases: Minimum amount of ` 1,000 and multiples of ̀ 1.00 thereafter.
SIP/STP/SWP: For monthly frequency - ̀ 1000 and in multiples of ̀ 1 thereafter
For quarterly frequency - ` 2000 and in multiples of ̀ 1 thereafter
PLANS / OPTIONS : Regular Plan- Growth Option Regular Plan- Dividend Reinvestment Option/ Payout Option
Direct Plan- Growth OptionDirect Plan- Dividend Reinvestment Option/ Payout Option
ENTRY LOAD: Nil
EXPENSE RATIO^:
Regular Plan : 2.70%
Direct Plan : 1.65%
BENCHMARK : S&P BSE 100
FUND MANAGER : 1) Mr. Ravi Gopalakrishnan2) Mr. Shridatta Bhandwaldar
TOTAL EXPERIENCE : 1) 23 Years 2) 10 Years
MANAGING THIS FUND : 1) Since 16-Sep-122) Since 5-July-16
#Monthend AUM : ` 113.16 Crores
Monthly AVG AUM : ` 109.37 Crores
EXIT LOAD:
1% for all amounts if redeemed / switched-out within 1 year from the date of allotment. Nil if redeemed / switched-out after 1 year from the date of allotment.
RISKOMETER

Investors understand that their principalwill be at High Risk
$ (for remaining disclaimer Please refer page no. 39) Monthend AUM as on 29.07.2016 =̂The expense ratios mentioned for the schemes excludes additional service tax on investment management fees.
=Please refer page no. 39 for disclaimers.
Source ICRA MFI Explorer = #
CANARA ROBECO F.O.R.C.E FUND (CRFRC) (Financial Opportunities, Retail Consumption & Entertainment Fund)
10
(as on July 29,2016)
INVESTMENT STYLE
Growth Value Blend
Large Cap Mid Cap Small Cap
Diversified Thematic Sector
PRODUCT POSITIONING
Canara Robeco FORCE Fund is an open ended thematic fund predominantly investing in 3 sectors benefitting from the rising domestic demand i.e. Financial Services, Retail Consumption and Media & Entertainment. The fund will also look for opportunity to invest in few other companies which benefit from this theme not covered in the sectors mentioned above. The fund will invest in stocks across the Market Capitalisation range and will look to follow 'Growth' style of investing.
PORTFOLIO
Name of the Instruments % to NAV
Equities 97.86Listed 97.07Banks 37.23HDFC Bank Ltd 9.38ICICI Bank Ltd 5.47Axis Bank Ltd 4.53State Bank of India 4.29IndusInd Bank Ltd 3.83Kotak Mahindra Bank Ltd 3.29Yes Bank Ltd 2.83Bank of Baroda 2.26DCB Bank Ltd 1.35
Media & Entertainment 16.36Zee Entertainment Enterprises Ltd 7.27D B Corp Ltd 2.48PVR Ltd 2.08Dish TV India Ltd 1.98Jagran Prakashan Ltd 1.56HT Media Ltd 0.99
Consumer Non Durables 15.44I T C Ltd 5.43Glaxosmithkline Consumer Healthcare Ltd 1.98Kansai Nerolac Paints Ltd 1.95Britannia Industries Ltd 1.86CCL Products (India) Ltd 1.76Emami Ltd 1.28Parag Milk Foods Ltd 1.18
Finance 15.37Housing Development Finance Corporation Ltd 3.50
Bajaj Finserv Ltd 2.07Capital First Ltd 1.91Cholamandalam Investment & Finance Co Ltd 1.55Muthoot Finance Ltd 1.41Mahindra & Mahindra Financial Services Ltd 1.32IIFL Holdings Ltd 1.29Max Financial Services Ltd 1.16Sundaram Finance Ltd 1.16
Consumer Durables 4.44Whirlpool Of India Ltd 2.36Century Plyboards (India) Ltd 2.08
Textile Products 4.39Arvind Ltd 1.78Raymond Ltd 1.47Siyaram Silk Mills Ltd 1.14
Hotels, Resorts And Other Recreational Activities 1.94The Indian Hotels Co Ltd 1.94
Retailing 1.90Aditya Birla Fashion and Retail Ltd 1.00Shopper’s Stop Ltd 0.90
Unlisted 0.79Retailing 0.79Bharti Retail Ltd 0.79
Money Market Instruments 3.78CBLO 3.78
Net Current Assets -1.64
Grand Total ( Net Asset) 100.00
lCapital appreciation over long term
lInvesting in equity and equity related securities of companies in the Finance, Retail & Entertainment sectors
This product is suitable for investors who are seeking*:
*Investors should consult their financial advisers if in doubt whether the product is suitable for them
$QUANTITATIVE INFORMATION
Standard Deviation 20.12
Portfolio Beta 1.12
Portfolio Turnover Ratio 0.48 times
R-Squared 0.85
Sharpe Ratio 0.80
FUND INFORMATION
CATEGORY: Open Ended Equity Scheme
SCHEME OBJECTIVE: The objective of the Fund is to provide long - term capital appreciation by primarily investing in equity and equity related securities of companies in the Finance, Retail & Entertainment sectors. However, there can be no assurance that the investment objective of the scheme will be realized.
NAV: (as on July 29, 2016)
Direct Plan - Dividend Option ` 26.79Direct Plan - Growth Option ` 28.82Regular Plan - Dividend Option ` 21.86Regular Plan - Growth Option ` 28.05
DATE OF ALLOTMENT: September 14, 2009
ASSET ALLOCATION: Equity and equity related instruments of companies in the Finance, Retail &
@Entertainment sector : 65% - 100%. Other Equity and equity related instruments : 0%-35%. Domestic Debt and Money Market instruments (Including securitised debt up to 10% of net assets) : 0% - 35%
@The scheme shall invest minimum 40% and maximum 65% in Finance Sector, minimum 15% and maximum 35% in Entertainment sector and minimum 10% and maximum 25% in Retail sector.
MINIMUM INVESTMENT :
Lumpsum: ̀ 5000 in multiples of ̀ 1 thereafterSubsequent purchases: Minimum amount of ` 1000 and multiples of ̀ 1 thereafter.SIP/STP/SWP: For monthly frequency - ̀ 1000 and in multiples of ̀ 1 thereafterFor quarterly frequency - ` 2000 and in multiples of ̀ 1 thereafter
PLANS / OPTIONS :
Regular Plan - Growth Regular Plan - Dividend Reinvestment Regular Plan - Dividend Payout
Direct Plan- Growth OptionDirect Plan- Dividend Reinvestment Option/ Payout Option
ENTRY LOAD: Nil
EXPENSE RATIO^:Regular Plan : 2.67%Direct Plan : 1.83%
BENCHMARK : Nifty 50
FUND MANAGER: Mr. Hemang Kapasi
TOTAL EXPERIENCE: 10 Years
MANAGING THIS FUND: Since 13-May-16(As Fund Manager)Since 12-Jun-14(As Co-Fund Manager)
#Monthend AUM : ` 124.87 Crores
Monthly AVG AUM : ` 123.00 Crores
EXIT LOAD : 1.5% - If redeemed/switched out within 12 months from the date of allotment.
1% - If redeemed/switched out after 12 months but before 18 months from the date of allotment.
Nil - if redeemed/switched out after 18 months from the date of allotment.
RISKOMETER

$ (for remaining disclaimer Please refer page no. 39) Monthend AUM as on 29.07.2016= ^The expense ratios mentioned for the schemes excludes additional service tax on investment management fees. =Please refer page no. 39 for disclaimers.
Source ICRA MFI Explorer = #
CANARA ROBECO EMERGING EQUITIES (CREE)
INVESTMENT STYLE
Growth Value Blend
Large Cap Mid Cap Small Cap
Diversified Thematic Sector
PRODUCT POSITIONING
Canara Robeco Emerging Equities follows a bottom-
up approach to predominantly invest in a well
diversified portfolio of companies within small &
mid cap universe. The fund endeavours to identify
the stars of tomorrow within the segment.
PORTFOLIO Name of the Instruments % to NAV
Equities 96.49Listed 95.47Banks 9.28IndusInd Bank Ltd 3.37Yes Bank Ltd 2.46DCB Bank Ltd 1.85Kotak Mahindra Bank Ltd 1.60
Finance 8.02Cholamandalam Investment & Finance Co Ltd 2.02Ujjivan Financial Services Ltd 1.85Credit Analysis and Research Ltd 1.53IIFL Holdings Ltd 1.39Bharat Financial Inclusion Ltd 1.23
Construction Project 7.33Engineers India Ltd 1.62Sadbhav Engineering Ltd 1.57Techno Electric & Engineering Co Ltd 1.49Ashoka Buildcon Ltd 1.37NCC Ltd 1.28
Cement 7.28The Ramco Cements Ltd 2.13JK Lakshmi Cement Ltd 1.67Dalmia Bharat Ltd 1.20Century Textiles & Industries Ltd 1.15Orient Cement Ltd 1.13
Pharmaceuticals 6.41Divi’s Laboratories Ltd 2.18Natco Pharma Ltd 1.81Strides Shasun Ltd 1.36Hikal Ltd 1.06
Industrial Products 6.17FAG Bearings India Ltd 1.61Timken India Ltd 1.52Bharat Forge Ltd 1.10Finolex Industries Ltd 1.01Greaves Cotton Ltd 0.93
Chemicals 6.10Atul Ltd 2.06Navin Fluorine International Ltd 2.05Solar Industries India Ltd 1.17Camlin Fine Sciences Ltd 0.82
Consumer Non Durables 5.51Akzo Nobel India Ltd 1.58Britannia Industries Ltd 1.53CCL Products (India) Ltd 1.32Eveready Industries India Ltd 1.08
Industrial Capital Goods 5.09Honeywell Automation India Ltd 1.41Praj Industries Ltd 1.30Texmaco Rail & Engineering Ltd 0.97Sanghvi Movers Ltd 0.73Skipper Ltd 0.68
Petroleum Products 4.80Indian Oil Corporation Ltd 2.99Gulf Oil Lubricants India Ltd 1.01Castrol India Ltd 0.80
Textile Products 4.04Arvind Ltd 1.60Raymond Ltd 1.59K.P.R. Mill Ltd 0.85
Power 3.75Cesc Ltd 1.96Kalpataru Power Transmission Ltd 1.79
Auto Ancillaries 3.42WABCO India Ltd 1.45Asahi India Glass Ltd 1.26Precision Camshafts Ltd 0.71
Transportation 2.94Transport Corporation of India Ltd 1.92Gateway Distriparks Ltd 1.02
Auto 2.84Force Motors Ltd 1.47Escorts Ltd 1.37
Consumer Durables 1.94Whirlpool Of India Ltd 1.21Century Plyboards (India) Ltd 0.73
Software 1.75NIIT Ltd 1.25Hexaware Technologies Ltd 0.50
Hotels, Resorts And Other Recreational Activities 1.65The Indian Hotels Co Ltd 1.65
Telecom - Services 1.64Tata Communications Ltd 1.64
Construction 1.60Ahluwalia Contracts (India) Ltd 0.85Kajaria Ceramics Ltd 0.75
Engineering Services 1.39VA Tech Wabag Ltd 1.39
Gas 1.38Indraprastha Gas Ltd 1.38
Media & Entertainment 1.14TV18 Broadcast Ltd 0.63Dish TV India Ltd 0.51
Unlisted 1.02Retailing 1.02Bharti Retail Ltd 1.02
Money Market Instruments 0.99CBLO 0.99
Net Current Assets 2.52
Grand Total ( Net Asset) 100.00
lCapital appreciation over long term
lInvesting in diversified mid-cap stocks
This product is suitable for investors who are seeking*:
*Investors should consult their financial advisers if in doubt whether the product is suitable for them
11
Investors understand that their principalwill be at Moderately High Risk
$QUANTITATIVE INFORMATION
Standard Deviation 21.50
Portfolio Beta 1.11
Portfolio Turnover Ratio 0.41 times
R-Squared 0.88
Sharpe Ratio 1.46
(as on July 29,2016)
FUND INFORMATION
CATEGORY: Open Ended Equity Scheme.
SCHEME OBJECTIVE: To generate capital appreciation by primarily investing in diversified mid cap stocks. However, there can be no assurance that the investment objective of the scheme will be realized.
NAV: (as on July 29, 2016)Direct Plan - Dividend Option ` 47.33Regular Plan - Dividend Option ` 37.86Direct Plan - Growth Option ` 69.08Regular Plan - Growth Option ` 66.99
DATE OF ALLOTMENT: March 11, 2005
ASSET ALLOCATION: Mid & Small Cap equity and @equity related instruments : 65%-100%.
Equity & equity related instruments of Companies other than the above: 0% - 35%. Domestic Debt and Money Market Instruments: 0% - 35%.
@For the purpose of this Fund, Mid & Small Cap Companies are defined as those which are ranked from 151 to 500 on the basis of market capitalisation. The ranking will be reviewed periodically.
MINIMUM INVESTMENT:
Lumpsum: ̀ 5000 in multiples of ̀ 1 thereafter
Subsequent purchases: Minimum amount of ` 1,000 and multiples of ̀ 1 thereafter.
SIP/STP/SWP: For monthly frequency - ̀ 1000 and in multiples of ̀ 1 thereafter
For quarterly frequency - ` 2000 and in multiples of ̀ 1 thereafter
PLANS / OPTIONS :
Regular Plan- Growth Option Regular Plan- Dividend Reinvestment Option/ Payout Option
Direct Plan- Growth OptionDirect Plan- Dividend Reinvestment Option/ Payout Option
ENTRY LOAD: Nil
EXPENSE RATIO^:
Regular Plan : 2.31%
Direct Plan : 1.29%
BENCHMARK : Nifty Free Float Midcap 100
FUND MANAGER: Mr. Ravi Gopalakrishnan
TOTAL EXPERIENCE: 23 Years
MANAGING THIS FUND: Since 13-May-16(As Fund Manager)Since 16-Sep-12(As Co-Fund Manager)
#Monthend AUM : ` 1,205.44 Crores
Monthly AVG AUM : ` 1,161.01 Crores
EXIT LOAD :
1% - if redeemed/switched out within 1 year from the date of allotment;
Nil - if redeemed/switched out after 1 year from the date of allotment
RISKOMETER

$ (for remaining disclaimer Please refer page no. 39) Monthend AUM as on 29.07.2016= ^The expense ratios mentioned for the schemes excludes additional service tax on investment management fees.
=Please refer page no. 39 for disclaimers.
Source ICRA MFI Explorer = #
CANARA ROBECO INFRASTRUCTURE (CRI)
INVESTMENT STYLE
Growth Value Blend
Large Cap Mid Cap Small Cap
Diversified Thematic Sector
Canara Robeco Infrastructure endeavours to
capture opportunities in the infrastructure space,
through a predominantly large-cap oriented
portfolio. The fund follows a thematic approach
towards Infrastructure with a 'Growth' style of
investing. The fund aims to have concentrated
holdings on high conviction ideas.
PRODUCT POSITIONING
PORTFOLIO Name of the Instruments % to NAV
Equities 95.06Listed 95.06Cement 16.61Ultratech Cement Ltd 8.96Grasim Industries Ltd 4.61Orient Cement Ltd 3.04
Transportation 15.75Container Corporation Of India Ltd 6.66Blue Dart Express Ltd 4.04Transport Corporation of India Ltd 2.64Gateway Distriparks Ltd 2.41
Petroleum Products 15.29Hindustan Petroleum Corporation Ltd 6.17Indian Oil Corporation Ltd 5.74Bharat Petroleum Corporation Ltd 2.05Castrol India Ltd 1.33
Construction Project 11.70Sadbhav Engineering Ltd 4.88Ashoka Buildcon Ltd 4.31Techno Electric & Engineering Co Ltd 1.34Larsen & Toubro Ltd 1.17
Power 8.13Power Grid Corporation Of India Ltd 8.13
Industrial Capital Goods 6.12Texmaco Rail & Engineering Ltd 3.61Praj Industries Ltd 2.32Salzer Electronics Ltd 0.19
Construction 5.58PNC Infratech Ltd 3.10Ahluwalia Contracts (India) Ltd 1.77Simplex Infrastructures Ltd 0.71
Industrial Products 3.62Bharat Forge Ltd 2.06Timken India Ltd 0.90Cummins India Ltd 0.66
Engineering Services 3.48VA Tech Wabag Ltd 3.48
Gas 3.31Indraprastha Gas Ltd 2.79GAIL (India) Ltd 0.52
Finance 3.30Housing Development Finance Corporation Ltd 2.59IDFC Ltd 0.71
Auto Ancillaries 1.14Exide Industries Ltd 0.66Z.F. Steering Gear (India) Ltd 0.48
Oil 0.56Oil & Natural Gas Corporation Ltd 0.56
Telecom - Services 0.47Tata Communications Ltd 0.47
Money Market Instruments 4.71CBLO 4.71
Net Current Assets 0.23
Grand Total ( Net Asset) 100.00
lCapital appreciation over long term
lInvesting in equities and equity related instruments of companies in the infrastructure sector
This product is suitable for investors who are seeking*:
*Investors should consult their financial advisers if in doubt whether the product is suitable for them
12
Investors understand that their principalwill be at High Risk
$QUANTITATIVE INFORMATION
Standard Deviation 23.71
Portfolio Beta 1.29
Portfolio Turnover Ratio 0.3 times
R-Squared 0.85
Sharpe Ratio 0.88
FUND INFORMATION
CATEGORY: Open Ended Equity Scheme
S C H E M E O B J E C T I V E : To g e n e r a t e income/capital appreciation by investing in equities and equity related instruments of companies in the infrastructure sector. However, there can be no assurance that the investment objective of the scheme will be realized.
NAV: (as on July 29, 2016)Direct Plan - Dividend Option ` 29.67Regular Plan - Dividend Option ` 26.71Direct Plan - Growth Option ` 41.23Regular Plan - Growth Option ` 40.33
DATE OF ALLOTMENT: December 2, 2005
ASSET ALLOCATION: Equity and equity related instruments of companies in the Infrastructure sector including derivatives of such companies : 75% - 100%. Domestic Debt and Money Market instruments : 0% - 25%.
MINIMUM INVESTMENT:
Lumpsum: ̀ 5000 in multiples of ̀ 1 thereafter
Subsequent purchases: Minimum amount of ` 1,000 and multiples of ̀ 1 thereafter.
SIP/STP/SWP: For monthly frequency - ` 1000 and in multiples of ̀ 1 thereafter
For quarterly frequency - ̀ 2000 and in multiples of ̀ 1 thereafter
PLANS / OPTIONS : Regular Plan- Growth Option Regular Plan- Dividend Reinvestment Option/ Payout Option
Direct Plan- Growth OptionDirect Plan- Dividend Reinvestment Option/ Payout Option
ENTRY LOAD: Nil
EXPENSE RATIO^:
Regular Plan : 2.66%
Direct Plan : 1.89%
BENCHMARK: S&P BSE 100
FUND MANAGER: Mr. Yogesh Patil
TOTAL EXPERIENCE: 13 Years
MANAGING THIS FUND: Since 29-May-15(As Fund Manager)
Since 1- Dec-11(As Co-Fund Manager)
#Monthend AUM : ` 132.82 Crores
Monthly AVG AUM : ` 129.22 Crores
EXIT LOAD: 1% - If redeemed/switched out within 1 year from the date of allotment, Nil - if redeemed/switched out after 1 year from the date of allotment.
(as on July 29,2016)
RISKOMETER

Equity 71.29%
CBLO/REPO/Reverse Repo & Net Current Assets 7.03%
NCDs/Bonds 9.88%
CP 3.07%
Treasury Bills/ Sovereign 8.74%
$ (for remaining disclaimer Please refer page no. 39) Monthend AUM as on 29.07.2016= ^The expense ratios mentioned for the schemes excludes additional service tax on investment management fees. = Please refer page no. 39 for disclaimers.
Source ICRA MFI Explorer = #
CANARA ROBECO BALANCE (CRB)
INVESTMENT STYLE
Growth Value Blend
Large Cap Mid Cap Small Cap
Diversified Thematic Sector
PRODUCT POSITIONING
Canara Robeco Balance aims to generating long-term capital appreciation through a prudent mix of equity and debt portfolio, making it more suitable for the average investor as it takes away the burden of focusing on asset allocation between equity & debt. The fund invests in a careful blend of select stocks and debt securities which effectively spreads the risk.
PORTFOLIO Name of the Instruments % to NAV
Equities 71.30Listed 71.30Banks 14.81HDFC Bank Ltd 2.24Yes Bank Ltd 2.24IndusInd Bank Ltd 2.10ICICI Bank Ltd 1.95State Bank of India 1.94Kotak Mahindra Bank Ltd 1.56Axis Bank Ltd 1.32DCB Bank Ltd 0.78Bank of Baroda 0.68Petroleum Products 7.20Reliance Industries Ltd 2.18Hindustan Petroleum Corporation Ltd 2.08Indian Oil Corporation Ltd 1.20Gulf Oil Lubricants India Ltd 1.03Castrol India Ltd 0.71Pharmaceuticals 5.77Sun Pharmaceutical Industries Ltd 2.74Divi’s Laboratories Ltd 1.45Cipla Ltd 1.04Natco Pharma Ltd 0.54Construction Project 5.37Techno Electric & Engineering Co Ltd 1.28Larsen & Toubro Ltd 1.13Ashoka Buildcon Ltd 0.93NCC Ltd 0.76Engineers India Ltd 0.64KEC International Ltd 0.63Consumer Non Durables 5.12Colgate Palmolive (India) Ltd 1.08Britannia Industries Ltd 1.05CCL Products (India) Ltd 0.98Akzo Nobel India Ltd 0.78Emami Ltd 0.64Eveready Industries India Ltd 0.59Auto 5.00Maruti Suzuki India Ltd 1.47Tata Motors Ltd A (DVR) 1.29Force Motors Ltd 0.86Eicher Motors Ltd 0.70Mahindra & Mahindra Ltd 0.68Cement 4.24Ultratech Cement Ltd 1.44JK Lakshmi Cement Ltd 0.89Orient Cement Ltd 0.72Century Textiles & Industries Ltd 0.69Sanghi Industries Ltd 0.50Finance 3.78Cholamandalam Investment & Finance Co Ltd 1.19Max Financial Services Ltd 0.98Credit Analysis and Research Ltd 0.87Bharat Financial Inclusion Ltd 0.74Industrial Capital Goods 2.63ABB India Ltd 1.22Texmaco Rail & Engineering Ltd 0.63Sanghvi Movers Ltd 0.52Alstom T&D India Ltd 0.26Software 2.39Infosys Ltd 1.59NIIT Ltd 0.80
ASSET ALLOCATION
lIncome/capital appreciation over long term
lInvesting in equity and equity related securities as well as fixed income securities (debt and money market securities)
This product is suitable for investors who are seeking*:
*Investors should consult their financial advisers if in doubt whether the product is suitable for them
13
Investors understand that their principalwill be at Moderately High Risk
Industrial Products 2.17Bharat Forge Ltd 0.83Mold Tek Packaging Ltd 0.68Timken India Ltd 0.66Textile Products 2.00Arvind Ltd 0.81Raymond Ltd 0.77Siyaram Silk Mills Ltd 0.42Chemicals 1.73Navin Fluorine International Ltd 1.73Transportation 1.30Transport Corporation of India Ltd 0.88Blue Dart Express Ltd 0.42Power 1.28Cesc Ltd 1.28Auto Ancillaries 1.03Banco Products (I) Ltd 0.54Precision Camshafts Ltd 0.49Minerals/Mining 0.95Coal India Ltd 0.95Hotels, Resorts And Other Recreational Activities 0.84The Indian Hotels Co Ltd 0.84Media & Entertainment 0.74Zee Entertainment Enterprises Ltd 0.74Construction 0.71Ahluwalia Contracts (India) Ltd 0.71Gas 0.65Indraprastha Gas Ltd 0.65Telecom - Services 0.62Tata Communications Ltd 0.62Engineering Services 0.54VA Tech Wabag Ltd 0.54Textiles - Synthetic 0.43Sarla Performance Fibers Ltd 0.43Debt Instruments 9.89Tata Sons Ltd 1.56Indiabulls Housing Finance Ltd 1.55L&T Housing Finance Ltd 1.24Power Finance Corporation Ltd 0.81Power Finance Corporation Ltd 0.80NTPC Ltd 0.79Power Grid Corporation of India Ltd 0.79Power Grid Corporation of India Ltd 0.79Housing Development Finance Corporation Ltd 0.78ICICI Bank Ltd 0.78Money Market Instruments 10.91CBLO 7.84JM Financial Products Ltd 2.30Muthoot Finance Ltd 0.77Government Securities 8.748.15% GOI 24-NOV-26 2.469.20% GOI 30-SEP-30 1.788.15% RAJASTHAN SDL 23-JUN-21 1.588.19% RAJASTHAN SDL 23-JUN-26 1.118.24% GOI 10-NOV-33 0.847.68% GOI 15-DEC-23 0.808.17% GOI 01-DEC-44 0.17
Net Current Assets -0.84
Grand Total ( Net Asset) 100.00
$QUANTITATIVE INFORMATION
Standard Deviation 14.76Portfolio Beta 1.29Portfolio Turnover Ratio 2.26 timesR-Squared 0.89Sharpe Ratio 0.95
(as on July 29,2016)
RISKOMETER
FUND INFORMATION
CATEGORY: Open Ended Balance Scheme
SCHEME OBJECTIVE: To seek to generate long term capital appreciation and/or income from a portfolio constituted of equity and equity related securities as well as fixed income securities (debt and money market securities). However, there can be no assurance that the investment objective of the scheme will be realized.
NAV: Direct Plan - Monthly Divi. Option ` 79.84Regular Plan - Monthly Divi. Option ` 78.57Direct Plan - Growth Option ` 122.75Regular Plan - Growth Option ` 120.81
DATE OF ALLOTMENT: February 1, 1993
ASSET ALLOCATION: Equity and equity related instruments : 40% - 75%. Debt securities including Securitized debt having rating above AA or equivalent, Money Market Instruments & Govt. Securities : 25% - 60%.
MINIMUM INVESTMENT:
Lumpsum: ̀ 5000 in multiples of ̀ 1 thereafterSubsequent purchases: Minimum amount of ` 1,000 and multiples of ̀ 1 thereafter.SIP/STP/SWP: For monthly frequency - ̀ 1000 and in multiples of ̀ 1 thereafterFor quarterly frequency - ` 2000 and in multiples of ̀ 1 thereafter
PLANS / OPTIONS : Regular Plan- Growth Option Regular Plan - Monthly Dividend Option (Payout and Reinvestment)Direct Plan- Growth OptionDirect Plan - Monthly Dividend Option (Payout and Reinvestment)
ENTRY LOAD: Nil
EXPENSE RATIO^:Regular Plan : 2.56% Direct Plan : 1.54%
BENCHMARK : CRISIL Balanced Fund - Aggressive Index
FUND MANAGER : 1) Mr. Ravi Gopalakrishnan2) Mr. Avnish Jain 3) Mr. Shridatta Bhandwaldar
TOTAL EXPERIENCE : 1) 23 Years 2) 22 Years3) 10 Years
MANAGING THIS FUND: 1) Since 13-May-162) Since 7-Oct-133) Since 5-July-16
#Monthend AUM : ` 646.02 Crores
Monthly AVG AUM : ` 615.21 Crores
EXIT LOAD: 1% - If redeemed/switched out within 1 year from the date of allotment, Nil - if redeemed/switched out after 1 year from the date of allotment.
(as on July 29, 2016)

$ (for remaining disclaimer Please refer page no. 39) Monthend AUM as on 29.07.2016= ^The expense ratios mentioned for the schemes excludes additional service tax on investment management fees.
= Please refer page no. 39 for disclaimers.
Source ICRA MFI Explorer = #
CANARA ROBECO MONTHLY INCOME PLAN (CRMIP)
PRODUCT POSITIONINGCanara Robeco Monthly Income Plan is a debt oriented hybrid fund which aims to generate regular income predominantly through exposure in debt instruments. Also a small participation in equity markets endeavours to boost portfolio returns.
QUANTITATIVE INFORMATION $
Yield to Maturity 7.39%Modified Duration 3.15 YearsAverage Maturity 4.89 Years
PORTFOLIO Name of the Instruments % to NAV
Equities 24.50Listed 24.50Banks 5.24HDFC Bank Ltd 1.55IndusInd Bank Ltd 1.03Bank of Baroda 0.57Yes Bank Ltd 0.52ICICI Bank Ltd 0.48Axis Bank Ltd 0.41State Bank of India 0.35Kotak Mahindra Bank Ltd 0.33Cement 2.29Ultratech Cement Ltd 0.95ACC Ltd 0.71Orient Cement Ltd 0.40Century Textiles & Industries Ltd 0.23Petroleum Products 2.18Hindustan Petroleum Corporation Ltd 0.98Reliance Industries Ltd 0.59Castrol India Ltd 0.34Gulf Oil Lubricants India Ltd 0.27Auto 2.10Force Motors Ltd 0.57Escorts Ltd 0.53Tata Motors Ltd 0.42Eicher Motors Ltd 0.33Tvs Motor Company Ltd 0.25Software 1.99Infosys Ltd 1.02Oracle Financial Services Software Ltd 0.56HCL Technologies Ltd 0.41Pharmaceuticals 1.50Sun Pharmaceutical Industries Ltd 0.91Divi’s Laboratories Ltd 0.35Aurobindo Pharma Ltd 0.24Construction Project 1.45KEC International Ltd 0.56Larsen & Toubro Ltd 0.45Ashoka Buildcon Ltd 0.44Industrial Capital Goods 1.28ABB India Ltd 0.47Sanghvi Movers Ltd 0.32Texmaco Rail & Engineering Ltd 0.27Alstom T&D India Ltd 0.22Chemicals 1.20Navin Fluorine International Ltd 0.68Atul Ltd 0.28Gujarat Fluorochemicals Ltd 0.24Finance 1.18Housing Development Finance Corporation Ltd 0.38Bharat Financial Inclusion Ltd 0.30Cholamandalam Investment & Finance Co Ltd 0.25Max Financial Services Ltd 0.25Industrial Products 1.00Mold Tek Packaging Ltd 0.45Bharat Forge Ltd 0.29Timken India Ltd 0.26Construction 0.64PNC Infratech Ltd 0.33Ahluwalia Contracts (India) Ltd 0.31Consumer Non Durables 0.56CCL Products (India) Ltd 0.34Eveready Industries India Ltd 0.22Media & Entertainment 0.45Zee Entertainment Enterprises Ltd 0.29Dish TV India Ltd 0.16Auto Ancillaries 0.38Z.F. Steering Gear (India) Ltd 0.38
lIncome / Capital appreciation over medium term to long term
lInvestment in Debt instruments, MMI and small portion in equity
This product is suitable for investors who are seeking*:
*Investors should consult their financial advisers if in doubt whether the product is suitable for them
14
Investors understand that their principalwill be at Moderately High Risk
RATING PROFILE (% to net assets)
ASSET ALLOCATION
FUND INFORMATIONCATEGORY: Open Ended Debt SchemeSCHEME OBJECTIVE: To generate income by investing in a wide range of Debt Securities and Money Market instruments of various maturities and small portion in equities and Equity Related Instruments. However, there can be no assurance that the investment objective of the scheme will be realized.
NAV: (as on July 29, 2016)Direct Plan - Growth Option ` 49.6616Regular Plan - Growth Option ` 47.9435Direct Plan - Monthly Divi. Option ` 15.2249Regular Plan - Monthly Divi. Option ` 14.6551Regular Plan - Quarterly Divi. Option ` 14.9016Direct Plan - Quarterly Divi. Option ` 15.5007DATE OF ALLOTMENT: April 24, 1988ASSET ALLOCATION: Equity and equity related instruments :10%-25%. Debt securities (including Securitized debt) with Money Market Instruments : 75% - 90%.MINIMUM INVESTMENT: Lumpsum: ̀ 5000 in multiples of ̀ 1 thereafterSIP/STP/SWP: For monthly frequency - ̀ 1000 and in multiples of ̀ 1 thereafterFor quarterly frequency - ` 2000 and in multiples of ̀ 1 thereafterPLANS / OPTIONS : Regular Plan- Growth OptionRegular Plan - Monthly Dividend Payout / Reinvestment OptionRegular Plan- Quarterly Dividend Payout/ Reinvestment OptionDirect Plan- Growth OptionDirect Plan - Monthly Dividend Payout / Reinvestment OptionDirect Plan- Quarterly Dividend Payout/ Reinvestment OptionENTRY LOAD: Nil
EXPENSE RATIO^: Regular Plan : 2.20% Direct Plan : 1.21%
BENCHMARK: Crisil MIP Blended IndexFUND MANAGER : 1) Mr. Avnish Jain
2) Mr. Ravi Gopalakrishnan(for equity allocation)
TOTAL EXPERIENCE : 1) 22 Years 2) 23 YearsMANAGING THIS FUND: 1) Since 7-Oct-13
2) Since 16-Sep-12
#Monthend AUM : ` 274.88 CroresMonthly AVG AUM : ` 273.62 Crores
EXIT LOAD: 1% - if redeemed/switched out within 1 year from the date of allotment.Nil – if redeemed / switched out after 1 year from the date of allotment.
MATURITY PROFILE% Allocation
0 to 3 Months 14.24%3 to 6 Months 5.49%6 to 12 Months 6.36%1 -2 years 9.50%Gretare then 2 years 35.94%
(as on July 29,2016)
RISKOMETER
Engineering Services 0.36VA Tech Wabag Ltd 0.36Gas 0.25Indraprastha Gas Ltd 0.25Hotels, Resorts And Other Recreational Activities 0.25The Indian Hotels Co Ltd 0.25Textile Products 0.20Arvind Ltd 0.20Money Market Instruments 5.27IDBI Bank Ltd 5.27Debt Instruments 36.19Food Corporation Of India 6.00Tata Sons Ltd 5.49NTPC Ltd 3.70Housing Development Finance Corporation Ltd 3.68L&T Housing Finance Ltd 3.65Indiabulls Housing Finance Ltd 3.65Power Grid Corporation of India Ltd 1.91Power Grid Corporation of India Ltd 1.85Power Grid Corporation of India Ltd 1.85Housing Development Finance Corporation Ltd 1.84L&T Infrastructure Finance Ltd 1.10Housing Development Finance Corporation Ltd 1.10Housing Development Finance Corporation Ltd 0.37Government Securities 16.958.15% GOI 24-NOV-26 4.248.19% RAJASTHAN SDL 23-JUN-26 3.739.20% GOI 30-SEP-30 2.108.24% GOI 10-NOV-33 1.967.68% GOI 15-DEC-23 1.878.15% RAJASTHAN SDL 23-JUN-21 1.868.17% GOI 01-DEC-44 1.197.72% GOI 26-OCT-55 0.00Mutual Fund Investments 0.39Canara Robeco Saving Plus 0.39
CBLO 13.14
Other Current Assets 3.56
Grand Total ( Net Asset) 100.00
CBLO/REPO/Reverse Repo & Net Current Assets 22.12%
AAA & Equivalent 41.65%
Unit Funds 0.52%
Sovereign 22.46%
AA+ & Equivalent 6.28%
A1+ & Equivalent 6.98%
CBLO/REPO/Reverse Repo & Net Current Assets 16.69%
NCDs/Bonds 36.17%
Treasury Bills/ Sovereign
16.95%Unit Funds
0.39%
Equity 24.53%
CDs5.27%

$ (for remaining disclaimer Please refer page no. 39) Monthend AUM as on 29.07.2016= ^The expense ratios mentioned for the schemes excludes additional service tax on investment management fees. = Please refer page no. 39 for disclaimers.
Source ICRA MFI Explorer = #
CANARA ROBECO INDIGO (Income from Debt Instruments & Gold) FUND (CRIF)
PRODUCT POSITIONING
The fund provides a unique combination of Debt and Gold (through Gold ETFs) in one fund. The fund aims to generate alpha through moderate duration play & by capturing the seasonal patterns in Gold. The fund acts as a portfolio diversifier and also provides a blend of accrual & capital appreciation to its investors. The fund through its Gold investment aims to generate additional yield without taking additional credit risk on the fixed income portfolio.
RATING PROFILE (% to net assets)
ASSET ALLOCATION
$$ Canara Robeco Blended Gold Index is a composite index of the Gold Index and CRISIL Short term Bond Fund Index
computed by CRISIL Limited for the purpose of benchmarking the performance of Canara Robeco InDiGo Fund. The Index shall not be copied, transmitted or distributed for any commercial use.
lIncome / Capital appreciation over medium term to short term
lInvestment in debt & money market securities along with investments in Gold ETFs
This product is suitable for investors who are seeking*:
*Investors should consult their financial advisers if in doubt whether the product is suitable for them
15
Investors understand that their principalwill be at Moderately High Risk
QUANTITATIVE INFORMATION $
Yield to Maturity 7.22%
Modified Duration 1.38 Years
Average Maturity 1.75 Years
MATURITY PROFILE% Allocation
Net Current Assets 9.26%
0 to 3 Months 16.47%
6 to 12 Months 16.97%
1 -2 years 5.35%
Greater than 2 years 22.02%
PORTFOLIO
Name of the Instruments % to NAV
Money Market Instruments 16.97IDBI Bank Ltd 16.97
Debt Instruments 38.00Tata Global Beverages Ltd 10.63Power Grid Corporation of India Ltd 9.23Rural Electrification Corporation Ltd 9.11LIC Housing Finance Ltd 5.35Power Finance Corporation Ltd 3.68
Mutual Fund Investments 29.93Goldman Sachs Gold ETS 14.48Canara Robeco Gold ETF 13.22Kotak Gold ETF 2.23
CBLO 5.84
Other Current Assets 9.26
Grand Total ( Net Asset) 100.00
FUND INFORMATION
CATEGORY: Open Ended Debt Scheme
SCHEME OBJECTIVE:To generate income from a portfolio constituted of debt & money market securities along with investments in Gold ETFs. However, there can be no assurance that the investment objective of the scheme will be realized.
NAV: (as on July 29, 2016)Direct Plan - Growth Option ` 15.0803Regular Plan - Growth Option ` 14.7285Regular Plan - Quarterly Divi. Option ` 10.9809Direct Plan - Quarterly Divi. Option ` 11.5969
DATE OF ALLOTMENT: July 9, 2010
ASSET ALLOCATION: Indian Debt & Money Market Instruments :65-90%Gold ETFs:10-35%
MINIMUM INVESTMENT: Lumpsum: ̀ 5000 in multiples of ̀ 1 thereafterSIP/STP/SWP: For monthly frequency - ̀ 1000 and in multiples of ̀ 1 thereafterFor quarterly frequency - ` 2000 and in multiples of ̀ 1 thereafter
PLANS / OPTIONS : Regular Plan- Growth OptionRegular Plan- Quarterly Dividend Payout/ Reinvestment Option
Direct Plan- Growth OptionDirect Plan- Quarterly Dividend Payout/ Reinvestment Option
ENTRY LOAD: Nil
EXPENSE RATIO^:
Regular Plan : 2.40%
Direct Plan : 1.73%
BENCHMARK: Canara Robeco Blended Gold $Index
FUND MANAGER: 1) Mr. Avnish Jain2) Mr. Kiran Shetty
TOTAL EXPERIENCE: 1) 22 Years2) 9 Years
MANAGING THIS FUND: 1) Since 7-Oct-132) Since 7-Oct-13
#Monthend AUM : ` 56.90 Crores
Monthly AVG AUM : ` 57.31 Crores
EXIT LOAD:
1% - if redeemed/switched out within 1 year from the date of allotment.Nil – if redeemed / switched out after 1 year from the date of allotment.
$
(as on July 29,2016)
RISKOMETER
CBLO/REPO/Reverse Repo & Net Current Assets 21.55%
AAA & Equivalent 39.07%
AA+ & Equivalent 15.17%
A1+ & Equivalent 24.22%
Gold ETFs 29.93%
CBLO/REPO/Reverse Repo & Net Current Assets 15.10%
CDs 16.97%
NCDs/Bonds 38.00%

Investors understand that their principalwill be at Moderate Risk
$ (for remaining disclaimer Please refer page no. 39) Monthend AUM as on 29.07.2016= ^The expense ratios mentioned for the schemes excludes additional service tax on investment management fees.
= Please refer page no. 39 for disclaimers.
Source ICRA MFI Explorer = #
CANARA ROBECO INCOME (CRINC)
PORTFOLIO
Name of the Instruments Rating % to NAV
Money Market Instruments 3.92JM Financial Products Ltd A1+(ICRA) 3.92
Debt Instruments 45.01Food Corporation Of India AAA(CRISIL) 8.70Power Finance Corporation Ltd AAA(CRISIL) 8.16NTPC Ltd AAA(CRISIL) 8.11Housing Development Finance Corporation Ltd AAA(CRISIL) 8.00Power Grid Corporation of India Ltd AAA(CRISIL) 4.04Power Grid Corporation of India Ltd AAA(CRISIL) 4.03LIC Housing Finance Ltd AAA(CARE) 3.97
Government Securities 44.419.20% GOI 30-SEP-30 Sovereign 9.128.19% RAJASTHAN SDL 23-JUN-26 Sovereign 8.118.15% UTTAR PRADESH SDL 02-JUN-21 Sovereign 8.078.24% GOI 10-NOV-33 Sovereign 4.277.68% GOI 15-DEC-23 Sovereign 4.078.14% HARYANA SDL 30-JUN-26 Sovereign 4.048.15% RAJASTHAN SDL 23-JUN-21 Sovereign 4.047.16% GOI 20-MAY-23 Sovereign 2.378.47% MAHARASHTRA SDL 10-FEB-26 Sovereign 0.32
CBLO 3.90
Other Current Assets 2.76
Grand Total ( Net Asset) 100.00
PRODUCT POSITIONING
Canara Robeco Income is an actively managed debt fund wherein the fund manager takes an active view of the interest rate movements. Based on the interest rate view, the duration of the portfolio will be decided along with the asset allocation pattern between sovereign & corporate bonds. As majority of the portfolio gets invested in high quality debt papers, it provides consistent accrual income to the portfolio.
RATING PROFILE (% to net assets)
ASSET ALLOCATION
lIncome / Capital appreciation over medium to long term
lInvestment in Debt and Money Market securities of different maturity and issuers of different risk profiles
This product is suitable for investors who are seeking*:
*Investors should consult their financial advisers if in doubt whether the product is suitable for them
16
QUANTITATIVE INFORMATION $
Yield to Maturity 7.61%
Modified Duration 5.07 Years
Average Maturity 7.73 Years
MATURITY PROFILE
% Allocation
Net Current Assets 2.75%
0 to 3 Months 11.79%
Greater than 2 years 85.46%
FUND INFORMATION
CATEGORY: Open Ended Debt Scheme
SCHEME OBJECTIVE:
To generate income through investment in debt
and money market securities of different
maturity and issuers of different risk profiles.
However, there can be no assurance that the
investment objective of the scheme will be
realized.
NAV: (as on July 29, 2016)Direct Plan - Quarterly Divi. Option ` 14.6869Regular Plan - Quarterly Divi. Option ` 14.3550Direct Plan - Growth Option ` 33.3178Regular Plan - Growth Option ` 32.5861
DATE OF ALLOTMENT: September 19, 2002
ASSET ALLOCATION:
Debt (Including Securitised Debt) : 50% - 100%.
Money Market Instruments / Call Money : 0% - 50%.
MINIMUM INVESTMENT:
Lumpsum: ̀ 5000 in multiples of ̀ 1 thereafter.
SIP/STP/SWP: For monthly frequency - ̀ 1000 and
in multiples of ̀ 1 thereafter
For quarterly frequency - ` 2000 and in multiples
of ̀ 1 thereafter
PLANS / OPTIONS :
Regular Plan- Growth Option Regular Plan - Quarterly Dividend Reinvestment Option/Payout Option
Direct Plan- Growth OptionDirect Plan - Quarterly Dividend Reinvestment Option/Payout Option
ENTRY LOAD: Nil
EXPENSE RATIO^:
Regular Plan : 1.90%
Direct Plan : 1.16%
BENCHMARK: CRISIL Composite Bond Fund Index
FUND MANAGER: Mr. Avnish Jain
TOTAL EXPERIENCE: 22 Years
MANAGING THIS FUND: Since 25-June-14
#Monthend AUM : ` 126.38 Crores
Monthly AVG AUM : ` 127.28 Crores
EXIT LOAD:
1.00% - If redeemed / switched out within 12
months from the date of allotment,
Nil - if redeemed / switched out after 12 months
from the date of allotment
(as on July 29,2016)
RISKOMETER
CBLO/REPO/Reverse Repo & Net Current Assets 6.65%
Treasury Bills/Sovereign 44.41%
AAA & Equivalent 45.01%
A1+ & Equivalent
3.92%
CBLO/REPO/Reverse Repo & Net Current Assets 6.65%
Treasury Bills/Sovereign 44.41%
CP 3.92%
NCDs/Bonds 45.01%
$ (for remaining disclaimer Please refer page no. 39) Monthend AUM as on 29.07.2016= ^The expense ratios mentioned for the schemes excludes additional service tax on investment management fees. = Please refer page no. 39 for disclaimers.
Source ICRA MFI Explorer = #
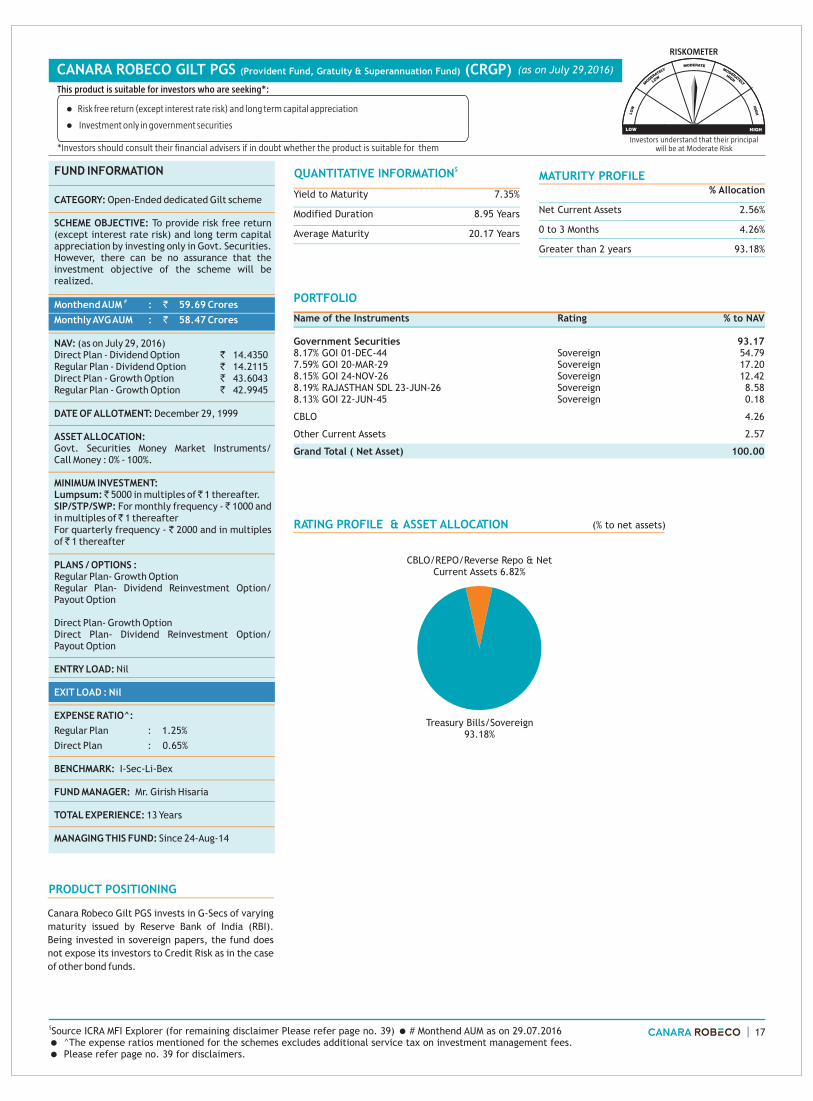
CANARA ROBECO GILT PGS (Provident Fund, Gratuity & Superannuation Fund) (CRGP)
PRODUCT POSITIONING
Canara Robeco Gilt PGS invests in G-Secs of varying
maturity issued by Reserve Bank of India (RBI).
Being invested in sovereign papers, the fund does
not expose its investors to Credit Risk as in the case
of other bond funds.
QUANTITATIVE INFORMATION $
Yield to Maturity 7.35%
Modified Duration 8.95 Years
Average Maturity 20.17 Years
MATURITY PROFILE% Allocation
Net Current Assets 2.56%
0 to 3 Months 4.26%
Greater than 2 years 93.18%
PORTFOLIO
Name of the Instruments Rating % to NAV
Government Securities 93.178.17% GOI 01-DEC-44 Sovereign 54.797.59% GOI 20-MAR-29 Sovereign 17.208.15% GOI 24-NOV-26 Sovereign 12.428.19% RAJASTHAN SDL 23-JUN-26 Sovereign 8.588.13% GOI 22-JUN-45 Sovereign 0.18
CBLO 4.26
Other Current Assets 2.57
Grand Total ( Net Asset) 100.00
RATING PROFILE & ASSET ALLOCATION (% to net assets)
lRisk free return (except interest rate risk) and long term capital appreciation
l Investment only in government securities
This product is suitable for investors who are seeking*:
*Investors should consult their financial advisers if in doubt whether the product is suitable for them
17
Investors understand that their principalwill be at Moderate Risk
FUND INFORMATION
CATEGORY: Open-Ended dedicated Gilt scheme
SCHEME OBJECTIVE: To provide risk free return (except interest rate risk) and long term capital appreciation by investing only in Govt. Securities. However, there can be no assurance that the investment objective of the scheme will be realized.
NAV: (as on July 29, 2016)Direct Plan - Dividend Option ` 14.4350Regular Plan - Dividend Option ` 14.2115Direct Plan - Growth Option ` 43.6043Regular Plan - Growth Option ` 42.9945
DATE OF ALLOTMENT: December 29, 1999
ASSET ALLOCATION: Govt. Securities Money Market Instruments/Call Money : 0% - 100%.
MINIMUM INVESTMENT: Lumpsum: ̀ 5000 in multiples of ̀ 1 thereafter.SIP/STP/SWP: For monthly frequency - ̀ 1000 and in multiples of ̀ 1 thereafterFor quarterly frequency - ` 2000 and in multiples of ̀ 1 thereafter
PLANS / OPTIONS : Regular Plan- Growth Option Regular Plan- Dividend Reinvestment Option/ Payout Option
Direct Plan- Growth OptionDirect Plan- Dividend Reinvestment Option/ Payout Option
ENTRY LOAD: Nil
EXPENSE RATIO^:
Regular Plan : 1.25%
Direct Plan : 0.65%
BENCHMARK: I-Sec-Li-Bex
FUND MANAGER: Mr. Girish Hisaria
TOTAL EXPERIENCE: 13 Years
MANAGING THIS FUND: Since 24-Aug-14
#Monthend AUM : ` 59.69 Crores
Monthly AVG AUM : ` 58.47 Crores
EXIT LOAD : Nil
(as on July 29,2016)
RISKOMETER
Treasury Bills/Sovereign 93.18%
CBLO/REPO/Reverse Repo & Net Current Assets 6.82%

$ (for remaining disclaimer Please refer page no. 39) Monthend AUM as on 29.07.2016= ^The expense ratios mentioned for the schemes excludes additional service tax on investment management fees.
= Please refer page no. 39 for disclaimers.
Source ICRA MFI Explorer = #
CANARA ROBECO DYNAMIC BOND FUND (CRDBF)
PRODUCT POSITIONING
Canara Robeco Dynamic Bond Fund intends to invest and trade in G-secs and Corporate Debt by identifying mispriced opportunities & capturing volatility trends. The fund aims at generating Alpha through free-style duration management depending on the interest rate view. At the same time it endeavours to capture accruals in the form of portfolio running yields on high-quality debt instruments.
PORTFOLIO
Name of the Instruments Rating % to NAV
Debt Instruments 11.43Housing Development Finance Corporation Ltd AAA(CRISIL) 5.72Power Grid Corporation of India Ltd AAA(CRISIL) 2.87Housing Development Finance Corporation Ltd AAA(CRISIL) 2.84
Government Securities 80.077.59% GOI 20-MAR-29 Sovereign 28.818.17% GOI 01-DEC-44 Sovereign 26.918.15% GOI 24-NOV-26 Sovereign 7.138.19% RAJASTHAN SDL 23-JUN-26 Sovereign 5.758.18% HARYANA SDL 15-JUN-26 Sovereign 5.748.14% HARYANA SDL 30-JUN-26 Sovereign 5.73
CBLO 6.57
Other Current Assets 1.93
Grand Total ( Net Asset) 100.00
QUANTITATIVE INFORMATION $
Yield to Maturity 7.42%
Modified Duration 7.57 Years
Average Maturity 14.74 Years
lIncome/ Capital appreciation over short to medium term
lInvestment in Debt and Money Market securities
This product is suitable for investors who are seeking*:
*Investors should consult their financial advisers if in doubt whether the product is suitable for them
18
Investors understand that their principalwill be at Moderate Risk
ASSET ALLOCATION
RATING PROFILE (% to net assets)
% Allocation
Net Current Assets 1.95%
0 to 3 Months 6.57%
Greater than 2 years 91.48%
MATURITY PROFILE
FUND INFORMATION
CATEGORY: Open Ended Debt Scheme
SCHEME OBJECTIVE: The objective of the Fund is to seek to generate income from a portfolio of debt and money market securities. However, there can be no assurance that the investment objective of the scheme will be realized and the Fund does not assure or guarantee any returns.
NAV: (as on July 29, 2016)Direct Plan - Dividend Option ` 13.7652Direct Plan - Growth Option ` 17.8940Regular Plan - Dividend Option ` 13.5155Regular Plan - Growth Option ` 17.6014
DATE OF ALLOTMENT: May 29, 2009
ASSET ALLOCATION: Government of india & Corporate Debt Securities
@(including Securitised Debt) : 0% - 100% Money Market Instruments : 0% - 100%.
@Excluding Debt/GOI Securities with initial maturity of less than one year and Treasury bills.
MINIMUM INVESTMENT : Lumpsum: ̀ 5000 in multiples of ̀ 1 thereafter.Subsequent purchases: Minimum amount of ` 1,000 and multiples of ̀ 1 thereafter.SIP/STP/SWP: For monthly frequency - ̀ 1000 and in multiples of ̀ 1 thereafter .For quarterly frequency - ` 2000 and in multiples of ̀ 1 thereafter.
PLANS / OPTIONS :Regular Plan - GrowthRegular Plan - Dividend ReinvestmentRegular Plan - Dividend Payout
Direct Plan- Growth OptionDirect Plan- Dividend Reinvestment Option/ Payout Option
ENTRY LOAD: Nil
EXPENSE RATIO^:
Regular Plan : 1.75%
Direct Plan : 1.10%
BENCHMARK: CRISIL Composite Bond Fund Index
FUND MANAGER: Mr. Girish Hisaria
TOTAL EXPERIENCE: 13 Years
MANAGING THIS FUND: Since 24-Aug-14
#Monthend AUM : ` 178.24 Crores
Monthly AVG AUM : ` 163.86 Crores
EXIT LOAD:0.50% - If redeemed / switched out within six months from the date of allotment,Nil - if redeemed / switched out after six months from the date of allotment
(as on July 29,2016)
RISKOMETER
CBLO/REPO/Reverse Repo & Net Current Assets 8.52%
Treasury Bills/Sovereign 80.06%
AAA & Equivalent11.42%
CBLO/REPO/Reverse Repo & Net Current Assets 8.52%
NCDs/Bonds11.42%
Treasury Bills/ Sovereign80.06%

$ (for remaining disclaimer Please refer page no. 39) Monthend AUM as on 29.07.2016= ^The expense ratios mentioned for the schemes excludes additional service tax on investment management fees. = Please refer page no. 39 for disclaimers.
Source ICRA MFI Explorer = #
CANARA ROBECO MEDIUM TERM OPPORTUNITIES FUND (CRMTOF)
PRODUCT POSITIONING
Canara Robeco Medium Term Opportunities Fund endeavours to generate accrual income by investing in High quality debt papers. At the same time the scheme endeavours to benefit from interest rate volatility by having low to medium exposure to duration in the portfolio. The fund is suitable for investors who have a medium to long term investment horizon & a moderate risk appetite.
ASSET ALLOCATION
PORTFOLIO
Name of the Instruments % to NAV
Money Market Instruments 6.77Piramal Enterprises Ltd A1+(ICRA) 6.77
Debt Instruments 74.76Emami Ltd AA+(CRISIL) 7.40Capital First Ltd AA+(CARE) 7.35Tata Motors Ltd AA+(CARE) 6.53Rural Electrification Corporation Ltd AAA(CRISIL) 6.09Sundaram Finance Ltd AA+(CRISIL) 5.89Tata Global Beverages Ltd AA+(ICRA) 5.33NTPC Ltd AAA(CRISIL) 4.52Power Grid Corporation Of India Ltd AAA(CRISIL) 3.14Power Finance Corporation Ltd AAA(CRISIL) 3.08Power Finance Corporation Ltd AAA(CRISIL) 3.01LIC Housing Finance Ltd AAA(CRISIL) 2.98LIC Housing Finance Ltd AAA(CRISIL) 2.97Kotak Mahindra Prime Ltd AAA(CRISIL) 2.97Mahindra & Mahindra Financial Services Ltd AAA(IND) 2.95Power Grid Corporation of India Ltd AAA(CRISIL) 1.59Power Grid Corporation of India Ltd AAA(CRISIL) 1.54Power Grid Corporation of India Ltd AAA(CRISIL) 1.50Power Finance Corporation Ltd AAA(CRISIL) 1.49LIC Housing Finance Ltd AAA(CRISIL) 1.48Tata Motors Ltd AA+(CARE) 1.48Indiabulls Housing Finance Ltd AAA(CARE) 1.47
Government Securities 14.428.19% RAJASTHAN SDL 23-JUN-26 Sovereign 5.418.15% UTTAR PRADESH SDL 02-JUN-21 Sovereign 4.498.52% UTTAR PRADESH SDL 29-MAR-22 Sovereign 1.528.15% RAJASTHAN SDL 23-JUN-21 Sovereign 1.508.21% RAJASTHAN SDL 31-MAR-21 Sovereign 1.50
CBLO 0.89
Other Current Assets 3.16
Grand Total ( Net Asset) 100.00
Rating
RATING PROFILE (% to net assets)
QUANTITATIVE INFORMATION $
Yield to Maturity 7.87%
Modified Duration 2.56 Years
Average Maturity 3.41 Years
MATURITY PROFILE% Allocation
Net Current Assets 3.16%
0 to 3 Months 12.10%
6 to 12 Months 12.71%
1 -2 years 22.15%
Greater than 2 years 49.88%
lIncome/Capital appreciation over medium to long - term
lInvestment in Debt and Money Market securities with a portfolio weighted average maturity between 3 to 7 years
This product is suitable for investors who are seeking*:
*Investors should consult their financial advisers if in doubt whether the product is suitable for them
19
Investors understand that their principalwill be at Moderate Risk
(as on July 29,2016)
FUND INFORMATION
CATEGORY : Open Ended Debt Scheme
SCHEME OBJECTIVE : The investment objective of the scheme is to generate income and capital appreciation through a portfolio constituted of medium term debt instruments and money market instruments. However, there can be no assurance that the investment objective of the scheme will be realized.
NAV : Direct Plan - Dividend Option 11.3280Regular Plan - Dividend Option ` 11.2112Direct Plan - Growth Option ` 12.6970Regular Plan - Growth Option ` 12.5731
DAT E OF ALLOTMENT : 7th February, 2014
ASSET ALLOCATION : GoI & Debt Securities: 60%-100%
@Money Market Instruments : 0% - 40%.@Money Market Instruments include Commercial Papers, Commercial Bills, Treasury Bills, Government Securities having an un-expired maturity up to one year, Call or Notice Money, Certif icate of Deposit, Usance Bi l ls, Collateralized Borrowing Lending Obligation, Repos & Reverse Repos in Government Securities/Treasury Bills, Bills re-discounting, MIBOR Instruments, alternative investment for the call money market as may be provided by the RBI to meet the liquidity requirements and any other Money market instruments specified by SEBI/RBI from time to time.
MINIMUM INVESTMENT:
Lumpsum: ̀ 5000 in multiples of ̀ 1 thereafter
Subsequent purchases: Minimum amount of ` 1,000 and multiples of ̀ 1 thereafter.
SIP/STP/SWP: `1000 and ` 2,000 respectively for Monthly and Quarterly frequency respectively and in multiples of ̀ 1 thereafter.
PLANS / OPTIONS : Regular Plan- Growth Option Regular Plan- Dividend Reinvestment Option/ Payout Option
Direct Plan- Growth OptionDirect Plan- Dividend Reinvestment Option/Payout Option
ENTRY LOAD: Nil
EXPENSE RATIO^:Regular Plan : 1.25%Direct Plan : 0.59%
BENCHMARK : CRISIL Composite Bond Fund Index
FUND MANAGER : Mr. Avnish Jain
22 Years
#Monthend AUM : ` 340.57 Crores
Monthly AVG AUM : ` 337.07 Crores
EXIT LOAD: 1% - if redeemed/switched-out within 1 year from the date of allotment;Nil - if redeemed/switched out after 1 year from the date of allotment
(as on July 29, 2016)`
TOTAL EXPERIENCE:
MANAGING THIS FUND: Since 7-Feb-14
RISKOMETER
CBLO/REPO/Reverse Repo & Net Current Assets 4.05%
AAA & Equivalent 40.77%
AA+ & Equivalent
33.98%
Treasury Bills/Sovereign 14.42%
A1+ & Equivalent6.77%
CBLO/REPO/Reverse Repo & Net Current Assets 4.05%
NCDs/Bonds 74.75%
Treasury Bills/ Sovereign 14.42%
CP 6.77%

Investors understand that their principalwill be at Moderately Low Risk
$ (for remaining disclaimer Please refer page no. 39) Monthend AUM as on 29.07.2016 = ^The expense ratios mentioned for the schemes excludes additional service tax on investment management fees. = Please refer page
no. 39 for disclaimers.
Source ICRA MFI Explorer = #
CANARA ROBECO SHORT TERM FUND (CRSTF)
PRODUCT POSITIONING
Canara Robeco Short Term Fund is perfectly suited
for an investor who has a short term investment
horizon of 6 to 9 months and wishes to avoid high
volatility. In terms of risk return, Canara Robeco
Short Term Fund is positioned between Floating
Rate Funds & Medium Term Funds. The fund
generates income predominantly from accrual
yields on high quality Money Market Instruments,
while an active trading strategy is followed for
generating Alpha.
QUANTITATIVE INFORMATION $
Yield to Maturity 7.32%
Modified Duration 1.30 Years
Average Maturity 1.59 Years
PORTFOLIO
Name of the Instruments Rating % to NAV
Money Market Instruments 35.35State Bank Of Hyderabad A1+(ICRA) 7.30Andhra Bank A1+(CARE) 7.09ICICI Bank Ltd A1+(ICRA) 7.08Yes Bank Ltd A1+(ICRA) 6.94Axis Bank Ltd A1+(CRISIL) 6.94
Debt Instruments 51.34Power Finance Corporation Ltd AAA(CRISIL) 7.57Can Fin Homes Ltd AAA(CARE) 7.44L&T Infrastructure Finance Ltd AA+(CARE) 7.41Power Grid Corporation of India Ltd AAA(CRISIL) 3.80Rural Electrification Corporation Ltd AAA(CRISIL) 3.79Power Grid Corporation of India Ltd AAA(CRISIL) 3.77NTPC Ltd AAA(CRISIL) 3.77LIC Housing Finance Ltd AAA(CRISIL) 3.75Kotak Mahindra Prime Ltd AAA(CRISIL) 3.72L&T Housing Finance Ltd AA+(CARE) 3.70Indiabulls Housing Finance Ltd AAA(CARE) 1.48Housing Development Finance Corporation Ltd AAA(CRISIL) 1.14
CBLO 10.95
Other Current Assets 2.36
Grand Total ( Net Asset) 100.00
ASSET ALLOCATION
RATING PROFILE (% to net assets)
% Allocation
Net Current Assets 2.33%
0 to 3 Months 18.25%
3 to 6 Months 11.16%
6 to 12 Months 35.47%
1 -2 years 3.70%
Greater than 2 years 29.09%
lIncome / capital appreciation over short term
lInvesting in short term to medium term debt and money market securities
This product is suitable for investors who are seeking*:
*Investors should consult their financial advisers if in doubt whether the product is suitable for them
20
FUND INFORMATION
CATEGORY: Open Ended Debt Scheme
SCHEME OBJECTIVE: The objective of the Fund is to generate income from a portfolio constituted of short to medium term debt and money market securities. However, there can be no assurance that the investment objective of the scheme will be realized.
NAV: (as on July 29, 2016)
Direct Plan - Growth Option ` 17.8389
Direct Plan - Monthly Dividend Option ` 10.2450
Regular Plan - Growth Option ` 17.5831
Regular Plan -
Monthly Dividend Option ` 10.2403
Regular Plan - Weekly Dividend Option ` 10.1346
Direct Plan - Weekly Dividend Option ` 10.1349
DATE OF ALLOTMENT: March 31, 2009
ASSET ALLOCATION:
Money Market Instruments/Debt Securities with less than 2 years residual maturity - 65% - 100%
Debt Securities with less than 5 years residual maturity (including Securitised Debt) - 0% - 35%
MINIMUM INVESTMENT :
Lumpsum: ̀ 5000 in multiples of ̀ 1 thereafter.
Subsequent purchases: Minimum amount of ` 1,000 and multiples of ̀ 1 thereafter.
SIP/STP/SWP: For monthly frequency - ̀ 1000 and in multiples of ̀ 1 thereafter .
For quarterly frequency - ` 2000 and in multiples of ̀ 1 thereafter.
PLANS / OPTIONS :
Regular Plan - Growth
Regular Plan - Weekly Dividend Reinvestment
Regular Plan - Monthly Dividend Reinvestment
Regular Plan - Monthly Dividend Payout
Direct Plan - Growth
Direct Plan - Weekly Dividend Reinvestment
Direct Plan - Monthly Dividend Reinvestment
Direct Plan - Monthly Dividend Payout
ENTRY LOAD: Nil
EXPENSE RATIO^:
Regular Plan : 1.10%
Direct Plan : 0.62%
BENCHMARK : CRISIL Short Term Bond Fund Index
FUND MANAGER: Ms. Suman Prasad
TOTAL EXPERIENCE: 18 Years
MANAGING THIS FUND: Since 12-Apr-11
#Monthend AUM : ` 135.50 Crores
Monthly AVG AUM : ` 134.57 Crores
EXIT LOAD :0.25% if redeemed/switched out within 60 days from the date of allotment.Nil - if redeemed/switched out after 60 days from the date of allotment.
(as on July 29,2016)
RISKOMETER
AAA & Equivalent 40.25%
A1+ & Equivalent 35.36%
AA+ & Equivalent
11.11%
CBLO/REPO/Reverse Repo & Net Current Assets 13.28%
CBLO/REPO/Reverse Repo & Net Current Assets 13.28%
NCDs/Bonds 51.36%
CDs 35.36%
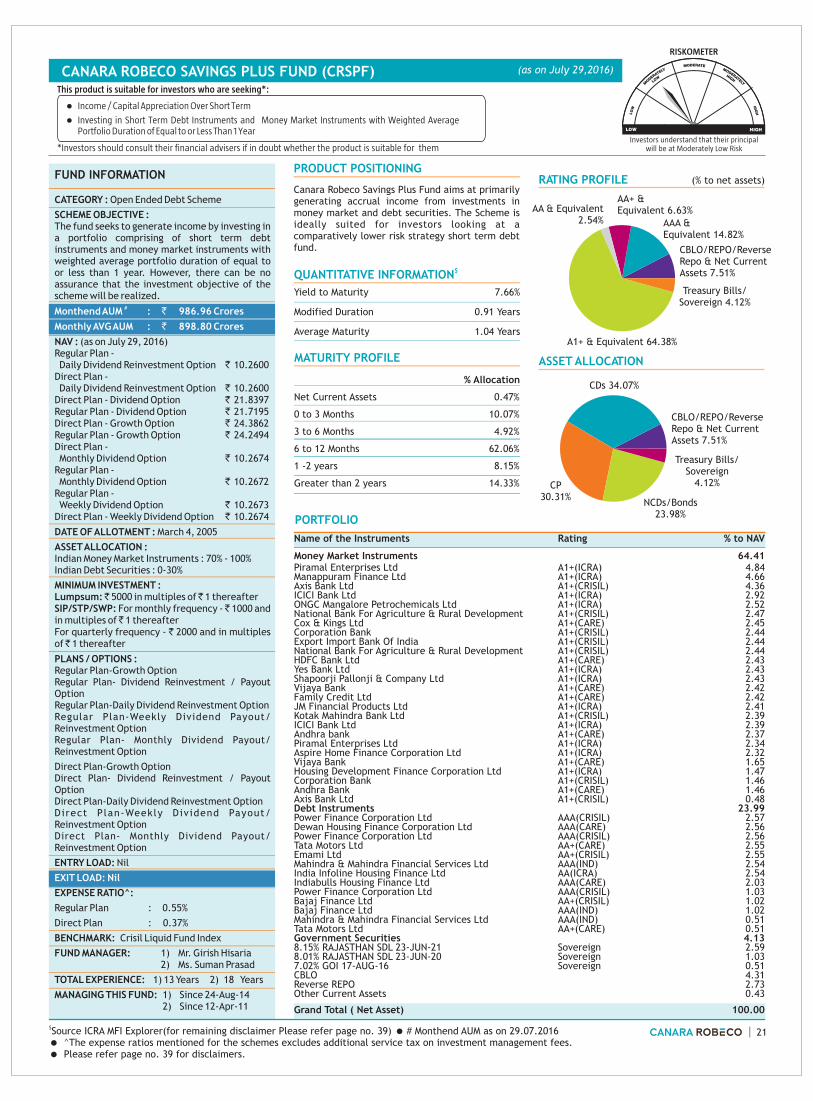
CBLO/REPO/Reverse Repo & Net Assets 7.51%
Current
AAA & Equivalent 14.82%
AA+ & Equivalent 6.63%
A1+ & Equivalent 64.38%
Treasury Bills/Sovereign 4.12%
AA & Equivalent 2.54%
$ (for remaining disclaimer Please refer page no. 39) Monthend AUM as on 29.07.2016= ^The expense ratios mentioned for the schemes excludes additional service tax on investment management fees. = Please refer page no. 39 for disclaimers.
Source ICRA MFI Explorer = # 21
Investors understand that their principalwill be at Moderately Low Risk
RISKOMETER
FUND INFORMATION
PORTFOLIO
Name of the Instruments Rating % to NAV
Money Market Instruments 64.41Piramal Enterprises Ltd A1+(ICRA) 4.84Manappuram Finance Ltd A1+(ICRA) 4.66Axis Bank Ltd A1+(CRISIL) 4.36ICICI Bank Ltd A1+(ICRA) 2.92ONGC Mangalore Petrochemicals Ltd A1+(ICRA) 2.52National Bank For Agriculture & Rural Development A1+(CRISIL) 2.47Cox & Kings Ltd A1+(CARE) 2.45Corporation Bank A1+(CRISIL) 2.44Export Import Bank Of India A1+(CRISIL) 2.44National Bank For Agriculture & Rural Development A1+(CRISIL) 2.44HDFC Bank Ltd A1+(CARE) 2.43Yes Bank Ltd A1+(ICRA) 2.43Shapoorji Pallonji & Company Ltd A1+(ICRA) 2.43Vijaya Bank A1+(CARE) 2.42Family Credit Ltd A1+(CARE) 2.42JM Financial Products Ltd A1+(ICRA) 2.41Kotak Mahindra Bank Ltd A1+(CRISIL) 2.39ICICI Bank Ltd A1+(ICRA) 2.39Andhra bank A1+(CARE) 2.37Piramal Enterprises Ltd A1+(ICRA) 2.34Aspire Home Finance Corporation Ltd A1+(ICRA) 2.32Vijaya Bank A1+(CARE) 1.65Housing Development Finance Corporation Ltd A1+(ICRA) 1.47Corporation Bank A1+(CRISIL) 1.46Andhra Bank A1+(CARE) 1.46Axis Bank Ltd A1+(CRISIL) 0.48Debt Instruments 23.99Power Finance Corporation Ltd AAA(CRISIL) 2.57Dewan Housing Finance Corporation Ltd AAA(CARE) 2.56Power Finance Corporation Ltd AAA(CRISIL) 2.56Tata Motors Ltd AA+(CARE) 2.55Emami Ltd AA+(CRISIL) 2.55Mahindra & Mahindra Financial Services Ltd AAA(IND) 2.54India Infoline Housing Finance Ltd AA(ICRA) 2.54Indiabulls Housing Finance Ltd AAA(CARE) 2.03Power Finance Corporation Ltd AAA(CRISIL) 1.03Bajaj Finance Ltd AA+(CRISIL) 1.02Bajaj Finance Ltd AAA(IND) 1.02Mahindra & Mahindra Financial Services Ltd AAA(IND) 0.51Tata Motors Ltd AA+(CARE) 0.51Government Securities 4.138.15% RAJASTHAN SDL 23-JUN-21 Sovereign 2.598.01% RAJASTHAN SDL 23-JUN-20 Sovereign 1.037.02% GOI 17-AUG-16 Sovereign 0.51CBLO 4.31Reverse REPO 2.73Other Current Assets 0.43
Grand Total ( Net Asset) 100.00
RATING PROFILE (% to net assets)
ASSET ALLOCATION
lIncome / Capital Appreciation Over Short Term
lInvesting in Short Term Debt Instruments and Money Market Instruments with Weighted Average Portfolio Duration of Equal to or Less Than 1 Year
This product is suitable for investors who are seeking*:
*Investors should consult their financial advisers if in doubt whether the product is suitable for them
CATEGORY : Open Ended Debt Scheme
SCHEME OBJECTIVE : The fund seeks to generate income by investing in a portfolio comprising of short term debt instruments and money market instruments with weighted average portfolio duration of equal to or less than 1 year. However, there can be no assurance that the investment objective of the scheme will be realized.
NAV : Regular Plan - Daily Dividend Reinvestment Option ` 10.2600Direct Plan - Daily Dividend Reinvestment Option ` 10.2600Direct Plan - Dividend Option ` 21.8397Regular Plan - Dividend Option ` 21.7195Direct Plan - Growth Option ` 24.3862Regular Plan - Growth Option ` 24.2494Direct Plan - Monthly Dividend Option ` 10.2674Regular Plan - Monthly Dividend Option ` 10.2672Regular Plan - Weekly Dividend Option ` 10.2673Direct Plan - Weekly Dividend Option ` 10.2674
DATE OF ALLOTMENT : March 4, 2005
ASSET ALLOCATION : Indian Money Market Instruments : 70% - 100%Indian Debt Securities : 0-30%
MINIMUM INVESTMENT : Lumpsum: ̀ 5000 in multiples of ̀ 1 thereafterSIP/STP/SWP: For monthly frequency - ̀ 1000 and in multiples of ̀ 1 thereafterFor quarterly frequency - ̀ 2000 and in multiples of ̀ 1 thereafter
PLANS / OPTIONS :Regular Plan-Growth OptionRegular Plan- Dividend Reinvestment / Payout Option Regular Plan-Daily Dividend Reinvestment OptionRegular Plan-Weekly Dividend Payout/ Reinvestment OptionRegular Plan- Monthly Dividend Payout/ Reinvestment Option
Direct Plan-Growth OptionDirect Plan- Dividend Reinvestment / Payout OptionDirect Plan-Daily Dividend Reinvestment OptionDirect Plan-Weekly Dividend Payout/ Reinvestment OptionDirect Plan- Monthly Dividend Payout/ Reinvestment Option
ENTRY LOAD: Nil
BENCHMARK: Crisil Liquid Fund Index
FUND MANAGER: 1) Mr. Girish Hisaria2) Ms. Suman Prasad
#Monthend AUM : ` 986.96 Crores
Monthly AVG AUM : ` 898.80 Crores
(as on July 29, 2016)
EXPENSE RATIO^:
Regular Plan : 0.55%
Direct Plan : 0.37%
13 Years
EXIT LOAD: Nil
TOTAL EXPERIENCE: 1) 2) 18 Years
MANAGING THIS FUND: 1) Since 24-Aug-142) Since 12-Apr-11
PRODUCT POSITIONING
Canara Robeco Savings Plus Fund aims at primarily generating accrual income from investments in money market and debt securities. The Scheme is ideally suited for investors looking at a comparatively lower risk strategy short term debt fund.
QUANTITATIVE INFORMATION$
Yield to Maturity 7.66%
Modified Duration 0.91 Years
Average Maturity 1.04 Years
MATURITY PROFILE
% Allocation
Net Current Assets 0.47%
0 to 3 Months 10.07%
3 to 6 Months 4.92%
6 to 12 Months 62.06%
1 -2 years 8.15%
Greater than 2 years 14.33%
CANARA ROBECO SAVINGS PLUS FUND (CRSPF) (as on July 29,2016)
CDs 34.07%
CP 30.31%
NCDs/Bonds23.98%
CBLO/REPO/Reverse Repo & Net Assets 7.51%
Current
Treasury Bills/ Sovereign
4.12%

$ (for remaining disclaimer Please refer page no. 39)= # Monthend AUM as on 29.07.2016 ^The expense ratios mentioned for the schemes excludes additional
service tax on investment management fees.= Please refer page no. 39 for disclaimers.
Source ICRA MFI Explorer =
=** Plan / Option close for subscription w.e.f 1st October 2012
CANARA ROBECO TREASURY ADVANTAGE FUND (CRTAF)
QUANTITATIVE INFORMATION $
Yield to Maturity 7.01%
Modified Duration 0.48 Years
Average Maturity 0.55 Years
ASSET ALLOCATION
RATING PROFILE (% to net assets)
PORTFOLIO
Name of the Instruments Rating % to NAV
Money Market Instruments 79.12Corporation Bank A1+(CRISIL) 10.69ICICI Bank Ltd A1+(ICRA) 10.69Vijaya Bank A1+(CARE) 8.54Small Industries Development Bank Of India A1+(CARE) 5.57Aditya Birla Finance Ltd A1+(ICRA) 5.56CESC Ltd A1+(CARE) 5.56BASF India Ltd A1+(CRISIL) 5.56JM Financial Products Ltd A1+(ICRA) 5.52L&T Infrastructure Finance Ltd A1+(CARE) 5.42Andhra Bank A1+(CARE) 5.35Yes Bank Ltd A1+(ICRA) 5.34Axis Bank Ltd A1+(CRISIL) 5.32
Debt Instruments 5.71Power Finance Corporation Ltd AAA(CRISIL) 5.71
CBLO 14.69
Other Current Assets 0.48
Grand Total ( Net Asset) 100.00
Canara Robeco Treasury Advantage Fund seeks to provide consistent income and liquidity through investments made primarily in money market and debt securities following a low risk strategy. The portfolio duration of the fund tends to be slightly higher than a liquid fund.
MATURITY PROFILE
% Allocation
Net Current Assets 0.49%
0 to 3 Months 42.46%
3 to 6 Months 5.42%
6 to 12 Months 45.92%
Greater than 2 years 5.71%
lIncome / capital appreciation over short term through a low risk strategy
lInvestment in a mix of Money Market Instrument & Debt Securities
This product is suitable for investors who are seeking*:
*Investors should consult their financial advisers if in doubt whether the product is suitable for them
22
Investors understand that their principalwill be at Moderately Low Risk
FUND INFORMATION
CATEGORY: Open Ended Debt Scheme
SCHEME OBJECTIVE: To generate income/capital appreciation through a low risk strategy by investment in Debt Securities and Money Market Instruments. However, there can be no assurance that the investment objective of the scheme will be realized.
NAV: (as on July 29, 2016)Direct Plan - Daily Dividend Reinvestment Option `1,240.7100Direct Plan - Dividend Option `1,365.7433Direct Plan - Growth Option `2,384.7229Institutional Plan - Daily Dividend Option** `1,240.7100Institutional Plan - Growth Option** `2,519.5589Direct Plan - Monthly Dividend Option `1,003.8446Retail Plan - Daily Dividend Option** `1,240.7100Retail Plan - Dividend Option** `1,688.3078Retail Plan - Growth Option** `2,453.0933Retail Plan - Monthly Divi. Option** `1,241.3090Retail Plan - Weekly Divi. Option** `1,241.3090Regular Plan - Daily Dividend Reinvestment Option** `1,240.7100Regular Plan - Growth Option `2,360.3186Regular Plan - Monthly Dividend Option `1,004.8338Regular Plan - Weekly Dividend Option `1,241.3301Direct Plan - Weekly Dividend Option `1,241.3777
DATE OF ALLOTMENT: Retail Plan : September 16, 2003Institutional Plan : August 21, 2007Regular Plan : July 14, 2008
ASSET ALLOCATION: MMI / Call / Debt Instruments with residual average maturity of equal or less than one year: 20% - 100%.Debt Instruments with residual average Maturity of more than one year (Including Securitised Debt) : 0% - 80%.
MINIMUM INVESTMENT : Lumpsum: ̀ 5000 in multiples of ̀ 1 thereafterSubsequent purchases: Minimum amount of ` 1,000 and multiples of ̀ 1 thereafter.SIP/STP/SWP: For monthly frequency - ̀ 1000 and in multiples of ̀ 1 thereafterFor quarterly frequency - ` 2000 and in multiples of ̀ 1 thereafter
PLANS / OPTIONS :Regular Plan - Growth OptionRegular Plan - Dividend Option : Daily Dividend ReinvestmentRegular Plan - Weekly Dividend ReinvestmentRegular Plan - Weekly Dividend PayoutRegular Plan - Monthly Dividend ReinvestmentRegular Plan - Monthly Dividend PayoutDirect Plan - Growth OptionDirect Plan - Dividend Option : Daily Dividend ReinvestmentDirect Plan - Weekly Dividend Reinvestment
#Monthend AUM : ` 89.80 Crores
Monthly AVG AUM : ` 87.26 Crores
Direct Plan - Weekly Dividend PayoutDirect Plan - Monthly Dividend ReinvestmentDirect Plan - Monthly Dividend PayoutDirect Plan - Dividend Payout
ENTRY LOAD: Nil
EXPENSE RATIO^:
Regular Plan : 0.95%
Direct Plan : 0.25%
BENCHMARK: Crisil Liquid Fund Index
FUND MANAGER: 1) Mr. Girish Hisaria2) Ms. Suman Prasad
TOTAL EXPERIENCE: 1) 13 Years2) 18 Years
MANAGING THIS FUND: 1) Since 24-Aug-142) Since 12-Apr-11
EXIT LOAD: Nil
(as on July 29,2016)
RISKOMETER
CBLO/REPO/Reverse Repo & Net
Assets 15.19%Current
AAA & Equivalent 5.71%
A1+ & Equivalent 79.09%
CDs 45.92%
CP 33.18%
CBLO/REPO/Reverse Repo & Net Current Assets 15.19%
NCDs/Bonds5.71%

CBLO/REPO/Reverse Repo & Net Current Assets 7.44%
A1+ & Equivalent 72.22%
Treasury Bills/Sovereign 20.34%
Investors understand that their principalwill be at Low Risk
CANARA ROBECO LIQUID (CRL)
$ (for remaining disclaimer Please refer page no. 39)= # Monthend AUM as on 29.07.2016 ^The expense ratios mentioned for the schemes excludes
additional service tax on investment management fees.= Please refer page no. 39 for disclaimers.
Source ICRA MFI Explorer =
=** Plan / Option close for subscription w.e.f 1st October 2012
PRODUCT POSITIONING
Canara Robeco Liquid invests in only short-term money market instruments with a residual maturity upto 91 days. The fund aims to provide liquidity at all the time. The fund is suitable for investments with very short term horizon & to park surplus money.
QUANTITATIVE INFORMATION $
Yield to Maturity 6.90%
Modified Duration 0.06 Years
Average Maturity 0.06 Years
MATURITY PROFILE
% Allocation
Net Current Assets 0.13%
0 to 3 Months 99.87%
PORTFOLIO
Name of the Instruments Rating % to NAV
Money Market Instruments 72.24Small Industries Development Bank Of India A1+(CARE) 6.65ONGC Mangalore Petrochemicals Ltd A1+(ICRA) 6.38Dewan Housing Finance Corporation Ltd A1+(CRISIL) 4.56Andhra bank A1+(CARE) 2.52Manappuram Finance Ltd A1+(ICRA) 2.29PTC India Financial Services Ltd A1+(CRISIL) 2.29Hero Fincorp Ltd A1+(CRISIL) 2.28Andhra bank A1+(CARE) 2.28State Bank Of Patiala A1+(ICRA) 2.28Raymond Ltd A1+(CRISIL) 2.28Adani Ports And Special Economic Zone Ltd A1+(ICRA) 2.28Aditya Birla Nuvo Ltd A1+(ICRA) 2.28Indiabulls Housing Finance Ltd A1+(CRISIL) 2.27Vijaya Bank A1+(CARE) 2.06National Bank For Agriculture & Rural Development A1+(CRISIL) 2.05Aditya Birla Finance Ltd A1+(ICRA) 1.83Raymond Ltd A1+(CRISIL) 1.83Piramal Enterprises Ltd A1+(ICRA) 1.61Chambal Fertilizers & Chemicals Ltd A1+(ICRA) 1.60Power Finance Corporation Ltd A1+(CRISIL) 1.15Shriram City Union Finance Ltd A1+(CARE) 1.15Capital First Ltd A1+(CARE) 1.15IndusInd Bank Ltd A1+(CRISIL) 1.15Oriental Bank of Commerce A1+(CRISIL) 1.15RBL Bank Ltd 1.15RBL Bank Ltd 1.15RBL Bank Ltd 1.15Vijaya Bank A1+(CARE) 1.15Blue Star Ltd A1+(CARE) 1.15PTC India Financial Services Ltd A1+(CRISIL) 1.14PTC India Financial Services Ltd A1+(CRISIL) 1.14Reliance Home Finance Ltd A1+(ICRA) 1.14Reliance Home Finance Ltd A1+(ICRA) 1.14ECL Finance Ltd A1+(CRISIL) 1.14Blue Star Ltd A1+(CARE) 1.14L&T Infrastructure Finance Ltd A1+(CARE) 0.91Piramal Enterprises Ltd A1+(ICRA) 0.91Small Industries Development Bank Of India A1+(CARE) 0.23Yes Bank Ltd A1+(ICRA) 0.23
Government Securities 3.447.02% GOI 17-AUG-16 Sovereign 3.44Treasury Bills 16.90CBLO 7.30Other Current Assets 0.12
Grand Total ( Net Asset) 100.00
lIncome/Capital appreciation over short term, while maintaining a level of high liquidity
lInvestment in a mix of Money Market Instrument & Debt Securities
This product is suitable for investors who are seeking*:
*Investors should consult their financial advisers if in doubt whether the product is suitable for them
23
FUND INFORMATIONCATEGORY: Open Ended Cash Management SchemeSCHEME OBJECTIVE: To enhance the income, while maintaining a level of liquidity through, investment in a mix of MMI & Debt securities. However, there can be no assurance that the investment objective of the scheme will be realized.
NAV: (as on July 29, 2016)Direct Plan - Daily Divi. Reinvestment Option `1,005.5000Direct Plan - Dividend Option `1,349.6164Direct Plan - Growth Option `1,885.1042Unclaimed Redmp & Dividend Plan-Direct Growth `1,023.9592Institutional Plan-Growth Option** `2,761.2911Insti. Plan-Daily Divi. Option** `1,005.5000Direct Plan-Monthly Divi. Option `1,000.4889Retail Plan-Monthly Divi. Option** `1,005.8650Retail Plan - Daily Divi. Option** `1,007.0000Retail Plan - Growth Option** `2,683.2762Retail Plan - Weekly Divi. Option** `1,005.8654Regular Plan - Daily Divi. Reinvestment Option `1,005.5000Regular Plan - Growth Option `1,881.9859Regular Plan - Monthly Divi. Option `1,000.4878Regular Plan - Weekly Divi. Option `1,000.4874Direct Plan - Weekly Divi. Option `1,000.4884DATE OF ALLOTMENT: Retail Plan : January 15, 2002Institutional Plan : May 31, 2004Regular Plan : July 15, 2008ASSET ALLOCATION: Money Market Instruments/call money:65%-100%Debt (including securitized debt) : 0% - 35%.MINIMUM INVESTMENT : Lumpsum: ̀ 5000 in multiples of ̀ 1 thereafterSubsequent purchases: Minimum amount of ` 1,000 and multiples of ̀ 1 thereafter.STP/SWP: For monthly frequency - ` 1000 and in multiples of ̀ 1 thereafterFor quarterly frequency - ` 2000 and in multiples of ̀ 1 thereafterPLANS / OPTIONS :Regular Plan - Growth OptionRegular Plan -Dividend Option : Daily Dividend ReinvestmentRegular Plan - Weekly Dividend ReinvestmentRegular Plan - Weekly Dividend payoutRegular Plan - Monthly Dividend ReinvestmentRegular Plan - Monthly Dividend PayoutDirect Plan - Growth OptionDirect Plan -Dividend Option : Daily Dividend ReinvestmentDirect Plan - Weekly Dividend ReinvestmentDirect Plan - Weekly Dividend payoutDirect Plan - Monthly Dividend ReinvestmentDirect Plan - Monthly Dividend PayoutDirect Plan - Dividend PayoutUnclaimed Redmp & Dividend Plan-Direct GrowthENTRY LOAD: Nil
EXPENSE RATIO^:Regular Plan : 0.11% = Direct Plan : 0.09%BENCHMARK: Crisil Liquid Fund IndexFUND MANAGER: 1) Mr. Girish Hisaria
2) Ms. Suman PrasadTOTAL EXPERIENCE: 1)13 Years 2) 18 Years MANAGING THIS FUND: 1) Since 24-Aug-14
2) Since 18-Mar-11
#Monthend AUM : ` 2,178.77 CroresMonthly AVG AUM : ` 2,396.74 Crores
EXIT LOAD: Nil
(as on July 29,2016)
RATING PROFILE (% to net assets) ASSET ALLOCATION
RISKOMETER
CDs 12.80%
CP 55.97%
Fixed Deposit3.44%
CBLO/REPO/Reverse Repo & Net Current Assets 7.44%
Treasury Bills/ Sovereign
20.34%

$ (for remaining disclaimer Please refer page no. 39) Monthend AUM as on 29.07.2016= ^The expense ratios mentioned for the schemes excludes additional service tax on investment management fees.
= Please refer page no. 39 for disclaimers.
Source ICRA MFI Explorer = #
CANARA ROBECO YIELD ADVANTAGE FUND (CRYAF)
PRODUCT POSITIONING
Canara Robeco Yield Advantage seeks to maximize returns through active management of the portfolio consisting of wide range of Debt and Money Market Instruments. The Fund takes Corporate Bond exposure (80-100%) with the aim to generate accrual returns. The scheme may also tactically allocate to money market and government securities (0-20%) to manage liquidity and generate capital appreciation
QUANTITATIVE INFORMATION $
Yield to Maturity 7.70%
Modified Duration 2.38 Years
Average Maturity 3.06 Years
MATURITY PROFILE
% Allocation
Net Current Assets 3.43%
0 to 3 Months 16.07%
6 to 12 Months 7.21%
1 -2 years 8.88%
Greater than 2 years 64.40%
PORTFOLIO
Name of the Instruments RATING % to NAV
Debt Instruments 73.97Power Grid Corporation of India Ltd AAA(CRISIL) 18.88Tata Motors Ltd AA+(CARE) 15.21Power Finance Corporation Ltd AAA(CRISIL) 11.29Indiabulls Housing Finance Ltd AAA(CARE) 10.79L&T Infrastructure Finance Ltd AA+(CARE) 7.21L&T Housing Finance Ltd AA+(CARE) 7.20Blue Dart Express Ltd AA(ICRA) 1.68Blue Dart Express Ltd AA(ICRA) 0.97Blue Dart Express Ltd AA(ICRA) 0.74
Government Securities 6.538.21% RAJASTHAN SDL 31-MAR-21 Sovereign 6.53
CBLO 16.07
Other Current Assets 3.43
Grand Total ( Net Asset) 100.00
ASSET ALLOCATION
RATING PROFILE (% to net assets)
lIncome/ Capital appreciation over medium term to long term.
lInvestment in a wide range of debt securities and Money Market Instruments of various maturities and risk profile and a small portion of investment in Equity and Equity Related Instruments
This product is suitable for investors who are seeking*:
*Investors should consult their financial advisers if in doubt whether the product is suitable for themInvestors understand that their principal
will be at Moderate Risk
FUND INFORMATION
CATEGORY: Open Ended Debt Scheme
SCHEME OBJECTIVE : To generate regular income by investing in a wide range of debt securities and Money Market Instruments of various maturities and risk profile and a small portion of investment in Equity and Equity Related Instruments. However, there can be no assurance that the investment objective of the Scheme will be realized.
NAV : (as on July 29, 2016)Direct Plan - Growth Option ` 15.0013Regular Plan - Growth Option ` 14.6063Direct Plan - Monthly Dividend Option ` 14.6854Regular Plan - Monthly Dividend Option ` 14.0445Regular Plan - Quarterly Dividend Option ` 14.2364Direct Plan - Quarterly Dividend Option ` 14.6317
DAT E OF ALLOTMENT : 25 April, 2011
ASSET ALLOCATION :
Indian Debt and Money Market Instruments: 90% - 100%
Equity and Equity related Instruments: 0% - 10%
MINIMUM INVESTMENT :
Lumpsum: ̀ 5000 in multiples of ̀ 1 thereafter
SIP/STP/SWP: For monthly frequency - ̀ 1000 and in multiples of ̀ 1 thereafter
For quarterly frequency - ` 2000 and in multiples of ̀ 1 thereafter
PLANS/OPTIONS :
Regular Plan- Growth OptionRegular Plan- Monthly Dividend Payout / Reinvestment OptionRegular Plan- Quarterly Dividend Payout/ Reinvestment Option
Direct Plan- Growth OptionDirect Plan- Monthly Dividend Payout / Reinvestment OptionDirect Plan- Quarterly Dividend Payout/ Reinvestment Option
ENTRY LOAD: Nil
EXPENSE RATIO^:
Regular Plan : 1.50%
Direct Plan : 0.55%
BENCHMARK: Crisil MIP Blended Index
FUND MANAGER : 1) Mr. Ravi Gopalakrishnan
2) Ms. Suman Prasad
TOTAL EXPERIENCE : 1) 23 Years
2) 18 Years
MANAGING THIS FUND : 1) Since 16-Sep-12
2) Since 16-Sep-12
#Monthend AUM : ` 27.85 Crores
Monthly AVG AUM : ` 28.10 Crores
EXIT LOAD:
0.50% if redeemed/switched out within 180 days from the date of allotment.
Nil - if redeemed/switched out after 180 days from the date of allotment.
(as on July 29,2016)
24
RISKOMETER
CBLO/REPO/Reverse Repo & Net Current Assets 19.50%
AAA & Equivalent 40.95%
AA+ & Equivalent
29.62%
AA & Equivalent
3.39%
Treasury Bills/Sovereign
6.53%
CBLO/REPO/Reverse Repo & Net Current Assets 19.50%
NCDs/Bonds 73.96%
Treasury Bills/ Sovereign
6.53%

PORTFOLIO
Name of the Instruments % to NAV
Mutual Fund Investments 98.55Canara Robeco Gold ETF 98.55
CBLO 1.80
Other Current Assets -0.35
Grand Total ( Net Asset) 100.00
$ (for remaining disclaimer Please refer page no. 39) Monthend AUM as on 29.07.2016= ^The expense ratios mentioned for the schemes excludes additional service tax on investment management fees.= Please refer page no. 39 for disclaimers.
Source ICRA MFI Explorer = #
CANARA ROBECO GOLD SAVINGS FUND (CRGSF)
RATING PROFILE (% to net assets)
CBLO/REPO/Reverse Repo & Net Current Assets : 100.00%
PRODUCT POSITIONING
Canara Robeco Gold Savings Fund is aimed at investors who want to benefit from movements in gold prices without holding physical gold. It follows a passive investment strategy and seeks to provide returns that closely correspond to the returns provided by Canara Robeco Gold ETF.
ASSET ALLOCATION
lCapital appreciation that closely correspond to returns provided by Canara Robeco Gold Exchange Traded Fund
lInvestment in units of Canara Robeco Gold Exchange Traded Fund
This product is suitable for investors who are seeking*:
*Investors should consult their financial advisers if in doubt whether the product is suitable for them
MATURITY PROFILE
% Allocation
Net Current Assets -0.35%
Investors understand that their principalwill be at Moderately High Risk
(as on July 29,2016)
FUND INFORMATION
CATEGORY : An Open Ended Fund of Fund
SCHEME OBJECTIVE : The investment objective of the Scheme is to provide returns that closely correspond to the returns provided by Canara Robeco Gold Exchange Traded Fund .
NAV : Direct Plan - Dividend Option ` 9.5855Regular Plan - Dividend Option ` 9.5642Direct Plan - Growth Option ` 9.6055Regular Plan - Growth Option ` 9.5584
DAT E OF ALLOTMENT : June 25, 2012
ASSET ALLOCATION :
Units of Canara Robeco Gold ETF : 95%-100%Debt and Money Market Instruments (Including Cash Equivalent) and Mutual fund Schemes which invest predominantly in the money market securities or Liquid Schemes : 0%-5%
MINIMUM INVESTMENT:
Lumpsum: ̀ 5,000 in multiples of ̀ 1 thereafter
SIP/STP/SWP: - ̀ 500 and ̀ 1,000 respectively for Monthly and Quarterly frequency respectively and in multiples of ̀ 1 thereafter.
PLANS / OPTIONS :
Regular Plan- Growth Option Regular Plan- Dividend Reinvestment Option/ Payout OptionDirect Plan- Growth OptionDirect Plan- Dividend Reinvestment Option/Payout Option
ENTRY LOAD: Nil
EXPENSE RATIO^:
Regular Plan : 0.59%Direct Plan : 0.44%
BENCHMARK : Price of Physical Gold
FUND MANAGER : 1) Mr. Avnish Jain2) Mr. Kiran Shetty
22 Years
#Monthend AUM : ` 69.01 Crores
Monthly AVG AUM : ` 70.29 Crores
EXIT LOAD:
2% if redeemed / switched – out within 1 year from the date of allotment
(as on July 29, 2016)
TOTAL EXPERIENCE: 1)2) 9 Years
MANAGING THIS FUND: 1) Since 7-Oct-13
2) Since 25-Jun-15
25
RISKOMETER
Gold ETFs98.55%
CBLO/REPO/Reverse
Repo & Net Current Assets1.45%

$ (for remaining disclaimer Please refer page no. 39) Monthend AUM as on 29.07.2016= ^The expense ratios mentioned for the schemes excludes additional service tax on investment management fees.
= Please refer page no. 39 for disclaimers.
Source ICRA MFI Explorer = # 26
CANARA ROBECO GOLD EXCHANGE TRADED FUND (CRGETF)
lCapital appreciation over long term that are in line with the performance of gold, subject to tracking errors
lInvestment predominantly in Gold bullion of 0.995 fineness
This product is suitable for investors who are seeking*:
*Investors should consult their financial advisers if in doubt whether the product is suitable for themInvestors understand that their principal
will be at Moderately High Risk
(as on July 29,2016)
PORTFOLIO
Name of the Instruments % to NAV
GOLD 995 1KG BAR 98.25
CBLO 1.95
Other Current Assets -0.20
Grand Total ( Net Asset) 100.00
GOLD
PRODUCT POSITIONING
Canara Robeco Gold Exchange Traded Fund is for investors who want to benefit from movement in gold prices without holding physical gold. It follows passive investment strategy and is benchmarked to price of physical gold. It endeavours to track and provide returns similar to its benchmark ie. prices of domestic gold through investment in physical gold and money market instruments
RATING PROFILE (% to net assets)
CBLO/REPO/Reverse Repo & Net Current Assets : 100.00%
ASSET ALLOCATION
MATURITY PROFILE% Allocation
Net Current Assets -0.20%
TRACKING ERROR
Annualised Tracking error for Gold ETF as of 2016 is 0.08(Period: July 2013 to July 2016).
Source: Internal Calculation, Domestic Price of Gold- Nova Scotia Bank
July
FUND INFORMATION
CATEGORY : An Open Ended Exchange Traded Fund
SCHEME OBJECTIVE : The investment objective of the Scheme is to generate returns that are in line with the performance of gold, subject to tracking errors.
NAV : (as on July 29, 2016) : 2,932.3113
DAT E OF ALLOTMENT : 19th March 2012
ASSET ALLOCATION :
Physical Gold : 95%-100%
Debt & Money Market Instruments (including Cash & Cash equivalents): 0%-5%
The Scheme will invest in physical gold of the prescribed quality and standard.
MINIMUM INVESTMENT:
Directly with the Fund – Subscription / Redemption in exchange of Portfolio Deposit and Cash Component in creation unit size of 1,000 units and in multiples thereafter. # On the Exchange – 1 unit and in multiples of 1 unit thereafter.
# For Large Investors, subscriptions shall only be allowed by payment of requisite Cash through RTGS/NEFT or Funds Transfer Letter/ Transfer Cheque of a bank where the Scheme has a collection account.
PLANS / OPTIONS : Nil
Exchange Listed : National Stock Exchange / BSE
ENTRY LOAD: Nil -
EXPENSE RATIO^:
Regular Plan : 1.00%Direct Plan : N.A.
BENCHMARK : Domestic Price of gold
FUND MANAGER : 1) Mr. Avnish Jain 2) Mr. Kiran Shetty
22 Years
#Monthend AUM : ` 76.80 Crores
Monthly AVG AUM : ` 78.79 Crores
EXIT LOAD: Nil - for redemption of the units through Stock Exchange.
`
TOTAL EXPERIENCE: 1)
2) 9 Years
MANAGING THIS FUND: 1) Since 25-Jun-14
2) Since 1-Apr-12
RISKOMETER
Gold 98.25%
CBLO/REPO/Reverse
Repo & Net Current Assets1.75%

PERFORMANCE AT A GLANCE (as on June 30,2016)
EQUITY SCHEMES
# # # $Scheme Benchmark = Additional Benchmark NAV per unit for since inception is as of and for others is as of beginning of the period. Load is not taken into consideration for computation of returns. Returns of dividend option under the scheme for the investor would be net of distribution tax as applicable.
= =30-June-2016
CANARA ROBECO EQUITY DIVERSIFIED Fund Manager: Mr. Ravi Gopalakrishnan / Mr. Shridatta Bhandwaldar
Period Returns (%) Current Value of Standard Investment of ` 10000
The past performance may or may not be sustained in the future. Returns are based on growth NAV of and are calculated on compounded annualized basis for a period of more than (or equal to) a year and absolute basis for a period less than a year. Inception Date: September 16, 2003 = w.e.f. 5th July 2016 Mr. Shridatta Bhandwaldar is also the Fund Manager of Canara Robeco Equity Diversified
Regular plan
NAV Per Unit (`) Scheme Sensex Scheme
Since Inception (CAGR) 91.21 18.86 15.55 15.49 91210 63572 63161
30 June’2015 to ’2016 95.03 -4.02 0.41 -2.81
14 to 15 83.11 14.34 12.01 9.31 NOT APPLICABLE
13 to 14 60.24 37.96 34.45 31.03
$ # ## # ##S&P BSE 200 S&P S&P BSE 200 S&P Sensex
30 June
30 June 30 June
30 June’20 30 June’20
’20 ’20
CANARA ROBECO INFRASTRUCTURE Fund Manager: Mr. Yogesh Patil
Period Returns (%) Current Value of Standard Investment of ` 10000
The past performance may or may not be sustained in the future. Returns are based on growth NAV of and are calculated on compounded annualized basis for a period of more than (or equal to) a year and absolute basis for a period less than a year. Inception Date: December 2, 2005
Regular plan
NAV Per Unit ( ) Scheme Scheme
Since Inception (CAGR) 38.10 13.47 11.16 10.98 38100 30649 30128
37.53 1.52 -0.40 -2.81
31.08 20.75 9.32 9.31 NOT APPLICABLE
20.46 51.91 33.44 31.03
$ # ## # ## S&P BSE 100 S&P Sensex S&P BSE 100 S&P Sensex`
30 June’2015 to 30 June’2016
30 June’2014 to 30 June’2015
30 June’2013 to 30 June’2014
CANARA ROBECO EQUITY TAX SAVER Fund Manager: Mr. Yogesh Patil
The past performance may or may not be sustained in the future. Returns are based on dividend NAV of Regular plan assuming reinvestment of dividend and are calculated on compounded annualized basis for a period of more than (or equal to) a year and absolute basis for a period less than a year. Inception Date: March 31, 1993
Period Returns (%) Current Value of Standard Investment of ` 10000
Scheme S&P BSE 100 Scheme
Since Inception (CAGR) 22.84 14.66 12.09 11.21 212628 142299 118393
25.19 -1.83 -0.40 -2.81
23.17 17.35 9.32 9.31 NOT APPLICABLE
17.32 38.11 33.44 31.03
$ # ## # ## NAV Per Unit ( ) S&P Sensex S&P BSE 100 S&P Sensex`
30 June’2015 to 30 June’2016
30 June’2014 to 30 June’2015
30 June’2013 to 30 June’2014
CANARA ROBECO EMERGING EQUITIES Fund Manager: Mr. Ravi Gopalakrishnan
The past performance may or may not be sustained in the future. Returns are based on growth NAV of and are calculated on compounded annualized basis for a period of more than (or equal to) a year and absolute basis for a period less than a year. Inception Date: March 11, 2005.
Regular plan
Period Returns (%) Current Value of Standard Investment of ` 10000
Scheme Nifty Free Float Scheme
Since Inception (CAGR) 63.38 17.73 14.10 12.88 63380 44488 39394
58.97 7.48 6.20 -2.81
43.51 35.53 17.24 9.31 NOT APPLICABLE
23.46 85.46 51.13 31.03
$ ## ## NAV Per Unit ( ) S&P Sensex S&P Sensex` Nifty Free Float # #Midcap 100 Midcap 100
30 June’2015 to 30 June’2016
30 June’2014 to 30 June’2015
30 June’2013 to 30 June’2014
Period Returns (%) Current Value of Standard Investment of ` 10000
CANARA ROBECO F.O.R.C.E FUND Fund Manager: Mr. Hemang Kapasi
The past performance may or may not be sustained in the future. Returns are based on growth NAV and are calculated on compounded annualized basis for a period of more than (or equal to) a year and absolute basis for a period less than a year. Inception Date: September 14, 2009
Scheme Nifty 50 Scheme Nifty 50
Since Inception (CAGR) 26.53 15.44 8.34 7.79 26530 17235 16652
25.83 2.71 -0.96 -2.81
19.83 30.26 9.95 9.31 NOT APPLICABLE
15.47 28.18 30.28 31.03
$ # ## # ## NAV Per Unit (`) S&P Sensex S&P Sensex
30 June’2015 to 30 June’2016
30 June’2014 to 30 June’2015
30 June’2013 to 30 June’2014
27

INCOME / DEBT SCHEMES
PERFORMANCE AT A GLANCE (as on June 30,2016)
EQUITY SCHEMES
# # # $Scheme Benchmark = Additional Benchmark NAV per unit for since inception is as of and for others is as of beginning of the period. Load is not taken into consideration for computation of returns. Returns of dividend option under the scheme for the investor would be net of distribution tax as applicable.
= =30-June-2016
CANARA ROBECO LARGE CAP+ FUND Fund Manager: Mr. Ravi Gopalakrishnan / Mr. Shridatta Bhandwaldar
Period Returns (%) Current Value of Standard Investment of ` 10000
The past performance may or may not be sustained in the future. Returns are based on growth NAV of Regular plan and are calculated on compounded annualized basis for a period of more than (or equal to) a year and absolute basis for a period less than a year. Inception Date: August 20, 2010 = w.e.f. 5th July 2016 Mr. Shridatta Bhandwaldar is also the Fund Manager of Canara Robeco Large Cap+ Fund
NAV Per Unit ( ) Scheme Scheme
Since Inception (CAGR) 17.46 9.97 6.86 6.75 17460 14755 14672
17.48 -0.11 -0.40 -2.81
15.34 13.95 9.32 9.31 NOT APPLICABLE
11.62 32.01 33.44 31.03
$ # ## # ## S&P BSE 100 S&P Sensex S&P BSE 100 S&P Sensex`
30 June’2015 to 30 June’2016
30 June’2014 to 30 June’2015
30 June’2013 to 30 June’2014
CANARA ROBECO GILT PGS Fund Manager: Mr. Girish Hisaria
Period Returns (%) Current Value of Standard Investment of ` 10000
The past performance may or may not be sustained in the future. Returns are based on growth NAV of and are calculated on compounded annualized basis for a period of more than (or equal to) a year and absolute basis for a period less than a year. Inception Date: December 29, 1999.* Benchmark Index not available at the time of launch.
Regular plan
Scheme Scheme
Since Inception (CAGR) 41.36 8.98 - - 41359 - -
37.67 9.81 11.55 10.03
33.41 12.75 13.34 11.76 NOT APPLICABLE
32.82 1.80 1.71 -2.47
$ # # NAV Per Unit ( ) I-Sec-Li-Bex 10 Years I-Sec-Li-Bex 10 Years ## ##` G-Sec G-Sec
30 June’2015 to 30 June’2016
30 June’2014 to 30 June’2015
30 June’2013 to 30 June’2014
CANARA ROBECO BALANCE Fund Manager: Mr. Ravi Gopalakrishnan / Mr. Avnish Jain / Mr. Shridatta Bhandwaldar
Period Returns (%) Current Value of Standard Investment of ` 10000
The past performance may or may not be sustained in the future. Returns are based on growth NAV of and are calculated on compounded annualized basis for a period of more than (or equal to) a year and absolute basis for a period less than a year. Inception Date: February 1, 1993. * Benchmark Index not available at the time of launch. = w.e.f. 5th July 2016 Mr. Shridatta Bhandwaldar is also the Fund Manager of Canara Robeco Balance
Regular plan
CANARA ROBECO MONTHLY INCOME PLAN Fund Manager: Mr. Ravi Gopalakrishnan / Mr. Avnish Jain
Period Returns (%) Current Value of Standard Investment of ` 10000
The past performance may or may not be sustained in the future. Returns are based on dividend NAV of Regular plan assuming reinvestment of dividend and are calculated on compounded annualized basis for a period of more than (or equal to) a year and absolute basis for a period less than a year. Inception Date: April 24, 1988.* Benchmark Index not available at the time of launch.
CANARA ROBECO INCOME Fund Manager: Mr. Avnish Jain
Period Returns (%) Current Value of Standard Investment of ` 10000
The past performance may or may not be sustained in the future. Returns are based on growth NAV of and are calculated on compounded annualized basis for a period of more than (or equal to) a year and absolute basis for a period less than a year.
Regular plan Inception Date: September 19, 2002
Scheme CRISIL Balanced Fund - Scheme
Since Inception (CAGR) 115.47 11.01 - 10.44 115470 - 102488
111.30 3.75 3.12 -2.81
92.84 19.88 10.58 9.31 NOT APPLICABLE
67.72 37.09 21.01 31.03
$ ## ## NAV Per Unit ( ) S&P Sensex S&P Sensex` CRISIL Balanced Fund -# # Aggressive Index Aggressive Index
30 June’2015 to 30 June’2016
30 June’2014 to 30 June’2015
30 June’2013 to 30 June’2014
Scheme 10 Years Scheme
Since Inception (CAGR) 14.26 9.99 - - 142694 - -
14.81 4.33 8.63 10.03
14.49 10.53 11.05 11.76 NOT APPLICABLE
13.50 16.19 8.28 -2.47
$ NAV Per Unit ( ) 10 Years `# ## # ##G-Sec G-Sec
30 June’2015 to 30 June’2016
30 June’2014 to 30 June’2015
30 June’2013 to 30 June’2014
Crisil MIP Blended Crisil MIP Blended Index Index
Scheme Scheme# #Bond Fund Bond Fund
Since Inception (CAGR) 31.81 8.75 6.79 6.38 31809 24733 23460
29.47 7.94 10.19 10.03
26.61 10.74 11.10 11.76 NOT APPLICABLE
25.68 3.62 4.60 -2.47
$ NAV Per Unit ( ) CRISIL Composite 10 Years CRISIL Composite 10 Years ## ##` G-Sec G-Sec
30 June’2015 to 30 June’2016
30 June’2014 to 30 June’2015
30 June’2013 to 30 June’2014
28

PERFORMANCE AT A GLANCE (as on June 30,2016)
# # # $Scheme Benchmark = Additional Benchmark NAV per unit for since inception is as of and for others is as of beginning of the period. Load is not taken into consideration for computation of returns. Returns of dividend option under the scheme for the investor would be net of distribution tax as applicable.
= =30-June-2016
INCOME / DEBT SCHEMES
The past performance may or may not be sustained in the future. Returns are based on growth NAV of and are calculated on compounded annualized basis for a period of more than (or equal to) a year and absolute basis for a period less than a year.
Regular plan Inception Date: July 9, 2010
The past performance may or may not be sustained in the future. Returns are based on growth NAV of and are calculated on compounded annualized basis for a period of more than (or equal to) a year and absolute basis for a period less than a year.
Regular plan Inception Date: April 25, 2011
CANARA ROBECO YIELD ADVANTAGE FUND Fund Manager: Mr. Ravi Gopalakrishnan / Ms. Suman Prasad
Period Returns (%) Current Value of Standard Investment of ` 10000
CANARA ROBECO LIQUID Fund Manager: Mr. Girish Hisaria /Ms. Suman Prasad
Period Returns (%) Current Value of Standard Investment of ` 10000
The past performance may or may not be sustained in the future. Returns are based on growth NAV and are calculated on compounded annualized basis for a period of more than (or equal to) a year and absolute basis for a period less than a year. Inception Date: Retail Plan : January 15, 2002 =Institutional Plan : May 31, 2004 =Regular Plan : July 15, 2008. The face value was changed to ̀ 1000 w.e.f Aug 20, 2011
CANARA ROBECO TREASURY ADVANTAGE FUND Fund Manager: Mr. Girish Hisaria /Ms. Suman Prasad
Period Returns (%) Current Value of Standard Investment of ` 10000
The past performance may or may not be sustained in the future. Returns are based on growth NAV and are calculated on compounded annualized basis for a period of more than (or equal to) a year and absolute basis for a period less than a year. Inception Date: Retail Plan : September 16, 2003 =Institutional Plan : August 21, 2007 =Regular Plan : July 14, 2008. The face value was changed to ̀ 1000 w.e.f Aug 20, 2011
CANARA ROBECO SAVINGS PLUS FUND Fund Manager: Mr. Girish Hisaria /Ms. Suman Prasad
Period Returns (%) Current Value of Standard Investment of ` 10000
The past performance may or may not be sustained in the future. Returns are based on growth NAV of and are calculated on compounded annualized basis for a period of more than (or equal to) a year and absolute basis for a period less than a year. Inception Date: March 4, 2005
Regular plan
CANARA ROBECO INDIGO FUND Fund Manager: Mr. Avnish Jain / Mr. Kiran Shetty
Period Returns (%) Current Value of Standard Investment of ` 10000
Scheme Scheme
Since Inception (CAGR) 14.59 6.53 8.81 6.76 14594 16566 14790
13.60 7.30 12.52 10.03
13.27 2.49 4.55 11.76 NOT APPLICABLE
12.49 6.23 9.94 -2.47
$ NAV Per Unit ( ) 10 Years 10 Years ## ##` Robeco G-Sec Canara Robeco G-Sec# # Blended Gold Index Blended Gold Index
30 June’2015 to 30 June’2016
30 June’2014 to 30 June’2015
30 June’2013 to 30 June’2014
Canara
Scheme Scheme
Since Inception (CAGR) 14.40 6.70 8.76 7.30 14396 15460 14410
13.42 7.28 8.63 10.03
12.71 5.55 11.05 11.76 NOT APPLICABLE
11.74 8.27 8.28 -2.47
$ NAV Per Unit ( ) 10 Years 10 Years ## ##` Crisil MIP G-Sec Crisil MIP G-Sec# # Blended Index Blended Index
30 June’2015 to 30 June’2016
30 June’2014 to 30 June’2015
30 June’2013 to 30 June’2014
Retail # ## # ##Unit ( ) Plan Plan Plan Fund Index T-Bill Plan Plan Plan Fund Index T-Bill
Since Inception (CAGR) 2,668.72 7.02 7.40 8.19 - 5.97 26687 27458 18714 - 23123
2,477.70 7.71 7.95 7.95 7.90 7.67
2,289.57 8.22 8.59 8.75 8.77 8.54
2,114.41 8.28 8.94 9.53 9.68 5.93
Last 7 Days - 0.14 0.14 0.14 0.16 0.15 NOT APPLICABLE
Last 14 Days - 0.27 0.28 0.28 0.29 0.27
Last 30 Days - 0.59 0.61 0.61 0.64 0.61
$ NAV Per Instt. Regular Crisil Liquid 364 Day Retail Instt. Regular Crisil Liquid 364 Day `
30 June’2015 to 30 June’2016
30 June’2014 to 30 June’2015
30 June’2013 to 30 June’2014
Retail # ## # ##Unit ( ) Plan Plan Plan Fund Index Plan Plan Plan Fund Index
Since Inception (CAGR) 2,436.72 7.21 8.03 8.30 6.93 5.88 24367 25023 23440 23579 20770
2,269.01 7.39 7.64 7.73 7.90 7.67
2,090.72 8.53 8.92 9.14 8.77 8.54 NOT APPLICABLE
1,933.42 8.14 8.74 9.29 9.68 5.93
$ NAV Per Instt. Regular Crisil Liquid 364 Day Retail Instt. Regular Crisil Liquid 364 Day`
30 June’2015 to 30 June’2016
30 June’2014 to 30 June’2015
30 June’2013 to 30 June’2014
T-Bill T-Bill
Scheme Scheme# ## # ##Fund Index Fund Index
Since Inception (CAGR) 24.04 8.05 7.31 6.13 24038 22234 19634
22.23 8.15 7.90 7.67
20.42 8.86 8.77 8.54 NOT APPLICABLE
18.78 8.74 9.68 5.93
$ NAV Per Unit ( ) Crisil Liquid 364 Day Crisil Liquid 364 Day`
30 June’2015 to 30 June’2016
30 June’2014 to 30 June’2015
30 June’2013 to 30 June’2014
T-Bill T-Bill
29

CANARA ROBECO MEDIUM TERM OPPORTUNITIES FUND
Fund Manager: Mr. Avnish Jain
The past performance may or may not be sustained in the future. Returns are based on growth NAV of and are calculated on compounded annualized basis for a period of more than (or equal to) a year and absolute basis for a period less than a year.
Regular plan
Inception Date: 7th February, 2014
Period Returns (%)
PERFORMANCE AT A GLANCE (as on June 30,2016)
INCOME / DEBT SCHEMES
# # # $Scheme Benchmark = Additional Benchmark NAV per unit for since inception is as of and for others is as of beginning of the period. Load is not taken into consideration for computation of returns. Returns of dividend option under the scheme for the investor would be net of distribution tax as applicable.
= =30-June-2016
The past performance may or may not be sustained in the future. Returns are based on growth NAV and are calculated on compounded annualized basis for a period of more than (or equal to) a year and absolute basis for a period less than a year. Inception Date: March 31, 2009 =The Benchmark of Canara Robeco Short Term Fund has been changed Crisil Liquid Fund Index to CRISIL Short Term Bond Fund Index with effect from 19th May, 2014.
CANARA ROBECO SHORT TERM FUND Fund Manager: Ms. Suman Prasad
Period Returns (%) Current Value of Standard Investment of ` 10000
Regular # ## # ##Unit ( ) Plan Plan Bond Fund Index G-Sec Plan Plan Index G-Sec
Since Inception (CAGR) 17.40 7.93 8.79 8.02 6.15 17400 18423 17498 15421
16.15 7.72 12.23 8.94 10.03
14.86 8.70 8.70 9.56 11.76 NOT APPLICABLE
13.78 7.81 7.71 8.81 -2.47
$ NAV Per Instt. Crisil Short Term 10 Years Regular Instt. 10 YearsCrisil Short Term` Bond Fund
30 June’2015 to 30 June’2016
30 June’2014 to 30 June’2015
30 June’2013 to 30 June’2014
CANARA ROBECO DYNAMIC BOND FUND Fund Manager: Mr. Girish Hisaria
Period Returns (%) Current Value of Standard Investment of ` 10000
The past performance may or may not be sustained in the future. Returns are based on growth NAVof and are calculated on compounded annualized basis for a period of more than (or equal to) a year and absolute basis for a period less than a year.
Regular plan Inception Date: May 29, 2009
Scheme Scheme# ## # ##Bond Fund G-Sec Bond Fund G-Sec
Since Inception (CAGR) 17.05 7.81 7.72 5.79 17053 16947 14912
15.75 8.29 10.19 10.03
14.17 11.13 11.10 11.76 NOT APPLICABLE
13.65 3.82 4.60 -2.47
$ NAV Per Unit ( ) Crisil Composite 10 Years Crisil Composite 10 Years`
30 June’2015 to 30 June’2016
30 June’2014 to 30 June’2015
30 June’2013 to 30 June’2014
The past performance may or may not be sustained in the future. Returns are based on growth NAV of and are calculated on compounded annualized basis for a period of more than (or equal to) a year and absolute basis for a period less than a year.
Regular plan Inception
Date: 25th June, 2012
CANARA ROBECO GOLD SAVINGS FUND
Fund Manager: Mr. Avnish Jain / Mr. Kiran Shetty
Period Returns (%)
Scheme Price of
Since Inception (CAGR) 9.39 -1.55 1.59
8.32 12.90 19.00
8.97 -7.28 -4.59
$ NAV Per #Unit (`) Physical Gold
30 June’2015 to 30 June’2016
30 June’2014 to 30 June’2015
30 June’2013 to 30 June’2014 8.35 7.50 10.77
CANARA ROBECO GOLD EXCHANGE TRADED FUND
Fund Manager: Mr. Avnish Jain / Mr. Kiran Shetty
The past performance may or may not be sustained in the future. Returns are based on growth NAV of and are calculated on compounded annualized basis for a period of more than (or equal to) a year and absolute basis for a period less than a year.
Regular plan Inception
Date: 19th March, 2012
Period Returns (%)
Scheme Domestic Price
Since Inception (CAGR) 2,898.21 0.83 3.15
2,532.08 14.46 19.00
$ NAV Per #Unit (`) of Gold
30 June’2015 to 30 June’2016
30 June’2014 to 30 June’2015 2,721.97 -6.98 -4.59
30 June’2013 to 30 June’2014 2,501.41 8.82 10.77
Scheme Crisil Composite
Since Inception (CAGR) 12.50 9.34 11.16 10.54
10.49 9.56 11.10 11.76
$ NAV Per #Unit (`) Bond Fund Index
##10 Years G-Sec
30 June’2015 to 30 June’2016 11.49 8.75 10.19 10.03
30 June’2014 to 30 June’2015
30
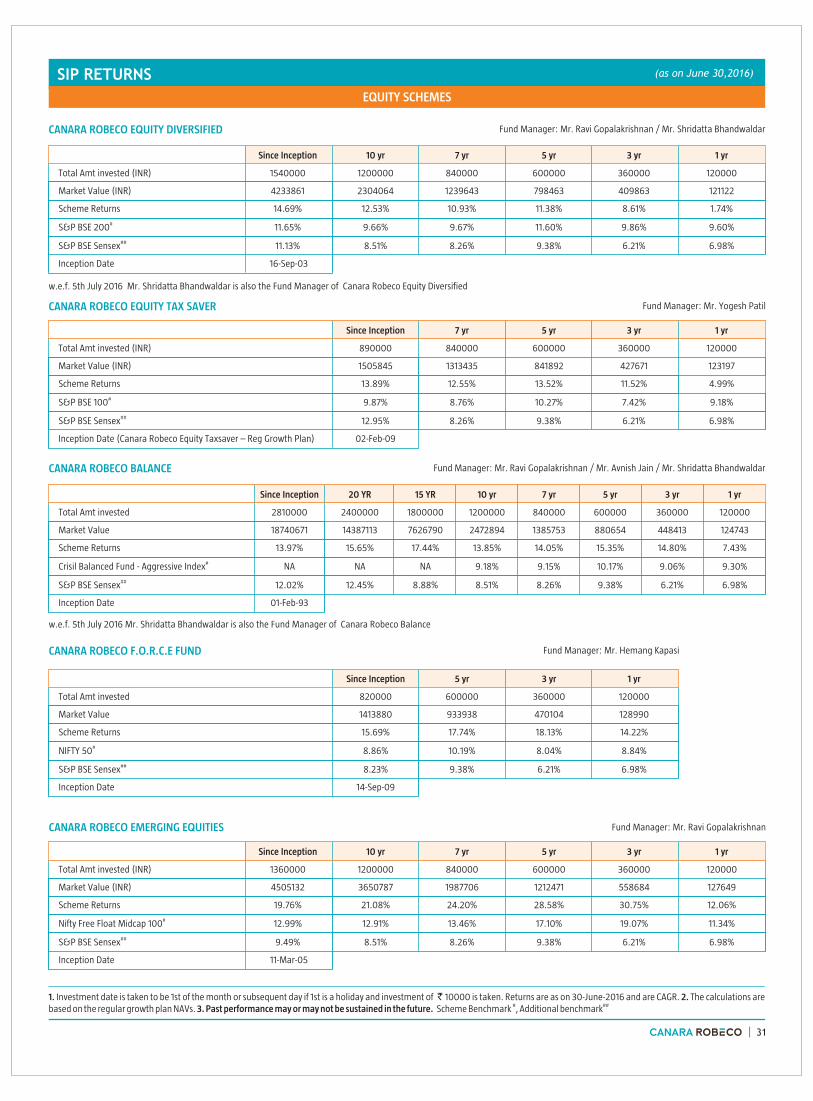
SIP RETURNS (as on June 30,2016)
EQUITY SCHEMES
31
1. Investment date is taken to be 1st of the month or subsequent day if 1st is a holiday and investment of ̀ 10000 is taken. Returns are as on and are CAGR. 2. The calculations are # ## based on the regular growth plan NAVs. 3. Past performance may or may not be sustained in the future. Scheme Benchmark , Additional benchmark
30-June-2016
CANARA ROBECO EQUITY DIVERSIFIED Fund Manager: Mr. Ravi Gopalakrishnan / Mr. Shridatta Bhandwaldar
Since Inception 10 yr 7 yr 5 yr 3 yr 1 yr
Total Amt invested (INR) 1540000 1200000 840000 600000 360000 120000
Market Value (INR) 4233861 2304064 1239643 798463 409863 121122
Scheme Returns 14.69% 12.53% 10.93% 11.38% 8.61% 1.74%
#S&P BSE 200 11.65% 9.66% 9.67% 11.60% 9.86% 9.60%
Sensex 11.13% 8.51% 8.26% 9.38% 6.21% 6.98%
Inception Date 16-Sep-03
##S&P BSE
CANARA ROBECO EQUITY TAX SAVER Fund Manager: Mr. Yogesh Patil
Since Inception 7 yr 5 yr 3 yr 1 yr
Total Amt invested (INR) 890000 840000 600000 360000 120000
Market Value (INR) 1505845 1313435 841892 427671 123197
Scheme Returns 13.89% 12.55% 13.52% 11.52% 4.99%
100 9.87% 8.76% 10.27% 7.42% 9.18%
Sensex 12.95% 8.26% 9.38% 6.21% 6.98%
#S&P BSE
##S&P BSE
Inception Date (Canara Robeco Equity Taxsaver – Reg Growth Plan) 02-Feb-09
CANARA ROBECO EMERGING EQUITIES Fund Manager: Mr. Ravi Gopalakrishnan
Since Inception 10 yr 7 yr 5 yr 3 yr 1 yr
Total Amt invested (INR) 1360000 1200000 840000 600000 360000 120000
Market Value (INR) 4505132 3650787 1987706 1212471 558684 127649
Scheme Returns 19.76% 21.08% 24.20% 28.58% 30.75% 12.06%
Nifty Free Float Midcap 100 12.99% 12.91% 13.46% 17.10% 19.07% 11.34%
Sensex 9.49% 8.51% 8.26% 9.38% 6.21% 6.98%
Inception Date
#
##S&P BSE
11-Mar-05
CANARA ROBECO F.O.R.C.E FUND Fund Manager: Mr. Hemang Kapasi
Since Inception 5 yr 3 yr 1 yr
Total Amt invested 820000 600000 360000 120000
Market Value 1413880 933938 470104 128990
Scheme Returns 15.69% 17.74% 18.13% 14.22%
NIFTY 50 8.86% 10.19% 8.04% 8.84%
Sensex 8.23% 9.38% 6.21% 6.98%
Inception Date 14-Sep-09
#
##S&P BSE
CANARA ROBECO BALANCE Fund Manager: Mr. Ravi Gopalakrishnan / Mr. Avnish Jain / Mr. Shridatta Bhandwaldar
Since Inception 20 YR 15 YR 10 yr 7 yr 5 yr 3 yr 1 yr
Total Amt invested 2810000 2400000 1800000 1200000 840000 600000 360000 120000
Market Value 18740671 14387113 7626790 2472894 1385753 880654 448413 124743
Scheme Returns 13.97% 15.65% 17.44% 13.85% 14.05% 15.35% 14.80% 7.43%
Crisil Balanced Fund - Aggressive Index NA NA NA 9.18% 9.15% 10.17% 9.06% 9.30%
Sensex 12.02% 12.45% 8.88% 8.51% 8.26% 9.38% 6.21% 6.98%
Inception Date 01-Feb-93
#
##S&P BSE
w.e.f. 5th July 2016 Mr. Shridatta Bhandwaldar is also the Fund Manager of Canara Robeco Equity Diversified
w.e.f. 5th July 2016 Mr. Shridatta Bhandwaldar is also the Fund Manager of Canara Robeco Balance

SIP RETURNS (as on June 30,2016)
32
EQUITY SCHEMES
CANARA ROBECO LARGE CAP+ FUND Fund Manager: Mr. Ravi Gopalakrishnan / Mr. Shridatta Bhandwaldar
CANARA ROBECO INFRASTRUCTURE Fund Manager: Mr. Yogesh Patil
DEBT SCHEMES
CANARA ROBECO GILT PGS Fund Manager: Mr. Girish Hisaria
Since Inception 5 yr 3 yr 1 yr
Total Amt invested 710000 600000 360000 120000
Market Value 993592 807637 417041 124195
Scheme Returns 11.25% 11.84% 9.79% 6.56%
BSE 100 9.38% 10.27% 7.42% 9.18%
Sensex 8.51% 9.38% 6.21% 6.98%
Inception Date 20-Aug-10
#S&P
##S&P BSE
1. Investment date is taken to be 1st of the month or subsequent day if 1st is a holiday and investment of ̀ 10000 is taken. Returns are as on and are CAGR. 2. The calculations are # ##based on the regular growth plan NAVs. 3. Past performance may or may not be sustained in the future. Scheme Benchmark , Additional benchmark
30-June-2016
Since Inception 15 YR 10 yr 7 yr 5 yr 3 yr 1 yr
Total Amt invested 1990000 1800000 1200000 840000 600000 360000 120000
Market Value 4326075 3598610 2034256 1301885 765392 419917 126437
Scheme Returns 8.73% 8.69% 10.18% 12.30% 9.68% 10.26% 10.14%
Isec Li Bex NA NA 9.42% 9.92% 10.61% 11.69% 11.50%
10yr G Sec Index NA NA 16.94% 7.44% 8.26% 9.57% 9.46%
Inception Date
#
##
29-Dec-99
CANARA ROBECO INCOME Fund Manager: Mr. Avnish Jain
Since Inception 10 yr 7 yr 5 yr 3 yr 1 yr
Total Amt invested 1660000 1200000 840000 600000 360000 120000
Market Value 3203268 1918122 1127883 742549 408897 124824
Scheme Returns 8.99% 9.07% 8.28% 8.46% 8.45% 7.57%
Crisil Composite Bond Fund Index 7.42% 8.22% 8.84% 9.43% 10.31% 9.68%
10yr G Sec Index 6.45% 16.94% 7.44% 8.26% 9.57% 9.46%
Inception Date
#
##
19-Sep-02
CANARA ROBECO MONTHLY INCOME PLAN Fund Manager: Mr. Ravi Gopalakrishnan / Mr. Avnish Jain
Since Inception 10 yr 7 yr 5 yr 3 yr 1 yr
Total Amt invested 1640000 1200000 840000 600000 360000 120000
Market Value 3472745 1965895 1160667 758896 409516 123374
Scheme Returns 10.33% 9.54% 9.09% 9.34% 8.56% 5.27%
Crisil MIP Blended Index NA 8.58% 9.01% 9.71% 10.10% 9.67%
10yr G Sec Index NA 16.94% 7.44% 8.26% 9.57% 9.46%
Inception Date 24-April-88
#
##
Since Inception 10 yr 7 yr 5 yr 3 yr 1 yr
Total Amt invested (INR) 1270000 1200000 840000 600000 360000 120000
Market Value (INR) 2511285 2283331 1335431 905713 477803 125880
Scheme Returns 12.32% 12.36% 13.02% 16.49% 19.29% 9.24%
BSE 100 9.28% 8.98% 8.76% 10.27% 7.42% 9.18%
Sensex 8.70% 8.51% 8.26% 9.38% 6.21% 6.98%
#S&P
##S&P BSE
Inception Date 02-Dec-05
w.e.f. 5th July 2016 Mr. Shridatta Bhandwaldar is also the Fund Manager of Canara Robeco Large Cap+ Fund

Since Inception 5 yr 3 yr 1 yr
Total Amt invested 860000 600000 360000 120000
Market Value 1181667 753579 411335 125131
Scheme Returns 8.72% 9.05% 8.86% 8.05%
Crisil Composite Bond Fund Index 8.78% 9.43% 10.31% 9.68%
10yr G Sec Index 7.36% 8.26% 9.57% 9.46%
#
##
Inception Date 29-May-09
SIP RETURNS (as on June 30,2016)
DEBT SCHEMES
33
1. Investment date is taken to be 1st of the month or subsequent day if 1st is a holiday and investment of ̀ 10000 is taken. Returns are as on and are CAGR. 2. The calculations are # ##based on the regular growth plan NAVs. 3. Past performance may or may not be sustained in the future. Scheme Benchmark , Additional benchmark
30-June-2016
CANARA ROBECO DYNAMIC BOND FUND Fund Manager: Mr. Girish Hisaria
CANARA ROBECO TREASURY ADVANTAGE FUND Fund Manager: Mr. Girish Hisaria /Ms. Suman Prasad
CANARA ROBECO SHORT TERM FUND Fund Manager: Ms. Suman Prasad
CANARA ROBECO INDIGO FUND Fund Manager: Mr. Avnish Jain / Mr. Kiran Shetty
Since Inception 7 yr 5 yr 3 yr 1 yr
Total Amt invested 960000 840000 600000 360000 120000
Market Value 1364747 1146955 748145 408777 124843
Scheme Returns 8.61% 8.75% 8.76% 8.43% 7.60%
Crisil Liquid Fund Index 8.18% 8.39% 8.58% 8.41% 7.94%
1 yr T- bill index 7.06% 7.29% 7.69% 7.96% 7.35%
Inception Date 14-July-08
#
##
Since Inception 5 yr 3 yr 1 yr
Total Amt invested 720000 600000 360000 120000
Market Value 844085 674907 390205.724 125775.5
Scheme Returns 5.23% 4.65% 5.31% 9.08%
Composite Gold Index 8.05% 7.75% 9.55% 17.06%
10yr G Sec Index 7.85% 8.26% 9.57% 9.46%
Inception Date
#
##
09-Jul-10
CANARA ROBECO SAVINGS PLUS FUND Fund Manager: Mr. Girish Hisaria /Ms. Suman Prasad
Since Inception 10 yr 7 yr 5 yr 3 yr 1 yr
Total Amt invested 1360000 1200000 840000 600000 360000 120000
Market Value 2231525 1860705 1147644 748326 409368 125173
Scheme Returns 8.40% 8.50% 8.77% 8.77% 8.53% 8.12%
Crisil Liquid Fund Index 7.69% 7.96% 8.39% 8.58% 8.41% 7.94%
1 yr T- bill index 6.64% 6.79% 7.29% 7.69% 7.96% 7.35%
Inception Date
#
##
04-Mar-05
Since Inception 7 yr 5 yr 3 yr 1 yr
Total Amt invested 880000 840000 600000 360000 120000
Market Value 1198498 1129493 740758 465946 124729
Scheme Returns 8.28% 8.32% 8.37% 17.50% 7.42%
Crisil Short-Term Bond Fund Index 8.70% 8.79% 9.15% 9.25% 8.89%
10yr G-sec Index 7.29% 7.44% 8.26% 9.57% 9.46%
#
##
Inception Date 31-Mar-09

SIP RETURNS (as on June 30,2016)
34
DEBT SCHEMES
CANARA ROBECO MEDIUM TERM OPPORTUNITIES FUND Fund Manager: Mr. Avnish Jain
CANARA ROBECO YIELD ADVANTAGE FUND Fund Manager: Mr. Ravi Gopalakrishnan / Ms. Suman Prasad
Since Inception 1 yr
Total Amt invested 290000 120000
Market Value 320998 124921
Scheme Returns 8.35% 7.72%
Crisil Composite Bond Fund Index 10.20% 9.68%
10yr G Sec Index 9.99% 9.46%
Inception Date 07-Feb-15
#
##
Since Inception 3 yr 1 yr
Total Amt invested 630000 360000 120000
Market Value 758365 399304 124549
Scheme Returns 7.00% 6.85% 7.13%
Crisil MIP Blended Index 9.40% 10.10% 9.67%
10yr G Sec Index 15.67% 9.57% 9.46%
Inception Date 25-Apr-11
#
##
1. Investment date is taken to be 1st of the month or subsequent day if 1st is a holiday and investment of ̀ 10000 is taken. Returns are as on and are CAGR. 2. The calculations are # ##based on the regular growth plan NAVs. 3. Past performance may or may not be sustained in the future. Scheme Benchmark , Additional benchmark
30-June-2016
CANARA ROBECO GOLD SAVINGS FUND Fund Manager: Mr. Avnish Jain / Mr. Kiran Shetty
Since Inception 3 yr 1 yr
Total Amt invested 490000 360000 120000
Market Value 510490 385980 134358
Scheme Returns 1.98% 4.58% 23.00%
Domestic Price of Gold (Per KG) 5.74% 9.91% 33.50%
Inception Date 25-Jun-12
#

Canara Robeco Infrastructure
30.08.2013 0.85 13.80
22.08.2014 1.30 24.08
28.08.2015 1.65 25.91
Direct Plan
30.08.2013 0.85 14.08
22.08.2014 1.30 24.73
Regular Plan
Date ofdeclaration (Record Date)
Dividend Distribution
per unit*
NAV as on the date
of declaration
DIVIDEND HISTORY
* On face value of ̀ 10. = For Daily, Weekly & Monthly dividend history of Canara Robeco Liquid Fund, Canara Robeco Treasury Advantage Fund & Canara Robeco Short Term Fund Visit : www.canararobeco.com
Past performance may or may not be sustained in the future. Pursuant to payment of dividend, the NAV of the dividend option of the scheme would fall to the extent of payout and statutory levy (if applicable).
Date ofdeclaration (Record Date)
Dividend Distribution
per unit*
NAV as on the date
of declaration
Canara Robeco F.O.R.C.E Fund
26.07.2013 0.85 14.5100
25.07.2014 1.00 17.7100
31.07.2015 1.30 22.4700
29.07.2016 1.20 21.8600
Regular Plan
35
Date ofdeclaration (Record Date)
Dividend Distribution
per unit*
NAV as on the date
of declaration
Canara Robeco Savings Plus Fund
09.12.2005 0.3267 (Others) 10.4499
0.3508 (Ind. & HUF) 10.4499
28.02.2011 0.50 14.4809
09.03.2011 0.50 14.0135
Canara Robeco Monthly Income Plan(Monthly Dividend Option)
Date ofdeclaration (Record Date)
Dividend Distribution
per unit*
NAV as on the date
of declaration
27.02.2015 0.10 15.3610
27.03.2015 0.10 15.1380
24.04.2015 0.10 15.0939
29.05.2015 0.10 15.1024
26.06.2015 0.10 14.9300
31.07.2015 0.10 15.1793
28.08.2015 0.10 14.8552
24.09.2015 0.10 14.7969
30.10.2015 0.10 14.9194
27.11.2015 0.10 14.7981
23.12.2015 0.10 14.6799
29.01.2016 0.10 14.2831
26.02.2016 0.10 13.7064
23.03.2016 0.10 14.1969
29.04.2016 0.10 14.2860
27.05.2016 0.10 14.2710
24.06.2016 0.10 14.2047
29.07.2016 0.10 14.6551
Direct Plan
27.02.2015 0.10 15.6685
27.03.2015 0.10 15.4504
24.04.2015 0.10 15.4145
29.05.2015 0.10 15.4372
26.06.2015 0.10 15.2789
31.07.2015 0.10 15.5567
28.08.2015 0.10 15.2409
24.09.2015 0.10 15.1972
30.10.2015 0.10 15.3481
27.11.2015 0.10 15.2409
23.12.2015 0.10 15.1358
29.01.2016 0.10 14.7477
26.02.2016 0.10 14.1659
23.03.2016 0.10 14.6850
29.04.2016 0.10 14.7925
27.05.2016 0.10 14.7927
24.06.2016 0.10 14.7404
29.07.2016 0.10 15.2249
Quarterly Dividend Option
Regular Plan
27.03.2015 0.30 15.5593
26.06.2015 0.30 15.3524
29.09.2015 0.30 15.2783
23.12.2015 0.30 15.1088
23.03.2016 0.30 14.6277
17.06.2016 0.30 14.6526
Direct Plan
27.03.2015 0.30 15.8980
26.06.2015 0.30 15.7287
29.09.2015 0.30 15.7097
23.12.2015 0.30 15.5900
23.03.2016 0.30 15.1422
17.06.2016 0.30 15.2133
Regular Plan
Date ofdeclaration (Record Date)
Dividend Distribution
per unit*
NAV as on the date
of declaration
Canara Robeco Large Cap+ Fund
28.11.2014 1.20 17.45
27.11.2015 1.25 15.81
Regular Plan
Date ofdeclaration (Record Date)
Dividend Distribution
per unit*
NAV as on the date
of declaration
Canara Robeco Equity Tax Saver
Regular Plan
20.12.2013 0.75 18.48
10.10.2014 1.00 24.68
27.02.2015 1.00 27.22
06.11.2015 1.00 24.49
26.02.2016 0.89 20.15
Date ofdeclaration (Record Date)
Dividend Distribution
per unit*
NAV as on the date
of declaration
Canara Robeco Emerging Equities
22.06.2007 3.00 15.39
Regular Plan
29.11.2013 1.05 17.58
28.11.2014 2.70 35.38
27.11.2015 2.20 37.54
Date ofdeclaration (Record Date)
Dividend Distribution
per unit*
NAV as on the date
of declaration
Canara Robeco Balance
Regular Plan
Monthly Dividend Option
29.01.2016 0.60 73.73
26.02.2016 0.60 66.55
23.03.2016 0.60 72.18
29.04.2016 0.60 73.74
27.05.2016 0.60 73.94
24.06.2016 0.60 73.93
29.07.2016 0.60 78.57
Direct Plan
Monthly Dividend Option
29.01.2016 0.60 74.54
26.02.2016 0.60 67.34
23.03.2016 0.60 73.10
29.04.2016 0.60 74.74
27.05.2016 0.60 75.01
24.06.2016 0.60 75.06
29.07.2016 0.60 79.84
Date ofdeclaration (Record Date)
Dividend Distribution
per unit*
NAV as on the date
of declaration
Canara Robeco Income
Regular Plan
27.03.2015 0.20 14.2034
26.06.2015 0.20 13.9535
29.09.2015 0.20 14.2348
23.12.2015 0.20 14.0407
23.03.2016 0.20 14.0555
17.06.2016 0.20 14.1154
Quarterly Dividend Option - Direct Plan
27.03.2015 0.20 14.3886
26.06.2015 0.20 14.1591
29.09.2015 0.20 14.4701
23.12.2015 0.20 14.2951
23.03.2016 0.20 14.3356
17.06.2016 0.20 14.4250
Quarterly Dividend Option -
Date ofdeclaration (Record Date)
Dividend Distribution
per unit*
NAV as on the date
of declaration
Canara Robeco Equity Diversified
14.10.2011 1.00 23.03
Regular Plan
25.10.2013 2.10 27.99
17.10.2014 2.80 34.20
30.10.2015 2.50 34.57

Date ofdeclaration (Record Date)
Dividend Distribution
per unit*
NAV as on the date
of declaration
Canara Robeco Yield Advantage Fund
29.01.2016 0.06 13.7680
26.02.2016 0.06 13.6589
23.03.2016 0.06 13.7920
29.04.2016 0.06 13.8783
27.05.2016 0.06 13.8750
24.06.2016 0.06 13.8752
29.07.2016 0.06 14.0445
Direct Plan
29.01.2016 0.06 14.0913
26.02.2016 0.06 13.9859
23.03.2016 0.06 14.1293
29.04.2016 0.06 14.4103
27.05.2016 0.06 14.4796
24.06.2016 0.06 14.4930
29.07.2016 0.06 14.6854
Quarterly Dividend Option
Regular Plan
23.03.2016 0.18 14.0967
17.06.2016 0.18 14.1688
Direct Plan
23.03.2016 0.18 14.4357
17.06.2016 0.18 14.5416
Monthly Dividend Option
Regular Plan
DIVIDEND HISTORY
Date ofdeclaration (Record Date)
Dividend Distribution
per unit*
NAV as on the date
of declaration
Canara Robeco Gilt PGS Fund
20.12.2013 0.37 12.3226
20.06.2014 0.35 12.8805
31.12.2014 0.40 13.6628
26.06.2015 0.40 13.5912
23.12.2015 0.40 13.7057
24.06.2016 0.40 13.9683
Direct Plan
20.12.2013 0.37 12.3426
20.06.2014 0.35 12.9282
31.12.2014 0.40 13.7442
26.06.2015 0.40 13.7047
23.12.2015 0.40 13.8634
24.06.2016 0.40 14.1721
Regular Plan
Date ofdeclaration (Record Date)
Dividend Distribution
per unit*
NAV as on the date
of declaration
Canara Robeco Dynamic Bond Fund
20.12.2013 0.37 12.2913
20.06.2014 0.35 12.6800
31.12.2014 0.39 13.3433
26.06.2015 0.40 13.2629
23.12.2015 0.40 13.3071
24.06.2016 0.40 13.4407
Direct Plan
20.12.2013 0.37 12.3200
20.06.2014 0.35 12.7361
31.12.2014 0.39 13.4389
26.06.2015 0.40 13.4008
23.12.2015 0.40 13.4853
24.06.2016 0.40 13.6734
Regular Plan
Date ofdeclaration (Record Date)
Dividend Distribution
per unit*
NAV as on the date
of declaration
Canara Robeco InDiGo
Regular Plan
26.09.2014 0.15 10.7078
31.12.2014 0.10 10.6805
27.03.2015 0.10 10.6885
26.06.2015 0.10 10.6283
29.09.2015 0.10 10.6462
23.12.2015 0.10 10.5251
23.03.2016 0.10 10.7848
17.06.2016 0.10 10.9058
Quarterly Dividend Option
Direct Plan
26.09.2014 0.15 11.1222
31.12.2014 0.10 11.1219
27.03.2015 0.10 11.1533
26.06.2015 0.10 11.1158
29.09.2015 0.10 11.1592
23.12.2015 0.10 11.0548
23.03.2016 0.10 11.3515
17.06.2016 0.10 11.5031
Quarterly Dividend Option
36
* On face value of ̀ 10. = For Daily, Weekly & Monthly dividend history of Canara Robeco Liquid Fund, Canara Robeco Treasury Advantage Fund & Canara Robeco Short Term Fund Visit : www.canararobeco.com
Past performance may or may not be sustained in the future. Pursuant to payment of dividend, the NAV of the dividend option of the scheme would fall to the extent of payout and statutory levy (if applicable).
Date ofdeclaration (Record Date)
Dividend Distribution
per unit*
NAV as on the date
of declaration
Canara Robeco Medium TermOpportunities Fund
28.11.2014 0.32 10.9937
29.05.2015 0.30 11.1100
27.11.2015 0.30 11.2040
27.05.2016 0.34 11.3020
Direct Plan
28.11.2014 0.32 11.0052
29.05.2015 0.30 11.1324
27.11.2015 0.30 11.2594
27.05.2016 0.34 11.4032
Regular Plan

Total Expense Ratio
Expressed as an annualized percentage, it is the ratio of all the expenses of the fund to the total assets of the fund and includes the fund management fees paid to the asset management company for managing the fund's assets.
Sharp Ratio
The Sharpe Ratio, named after its founder, the Nobel Laureate William Sharpe, is a measure of risk-adjusted returns. It is calculated using standard deviation and excess return to determine reward per unit or risk.
Beta Ratio
Beta is a measure of an investment's volatility vis-à-vis the market. Beta of less than 1 means that the security will be less volatile than the market. A beta of greater than 1 implies that the security's price will be more volatile than the market.
Portfolio Turnover Ratio
It is a measure of how often assets within a fund are churned.
Modified Duration
Modified duration is the price sensitivity and the percentage change in price for a unit changes in yield.
Average Maturity
It is the weighted average of residual maturity of debt securities in a fund portfolio
Portfolio Yield
Weighted Average valuation yield of the assets
Standard Deviation
Standard Deviation is a statistical measure of the range of an investment's performance. When a mutual fund has a high standard deviation, its means its range of performance is wide, implying greater volatility.
Risk Free Return
It represents the rate of return an investor could have earned by investing in a security which is believed to have zero investment risk over the specified period of time.
Tracking Error
Tracking error is a measure of how closely is a scheme able to imitate the index to which it is benchmarked. It is the standard deviation of the difference between the scheme and index returns.
R-Squared:
It is a statistical measure of how closely the portfolio returns are correlated with its benchmark.
DEFINITIONS
37
Fund ManagerAn employee of the asset management company who manages investments of the scheme. He is usually part of a larger team of fund managers and research analysts.
Minimum Application Amount for Fresh SubscriptionThis is the minimum investment amount for a new investor in a mutual fund scheme
Application Amount for Fresh SubscriptionThis is the minimum investment amount for a new investor in a mutual fund scheme.
Minimum Additional AmountThis is the minimum investment amount for an existing investor in a mutual fund scheme.
Yield to MaturityThe Yield to Maturity or the YTM is the rate of return anticipated on a bond if held until Maturity. YTM is expressed as an annual rate. The YTM factors in the bond's current market price, par value, coupon interest rate a d time to maturity.
SIPSIP or systematic investment plan works on the principle of making periodic investments of a fixed sum. It works similar to a recurring bank deposit. For instance, an investor may opt for an SIP that invests Rs. 500 every 15th of the month in an equity fund for a period of three years.
NAVThe NAV or the net asset value is the total asset value per unit of the mutual fund after deducting all related and permissible expenses. The NAV is calculated at the end of every business day. It is the value at which the investor enters or exits the mutual fund.
BenchmarkA group of securities, usually a market index, whose performance is used as a standard or benchmark to measure investment performance of mutual funds, among other investments. Some typical benchmarks include the Nifty, Sensex, BSE200, BSE500, 10 –Year Gsec.
Entry LoadA mutual fund may have a sales charge or load at the time of entry and/or exit to compensate the distributor/agent.
Entry load is charged at the time an investor purchases the units of a mutual find. The entry load is added to the prevailing NAV at the time of investment. For instance, if the NAV is Rs. 100 and the exit load is 1%, the investor will enter the fund at Rs. 101.
Exit LoadExit load is charged at the time an investor redeems the units of mutual fund. The exit load is reduced from the prevailing NAV at the time of redemption. The investor will receive redemption proceed at net value of NAV less Exit Load. For instance if the NAV is Rs. 100 and the exit load is 1% the investor will receive Rs. 99
Modified DurationModified duration is the price sensitivity and the percentage change in price for a unit changes in yield.
Standard DeviationStandard Deviation is a statistical measure of the range of an investment's performance. When a mutual fund has a high standard deviation, its means its range of performance is wide, implying greater volatility.
Sharpe Ratio The Sharpe Ratio, named after its founder, the Nobel Laureate William Sharpe, is a measure of risk-adjusted returns. It is calculated using standard deviation and excess return to determine reward per unit or risk.
BetaBeta is a measure of an investment's volatility vis-à-vis the market. Beta of less than 1 means that the security will be less volatile than the market. A beta of greater than 1 implies that the security's price will be more volatile than the market.
AUMAUM or assets under management refers to recent / updated cumulative market value of investments of a scheme managed by the mutual fund.
HoldingsThe holdings or the portfolio is a mutual fund's latest or updated reported statement of investments/securities. These are usually displayed in terms of percentage to net assets or the rupee value or both. The objective is to give investors an idea of where their money is being invested by the fund manager.
Nature of SchemeThe investment objective and underlying investments determine the nature of the mutual fund scheme. For instance, a mutual fund that aims at generating capital appreciation by investing in stock markets is an equity fund or growth fund. Likewise, a mutual fund that aims at capital preservation by investing in debt markets is a debt fund or income fun. Each of these categories may have sub-categories.
Rating ProfileMutual funds invest in securities after evaluating their creditworthiness a disclosed by the ratings. A depiction of the mutual fund in various investments based on their ratings becomes the rating profile of the fund. Typically, this is a feature of debt funds.
HOW TO READ A FACTSHEET
38

BRANCH OFFICES Toll Free No : 1800 209 2726 Website : www.canararobeco.com
Disclaimer : The information used towards formulating the outlook have been obtained from sources published by third parties. While such publications
are believed to be reliable, however, neither the AMC, its officers, the trustees, the Fund nor any of their affiliates or representatives assume any
responsibility for the accuracy of such information and assume no financial liability whatsoever to the user of this document. The document is solely for
the information and understanding of intended recipients only. Internal views, estimates, opinions expressed herein may or may not materialize. These
views, estimates, opinions alone are not sufficient and should not be used for the development or implementation of an investment strategy. Forward
looking statements are based on internal views and assumptions and subject to known and unknown risks and uncertainties which could materially impact
or differ the actual results or performance from those expressed or implied under those statements.
Mutual Fund investments are subject to market risks, read all scheme related documents carefully.
DISCLAIMERS (as on July 29,2016)
Ahmedabad: Tel: (079) 40278936 Bangalore : Tel.: (080) 39871400-01 Chandigarh : Tel: (0172) 2648007 Chennai : Tel.: (044) 28492596-98 Goa : Tel.: (0832) 2422415, 6450631
Hyderabad : Tel.: (040) 39132301 /02 Indore : Tel.: (0731) 6451222 Jaipur: Tel.: +(141) 4010281 Kochi : Tel.: (0484) 2364846/36 Kolkata : Tel.: (033) 30584716 - 19 Lucknow :
Tel.: ( 522) 4026560 Mangalore : Tel: (0824) 2448804 Mumbai : Tel.: (022) 66585000/18, 66585085-86 New Delhi : Tel.: (011) 23326417 Pune : Tel.: (020) 30923820-24
Patna: Tel (0612) 3223911 Surat : Tel.: (0261) 6554243, 6641345
Note: The disclosures relating to portfolio Turn over Ratio (for equity segment) is based on the aggregate market value of equity as on 29.07.2016. The disclosures of average
maturity period relates to the debt component of the portfolio as on 29.07.2016.
Unclaimed Dividends : Those Investors who have not received/encashed the Dividends distributed by the Schemes, may write to respective registrar, duly furnishing the Name
of the Scheme, Folio No. and Details of the Dividends not received.
$Note :
Risk ratios calculated for schemes having minimum three year performance
For schemes having completed 4-6 years, 4 year data point considered.
For schemes having more than 6 year tenuer, 6 year data point is considered.
Risk Free Rate of Return : 6.59% (MIBOR as of July 29, 2016)
For the calculation of risk ratios monthly absolute returns calculated at monthly frequency are used
39