Embed Size (px)
Citation preview
1
Facts on the Seashore: Conflict, Population Displacement, and Coastal Vulnerability on the
Eve of the Sri Lankan Tsunami
Randall Kuhn
Josef Korbel School of International Studies University of Denver
Abstract
Approaches to humanitarian relief have been greatly enhanced by the concept of a complex emergency, an interaction or negative synergy between manmade and natural disaster. One
particularly important area of interest lies in the interconnections between the political ecology of fragile coastal environments, population displacement into such environments, and vulnerability to subsequent disasters. While grand models (i.e., the work of Thomas Homer-
Dixon) suggest powerful relationships, few empirical studies bring detailed population data to bear on the issue. This study looks at the impact of population movements in the east coast of Sri
Lanka before and during the 26-year Eelam War on the Boxing Day Tsunami of December 2004. In contrast to Northern Sri Lanka, which saw wholesale ethnic cleansing, pop ulation movements in the east were characterized by gradual processes of communal violence, insecurity,
encroachment, disparate access to entitlements (e.g., irrigation), and temporary military or rebel clearances. The net result is a substantial net migration towards previously unsettled coastal
areas, particularly by vulnerable minority-within-a-minority communities (e.g., Tamils in Muslim-majority areas, or vice versa). I characterize processes of displacement and produce estimates of the impact of the conflict on the tsunami, including: tsunami deaths and housing
destruction attributable to conflict, ethnic and sub-ethnic differentials in tsunami impact, and evidence of extraordinarily high levels of community vulnerability in new settlements. The study
leverages a unique combination of community surveys, Geographic Information System (GIS) data, public records, official damage reports, ground truth estimates of tsunami impact, and archival evidence of historic population movements. I conclude with likely implications of my
findings for the collective efficacy and recovery of affected communities, and draw linkages to a broader study of the impacts of the tsunami on the sudden end of the Civil War in 2009.
The results are based on the attached paper “Conflict, Coastal Vulnerability, and Resiliency in
Tsunami-Affected Communities of Sri Lanka”, forthcoming in Tsunami Recovery in Sri
Lanka: Ethnic and Regional Dimensions, M. Gamburd, D. McGilvray, eds., Taylor and Francis, November 2009.
In particular, this paper will expand upon the section entitled “Results of the Community
Study: Facts on the Ground” using new community displacement histories and GIS mapping
collected in January 2009.
2
Conflict, Coastal Vulnerability, and Resiliency in Tsunami-Affected Communities of Sri
Lanka
Introduction
What can a quantitative analysis of pre- and post-tsunami social indicators tell us about the
broader regional and ethnic dimensions of the Sri Lankan tsunami recovery process? Recent years have seen a more systematic effort to quantify disasters, relief efforts, and paths to recovery. Indeed, when the humanitarian community set out to establish clear humanitarian
guidelines and responsibilities under the Sphere Project and its Humanitarian Charter and Minimum Standards in Disaster Response, a major element was the application of specific
measurement criteria, evidence-based standards, and tools for evaluation of disaster relief efforts (Sphere 2004). Yet there remains a disconnect between the quantitative and qualitative approaches Quantitative statistics are typically analyzed only at a very high level, which in Sri
Lanka typically entails taking the district, with a population of around 300,000 people, as the primary unit of analysis. Qualitative needs assessments and ethnographies usually take the
individual, family, or neighborhood as the unit of analysis and one or perhaps a small number of villages as the scale of analysis. Donor-driven ethnographies are typically aimed at understanding local needs or progress as representative of a larger context (for instance the
district) rather than at addressing differences between a number of localities. Furthermore, donor-driven analysis often focuses on local needs rather than on capabilities or resiliencies.
In light of these gaps, the multidisciplinary Sri Lanka tsunami project described in the Introduction to this volume included a quantitative study designed to bridge the micro and macro
levels. The author assembled a quantitative database linking publicly available and newly collected data on population, tsunami impact, and tsunami relief and recovery. Donor-driven
analyses of Sri Lanka have looked at the level of the province (of which Sri Lanka has 8, of which 4 were tsunami-affected) or the district (25, with 12 affected). The current analysis captures the two lowest levels of administrative organization. Below the district is the Divisional
Secretariat (DS) Division, with 41 out of a total 325 affected. At the lowest level of organization, typically containing about 1,000 people is the Grama Niladarai (GN) Division, literally meaning
“Village Headman”, with 663 affected out of about 14,000. The study focused on a comparison 429 affected and 782 unaffected GNs in the five of the most heavily affected districts: Ampara and Batticaloa in the mostly Tamil and Muslim Eastern Province, and Galle, Matara, and
Hambantota in the majority Sinhalese Southern Province. More in-depth surveys were conducted with 146 affected and unaffected GNs.
Data were gathered to address antecedents, recovery efforts, and outcomes of the tsunami in light of the ongoing civil conflict between the majority Sinhalese and minority Tamil population,
as well as Sri Lanka‟s history of greater government support to Sinhalese-dominated areas versus those populated by Tamils or Muslims. Data collection was carried out with approval of the Sri
Lankan Ministry of Public Administration and Home Affairs. Data were collected by a team of four researchers (one Sinhala, one Tamil, one Muslim, and one American Fulbright scholar with strong Sinhala language abilities) between July and December 2006. The author spent one month
of the data collection period in Sri Lanka, taking the lead on the collection of GN-wise statistical information from DS offices including tsunami damage, design and pretesting of GN survey
3
instruments, and selection of GNs for inclusion in the survey. The dataset also incorporates a range of publicly available population, damage, and recovery data.
The demographic study was designed to produce broader statistical results that would
contextualize key ethnographic findings from Tamil (McGilvray, Lawrence, and Gaasbeek) and Sinhalese (Gamburd) communities, while local ethnographic studies would reveal specific causal factors that contributed to the quantitative findings. The key study hypothesis anticipated
regional or ethnic differences in post-tsunami recovery and welfare between the Sinhala-majority Southern Province and the Tamil-speaking (both ethnic Muslim and Tamil) Eastern Province.
The findings of this data collection project are illustrative of a more complex reality reflecting the unique tripartite dimension of Sri Lankan society, the unprecedented scale of foreign
assistance to the country, and the complexities of coastal ecosystems, as well as the fundamental gap between Sinhalese-dominated areas of southern Sri Lanka and minority areas in the east.
They illustrate key ways in which conflict and disaster interact to exact a considerable toll on minority communities. Yet basic health and educational standards thus far remain robust despite the conflict and tsunami impact. Post-tsunami foreign assistance flows reflect a distinct bias
towards the majority Sinhalese community, yet it is not at all clear that excess funds have really addressed the basic human needs of affected Sinhalese communities.
Ultimately, tests of an ethnic/regional differential hypothesis were complicated by important factors that will constitute the bulk of this chapter. First, the complexity of preexisting
socioeconomic differentials among affected and unaffected communities across the three ethic communities undermined the assumptions of a simple pre-post experimental design. Second, the
magnitude of the international post-tsunami relief effort fundamentally altered the nature of the study, swamping the role of community- level factors while introducing new sources of ethnic differential. With these caveats in mind, the chapter describes basic ethnic and community
variations in objective and perceived indicators of tsunami recovery. It concludes with comments on the relevance of these findings for Sri Lanka‟s recovery process and for future community
analysis of disaster recovery.
Ethnicity, Conflict, and Recovery
It is by now conventional wisdom that the global response to the Indian Ocean tsunami of
December 26, 2004 was unprecedented in its scale and complexity. Foreign governments, charities, and private donors allocated and delivered more financial and logistical assistance than
in almost any natural disaster to date. Donors became directly involved in service delivery and reconstruction in unprecedented ways, most notably in housing reconstruction.
In the aftermath of the aid-fueled conflicts of the 1990s in places such as Rwanda and Sudan, considerable concern was voiced about the role of foreign donors in supporting discrimination
against minority groups, in promoting insurgency and insecurity, or in assisting military build-ups (Gasper 1999; Le Billon 2000; Cliffe and Luckham 2000; Fox 2001; Barnett 2005). Of particular concern has been the increasing tendency for modern humanitarian operations to span
the continuum from emergency relief to long-term political and economic development (Fox 2001; Goyder et al. 2006). Whereas the former activity can be carried out in a largely apolitical
fashion, the latter can more readily be co-opted to reflect the political agendas of geopolitical
4
powers and local political elites (Buchanan-Smith and Maxwell 1994; Weiss 1999; Easterly 2002; Hillhorst 2002; Freeman 2004). The formalization of this shift in the SPHERE standards
for humanitarian intervention raised considerable controversy among donors and implementers (Sphere 2004; Tong 2004). As will be demonstrated in this chapter, a great majority of the post-
tsunami assistance provided to Sri Lanka, even in the early relief stages, cross into the development sector with political consequences, intended or not (Houghton 2007; Telford and Cosgrove 2007).
SPHERE also placed an unprecedented emphasis on accountability and measurement in
humanitarian operations. This has encouraged creative and innovative analyses of the conduct, effectiveness, and ethics of aid delivery (Benini et al. 2008; Fengler et al. 2008). It is hoped that the analysis presented here will advance this scholarly process by reconciling the regional
patterns of tsunami devastation against the financial accounts of foreign donor agencies. A number of potential pathways could explain regional differences in foreign assistance. First,
conflict may obstruct the delivery of post-disaster assistance to affected areas (Slim 1997; White and Cliffe 2000). Second, donors may eschew areas under the immediate control of insurgent groups (Smillie and Minear 2003; Uvin 1998). Third, the government may divert assistance
away from areas affected by conflict or areas populated by minority groups (Macrae et al. 1997; Smilie 2001). This analysis explores regional patterns and their possible causes in Sri Lanka‟s
tsunami-affected areas. Humanitarian assistance may also disproportionately accrue to privileged or dominant population
groups for logistical reasons that, while still problematic for operational efficacy, do not imply politically motivated bias or manipulation. For example, areas populated by dominant ethnic
groups may be characterized by higher levels of development and higher wages and prices, thus perhaps justifying greater investment (Morris and Wodon 2003). Politically dominant areas may also happen to be more accessible to points of entry for finance, materials, and relief personnel, a
situation often referred to as “tarmac bias” (Waters 2001; Benini et al. 2008).
The environmental justice literature also highlights how vulnerable groups often bear the heaviest burden of disaster, particularly under conditions of political or military conflict (Blaikie and Brookfield 1987; Peet and Watts 2004; Bryant and Bailey 1997; Peluso and Watts 2001;
Bohle and Fünfgeld 2007). It is important, however, to clarify whether disadvantaged groups were hit hardest by a disaster because they happened to live in a vulnerable area, or because
systematic processes of exclusion placed them there. These issues are particularly complicated in the context of coastal ecosystems. Depending on industrial mix, rates of inequality, migration, and topographical characteristics, coastal areas can either be among the most wealthy residential
areas or among the poorest, or they may be largely uninhabited industrial or ecological protection zones. Whether pre-existing differences are the result of systematic or random forces,
this study aims to measure variations in post-tsunami community outcomes while accounting for preexisting variations in community well-being.
Conflict, Coastal Vulnerability, and Resiliency in Sri Lanka
In 2002, Sri Lanka‟s population composition by ethnicity/nationality was 74% Sinhalese (primarily Buddhist), 18% Tamil (primarily Hindu), and 7% Muslim (Department of Census and
Statistics 2001). The Sinhalese, traditionally residing in the west and south of the country, have
5
dominated Sri Lanka‟s political and economic life since the country gained independence in 1948. Tamils, living predominately in the North and East, have faced considerable
discrimination as a result of physical and social isolation, government policies aimed at promoting the Sinhalese language and population, and civil conflict (de Silva 1997). Yet Tamils
also continue a legacy of high educational and occupational attainment dating back to the colonial era (Bush 1993). The Muslim population, typically Tamil-speaking but ethnically distinct from Tamils, have fared better than Tamils on most living standards indicators.
Each of Sri Lanka‟s major ethnic groups resides in large numbers near the coastline, yet the
quality of their existence and their reasons for living in these areas is conditioned by the local topography, by political and economic forces, and most of all by the ongoing ethno-nationalist conflict (Peebles 1990; Bastian 1999; Dunham and Jayasuriya 2001; Korf and Engel 2006; Korf
2005). All tsunami-affected regions of the Southern Province share a similar demographic makeup, with a large Sinhalese majority and pockets of Muslims in the cities, and a similar
ecology: a moist, flat, tropical coastline. Yet there are important differences, most notably a significant political division between administrative districts. Galle District traditionally supports the opposition United National Party, while Hambantota and Matara Districts are the home base
of the ruling Sri Lankan Freedom Party as well as the ultra-nationalist Janatha Vimukhti Peramuna (JVP). For instance, in the 2001 election, JVP received 21% of votes in Hambantota,
13% in Matara, and 11% in the rest of Southern and Western Province compared to between 4 and 9% in southern areas away from the coast (Department of Elections 2008). Economic differences exist as well, with Galle‟s economy drawing considerable hard currency income from
tourism and overseas remittances.
Further complexity shapes the ethnic and political fabric of the Eastern Province. Ampara and Batticaloa Districts, two areas of focus in this study, both sit in Sri Lanka‟s dry zone directly facing the Indian Ocean to the east, the direction from which the tsunami originated. Both have
sizable Tamil and Muslim populations. Both have been affected by the ongoing conflict between the government and the LTTE. Yet considerable differences and occasional animosity exist
between the Tamil and Muslim communities. More recently, these differences have been reinforced by an ongoing administrative
reorganization of Tamils and Muslims into separate divisions within each district and also increasingly into separate districts, with Ampara seen by many Muslim leaders as a Muslim
stronghold and Batticaloa as a place for the Tamils (Routray and Singh 2007). While the higher intensity of armed conflict in Batticaloa District has created considerable hardship for both groups, and frequent attacks on the Muslim population, the conflict has had a more moderate
effect in Ampara. Major government water schemes such as the Gal Oya and Mahaveli, resulting in the large-scale settlement of Sinhala people in the Eastern Province, have increasingly been
utilized as a wedge between the Tamil and Muslim communities (Peebles 1990; Bastian 1999; Dunham and Jayasuriya 2001; Korf and Silva 2003; Korf and Engel 2006). These conditions form the background for the current demographic investigation.
Assessing Tsunami Impact
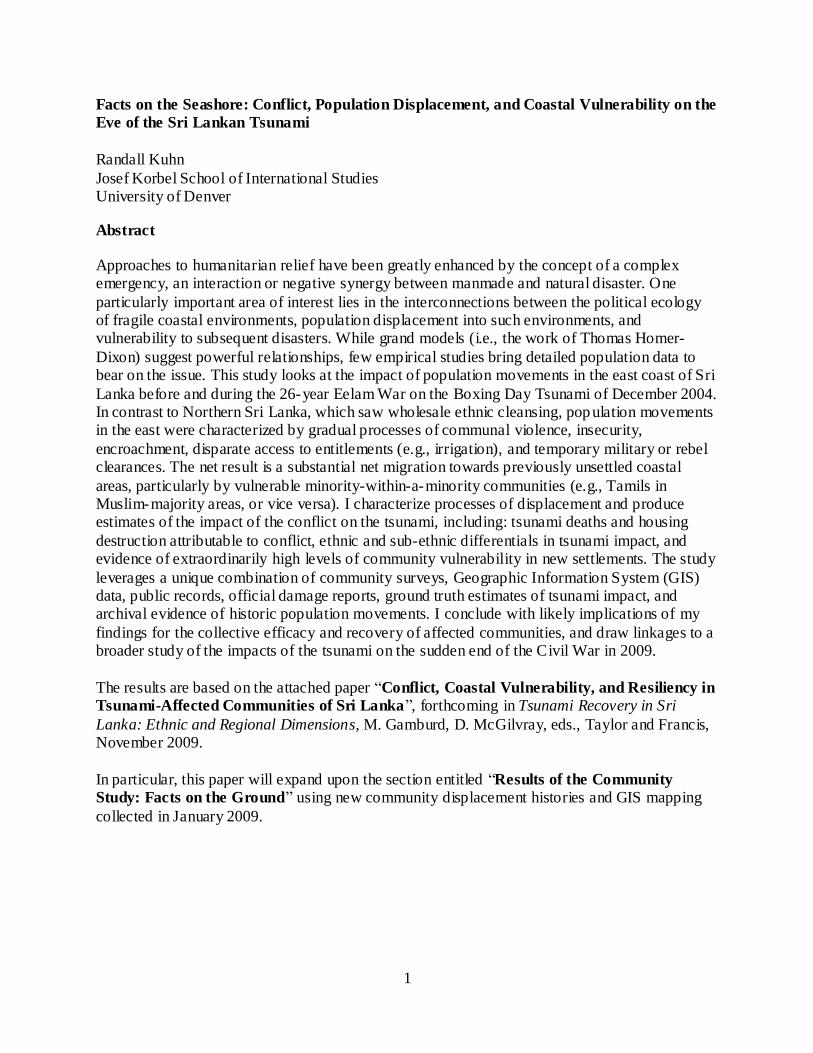
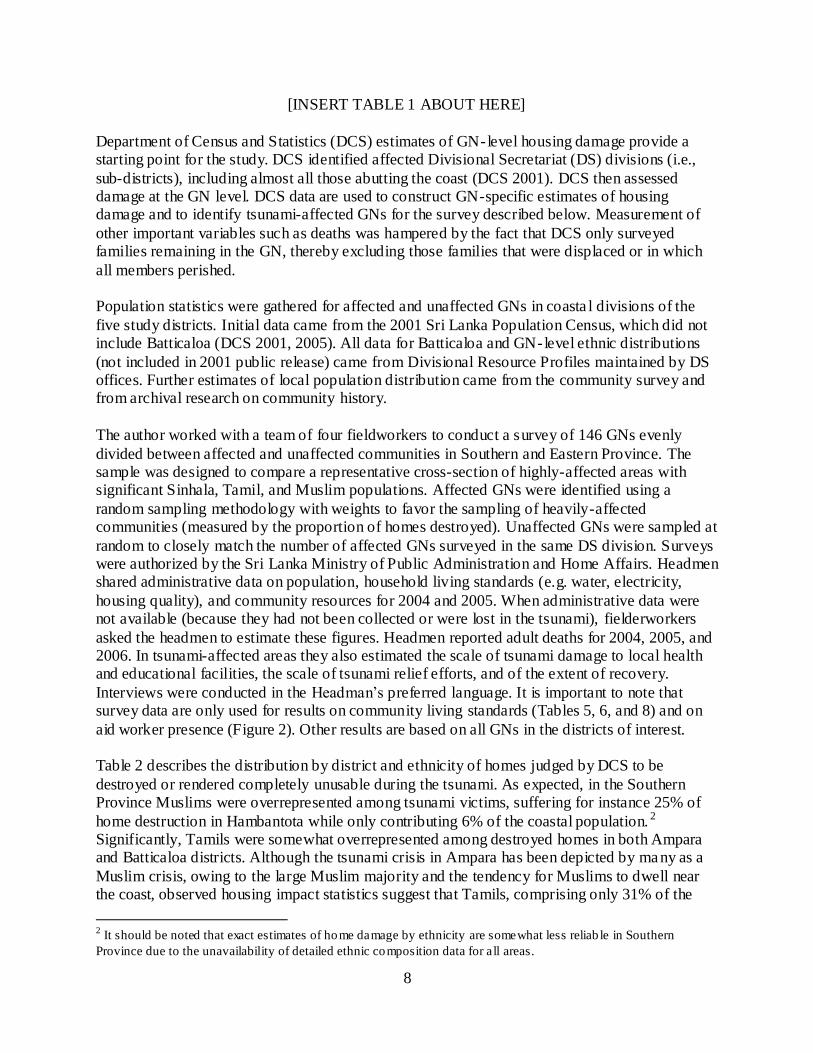
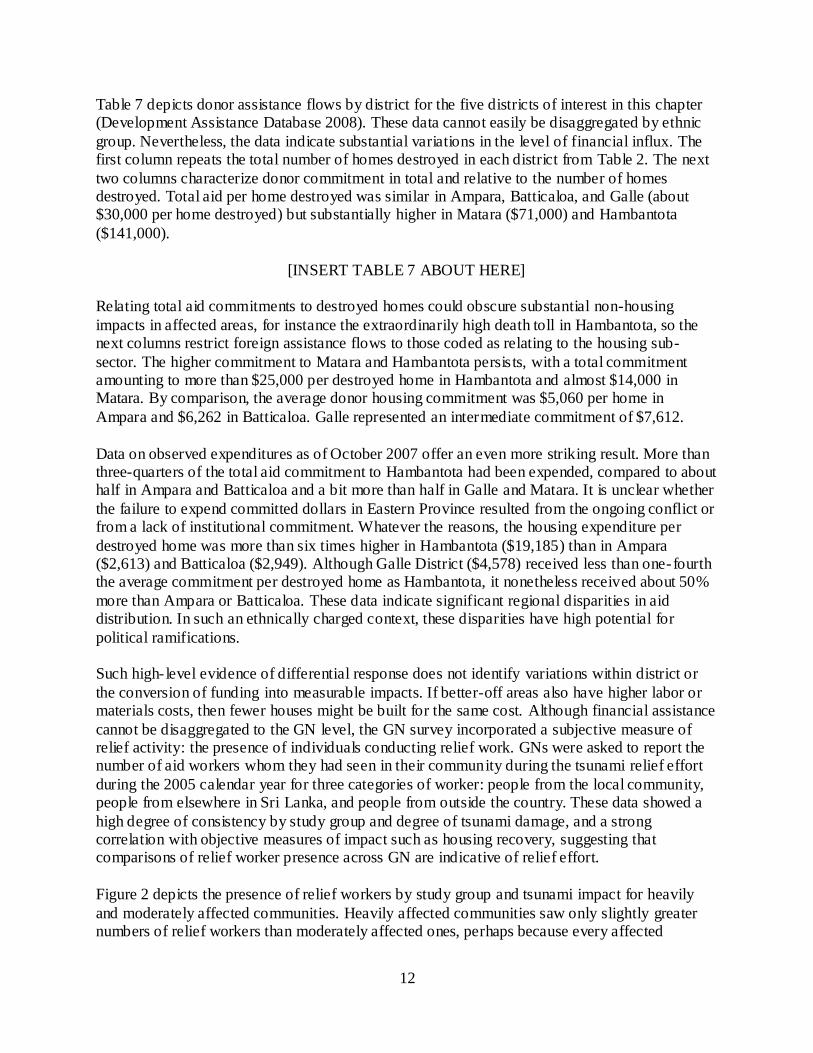
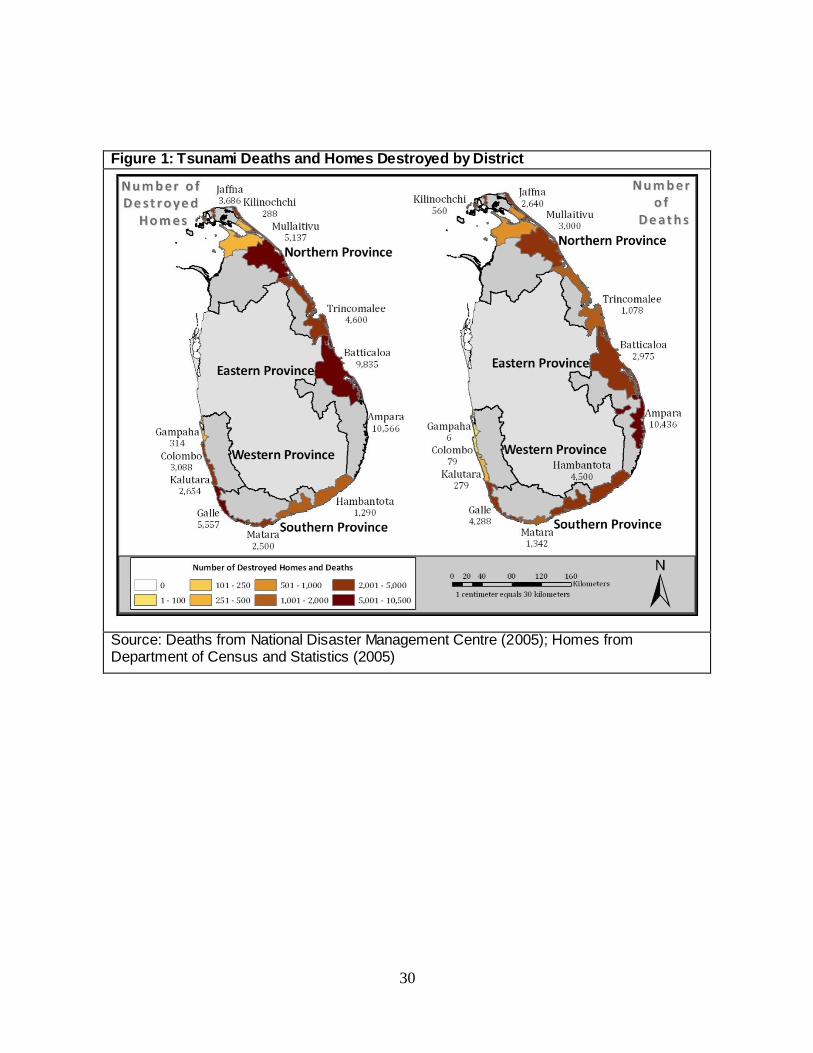
The tsunami affected each of Sri Lanka‟s 14 coastal districts. Figure 1 depicts the regional
pattern of damage in terms of the official death toll, based on police reports, and the number of
6
homes destroyed according to the Department of Census and Statistics (DCS). The impact was felt first and, by most measures most severely, in areas to the east and therefore directly facing
the source of the wave in Sumatra. Total death tolls and housing damage were highest in the mixed Tamil and Muslim regions of Eastern Province, particularly the Muslim-dominated
coastal region of Ampara and Tamil-dominated Batticaloa, as shown in Figure 1. Rates of death and destruction were even higher in these areas, which are far less densely populated than the south. The toll of death and destruction was also quite high the Northern Province, particularly
the LTTE-controlled districts of Mullaitivu and Kilinochchi, though data from these areas are less verifiable. Although the wave hit the southern districts less directly, their higher population
densities nonetheless resulted in a substantial number of victims, particularly in Galle and Hambantota District. Each of these areas has a substantial Sinhala majority, though areas most closely abutting the coast were often heavily populated with Muslims. Areas on the west coast
were far less affected, particularly the lightly populated Puttalam District north of Colombo. The official death toll was 31,000, with around one million people (5% of the total population)
directly affected by the tsunami and 180,000 (about 1% of the population) displaced temporarily or permanently. This study focuses on five heavily-affected districts in the Southern and Eastern Provinces.
[INSERT FIGURE 1 ABOUT HERE]
The study employs a research design in which the tsunami is taken as a random shock simultaneously affecting multiple locations and ethnic communities. It seeks to measure
differential changes in social indicators before and after the tsunami in Tamil, Muslim, and Sinhalese communities, while looking also at other covariates relating to community efficacy
and organization. This design has a number of inferential limitations, the first being the difficulty of identifying meaningful markers of community distinction that could be measured with equal precision both before and after the tsunami. Second are confounding forces that vary across
region but have little to do with the ethnic variations of interest in the study. For example, eastern areas, home to most of the Tamils and Muslims in the study, lie in a sparsely populated
dry zone, while the largely Sinhalese southern areas resembled urban areas in many ways. Eastern communities themselves differ from one another in the extent of conflict exposure.
Two other factors also limited the viability of the original study design and the success of the data collection. First was the sheer magnitude of foreign donor response, which extended into
even the most isolated areas of the island. Beyond its magnitude, the foreign response was notable for its complexity. In particular, the housing reconstruction program, possibly the most intricate in the history of humanitarian assistance, included a complicated mix of finance
mechanisms. Some homes were rebuilt by owners themselves using $2,500 phased transfers from the government, with donor support.1 Others, particularly those originating from inside a
coastal protection buffer zone (initially 100m or closer in the South and 200m or closer in the East, then later reduced), had their homes built through direct donor involvement with no government fund transfers. Between these two extremes lay an array of hybrid s, including
owner-built homes with co-financing or top-up transfers from donors, donor-built homes that required owners to sign over their government housing grants, and donor-built homes for which
1 Housing reconstruction payments were paid in four installments: an init ial payment, one for completion of the
foundation, one for the walls, and one for the roof.
7
victims were also able to keep their $2,500 grants from the government. These latter arrangements were most typical during Phase II of housing reconstruction, which began in July
2006 when the buffer zone was narrowed to 35-60m in the south and 65-125m in the east. The scale and complexity of housing assistance was likely to outweigh the impact of local cultural
and community factors, a key interest of our study, on subsequent outcomes. The scale of district- level differentials in donor assistance is described below in the section on post-tsunami response.
A final confounding force was the reemergence of the ethnic conflict soon after this study began.
On 15 July 2005, the Sri Lanka Supreme Court ruled key provisions of the government‟s proposed Post-Tsunami Operational Management Structure (P-TOMS) to be unconstitutional, setting the stage for a new round of conflict over tsunami assistance (see Keenan this volume).
The election in November 2005 of Mahinda Rajapakse as President was followed by further escalation in tension. Military activity increased considerably, particularly in Trincomalee and
Batticaloa Districts in the Eastern Province, each of which has been the site of government recovery of territory, coupled with sustained humanitarian crises. It is estimated that 21,000 people died in the conflict between the time of the tsunami and December 2008 (SATP 2009). In
some areas in the east, particularly Batticaloa District, the post-tsunami recovery might have been affected by renewed conflict.
Results of the Community Study: Facts on the Ground
The study design necessitated the availability of comparable socioeconomic indicators from before and after the tsunami. Given the absence of a pre-existing individual or household survey
with adequate sample size, the study focused on the community level of analysis. The primary unit of analysis was the Grama Niladari (GN) division, the smallest unit of public administration.
Under Sri Lanka‟s highly integrated and effective system of local data collection, GNs are neighborhood civil servants (called “village headmen” in colonial days, and “Grama Sevakas” until recently), responsible for maintaining and reporting local data on population distribution,
household living standards (water/sanitation, electricity, labor, welfare program participation, etc.) and community economic, social, and educational institutions. They also maintain an
election registry, which requires the tracking of all deaths occurring to residents age 18 and over. For clarity, the administrative unit is referred to as “GN” while the officer in charge of the GN is referred to as the “Headman”.
To capture greater between-community diversity within each locality and to be broadly
comparable to the communities of interest in qualitative chapters (see Gamburd, Lawrence, McGilvray), communities were sampled in Galle, Matara, and Hambantota Districts of Southern Province (predominately Sinhala with small Malay Muslim minorities) and Ampara and
Batticaloa Districts in Eastern Province (each having a mix of Tamil and Muslim populations). These districts accounted for about two-thirds of all deaths and homes destroyed in the tsunami.
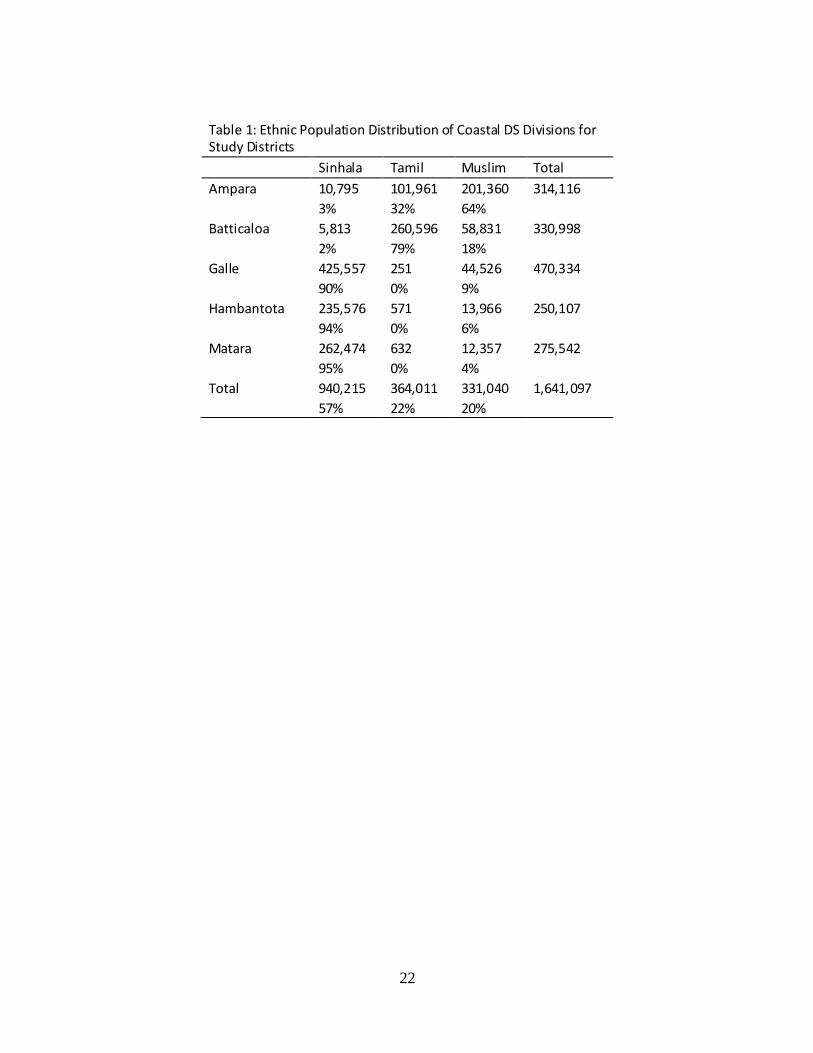
The ethnic population distribution of affected DS divisions is depicted in Table 1. Affected areas of Southern Province are overwhelmingly Sinhalese, with a Muslim minority typ ically living in close proximity to the coast. Ampara District is two-thirds Muslim, with a one-third Tamil
minority and a small number of Sinhalese. Batticaloa district was 82% Tamil, with a 15% Muslim minority and almost no Sinhalese population.
8
[INSERT TABLE 1 ABOUT HERE]
Department of Census and Statistics (DCS) estimates of GN-level housing damage provide a starting point for the study. DCS identified affected Divisional Secretariat (DS) divisions (i.e.,
sub-districts), including almost all those abutting the coast (DCS 2001). DCS then assessed damage at the GN level. DCS data are used to construct GN-specific estimates of housing damage and to identify tsunami-affected GNs for the survey described below. Measurement of
other important variables such as deaths was hampered by the fact that DCS only surveyed families remaining in the GN, thereby excluding those families that were displaced or in which
all members perished. Population statistics were gathered for affected and unaffected GNs in coasta l divisions of the
five study districts. Initial data came from the 2001 Sri Lanka Population Census, which did not include Batticaloa (DCS 2001, 2005). All data for Batticaloa and GN-level ethnic distributions
(not included in 2001 public release) came from Divisional Resource Profiles maintained by DS offices. Further estimates of local population distribution came from the community survey and from archival research on community history.
The author worked with a team of four fieldworkers to conduct a survey of 146 GNs evenly
divided between affected and unaffected communities in Southern and Eastern Province. The sample was designed to compare a representative cross-section of highly-affected areas with significant Sinhala, Tamil, and Muslim populations. Affected GNs were identified using a
random sampling methodology with weights to favor the sampling of heavily-affected communities (measured by the proportion of homes destroyed). Unaffected GNs were sampled at
random to closely match the number of affected GNs surveyed in the same DS division. Surveys were authorized by the Sri Lanka Ministry of Public Administration and Home Affairs. Headmen shared administrative data on population, household living standards (e.g. water, electricity,
housing quality), and community resources for 2004 and 2005. When administrative data were not available (because they had not been collected or were lost in the tsunami), fielderworkers
asked the headmen to estimate these figures. Headmen reported adult deaths for 2004, 2005, and 2006. In tsunami-affected areas they also estimated the scale of tsunami damage to local health and educational facilities, the scale of tsunami relief efforts, and of the extent of recovery.
Interviews were conducted in the Headman‟s preferred language. It is important to note that survey data are only used for results on community living standards (Tables 5, 6, and 8) and on
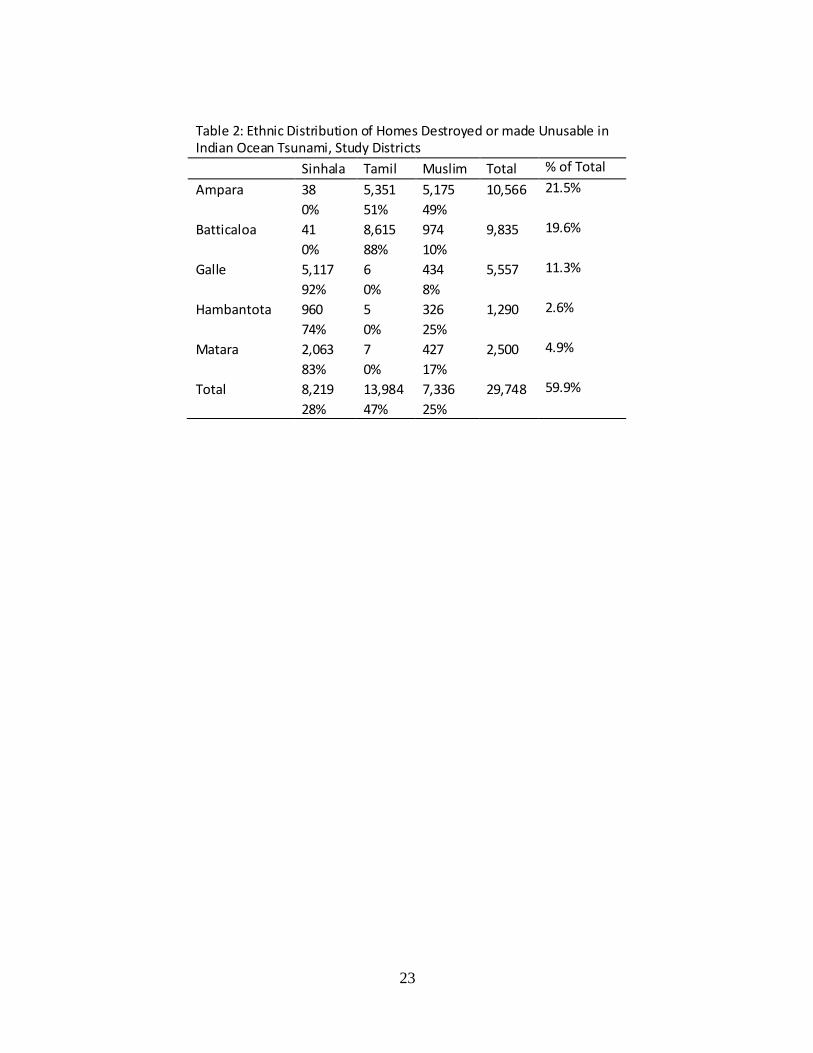
aid worker presence (Figure 2). Other results are based on all GNs in the districts of interest. Table 2 describes the distribution by district and ethnicity of homes judged by DCS to be
destroyed or rendered completely unusable during the tsunami. As expected, in the Southern Province Muslims were overrepresented among tsunami victims, suffering for instance 25% of
home destruction in Hambantota while only contributing 6% of the coastal population. 2 Significantly, Tamils were somewhat overrepresented among destroyed homes in both Ampara and Batticaloa districts. Although the tsunami crisis in Ampara has been depicted by many as a
Muslim crisis, owing to the large Muslim majority and the tendency for Muslims to dwell near the coast, observed housing impact statistics suggest that Tamils, comprising only 31% of the
2 It should be noted that exact estimates of home damage by ethnicity are somewhat less reliab le in Southern
Province due to the unavailability of detailed ethnic composition data for all areas.
9
population of Ampara‟s coastal divisions, suffered 46% of home destruction. Muslims, while 66% of the population, suffered only 53% of the homes destroyed. Similarly in Batticaloa, while
Muslims comprised 18% of the population, they suffered only about 8% of the lost homes.
[INSERT TABLE 2 ABOUT HERE] Table 2 defined four groups that faced the greatest tsunami impact in the study districts and that
constitute the basis for the study. Sinhalese communities in Southern Province suffered 7,072 destroyed homes, or 24% of the total for the five districts. 3 Second, Muslims in Ampara District
accounted for 5,639 homes, or 19% of the total. Third, the Tamil minority in Ampara experienced a disproportionate share of the damage, accounting for 4,895, or 17%, of all homes destroyed. Finally, Tamil communities in Batticaloa district lost 8,835, or 30%, of all homes. The
study will primarily compare outcomes for these three conflict-affected eastern groups in comparison to the largely Sinhalese reference group in the Southern Province.
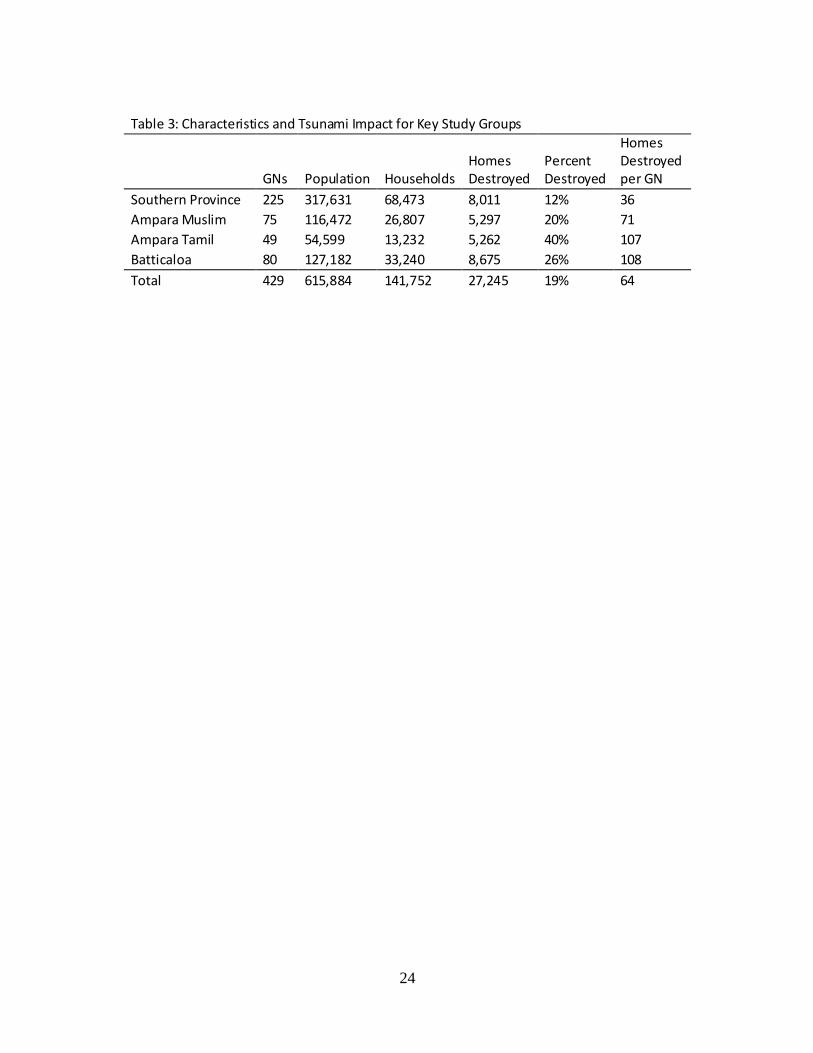
For each study group Table 3 characterizes the total number of tsunami-affected GNs, their aggregate population size, and the tsunami housing impact. Although the total number and
cumulative size of affected communities in Southern Province was quite large (about half of the total), the average Southern Province tsunami-affected GN lost only 36 homes, or 12% of the
total. By comparison, in Ampara affected Muslim GNs lost 20% of all homes (71 per affected GN) while Tamil GNs lost 40% of all homes (107 per GN). In Tamil parts of Batticaloa, 25% of all homes in affected GNs were lost, with the considerably larger size of GNs resulting in 110
destroyed homes per affected GN. Although the Southern Province communities accounted for half of our total survey population, they accounted for only 28% of lost homes.
[INSERT TABLE 3 ABOUT HERE]
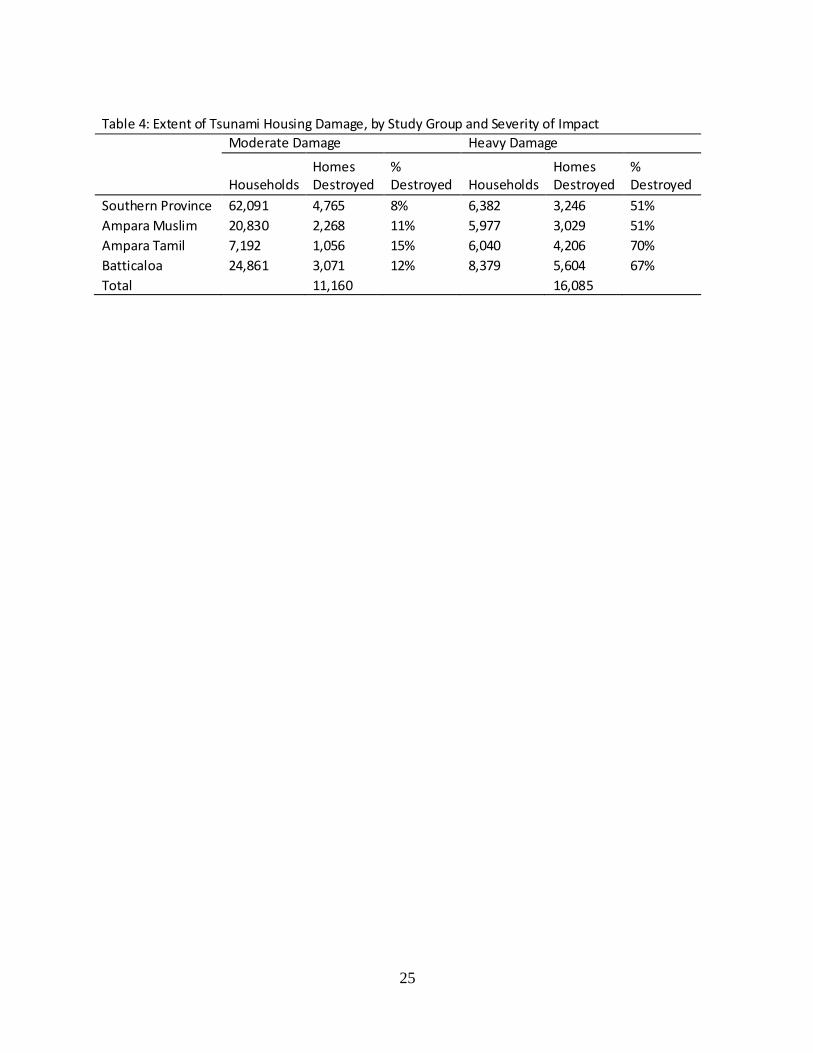
Table 4 describes pre-existing differences between affected communities among the four study groups, dividing affected GNs into those that are heavily affected (meaning greater than 50% of
all homes were destroyed) or moderately affected. Victims from Eastern Province, particularly Tamils, were far more likely to reside in heavily affected communities. In such communities the mechanisms of inter-household support and assistance would likely be less effective since all o f
one‟s neighbors – including in many cases matrilocally clustered married sisters - would be in similarly dire straits (see McGilvray and Lawrence this volume for ethnographic examples).
Only 41% of Sinhalese victims came from heavily affected communities, largely in Hambantota and Hikkaduwa. By contrast, about 80% of those Ampara Tamils who lost their homes came from communities where more than half of their neighbors also lost their homes. Muslims in
Ampara (57%) and Tamils in Batticaloa (65%) had an intermediate level of concentration in heavily affected communities.
[INSERT TABLE 4 ABOUT HERE]
Although Ampara‟s tsunami victims were divided almost evenly among Tamil and Muslim, more than two thirds of those losing their homes in moderately affected communities were
3 Although Muslims in Southern Province are an interesting study population in their own right, they accounted for
only 4% of the total homes destroyed in the study and are excluded.
10
Muslim (2,268 Muslim versus 1,056 Tamil), while 58% of those losing their homes in heavily affected communities were Tamil (4,206 Tamil versus 3,029 Muslim). A number of possible
explanations explain this pattern. First, it is possible that Tamils lived nearer to the coast or in more vulnerable coastal areas. It is also possible that Muslim communities lived in similar areas
but had better housing or flood control. Cursory observation of coastal areas of Ampara offer support for both possibilities.
With respect to residential patterns, a significant number of Tamils lived in close proximity to the coast, often situated between a coastal lagoon and the ocean. This includes Tamil villages
such as Sinna Mugathuwaram (in the Akkaraipattu area); Thampaddai and Thambiluvil (in Thirukkovil Division), and the Methodist village of Komari (in Pottuvil Divison), which sat perched on a particularly narrow causeway and lost 100% of homes. In contrast, large Muslim
population centers such as Akkaraipattu are largely built away from the coast, though some heavily affected Muslim fishing communities such as Maruthamunai had expanded along the
coast. It is unclear whether Tamil proximity to the coast reflected systematic vulnerability or displacement from more ecologically secure areas. Few in the area would have based residential decisions explicitly on tsunami risks, which were not widely understood before the event. But
factors predisposing areas to ecological vulnerability were not unrelated to those factors that would also predict vulnerability to tropical cyclones, coastal erosion, flooding, and withholding
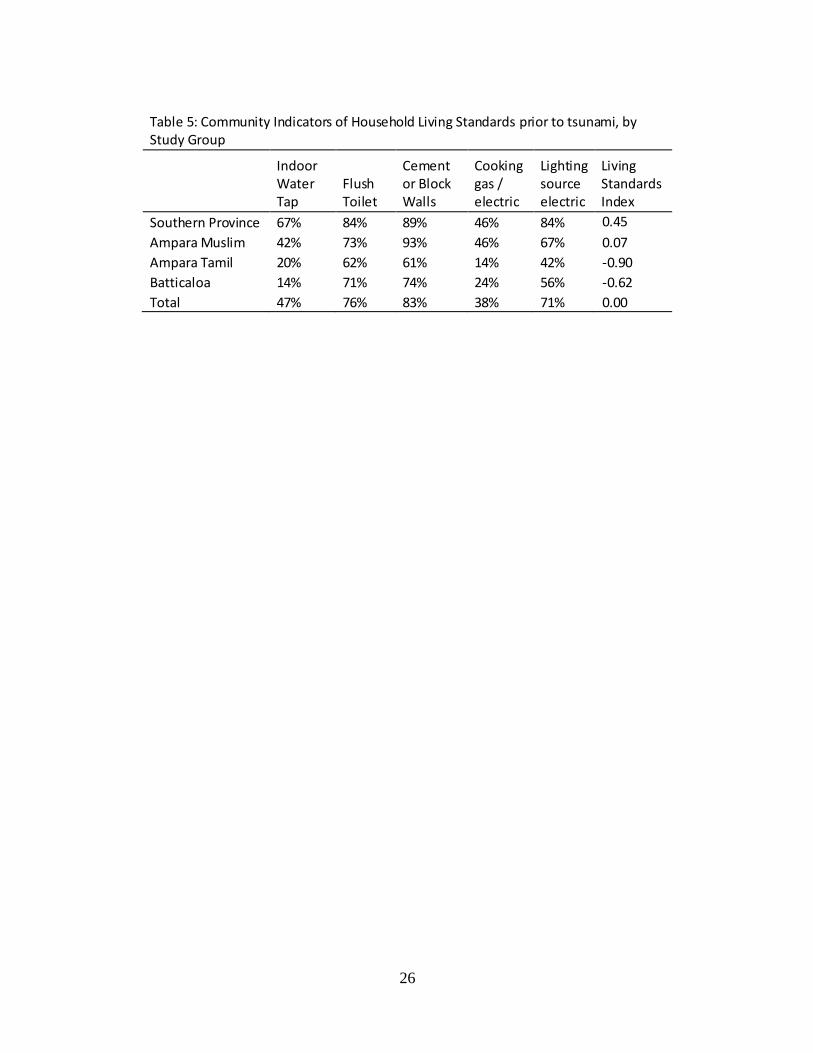
of upstream water resources. The results of a survey conducted in 146 tsunami-affected GNs in Southern and Eastern Province
shed light on the socioeconomic disadvantage of the tsunami-affected areas of Eastern Province, and Tamil areas in particular. GNs shared pre-tsunami records on the proportion of households
having an indoor water tap, a flush toilet, cement or block wall construction, natural gas or electric cooking facilities, or an electric lighting source. 4 Table 5 shows the disparities among the study groups, looking at both the affected and unaffected communities combined, prior to the
tsunami. Southern Province ranked highest on indoor water tap, flush toilet, and electric lighting source. While 67% of Southern Province communities had an indoor water source, only 42% of
Ampara Muslims, 20% of Ampara Tamils, and 14% of Batticaloa Tamils had this facility. In terms of brick or concrete wall construction and modern cooking facilities, Southern Province and Ampara Muslims had comparable levels well ahead of those experienced by Tamils in
Ampara and Batticaloa. Of the five indicators, Ampara Tamils ranked lowest on all but indoor water tap, for which Batticaloa was lowest. These indicators suggest significant pre-tsunami
differences in household infrastructure between the different study communities.
[INSERT TABLE 5 ABOUT HERE]
The divergence in pre-tsunami living standards of the study groups is summarized in the living
standards index (LSI) shown in the last column. As all five living standards measures are highly concordant, a single index was constructed using a latent variable analysis. LSI thus measures a community‟s standard deviation from the combined living standards of the average community
4 Indoor water tap refers to the presence of a municipal water source, indicat ing the availability of water and the time
and labor required to draw water. Shorter travel d istances would also tend to reduce the risks of external
contamination of the water in unsanitary containers or due to temporary storage indoors. Flush toilet refers to any
toilet that uses a powerful, mechanical force enabling the immediate separation of waste from proximity to humans.
11
on all dimensions. For example, the mean community with an LSI score of 0 saw 36% of households with gas or electric cooking, 84% with flush toilet, 92% with concrete walls, and
52% with indoor water. This compares to 72%, 93%, 94%, and 77% respectively for communities one standard deviation above the mean (+1 LSI) and 15%, 70%, 84%, and 24% for
communities with a -1 LSI. The LSI score demonstrates a clear ordering among the four study groups. Southern Province communities had an LSI score of 0.45 standard deviations above the mean, meaning that the average community was in about the 67th percentile of living standards.
Ampara Muslims were just about average at 0.07. Batticaloa LSI was -0.62, meaning that the typical community was in about the 27th percentile nationally. Ampara Tamils worst off at -0.90,
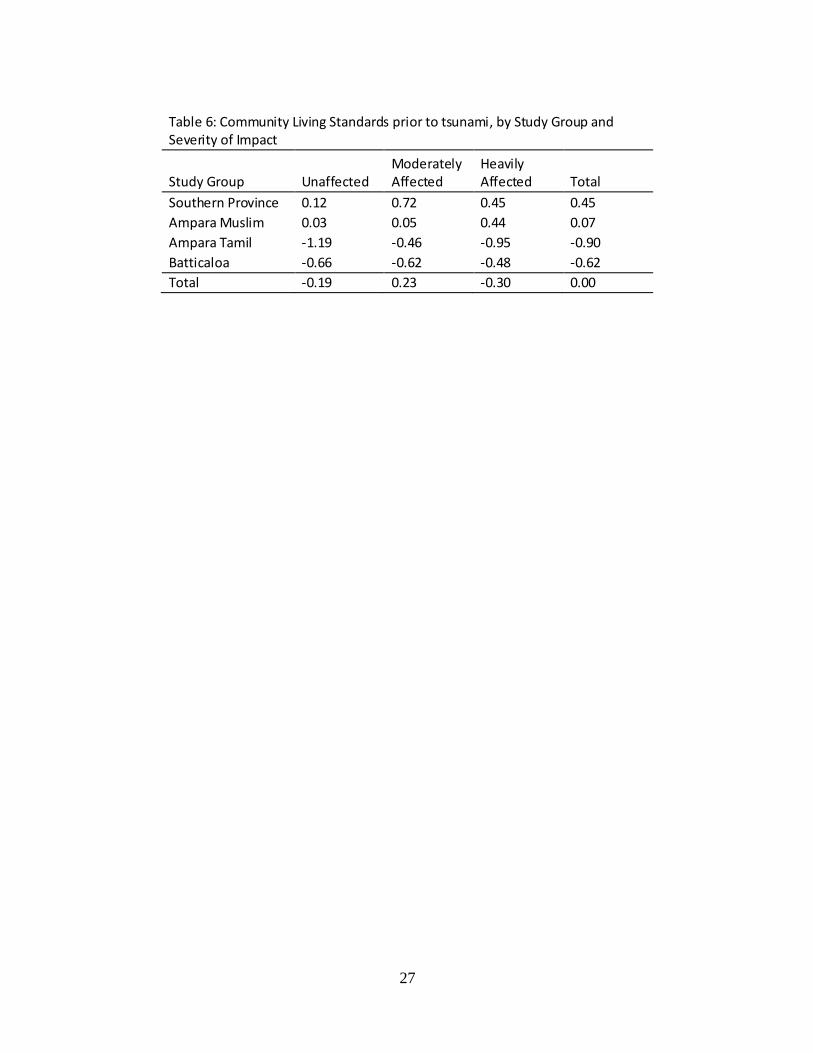
meaning they were in about the 18th percentile nationally. With a single LSI measure in place, it is possible to look at the selectivity, or patterns of pre-
tsunami difference, between tsunami-affected communities in the four study groups. Table 6 demonstrates a common pattern of selectivity in both Southern Province and among Ampara
Tamils whereby moderately affected communities display higher living standards than both unaffected and heavily affected communities. This pattern fits with a typical understanding of coastal vulnerability patterns: while those who are better off might choose to live near the coast
for improved access to trade and roads, highly vulnerable areas closest to major bodies of water as well as isolated inland sites with few amenities might be avoided. Nonetheless, even
comparatively well off Ampara Tamils in moderately affected communities had lower LSI than the worst off Southern Province or Ampara Muslim communities. Affected and unaffected communities in Batticaloa had lower living standards than all categories of Southern Province or
Ampara Muslim community. Interestingly, among Ampara Muslim communities, the heavily affected communities were in fact the best off.
Taken together, LSI patterns for Ampara Muslims and Tamils indicate considerable population sorting with respect to coastal vulnerability, though the specific demographic mechanisms
underlying this risk (in-migration, out-migration, or fertility) have not yet been identified. Tamils living in moderately affected communities, which are presumably the most desirable
communities located near the coast, display a relatively small LSI disadvantage relative to Muslims (-0.46 versus 0.05), equivalent to the difference between the 50th and 32nd percentile of the living standards distribution. But among the hardest-hit communities, the typical Tamil
community was in the 17th percentile of living standards, compared to the 67th percentile for Muslims (-0.95 Tamil LSI vs. 0.44 Muslim).
Post-Tsunami Response
Analysis of post-tsunami response can focus on a number of outcomes including expenditure, recovery achievement, or social welfare outcomes. Research emerging from this project has
demonstrated substantial province-level differentials in post-tsunami financial assistance from foreign donors and related these to housing reconstruction outcomes (Kuhn 2008). Levels of
donor assistance per affected population (accounting for total affected population, death toll, and housing destruction) were markedly higher in Southern Province than Eastern Province. Aid allocations in Northern Province, even in areas controlled by LTTE, were also higher than in
Eastern Province.
12
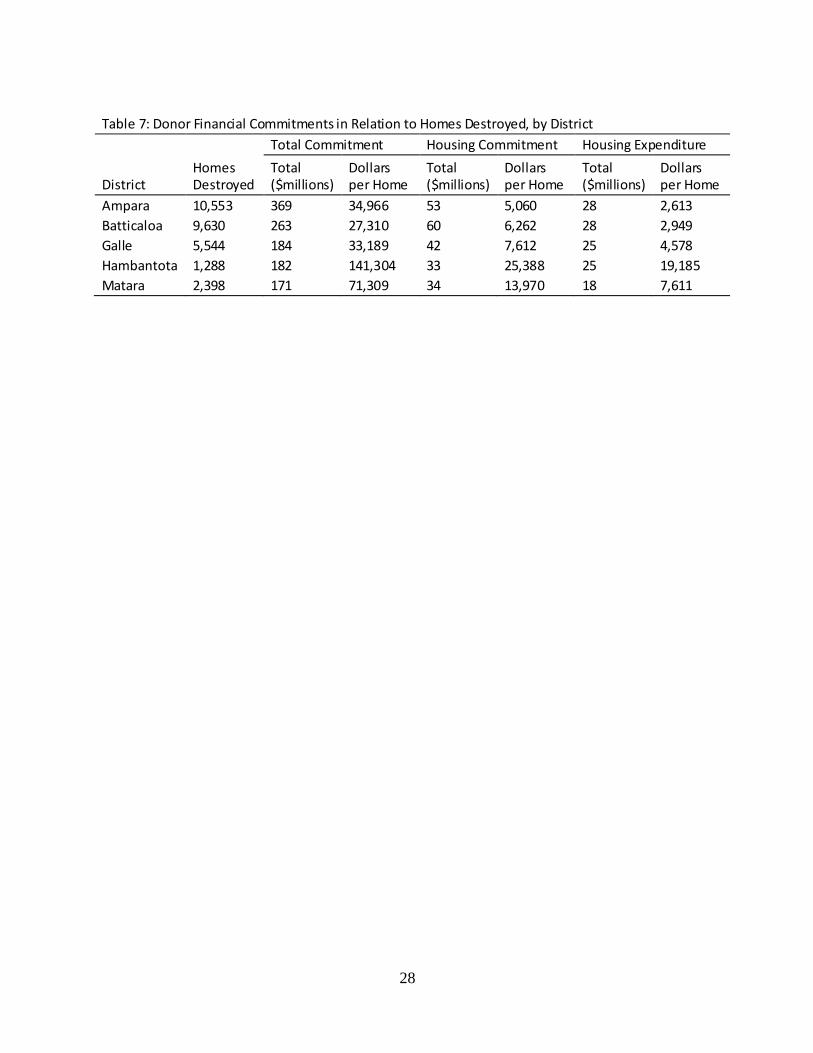
Table 7 depicts donor assistance flows by district for the five districts of interest in this chapter (Development Assistance Database 2008). These data cannot easily be disaggregated by ethnic
group. Nevertheless, the data indicate substantial variations in the level of financial influx. The first column repeats the total number of homes destroyed in each district from Table 2. The next
two columns characterize donor commitment in total and relative to the number of homes destroyed. Total aid per home destroyed was similar in Ampara, Batticaloa, and Galle (about $30,000 per home destroyed) but substantially higher in Matara ($71,000) and Hambantota
($141,000).
[INSERT TABLE 7 ABOUT HERE] Relating total aid commitments to destroyed homes could obscure substantial non-housing
impacts in affected areas, for instance the extraordinarily high death toll in Hambantota, so the next columns restrict foreign assistance flows to those coded as relating to the housing sub-
sector. The higher commitment to Matara and Hambantota persists, with a total commitment amounting to more than $25,000 per destroyed home in Hambantota and almost $14,000 in Matara. By comparison, the average donor housing commitment was $5,060 per home in
Ampara and $6,262 in Batticaloa. Galle represented an intermediate commitment of $7,612.
Data on observed expenditures as of October 2007 offer an even more striking result. More than three-quarters of the total aid commitment to Hambantota had been expended, compared to about half in Ampara and Batticaloa and a bit more than half in Galle and Matara. It is unclear whether
the failure to expend committed dollars in Eastern Province resulted from the ongoing conflict or from a lack of institutional commitment. Whatever the reasons, the housing expenditure per
destroyed home was more than six times higher in Hambantota ($19,185) than in Ampara ($2,613) and Batticaloa ($2,949). Although Galle District ($4,578) received less than one-fourth the average commitment per destroyed home as Hambantota, it nonetheless received about 50%
more than Ampara or Batticaloa. These data indicate significant regional disparities in aid distribution. In such an ethnically charged context, these disparities have high potential for
political ramifications. Such high- level evidence of differential response does not identify variations within district or
the conversion of funding into measurable impacts. If better-off areas also have higher labor or materials costs, then fewer houses might be built for the same cost. Although financial assistance
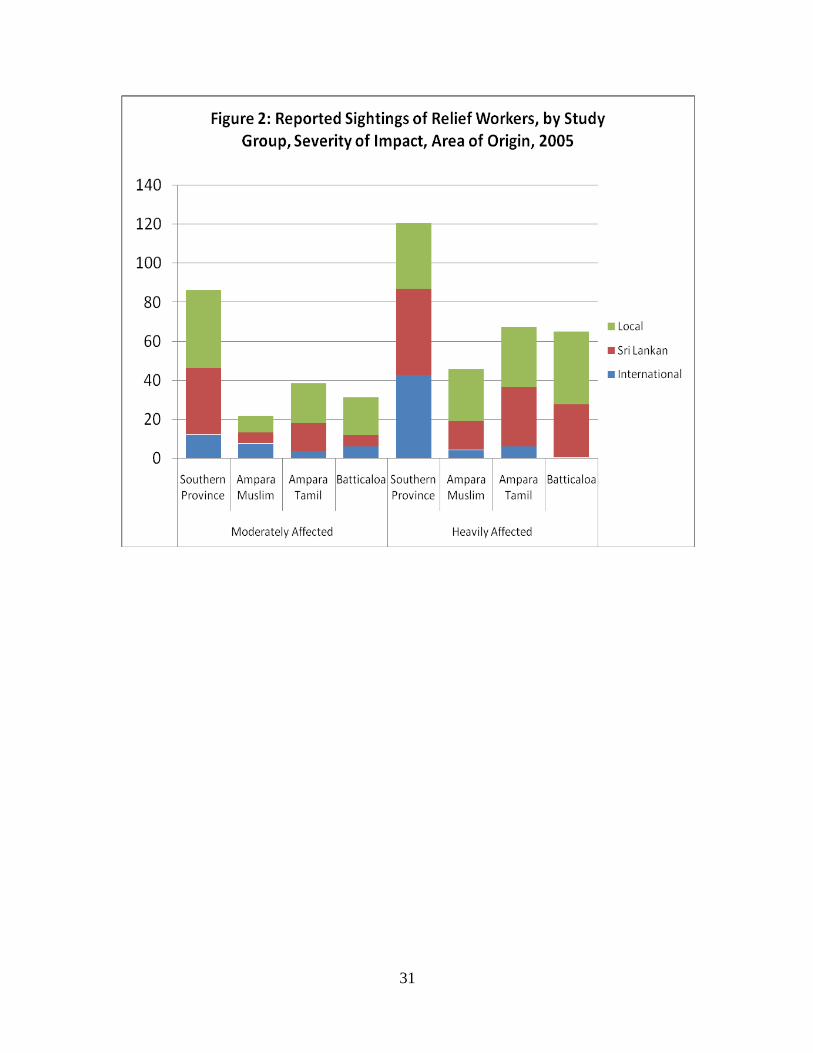
cannot be disaggregated to the GN level, the GN survey incorporated a subjective measure of relief activity: the presence of individuals conducting relief work. GNs were asked to report the number of aid workers whom they had seen in their community during the tsunami relief effort
during the 2005 calendar year for three categories of worker: people from the local community, people from elsewhere in Sri Lanka, and people from outside the country. These data showed a
high degree of consistency by study group and degree of tsunami damage, and a strong correlation with objective measures of impact such as housing recovery, suggesting that comparisons of relief worker presence across GN are indicative of relief effort.
Figure 2 depicts the presence of relief workers by study group and tsunami impact for heavily
and moderately affected communities. Heavily affected communities saw only slightly greater numbers of relief workers than moderately affected ones, perhaps because every affected
13
community requires a basic relief infrastructure that is not wholly proportionate to tsunami impact. More significantly, Southern Province saw about twice as many relief workers as other
areas, about 86 for moderately affected and 121 for heavily affected communities, even though a typical affected community in Southern Province lost few households, a smaller proportion of
households, and had less preexisting vulnerability than typical Eastern Province communities (see Table 3). Levels of relief worker contact were considerably lower among the three Eastern Province groups, with between-group variation in accordance with the average level of tsunami
impact: highest among Ampara Tamils, then Batticaloa Tamils, then Ampara Muslims.
[INSERT FIGURE 2 ABOUT HERE] Differences in the presence of Sri Lankan and international aid workers are also notable.
International aid worker sightings offer considerable evidence of tarmac bias, the tendency for international aid workers to visit places that are convenient. In Southern Province, the average
moderately affected community received 12 international workers on average, while the average heavily affected community received 42. A closer look at the data reveals a more obvious pattern whereby two heavily affected communities in the tourist area of Balapitiya saw 95 international
workers on average, while two moderately affected communities received 45 international workers. Five heavily affected communities in war torn Batticaloa District saw a single aid
worker between them, though moderately affected communities in Batticaloa saw six on average. These data indicate substantial regional variation in local, national, and international relief activities. Here again, differential administration of aid could have political causes or
ramifications.
Housing Construction
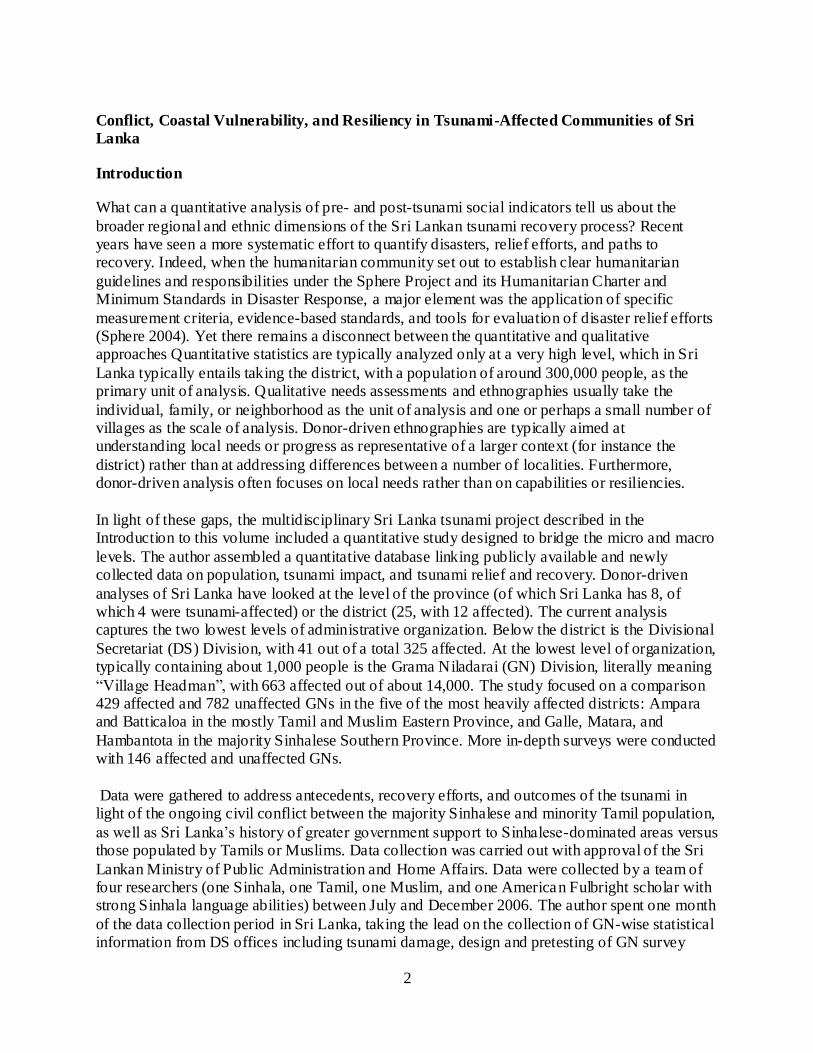
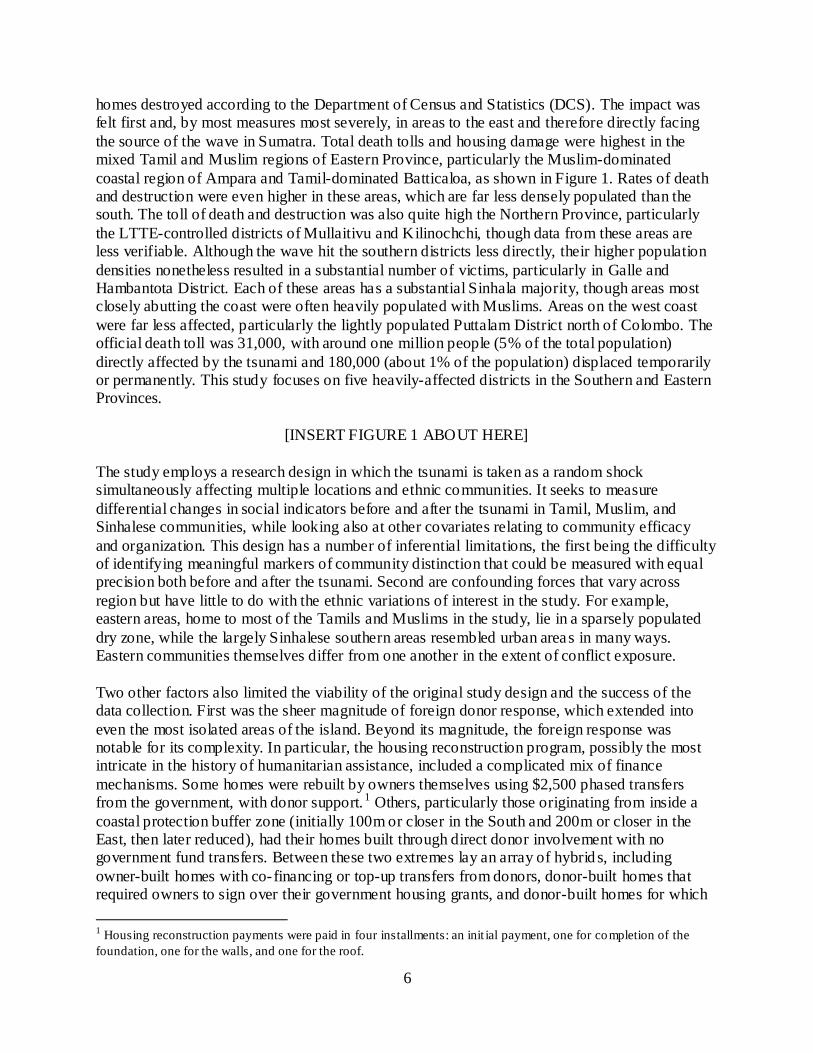
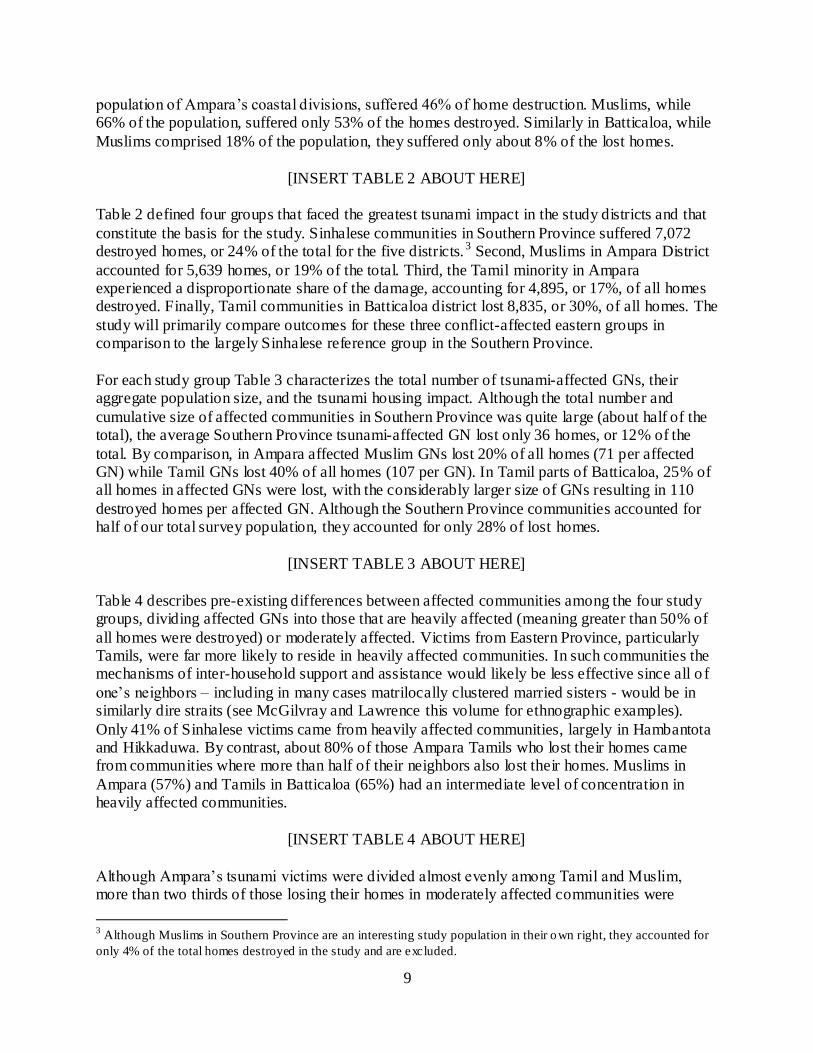
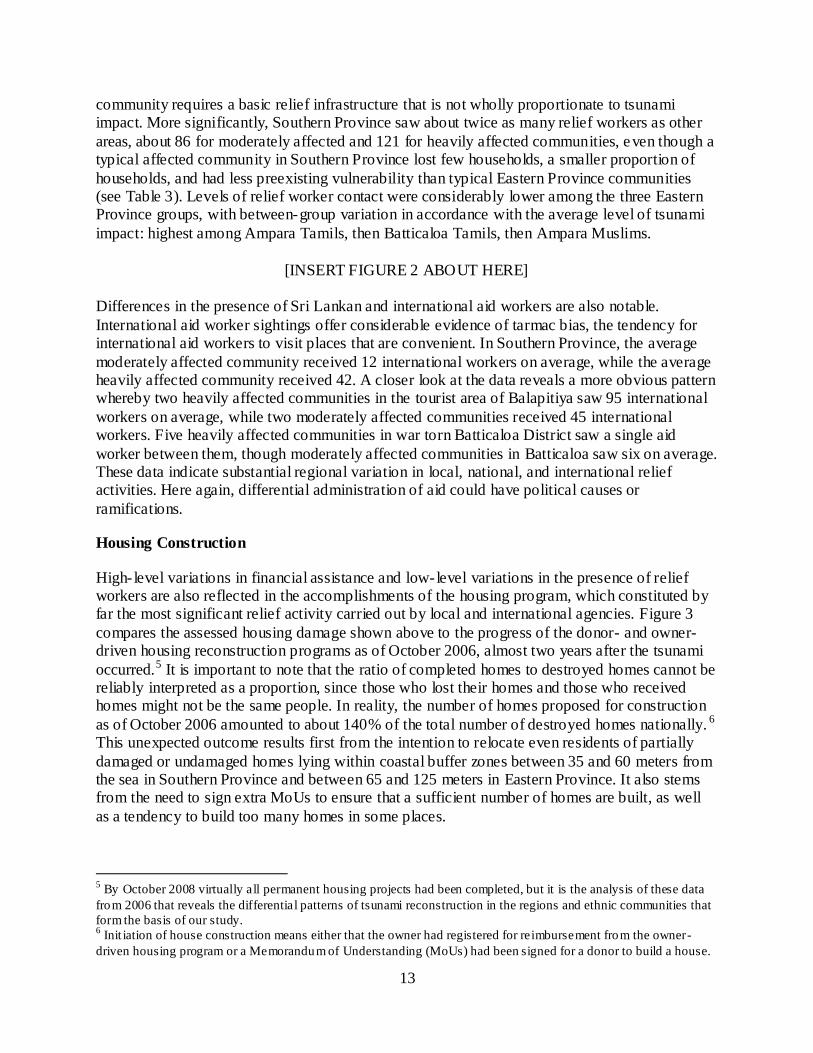
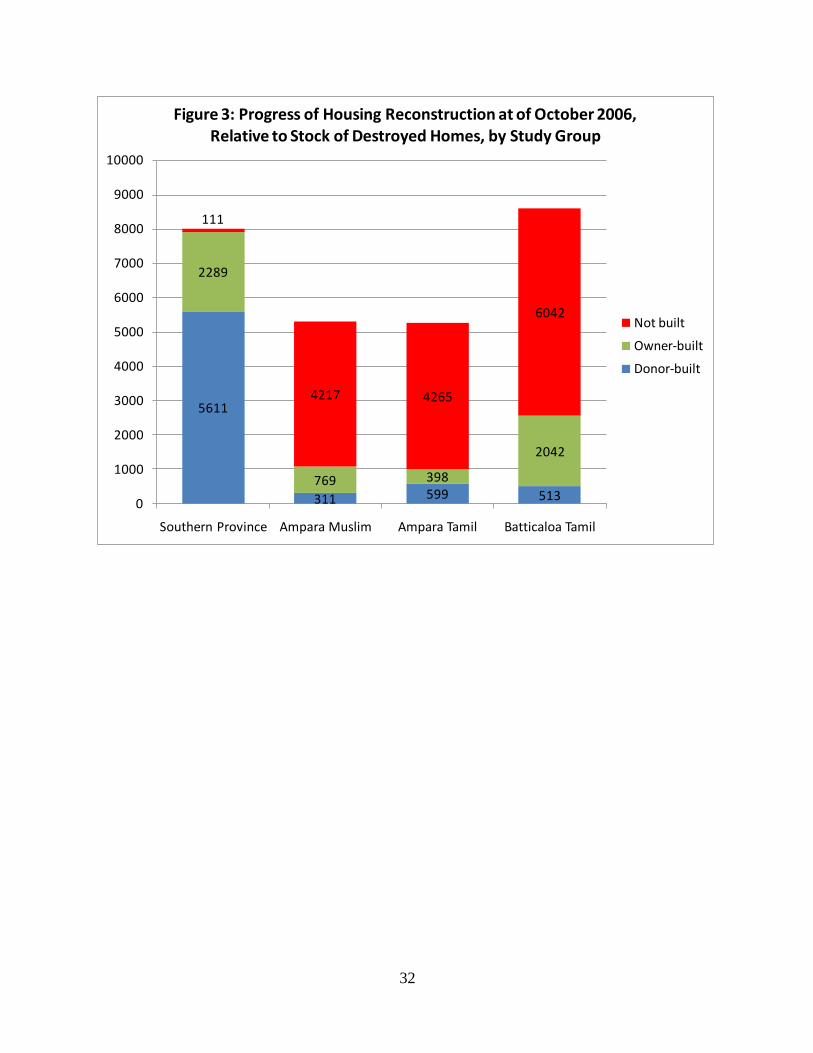
High-level variations in financial assistance and low-level variations in the presence of relief workers are also reflected in the accomplishments of the housing program, which constituted by far the most significant relief activity carried out by local and international agencies. Figure 3
compares the assessed housing damage shown above to the progress of the donor- and owner-driven housing reconstruction programs as of October 2006, almost two years after the tsunami
occurred.5 It is important to note that the ratio of completed homes to destroyed homes cannot be reliably interpreted as a proportion, since those who lost their homes and those who received homes might not be the same people. In reality, the number of homes proposed for construction
as of October 2006 amounted to about 140% of the total number of destroyed homes nationally. 6 This unexpected outcome results first from the intention to relocate even residents of partially
damaged or undamaged homes lying within coastal buffer zones between 35 and 60 meters from the sea in Southern Province and between 65 and 125 meters in Eastern Province. It also stems from the need to sign extra MoUs to ensure that a sufficient number of homes are built, as well
as a tendency to build too many homes in some places.
5 By October 2008 virtually all permanent housing projects had been completed, but it is the analysis of these data
from 2006 that reveals the differential patterns of tsunami reconstruction in the regions and ethnic communities that
form the basis of our study. 6 Init iation of house construction means either that the owner had registered for reimbursement from the owner-
driven housing program or a Memorandum of Understanding (MoUs) had been signed for a donor to build a house.
14
Relative to the total number of destroyed homes, the shaded segments of the bars indicate homes completed through the donor-driven program, those completed through the owner-driven
program, and those remaining to be built. In Southern Province, the number of completed homes was 99% of the number of destroyed homes, with a sizable majority (70%) built directly by
donors. By comparison, the number of complete homes was only 20% of the total for Ampara Muslims and 19% for Ampara Tamils. In the Ampara Tamil GNs, a bigger proportion of completed homes were built directly by donors. In Batticaloa, the number of completed homes
was slightly higher, at 30% of the total burden of destroyed hones, on the strength of a highly effective homeowner-driven housing program in Batticaloa Town. These differences could be
explained not only through political favoritism but also through tarmac bias, distance from the capital, and construction difficulties caused by the increase in the ethnic conflict.
[INSERT FIGURE 3 ABOUT HERE]
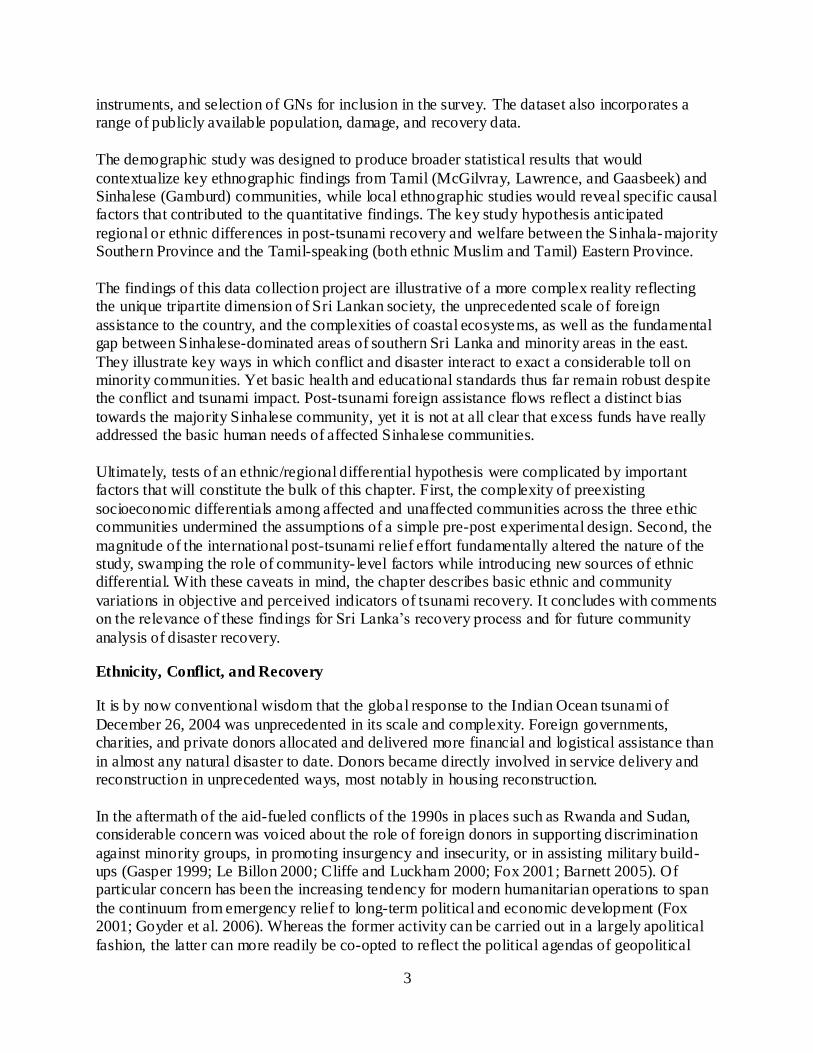
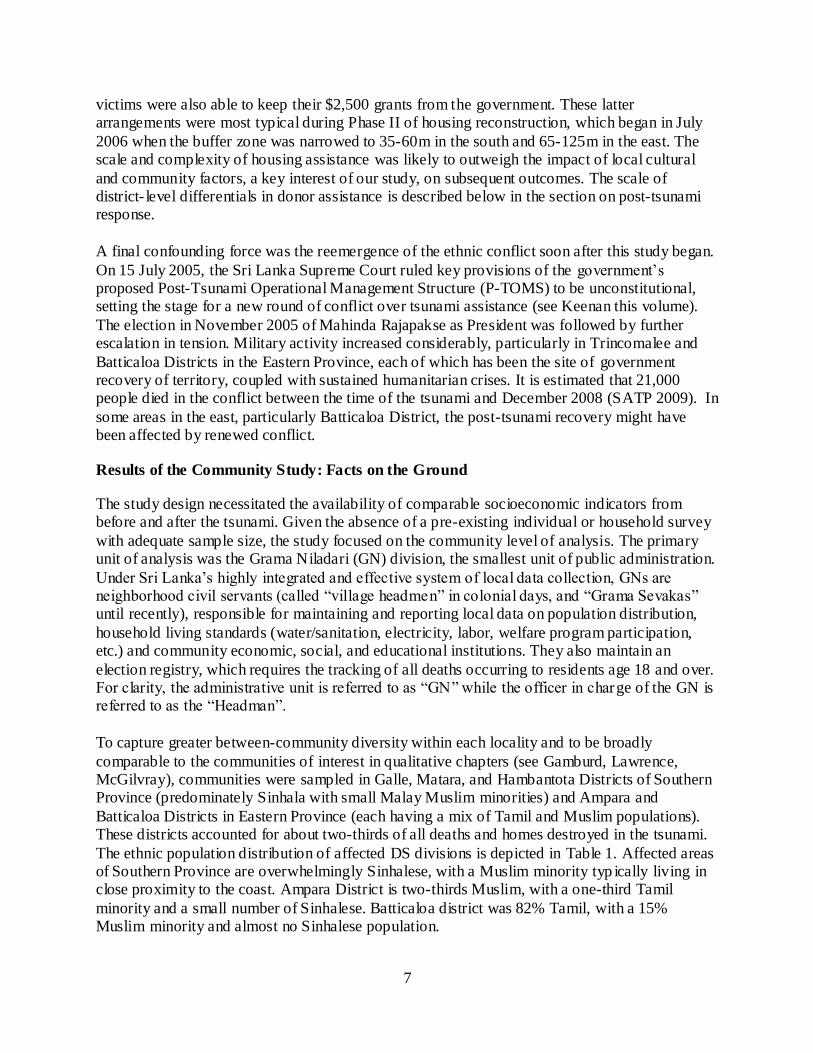
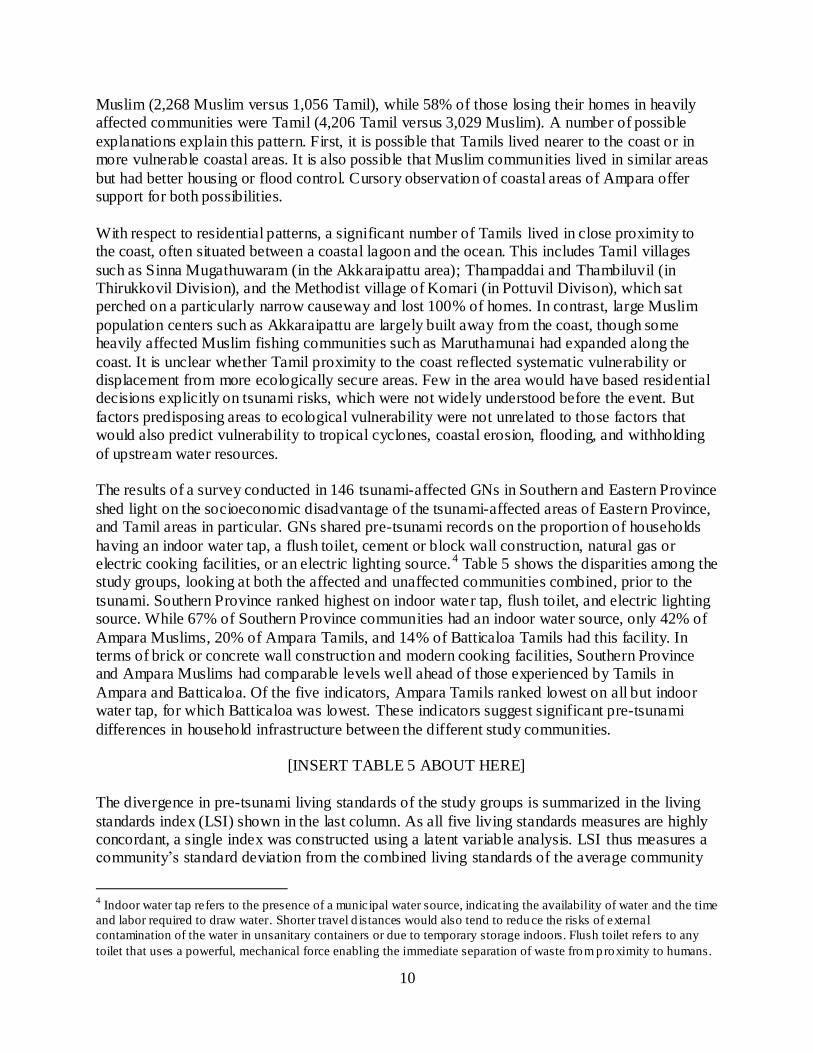
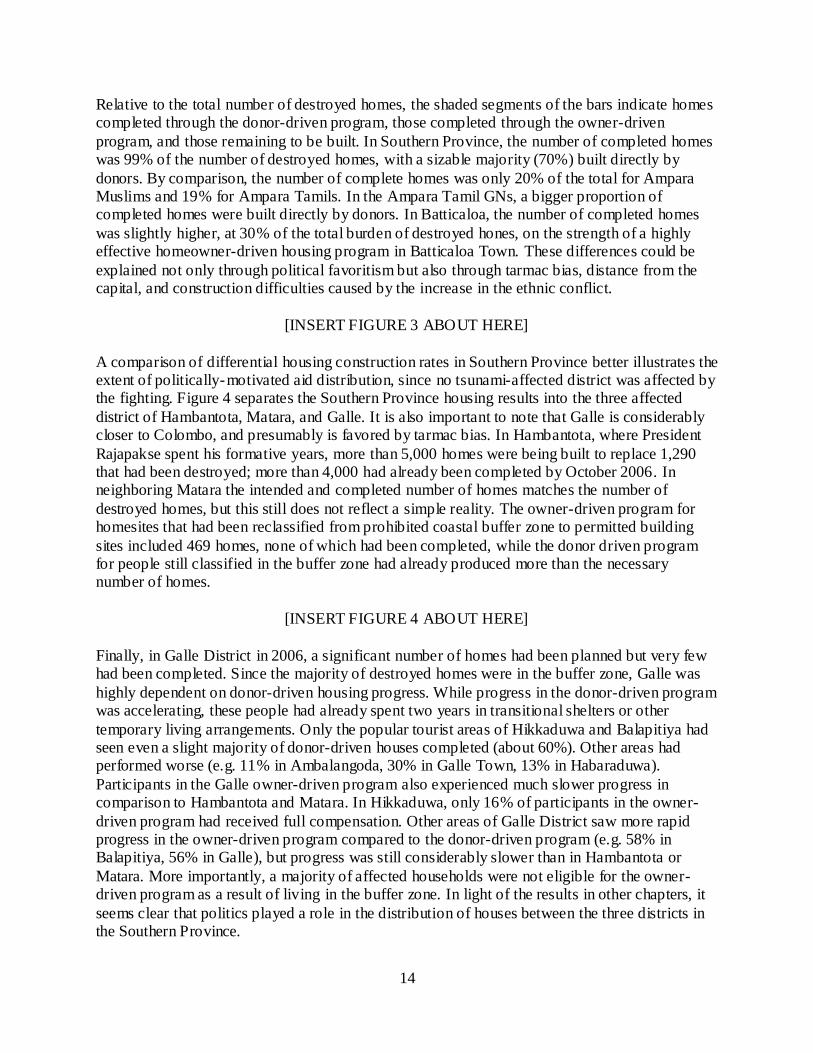
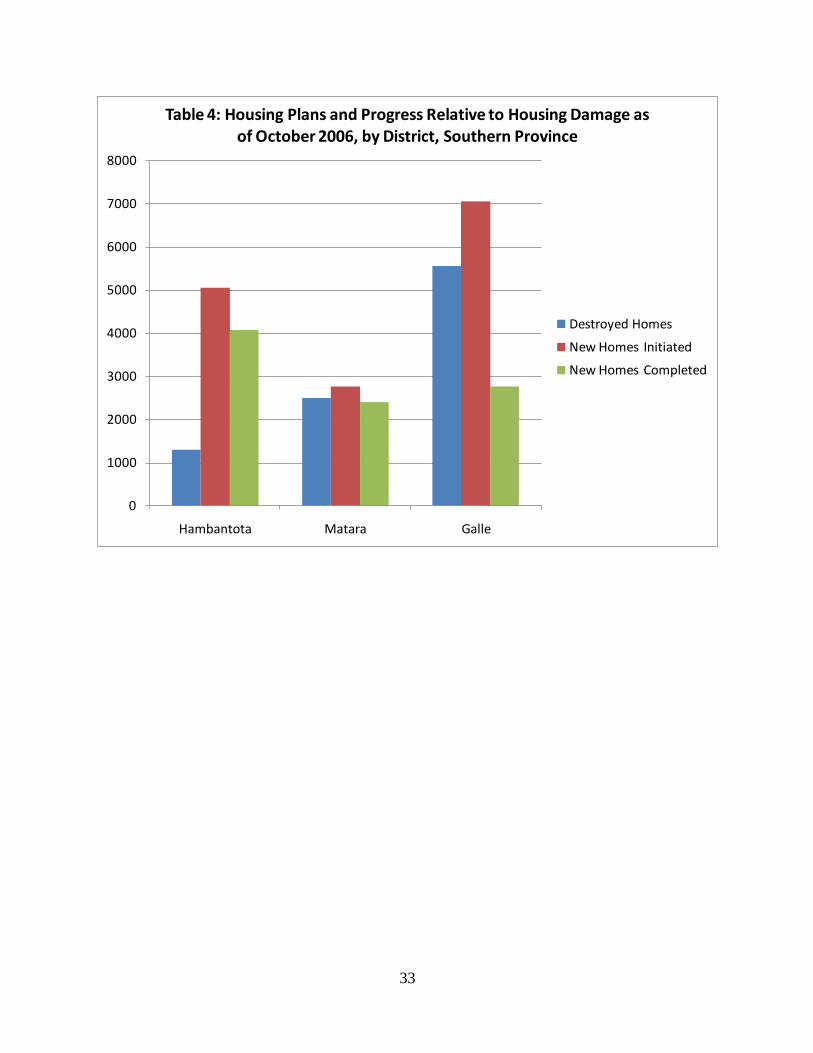
A comparison of differential housing construction rates in Southern Province better illustrates the extent of politically-motivated aid distribution, since no tsunami-affected district was affected by the fighting. Figure 4 separates the Southern Province housing results into the three affected
district of Hambantota, Matara, and Galle. It is also important to note that Galle is considerably closer to Colombo, and presumably is favored by tarmac bias. In Hambantota, where President
Rajapakse spent his formative years, more than 5,000 homes were being built to replace 1,290 that had been destroyed; more than 4,000 had already been completed by October 2006. In neighboring Matara the intended and completed number of homes matches the number of
destroyed homes, but this still does not reflect a simple reality. The owner-driven program for homesites that had been reclassified from prohibited coastal buffer zone to permitted building
sites included 469 homes, none of which had been completed, while the donor driven program for people still classified in the buffer zone had already produced more than the necessary number of homes.
[INSERT FIGURE 4 ABOUT HERE]
Finally, in Galle District in 2006, a significant number of homes had been planned but very few had been completed. Since the majority of destroyed homes were in the buffer zone, Galle was
highly dependent on donor-driven housing progress. While progress in the donor-driven program was accelerating, these people had already spent two years in transitional shelters or other
temporary living arrangements. Only the popular tourist areas of Hikkaduwa and Balapitiya had seen even a slight majority of donor-driven houses completed (about 60%). Other areas had performed worse (e.g. 11% in Ambalangoda, 30% in Galle Town, 13% in Habaraduwa).
Participants in the Galle owner-driven program also experienced much slower progress in comparison to Hambantota and Matara. In Hikkaduwa, only 16% of participants in the owner-
driven program had received full compensation. Other areas of Galle District saw more rapid progress in the owner-driven program compared to the donor-driven program (e.g. 58% in Balapitiya, 56% in Galle), but progress was still considerably slower than in Hambantota or
Matara. More importantly, a majority of affected households were not eligible for the owner-driven program as a result of living in the buffer zone. In light of the results in other chapters, it
seems clear that politics played a role in the distribution of houses between the three districts in the Southern Province.
15
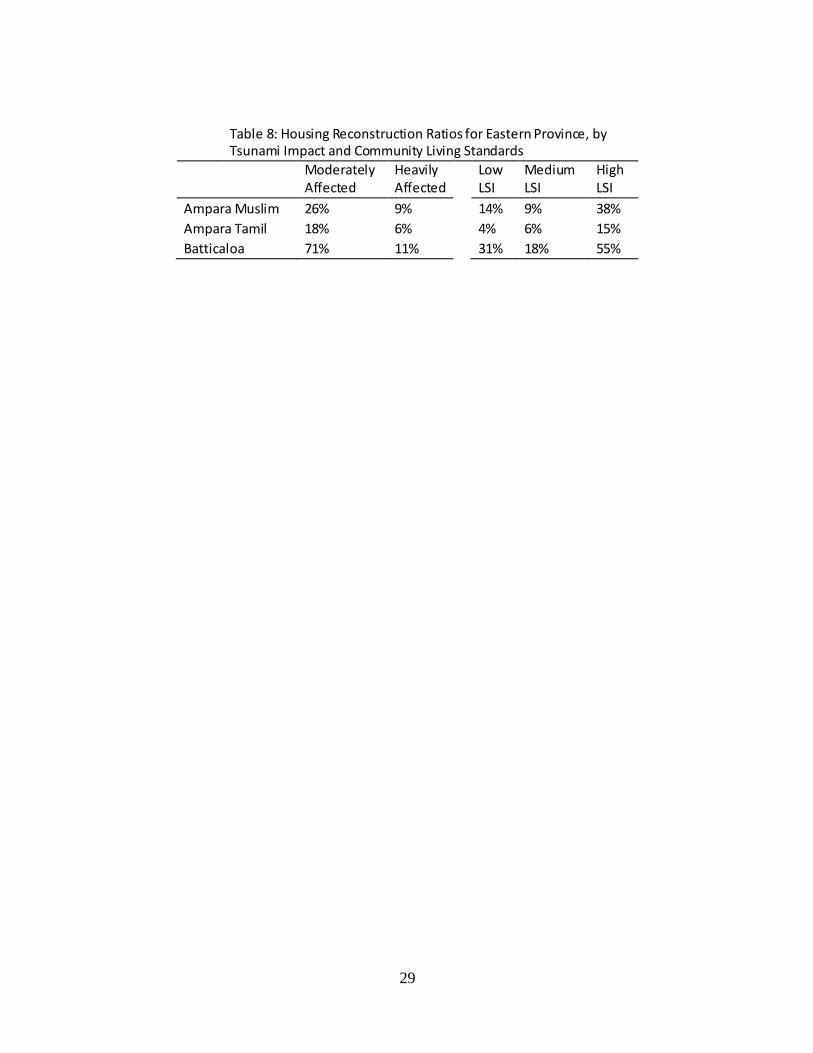
Finally, it is worth considering the relationship between coastal vulnerability and the pace of
housing reconstruction. While complete GN-specific housing progress records could not be constructed for Southern Province, Table 8 describes the ratio of completed homes to destroyed
homes for the three Eastern Province study groups, by level of tsunami impact (for all GNs) and by the Living Standards Index (for the surveyed GNs). The imposition of the coastal buffer zone had a devastating effect on the pace of housing reconstruction in heavily affected communities
where it would have been difficult to rebuild in any case. In all cases the rate of home construction was three times higher in moderately affected communities compared to heavily
affected communities. In Batticaloa where the owner-driven program was so effective, 71% of homes in moderately affected communities had been rebuilt by October 2006 compared to only 11% in heavily affected communities. In Ampara, the burden of slow housing reconstruction in
heavily affected GNs fell particularly hard on Tamils, who were overrepresented in heavily affected communities where only 6% of homes had been rebuilt after two years.
The second set of results in Table 8 illustrates the burden of the housing reconstruction program on the poor, particularly poor Tamils living in Ampara. Coastal Tamil communities in Ampara
bore a triple burden given their preexisting disadvantages (see Table 6), their more comprehensive tsunami losses (see Tables 3 and 4), and the housing reconstruction deficit. Low
LSI Ampara Tamil communities had a reconstruction rate of 4%, compared to 6% for middle and 15% for high LSI communities.7
In summary, the data presented here indicate significant regional and ethnic variation in relief and recovery operations.
[INSERT TABLE 6 ABOUT HERE]
Post-Tsunami Exam Scores
A final study goal was to assess the differential impact of the tsunami on measurable human welfare outcomes. One outcome of great importance in the lives of young people in Sri Lanka is
the nationwide Grade 5 scholarship examination. The exam provides an objective measure of community academic achievement, and holds considerable consequences for future progress.
Children passing the scholarship exam are eligible for admission to competitive national schools. Those from poor households are also eligible for scholarship funding from government, corporate, and non-profit sources. The exam measures academic achievement, not basic aptitude,
in mathematics and the student‟s primary language (World Bank 2008). It therefore offers some indication of children‟s knowledge acquisition, retention, and test performance in the year before
and after the tsunami. Exam results were gathered from the national Department of Examinations for all schools in the
five districts of interest, including divisions further away from the ocean. The results of exams taken in August 2004, just before the tsunami, and August 2005, the year immediate ly following
the tsunami were selected for analysis. Because it is difficult to link individual schools and GNs, the source of variation is the amount of tsunami damage in the DS division of which the GN
7 It should be noted that no data source accounts for houses that were built without donor assistance.
16
division is a part.8 Separate results for the different study groups in Eastern Province are not presented due to sample size limitations. The total sample includes 1,076 schools in Southern
Province (with 37,692 applicants in 2004, and 35,373 in 2005) and 685 in Eastern Province (12,041 applicants in 2004, 12,351 in 2005).
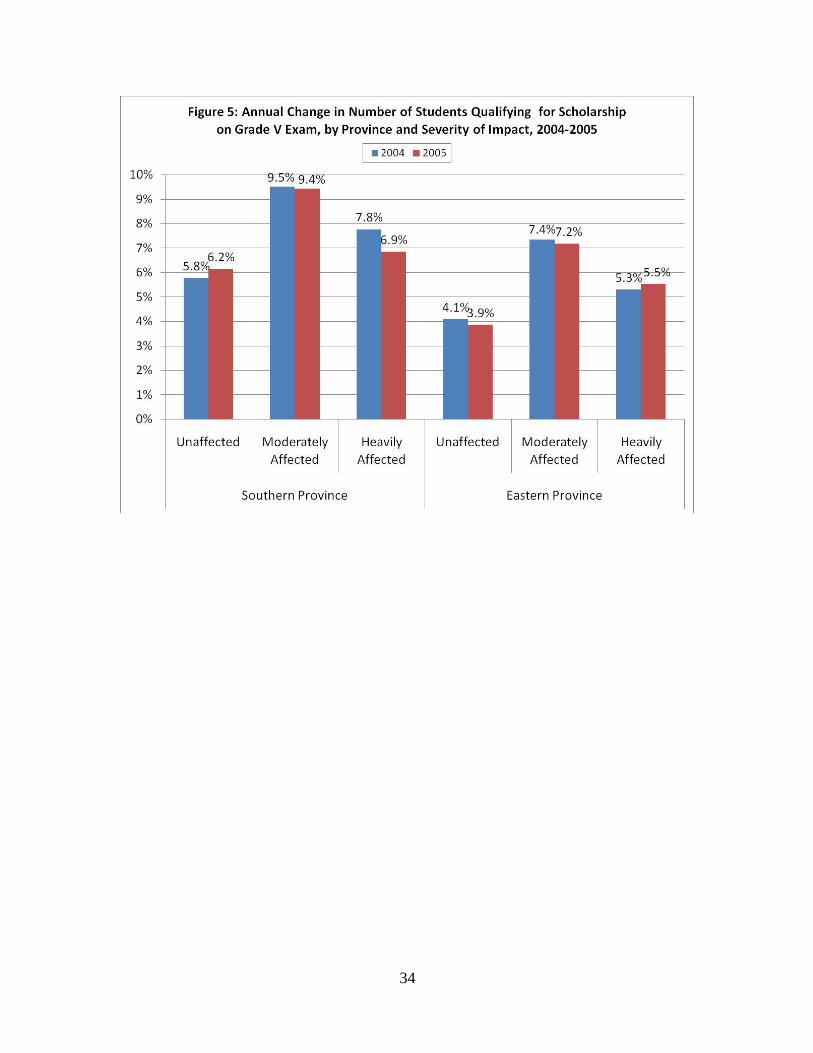
Figure 5 summarizes changes in test outcomes from 2004 to 2005 for schools in unaffected, moderately affected, heavily affected divisions of Southern and Eastern Province. Before and
after the tsunami, qualification rates were higher in Southern Province (7.1%) than in Eastern Province, (5.6%). In both areas, qualification rates were highest in moderately affected DSs, then
in heavily affected, and lowest in unaffected. Between 2004 and 2005, the qualification rate rose slightly in unaffected areas (5.8% to 6.2%) and declined only slightly in moderately affected DSs (9.5% to 9.4%), but decline substantially in heavily affected DSs from 7.8% to 6.9%, or a 13%
drop. Since the number taking the test also declined slightly in affected areas, the actual number of qualifiers was reduced by 60 in moderately affected areas, or a 7.5% reduction, and by 100
students in heavily affected areas, or a 15.4% reduction. The greatest declines were seen in economically advanced urban areas, including some of the largest recipients of post-tsunami assistance. Tangalle division lost 62 qualifiers, or a 27% drop, Matara Four Gravets (Matara
City) lost 60 for a 19% drop, and Hikkaduwa lost 36, for a 50% drop.
In contrast, both attendance and qualification rates remained relatively stable in all parts of Eastern Province.9 Pass rates dropped slightly in unaffected (4.1% to 3.9%) and moderately affected DSs (7.4% to 7.2%) but actually rose slightly in heavily affected areas, from 5.3% to
5.5%. The over-all number of qualifiers did not decline in any part of Eastern Province, including a small but still surprising 4% increase in the heavily affected areas.
It is difficult to reconcile these changes in academic achievement with the broader context of tsunami impact and relief, but a few caveats are worth mentioning. First, exams were taken only
8 months after the tsunami, so results may not reflect recovery so much as immediate impact. Students in tsunami-affected areas of Southern Province, having a history of high qualification
rates, also had more room to lose ground. Many of the worst hit Tamil areas of Eastern Province had almost no qualifiers in either 2004 or 2005, and thus little room for decline. Yet qualification rates remained stable even in high-achieving, heavily affected parts of Ampara and Batticaloa.
For at least this one human welfare outcome, the results do not reinforce that inequities observed in terms of preexisting vulnerability, financial commitment, aid worker presence, or housing
reconstruction.
8 Because DS d ivisions are much larger and extend further inland in Southern Province, the cut -off for a heavily
affected district there was 5% of all homes destroyed, whereas the cut-off in Eastern Province was 15% of all
homes. The reported relat ionships also hold when a continuous measure of DS -level housing damage is correlated
with exam outcomes. 9 Some of this pattern may be exp lained by the fact that the minimum qualificat ion score was reduced considerably
for Ampara District, from 126 to 118, and in Batticaloa District, from 128 to 124. In Galle and Matara, the minimum
score was reduced only from 133 to 132, while in Hambantota it rose from 130 to 131. All changes in min imum
qualification score were consistent within District, and thus should have resulted in equal changes in qualification
rates in tsunami-affected and unaffected areas. Since these results reflect tsunami-related differences in the relative
change from 2004 to 2005, changes in scoring criterion should not obviously affect the results.
17
Conclusions
While a complete assessment of the impacts of the tsunami and its complex reconstruction
process is yet to come, this inter-regional and inter-ethnic study of grassroots statistical data suggests that a micro-demographic approach can pose new questions and yield new insights for
multidisciplinary post-disaster research. This sprawling comparison of tsunami-affected communities before, during, and after the tsunami has attempted to place the disaster into a local and regional context of selective political opportunism, population movements, and
socioeconomic disadvantage, all in some ways connected to the island‟s ongoing civil conflict.
On the day of the tsunami, striking regional variations in the coastal vulnerability and tsunami impact largely reflected the cleavages of Sri Lanka‟s ongoing civil conflict. Tamil and Muslim areas in the east showed substantially higher concentrations of tsunami damage and lower living
standards than Sinhala-majority areas of the South. Variations within the east are illustrative of the more immediate connections between conflict and ecological vulnerability. As in many areas
of the developing world, in Sri Lanka traditional areas of high settlement density tend to be situated a moderate distance from the coastline, enabling access to coastal economic opportunities and amenities without exposure to coastal disaster risks. Throughout the
developing world rapid population growth and movement have led to the formation of new settlements in areas nearer or farther from the coast, typically by vulnerable, low status
populations. In Eastern Sri Lanka, several aspects of the ongoing conflict – including Sinhalese settlements, LTTE guerilla camps, and military closures – have restricted inland settlement opportunities. Although this paper does not document these movements, it does document the
considerable concentration of Tamil communities, particularly in areas of Muslim- and Sinhala-dominated Ampara District, in vulnerable coastal settings, typically with water on all sides. Such
communities also showed deep pre-existing socioeconomic disadvantages in comparison to less affected Tamil communities and to similarly affected Muslim ones.
In the aftermath of the tsunami, foreign assistance efforts placed considerable emphasis on the less heavily affected communities in Southern Province, seemingly at the expense of more
vulnerable, more heavily affected areas of Eastern Province. This was visible in levels of foreign financial assistance, in local perceptions of aid worker presence on the ground, and in the pace of housing reconstruction. The challenging context of disaster recovery in a conflict-affected
environmental was reflected in the politics of the coastal buffer zone, which was initially set to 200 meters in the east versus 100m in the south, leading to observable deficits in housing
progress and widespread perceptions of bias. In Southern Province, the largely donor-driven housing program in Hambantota and Matara Districts offered a means of expressing favoritism not merely vis-à-vis the east, but also in comparison to neighboring Galle District. This
favoritism is clearly not ethnic in nature, but rather fits with a general pattern of political party-based distribution of entitlements in Sinhalese areas of Sri Lanka: areas such as Hambantota that
are supportive of the current ruling party received substantially greater support than opposition-led areas such as Galle. While the scale or effectiveness of relief efforts did not vary substantially between the Muslim and Tamil communities of Eastern Province, the distribution
of relief did not take into account the greater level of vulnerability among Tamil affected communities.
18
In a separate paper, the excess tsunami impact in the northeast was combined with the excess tsunami relief to estimate that the tsunami constituted about $500 million in excess net losses for
the east and north compared to the south (Kuhn 2009). This include a rather conservative assessment of the value of a lost life at $50,000, but the tsunami would have constituted a
considerable net transfer from northeast to southwest under any assumptions. This deficit must surely create a perception of grievance within the Tamil and Muslim communities. It is also possible that the greater net impact on the Tamil community contributed to the government‟s
decision to increase defense spending in an effort to defeat the Tamils on the battlefield, an effort that will in all likelihood lead to the return of the entire island to government control.
While the study documents significant conflict-related variations in prior vulnerability and subsequent relief activity, it was not able to link these with welfare outcomes. In the context of
the current chapter, for instance, it remains unclear whether the extra a id and homes poured into Hambantota actually generated a welfare benefit. It is unclear who received these new houses,
whether unaffected families received them, and whether the homes were of satisfactory quality. Certainly visual and anecdotal evidence would cause one to question the merits of the extra homes in Hambantota, which are situated in a dry interior area 14km from the city centre and the
coastal livelihoods of many affected communities. Analysis of children‟s scholarship exam scores suggested a pattern of deterioration among affected Sinhalese communities and resiliency
among Eastern Province Tamil and Muslim communities. Further research is needed to link variations in financial assistance and relief effort with measurable variations in welfare. For a society as fragmented and trouble as Sri Lanka‟s, however, any perception of bias, whether
based in intentions, allocations, or outcomes, may only add to the grievances that have been accumulating for decades.
19
References
Barnett. M. (2005) „Humanitarianism Transformed‟, Perspectives on Politics, 3: 723-740
Bastian, S. (1999) „The failure of the state formation, identity conflict and civil society responses
– the case of Sri Lanka‟, University of Manchester/University of Bradford, p.24. Benini, A., Conley, C., Dittemore, B. and Waksman, Z. (2008) „Survivor Needs or Logistical
Convenience? Factors Shaping Decisions to Deliver Relief to Earthquake-Affected Communities, Pakistan 2005–06‟, Disasters, 33(1): 110-131.
Blaikie, P. M., and Brookfield, H. C. (1987) Land degradation and society, London: Methuen.
Bryant, R and Bailey, S. (1997) Third World political ecology, London: Routledge.
Bohle, H-G and Fünfgeld, H. (2007) „The Political Ecology of Violence in Eastern Sri Lanka‟, Development and Change, 38(4): 667-687
Buchanan-Smith, M.S. and Maxwell, S. (1994) „Linking relief and development: an introduction and overview‟, IDS Bulletin, 25(4).
Bush, K.D. (1993) „Reading Between the Lines: Intra-Group Heterogeneity and Conflict in Sri Lanka‟, Refuge, 13(3): 15-22.
Cliffe, L. and Luckham, R. (2000) „What Happens to the State in Conflict? Political Analysis as
a Tool for Planning Humanitarian Assistance‟, Disasters, 24(4): 291-313 Department of Census and Statistics (2005) Census on the Buildings and People Affected by the
Tsunami, web-based reporting and personal data transmission.
Department of Census and Statistics (2001) Census of Population and Housing, CD Data file. Department of Elections (2008). http:// slelections.gov.lk. Government of Sri Lanka.
Development Assistance Database (2008) United Nations Development Program, Bangkok.
De Silva, K.M. (1997) „Affirmative Action Policies: The Sri Lankan Experience ‟, Ethnic Studies Report, XV(2): 245-287.
Dunham, D. and Jayasuriya, S. (2001) „Liberalisation and Poilitical Decay: Sri Lanka‟s Journey
from Welfare State to a Brutalised Society‟, Institute of Social Studies, Netherlands, Working Paper 352.
Easterly, W. (2003) „The cartel of good intentions: the problem of bureaucracy in foreign aid‟, Journal of Policy Reform, 5(4): 1–28.
20
Fengler, W., Ihasn, A. and Kaiser, K. (2008) „Managing Post-Disaster Reconstruction Finance: International Experience in Public Financial Management‟, World Bank Policy Research
Working Paper No. 4475.
Fox, F. (2001) „New Humanitarianism: Does It Provide a Moral Banner for the 21st Century? ‟, Disasters, 25(4): 275-289
Freeman, P.K. (2004) „Allocation of post-disaster reconstruction financing to housing‟, Building Research & Information, 32(5): 427-437
Gasper, D.R. (1999) „“Drawing a line”: Ethical and political strategies in complex emergency assistance‟, European Journal of Development Research, 11(2): 87–114.
Goyder, H., Coventry, C., Adams, J., Kaiser, T., Williams, S. and Smillie, I. (2006) Linking
Relief, Recovery, and Development (LRRD) – Policy Study, London: Tsunami Evaluation Coalition.
Hilhorst, D. (2002) „Being Good at Doing Good? Quality and Accountability of Humanitarian NGOs‟. Disasters, 26(3): 193–212.
Houghton, R. (2007) The Tsunami Evaluation Coalition: Implications for Practice, London: Tsunami Evaluation Coalition.
Korf, B. (2005) „Rethinking the Greed–Grievance Nexus: Property Rights and the Political
Economy of War in Sri Lanka‟, Journal of Peace Research, 42(3): 201-217. Korf, B. and Engel, S. (2006) „On the Incentives of Violence: Greed and Pride in Sri Lanka‟s
Civil War‟, South Asia Economic Journal, 7(1): 99-116.
Korf, B. and Silva, K.T. (2003) „Poverty, Ethnicity and Conflict in Sri Lanka‟, in Staying Poor: Chronic Poverty and Development Policy. Chronic Poverty Research Centre, Department for International Development, UK.
Kuhn, R. (2008) „Tsunami and Conflict in Sri Lanka‟, Background paper, World Bank Research
Group. ------- (2009) „An Ethno-Political Accounting of the Sri Lankan Tsunami Impact and Recovery‟,
in S. Reddy, H. Naraindas, P. Greenough (eds.), Re-Examining Disaster, Recovery and Reconstruction: Social Science Perspectives on the Tsunami.
Le Billon, P. (2001) „The political ecology of war: natural resources and armed conflicts‟, Political Geography, 20(5): 561-584.
Macrae, J., Bradbury, M., Jaspars, S., Johnson, D. and Duffield, M. (1997) „Conflict, the
Continuum and Chronic Emergencies: A Critical Analysis of the Scope for Linking Relief, Rehabilitation and Development Planning in Sudan‟, Disasters, 21(3): 223–43.
21
Morris, S. S. and Q. Wodon (2003) „The Allocation of Natural Disaster Relief Funds: Hurricane
Mitch in Honduras‟, World Development, 31(7): 1279–89.
Peebles, Patrick (1990) „Colonization and Ethnic Conflict in the Dry Zone of Sri Lanka‟, Journal of Asian Studies, 49(1): 30-55.
Peebles, Patrick (2006) The History of Sri Lanka, Westport, CT: Greenwood Publishing Group.
Peet, R. and Watts, M., Eds, (2004) Liberation ecologies (2nd ed.), Routledge, London. Peluso, N.L. and Watts, M. (2001) Violent environments, Ithaca, NY: Cornell University Press.
Routray, B.P. and Singh, A.K. (2007) „The Pawns of War‟ South Asia Intelligence Review 5(12).
Slim, H, (1997) „Doing the Right Thing: Relief Agencies, Moral Dilemmas and Moral Responsibility in Political Emergencies and War‟, Disasters, 21(3): 244–57.
Smillie, I. (2001) „From Patrons to Partners?‟ in I. Smillie (eds.), Patronage or Partnership:
Local Capacity Building in Humanitarian Crises, Bloomfield: Kumarian Press, 175–93. Smillie, I. and Minear, L. (2003) The Quality of Money: Donor Behavior in Humanitarian
Financing: An Independent Study, Somerville, MA: Tufts University.
South Asia Terrorism Project (2009), Sri Lanka Assessment 2009. SPHERE Project (2004) Humanitarian Charter and Minimum Standards in Disaster Response,
http://www.sphereproject.org/handbook/pages/navbook.htm?param1=0.
Tong, J. (2004) „Questionable Accountability: MSF and Sphere in 2003‟, Disasters 28(2): 176–89.
Uvin, P. (1998) Aiding Violence: The Development Enterprise in Rwanda, West Hartford, Connecticut: Kumarian Press.
Waters, T. (2001) Bureaucratizing the Good Samaritan: The Limitations to Humanitarian Relief Operations, Boulder, CO: Westview Press.
Weiss, T.G. (1999) „Principles, Politics and Humanitarian Action‟, Ethics and International
Affairs, XIII: 1–32.
22
Table 1: Ethnic Population Distribution of Coastal DS Divisions for Study Districts
Sinhala Tamil Muslim Total
Ampara 10,795 101,961 201,360 314,116
3% 32% 64%
Batticaloa 5,813 260,596 58,831 330,998
2% 79% 18%
Galle 425,557 251 44,526 470,334
90% 0% 9%
Hambantota 235,576 571 13,966 250,107
94% 0% 6%
Matara 262,474 632 12,357 275,542
95% 0% 4%
Total 940,215 364,011 331,040 1,641,097
57% 22% 20%
23
Table 2: Ethnic Distribution of Homes Destroyed or made Unusable in Indian Ocean Tsunami, Study Districts
Sinhala Tamil Muslim Total % of Total
Ampara 38 5,351 5,175 10,566 21.5%
0% 51% 49%
Batticaloa 41 8,615 974 9,835 19.6%
0% 88% 10%
Galle 5,117 6 434 5,557 11.3%
92% 0% 8%
Hambantota 960 5 326 1,290 2.6%
74% 0% 25%
Matara 2,063 7 427 2,500 4.9%
83% 0% 17%
Total 8,219 13,984 7,336 29,748 59.9%
28% 47% 25%
24
Table 3: Characteristics and Tsunami Impact for Key Study Groups
GNs Population Households Homes Destroyed
Percent Destroyed
Homes Destroyed per GN
Southern Province 225 317,631 68,473 8,011 12% 36
Ampara Muslim 75 116,472 26,807 5,297 20% 71
Ampara Tamil 49 54,599 13,232 5,262 40% 107
Batticaloa 80 127,182 33,240 8,675 26% 108
Total 429 615,884 141,752 27,245 19% 64
25
Table 4: Extent of Tsunami Housing Damage, by Study Group and Severity of Impact
Moderate Damage Heavy Damage
Households Homes Destroyed
% Destroyed Households
Homes Destroyed
% Destroyed
Southern Province 62,091 4,765 8% 6,382 3,246 51%
Ampara Muslim 20,830 2,268 11% 5,977 3,029 51%
Ampara Tamil 7,192 1,056 15% 6,040 4,206 70%
Batticaloa 24,861 3,071 12% 8,379 5,604 67%
Total 11,160 16,085
26
Table 5: Community Indicators of Household Living Standards prior to tsunami, by Study Group
Indoor Water Tap
Flush Toilet
Cement or Block Walls
Cooking gas / electric
Lighting source electric
Living Standards Index
Southern Province 67% 84% 89% 46% 84% 0.45
Ampara Muslim 42% 73% 93% 46% 67% 0.07
Ampara Tamil 20% 62% 61% 14% 42% -0.90
Batticaloa 14% 71% 74% 24% 56% -0.62
Total 47% 76% 83% 38% 71% 0.00
27
Table 6: Community Living Standards prior to tsunami, by Study Group and Severity of Impact
Study Group Unaffected Moderately Affected
Heavily Affected Total
Southern Province 0.12 0.72 0.45 0.45
Ampara Muslim 0.03 0.05 0.44 0.07
Ampara Tamil -1.19 -0.46 -0.95 -0.90
Batticaloa -0.66 -0.62 -0.48 -0.62
Total -0.19 0.23 -0.30 0.00
28
Table 7: Donor Financial Commitments in Relation to Homes Destroyed, by District
Total Commitment Housing Commitment Housing Expenditure
District Homes Destroyed
Total ($millions)
Dollars per Home
Total ($millions)
Dollars per Home
Total ($millions)
Dollars per Home
Ampara 10,553 369 34,966 53 5,060 28 2,613
Batticaloa 9,630 263 27,310 60 6,262 28 2,949
Galle 5,544 184 33,189 42 7,612 25 4,578
Hambantota 1,288 182 141,304 33 25,388 25 19,185
Matara 2,398 171 71,309 34 13,970 18 7,611
29
Table 8: Housing Reconstruction Ratios for Eastern Province, by Tsunami Impact and Community Living Standards
Moderately Affected
Heavily Affected
Low LSI
Medium LSI
High LSI
Ampara Muslim 26% 9% 14% 9% 38%
Ampara Tamil 18% 6% 4% 6% 15%
Batticaloa 71% 11% 31% 18% 55%
30
Figure 1: Tsunami Deaths and Homes Destroyed by District
Source: Deaths from National Disaster Management Centre (2005); Homes from Department of Census and Statistics (2005)
31
32
5611
311 599 513
2289
769 398
2042
111
4217 4265
6042
0
1000
2000
3000
4000
5000
6000
7000
8000
9000
10000
Southern Province Ampara Muslim Ampara Tamil Batticaloa Tamil
Figure 3: Progress of Housing Reconstruction at of October 2006, Relative to Stock of Destroyed Homes, by Study Group
Not built
Owner-built
Donor-built
33
0
1000
2000
3000
4000
5000
6000
7000
8000
Hambantota Matara Galle
Table 4: Housing Plans and Progress Relative to Housing Damage as of October 2006, by District, Southern Province
Destroyed Homes
New Homes Initiated
New Homes Completed
34