Embed Size (px)
Citation preview
Facts and Myths about Global
WarmingJohn R. Christy
NWS Climate Services
University of Alabama in Huntsville20 June 2007

Consensus is not Science
Michael Crichton

Consensus is not Science
William Thompson (Lord Kelvin)
All Science is numbers
Michael Crichton

Some people will do anything to save the Earth ...
except take a science course.

Some people will do anything to save the Earth ...
except take a science course.
Greenhouse “Affect”, Rolling Stone
P.J. O’Rourke

Two Main observing systems for detecting
Greenhouse Gas effects
• Surface thermometers– Daily High Temperature– Daily Low Temperature– Daily Mean Temperature
(popular)
• Upper Air Temperatures– Balloon – Microwave emissions

"Global" Surface Temperature HadCRUT3
-0.8
-0.6
-0.4
-0.2
0.0
0.2
0.4
0.6
1850 1870 1890 1910 1930 1950 1970 1990 2010
Constructed from Mean Temperatures

Vertical Temperature Change due to Greenhouse Forcing in
Models
Model Simulations of Tropical Troposphere Warming:About 2X surfaceLee et al. 2007

Is Mean Surface Temperature an
Appropriate Index for the Greenhouse Effect?
TMean = (TMax + TMin)/2

Day vs. Night Surface Temp
Nighttime - disconnectedshallow layer/inversion. Temperature affected by land-use changes, buildings, farming, etc.
Daytime - deep layer mixing, connected with levels impacted by enhanced greenhouse effect
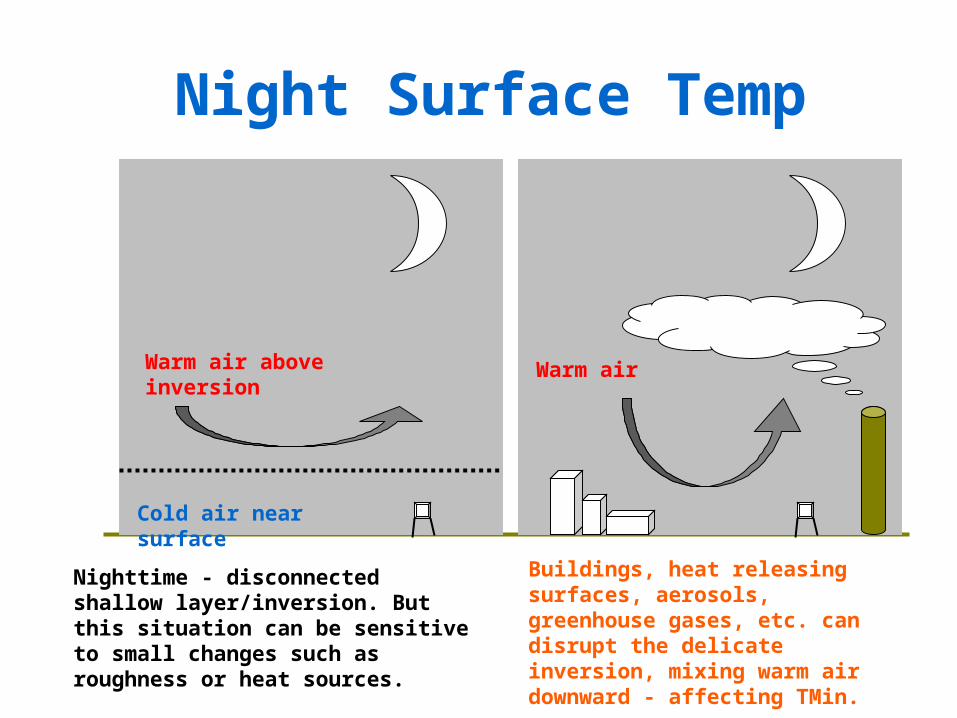
Night Surface Temp
Nighttime - disconnectedshallow layer/inversion. But this situation can be sensitive to small changes such as roughness or heat sources.
Buildings, heat releasing surfaces, aerosols, greenhouse gases, etc. can disrupt the delicate inversion, mixing warm air downward - affecting TMin.
Warm air above inversion
Cold air near surface
Warm air

The nighttime minimum is related to the delicate formation of the nocturnal boundary layer which can be easily disrupted, mixing warm air downward and sending temperatures up dramatically
Walters et al. (in press)

No. Alabama Summer TMax Temperatures
28
30
32
34
36
1890 1910 1930 1950 1970 1990 2010
Observations: -0.13 °C/decade
Christy 2002

Mean TemperatureSoutheast USA 1899-2003
-0.06
-0.04
-0.02
0.00
0.02
0.04
0.06
0.08
0.10
0.12
0.14
Observations BCM CCMA CCMA_T63 CSIRO GFDL_0 GFDL_1 IPSL MIROC3 MPI MRI
ModelsObservation

Christy et al. 2006, J. Climate

MODIS21 Jul 2002
Jacques DescloitresMODIS Land Rapid Response Team NASA GSFC

+ Valley Stations° Mountain Stns
•Christy et al. 2006, J. Climate

Manually digitized thousands of records

CA Valley and Sierra (Jun-Nov) 1910-2003
8
12
16
20
24
1910 1920 1930 1940 1950 1960 1970 1980 1990 2000 2010
°C
Valley TMax (less 10°C)Valley TMinSierra TMin
Christy et al. 2006Valley affected by irrigation and urbanization
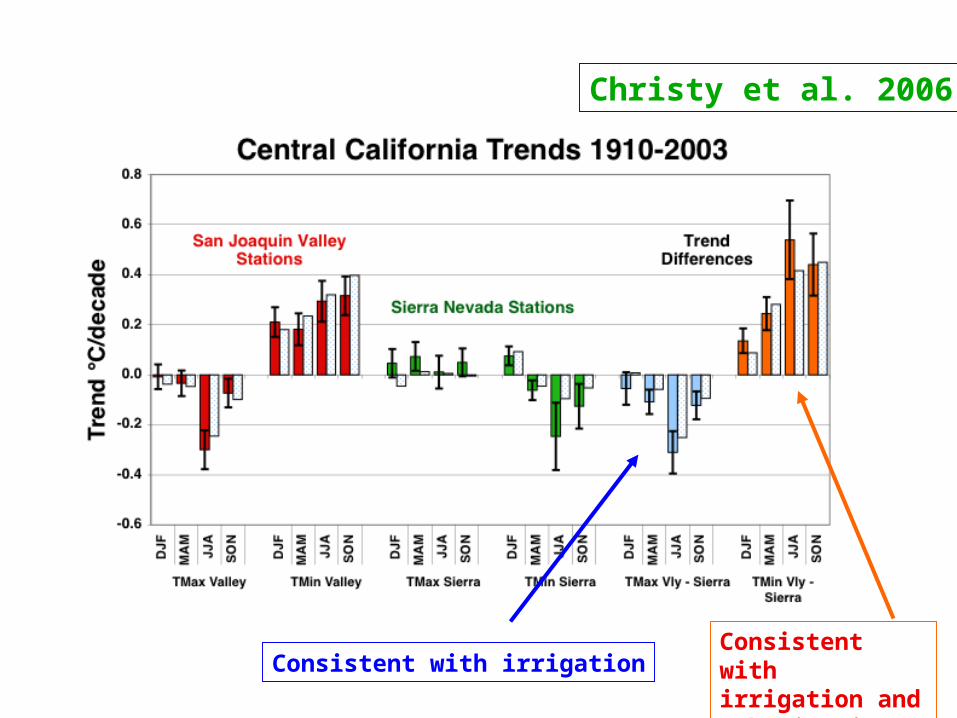
Christy et al. 2006
Consistent with irrigationConsistent with irrigation and urbanization

Snyder et al. 2002
Sierras warm faster than Valley in model simulations

East Africa (Kenya/Tanzania)

-0.1
0.0
0.1
0.2
0.3
0.4
0.5
0.6
Trend 1979-2004
°C/decade
GISSHadCRUT3CRUT3vTMinTMeanTMaxUAH SatelliteBalloon HadAT (0.0)Balloon ECMWF (0.0)
East Africa: 5°S-Eq, 35-40°E(Nairobi, Mt. Kilimanjaro, Mt. Kenya)
Daytime warming rate 20% of Mainline Datasets in E. Africa
Christy et al. (submitted) uses 10 times the amount of surface data
Upper Air

0.00
0.01
0.02
0.03
0.04
0.05
0.06
1900-1999
°C/decade
GHCN ObsCSIRO (3)GISS (2)INM-CM3.0MIROC3.2 (4)NCAR CCSM3.0 (2)NCAR PCM1 (2)GCM Avg
Model vs. ObservationsTMin minus TMax
Preliminary study

Is Mean Surface Temperature an
Appropriate Index for the Greenhouse Effect?
Evidence indicates TMax is the better metric to serve as a proxy for monitoring deep atmospheric change
Pielke et al. 2007, Walters et al. 2007, Christy et al. (submitted)

Upper Air Temperatures
Upper Air Temperatures
• Recent claims suggest the upper air temperature record is in agreement with the surface and with climate models, so global warming theory must be right
• IPCC more or less supports this view
• UAH satellite data reportedly “flawed”

Vertical Temperature Change due to Greenhouse Forcing in
Models
Model Simulations of Tropical Troposphere Warming:About 2X surfaceLee et al. 2007

Christy and Spencer 2005Christy and Norris 2006Christy et al. 2007

Christy and Norris 2006Christy et al. 2007

-0.6
-0.4
-0.2
0.0
0.2
0.4
0.6
0.8
1.0
1978 1982 1986 1990 1994 1998 2002 2006
Global Bulk Atmospheric TemperaturesUAH Satellite Data
Warming rate 60% of model projections

Greenhouse Effect

Total Greenhouse Effect
• Water vapor and Clouds Dominate
• Total Greenhouse Effect is variable
• Climate models show strong water-vapor/cloud positive feedback with increased CO2
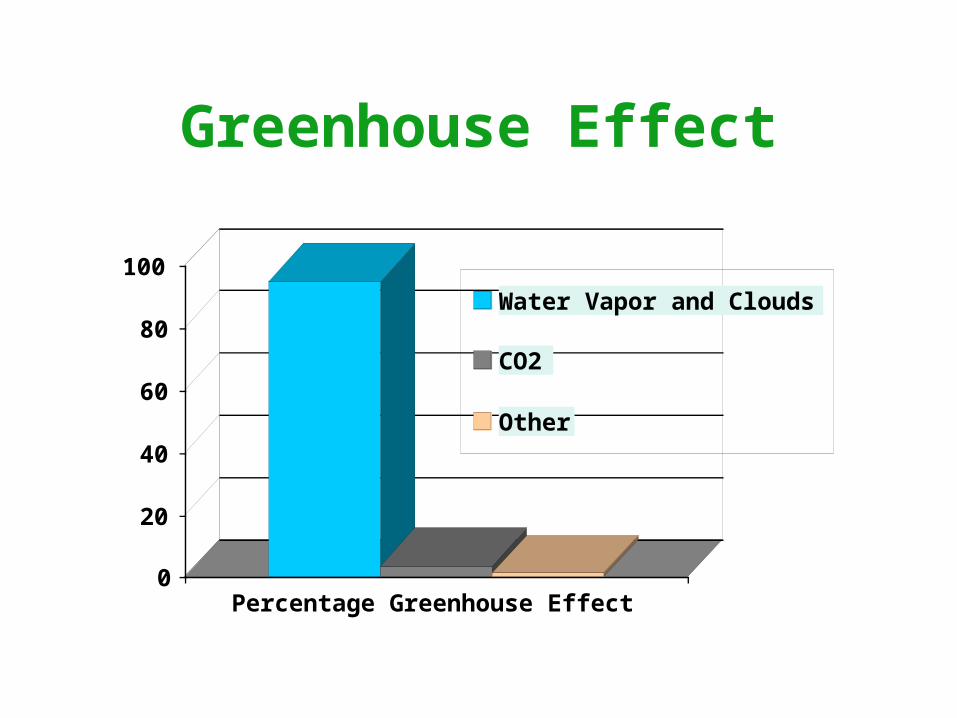
Greenhouse Effect
0
20
40
60
80
100
Percentage Greenhouse Effect
Water Vapor and Clouds
CO2
Other

Greenhouse Effect
0
20
40
60
80
100
Percentage Greenhouse Effect
Water Vapor and Clouds
CO2
Other
?

Tropical Temp. and Cloud Forcing (major part of total greenhouse effect) based on
latest satellite sensorsNegative feedback on monthly time scales
Spencer et al. (submitted)
-3
-2
-1
0
1
2
-0.2 0 0.2 0.4
Troposphere Temp Anomaly
LW+SW CRF (W/m2)

What aboutCold Places?


North Polar RegionsHadCRUT3
-5
-4
-3
-2
-1
0
1
2
3
1850 1880 1910 1940 1970 2000
Arctic 70-85NGreenland
Period of most polar ice observations

Greenland Summer Temperatures
1780-2005
3
4
5
6
7
8
9
1780 1820 1860 1900 1940 1980
JJA11-season average
Period of most polar ice observations

Greenland Borehole TemperatureDahl-Jensen et al. 1998
-32.5
-32.0
-31.5
-31.0
-30.5
0 500 1000 1500 2000
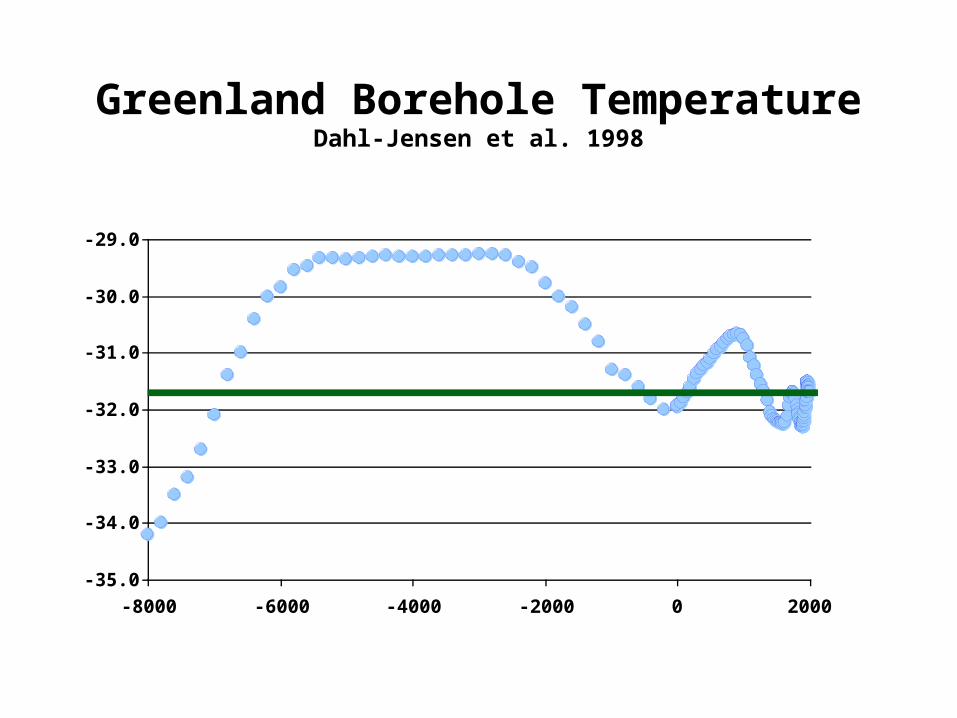
Greenland Borehole TemperatureDahl-Jensen et al. 1998
-35.0
-34.0
-33.0
-32.0
-31.0
-30.0
-29.0
-8000 -6000 -4000 -2000 0 2000

AlaskaHadley CRU 3 (°C)
Shift in 1977, but high natural variability
-4
-3
-2
-1
0
1
2
3
4
1900 1920 1940 1960 1980 2000

When Hemingway writes “Snows of
Kilimanjaro”—half of the “snows” are
already gone
X
-5
-4
-3
-2
-1
0
1
2
3
4
1955 1965 1975 1985 1995 2005
Arusha/Kilimanjaro
TMax
Mass Gain in 2006Molg and Kaser 2007

Regional Snowpack, Central Andes, 1951-2005Masiokas et al. 2006


Schneider et al. 2006
Antarctica
-3.5-3.0-2.5-2.0-1.5-1.0-0.50.00.51.01.5
1940 1955 1970 1985 2000 Thermometers
Ice Cores
Doran et al. 2002

Antarctica snowaccumulationtrends cm/yr
1992-2003
Davis et al. 2005
See also:Monoghan et al 2006Van de Berg et a. 2006

Evidence Thus Far
• Global surface temperature is rising, but in a way inconsistent with model projections of GHG forcing
• Overall decline in ice mass, with sea level rise of about 1” per decade
• Severe weather not becoming more frequent

Main Point:
I don’t see a disaster developing
But, suppose you do ….

Energy Technology1900: World supported
56 billion human-life years

Energy Technology1900: World supported
56 billion human-life years
2005: World supports 429 billion
human-life years

Kenya, East Africa

Energy Transmission
Energy System
Energy Use
Energy Source

All Science is Numbers
• The Human population currently uses energy at a rate of 14 terawatts to its considerable benefit.

All Science is Numbers
• The Human population currently uses energy at a rate of 14 terawatts to its considerable benefit.
• Most energy production relies on burning carbon (i.e. CO2 is released)

All Science is Numbers
• The Human population currently uses energy at a rate of 14 terawatts to its considerable benefit.
• Most energy production relies on burning carbon (I.e. CO2 is released)
• To replace 10% of this (i.e. 1.4 terawatts) requires 1000 nuclear power plants (1.4 gigawatt each)

IPCC “Best Estimate” Temp
0.0
0.5
1.0
1.5
2.0
2.5
3.0
199020002010202020302040205020602070208020902100
A1B

California AB 149326% CO2 reduction LDV 2016
0.0
0.5
1.0
1.5
2.0
2.5
3.0
199020002010202020302040205020602070208020902100
A1BCANo. EastUSA
Net Impact if all US 0.01°C 2100

Net Effect of 10% CO2 emission reduction to A1B Scenario
(~1000 Nuclear Plants by 2020)
0.0
0.5
1.0
1.5
2.0
2.5
3.0
199020002010202020302040205020602070208020902100
A1B Emissions
10% Reduction A1B
Net Impact 0.07°C 2050

OR A MORE RATIONAL APPROACH?
• In 50 years will we learn that the most cost-effective path was to adapt to changes we actually observed and measured, rather than try to outguess Mother Nature’s course?
• In 50 years will we be surprised not by climate change but by the inventive minds of our scientists and engineers as they discover profitable and affordable ways to generate energy without carbon emissions?