Embed Size (px)
Citation preview
Facts and Figures
2020
株式会社アルファシステムズALPHA SYSTEMS INC.
当期純利益/1株当たり当期純利益Net IncomeNet Income per Share
0
(百万円/¥ Millions) (円/¥)
0
30
60
90
120
180
150
19/3 20/3
当期純利益/Net Income1株当たり当期純利益/Net Income per Share
500
1,000
1,500
2,500
2,250
2,000
250
750
1,250
1,750
18/316/3 17/3
営業利益/経常利益Operating IncomeOrdinary Income
19/3 20/3
(百万円/¥ Millions)
営業利益/Operating Income経常利益/Ordinary Income
0
500
1,000
1,500
2,000
2,500
3,000
3,500
18/316/3 17/3
1
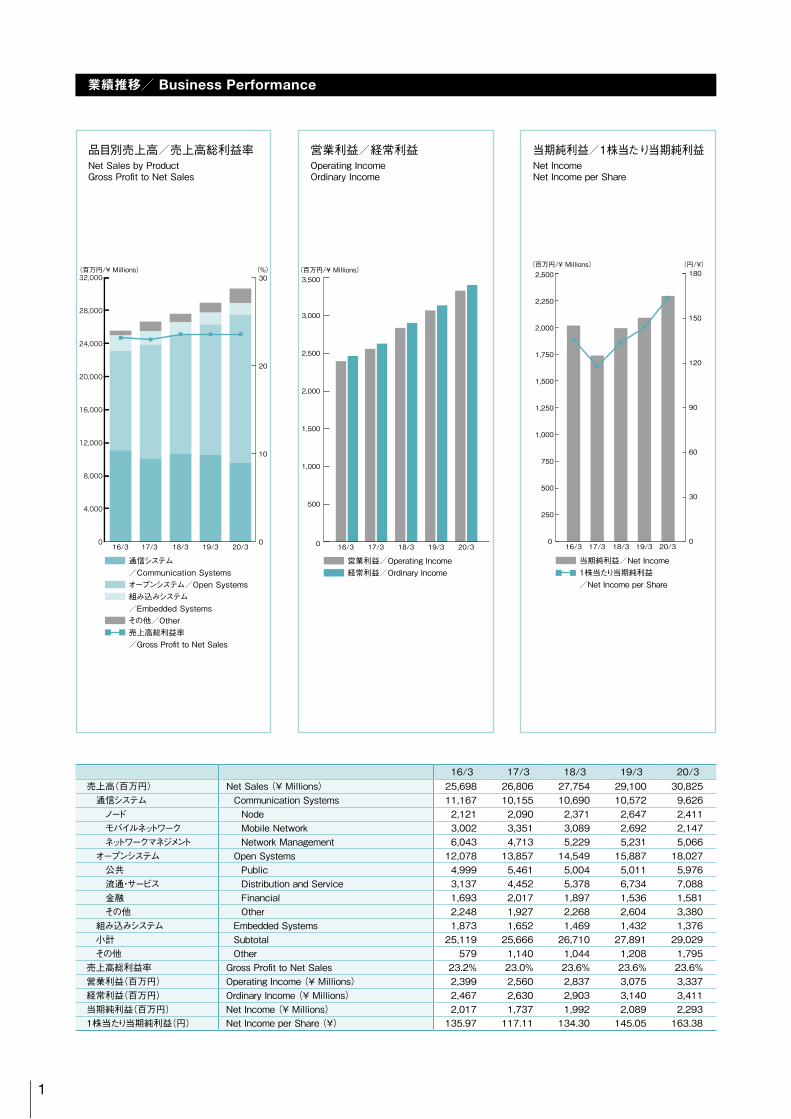
業績推移/ Business Performance
品目別売上高/売上高総利益率Net Sales by ProductGross Profit to Net Sales
通信システム/Communication Systemsオープンシステム/Open Systems組み込みシステム/Embedded Systems その他/Other売上高総利益率/Gross Profit to Net Sales
(百万円/¥ Millions) (%)
0
10
20
30
20/30
4,000
8,000
12,000
16,000
20,000
24,000
28,000
32,000
19/316/3 17/3 18/3
16/3 17/3 18/3 19/3 20/3売上高(百万円) Net Sales (¥ Millions) 25,698 26,806 27,754 29,100 30,825
通信システム Communication Systems 11,167 10,155 10,690 10,572 9,626ノード Node 2,121 2,090 2,371 2,647 2,411モバイルネットワーク Mobile Network 3,002 3,351 3,089 2,692 2,147ネットワークマネジメント Network Management 6,043 4,713 5,229 5,231 5,066
オープンシステム Open Systems 12,078 13,857 14,549 15,887 18,027公共 Public 4,999 5,461 5,004 5,011 5,976流通・サービス Distribution and Service 3,137 4,452 5,378 6,734 7,088金融 Financial 1,693 2,017 1,897 1,536 1,581その他 Other 2,248 1,927 2,268 2,604 3,380
組み込みシステム Embedded Systems 1,873 1,652 1,469 1,432 1,376小計 Subtotal 25,119 25,666 26,710 27,891 29,029その他 Other 579 1,140 1,044 1,208 1,795
売上高総利益率 Gross Profit to Net Sales 23.2% 23.0% 23.6% 23.6% 23.6%営業利益(百万円) Operating Income (¥ Millions) 2,399 2,560 2,837 3,075 3,337経常利益(百万円) Ordinary Income (¥ Millions) 2,467 2,630 2,903 3,140 3,411当期純利益(百万円) Net Income (¥ Millions) 2,017 1,737 1,992 2,089 2,2931株当たり当期純利益(円) Net Income per Share (¥) 135.97 117.11 134.30 145.05 163.38
投下資本利益率Return on Invested Capital
自己資本純利益率Return on Equity
2
4
8
10(%)
6
0
自己資本純利益率/Return on Equity
18/3 19/3 20/316/3 17/3
売上高営業利益率/売上高純利益率Operating Income to Net Sales/Net Income to Net Sales
0
3
6
9
12
15(%)
売上高営業利益率/Operating Income to Net Sales売上高純利益率/Net Income to Net Sales
19/3 20/318/316/3 17/3
2
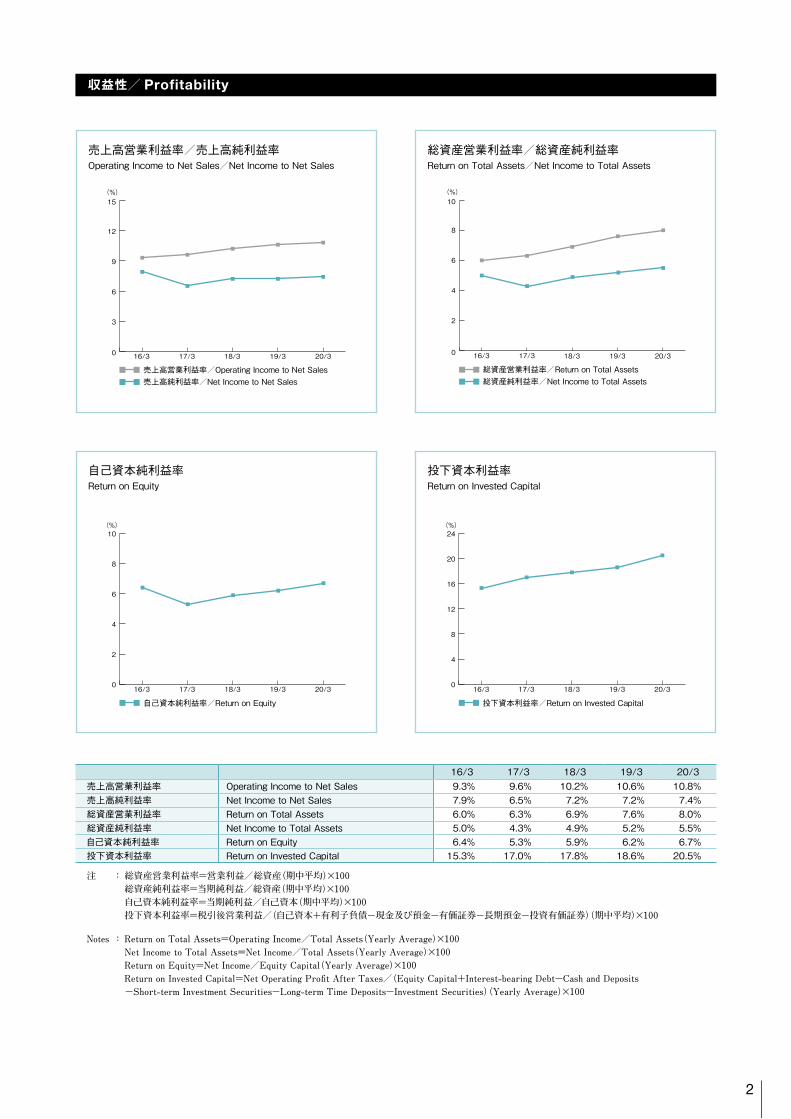
収益性/ Profitability
16/3 17/3 18/3 19/3 20/3売上高営業利益率 Operating Income to Net Sales 9.3% 9.6% 10.2% 10.6% 10.8%売上高純利益率 Net Income to Net Sales 7.9% 6.5% 7.2% 7.2% 7.4%総資産営業利益率 Return on Total Assets 6.0% 6.3% 6.9% 7.6% 8.0%総資産純利益率 Net Income to Total Assets 5.0% 4.3% 4.9% 5.2% 5.5%自己資本純利益率 Return on Equity 6.4% 5.3% 5.9% 6.2% 6.7%投下資本利益率 Return on Invested Capital 15.3% 17.0% 17.8% 18.6% 20.5%
注 : 総資産営業利益率=営業利益/総資産(期中平均)×100 総資産純利益率=当期純利益/総資産(期中平均)×100 自己資本純利益率=当期純利益/自己資本(期中平均)×100 投下資本利益率=税引後営業利益/(自己資本+有利子負債−現金及び預金−有価証券−長期預金−投資有価証券)(期中平均)×100
Notes: ReturnonTotalAssets=OperatingIncome/TotalAssets(YearlyAverage)×100 NetIncometoTotalAssets=NetIncome/TotalAssets(YearlyAverage)×100 ReturnonEquity=NetIncome/EquityCapital(YearlyAverage)×100 ReturnonInvestedCapital=NetOperatingProfitAfterTaxes/(EquityCapital+Interest-bearingDebt−CashandDeposits −Short-termInvestmentSecurities−Long-termTimeDeposits−InvestmentSecurities)(YearlyAverage)×100
総資産営業利益率/総資産純利益率Return on Total Assets/Net Income to Total Assets
0
2
4
6
8
10(%)
総資産営業利益率/Return on Total Assets総資産純利益率/Net Income to Total Assets
19/3 20/318/316/3 17/3
4
8
16
24
20
(%)
12
0
投下資本利益率/Return on Invested Capital
18/3 19/3 20/316/3 17/3
固定比率/固定長期適合比率Noncurrent Assets Ratio / Noncurrent Assets/(Equity Capital+Noncurrent Liabilities)
流動比率/当座比率Current Ratio/Quick Assets to Current Liabilities
0
500
600
400
300
200
(%)
流動比率/Current Ratio当座比率/Quick Assets to Current Liabilities
18/3 19/3 20/316/3 17/3
3
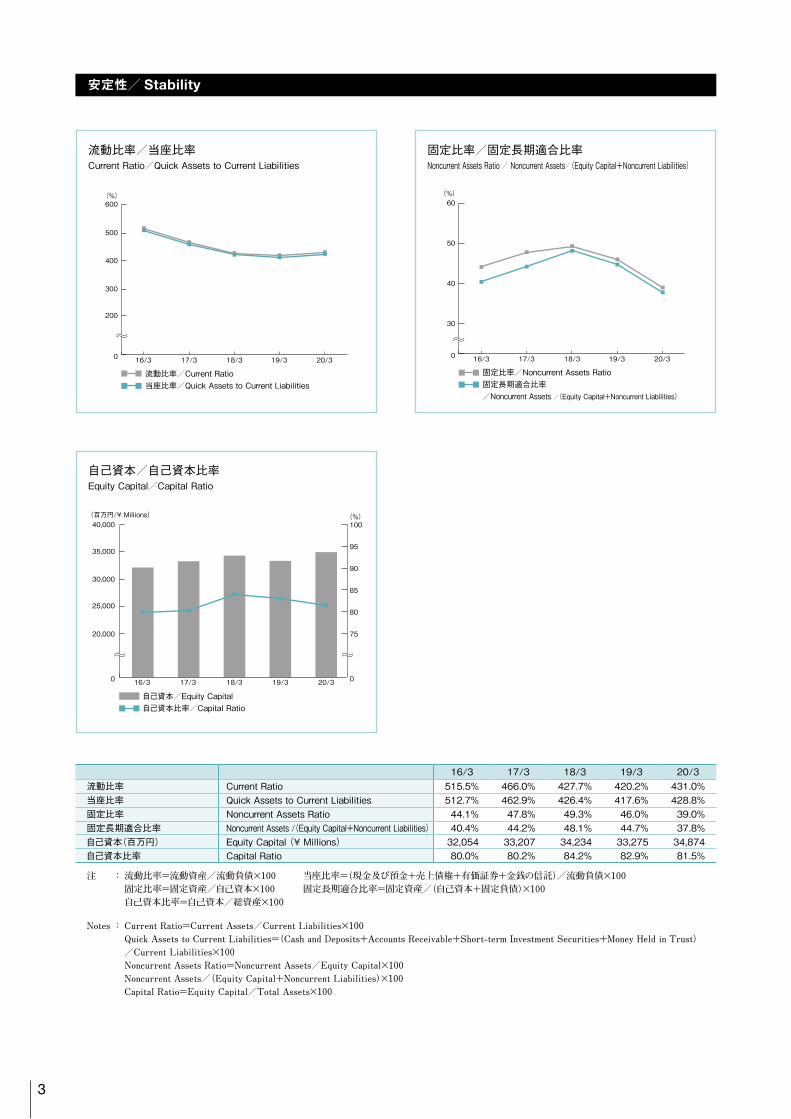
安定性/ Stability
16/3 17/3 18/3 19/3 20/3流動比率 Current Ratio 515.5% 466.0% 427.7% 420.2% 431.0%当座比率 Quick Assets to Current Liabilities 512.7% 462.9% 426.4% 417.6% 428.8%固定比率 Noncurrent Assets Ratio 44.1% 47.8% 49.3% 46.0% 39.0%固定長期適合比率 Noncurrent Assets /(Equity Capital+Noncurrent Liabilities) 40.4% 44.2% 48.1% 44.7% 37.8%自己資本(百万円) Equity Capital (¥ Millions) 32,054 33,207 34,234 33,275 34,874自己資本比率 Capital Ratio 80.0% 80.2% 84.2% 82.9% 81.5%
注 :流動比率=流動資産/流動負債×100 当座比率=(現金及び預金+売上債権+有価証券+金銭の信託)/流動負債×100 固定比率=固定資産/自己資本×100 固定長期適合比率=固定資産/(自己資本+固定負債)×100 自己資本比率=自己資本/総資産×100
Notes: CurrentRatio=CurrentAssets/CurrentLiabilities×100 QuickAssetstoCurrentLiabilities=(CashandDeposits+AccountsReceivable+Short-termInvestmentSecurities+MoneyHeldinTrust) /CurrentLiabilities×100 NoncurrentAssetsRatio=NoncurrentAssets/EquityCapital×100 NoncurrentAssets/(EquityCapital+NoncurrentLiabilities)×100 CapitalRatio=EquityCapital/TotalAssets×100
自己資本/自己資本比率Equity Capital/Capital Ratio
0
(百万円/¥ Millions) (%)
20,000
25,000
30,000
35,000
0
75
80
85
100
自己資本/Equity Capital自己資本比率/Capital Ratio
19/3 20/318/316/3 17/3
40,000
90
95
0
60(%)
固定比率/Noncurrent Assets Ratio 固定長期適合比率/Noncurrent Assets /(Equity Capital+Noncurrent Liabilities)
19/3 20/318/316/3 17/3
30
40
50
1人当たり営業利益/1人当たり当期純利益Operating Income per Employee/Net Income per Employee
1人当たり売上高Net Sales per Employee
20/30
8,000
9,000
10,000
11,000
12,000(千円/¥ Thousands)
1人当たり売上高/Net Sales per Employee
19/316/3 17/3 18/3
総資産回転率Total Assets Turnover
0
(回/Times)
総資産回転率/Total Assets Turnover
0.5
0.6
0.7
0.8
0.9
19/318/316/3 17/3 20/3
1.0
従業員数/開発人員Number of Employees/Development Staff
20/319/3
(人/Persons)
0
2,000
2,800
3,000
従業員数/Number of Employees開発人員/Development Staff
16/3 17/3 18/3
2,600
2,400
2,200
4
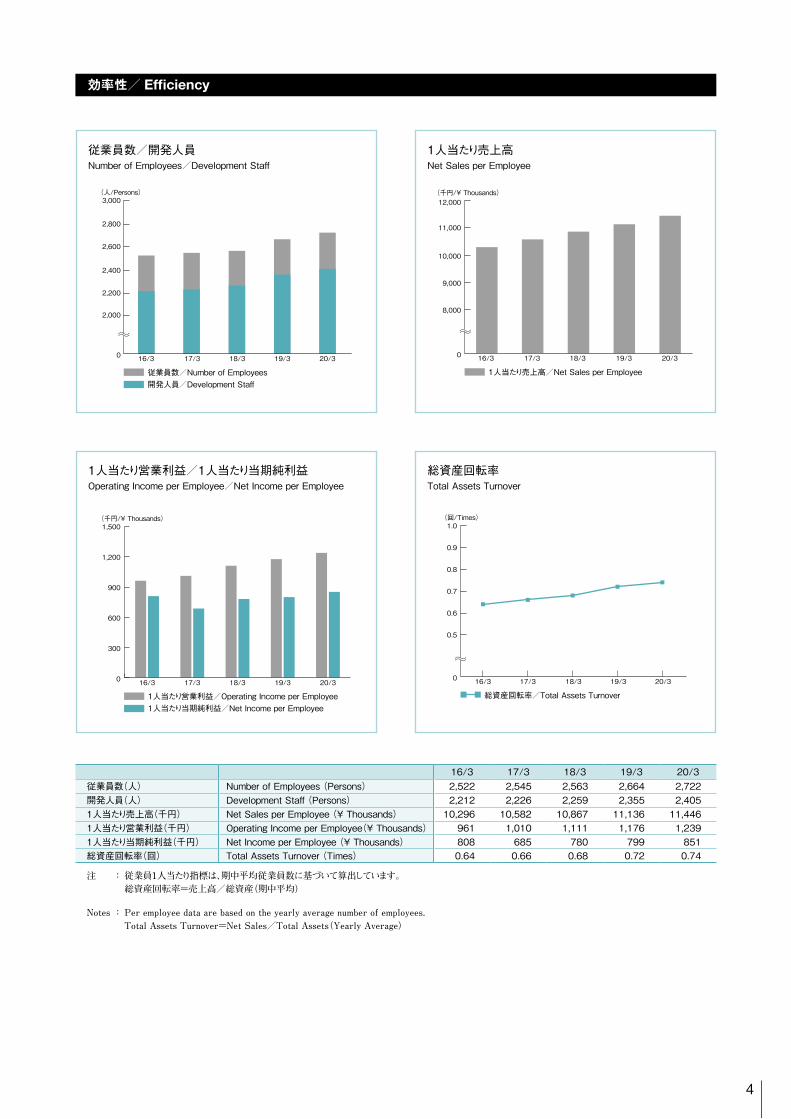
効率性/ Efficiency
16/3 17/3 18/3 19/3 20/3従業員数(人) Number of Employees (Persons) 2,522 2,545 2,563 2,664 2,722開発人員(人) Development Staff (Persons) 2,212 2,226 2,259 2,355 2,4051人当たり売上高(千円) Net Sales per Employee (¥ Thousands) 10,296 10,582 10,867 11,136 11,4461人当たり営業利益(千円) Operating Income per Employee(¥ Thousands) 961 1,010 1,111 1,176 1,2391人当たり当期純利益(千円) Net Income per Employee (¥ Thousands) 808 685 780 799 851総資産回転率(回) Total Assets Turnover (Times) 0.64 0.66 0.68 0.72 0.74
注 : 従業員1人当たり指標は、期中平均従業員数に基づいて算出しています。 総資産回転率=売上高/総資産(期中平均)
Notes: Peremployeedataarebasedontheyearlyaveragenumberofemployees. TotalAssetsTurnover=NetSales/TotalAssets(YearlyAverage)
0
300
600
900
1,500
1,200
(千円/¥ Thousands)
1人当たり営業利益/Operating Income per Employee1人当たり当期純利益/Net Income per Employee
20/319/318/317/316/3
配当性向Payout Ratio
0
25
50
75
100(%)
配当性向/Payout Ratio
19/316/3 17/3 18/3 20/3
設備投資/減価償却費Capital Expenditures/Depreciation
0
250
500
750
1,000
設備投資/Capital Expenditures減価償却費/Depreciation
(百万円/¥ Millions)
19/316/3 17/3 18/3 20/3
5
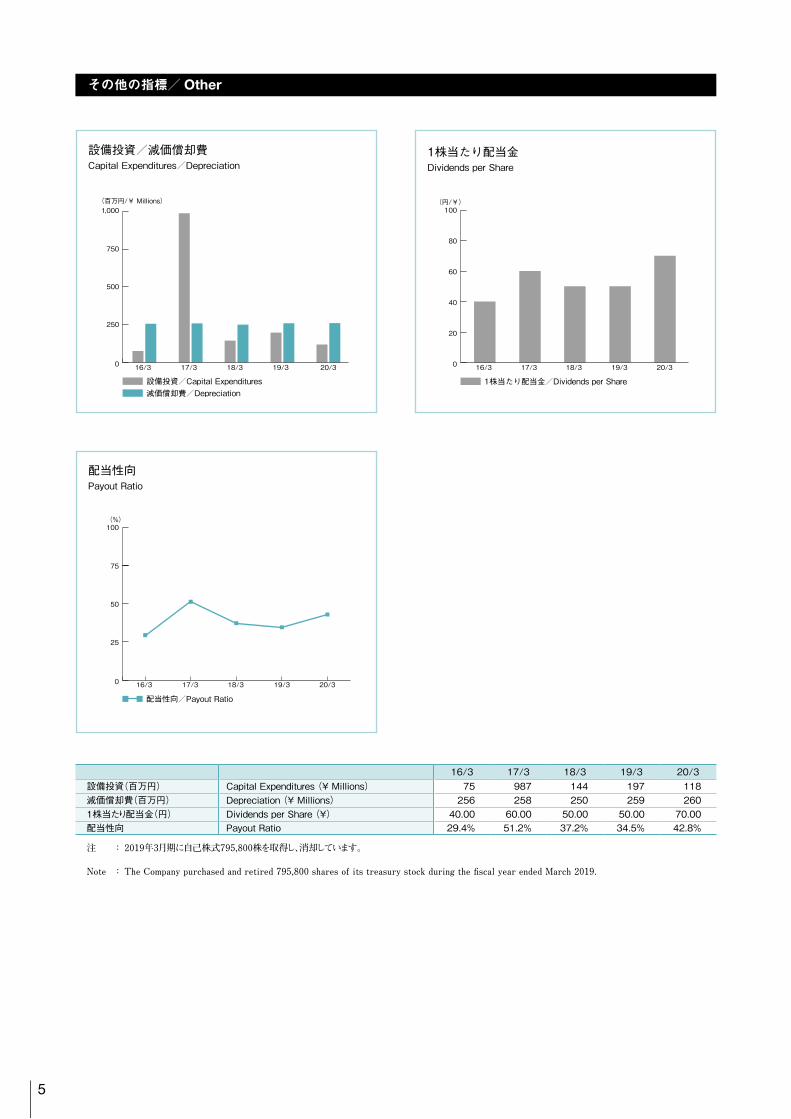
その他の指標/ Other
16/3 17/3 18/3 19/3 20/3設備投資(百万円) Capital Expenditures (¥ Millions) 75 987 144 197 118減価償却費(百万円) Depreciation (¥ Millions) 256 258 250 259 2601株当たり配当金(円) Dividends per Share (¥) 40.00 60.00 50.00 50.00 70.00配当性向 Payout Ratio 29.4% 51.2% 37.2% 34.5% 42.8%
注 :2019年3月期に自己株式795,800株を取得し、消却しています。
Note : TheCompanypurchasedandretired795,800sharesofitstreasurystockduringthefiscalyearendedMarch2019.
1株当たり配当金Dividends per Share
0
60
40
20
80
100(円/¥)
1株当たり配当金/Dividends per Share
19/316/3 17/3 18/3 20/3
6
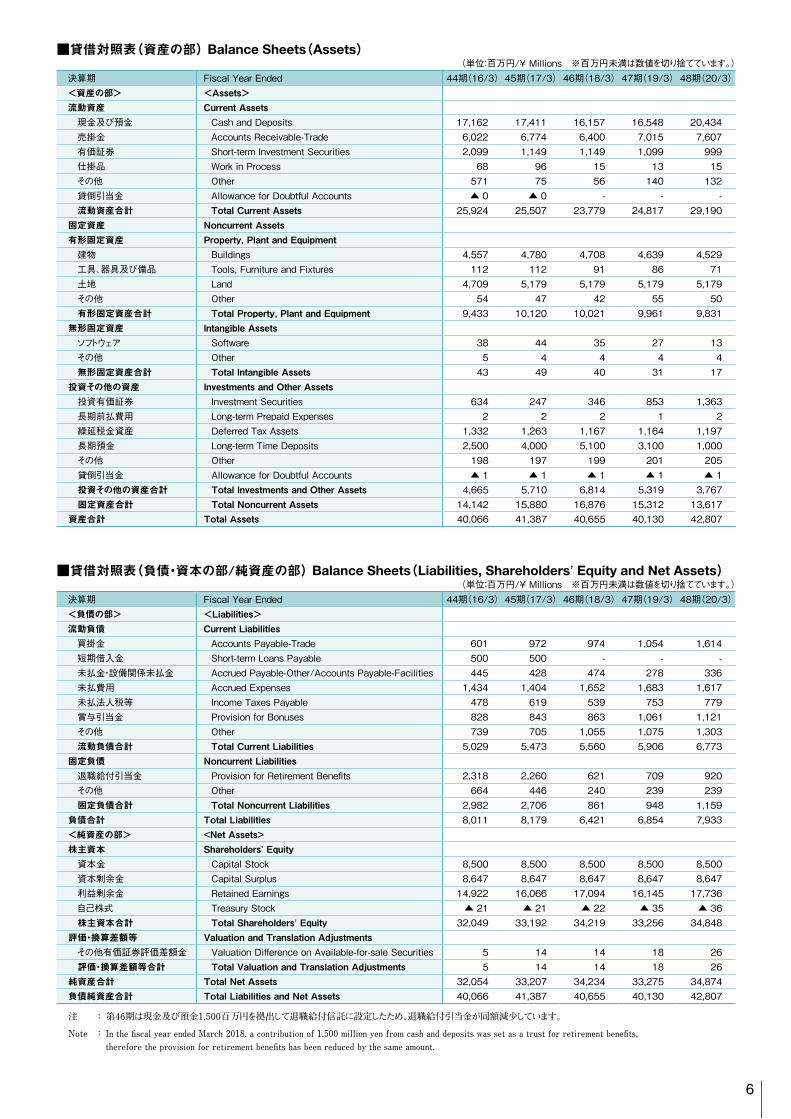
■貸借対照表(資産の部) Balance Sheets(Assets) (単位:百万円/¥ Millions ※百万円未満は数値を切り捨てています。)
決算期 Fiscal Year Ended 44期(16/3)45期(17/3)46期(18/3)47期(19/3)48期(20/3)<資産の部> <Assets> 流動資産 Current Assets
現金及び預金 Cash and Deposits 17,162 17,411 16,157 16,548 20,434売掛金 Accounts Receivable-Trade 6,022 6,774 6,400 7,015 7,607有価証券 Short-term Investment Securities 2,099 1,149 1,149 1,099 999仕掛品 Work in Process 68 96 15 13 15その他 Other 571 75 56 140 132貸倒引当金 Allowance for Doubtful Accounts ▲ 0 ▲ 0 - - -流動資産合計 Total Current Assets 25,924 25,507 23,779 24,817 29,190
固定資産 Noncurrent Assets 有形固定資産 Property, Plant and Equipment
建物 Buildings 4,557 4,780 4,708 4,639 4,529工具、器具及び備品 Tools, Furniture and Fixtures 112 112 91 86 71土地 Land 4,709 5,179 5,179 5,179 5,179その他 Other 54 47 42 55 50有形固定資産合計 Total Property, Plant and Equipment 9,433 10,120 10,021 9,961 9,831
無形固定資産 Intangible Assets ソフトウェア Software 38 44 35 27 13その他 Other 5 4 4 4 4無形固定資産合計 Total Intangible Assets 43 49 40 31 17
投資その他の資産 Investments and Other Assets 投資有価証券 Investment Securities 634 247 346 853 1,363長期前払費用 Long-term Prepaid Expenses 2 2 2 1 2繰延税金資産 Deferred Tax Assets 1,332 1,263 1,167 1,164 1,197長期預金 Long-term Time Deposits 2,500 4,000 5,100 3,100 1,000その他 Other 198 197 199 201 205貸倒引当金 Allowance for Doubtful Accounts ▲ 1 ▲ 1 ▲ 1 ▲ 1 ▲ 1投資その他の資産合計 Total Investments and Other Assets 4,665 5,710 6,814 5,319 3,767固定資産合計 Total Noncurrent Assets 14,142 15,880 16,876 15,312 13,617
資産合計 Total Assets 40,066 41,387 40,655 40,130 42,807
決算期 Fiscal Year Ended 44期(16/3)45期(17/3)46期(18/3)47期(19/3)48期(20/3)<負債の部> <Liabilities> 流動負債 Current Liabilities
買掛金 Accounts Payable-Trade 601 972 974 1,054 1,614短期借入金 Short-term Loans Payable 500 500 - - -未払金・設備関係未払金 Accrued Payable-Other/Accounts Payable-Facilities 445 428 474 278 336未払費用 Accrued Expenses 1,434 1,404 1,652 1,683 1,617未払法人税等 Income Taxes Payable 478 619 539 753 779賞与引当金 Provision for Bonuses 828 843 863 1,061 1,121その他 Other 739 705 1,055 1,075 1,303流動負債合計 Total Current Liabilities 5,029 5,473 5,560 5,906 6,773
固定負債 Noncurrent Liabilities 退職給付引当金 Provision for Retirement Benefits 2,318 2,260 621 709 920その他 Other 664 446 240 239 239固定負債合計 Total Noncurrent Liabilities 2,982 2,706 861 948 1,159
負債合計 Total Liabilities 8,011 8,179 6,421 6,854 7,933<純資産の部> <Net Assets> 株主資本 Shareholders’ Equity
資本金 Capital Stock 8,500 8,500 8,500 8,500 8,500資本剰余金 Capital Surplus 8,647 8,647 8,647 8,647 8,647利益剰余金 Retained Earnings 14,922 16,066 17,094 16,145 17,736自己株式 Treasury Stock ▲ 21 ▲ 21 ▲ 22 ▲ 35 ▲ 36株主資本合計 Total Shareholders’ Equity 32,049 33,192 34,219 33,256 34,848
評価・換算差額等 Valuation and Translation Adjustments その他有価証券評価差額金 Valuation Difference on Available-for-sale Securities 5 14 14 18 26評価・換算差額等合計 Total Valuation and Translation Adjustments 5 14 14 18 26
純資産合計 Total Net Assets 32,054 33,207 34,234 33,275 34,874負債純資産合計 Total Liabilities and Net Assets 40,066 41,387 40,655 40,130 42,807
注 : 第46期は現金及び預金1,500百万円を拠出して退職給付信託に設定したため、退職給付引当金が同額減少しています。
Note : InthefiscalyearendedMarch2018,acontributionof1,500millionyenfromcashanddepositswassetasatrustforretirementbenefits, thereforetheprovisionforretirementbenefitshasbeenreducedbythesameamount.
■貸借対照表(負債・資本の部/純資産の部) Balance Sheets(Liabilities, Shareholders’ Equity and Net Assets) (単位:百万円/¥ Millions ※百万円未満は数値を切り捨てています。)
7
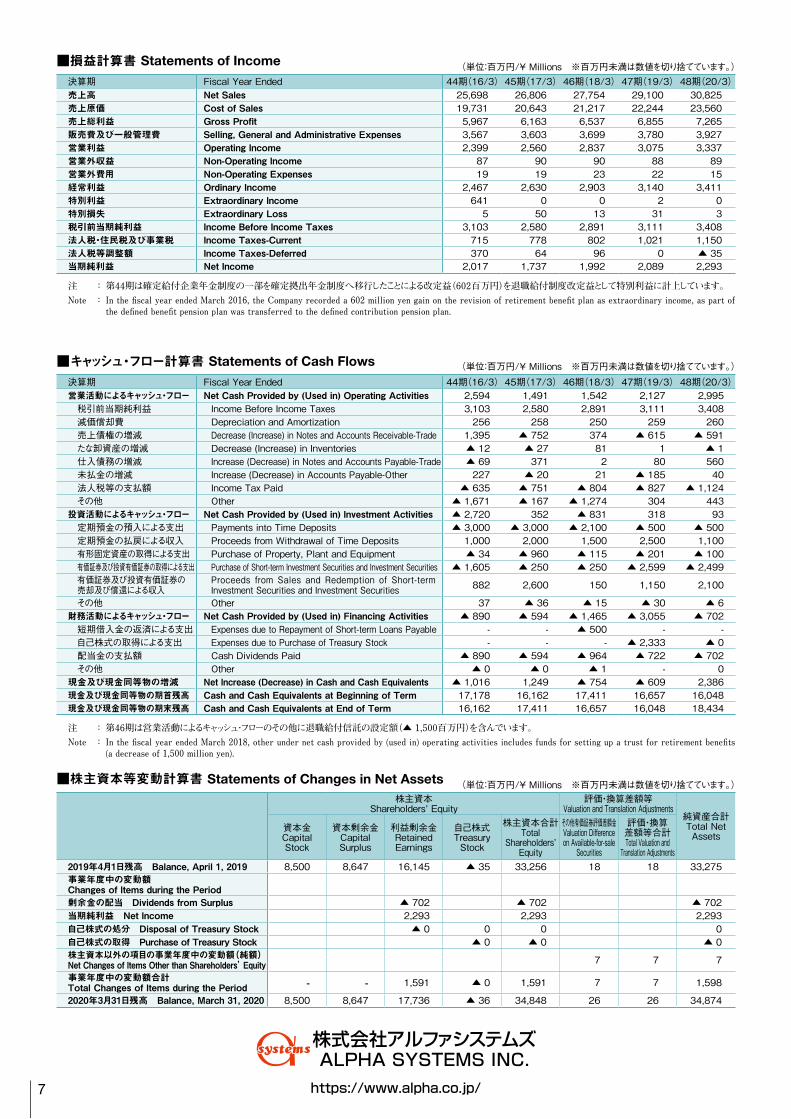
■損益計算書 Statements of Income (単位:百万円/¥ Millions ※百万円未満は数値を切り捨てています。) 決算期 Fiscal Year Ended 44期(16/3)45期(17/3)46期(18/3)47期(19/3)48期(20/3)売上高 Net Sales 25,698 26,806 27,754 29,100 30,825売上原価 Cost of Sales 19,731 20,643 21,217 22,244 23,560売上総利益 Gross Profit 5,967 6,163 6,537 6,855 7,265販売費及び一般管理費 Selling, General and Administrative Expenses 3,567 3,603 3,699 3,780 3,927営業利益 Operating Income 2,399 2,560 2,837 3,075 3,337営業外収益 Non-Operating Income 87 90 90 88 89営業外費用 Non-Operating Expenses 19 19 23 22 15経常利益 Ordinary Income 2,467 2,630 2,903 3,140 3,411特別利益 Extraordinary Income 641 0 0 2 0特別損失 Extraordinary Loss 5 50 13 31 3税引前当期純利益 Income Before Income Taxes 3,103 2,580 2,891 3,111 3,408法人税・住民税及び事業税 Income Taxes-Current 715 778 802 1,021 1,150法人税等調整額 Income Taxes-Deferred 370 64 96 0 ▲ 35当期純利益 Net Income 2,017 1,737 1,992 2,089 2,293
注 : 第44期は確定給付企業年金制度の一部を確定拠出年金制度へ移行したことによる改定益(602百万円)を退職給付制度改定益として特別利益に計上しています。 Note : InthefiscalyearendedMarch2016,theCompanyrecordeda602millionyengainontherevisionofretirementbenefitplanasextraordinaryincome,aspartof
thedefinedbenefitpensionplanwastransferredtothedefinedcontributionpensionplan.
■キャッシュ・フロー計算書 Statements of Cash Flows (単位:百万円/¥ Millions ※百万円未満は数値を切り捨てています。)決算期 Fiscal Year Ended 44期(16/3)45期(17/3)46期(18/3)47期(19/3)48期(20/3)営業活動によるキャッシュ・フロー Net Cash Provided by (Used in) Operating Activities 2,594 1,491 1,542 2,127 2,995
税引前当期純利益 Income Before Income Taxes 3,103 2,580 2,891 3,111 3,408減価償却費 Depreciation and Amortization 256 258 250 259 260売上債権の増減 Decrease (Increase) in Notes and Accounts Receivable-Trade 1,395 ▲ 752 374 ▲ 615 ▲ 591たな卸資産の増減 Decrease (Increase) in Inventories ▲ 12 ▲ 27 81 1 ▲ 1仕入債務の増減 Increase (Decrease) in Notes and Accounts Payable-Trade ▲ 69 371 2 80 560未払金の増減 Increase (Decrease) in Accounts Payable-Other 227 ▲ 20 21 ▲ 185 40法人税等の支払額 Income Tax Paid ▲ 635 ▲ 751 ▲ 804 ▲ 827 ▲ 1,124その他 Other ▲ 1,671 ▲ 167 ▲ 1,274 304 443
投資活動によるキャッシュ・フロー Net Cash Provided by (Used in) Investment Activities ▲ 2,720 352 ▲ 831 318 93定期預金の預入による支出 Payments into Time Deposits ▲ 3,000 ▲ 3,000 ▲ 2,100 ▲ 500 ▲ 500定期預金の払戻による収入 Proceeds from Withdrawal of Time Deposits 1,000 2,000 1,500 2,500 1,100有形固定資産の取得による支出 Purchase of Property, Plant and Equipment ▲ 34 ▲ 960 ▲ 115 ▲ 201 ▲ 100有価証券及び投資有価証券の取得による支出 Purchase of Short-term Investment Securities and Investment Securities ▲ 1,605 ▲ 250 ▲ 250 ▲ 2,599 ▲ 2,499有価証券及び投資有価証券の売却及び償還による収入
Proceeds from Sales and Redemption of Short-term Investment Securities and Investment Securities 882 2,600 150 1,150 2,100
その他 Other 37 ▲ 36 ▲ 15 ▲ 30 ▲ 6財務活動によるキャッシュ・フロー Net Cash Provided by (Used in) Financing Activities ▲ 890 ▲ 594 ▲ 1,465 ▲ 3,055 ▲ 702
短期借入金の返済による支出 Expenses due to Repayment of Short-term Loans Payable - - ▲ 500 - -自己株式の取得による支出 Expenses due to Purchase of Treasury Stock - - - ▲ 2,333 ▲ 0配当金の支払額 Cash Dividends Paid ▲ 890 ▲ 594 ▲ 964 ▲ 722 ▲ 702その他 Other ▲ 0 ▲ 0 ▲ 1 - 0
現金及び現金同等物の増減 Net Increase (Decrease) in Cash and Cash Equivalents ▲ 1,016 1,249 ▲ 754 ▲ 609 2,386現金及び現金同等物の期首残高 Cash and Cash Equivalents at Beginning of Term 17,178 16,162 17,411 16,657 16,048現金及び現金同等物の期末残高 Cash and Cash Equivalents at End of Term 16,162 17,411 16,657 16,048 18,434
注 : 第46期は営業活動によるキャッシュ・フローのその他に退職給付信託の設定額(▲1,500百万円)を含んでいます。 Note : InthefiscalyearendedMarch2018,otherundernetcashprovidedby(usedin)operatingactivitiesincludesfundsforsettingupatrustforretirementbenefits
(adecreaseof1,500millionyen).
■株主資本等変動計算書 Statements of Changes in Net Assets (単位:百万円/¥ Millions ※百万円未満は数値を切り捨てています。)株主資本
Shareholders’ Equity評価・換算差額等
Valuation and Translation Adjustments純資産合計Total Net Assets
資本金CapitalStock
資本剰余金Capital Surplus
利益剰余金Retained Earnings
自己株式Treasury Stock
株主資本合計Total
Shareholders’ Equity
その他有価証券評価差額金Valuation Difference on Available-for-sale
Securities
評価・換算差額等合計Total Valuation and
Translation Adjustments2019年4月1日残高 Balance, April 1, 2019 8,500 8,647 16,145 ▲ 35 33,256 18 18 33,275事業年度中の変動額Changes of Items during the Period 剰余金の配当 Dividends from Surplus ▲ 702 ▲ 702 ▲ 702当期純利益 Net Income 2,293 2,293 2,293自己株式の処分 Disposal of Treasury Stock ▲ 0 0 0 0自己株式の取得 Purchase of Treasury Stock ▲ 0 ▲ 0 ▲ 0株主資本以外の項目の事業年度中の変動額(純額)Net Changes of Items Other than Shareholders’ Equity 7 7 7
事業年度中の変動額合計Total Changes of Items during the Period - - 1,591 ▲ 0 1,591 7 7 1,598
2020年3月31日残高 Balance, March 31, 2020 8,500 8,647 17,736 ▲ 36 34,848 26 26 34,874
株式会社アルファシステムズALPHA SYSTEMS INC.
https://www.alpha.co.jp/