Embed Size (px)
Citation preview
REUNA, Belo Horizonte - MG, Brasil, v.23, n.2, p.23-42, Abr. – Jun. 2018 - ISSN 2179-8834
FACTORS THAT IMPACT THE E-CONSUMER LOYALTY
FATORES QUE INFLUENCIAM NA LEALDADE DO E-CONSUMIDOR
http://dx.doi.org/10.21714/2179-8834/2018v23n2p23-42
Tadeu Ataíde Arantes Guedes Universidade Federal de Minas Gerais (UFMG), Brasil. E-mail: [email protected] Marlusa de Sevilha Gosling Universidade Federal de Viçosa (UFV), Brasil. E-mail: [email protected]
Solange Riveli de Oliveira
Universidade Federal de Juiz de Fora (UFJF), Brasil. Universidade Federal de Minas Gerais (UFMG), Brasil. E-mail: [email protected] Iury Teixeira de Sevilha Gosling Universidade Vale do Rio Verde (Unincor), Brasil. Universidade Federal de Minas Gerais (UFMG), Brasil. E-mail: [email protected] Kelly Cristine Oliveira Meira Universidade Federal de Minas Gerais (UFMG), Brasil. E-mail: [email protected] Submissão: 12 Abr. 2018 Publicação: 06 Set. 2018. Sistema de avaliação: Double blind review. Centro Universitário UNA, Belo Horizonte - MG, Brasil. Editor chefe: Prof. Dr. Gustavo Quiroga Souki
Este artigo encontra-se disponível nos seguintes endereços eletrônicos: http://revistas.una.br/index.php/reuna/article/view/1023 http://dx.doi.org/10.21714/2179-8834/2018v23n2p23-42
ABSTRACT The objective of this study was to identify and analyze the different attributes that can be considered as important by e-consumers for the process of loyalty with e-commerce available in the market. To do so, quantitative survey was conducted with 160 people through an online survey. The data collected were analyzed with the help of SPSS and SmartPLS software. Among the main results, we highlight the fact that the most important factor in the loyalty process is related to the trust of the site, and that design influences the purchasing experience. In addition, the better the Post purchase experience, the better the purchasing experience, and purchasing experience and trust are important aspects for e-consumer loyalty. The main contribution of this research is the collaboration in the clear understanding of which are the most influential aspects in the loyalty process is the virtual commerce entrepreneurs in the sector. Keywords: E-commerce. Consumer behavior. Loyalty.
REUNA, Belo Horizonte - MG, Brasil, v.23, n.2, p.23-42, Abr. – Jun. 2018 - ISSN 2179-8834
24 FACTORS THAT IMPACT IN E-CONSUMER LOYALTY
RESUMO O objetivo deste estudo foi identificar e analisar os diferentes atributos que podem ser considerados como importantes pelos e-consumidores para o processo de lealdade com os e-commerce disponíveis no mercado. Para tanto, uma pesquisa quantitativa foi realizada com 160 pessoas por meio de um survey online. Os dados coletados foram analisados com o auxílio dos softwares SPSS e SmartPLS. Dentre os principais resultados, destaca-se que o fator que mais provavelmente impacta experiência de compra é design e a experiência de compra é o que mais impacta em lealdade. Além disso, quanto melhor o pós-vendas, melhor é a experiência de compra, sendo que a experiência de compra e confiabilidade são aspectos importantes para a lealdade do e-consumidor. Por outro lado, design e preço não demonstraram influenciar na lealdade dos e-consumidores. A principal contribuição desta pesquisa é a colaboração na compreensão mais clara de quais sejam os aspectos mais influentes no processo de lealdade para os empresários atuantes no setor de comércio virtual. Palavras-chave: Comércio eletrônico. Comportamento de consumo. Lealdade.
1. Introduction
Even with a scenario of uncertainty introduced in Brazil in recent years, the Brazilian e-commerce followed in opposite direction with a growth of 15% and 8% in the years 2015 and 2016, respectively (WEBSHOPPERS REPORT, 2017). In addition to the billing, the market presents relevant figures as the growth of 22% in the number of e-consumers between 2015 and 2016; growth of 8% in average ticket and indicators pointing out that approximately 25% of the Brazilian population already has the habit of consuming over the internet (WEBSHOPPERS REPORT, 2017).
Considering a scenario of good expectations, investment and resources intended for the market of e-commerce, in addition to the constant growth of its sales (WEBSHOPPERS REPORT, 2017), changes in the environment in which organizations are inserted are evident and has been providing changes in relation to the final consumer (NAPIER; JUDD; RIVERS; WAGNER, 2001; LIN; SILVEIRA; RAMOS, 2014). The e-commerce became one of the major business segment of the new economy and, following its trends, changing every form of consumption and the relationship of the traditional sales model (ENSSLIN; LACERDA; CHAVES; LIMA; LIMA, 2014), presenting, including, as a fundamental strategy and of the greatest potential to the current context. Zhang and Wang (2015) also argue that the e-commerce refers not only to a company or the adoption of a strategy by several companies in particular business segment. Much more representative than this, this type of business is a global trend.
Understanding what the consumer seeks, what builds his or her loyalty and different ways of reaching him or her has been a constant concern of companies operating in the virtual marketplace. Thus, factors such as credibility, indication, recommendation, and design and user experience in the process of buying points are often addressed. (FREDERICO; TEIXEIRA; GHANI; ANDRADE, 2017). In the national literature it is common to see translations of the terms fidelity and loyalty as synonyms, especially considering the thematic area of marketing. Just as Ferreira,
REUNA, Belo Horizonte - MG, Brasil, v.23, n.2, p.23-42, Abr. – Jun. 2018 - ISSN 2179-8834
25 Tadeu Ataíde Arantes Guedes, Marlusa de Sevilha Gosling, Solange Riveli de Oliveira, Iury Teixeira de Sevilha Gosling e Kelly Cristine Oliveira Meira
Hashimoto, Silva and Troccoli (2011) understood the terms interchangeably when performing a bibliometric survey in ENANPAD’s about loyalty, the present study considers the terms also as synonyms.
As highlighted by Rohden and Matos (2013), due to the particularities and peculiarities of consumption in e-commerce, the development of research that aims to understand the factors propellant of loyalty and satisfaction becomes crucial.
Therefore, the research problem that motivates this study is: what are the factors that influence the loyalty of e-consumers?
2. Theoretical framework
2.1 E-commerce market
The e-commerce arose and changed completely the functioning of the economy and the retail sector in Brazil, demanding a revolution in the structures of the market and the need to redesign an entire purchasing process, drivers of success and strategies of engagement, loyalty and exploitation of the consumer market. (MEDEIROS; VIEIRA; NOGAMI, 2014). Its wide acceptance and diffusion is a consequence of important factors in the world economy, from a modernization of processes, maturing of the use of the web, structuring of global connections and extensive dynamism (CONDE, 2013).
Acting over the internet provides gains for all parties involved in the process of buying and selling, and therefore it has been highlighted as one of the main channels of sale currently (BONES; HAMMERSLEY 2015). According to Galinari et al. (2015) the electronic commerce has the advantage of saving time and cost of travel to a physical store by the consumer. In addition to bringing comfort, consumers enjoy a high level of personalized services, more efficient purchase, greater range of products, as well as immediate information and cheaper products (ALMEIDA; BRENDLE; SPINDOLA, 2014).
The prospects for the e-commerce remain positive. The scenario is already favorable to compare it with the performance of the economy in a general way, with steady growth even in times of economic crisis (WEBSHOPPERS REPORT, 2017).
2.2 Loyalty of e-consumers
The loyalty of online consumers is due to several factors, and is directly related with the intention to repurchase of this consumer, as suggested by Dick and Basu (1994).
According to Ward and Dagger (2007), strong relationships contribute to the perception of quality and increase consumer satisfaction and loyalty to the services offered by the organization. Thus, organizations that seek to relate more effectively and bring a more positive experience tend to have higher rates of loyalty of its consumers.
However, when analyzing the industry of virtual purchases in comparison to physical sales, the difficulty of loyalty in e-commerce is something far more complex. There are many factors such as price, confidence in the brand and previous
REUNA, Belo Horizonte - MG, Brasil, v.23, n.2, p.23-42, Abr. – Jun. 2018 - ISSN 2179-8834
26 FACTORS THAT IMPACT IN E-CONSUMER LOYALTY
experiences, which are taken into account in the choice of a product or a virtual platform for the purchase to be performed (CHO; HSU, 2015).
The work of loyalty becomes fundamental in the point that, as there are major barriers to changes from one site to another, in addition to not existing a large customer customization or even a purchase by proximity or affinity with salespeople and managers, the concern to retain this consumer is always constant (WEBSHOPPERS REPORT, 2017).
2.3 Reliability
The confidence, not particularly for the virtual sector, is one of the key points to be studied in the decision-making process of purchase in virtually all sectors of the economy and has been studied in various disciplinary optics (SINGH; SIRDESHMUKH, 2000). As the trust factor is not due only to a successful action on the part of a company, not even justified exclusively by time to market and tradition, the theme is reflected in different subjects, since philosophical studies the marketing approaches that awaken the consumer the feeling of confidence to the point of opting for one, instead of the other, in choosing his or her supplier (RAZAK; MARIMUTHUB; OMAR; CHAH, 2014).
When migrating to the virtual world, we noticed that one of the factors that most influence the process of buying decision is confidence, because the virtual buying journey requires of the consumer some situations of less comfort and greater reliability, as the choice of a quality product, the payment decision, waiting for the delivery and other points on which the virtual commerce differs from the physical (DIBB; CHEN, 2010). Not only the trust is an important factor in this process, but also lack of confidence is pointed out by Urban, Amyx, Lorenzon (2009) as the main barrier that prevents consumers from carrying out virtual purchases.
2.4 Price
Understanding how the price influences on customer loyalty is an important point to be researched, because the relevance of the theme is so evident when we observe the existing great competitiveness index to fight for a price considered within the market, the transparency with which these prices are transmitted to the final consumer and the ease of research of prices competitors (ANDERSON; SWAMINATHAN, 2011).
According to the research of CETIC.br (2016) that seeks to analyze the virtual commerce and how purchases are carried out, indicates that 60% of users perform purchases after searching for prices, showing the importance of prices and the concern in being competitive among its competitors to online consumers.
The price, inclusive, is a factor that motivates the transition from physical to virtual, since, in addition to facilitated research the e-consumers have the incentive, many times, to participate in benefits programs, greater variety, exclusive promotions and other benefits (YOON; OCCEÑA, 2015).
REUNA, Belo Horizonte - MG, Brasil, v.23, n.2, p.23-42, Abr. – Jun. 2018 - ISSN 2179-8834
27 Tadeu Ataíde Arantes Guedes, Marlusa de Sevilha Gosling, Solange Riveli de Oliveira, Iury Teixeira de Sevilha Gosling e Kelly Cristine Oliveira Meira
2.5 Purchase experience
The buying experience in the virtual market is very close to factors related to the whole journey performed by the customer, i.e., since when the customer is browsing the website, choose his or her products, performs the payment and receives his or her product at home (ANDERSON; SWAMINATHAN, 2011).
Some points are highlighted by Anderson and Swaminathan (2011) as being important for the purchase experience and, consequently, loyalty, with the site, namely, the variety of products in the store and the ease in the transaction.
The factor variety of products differs not only in a specific store as the entire e-commerce upon comparing it with the physical environment (CLARKE; FLAHERTY, 2005). According to Anderson and Swaminathan (2011), it is expected by e-consumer that the virtual store has a great variety of products, models and types, offering a mix of products sufficient to ensure that the client find in there all they need and do not need to go searching in other shops. Whereas the ease of transaction is related to the navigability of the site, in not having great difficulties to select their products, make the payment and complete their purchase (ANDERSON; SWAMINATHAN, 2011).
The delivery of products also composes the buying experience for consumers, since they expect that products are delivered without damage and within the agreed deadline with the store at the time of purchase, that all contracted installations are carried out and are in readiness to respond to possible customer’s claims and demands. (ANDERSON; SWAMINATHAN, 2011).
2.6 Visual Design / environment
The visual environment is considered a fundamental factor for the achievement of purchase and consequent loyalty of e-consumers with the virtual stores (MATTAR, 2011). To Anderson and Swaminathan (2011) the virtual aesthetics can even provide a competitive advantage for some virtual stores. There are several ways to highlight, not only with the beautiful and intuitive web site, but with well worked images, texts, graphic styles produced in consistency with the proposal of the company, logos, slogans and color palette thought according to the user experience (ANDERSON; SWAMINATHAN, 2011).
On the customization, including Rose, Clark and Hair (2012) emphasize that it becomes very important especially on models where the user is invited to engage with the platform, creating a his or her own page, with his or her logo, his or her name and his or her identity, thus causing a feeling of belonging and, consequently, loyalty.
2.7 After-sales
The after-sales experience to the e-consumer takes place at the moment in which the purchase was performed, the product delivered and, on the part of the e-commerce Supplier, there is an attempt to understand the whole process of purchase and customer engagement, trying to bring a feeling of perceived benefits to the buyer (YU; DEAN, 2001). Interactivity is the way that the company seeks its consumer with the aim of establishing a bond of trust and a better understanding of the experience as a whole (ANDERSON; SWAMINATHAN, 2011).
REUNA, Belo Horizonte - MG, Brasil, v.23, n.2, p.23-42, Abr. – Jun. 2018 - ISSN 2179-8834
28 FACTORS THAT IMPACT IN E-CONSUMER LOYALTY
For Silva, Frio, Sampaio and Broilo (2015), the scales that usually work for measuring the satisfaction and the interaction with the consumer do not sound entirely applicable to the virtual world, taking with it the concern to offer something more personalized. Thinking in all development in the area of after-sales, it is evidenced by the constant evolution and concern with the service provided online, developing appropriate scales in this new context to understand at which points the result will be more effective for the e-consumer (BORGES; VEIGA; GONÇALVES; FERNANDES; TORRES, 2014).
3. Methodology
With the objective to analyze the relationships between variables and constructs from previously established hypotheses, we have as characteristic of this research the conclusive descriptive character with a mixed approach, i.e., qualitative and quantitative phases.
The qualitative research conducted was built based on the exploitation of this literature and guided in order to understand what points are cited more frequently. For the definition of the constructs, the qualitative research as joined with the theoretical model of the antecedents of satisfaction of the e-commerce market of Anderson and Swaminathan (2011).
In the qualitative research 25 people were interviewed being 14 females and 11 males. The ages of the interviewees varied between 15 and 75 years, and the questions of the qualitative script were:
1 - Do you usually make purchases over the internet?
2 - What attracts you most to buy over the internet?
3 - What do you take into consideration when choosing the site?
4 - Describe what would be a successful purchase
5 - What would motivate you to swap one site to another?
6 - What would make you not to buy in a website?
7 - What would motivate you to buy again from the same store?
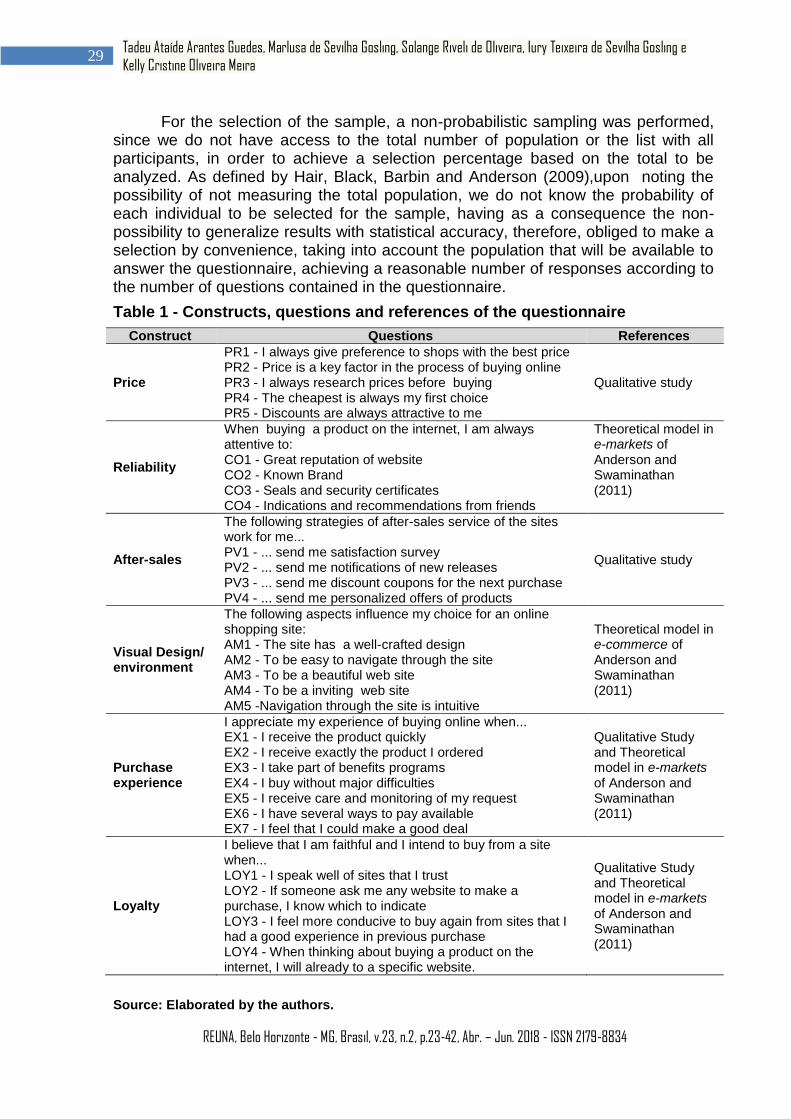
As a result of the qualitative phase items were generated to proceed with the quantitative phase. Table 1 shows the constructs and references used.
The data of the quantitative phase were collected between September and October 2017, by means of an online questionnaire shared in social networks and encouraged/requested for sharing of third parties for greater disclosure. The platform used was Google forms due to the ease, convenience, consolidation of data and due to being already usual for the respondents. The Likert Scale was used for the standardized measurement of indicators with eleven points, which vary between (0) "completely disagree" and (10) "completely agree".
The population studied in the research was of Brazilians with internet access and with the habit of making online purchases. This is due to the fact that the analysis aims to identify trends and the profile of consumers, in order to obtain data relating to what are the factors that build the consumer loyalty to a specific virtual store.
REUNA, Belo Horizonte - MG, Brasil, v.23, n.2, p.23-42, Abr. – Jun. 2018 - ISSN 2179-8834
29 Tadeu Ataíde Arantes Guedes, Marlusa de Sevilha Gosling, Solange Riveli de Oliveira, Iury Teixeira de Sevilha Gosling e Kelly Cristine Oliveira Meira
For the selection of the sample, a non-probabilistic sampling was performed, since we do not have access to the total number of population or the list with all participants, in order to achieve a selection percentage based on the total to be analyzed. As defined by Hair, Black, Barbin and Anderson (2009),upon noting the possibility of not measuring the total population, we do not know the probability of each individual to be selected for the sample, having as a consequence the non-possibility to generalize results with statistical accuracy, therefore, obliged to make a selection by convenience, taking into account the population that will be available to answer the questionnaire, achieving a reasonable number of responses according to the number of questions contained in the questionnaire.
Table 1 - Constructs, questions and references of the questionnaire
Construct Questions References
Price
PR1 - I always give preference to shops with the best price PR2 - Price is a key factor in the process of buying online PR3 - I always research prices before buying PR4 - The cheapest is always my first choice PR5 - Discounts are always attractive to me
Qualitative study
Reliability
When buying a product on the internet, I am always attentive to: CO1 - Great reputation of website CO2 - Known Brand CO3 - Seals and security certificates CO4 - Indications and recommendations from friends
Theoretical model in e-markets of Anderson and Swaminathan (2011)
After-sales
The following strategies of after-sales service of the sites work for me... PV1 - ... send me satisfaction survey PV2 - ... send me notifications of new releases PV3 - ... send me discount coupons for the next purchase PV4 - ... send me personalized offers of products
Qualitative study
Visual Design/ environment
The following aspects influence my choice for an online shopping site: AM1 - The site has a well-crafted design AM2 - To be easy to navigate through the site AM3 - To be a beautiful web site AM4 - To be a inviting web site AM5 -Navigation through the site is intuitive
Theoretical model in e-commerce of Anderson and Swaminathan (2011)
Purchase experience
I appreciate my experience of buying online when... EX1 - I receive the product quickly EX2 - I receive exactly the product I ordered EX3 - I take part of benefits programs EX4 - I buy without major difficulties EX5 - I receive care and monitoring of my request EX6 - I have several ways to pay available EX7 - I feel that I could make a good deal
Qualitative Study and Theoretical model in e-markets of Anderson and Swaminathan (2011)
Loyalty
I believe that I am faithful and I intend to buy from a site when... LOY1 - I speak well of sites that I trust LOY2 - If someone ask me any website to make a purchase, I know which to indicate LOY3 - I feel more conducive to buy again from sites that I had a good experience in previous purchase LOY4 - When thinking about buying a product on the internet, I will already to a specific website.
Qualitative Study and Theoretical model in e-markets of Anderson and Swaminathan (2011)
Source: Elaborated by the authors.
REUNA, Belo Horizonte - MG, Brasil, v.23, n.2, p.23-42, Abr. – Jun. 2018 - ISSN 2179-8834
30 FACTORS THAT IMPACT IN E-CONSUMER LOYALTY
In this study we tested the following hypotheses:
H1: The higher the reliability, the greater the loyalty/retention of e-consumer.
H2: The better the design, the greater the loyalty/retention of e-consumer.
H3: The better the design, the greater the purchase experience of e-consumer.
H4: The better the purchase experience, the greater the loyalty/retention of e-consumer.
H5: The better the after-sales, the greater the purchase experience of e-consumer.
H6: The lower the price, the greater the loyalty/retention of e-consumer.
The constructs whose items were removed from other studies, were modeled as in the original study (reflective). Another criterion was the verification of the relationship between the construct and their respective items. Thus, the construct purchase experience was modeled as formative.
4. DATA ANALYSIS
4.1 Sample characterization
The research sample counted with 160 individual responses to the online survey, in the platform Google Forms. Of these, 146 responses were seized and 14 discarded, because they do not fit the profile of consumers sought (individuals who have the habit of buying over the internet) or to be outliers.
The sample is composed mostly by women who represent 60.6%, while the men represent 38.8% and a person chose not to identify himself or herself. It is not possible to determine the reason for the predominance of females. It was also noted that the majority of participants were between 18 and 29 years (58.8%), while the second group with more respondents in the survey had people between 45 and 60 years (18.1%). It is important to highlight that the minors corresponded to 5.6% of the answers. The other groups are represented by: between 30 and 45 years, corresponding to 12.5% of the population and over 60 years, corresponding to 5% of the population.
4.2 Analysis of normality, linearity, uni and multivariate outliers and descriptive statistics
For the analysis of the data normality, in general, the Kolmogorov-Smirnov tests are used, when the sample is greater than 50 (HAIR, ANDERSON; TATHEM; BLACK, 2005). The assessment is performed on the basis of the normal distribution curve when comparing the data of a given sample with a normal distribution with the same mean and standard deviation (HAIR; KOHLI; RINGLE; SARSTEDT, 2014). As a result, the data were not univariate normal and, consequently, there is not a multivariate normality.
To test the linearity, the linear correlation pair to pair was calculated using the Spearman correlation (HAIR et al., 2005). The percentage of significant correlations of each sample was assessed, which indicate the presence of linear data.
REUNA, Belo Horizonte - MG, Brasil, v.23, n.2, p.23-42, Abr. – Jun. 2018 - ISSN 2179-8834
31 Tadeu Ataíde Arantes Guedes, Marlusa de Sevilha Gosling, Solange Riveli de Oliveira, Iury Teixeira de Sevilha Gosling e Kelly Cristine Oliveira Meira
The Outliers are atypical observations that have an extreme response to a question or a unique combination of responses, significantly different from the patterns observed by the majority of the interviewees (HAIR et al., 2005; 2014). In the sample uni (5) and multivariate (1) outliers were removed.
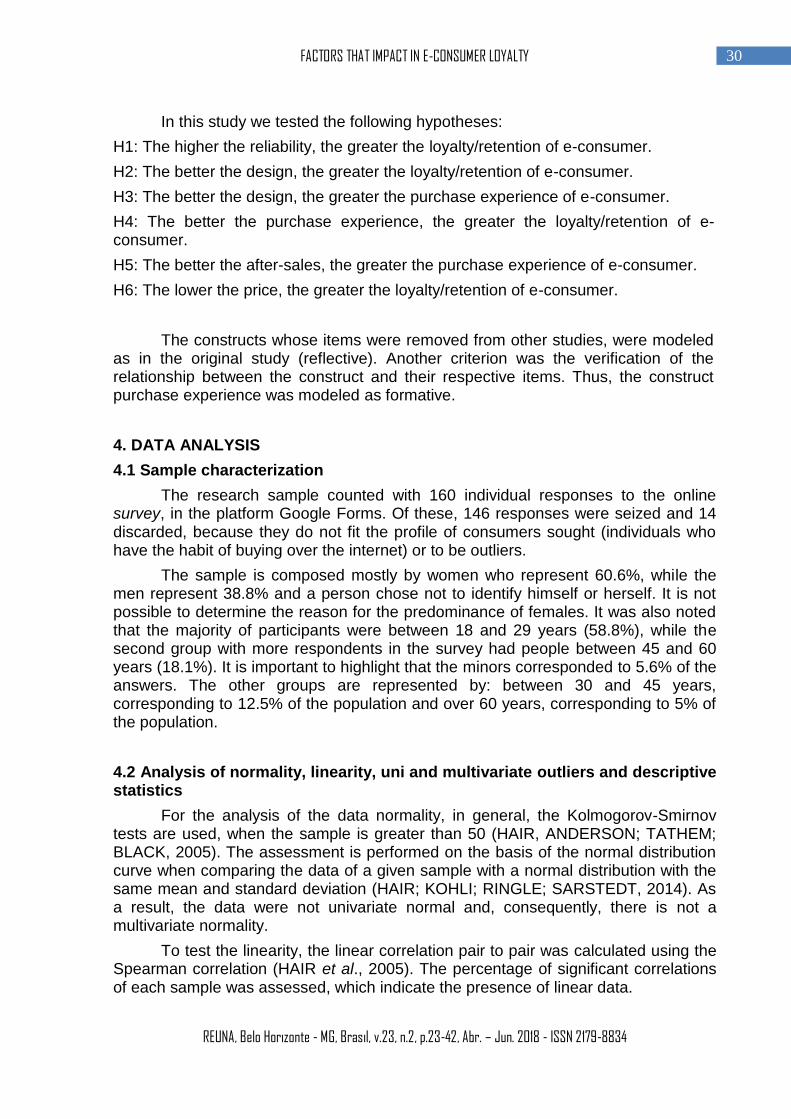
The descriptive statistics exposed below have the property to represent the trend of data whose analysis was performed with the aid of SPSS software. For comparison purposes, the value of standard deviation equivalent to 3 as reference was used, as suggested by Hair et al. (2005). Thus, standard deviation values greater than 3 were considered high, representing that respondents were not consistent in their responses, while less than 3 were considered low, representing that the respondents were consistent in their responses. As it can be seen in table 2 below, only those items of after-sales construct have standard deviations greater than 3, even so, marginally.
Table 2 - Descriptive Statistics of Constructs
Price PR1 PR2 PR3 PR4 PR5
N 146 146 146 146 146
Average 7.92 8.29 9.02 8.71 7.23
Standard Deviation 2.015 1.864 1.840 1.890 2.508
Reliability CO1 CO2 CO3 CO4
N 146 146 146 146
Average 9.28 8.98 9.44 8.57
Standard Deviation 1.296 1.469 1.209 1.857
Visual Design/ environment AM1 AM2 AM3 AM4 AM5
N 146 146 146 146 146
Average 8.09 8.85 7.54 7.89 8.21
Standard Deviation 1.606 1.205 1.909 1.770 2.024
After-sales PV1 PV2 PV3 PV4
N 146 146 146 146
Average 5.40 6.33 5.48 8.21
Standard Deviation 3.142 3.017 3.180 2.314
Purchase experience EX1 EX2 EX3 EX4 EX5 EX6 EX7
N 146 146 146 146 146 146 146
Average 9.45 9.54 7.35 9.11 8.71 8.40 9.29
Standard Deviation 1.133 1.594 2.406 1.514 2.042 2.245 1.226
Loyalty FI1 FI2 FI3 FI4
N 146 146 146 146
Average 8.88 8.75 9.42 8.14
Standard Deviation 1.614 1.582 1.075 1.919
Source: Research data.
REUNA, Belo Horizonte - MG, Brasil, v.23, n.2, p.23-42, Abr. – Jun. 2018 - ISSN 2179-8834
32 FACTORS THAT IMPACT IN E-CONSUMER LOYALTY
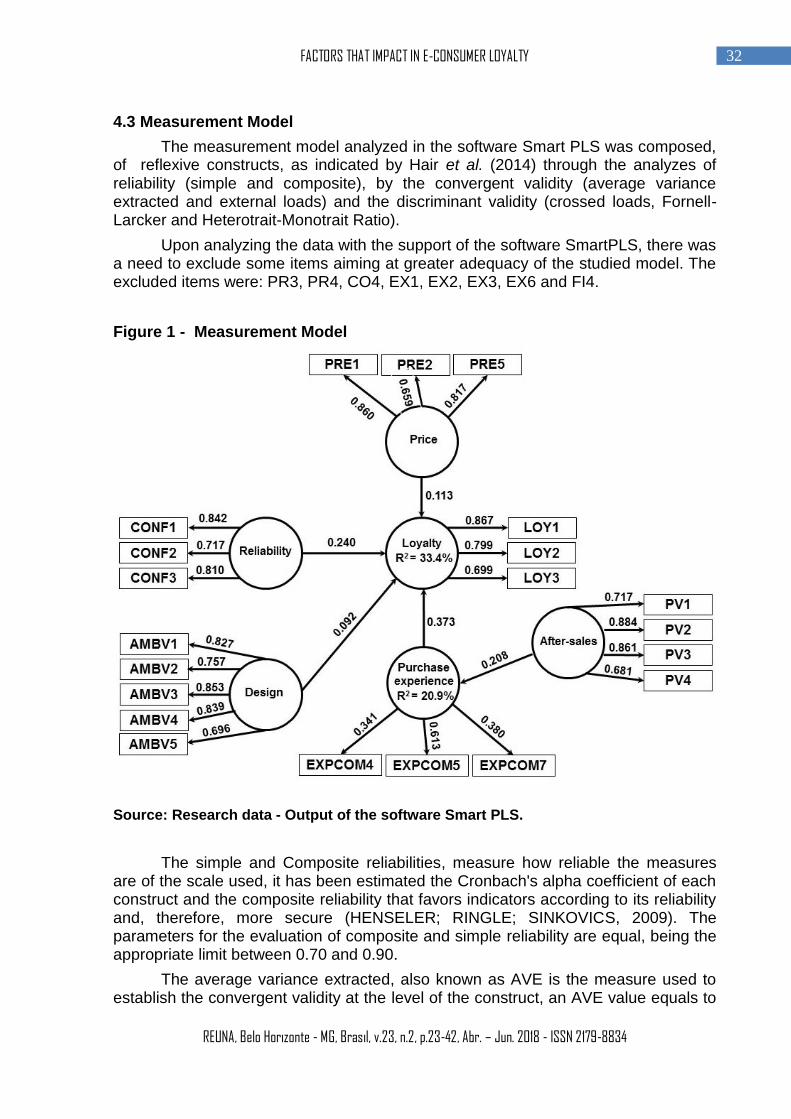
4.3 Measurement Model
The measurement model analyzed in the software Smart PLS was composed, of reflexive constructs, as indicated by Hair et al. (2014) through the analyzes of reliability (simple and composite), by the convergent validity (average variance extracted and external loads) and the discriminant validity (crossed loads, Fornell-Larcker and Heterotrait-Monotrait Ratio).
Upon analyzing the data with the support of the software SmartPLS, there was a need to exclude some items aiming at greater adequacy of the studied model. The excluded items were: PR3, PR4, CO4, EX1, EX2, EX3, EX6 and FI4.
Figure 1 - Measurement Model
Source: Research data - Output of the software Smart PLS.
The simple and Composite reliabilities, measure how reliable the measures are of the scale used, it has been estimated the Cronbach's alpha coefficient of each construct and the composite reliability that favors indicators according to its reliability and, therefore, more secure (HENSELER; RINGLE; SINKOVICS, 2009). The parameters for the evaluation of composite and simple reliability are equal, being the appropriate limit between 0.70 and 0.90.
The average variance extracted, also known as AVE is the measure used to establish the convergent validity at the level of the construct, an AVE value equals to
REUNA, Belo Horizonte - MG, Brasil, v.23, n.2, p.23-42, Abr. – Jun. 2018 - ISSN 2179-8834
33 Tadeu Ataíde Arantes Guedes, Marlusa de Sevilha Gosling, Solange Riveli de Oliveira, Iury Teixeira de Sevilha Gosling e Kelly Cristine Oliveira Meira
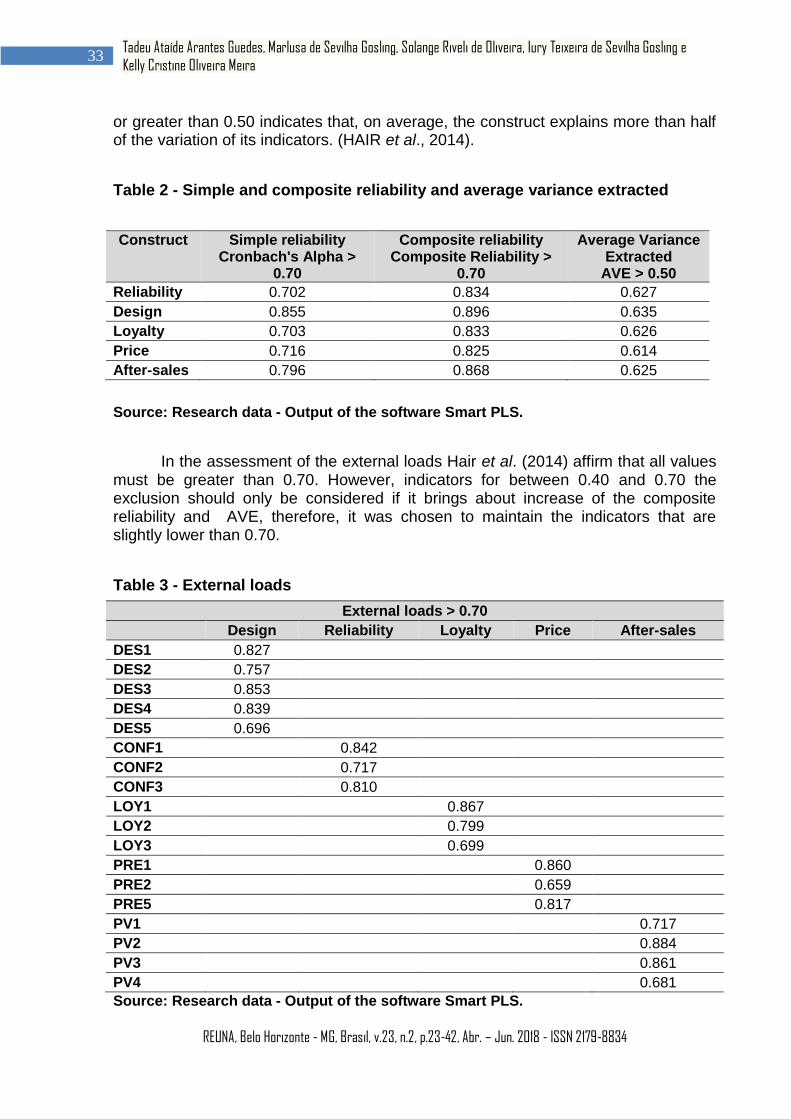
or greater than 0.50 indicates that, on average, the construct explains more than half of the variation of its indicators. (HAIR et al., 2014).
Table 2 - Simple and composite reliability and average variance extracted
Construct Simple reliability Cronbach's Alpha >
0.70
Composite reliability Composite Reliability >
0.70
Average Variance Extracted
AVE > 0.50
Reliability 0.702 0.834 0.627
Design 0.855 0.896 0.635
Loyalty 0.703 0.833 0.626
Price 0.716 0.825 0.614
After-sales 0.796 0.868 0.625
Source: Research data - Output of the software Smart PLS.
In the assessment of the external loads Hair et al. (2014) affirm that all values must be greater than 0.70. However, indicators for between 0.40 and 0.70 the exclusion should only be considered if it brings about increase of the composite reliability and AVE, therefore, it was chosen to maintain the indicators that are slightly lower than 0.70.
Table 3 - External loads
External loads > 0.70
Design Reliability Loyalty Price After-sales
DES1 0.827
DES2 0.757
DES3 0.853
DES4 0.839
DES5 0.696
CONF1 0.842
CONF2 0.717
CONF3 0.810
LOY1 0.867
LOY2 0.799
LOY3 0.699
PRE1 0.860
PRE2 0.659
PRE5 0.817
PV1 0.717
PV2 0.884
PV3 0.861
PV4 0.681
Source: Research data - Output of the software Smart PLS.
REUNA, Belo Horizonte - MG, Brasil, v.23, n.2, p.23-42, Abr. – Jun. 2018 - ISSN 2179-8834
34 FACTORS THAT IMPACT IN E-CONSUMER LOYALTY
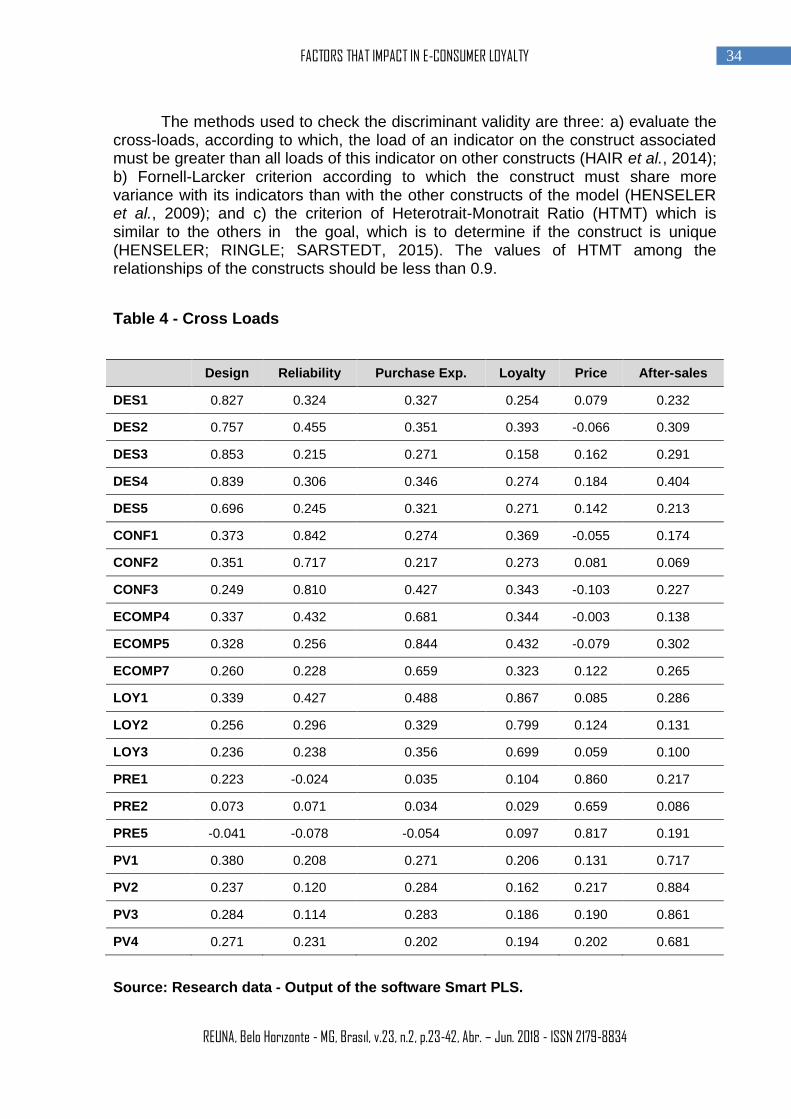
The methods used to check the discriminant validity are three: a) evaluate the cross-loads, according to which, the load of an indicator on the construct associated must be greater than all loads of this indicator on other constructs (HAIR et al., 2014); b) Fornell-Larcker criterion according to which the construct must share more variance with its indicators than with the other constructs of the model (HENSELER et al., 2009); and c) the criterion of Heterotrait-Monotrait Ratio (HTMT) which is similar to the others in the goal, which is to determine if the construct is unique (HENSELER; RINGLE; SARSTEDT, 2015). The values of HTMT among the relationships of the constructs should be less than 0.9.
Table 4 - Cross Loads
Design Reliability Purchase Exp. Loyalty Price After-sales
DES1 0.827 0.324 0.327 0.254 0.079 0.232
DES2 0.757 0.455 0.351 0.393 -0.066 0.309
DES3 0.853 0.215 0.271 0.158 0.162 0.291
DES4 0.839 0.306 0.346 0.274 0.184 0.404
DES5 0.696 0.245 0.321 0.271 0.142 0.213
CONF1 0.373 0.842 0.274 0.369 -0.055 0.174
CONF2 0.351 0.717 0.217 0.273 0.081 0.069
CONF3 0.249 0.810 0.427 0.343 -0.103 0.227
ECOMP4 0.337 0.432 0.681 0.344 -0.003 0.138
ECOMP5 0.328 0.256 0.844 0.432 -0.079 0.302
ECOMP7 0.260 0.228 0.659 0.323 0.122 0.265
LOY1 0.339 0.427 0.488 0.867 0.085 0.286
LOY2 0.256 0.296 0.329 0.799 0.124 0.131
LOY3 0.236 0.238 0.356 0.699 0.059 0.100
PRE1 0.223 -0.024 0.035 0.104 0.860 0.217
PRE2 0.073 0.071 0.034 0.029 0.659 0.086
PRE5 -0.041 -0.078 -0.054 0.097 0.817 0.191
PV1 0.380 0.208 0.271 0.206 0.131 0.717
PV2 0.237 0.120 0.284 0.162 0.217 0.884
PV3 0.284 0.114 0.283 0.186 0.190 0.861
PV4 0.271 0.231 0.202 0.194 0.202 0.681
Source: Research data - Output of the software Smart PLS.
REUNA, Belo Horizonte - MG, Brasil, v.23, n.2, p.23-42, Abr. – Jun. 2018 - ISSN 2179-8834
35 Tadeu Ataíde Arantes Guedes, Marlusa de Sevilha Gosling, Solange Riveli de Oliveira, Iury Teixeira de Sevilha Gosling e Kelly Cristine Oliveira Meira
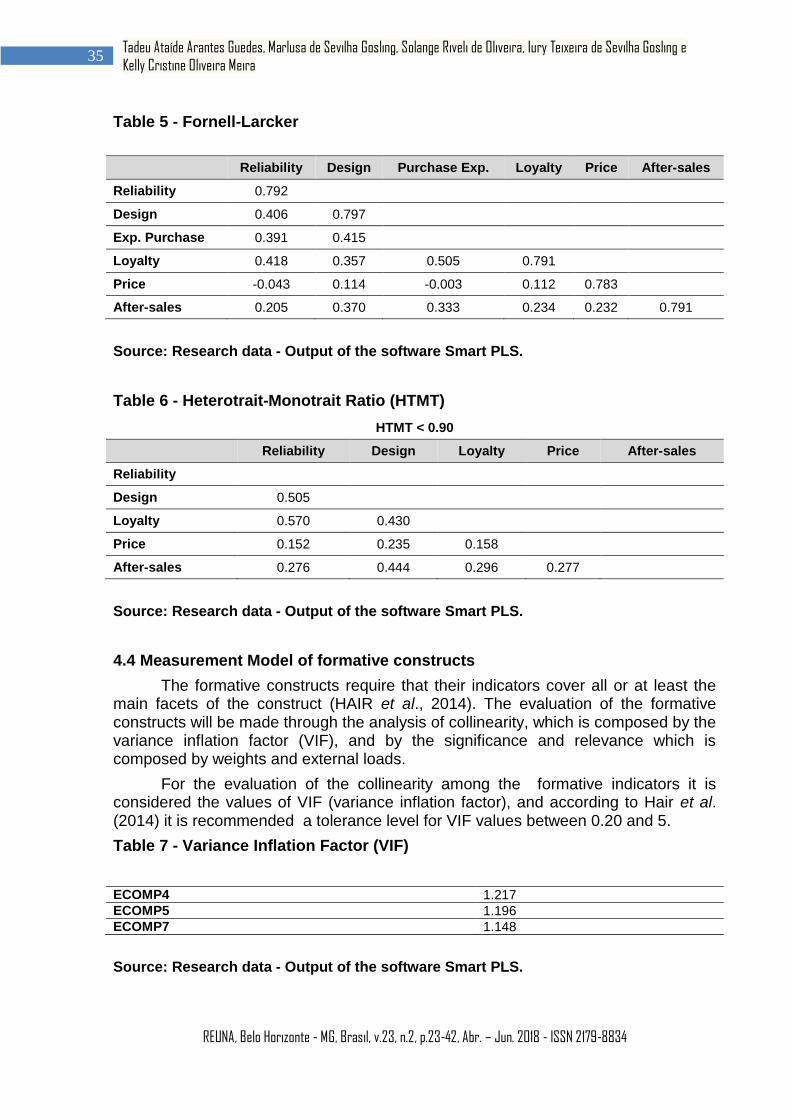
Table 5 - Fornell-Larcker
Reliability Design Purchase Exp. Loyalty Price After-sales
Reliability 0.792
Design 0.406 0.797
Exp. Purchase 0.391 0.415
Loyalty 0.418 0.357 0.505 0.791
Price -0.043 0.114 -0.003 0.112 0.783
After-sales 0.205 0.370 0.333 0.234 0.232 0.791
Source: Research data - Output of the software Smart PLS.
Table 6 - Heterotrait-Monotrait Ratio (HTMT)
HTMT < 0.90
Reliability Design Loyalty Price After-sales
Reliability
Design 0.505
Loyalty 0.570 0.430
Price 0.152 0.235 0.158
After-sales 0.276 0.444 0.296 0.277
Source: Research data - Output of the software Smart PLS.
4.4 Measurement Model of formative constructs
The formative constructs require that their indicators cover all or at least the main facets of the construct (HAIR et al., 2014). The evaluation of the formative constructs will be made through the analysis of collinearity, which is composed by the variance inflation factor (VIF), and by the significance and relevance which is composed by weights and external loads.
For the evaluation of the collinearity among the formative indicators it is considered the values of VIF (variance inflation factor), and according to Hair et al. (2014) it is recommended a tolerance level for VIF values between 0.20 and 5.
Table 7 - Variance Inflation Factor (VIF)
ECOMP4 1.217
ECOMP5 1.196
ECOMP7 1.148
Source: Research data - Output of the software Smart PLS.
REUNA, Belo Horizonte - MG, Brasil, v.23, n.2, p.23-42, Abr. – Jun. 2018 - ISSN 2179-8834
36 FACTORS THAT IMPACT IN E-CONSUMER LOYALTY
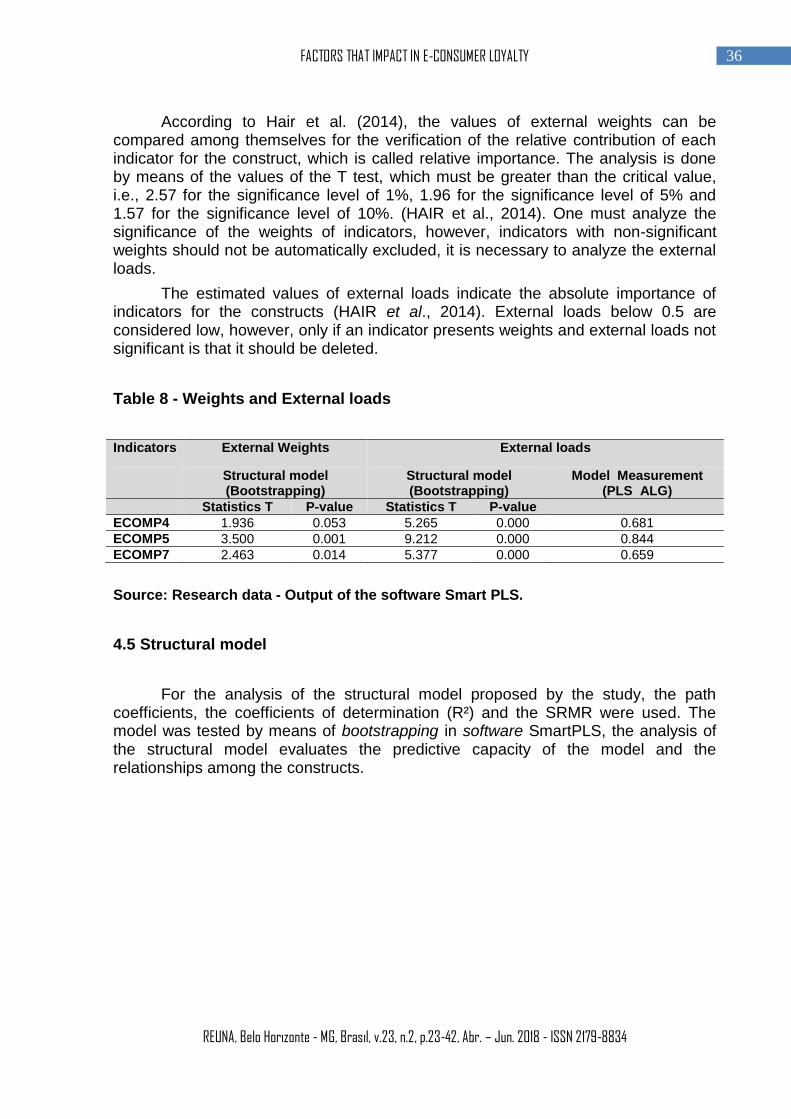
According to Hair et al. (2014), the values of external weights can be compared among themselves for the verification of the relative contribution of each indicator for the construct, which is called relative importance. The analysis is done by means of the values of the T test, which must be greater than the critical value, i.e., 2.57 for the significance level of 1%, 1.96 for the significance level of 5% and 1.57 for the significance level of 10%. (HAIR et al., 2014). One must analyze the significance of the weights of indicators, however, indicators with non-significant weights should not be automatically excluded, it is necessary to analyze the external loads.
The estimated values of external loads indicate the absolute importance of indicators for the constructs (HAIR et al., 2014). External loads below 0.5 are considered low, however, only if an indicator presents weights and external loads not significant is that it should be deleted.
Table 8 - Weights and External loads
Indicators External Weights External loads
Structural model (Bootstrapping)
Structural model (Bootstrapping)
Model Measurement (PLS ALG)
Statistics T P-value Statistics T P-value
ECOMP4 1.936 0.053 5.265 0.000 0.681
ECOMP5 3.500 0.001 9.212 0.000 0.844
ECOMP7 2.463 0.014 5.377 0.000 0.659
Source: Research data - Output of the software Smart PLS.
4.5 Structural model
For the analysis of the structural model proposed by the study, the path coefficients, the coefficients of determination (R²) and the SRMR were used. The model was tested by means of bootstrapping in software SmartPLS, the analysis of the structural model evaluates the predictive capacity of the model and the relationships among the constructs.
REUNA, Belo Horizonte - MG, Brasil, v.23, n.2, p.23-42, Abr. – Jun. 2018 - ISSN 2179-8834
37 Tadeu Ataíde Arantes Guedes, Marlusa de Sevilha Gosling, Solange Riveli de Oliveira, Iury Teixeira de Sevilha Gosling e Kelly Cristine Oliveira Meira
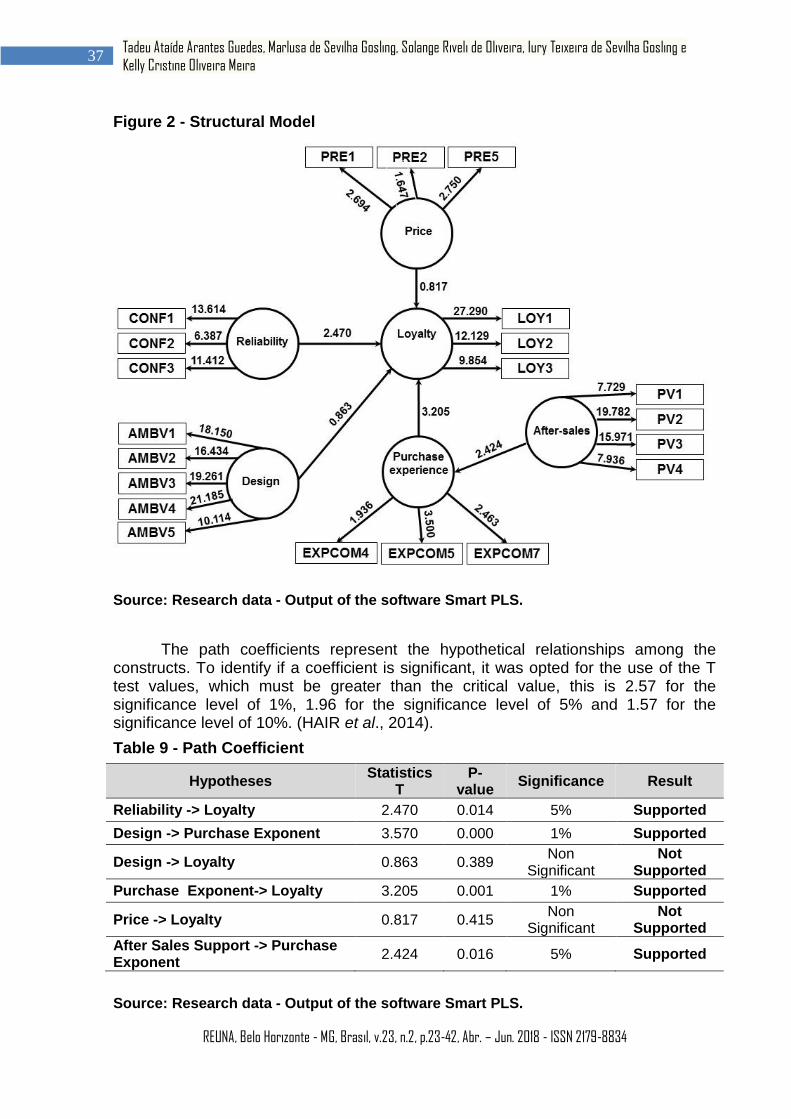
Figure 2 - Structural Model
Source: Research data - Output of the software Smart PLS.
The path coefficients represent the hypothetical relationships among the constructs. To identify if a coefficient is significant, it was opted for the use of the T test values, which must be greater than the critical value, this is 2.57 for the significance level of 1%, 1.96 for the significance level of 5% and 1.57 for the significance level of 10%. (HAIR et al., 2014).
Table 9 - Path Coefficient
Hypotheses Statistics
T P-
value Significance Result
Reliability -> Loyalty 2.470 0.014 5% Supported
Design -> Purchase Exponent 3.570 0.000 1% Supported
Design -> Loyalty 0.863 0.389 Non
Significant Not
Supported
Purchase Exponent-> Loyalty 3.205 0.001 1% Supported
Price -> Loyalty 0.817 0.415 Non
Significant Not
Supported
After Sales Support -> Purchase Exponent
2.424 0.016 5% Supported
Source: Research data - Output of the software Smart PLS.
REUNA, Belo Horizonte - MG, Brasil, v.23, n.2, p.23-42, Abr. – Jun. 2018 - ISSN 2179-8834
38 FACTORS THAT IMPACT IN E-CONSUMER LOYALTY
The coefficient of determination (R²) is a measure of the predictive power that the model has and values between 0.19 and 0.33 are considered weak, with coefficient value between 0.33 and 0.67 are considered moderate, and coefficient of determination with value above 0.67 is considered significant (HENSELER et al., 2009; HAIR et al., 2014). The R² of the construct buying experience was 0.209 and the adjusted R² was 0.199, whereas the loyalty construct obtained R² 0.334 and R² adjusted of 0.316.
The Standardized Root Mean Square Residual (SRMR) is defined as the difference between the correlations between observed and expected. The value of SRMR until 0.10 is considered good (HU; BENTLER, 1998), in this study the value of SRMR estimated was 0.091 and the observed value of 0.087, thus, both values are appropriate.
CONCLUSION
Currently, the market for e-commerce as well as the number of e-consumers has been increasing in the Brazilian market. In addition, indicators suggest that approximately 25% of the Brazilian population already has the habit of consuming over the internet (WEBSHOPPERS REPORT, 2017). This type of business is a global trend (ZHANG; WANG, 2015). Therefore, understanding how the consumer researches, which generates loyalty is essential for companies operating in the virtual marketplace. Thus, factors such as credibility, indication, recommendation, design and user experience in the process of buying points are often addressed. (FREDERICO; TEIXEIRA; GHANI; ANDRADE, 2017). This study proved to be relevant in the sense of contributing to the development of research that aims to understand the propellant factors of loyalty and satisfaction which become essential for consumption in e-commerce (ROHDEN; MATOS, 2013). It is worth pointing out that upon analyzing the industry of virtual purchases in comparison to physical sales, the difficulty of loyalty in e-commerce is something far more complex. There are many factors such as price, confidence in the brand and previous experiences, which are taken into account (CHO; HSU, 2015).
This research resulted in a psychometric instrument to be used in the context of e-commerce. The final instrument was composed of 21 items which involve the following dimensions: price, reliability, design, purchasing experience, after-sales and loyalty.
The constructs reliability, design, loyalty, price and after-sales presented as composite of reliable measurements and showed convergent and discriminant validity, even presenting indicators slightly lower than 0.70.
Upon assessing the formative construct of buying, through the analysis of collinearity, which is composed by the variance inflation factor (VIF), and by the significance and relevance which is composed by weights and external loads, three indicators were formed with this construct.
Considering the structural model proposed to evaluate the predictive capacity of the model and the relationships among the constructs the path coefficients, the coefficients of determination (R²) and the SRMR were considered. Considering the
significance level of 1% or 5% and p 0.05, rejection of the hypotheses H2 (The
REUNA, Belo Horizonte - MG, Brasil, v.23, n.2, p.23-42, Abr. – Jun. 2018 - ISSN 2179-8834
39 Tadeu Ataíde Arantes Guedes, Marlusa de Sevilha Gosling, Solange Riveli de Oliveira, Iury Teixeira de Sevilha Gosling e Kelly Cristine Oliveira Meira
better the design, the greater the loyalty of the e-consumer is ) and H6 (the lower the price, the greater the loyalty of the e-consumer) demonstrated that the best design and the lowest price do not influence the loyalty of the e-consumer. Thus, although the price is a factor that motivates the transition from physical to virtual (YOON; OCCEÑA, 2015), it is not a factor of loyalty (CHO; HSU, 2015), as well as the design. For Rose, Clark and Hair (2012) the design is very important when the user is invited to engage with the platform, and it may result in loyalty, in the present study, it was not possible to evaluate the engagement of the e-consumer. On the other hand, the design influences the purchase experience of e-consumer, as tested and accepted H3 (The better the design, the better the purchase experience of e-consumer). In turn, the buying experience is an important aspect for the loyalty of the e-consumer, according to acceptance of H4 (The better the buying experience is, the greater the loyalty of the e-consumer), since that organizations that seek to relate more effectively and bring a more positive experience tend to have higher rates of loyalty (WARD; DAGGER, 2007). In addition, the survey gave support for H1 (The higher the reliability, the greater the loyalty of the e-consumer is), demonstrating that the virtual buying journey requires of the consumer greater reliability (DIBB; CHEN, 2010) and that trust is positively associated with the loyalty (FREDERICO et al, 2017) and to H5 (The better the post-sales, the better the purchase experience of e-consumer), demonstrating that the after-sale impacts on the buying experience. This confirms the fact that when the company provides clients with useful and desirable after-purchase information, the e-business increase the customer satisfaction with the full experience of purchase of the product and decrease the likelihood of additional research on the part of the customer (ANDERSON; SWAMINATHAN, 2011). As a limitation, the research presents a non-probabilistic sample. Future research may be carried out considering new models, testing new relationships with the same constructs, for example, testing online trust as intimately linked to the site design (URBAN, AMYX, LORENZON, 2009) or by adding constructs correlating with loyalty, since there are many factors that can lead to loyalty.
REFERENCES
ALMEIDA, Raimunda Eunice da Silva.; BRENDLE, Vivian.; SPINOLA, Noelio Dantaslé. Ecommerce: Evolução, processo de compra, e o desafio da entrega. Revista de Desenvolvimento Econômico, Salvador, v. 16, n. 29, p.138-149, 2014
ANDERSON, Rolph E..; SWAMINATHAN, Srinivasan. Customer Satisfaction and Loyalty in E-Markets: A PLS Path Modeling Approach. Journal of Marketing Theory and Practice, v. 19, n. 2, p. 221–234, 2011.
BONES, Christopher.; HAMMERSLEY, James. Leading Digital Strategy: Driving Business Growth through effective e-commerce, Kogan Page, 2015
BORGES, Fábio Roberto; VEIGA, Ricardo Teixeira; GONÇALVES, Cid Gonçalves; FERNANDES, Izabella Bueno; TORRES, Noel. Qualidade em serviços e gestão da experiência do cliente no comércio eletrônico. Revista Pensamento Contemporâneo em Administração, v. 8, n. 2, p. 126-143, 2014.
REUNA, Belo Horizonte - MG, Brasil, v.23, n.2, p.23-42, Abr. – Jun. 2018 - ISSN 2179-8834
40 FACTORS THAT IMPACT IN E-CONSUMER LOYALTY
CETIC.BR. Pesquisa realizada entre os consumidores sobre os hábitos de pesquisa de preço prévios a realização da compra. 2016. Disponível em: <http://cetic.br/tics/usuarios/2016/total-brasil/H1/> Acesso em: 13 out. 2017.
CHOU, Shih-Wei; HSU, Chia-Shiang. Understanding Online Repurchase Intention: Social Exchange Theory and Shopping Habit. Informations Systems and e- Business Management, v. 14, n. 1, p. 19-45, 2015.
CLARKE, Irvine; FLAHERTY, Theresa. Advances in Eletronic Marketing. Hershey: IGI Publishing, 2005.
CONDE, Ana Carolina Pinzkoski. Estímulos no ambiente de compra online: Impacto na intenção de recompra do consumidor. 2013. 148f. Dissertação (Mestrado em Ciências) – Universidade de São Paulo – São Paulo, 2013.
DIBB, Sally; CHEN, Jun. Consumer Trust in the Online Retail Context: Exploring the Antecedents and Consequences. Psychology & Marketing, v. 27, n. 4, p. 323–346, 2010.
DICK, Allan S.; BASU, Kunal. Customer loyalty: towards an integrated framework. Journal of the Academy of Marketing Science, v. 22, n. 2, p. 99-113, 1994.
ENSSLIN, Leonardo.; LACERDA, Rogério Tadeu de Oliveira.; CHAVES., Leonardo Corrêa; LIMA, Patricia Schmidt Hahn; LIMA, Carlos Rogerio Montenegro. Evidenciação do Estado da Arte do Balanced Scorecard no E-Commerce. Organizações em Contexto, v. 10, n. 20, p. 343-370, 2014.
FERREIRA, Gilciney; HASHIMOTO, Jean Pierre; SILVA, Maria Claudete; TROCCOLI, Irene Raguenet. Lealdade nos EnANPADs de 2000 a 2010: Um Levantamento Bibliométrico, Sociedade, Contabilidade e Gestão, v. 6, n. 2, p. 106-123, 2011.
FREDERICO, Elias; TEIXEIRA, Nathalia Cavalcante; GHANI, Samia Ahmed Abdul; ANDRADE, Josmar. Determinantes da lealdade aos sites de compras coletivas (SCCs). REGE – Revista de Gestão, v. 24, n. 3, p. 281-290, 2017.
HAIR Jr., Joseph F., BABIN, Barry., MONEY, Arthur. H., SAMOUEL, Phillip. Fundamentos de métodos de pesquisa em administração. Porto Alegre: Bookman, 2005.
HAIR, Joseph F.; BLACK, William. C.; BABIN, Barry J.; ANDERSON, Rolph. E. Multivariate Data Analysis. Upper Saddler River: Prentice-Hall, 2009.
HAIR, Joseph F.; ANDERSON, Rolph. E.; TATHEM, Ronald L.; BLACK, William C. Análise Multivariada de Dados. Porto Alegre: Bookman, 2005.
HAIR, Joseph F.; HULT, G. Tomas. M.; RINGLE, Christian. M.; SARSTEDT, Marko. A Primer on Partial Least Squares Structural Equation Modeling (PLS-SEM). Los Angeles: Sage Publications, 2014.
REUNA, Belo Horizonte - MG, Brasil, v.23, n.2, p.23-42, Abr. – Jun. 2018 - ISSN 2179-8834
41 Tadeu Ataíde Arantes Guedes, Marlusa de Sevilha Gosling, Solange Riveli de Oliveira, Iury Teixeira de Sevilha Gosling e Kelly Cristine Oliveira Meira
HENSELER, Jörg; RINGLE, Christian M.; SARSTEDT, Marko. A new criterion for assessing discriminant validity in variance-based structural equation modeling. Journal of the Academy Marketing Science, v. 43, p. 115–135. 2015.
HENSELER, Jörg.; RINGLE, Christian M.; SINKOVICS, Roudolf. R. The use of partial least squares path modeling in international marketing. Advances in International Marketing (AIM), v. 20, p. 277-320, 2009.
HU, Li-tze; BENTLER, Peter. M. Fit indices in covariance structure modeling: sensitivity to underparameterized model misspecification. Psychological Methods, v. 3, n. 4, p. 424-453 1998.
LIN, Cibele Eschner; SILVEIRA, Ricardo Boeing; RAMOS, Marcos Roberto. O Crescimento do E-commerce: Posicionamento e Gestão da Marca Shopmasp. TAC, Rio de Janeiro, v. 4, n. 2, p. 148-163, 2014.
MATTAR, Fauze Najib. Administração de Varejo. Rio de Janeiro: Elsavier, 2011.
MEDEIROS, Juliana; VIEIRA, Francisco Giovanni David; NOGAMI, Vitor Koki da Costa. A construção do mercado editorial eletrônico no Brasil por meio de práticas de marketing. Revista de Adinistração Mackenzie, v.15, n.1, p.152-173, 2014.
NAPIER, H. Albert.; JUDD, P. J.; RIVERS, Ollie N. Rivers; WAGNER, Stuart. W. Creating a Winning E-Business. Course Technology. Boston, MA, 2001.
RAZAK, Nurhanan Syafiah Abdul; MARIMUTHUB, Malliga; OMAR, Azizah; MAMAT, Mazlina. Trust and Repurchase Intention on Online Tourism Services among Malaysian Consumers. Procedia - Social and Behavioral Sciences, v. 130, p. 577– 582, 2014.
RELATÓRIO WEBSHOPPERS 2017. 35a Edição. Disponível em: <http://www.fecomercio.com.br/public/upload/editor/pdfs/webshoppers_35_edicao.pdf> Acesso em: 01 out. 2017.
ROHDEN, Simoni Fernanda; MATOS, Celso Augusto. Comportamento do Consumidor de Países Emergentes em Situações de Falha e Recuperação de Serviços Online. In: 36º Encontro Nacional da ANPAD – ENANPAD, 2013, Rio de Janeiro. Anais. Rio de Janeiro: ANPAD, 2013.
ROSE, Susan; CLARK, Moira; SAMOUEL, Phillip; HAIR, Neil. Online Customer Experience in e- Retailing: An empirical model of Antecedents and Outcomes. Journal of Retailing, v. 88, n.2, p. 308-322, 2012.
SILVA, Renata Gonçalves Santos; FRIO, Ricardo Saraiva; SAMPAIO, Claudio Hoffmann; BROILO, Patrícia Liebesny. Qualidade percebida do Autosserviço Online: Validação da Escala e-SELFQUAL no Contexto Brasileiro. Revista Brasileira de Marketing, v.14, n. 2, p. 138-153, 2015.
SINGH, Jagdip; SIRDESHMUKH, Deepak. Agency and Trust Mechanisms in Consumer Satisfaction and Loyalty Judgements. Journal of the Academy of Marketing Science, v. 28, n. 1, p. 150 - 167, 2000.
REUNA, Belo Horizonte - MG, Brasil, v.23, n.2, p.23-42, Abr. – Jun. 2018 - ISSN 2179-8834
42 FACTORS THAT IMPACT IN E-CONSUMER LOYALTY
URBAN, Glen L.; AMYX, Cinda; LORENZON, Antonio. Online Trust: State of the Art, New Frontiers, and Research Potential. Journal of Interactive Marketing, v. 23,n.2, p. 179-190, 2009.
WARD, Tony; DAGGER, Tracey S. The complexity of Relationship Marketing for Service Customers. Journal of Services Marketing, v. 21, n. 4, 2007.
YOON, Hyun Shik; OCCEÑA, Luis. G. Influencing factors of trust in consumer-to-consumer electronic commerce with gender and age. International Journal of Information Management, v.35, n.3, p. 352-363, 2015.
YU, Yi‐Ting; DEAN, Alison. The contribution of emotional satisfaction to consumer loyalty. International Journal of Service Industry Management, v. 12, n. 3, p. 234-250, 2001.
ZHANG, Zheng; WANG, Yu. Analysis of Small and Medium-Sized Enterprises’ E-Commerce Development Status in China in the New Economy Era. Cross-Cultural Communication, v.. 11, n. 2, p. 97-101, 2015.