Embed Size (px)
Citation preview

The Wharton School. University of Pennsylvania
April 29/30, 2015
Factors that impact on pension fund
investments in infrastructure under
the current global financial regulation
Implications of the New Regulatory Order for Retirement System Risk Management
Javier Alonso, Alfonso Arellano and David Tuesta

1
Outline
1. Motivation
2. Relevant Facts
3. Data and Methodology
4. Conclusions
2
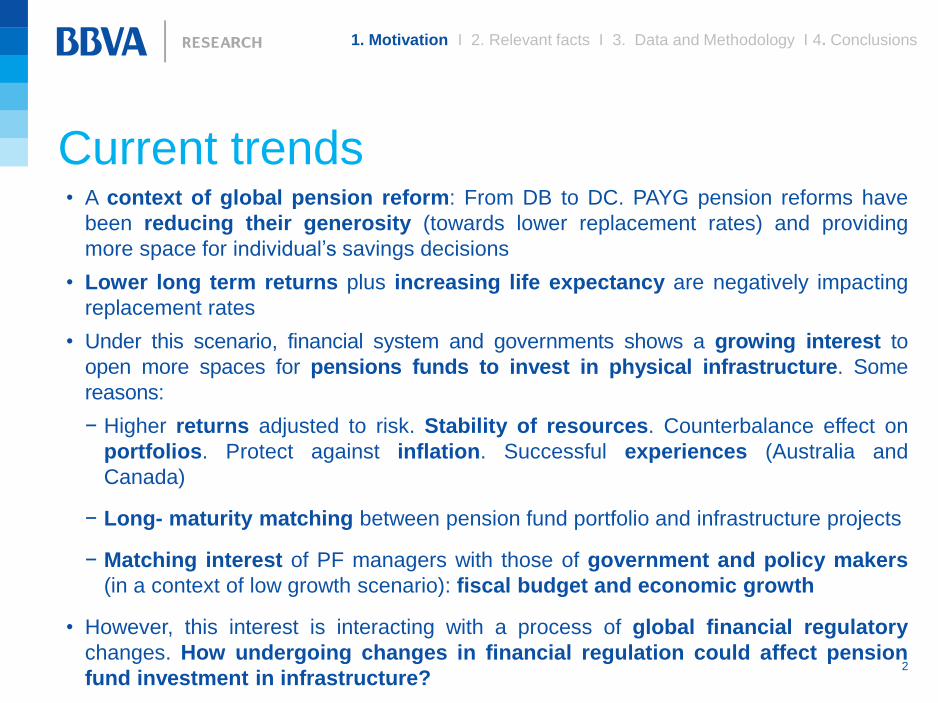
• A context of global pension reform: From DB to DC. PAYG pension reforms have
been reducing their generosity (towards lower replacement rates) and providing
more space for individual’s savings decisions
• Lower long term returns plus increasing life expectancy are negatively impacting
replacement rates
• Under this scenario, financial system and governments shows a growing interest to
open more spaces for pensions funds to invest in physical infrastructure. Some
reasons:
− Higher returns adjusted to risk. Stability of resources. Counterbalance effect on
portfolios. Protect against inflation. Successful experiences (Australia and
Canada)
− Long- maturity matching between pension fund portfolio and infrastructure projects
− Matching interest of PF managers with those of government and policy makers
(in a context of low growth scenario): fiscal budget and economic growth
• However, this interest is interacting with a process of global financial regulatory
changes. How undergoing changes in financial regulation could affect pension
fund investment in infrastructure?
Current trends
1. Motivation I 2. Relevant facts I 3. Data and Methodology I 4. Conclusions
3
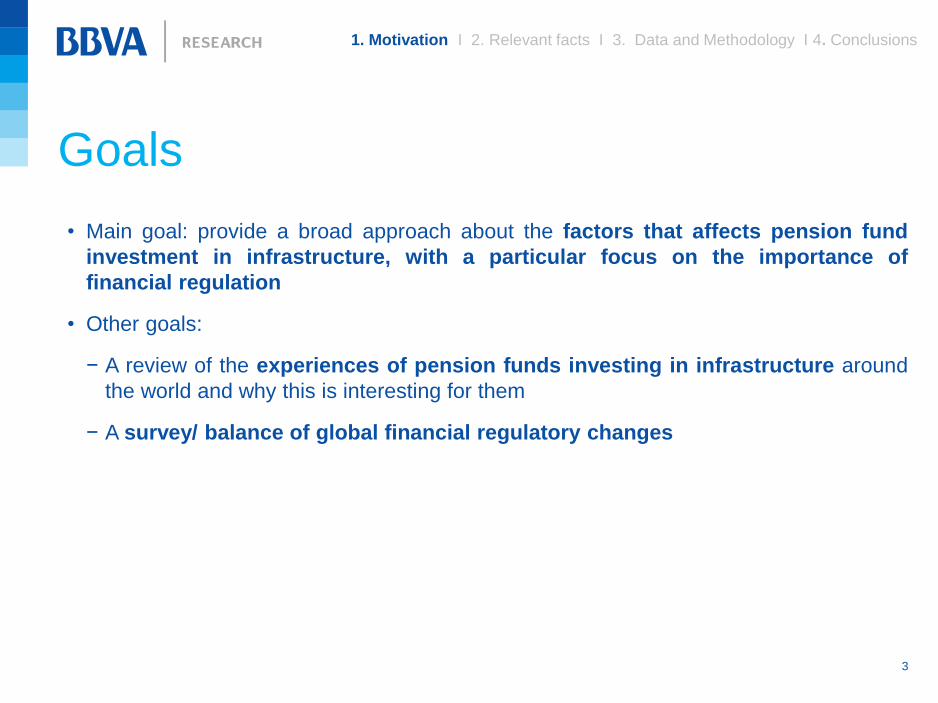
• Main goal: provide a broad approach about the factors that affects pension fund
investment in infrastructure, with a particular focus on the importance of
financial regulation
• Other goals:
− A review of the experiences of pension funds investing in infrastructure around
the world and why this is interesting for them
− A survey/ balance of global financial regulatory changes
Goals
1. Motivation I 2. Relevant facts I 3. Data and Methodology I 4. Conclusions
4
Global financial regulation and
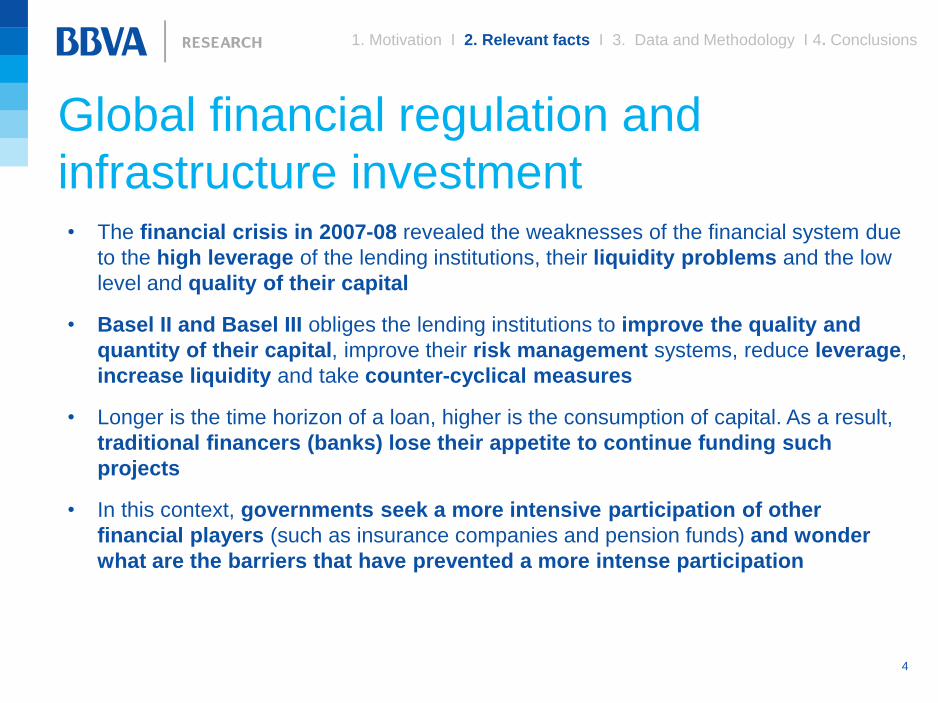
infrastructure investment • The financial crisis in 2007-08 revealed the weaknesses of the financial system due
to the high leverage of the lending institutions, their liquidity problems and the low
level and quality of their capital
• Basel II and Basel III obliges the lending institutions to improve the quality and
quantity of their capital, improve their risk management systems, reduce leverage,
increase liquidity and take counter-cyclical measures
• Longer is the time horizon of a loan, higher is the consumption of capital. As a result,
traditional financers (banks) lose their appetite to continue funding such
projects
• In this context, governments seek a more intensive participation of other
financial players (such as insurance companies and pension funds) and wonder
what are the barriers that have prevented a more intense participation
1. Motivation I 2. Relevant facts I 3. Data and Methodology I 4. Conclusions
5 0 10 20 30 40
Aust-AusfundAust-Catholic
Aust-FirstsuperBrasil-Fapes
Chil- Pension Reserve FundChil-Provida
Finland-KevaSpain-Endesa
Swe- AP 4USA-Alaska PFC
USA-CalpersUSA-Calsters
USA-MERSUSA-NYC Combined Retirement Service
Aust-HosplusJapan-Pension Fund Association
RSA-Gov EmployeesSpain-Fonditel
Chil-HabitatFinland-Ilmarien
Mex-AFORE XXI BanorteNed-PMTCol-AFP
Aust-HestaDen-PFA
Ned-PGGMSwe- AP Fonden
Bras-Pension FundsChil-AFP
Can-Caisse de DepoSwe- AP 3Ned- ABP
Portugal-CGD Staff's Pension FundMex-Banamex
Aust-State SuperNew Zealand-Superannuation Fund
Ned- PFZWIsrael-Menora-Mitvachim
Aust-TelstraPortugal-BPI Pension Fund
Aust-First State SAPer-AFPAust-QIC
Can-Quebec Pension PlanAust-UnisuperTurkey -Oyak
UK-USSAust-Health Super
Mex-AFOREAust-Sun Super
Aust-VICCan-CPPIB
Aust-CareCan-CPP Alberta
Can-CPPCan-PSP
Aust-Q SuperAust-AusGov Superfund
Brasil-FuncefBrasil-PreviAust-FutureCan-OTTP
Aust-MilitaryAust-Australian Super
Argentina-Sustainability Guarantee FundAust-Retail Employees
Aust-RewardAust-Cbus
Can-OMERSAust-BUSS (Q)
Aust-West SchemAust-MTAA
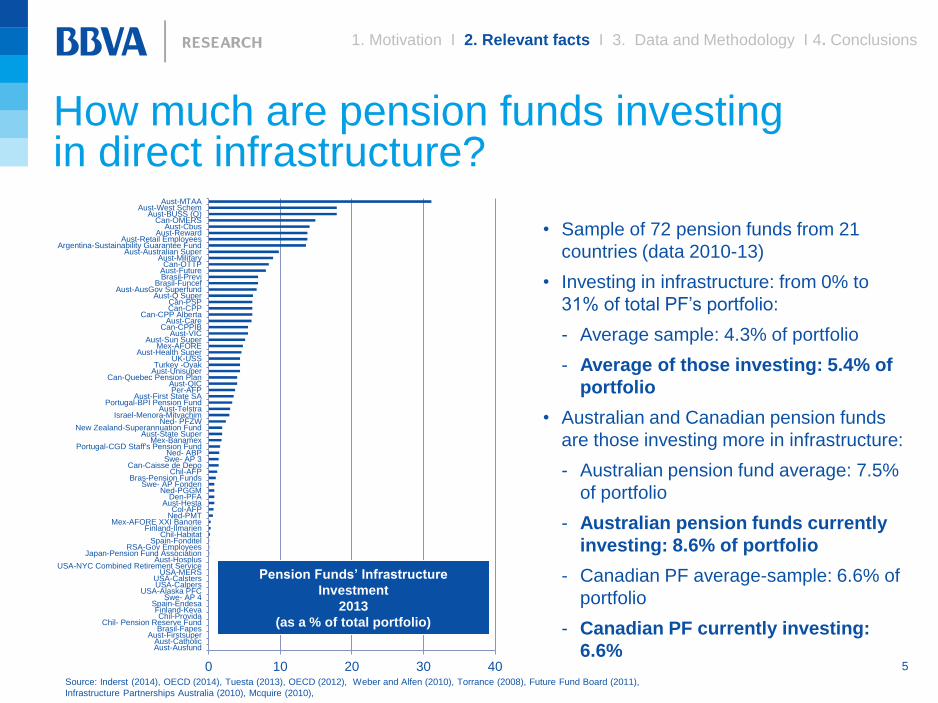
How much are pension funds investing in direct infrastructure?
Pension Funds’ Infrastructure
Investment
2013
(as a % of total portfolio)
Source: Inderst (2014), OECD (2014), Tuesta (2013), OECD (2012), Weber and Alfen (2010), Torrance (2008), Future Fund Board (2011),
Infrastructure Partnerships Australia (2010), Mcquire (2010),
• Sample of 72 pension funds from 21
countries (data 2010-13)
• Investing in infrastructure: from 0% to
31% of total PF’s portfolio:
- Average sample: 4.3% of portfolio
- Average of those investing: 5.4% of
portfolio
• Australian and Canadian pension funds
are those investing more in infrastructure:
- Australian pension fund average: 7.5%
of portfolio
- Australian pension funds currently
investing: 8.6% of portfolio
- Canadian PF average-sample: 6.6% of
portfolio
- Canadian PF currently investing:
6.6%
1. Motivation I 2. Relevant facts I 3. Data and Methodology I 4. Conclusions
6
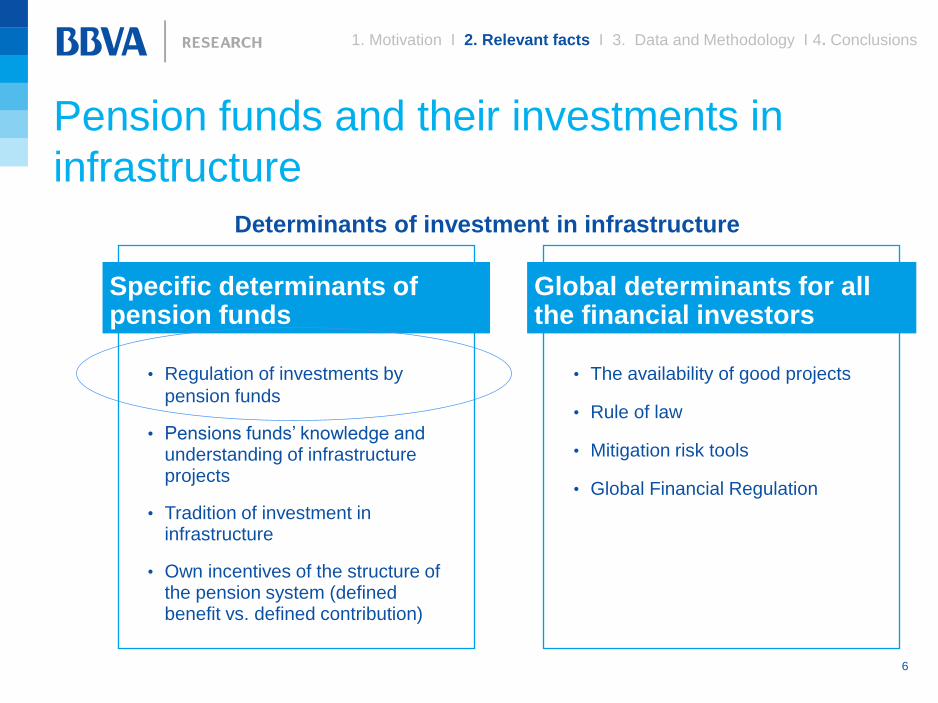
Pension funds and their investments in
infrastructure
Determinants of investment in infrastructure
1. Motivation I 2. Relevant facts I 3. Data and Methodology I 4. Conclusions
Specific determinants of pension funds
• Regulation of investments by
pension funds
• Pensions funds’ knowledge and understanding of infrastructure projects
• Tradition of investment in infrastructure
• Own incentives of the structure of the pension system (defined benefit vs. defined contribution)
• The availability of good projects
• Rule of law
• Mitigation risk tools
• Global Financial Regulation
Global determinants for all the financial investors
7
1. Motivation I 2. Relevant facts I 3. Data and Methodology I 4. Conclusions
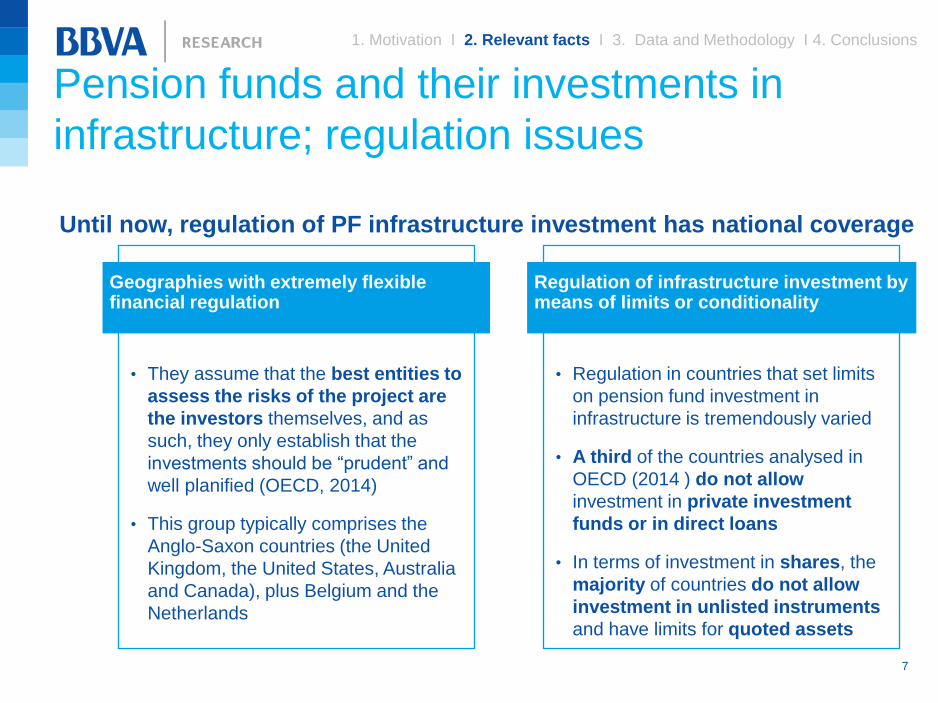
Pension funds and their investments in
infrastructure; regulation issues
Until now, regulation of PF infrastructure investment has national coverage
Geographies with extremely flexible financial regulation
• They assume that the best entities to
assess the risks of the project are
the investors themselves, and as
such, they only establish that the
investments should be “prudent” and
well planified (OECD, 2014)
• This group typically comprises the
Anglo-Saxon countries (the United
Kingdom, the United States, Australia
and Canada), plus Belgium and the
Netherlands
• Regulation in countries that set limits
on pension fund investment in
infrastructure is tremendously varied
• A third of the countries analysed in
OECD (2014 ) do not allow
investment in private investment
funds or in direct loans
• In terms of investment in shares, the
majority of countries do not allow
investment in unlisted instruments
and have limits for quoted assets
Regulation of infrastructure investment by means of limits or conditionality
8
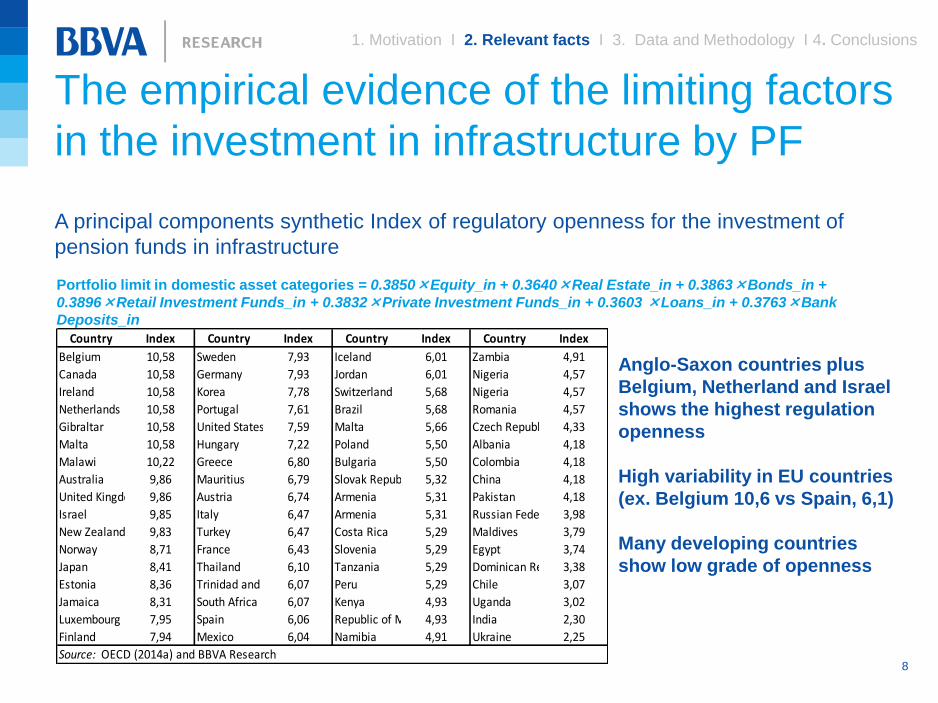
The empirical evidence of the limiting factors
in the investment in infrastructure by PF
A principal components synthetic Index of regulatory openness for the investment of
pension funds in infrastructure
Portfolio limit in domestic asset categories = 0.3850×Equity_in + 0.3640×Real Estate_in + 0.3863×Bonds_in +
0.3896×Retail Investment Funds_in + 0.3832×Private Investment Funds_in + 0.3603 ×Loans_in + 0.3763×Bank
Deposits_in
Country Index Country Index Country Index Country Index
Belgium 10,58 Sweden 7,93 Iceland 6,01 Zambia 4,91
Canada 10,58 Germany 7,93 Jordan 6,01 Nigeria 4,57
Ireland 10,58 Korea 7,78 Switzerland 5,68 Nigeria 4,57
Netherlands 10,58 Portugal 7,61 Brazil 5,68 Romania 4,57
Gibraltar 10,58 United States 7,59 Malta 5,66 Czech Republic 4,33
Malta 10,58 Hungary 7,22 Poland 5,50 Albania 4,18
Malawi 10,22 Greece 6,80 Bulgaria 5,50 Colombia 4,18
Australia 9,86 Mauritius 6,79 Slovak Republic 5,32 China 4,18
United Kingdom 9,86 Austria 6,74 Armenia 5,31 Pakistan 4,18
Israel 9,85 Italy 6,47 Armenia 5,31 Russian Federation 3,98
New Zealand 9,83 Turkey 6,47 Costa Rica 5,29 Maldives 3,79
Norway 8,71 France 6,43 Slovenia 5,29 Egypt 3,74
Japan 8,41 Thailand 6,10 Tanzania 5,29 Dominican Republic3,38
Estonia 8,36 Trinidad and Tobago6,07 Peru 5,29 Chile 3,07
Jamaica 8,31 South Africa 6,07 Kenya 4,93 Uganda 3,02
Luxembourg 7,95 Spain 6,06 Republic of Macedonia4,93 India 2,30
Finland 7,94 Mexico 6,04 Namibia 4,91 Ukraine 2,25
Source: OECD (2014a) and BBVA Research
Anglo-Saxon countries plus
Belgium, Netherland and Israel
shows the highest regulation
openness
High variability in EU countries
(ex. Belgium 10,6 vs Spain, 6,1)
Many developing countries
show low grade of openness
1. Motivation I 2. Relevant facts I 3. Data and Methodology I 4. Conclusions
9
Some comprehensive initiatives: the case of
the European Union
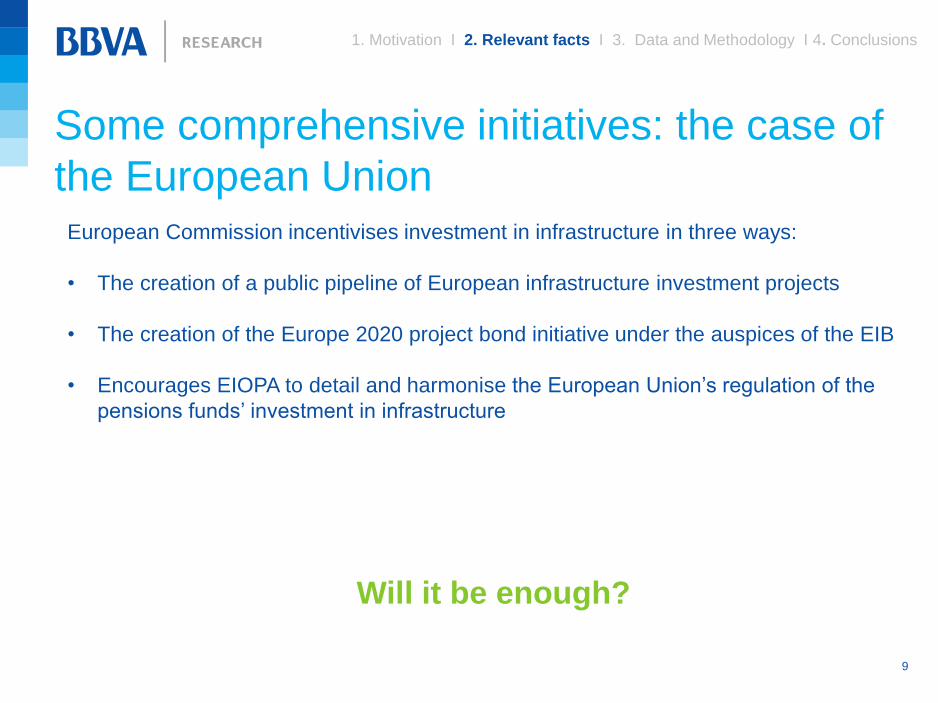
European Commission incentivises investment in infrastructure in three ways:
• The creation of a public pipeline of European infrastructure investment projects
• The creation of the Europe 2020 project bond initiative under the auspices of the EIB
• Encourages EIOPA to detail and harmonise the European Union’s regulation of the
pensions funds’ investment in infrastructure
Will it be enough?
1. Motivation I 2. Relevant facts I 3. Data and Methodology I 4. Conclusions
10
Data
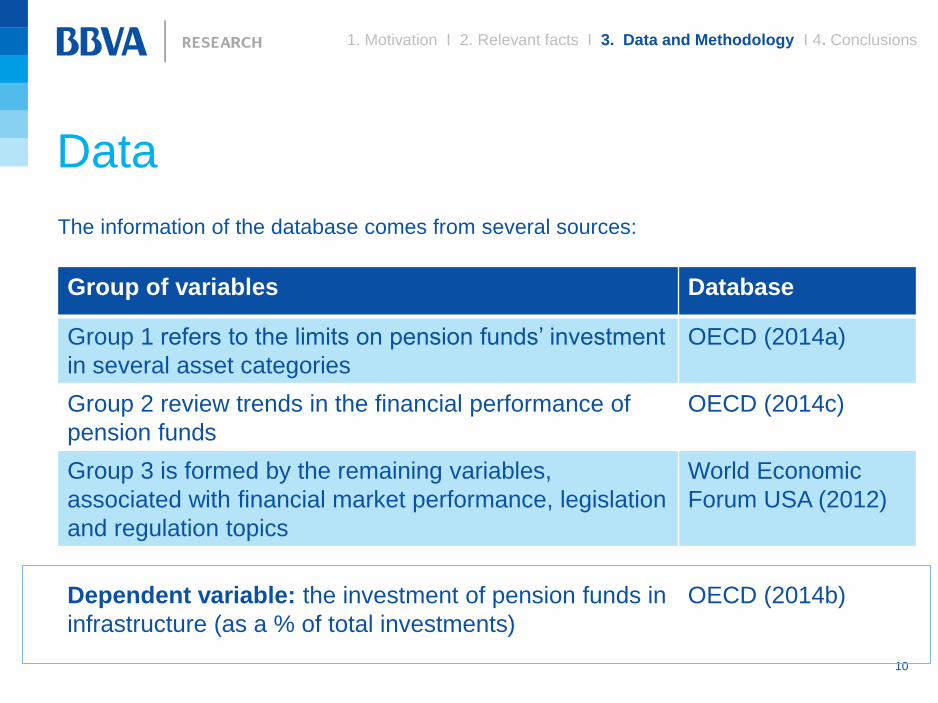
The information of the database comes from several sources:
Group of variables Database
Group 1 refers to the limits on pension funds’ investment
in several asset categories
OECD (2014a)
Group 2 review trends in the financial performance of
pension funds
OECD (2014c)
Group 3 is formed by the remaining variables,
associated with financial market performance, legislation
and regulation topics
World Economic
Forum USA (2012)
Dependent variable: the investment of pension funds in
infrastructure (as a % of total investments)
OECD (2014b)
1. Motivation I 2. Relevant facts I 3. Data and Methodology I 4. Conclusions
11
Econometric strategy: the Tobit model
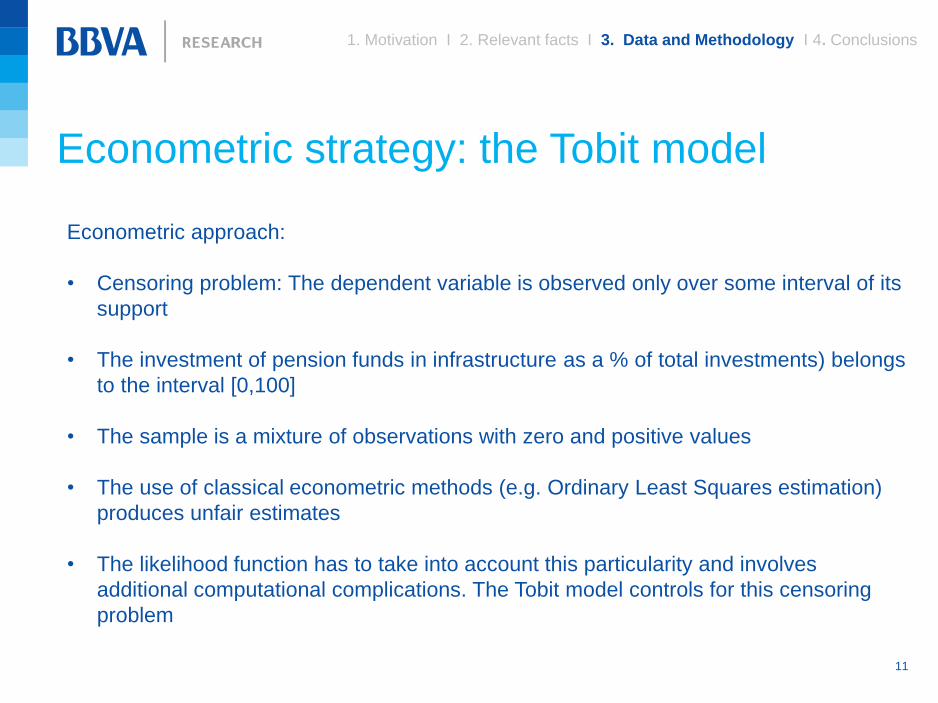
Econometric approach:
• Censoring problem: The dependent variable is observed only over some interval of its
support
• The investment of pension funds in infrastructure as a % of total investments) belongs
to the interval [0,100]
• The sample is a mixture of observations with zero and positive values
• The use of classical econometric methods (e.g. Ordinary Least Squares estimation)
produces unfair estimates
• The likelihood function has to take into account this particularity and involves
additional computational complications. The Tobit model controls for this censoring
problem
1. Motivation I 2. Relevant facts I 3. Data and Methodology I 4. Conclusions
12
The empirical evidence of the limiting factors in the
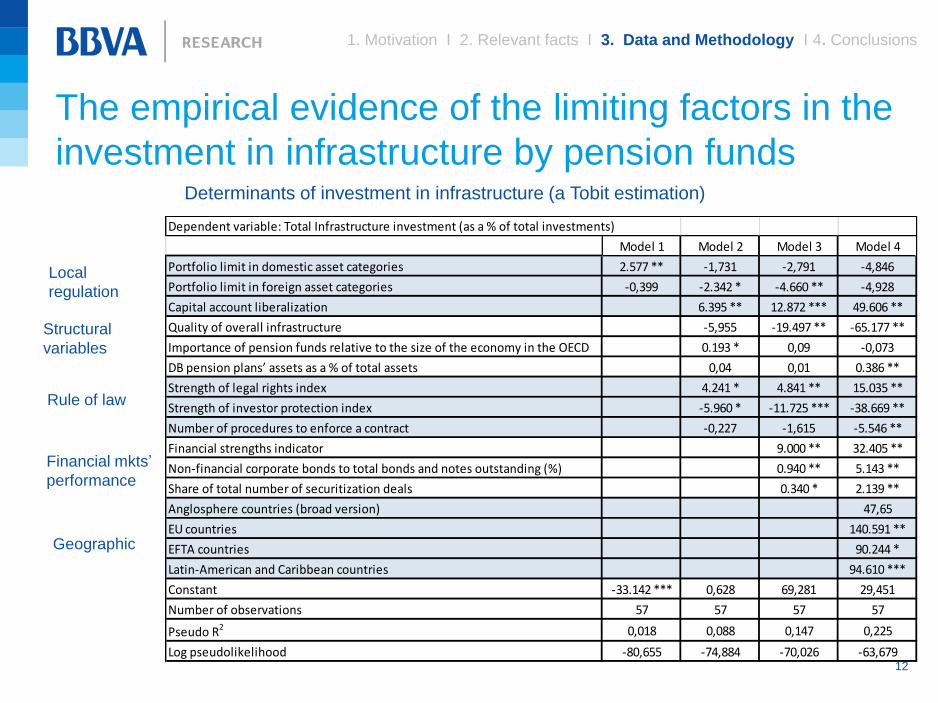
investment in infrastructure by pension funds Determinants of investment in infrastructure (a Tobit estimation)
Local
regulation
Structural
variables
Rule of law
Financial mkts’
performance
Geographic
1. Motivation I 2. Relevant facts I 3. Data and Methodology I 4. Conclusions
Dependent variable: Total Infrastructure investment (as a % of total investments)
Model 1 Model 2 Model 3 Model 4
Portfolio limit in domestic asset categories 2.577 ** -1,731 -2,791 -4,846
Portfolio limit in foreign asset categories -0,399 -2.342 * -4.660 ** -4,928
Capital account liberalization 6.395 ** 12.872 *** 49.606 **
Quality of overall infrastructure -5,955 -19.497 ** -65.177 **
Importance of pension funds relative to the size of the economy in the OECD 0.193 * 0,09 -0,073
DB pension plans’ assets as a % of total assets 0,04 0,01 0.386 **
Strength of legal rights index 4.241 * 4.841 ** 15.035 **
Strength of investor protection index -5.960 * -11.725 *** -38.669 **
Number of procedures to enforce a contract -0,227 -1,615 -5.546 **
Financial strengths indicator 9.000 ** 32.405 **
Non-financial corporate bonds to total bonds and notes outstanding (%) 0.940 ** 5.143 **
Share of total number of securitization deals 0.340 * 2.139 **
Anglosphere countries (broad version) 47,65
EU countries 140.591 **
EFTA countries 90.244 *
Latin-American and Caribbean countries 94.610 ***
Constant -33.142 *** 0,628 69,281 29,451
Number of observations 57 57 57 57
Pseudo R2 0,018 0,088 0,147 0,225
Log pseudolikelihood -80,655 -74,884 -70,026 -63,679
13
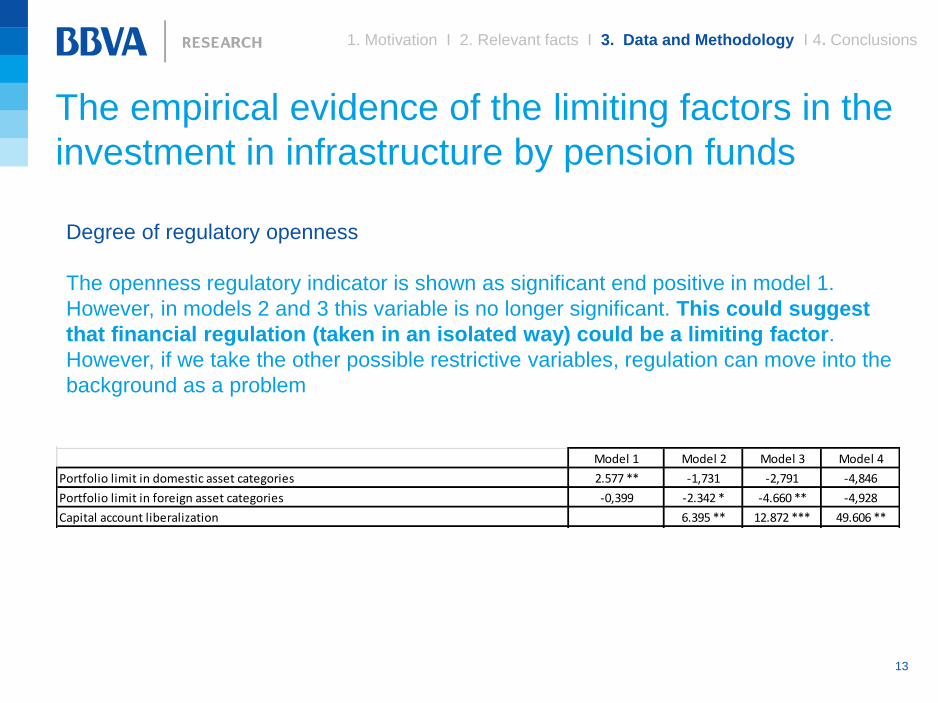
Degree of regulatory openness
The openness regulatory indicator is shown as significant end positive in model 1.
However, in models 2 and 3 this variable is no longer significant. This could suggest
that financial regulation (taken in an isolated way) could be a limiting factor.
However, if we take the other possible restrictive variables, regulation can move into the
background as a problem
Dependent variable: Total Infrastructure investment (as a % of total investments)
Model 1 Model 2 Model 3 Model 4
Portfolio limit in domestic asset categories 2.577 ** -1,731 -2,791 -4,846
Portfolio limit in foreign asset categories -0,399 -2.342 * -4.660 ** -4,928
Capital account liberalization 6.395 ** 12.872 *** 49.606 **
Quality of overall infrastructure -5,955 -19.497 ** -65.177 **
Importance of pension funds relative to the size of the economy in the OECD 0.193 * 0,09 -0,073
DB pension plans’ assets as a % of total assets 0,04 0,01 0.386 **
Strength of legal rights index 4.241 * 4.841 ** 15.035 **
Strength of investor protection index -5.960 * -11.725 *** -38.669 **
Number of procedures to enforce a contract -0,227 -1,615 -5.546 **
Financial strengths indicator 9.000 ** 32.405 **
Non-financial corporate bonds to total bonds and notes outstanding (%) 0.940 ** 5.143 **
Share of total number of securitization deals 0.340 * 2.139 **
Anglosphere countries (broad version) 47,65
EU countries 140.591 **
EFTA countries 90.244 *
Latin-American and Caribbean countries 94.610 ***
Constant -33.142 *** 0,628 69,281 29,451
Number of observations 57 57 57 57
Pseudo R2 0,018 0,088 0,147 0,225
Log pseudolikelihood -80,655 -74,884 -70,026 -63,679
Notes : ***, **, * denote estimates significant to 1%, 5% and 10% respectively.
Source : OECD (2014a, 2014b, 2014c) and World Economic Forum USA Inc. And BBVA Research
1. Motivation I 2. Relevant facts I 3. Data and Methodology I 4. Conclusions
The empirical evidence of the limiting factors in the
investment in infrastructure by pension funds
14
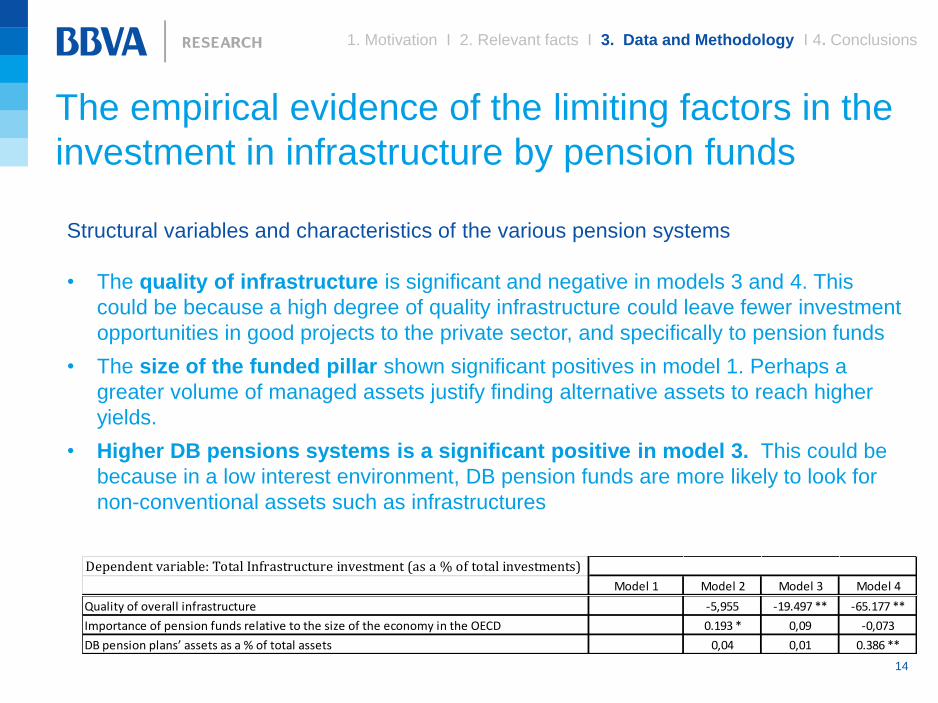
Structural variables and characteristics of the various pension systems
• The quality of infrastructure is significant and negative in models 3 and 4. This
could be because a high degree of quality infrastructure could leave fewer investment
opportunities in good projects to the private sector, and specifically to pension funds
• The size of the funded pillar shown significant positives in model 1. Perhaps a
greater volume of managed assets justify finding alternative assets to reach higher
yields.
• Higher DB pensions systems is a significant positive in model 3. This could be
because in a low interest environment, DB pension funds are more likely to look for
non-conventional assets such as infrastructures
Dependent variable: Total Infrastructure investment (as a % of total investments)
Model 1 Model 2 Model 3 Model 4
Portfolio limit in domestic asset categories 2.577 ** -1,731 -2,791 -4,846
Portfolio limit in foreign asset categories -0,399 -2.342 * -4.660 ** -4,928
Capital account liberalization 6.395 ** 12.872 *** 49.606 **
Quality of overall infrastructure -5,955 -19.497 ** -65.177 **
Importance of pension funds relative to the size of the economy in the OECD 0.193 * 0,09 -0,073
DB pension plans’ assets as a % of total assets 0,04 0,01 0.386 **
Strength of legal rights index 4.241 * 4.841 ** 15.035 **
Strength of investor protection index -5.960 * -11.725 *** -38.669 **
Number of procedures to enforce a contract -0,227 -1,615 -5.546 **
Financial strengths indicator 9.000 ** 32.405 **
Non-financial corporate bonds to total bonds and notes outstanding (%) 0.940 ** 5.143 **
Share of total number of securitization deals 0.340 * 2.139 **
Anglosphere countries (broad version) 47,65
EU countries 140.591 **
EFTA countries 90.244 *
Latin-American and Caribbean countries 94.610 ***
Constant -33.142 *** 0,628 69,281 29,451
Number of observations 57 57 57 57
Pseudo R2 0,018 0,088 0,147 0,225
Log pseudolikelihood -80,655 -74,884 -70,026 -63,679
Notes : ***, **, * denote estimates significant to 1%, 5% and 10% respectively.
Source : OECD (2014a, 2014b, 2014c) and World Economic Forum USA Inc. And BBVA Research
1. Motivation I 2. Relevant facts I 3. Data and Methodology I 4. Conclusions
The empirical evidence of the limiting factors in the
investment in infrastructure by pension funds
15
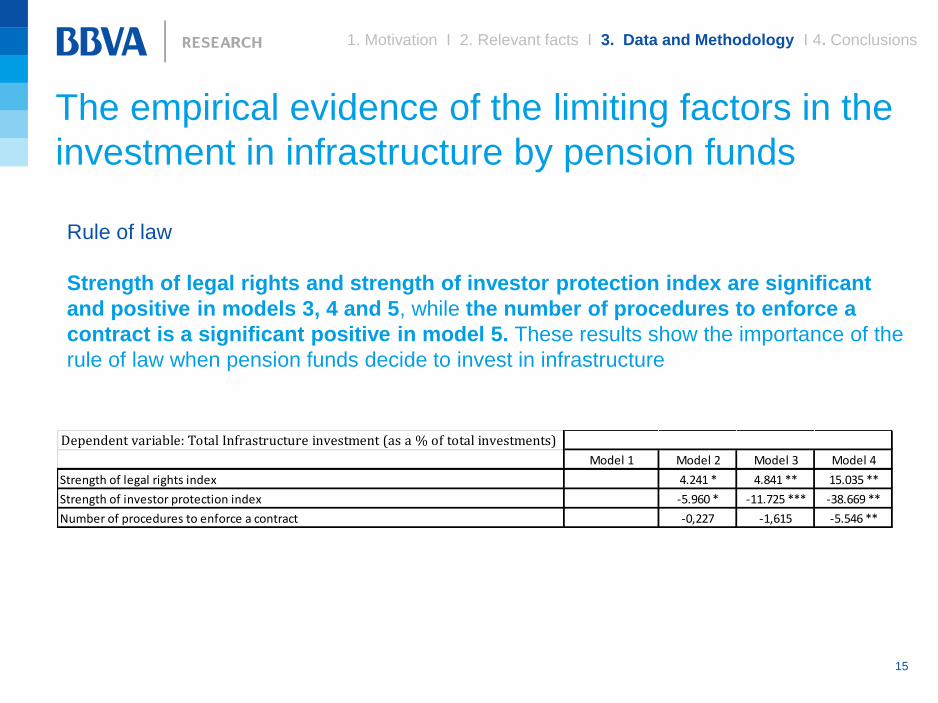
Rule of law
Strength of legal rights and strength of investor protection index are significant
and positive in models 3, 4 and 5, while the number of procedures to enforce a
contract is a significant positive in model 5. These results show the importance of the
rule of law when pension funds decide to invest in infrastructure
Dependent variable: Total Infrastructure investment (as a % of total investments)
Model 1 Model 2 Model 3 Model 4
Portfolio limit in domestic asset categories 2.577 ** -1,731 -2,791 -4,846
Portfolio limit in foreign asset categories -0,399 -2.342 * -4.660 ** -4,928
Capital account liberalization 6.395 ** 12.872 *** 49.606 **
Quality of overall infrastructure -5,955 -19.497 ** -65.177 **
Importance of pension funds relative to the size of the economy in the OECD 0.193 * 0,09 -0,073
DB pension plans’ assets as a % of total assets 0,04 0,01 0.386 **
Strength of legal rights index 4.241 * 4.841 ** 15.035 **
Strength of investor protection index -5.960 * -11.725 *** -38.669 **
Number of procedures to enforce a contract -0,227 -1,615 -5.546 **
Financial strengths indicator 9.000 ** 32.405 **
Non-financial corporate bonds to total bonds and notes outstanding (%) 0.940 ** 5.143 **
Share of total number of securitization deals 0.340 * 2.139 **
Anglosphere countries (broad version) 47,65
EU countries 140.591 **
EFTA countries 90.244 *
Latin-American and Caribbean countries 94.610 ***
Constant -33.142 *** 0,628 69,281 29,451
Number of observations 57 57 57 57
Pseudo R2 0,018 0,088 0,147 0,225
Log pseudolikelihood -80,655 -74,884 -70,026 -63,679
Notes : ***, **, * denote estimates significant to 1%, 5% and 10% respectively.
Source : OECD (2014a, 2014b, 2014c) and World Economic Forum USA Inc. And BBVA Research
1. Motivation I 2. Relevant facts I 3. Data and Methodology I 4. Conclusions
The empirical evidence of the limiting factors in the
investment in infrastructure by pension funds
16
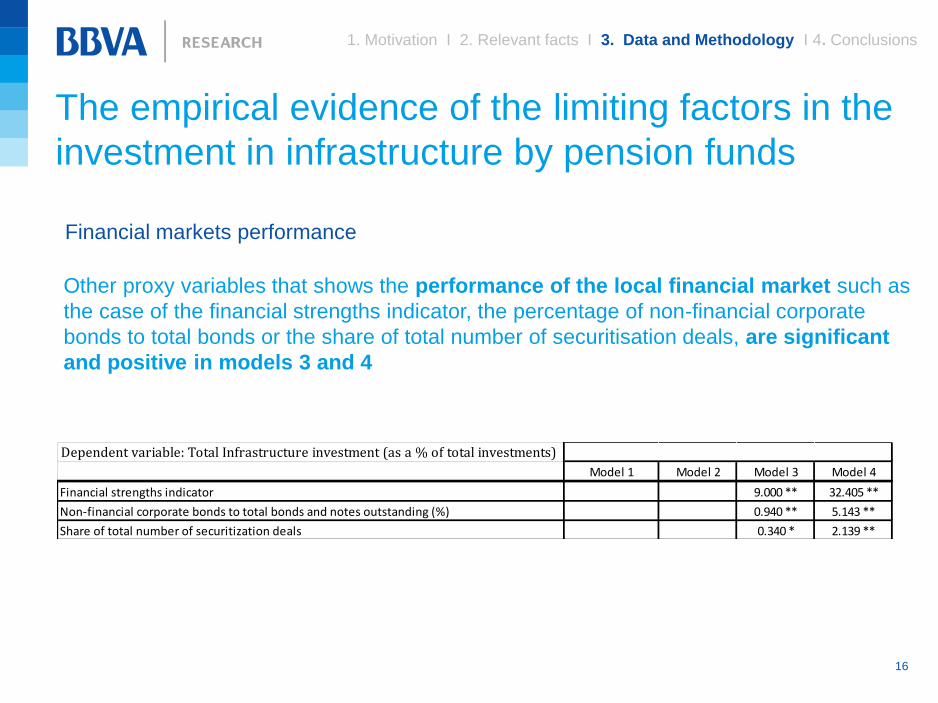
Financial markets performance
Dependent variable: Total Infrastructure investment (as a % of total investments)
Model 1 Model 2 Model 3 Model 4
Portfolio limit in domestic asset categories 2.577 ** -1,731 -2,791 -4,846
Portfolio limit in foreign asset categories -0,399 -2.342 * -4.660 ** -4,928
Capital account liberalization 6.395 ** 12.872 *** 49.606 **
Quality of overall infrastructure -5,955 -19.497 ** -65.177 **
Importance of pension funds relative to the size of the economy in the OECD 0.193 * 0,09 -0,073
DB pension plans’ assets as a % of total assets 0,04 0,01 0.386 **
Strength of legal rights index 4.241 * 4.841 ** 15.035 **
Strength of investor protection index -5.960 * -11.725 *** -38.669 **
Number of procedures to enforce a contract -0,227 -1,615 -5.546 **
Financial strengths indicator 9.000 ** 32.405 **
Non-financial corporate bonds to total bonds and notes outstanding (%) 0.940 ** 5.143 **
Share of total number of securitization deals 0.340 * 2.139 **
Anglosphere countries (broad version) 47,65
EU countries 140.591 **
EFTA countries 90.244 *
Latin-American and Caribbean countries 94.610 ***
Constant -33.142 *** 0,628 69,281 29,451
Number of observations 57 57 57 57
Pseudo R2 0,018 0,088 0,147 0,225
Log pseudolikelihood -80,655 -74,884 -70,026 -63,679
Notes : ***, **, * denote estimates significant to 1%, 5% and 10% respectively.
Source : OECD (2014a, 2014b, 2014c) and World Economic Forum USA Inc. And BBVA Research
Other proxy variables that shows the performance of the local financial market such as
the case of the financial strengths indicator, the percentage of non-financial corporate
bonds to total bonds or the share of total number of securitisation deals, are significant
and positive in models 3 and 4
1. Motivation I 2. Relevant facts I 3. Data and Methodology I 4. Conclusions
The empirical evidence of the limiting factors in the
investment in infrastructure by pension funds
17
Geographic
Dependent variable: Total Infrastructure investment (as a % of total investments)
Model 1 Model 2 Model 3 Model 4
Portfolio limit in domestic asset categories 2.577 ** -1,731 -2,791 -4,846
Portfolio limit in foreign asset categories -0,399 -2.342 * -4.660 ** -4,928
Capital account liberalization 6.395 ** 12.872 *** 49.606 **
Quality of overall infrastructure -5,955 -19.497 ** -65.177 **
Importance of pension funds relative to the size of the economy in the OECD 0.193 * 0,09 -0,073
DB pension plans’ assets as a % of total assets 0,04 0,01 0.386 **
Strength of legal rights index 4.241 * 4.841 ** 15.035 **
Strength of investor protection index -5.960 * -11.725 *** -38.669 **
Number of procedures to enforce a contract -0,227 -1,615 -5.546 **
Financial strengths indicator 9.000 ** 32.405 **
Non-financial corporate bonds to total bonds and notes outstanding (%) 0.940 ** 5.143 **
Share of total number of securitization deals 0.340 * 2.139 **
Anglosphere countries (broad version) 47,65
EU countries 140.591 **
EFTA countries 90.244 *
Latin-American and Caribbean countries 94.610 ***
Constant -33.142 *** 0,628 69,281 29,451
Number of observations 57 57 57 57
Pseudo R2 0,018 0,088 0,147 0,225
Log pseudolikelihood -80,655 -74,884 -70,026 -63,679
Notes : ***, **, * denote estimates significant to 1%, 5% and 10% respectively.
Source : OECD (2014a, 2014b, 2014c) and World Economic Forum USA Inc. And BBVA Research
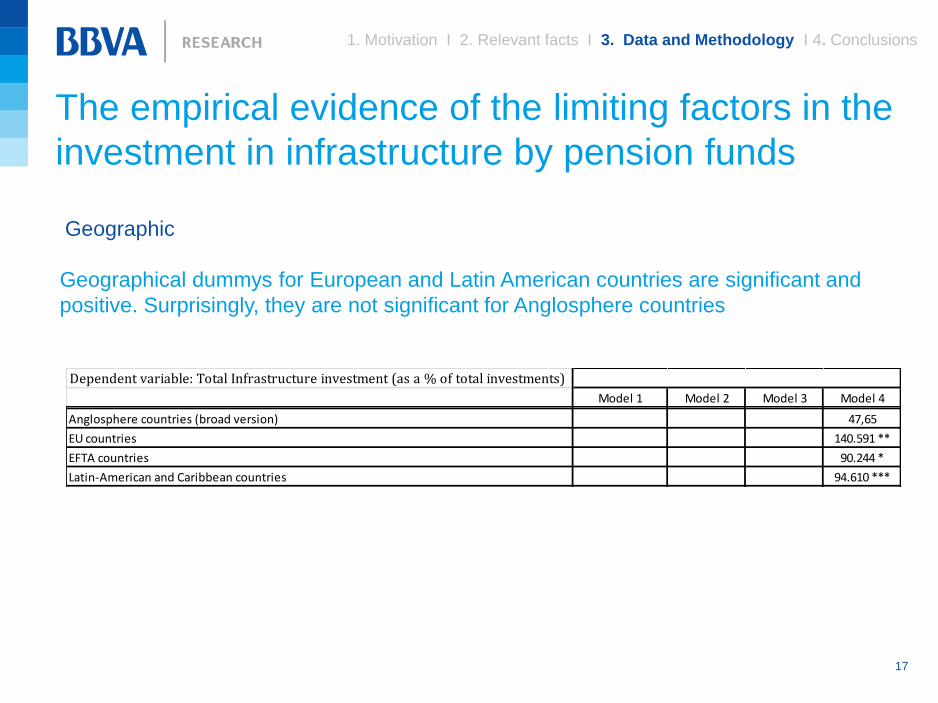
Geographical dummys for European and Latin American countries are significant and
positive. Surprisingly, they are not significant for Anglosphere countries
The empirical evidence of the limiting factors in the
investment in infrastructure by pension funds
1. Motivation I 2. Relevant facts I 3. Data and Methodology I 4. Conclusions
18
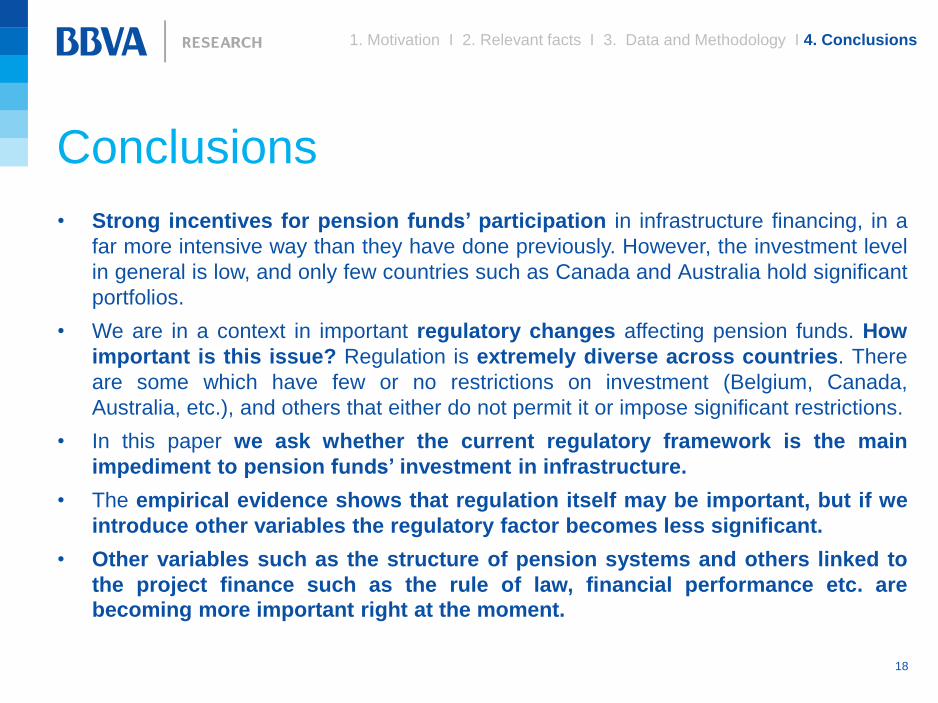
• Strong incentives for pension funds’ participation in infrastructure financing, in a
far more intensive way than they have done previously. However, the investment level
in general is low, and only few countries such as Canada and Australia hold significant
portfolios.
• We are in a context in important regulatory changes affecting pension funds. How
important is this issue? Regulation is extremely diverse across countries. There
are some which have few or no restrictions on investment (Belgium, Canada,
Australia, etc.), and others that either do not permit it or impose significant restrictions.
• In this paper we ask whether the current regulatory framework is the main
impediment to pension funds’ investment in infrastructure.
• The empirical evidence shows that regulation itself may be important, but if we
introduce other variables the regulatory factor becomes less significant.
• Other variables such as the structure of pension systems and others linked to
the project finance such as the rule of law, financial performance etc. are
becoming more important right at the moment.
Conclusions
1. Motivation I 2. Relevant facts I 3. Data and Methodology I 4. Conclusions
The Wharton School. University of Pennsylvania
April 29/30, 2015
Factors that impact on pension fund
investments in infrastructure under
the current global financial regulation
Implications of the New Regulatory Order for Retirement System Risk Management
Javier Alonso, Alfonso Arellano and David Tuesta
20
Econometric strategy: the Tobit model
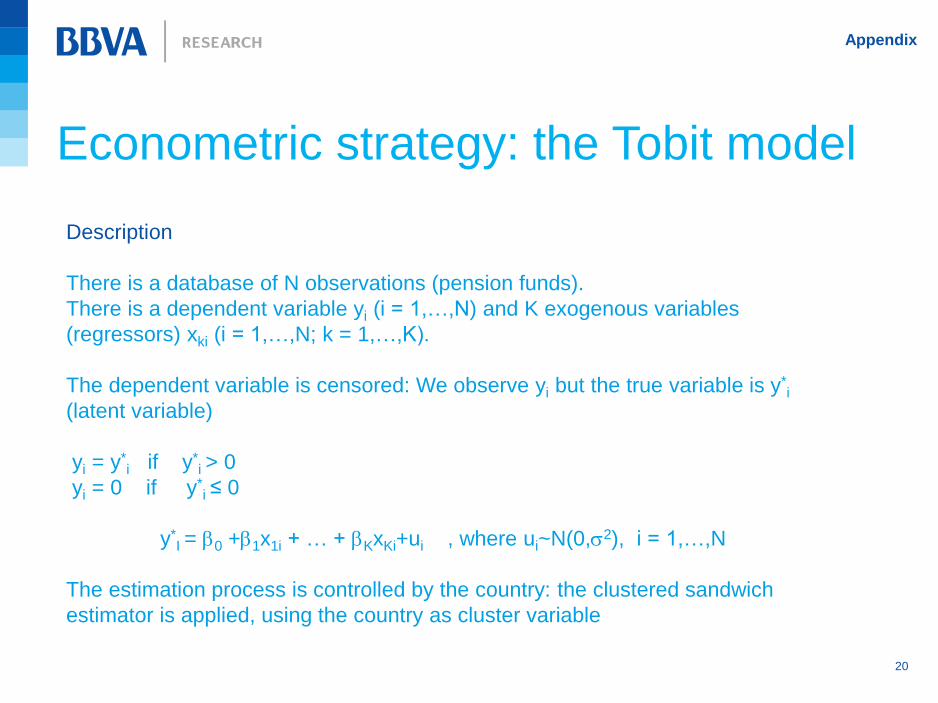
Description
There is a database of N observations (pension funds).
There is a dependent variable yi (i = 1,…,N) and K exogenous variables
(regressors) xki (i = 1,…,N; k = 1,…,K).
The dependent variable is censored: We observe yi but the true variable is y*i
(latent variable)
yi = y*i if y
*i > 0
yi = 0 if y*i ≤ 0
y*I = b0 +b1x1i + … + bKxKi+ui , where ui~N(0,s2), i = 1,…,N
The estimation process is controlled by the country: the clustered sandwich
estimator is applied, using the country as cluster variable
Appendix
21
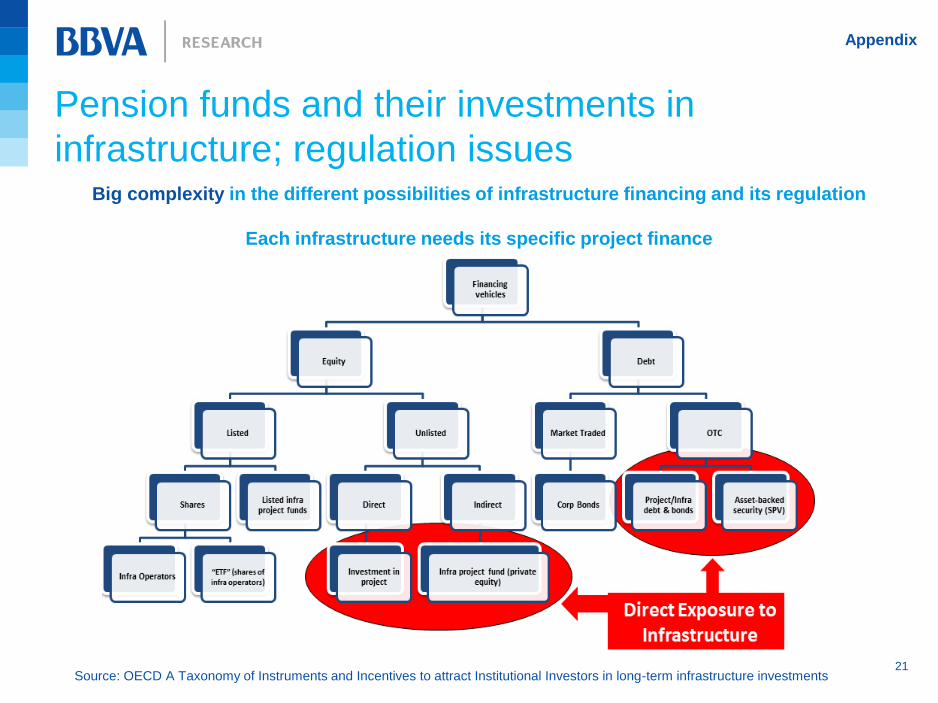
Pension funds and their investments in
infrastructure; regulation issues
Big complexity in the different possibilities of infrastructure financing and its regulation
Each infrastructure needs its specific project finance
Source: OECD A Taxonomy of Instruments and Incentives to attract Institutional Investors in long-term infrastructure investments
Appendix
22
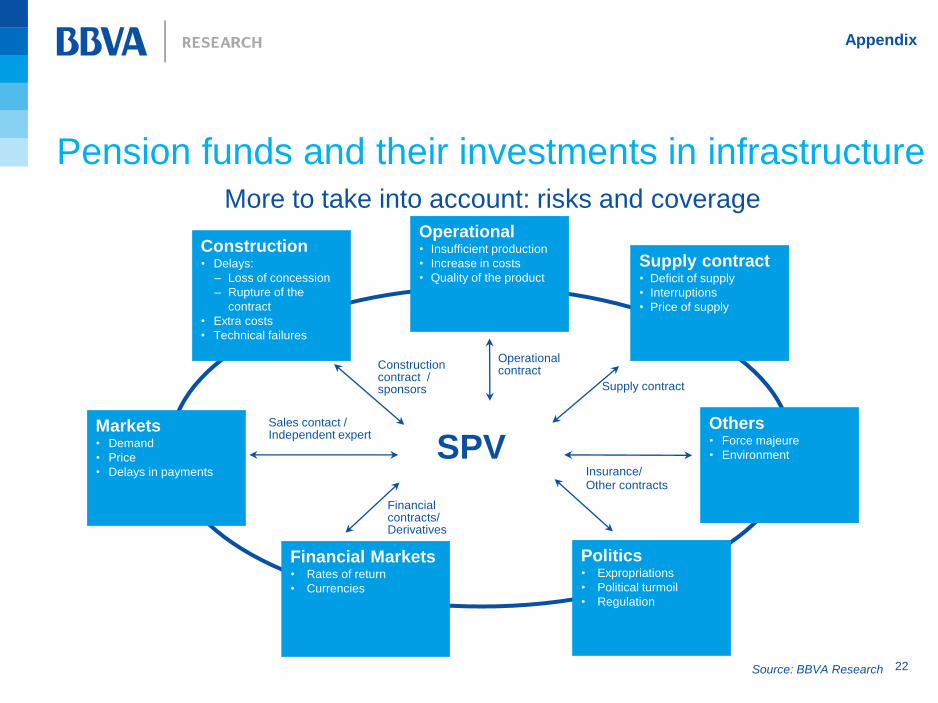
More to take into account: risks and coverage
SPV
Operational • Insufficient production
• Increase in costs
• Quality of the product
Supply contract • Deficit of supply
• Interruptions
• Price of supply
Others • Force majeure
• Environment
Construction • Delays:
– Loss of concession
– Rupture of the
contract
• Extra costs
• Technical failures
Politics • Expropriations
• Political turmoil
• Regulation
Markets • Demand
• Price
• Delays in payments
Financial Markets • Rates of return
• Currencies
Construction contract / sponsors
Operational contract
Supply contract
Insurance/ Other contracts
Financial contracts/ Derivatives
Sales contact / Independent expert
Source: BBVA Research
Pension funds and their investments in infrastructure
Appendix