Embed Size (px)
Citation preview


Factors that Determine Choice of Products Market for Businesses in
the Informal Sector in Kenya
Evelyne Njuguna and Purity Mugambi
Kenya Institute for Public Policy Research and Analysis
KIPPRA Discussion Paper No. 2242019

ii
Factors that determine choice of products market for businesses in the informal sector in Kenya
KIPPRA in Brief
The Kenya Institute for Public Policy Research and Analysis (KIPPRA) is an autonomous institute whose primary mission is to conduct public policy research leading to policy advice. KIPPRA’s mission is to produce consistently high-quality analysis of key issues of public policy and to contribute to the achievement of national long-term development objectives by positively influencing the decision-making process. These goals are met through effective dissemination of recommendations resulting from analysis and by training policy analysts in the public sector. KIPPRA therefore produces a body of well-researched and documented information on public policy, and in the process assists in formulating long-term strategic perspectives. KIPPRA serves as a centralized source from which the Government and the private sector may obtain information and advice on public policy issues.
Published 2019© Kenya Institute for Public Policy Research and AnalysisBishops Garden Towers, Bishops RoadPO Box 56445-00200 Nairobi, Kenyatel: +254 20 2719933/4; fax: +254 20 2719951email: [email protected]: http://www.kippra.org
ISBN 9966 817 27 3
The Discussion Paper Series disseminates results and reflections from ongoing research activities of the Institute’s programmes. The papers are internally refereed and are disseminated to inform and invoke debate on policy issues. Opinions expressed in the papers are entirely those of the authors and do not necessarily reflect the views of the Institute.
This paper is produced under the KIPPRA Young Professionals (YPs) programme. The programme targets young scholars from the public and private sector, who undertake an intensive one-year course on public policy research and analysis, and during which they write a research paper on a selected public policy issue, with supervision from senior researchers at the Institute.
iii
Abstract
Choice of products market by informal businesses is a critical pathway for their survival, performance and profit maximization. Kenya’s informal businesses have an option of selling their products to individual consumers, micro-small and medium enterprises, large establishments (non-MSMEs), through direct export and to the government. Unlike businesses operating formally, informal businesses do not adopt marketing strategies such as price posting that send informative signals describing the product price and their location. Lying low is key for informal businesses as they are characterized by phenomena such as tax evasion. Therefore, there is need to determine factors that influence choice of a product market by informal businesses in Kenya. Secondary data obtained from the 2016 micro, small and medium enterprises (MSMEs) survey by KNBS was used, and multinomial logistic regression used in the estimation of the factors presumed to influence choice of a product market. The results show that business, entrepreneur and micro economic factors significantly influenced the choice of a product market among informal businesses in Kenya. It is clear there is limited business growth and tendencies to remain in the confines of informality; market places create strategic location for access to customers compared to commercial and residential premises; female-owned businesses have a limited scope and do not access wider markets, and that mobile phone is relied on as a source of market information by businesses in the informal sector. Therefore, emphasis should be placed on promotion of locally manufactured products in the government procurement processes by reducing red tape to encourage compliance to prerequisite conditions. There is need to change informal businesses mindset to that of growth and expansion through increased skills and educational capacities, and continuous training and incorporation of entrepreneurship and business-oriented lessons into the schools’ curriculum. There is need to provide market infrastructure and designate selling points within markets, improve access to market information by encouraging tapping into technology such as mobile phones through lowered tariffs, and reduce taxes imposed on data usage in the telephony industry.

iv
Factors that determine choice of products market for businesses in the informal sector in Kenya
Abbreviations and Acronyms
AGPO Access to Government Procurement Opportunities
ICT Information and Communication Technology
KNBS Kenya National Bureau of Statistics
MSEA Micro and Small Enterprises Authority
MSEs Micro and Small Enterprises
MSMEs Micro, Small and Medium Enterprises

v
Table of Contents
Abstract ...................................................................................................................iiiAbbreviations and Acronyms ................................................................................. ivList of Tables ..........................................................................................................viiList of Figures ........................................................................................................vii
1. Introduction ...................................................................................................... 1
2. Institutional/Legal and Regulatory Frameworks on Markets in Relation to the Informal Sector ...........................................................................................3
3. Literature Review .............................................................................................53.1. Theoretical Review ...........................................................................................53.1.1 Neoclassical paradigm theory .........................................................................53.1.2 Market orientation theory ..............................................................................63.1.3 Evolutionary systems change theory ..............................................................63.1.4 Relationship marketing theory ....................................................................... 73.1.5 Functional approach theory ............................................................................ 73.1.6 Transaction costs theory ................................................................................. 73.2 Empirical Review .............................................................................................8
4. Methodology ................................................................................................... 104.1 Conceptual Framework .................................................................................. 104.2 Empirical Framework ......................................................................................114.3 Data Sources ................................................................................................... 144.3.1 Secondary data .............................................................................................. 144.4 Data Analysis .................................................................................................. 14
5. Findings .......................................................................................................... 145.1 Major Products Market and their Characteristics ......................................... 155.2 Informal Business Characteristics ................................................................. 165.2.1 Business type ................................................................................................. 165.2.2 Age of the business ....................................................................................... 165.2.3 Product, process and marketing innovation ................................................ 165.2.4 More informal businesses characteristics .....................................................175.3 Entrepreneur Characteristics ......................................................................... 195.4 Microeconomic Factors .................................................................................. 215.4.1 Access to credit .............................................................................................. 215.4.2 Access to market information ......................................................................235.4.3 Contractual arrangements ............................................................................265.4.4 Technology ....................................................................................................275.5 Social Amenities .............................................................................................285.6 Determinants of Products Market Choice in Informal Businesses
in Kenya ..........................................................................................................29

vi
Factors that determine choice of products market for businesses in the informal sector in Kenya
5.6.1 Business characteristics ................................................................................325.6.2 Entrepreneur characteristics ........................................................................345.6.3 Microeconomic characteristics ....................................................................35
6. Conclusions and Recommendations ..............................................................366.1. Conclusions .....................................................................................................366.2. Recommendations ..........................................................................................37
References ..............................................................................................................39

vii
List of Tables
Table 1: Main buyers of products from MSME establishments (%) ....................... 1
Table 2: Description of the variables used in the study ........................................ 13
Table 3: Product, process and marketing innovation ............................................17
Table 4: Descriptive statistics of the informal businesses .................................... 18
Table 5: Descriptive statistics of the entrepreneur ...............................................20
Table 6: Credit sources purpose for borrowing and reasons why credit inadequate ......................................................................................................22
Table 7: Descriptive statistics on social amenities among business establishments in the informal sector .....................................................................................29
Table 8: Parameter estimates for determinants of products market choice ........30
Table 9: Marginal effects from multinomial logistic regression estimates ......... 31
List of Figures
Figure 1: Determinants of choice of product markets in informal businesses in Kenya ..............................................................................................................10
Figure 2: Market choices for products from informal sector (%) ......................... 15
Figure 3: Type of business based on the market choice ....................................... 16
Figure 4: Age of the business in years ....................................................................17
Figure 5: Credit application .................................................................................. 21
Figure 6: Access to information using landline phones .......................................23
Figure 7: Access to information using mobile phone ...........................................24
Figure 8: Access to information using computers ................................................24
Figure 9: Different computer uses ........................................................................25
Figure 10: Internet uses .........................................................................................25
Figure 11: Use of internet to access government services .....................................26
Figure 12: Contractual arrangements when buying inputs ..................................26
Figure 13: Contractual arrangements when selling products/services ................ 27
Figure 14: Average number of machines/equipment owned by a business .........28


1
1. Introduction
Product market choice is central for businesses seeking to maximize profits. From the Micro, Small and Medium Enterprises (MSMEs) report of 2016 that covers formal and largely informal businesses, MSMEs have a choice to sell their products to various markets. From Table 1, individual consumers are the largest consumers of products from MSMEs for both licensed and unlicensed enterprises. The proportion to the non-MSMEs, government opportunities and direct exports is very low, particularly among the unlicensed MSMEs. This resonates with Sessional Paper No. 2 of 2005 on Development of Micro and Small Enterprises for Wealth and Employment Creation for Poverty Reduction where MSEs are noted to be ill-prepared to compete in liberalized markets and tend to remain in the confines of very narrow local markets characterized by intense competition which drives prices down resulting in very low profit margins.
Table 1: Main buyers of products from MSME establishments (%)
Main buyer of MSME products
Licensed Unlicensed
Micro Small MediumMSMEs 7.8 12.2 12.5 9.7Non-MSMEs 1.3 4.5 8.4 2.9Direct exports 0.1 1.0 3.5 -Individual consumers 89.9 75.4 68.6 85.6Government 0.3 2.8 2.8 0.6Others 0.5 4.1 4.2 1.3
Source: MSME report (2016)
Access to product markets has been identified as a serious issue for micro and small enterprises’ (both formal and informal) growth and competitiveness in Kenya and Sub-Saharan Africa at large (Liedholm and Mead, 2013; Jagongo and Kinyua, 2013; Government of Kenya, 2005.). Promoting marketing capabilities is the key challenge to increasing the informal businesses productivity. Product markets strategies by businesses are important as they aid in decisions on how to compete (Zott and Amit, 2008).
Although most activities in the informal sector are not registered or regulated, the goods and services produced are legal (Del Cid, 2003). In Kenya, the informal sector is very important, accounting for 83.4 per cent of the total employment

2
Factors that determine choice of products market for businesses in the informal sector in Kenya
(KNBS, 2018). The sector provides a livelihood for the vulnerable groups in the economy, employing women, youth, and rural communities (Barrientos and Barrientos, 2002). With this increasing importance, stakeholders including governments and researchers are increasingly viewing the sector as a path-way for poverty reduction (Chen, 2012).
The Government of Kenya realizes the need to promote local industries and shift from the over-reliance on importation of goods. Government initiatives include expansion of access to procurement opportunities where Ministries, Departments and Agencies (MDAs) are required to reserve a minimum of 40 per cent of their procurement budget for locally produced goods and services. Strategies such as ‘Buy Kenya Build Kenya’ are being implemented with an aim of creating a single and unified platform to streamline and coordinate government and private efforts to strengthen public confidence in consuming locally produced goods and services (Ministry of Trade Kenya, 2017). Unlike businesses operating formally, informal businesses do not have the luxury of sending informative signals describing the product, price and their location. This is principally because such marketing strategies would not only expose them to potential customers and competitors, but also taxing authorities of a country (Anbarci et al., 2012).
Businesses in the informal sector are deemed to be illegal and lie low to avoid regulations such as tax authorities, but their key role in the economy as sources of household’s income and employment cannot be denied. This study therefore aims to determine how informally-operated businesses choose buyers for their products in Kenya. Specifically, the study attempts to answer the question of whether microeconomic, business and entrepreneur characteristics do influence choice of products market among informally operated businesses. This grants a useful strategy for informal sector to improve their productivity, reduce poverty and create decent jobs. This will go a long way towards achieving the governments’ development agenda of increased employment in the manufacturing sector under the “Big Four” agenda and will also help in mainstreaming informal sector to improve its efficiency and productivity as visualized in the Kenya Vision 2030.
3
2. Institutional/Legal and Regulatory Frameworks on Markets in Relation to the Informal Sector
Following the realization of the important role the informal sector plays, the government has over the years set up an institutional, legal and regulatory framework to mainstream and regulate the activities from the sector. Sessional Paper No. 1 of 1986 on Economic Management for Renewed Growth recognized the importance of MSEs and called for special attention to informal sector entrepreneurs in the manufacturing, construction, transport and housing. Sessional Paper No. 2 of 1992 on Small Enterprises and Jua Kali Development provided definitions of MSMEs based on the number of employees the enterprises have. It also recognized the limited knowledge on issues concerning taxation, licensing and legal requirements. For increased access to information, the Sessional Paper pushed for the formation of associations (KNBS, 2016).
Sessional Paper No. 2 of 2005 on Development of Micro and Small Enterprises for Wealth and Employment Creation for Poverty Reduction places emphasis on the role of markets, with government’s objective being to promote the number and competitiveness of MSEs. The sessional paper stipulates that government would allocate at least 25 per rcent of its procurement requirements to the sector as a way of showing commitment to markets access and marketing for MSEs. Similarly, the sessional paper committed to spearhead the ‘Buy Kenyan Build Kenya’ sensitization. This sessional paper saw the birth of the Micro and Small Enterprise Act. It is worth noting that this sessional paper was drafted before the Vision 2030, and therefore may not be in line with the country’s blueprint vision document. Therefore, revision of the session paper is necessary.
The ‘Buy Kenya Build Kenya’ strategy of 2017 was drafted with the aim of creating a single and unified platform to streamline and coordinate government and private efforts aimed at enhancing public confidence in consuming locally produced goods and services. The perception of imported goods to be superior than locally produced goods and services has also been noted as the biggest weakness in the strategy. To achieve this, a reservation of 40 per cent of public procurement budget for local goods and services has been called for. This is to be achieved by reviewing the existing legal guidelines, and creation of a database in partnership with the private sector of all goods/services produced locally. Enhancing market access of locally produced goods and services is the other strategy to be adopted. Here, proposals to promote competitiveness and consumption of local products and services, offering support in packaging for market access, branding for market access, provision of working shelf space and physical market infrastructure have been made. This strategy has not placed specific emphasis on the informal sector and its role in promoting consumption of local goods and services. Rather, it

4
Factors that determine choice of products market for businesses in the informal sector in Kenya
has bundled the informal sector as part of MSMEs and proposes to support the deserving MSMEs to set up a common packaging platform that meets consumer requirements. This is despite acknowledgement by the Vision 2030 of the dominance of informal businesses in the wholesale and retail sectors. Achievement of the proposed strategies will be most effective if more focus is shifted towards the informal sectors’ productivity.
Micro and Small Enterprises Act (MSEA) No. 55 of 2012 provides for establishment of Micro and Small Enterprises Authority (MSEA) with one of its core functions being promotion of access to markets by MSEs. Part five, section 49(b) of the Act requires that the Authority identifies markets for products generated by micro and small enterprises and provide linkages between micro and small enterprises and potential markets. Section 51 establishes the Micro and Small Enterprises Development Fund whose purpose is to provide affordable and accessible credit to micro and small enterprises. Caution needs to be exercised while implementing the fund to ensure proper coordination with other credit lending institutions such as those stipulated in the Micro Finance Act 2006, SACCOs and Cooperatives to avoid over burdening the MSEs with credit, especially in an era where mobile money is becoming deeply rooted in Kenya.
Access to Government Procurement Opportunities (AGPO) is a government programme anchored in the Constitution of Kenya with an aim of facilitating the enterprises owned by women, youth and persons with disability to participate in government opportunities. This is supported by the legal requirement that 30 per cent of government procurement opportunities are set aside specifically for enterprises owned by these groups. However, the micro and small enterprises that fall in the informal sector category will most likely miss out on these opportunities given the pre-qualification requirements. Some of these include registration of the business with the Attorney General’s Office, acquisition of a PIN and Tax compliance certificate, acquire all required certifications from professional bodies and authorities such as National Construction Authority and finally must have a bank account for the enterprise and a bank reference from the bank (AGPO, 2019). By sheer definition of an informal enterprise to be one that lacks registration locks out this group from such an opportunity.
From the review of the policy framework on markets in relation to informal sector, gaps are evident particularly in consideration of the informal sector. While there is acknowledgement of the importance the informal sector plays, there lacks policies directed to the sector but a tendency to bundle informally operated businesses under MSMEs. This almost always leaves the participants from any beneficial policies laid down to support their growth. This is especially following the definition of an informal sector.

5
3. Literature Review
3.1 Theoretical Review
There are four main schools of thought that have been applied in the informal sector phenomenon. In the legalist school of thought, informality is perceived as a response by informal workers to red tape and high cost of formality in terms of time, money and effort imposed by government to entrepreneurs (Becker, 2004). The voluntarists school argues that informality is a deliberate decision made by entrepreneurs to avoid regulations and taxes, because they perceive benefits of informality to outweigh formality (Chen, 2012). The structuralist school suggests that informal sector grows because of conditions in the formal economy. In dealing with high costs associated with formality, the informal sector tends to become a complimentary and subordinated sector of the formal economic structure (Portes and Haller, 2004). The dualist school of thought on informality explains that informality exists as parallel and marginal sector that provides income for the poor (Chen, 2012).
Many theories have been put forward to explain the concept of marketing and market access. The study reviewed the theories with a view to isolating and understanding key marketing factors that relate to formal and informal sector market access.
3.1.1 Neoclassical paradigm theory
The research was based on the neoclassical paradigm theory that is grounded on the concept of perfect competition, which is guided by several axioms; perfect knowledge of prices and technology, homogeneous products by all firms, unrestricted exit and entry in the industry, many small firms, no transaction cost, no public goods, no economies of scale and scope, firms are profit maximizers. Given these assumptions, all players in the perfect market will seek to maximize their gains and in the long run, the market will tend towards equilibrium in which returns equals to costs. However, perfect markets are not realistic and in the absence of advanced legal structures, competition law and regulation, firms operating in imperfect markets suffer from high transaction costs, monopoly distortions, information failure, mistrust, uncertainty and risk-aversion. For perfect competition, firms require perfect and costless information and minimal transaction costs to compete effectively (List, 2004).

6
Factors that determine choice of products market for businesses in the informal sector in Kenya
3.1.2 Market orientation theory
The theory holds that the key to achieving organizational goals is by being more effective than competitors in integrating marketing activities to determine the needs and wants of target markets (Kotler,1999). Conventional marketing wisdom, thus, holds that market orientation provides a firm with better understanding of its customers, competitors and environment, which subsequently leads to a superior firm performance. The model states that understanding customer needs is translated into products by a process that involves technology, and the final product put in the market for customer reaction. Market research and consumer analysis are therefore vital in enabling enterprises to meet their customer’s needs and wants, while at the same time remaining competitive and timely and responding to customers’ emerging needs. The theory posit collection and use of market information, and to put emphasize on coordination of resources to deliver superior customer value. The accuracy of this theory has been tested in empirical studies, and it has been found that market-oriented firms perform better than their internally focused competitors on financial measures such as profit, return on asset, and non-financial measures such as new product success and innovation.
3.1.3 Evolutionary systems change theory
This theory stipulates that ability of a firm to survive and succeed depends on its ability to search for and respond to the needs of the market niches (Ehebrecht et al., 2018). Market systems are dynamic in nature and tend to respond to evolving needs and the behaviour of competitors. This makes the market system to be in a continuous shift towards disequilibrium. Firms thus need to adapt to the new environment and find a competitive edge through improvements, maintaining high quality, selecting strategic market sites, promoting products and services, identifying niche markets and access to other markets outside their localities. The theory identifies the role of entrepreneur as to purposely disrupt the equilibrium by creating new alternatives for consumers and constraining opportunities for competitors (Ehebrecht et al., 2018). This shift transforms market into new markets, with new features and firms that stay afloat in the new market are the ones able to adjust to the new competitive environment. Therefore, for evolutionary survival, energetic firms undertake “organizational learning” to manage their own adaptations and vicissitudes.

7
3.1.4 Relationship marketing theory
The theory is based on the idea that it costs more to attract a new customer than to retain an existing one (Ehebrecht et al., 2018), and new mutual value is created between a supplier and individual customer. In addition to consumers looking for suppliers who provide value for money in terms of fair prices, consumers also look for relationship value. The theory emphasizes on establishing, developing and maintaining successful relational exchanges. When customers and businesses can relate well, novelty and mutuality are deepened, extending and prolonging relationships, further creating more opportunities for customer and supplier to benefit from one another. Customer satisfaction coupled with improved quality of products and services enhances customer loyalty, translating to certainty of sales growth of a firm. It is therefore imperative for firms to develop fulfilling customer relationship to obtain and retain customers.
3.1.5 Functional approach theory
Developed by Wroe Alderson in 1965, the theory provides insight into dynamics and mechanisms of marketing. It identifies two distinct functions that interact in heterogeneous markets, noting that marketing process starts with firm resources in their natural state and ends with meaningful assortment in the hands of consumers. van Raaij et al. (2002) states that the theory focuses on the functions that are needed to get different kinds of goods from the producer to the consumer.
Households buy and consume products from firms and households have desires of assortments that are heterogeneous, requiring heterogeneous market intervention in the form of heterogeneous supply. Such interventions are met by competitive firms that engage in strategic innovation in marketing. Dynamism in the market creates room for newer and heterogeneous consumer demands that require entry of new and heterogeneous production that would be premised on competitive synergy.
3.1.6 Transaction costs theory
The theory recognizes that markets are driven by transaction costs created by information asymmetry, opportunism and asset specificity. Examples of transaction costs include cost of acquiring information, negation, monitoring, coordination and enforcement of contracts. Various costs inquired during production process determine the price of the products, making it clear that reduced transaction costs are significant to marketing and in enhancing market access (Williamson, 1993).
Literature review
8
Factors that determine choice of products market for businesses in the informal sector in Kenya
3.2 Empirical Review
The type of market that businesses choose to sell their products is an important pathway for its profit maximization goal. Several factors determine the type of market an informal business is able to access. Use of technology in a business determines the scale of production, quality of the products and consequently the type of market accessed. The quality dualism theory characterizes products from the informal sector to be of low quality, driven by factor price changes in production (Banerji and Jain, 2007). With the micro nature of businesses in the informal sector, production in scale is not possible and tendencies to employ labour intensive as opposed to capital intensive production systems are common. This has an impact on the pricing of the end products and, therefore, the type of buyers accessed. wa Kabecha (1998) observes that businesses operating informally tend to imitate products from formal businesses and because of resources constraints, tendency to lower the quality of the same product is evident. This leads to selling the product at lower prices driving the competitors with superior quality products out of business. However, because of the lowered quality, informal businesses are not able to access wider markets. Similarly, production is not technologically inspired, and competing on quality is not adopted as a marketing strategy.
Access to market information aids in business decision making from production of demanded products to price setting. According to transaction cost theory, market coordination includes all the information and communication related costs before, during and after a transaction (Boateng, 2011). Hairuddin et al. (2012) find that micro-enterprises in Malaysia do not use information technology (IT) such as computers and phones for business-related activities such as records keeping, searching for markets and communication to clients. They therefore relied on other parties to distribute, promote and market their products. These forced micro-enterprises to play sub-contracted roles by larger businesses that adopted use of IT. As a consequence, micro-enterprises fetched very little from their businesses as they had to sell at lower prices. In Ghana, Boateng (2011) notes that traders in their micro-trading activities used mobile phone to monitor goods for pricing strategies, scheduling deliveries and addressing inquires and complaints during trade activities. Similarly, Jagun (2008) argues that mobile telephony reduced cost of doing business in terms of time and finances by substituting for journeys made to attend in person business meetings. However, he notes that mobile phones do not necessarily improve the quality of information when it comes to accuracy and relevance.
While access to credit is not on top of the list of challenges affecting small and micro enterprises in Nairobi Kenya, Bowen et al. (2009) and Beck et al. (2015) find that access to informal finance is associated with a higher growth of rural

9
micro enterprises among rural Chinese households. On the other hand, Nguyen et al. (2015) empirical analysis on credit accessibility by small and medium-sized enterprises in Vietnam revealed that the size of business and sector of the economy they operated in determined access to credit. Larger firms are more likely to access credit and those in the services sector have a lower probability of borrowing. Gobena and Amare (2016) deduce that access to credit significantly affected access to markets by micro and small enterprises in Ethiopia. However, none of these studies explore if access to credit significantly determines the choice of a product market among the informally operated businesses.
Availability of skilled labour is noted to be one of the serious constraints among informally operated businesses in Africa (Mamman et al., 2007). Martin and Alejandro (2016) argue that formal education affects overall efficiency only when the entrepreneur has attained higher education. In addition, Magambo (2015)recommends boosting the level of education by entrepreneurs with emphasis on communication skills as it assists in attracting more clients.
From the review of literature, few studies have focused on how informally operated businesses choose a product market and what factors determine such choices. Studies that have attempted studying market access are to a larger extent agricultural related activities (Abebe et al., 2018; Kyomugisha et al., 2018; Kar and Jacobson, 2012). This is in consideration of the definition of the informal sector which does not cover small scale agricultural and pastoralism activities (KNBS, 2018). The current study therefore determined factors that influenced choice of a product market among informally operated businesses in Kenya
Literature review
10
Factors that determine choice of products market for businesses in the informal sector in Kenya
4. Methodology
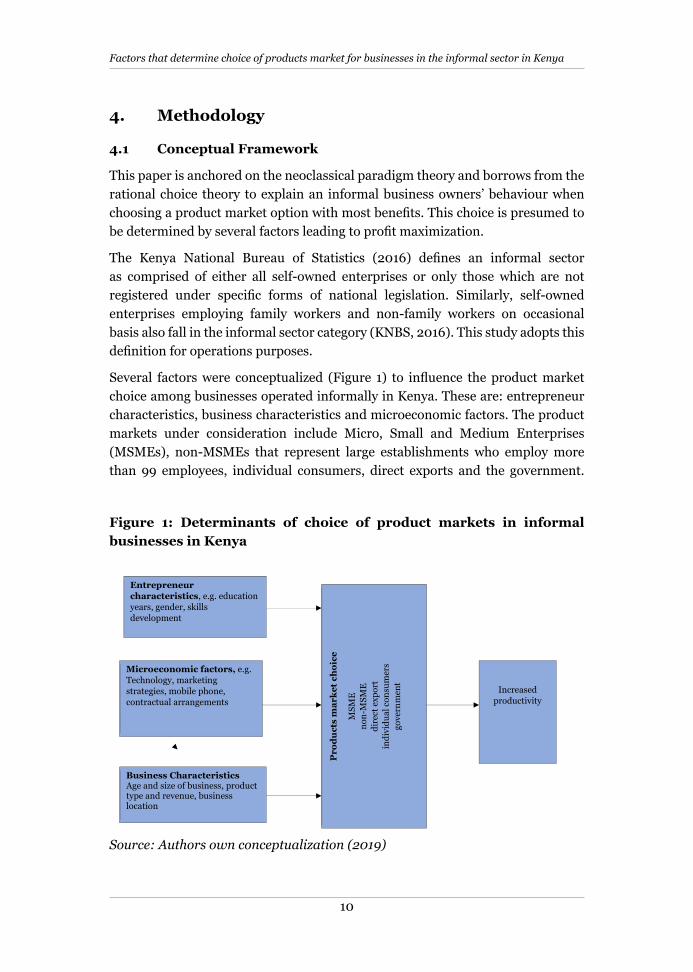
4.1 Conceptual Framework
This paper is anchored on the neoclassical paradigm theory and borrows from the rational choice theory to explain an informal business owners’ behaviour when choosing a product market option with most benefits. This choice is presumed to be determined by several factors leading to profit maximization.
The Kenya National Bureau of Statistics (2016) defines an informal sector as comprised of either all self-owned enterprises or only those which are not registered under specific forms of national legislation. Similarly, self-owned enterprises employing family workers and non-family workers on occasional basis also fall in the informal sector category (KNBS, 2016). This study adopts this definition for operations purposes.
Several factors were conceptualized (Figure 1) to influence the product market choice among businesses operated informally in Kenya. These are: entrepreneur characteristics, business characteristics and microeconomic factors. The product markets under consideration include Micro, Small and Medium Enterprises (MSMEs), non-MSMEs that represent large establishments who employ more than 99 employees, individual consumers, direct exports and the government.
8
Entrepreneur characteristics, e.g. education years, gender, skills development
Microeconomic factors, e.g. Technology, marketing strategies, mobile phone, contractual arrangements
Business Characteristics Age and size of business, product type and revenue, business location
Pro
du
cts
mar
ket
choi
ce
MSM
E
non-
MSM
E
dire
ct e
xpor
t in
divi
dual
con
sum
ers
gove
rnm
ent
Increased productivity
Figure 1: Determinants of choice of product markets in informal businesses in Kenya
Source: Authors own conceptualization (2019)

11
These categories of product markets are as identified in 2016 MSME survey data. From the choices of the buyers, individual consumers are those who buy for direct consumption and mostly found at the household level (Lubaale and Nyang’oro, 2013). For the non-MSMEs, these are assumed to be buyers from the private sector, mostly large companies. This is as demonstrated by (UNDP, 2015) in the paper on MSMEs as suppliers to the extractive industry. Fellow MSMEs also provide market for products from the informal sector depending on the line of business one engages in. The government is also a buyer of goods and services from the private sector that encompasses micro, small and medium enterprises having approximately 30 per cent of the national budget going to procurement (USAID and PPOA, 2009).
In Figure 1, lower level of education may limit the product market scope and individual consumers may be preferred. Credit accessibility, transport and communication networks may influence decision on the product market. This is possibly from ease of accessing market information if the communication infrastructure is in place, or ease of obtaining credit to expand production activities with the available collateral. Similarly, other product markets such as exports and non-MSMEs can easily be reached following ability to quickly access market information. This is true for business characteristics such as location, where those in urban setting are more likely to choose product markets such as non-MSMEs as it would be easier to access the business location in urban areas. It is expected that the choice of a market channel led to increased profitability and hence increased productivity for the informally operated businesses in Kenya.
4.2 Empirical Framework
In this study, informally operated businesses were asked the main buyer of their products among alternatives including individual buyers, MSMEs, non-MSMEs, direct exports and government. These choices are categorical, unordered and mutually exclusive. Multinomial logit regression (MNL) and multinomial probit regression (MNP) are methods used in estimating the significance of factors believed to influence choice in categorical and mutually exclusive alternatives (Greene, 2003). MNL was preferred as it is possible to capture the characteristics of the individuals faced with choices without necessarily having to capture the attributes of the choices. Similarly, unlike MNP, MNL has the ability to evaluate multiple integrals of the normal distribution (Greene, 2003).
According to Greene (2003), MNL borrows largely from random utility model concepts where for the ith business faced with J product market choices, the utility of product market choice J is expressed as:
Methodology

12
Factors that determine choice of products market for businesses in the informal sector in Kenya
Uij= β’ Xi+εij for i=1,…,n: j=1,…, J 1
Given two product market options PM1 and PM2 with their associated utility/profits P1 and P2, respectively, if P1 is higher than P2, then the business owner will choose product market option PM1 based on the random utility model theory. The hypothetical linear utility function of i for alternative j is written as in equation 1.
From equation 1, Uij is the utility derived by business owner i from product market j. Xi form the deterministic part representing individual characteristics and alternative specific attributes respectively. β represents the parameter estimates. εij represents the error term, which is used to capture aspects of utility that the researcher does not observe (Train, 2003). A business owner i is expected to choose an alternative product market option j to maximize his/her utility/profits Uij.
In multinomial regression analysis, coefficients are interpreted as the probability of choosing one among the several alternatives. MNL has a distribution assumption that the error term (εij) are independently and identically standard extreme value distributed over all categories j = 1,…, J, therefore a standard logistic distribution. The choice probabilities for the model are expressed as (Greene, 2003):
2
Since there are five categories in the dependent variable, four equations will be estimated providing probabilities for the J+1 choice for a decision maker with characteristics Xi. The βs are the coefficients to be estimated through maximum likelihood method. The coefficients provide the direction but not the magnitude or the actual effects. The marginal effects measure the actual effects of a unit change in each of the independent variables in relation to the base outcome on the choice of a product market. The linear expression of the model is presented as;
Yij=βXi+αWi+γZi+εi 3
Where Yij is the probability that an informal business owner i chooses to sell through product market j. Xi are business characteristics, Wi are the entrepreneur characteristics and Zi are the microeconomic factors. β,α and γ are the parameters to be estimated and εi is the error term. The equation estimated is
Products Market choice=β0+β1 Business type+β2 Business size+β3 Revenue+β4 Business Age+β5 Education years+β6 Gender+β7 Skills development+β8 credit access+β9 Mobile phone+β10 contractual agreement+β11 Product improvement+β12 technology +β13 Business location +e
10
𝑃𝑃𝑃𝑃𝑃𝑃𝑃𝑃(𝑌𝑌� = 𝑗𝑗) =𝑒𝑒�𝑗��
∑ 𝑒𝑒���𝐽�=0
, 𝑗𝑗 = 0,1 … 𝐽𝐽

13
Table 2: Description of the variables used in the study
Variable name Variable description Variable type Unit of measurement
Products market choice
Main buyer of products or services
Categorical 1=MSMEs2= Non-MSMEs3= Direct exports4= Individual consumers5= Government
Business characteristics
Business type Businesses categorized according to sectors of the economy
Categorical 1= Manufacturing2= Trade3= Service4= Agri-business
Business location Operating location for the business
Categorical 1= Commercial premises2= Industrial sites3= Markets4= Residential
Age of business Computed from date started or acquired to 2017
Continuous Years
Business size Computed from the number of employees in the business excluding the owner
Categorical 1=Micro (1-9 workers)2= Small (10-49 workers)3= Medium (50-99 workers)4= Large (above 100 workers)
Revenue Total sales of goods and services including sales on credit
Continuous Amount in Kenya shillings
Goods and services improvement
Introduction of new or significantly improved goods or services
Dummy 1=Yes0=Otherwise
Method of production improvement
Introduction of new or significantly improved methods of manufacturing or producing goods and services
Dummy 1=Yes0=Otherwise
Entrepreneur characteristics
Education years Computed from the highest level of education of the business owner/co-owner
Continuous Years
Gender Ownership of the business Categorical 1= Male 2= Female3=Male- female partners
Skills development Number of different types of trainings received by the business owner
Continuous Number
Microeconomic factors
Methodology
14
Factors that determine choice of products market for businesses in the informal sector in Kenya
Credit access Computed from the amount of credit that was borrowed and received. Anyone with above zero was considered to have accessed.
Dummy 1= Access0=otherwise
Access to market information
Dedicated mobile phone for business used as a proxy
Dummy 1=Yes0= otherwise
Contractual agreement Computed from type of contractual agreement
Dummy 1= Contract0= otherwise
Technology Proxied from electrically operated machines
Dummy 1=Yes0= otherwise
4.3 Data Sources
4.3.1 Secondary data
The study used secondary data obtained from the 2016 Micro, Small and Medium Enterprises survey. This recent data set was collected though a survey conducted by the Kenya National Bureau of Statistics. The data set incorporated both household-based approach and interviews from businesses/establishments identified from business registers maintained by county governments. The survey design focused on both licensed and unlicensed business establishments. The fifth National Sample Survey and Evaluation Programme (NASSEP V) sampling frame was used and a total sample of 23,745 businesses were interviewed. The dataset was chosen for analysis because approximately 74 per cent (17,896) of the businesses interviewed were not registered with the Registrar of Companies, therefore formed a good sample size of informally operated businesses in Kenya and secondly, the dataset is the most recent from the Kenya National Bureau of Statistics.
4.4 Data Analysis
The analysis of MSME 2016 was done including descriptive statistics to compare different informal businesses characteristics in Kenya. The frequencies, means, percentages and standard deviation results were generated and presented in graphs and tables. Multinomial Logistic Regression Analysis was done to determine factors influencing choice of a product market among informal businesses in Kenya.

15
5. Findings
5.1 Major Products Market and their Characteristics
Individual consumers form the majority (89.09%) of the products market where informal business sell their products (Figure 2). This is possibly because of ease with which a business can penetrate such a market. The scale of production is not necessarily large, and most times the individual consumers are likely to be from informal households (Bohme and Thiele, 2011). Micro Small and Medium Enterprises (MSMEs) as a product market option account for about 8 per cent of the informal businesses. This could be the case as penetration to these markets could be relatively easy especially in the supply of inputs among the micro and small businesses. Non MSMEs representing large establishments had only two percent of the informal business in this category as a main product market choice. This is also possibly because informal business are engaged as distribution channels and in the supply of inputs along the value chains (Bohme and Thiele, 2011).
A very small proportion of the informal businesses have government and the direct exports as their product market choices. This is possibly because government does not principally engage in business but rather provides an enabling environment for private agents to engage in business. Secondly, for a business to engage in business with the government, there are certain prerequisites needed, key among them a registration certificate and an operational business license. This argument holds true for businesses that have direct exports as the choice of market.
Figure 2: Market choices for products from informal sector (%)

16
Factors that determine choice of products market for businesses in the informal sector in Kenya
5.2 Informal Business Characteristics
5.2.1 Business type
From Figure 3, the most prevalent type of business establishments is in wholesale and retail trade, repair of motor vehicles and motorcycles in all the market choices. This marks more than half of all business types in the study. This means that most businesses do not engage in primary production of goods and services, but rather trade intermediary goods and offer services. This is possibly because engaging in these economic activities is less restrictive, and businesses can enter and exit the market freely.
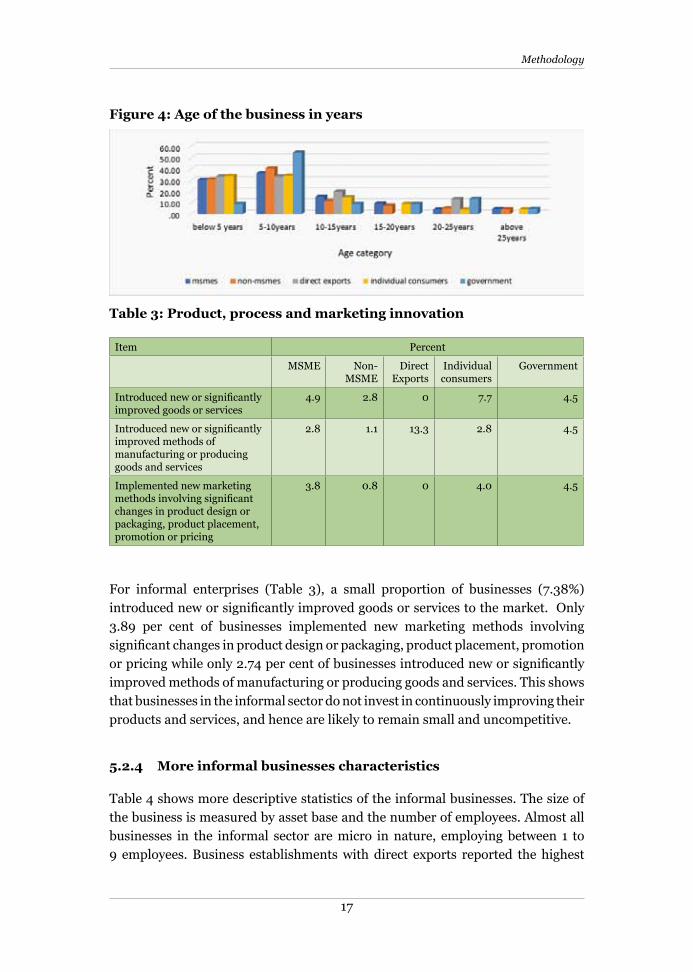
5.2.2 Age of the business
Figure 4 shows the age of informal sector establishments in various categories. Majority of the business establishments were below ten years. Over 50 per cent of the businesses that had government as their choice market were between five to ten years.
This is possibly because this market requires high standard goods, and businesses needs skills and capacity to produce the products that require time. This also indicates that much as opportunities such as Access to Government Procurement Opportunity (AGPO) have recently been established, businesses especially in the informal sector are not able to penetrate such opportunities.
5.2.3 Product, process and marketing innovation
Innovation is the process of introducing new ideas, workflows, methodologies, services or products. For business to have global competitiveness and meet the growing customer demands, they need to progressively innovate to keep abreast.
Figure 3: Type of business based on the market choice
17
Table 3: Product, process and marketing innovation
Item Percent
MSME Non-MSME
Direct Exports
Individual consumers
Government
Introduced new or significantly improved goods or services
4.9 2.8 0 7.7 4.5
Introduced new or significantly improved methods of manufacturing or producing goods and services
2.8 1.1 13.3 2.8 4.5
Implemented new marketing methods involving significant changes in product design or packaging, product placement, promotion or pricing
3.8 0.8 0 4.0 4.5
For informal enterprises (Table 3), a small proportion of businesses (7.38%) introduced new or significantly improved goods or services to the market. Only 3.89 per cent of businesses implemented new marketing methods involving significant changes in product design or packaging, product placement, promotion or pricing while only 2.74 per cent of businesses introduced new or significantly improved methods of manufacturing or producing goods and services. This shows that businesses in the informal sector do not invest in continuously improving their products and services, and hence are likely to remain small and uncompetitive.
5.2.4 More informal businesses characteristics
Table 4 shows more descriptive statistics of the informal businesses. The size of the business is measured by asset base and the number of employees. Almost all businesses in the informal sector are micro in nature, employing between 1 to 9 employees. Business establishments with direct exports reported the highest
Figure 4: Age of the business in years
Methodology

18
Factors that determine choice of products market for businesses in the informal sector in Kenya
revenue in a month of Ksh 1.67 million compared to those selling to individual consumers at Ksh 31,783 in a month. There is a significant difference in the average revenue for business establishments accessing various market options (F-stat: 96.18; Pvalue:0.000). This may possibly indicate that business establishments that only access individual consumers do not have scale in production, and these consumers buy products and services in small quantities. As expected, those able to access direct exports have a higher monthly revenue because exporting of goods and services is one of the business strategies for expansion (Salomon and Shaver, 2005).
From Table 4, approximately 42.86 per cent of informal businesses that sell their products to direct export market felt the site was very appropriate with regard to getting customers, followed by businesses that sold their products to the government at 31.82 per cent. This is possibly because of the kind of client who is not a walk in. On business ownership, the informal businesses are sole proprietors and family businesses in all market choices. Of interest to note was that over half of the family owned businesses had government as their choice of market. Decision making in a business is critical for the success. From the survey, the informal business establishments have the owner or a co-owner of the business as the decision maker. This is in line with the form of business ownership of sole proprietorship is dominant.
Table 4: Descriptive Statistics of the informal businesses
Market choices (%)
MSMEs (n=1433)
Non-MSMEs (n=363)
Direct Exports (n= 15)
Individual Consumers (n=15943
Government (n=22)
Business size
Micro (1-9 workers) 94.07 94.77 93.33 95.40 95.45
Small (10-49 workers) 5.02 4.68 0.00 4.25 4.55
Medium (50-99 workers)
0.63 0.55 0.00 0.27 0.00
Large (above 100 workers)
0.28 0.00 6.67 0.09 0.00
Business location and access to customers
Very Appropriate 0.25 23.27 42.86 16.72 31.82
Appropriate 44.05 59.28 21.43 46.11 27.27
Fairly Appropriate 27.30 15.79 21.43 32.87 40.91
Inappropriate 2.85 1.66 14.29 3.83 0.00
Very Inappropriate 0.43 0.00 0.00 0.47 0.00
Business ownership

19
Family 21.77 15.15 26.67 24.42 63.64
Sole proprietor 72.44 70.80 66.67 68.10 36.36
Partnership 4.54 4.68 0.00 6.12 0.00
Cooperative 0.21 0.83 0.00 0.14 0.00
Group 0.77 0.00 0.00 0.83 0.00
Private company 0.21 7.71 0.00 0.18 0.00
Public limited company
0.00 0.28 6.67 0.06 0.00
Business decision making
Owner/co-owner 97.56 96.14 93.33 97.55 100.00
Board / committee members
1.54 2.48 6.67 1.31 0.00
Managers 0.84 1.38 0.00 1.03 0.00
Average monthly revenue (Ksh)
54945.19 49106.85 1675879 31783.04 41593.6
5.3 Entrepreneur characteristics
From Table 5, all entrepreneurs had basic education with an average of 12.99 years of education. Those accessing government reported the highest average years of education at 15.55 followed by those accessing direct exports. This is an indicator that education plays a critical role in business and decision making, especially on decisions of where to sell. Continuous skills development is also key as it affects performance of the business and the ultimate market that can be reached.
Methodology

20
Factors that determine choice of products market for businesses in the informal sector in Kenya
Table 5: Descriptive statistics of the entrepreneur
Market choices (%) MSMEs
(n=1433)Non-MSMEs (n=363)
Direct Exports (n= 15)
Individual Consumers (n=15,943
Government (n=22)
GenderMale only 53.94 44.90 20.00 45.91 36.36Female only 25.47 26.45 46.67 29.74 13.64Male-male partners
1.67 3.58 0.00 2.35 0.00
Female-female partners
1.67 0.00 0.00 1.12 0.00
Male-female partners
17.24 25.07 33.33 20.88 50.00
Highest education qualificationNone 11.95 11.70 7.69 9.54 0.00CPE / KCPE 27.14 30.14 53.85 29.74 18.18KJSE 30.85 32.00 7.69 31.20 40.91EACE / KCE / KCSE
7.83 5.70 0.00 7.82 13.64
Certificate 11.95 11.70 23.08 11.13 4.55Diploma 5.30 4.30 0.00 5.08 13.64Degree 0.95 0.00 7.69 0.97 4.55Skills developmentArtisan grade 1 1.33 0.32 14.29 2.26 4.55Teaching 2.36 2.86 3.00 -Computer packages
3.68 2.86 7.14 3.96 -
Artisan grade 3 3.76 2.54 7.14 4.31 -Diploma 4.13 6.98 14.29 4.51 9.09None 68.83 74.60 42.86 66.19 40.91 Average years of education
12.96 12.12 13.29 13.00 15.55
Majority of the business owners have not invested in any skills development courses regardless of the market they were able to access. This possibly explains

21
why products from the informal sector are perceived to be of low quality and access to bigger markets is not possible (Bohme and Thiele, 2011). On the issue of gender as shown in Table 5, about 50 per cent of the business owners who accessed government were male- female partnerships while a majority (54%) supplying MSMEs were male only. Interestingly, a larger majority (47%) who accessed direct exports were female only. This may likely indicate the kind of exports could be artifacts such as beadwork and clay work mostly done by women. This also resonates with the main type of business where those accessing direct exports were in manufacturing (Figure 3).
5.4 Microeconomic Factors
5.4.1 Access to credit
Credit application
Access to credit is crucial to the enterprise growth as they rely on credit for capital improvement and startup costs, and to meet everyday expenses such as wages. Demand for credit among informal enterprises was generally low, with 71 per cent reporting not to have applied for a credit for the last 3 years (Figure 5).
There is a significant difference between informal businesses that applied for credit and the amount of revenue (F-stat= 4.98; Pvalue= 0.0256). This means that the businesses that applied for credit to use in business expansion recorded a higher revenue compared to those that did not. Interestingly, informal business exporting directly did not apply for credit. This is contrary to expectation as it is
Figure 5: Credit application
Methodology

22
Factors that determine choice of products market for businesses in the informal sector in Kenya
assumed that businesses that export require heavy capital investment for products to reach the desired market.
Credit sources and the main purpose for borrowing
From Table 6, the main source of credit was commercial banks (40.9%), followed by micro-finance institutions at 22.5 per cent. Working capital was the main reason for credit at 35.5 per cent, followed by refurbishing business at 25.5 per cent. 14.8 per cent of establishments took credit to purchase inventory while 14.8 per cent took credit for non-business purposes. Informal enterprises that reported credit inadequacy cited lenders ceiling, lack of collateral and high interest rate as the main reasons at 35.7 per cent, 31 per cent and 24.4 per cent, respectively.
Table 6 : Credit sources purpose for borrowing and reasons why credit inadequate
Product market choice MSMEs (n=1433)
Non-MSMEs (n=363)
Individual Consumers (n=15943
Government (n=22)
Credit sources
Public financing agencies/cooperatives
5.7 2.9 3.9 -
Micro-finance institutions 24.7 9.8 22.6 -
Self-help groups 3.6 1.0 6.8 -
NGOs .3 .2 -
Family friends .5 1.0 .6 -
Money lenders 2.3 .8 -
Non-bank finance institutions 3.1 2.0 1.9 -
Rotating savings and credit associations
2.1 1.0 4.6 -
Commercial banks 44.5 58.8 40.1 80.0
SACCOS 8.0 17.6 12.4 20.0
Public enterprise funds (youth, women)
1.0 1.0 1.1 -
Mobile platform 1.8 1.0 .9 -
Purpose of credit
Purchase inventory 13.9 8.8 16.9 -
Working capital 39.1 16.7 35.7 60.0
Refurbishing business 28.5 59.8 24.6 -
Pay debt .5 1.0 .6 -
Non-business purpose 12.3 11.8 15.1 -

23
Starting another business 2.6 2.0 4.2 20.0
Reason credit was inadequate
Lack of collateral 35.8 43.8 30.5 100.0
High interest rate 11.9 6.3 25.7 -
Lender ceiling 47.2 31.3 34.7 -
Contrary to expectations, informal sources of credit such as chamas and table banking were not cited as the main sources of credit, though they have been shown to be dominant in the informal setting. Public enterprise funds, including women and youth were also not well accessed by the informal businesses in Kenya. As much as the informal businesses mostly access credit from commercial banks, adverse selection bias and moral hazard behaviours are likely to be observed. This is because some of the requirements needed for commercial bank credit are not within the confines of a business operating informally, for example business registration, license and business pin number.
5.4.2 Access to market information
From Figure 6, over 80 per cent of all the informally operated businesses did not rely on land line phones as a source of market information or communication in general. This is possibly because land line phones are rather old technology and newer gadgets such as mobile phones have replaced them. Similarly, this is a more expected occurrence given the minute nature of informal businesses, some of which are also mobile, for example street hawking.
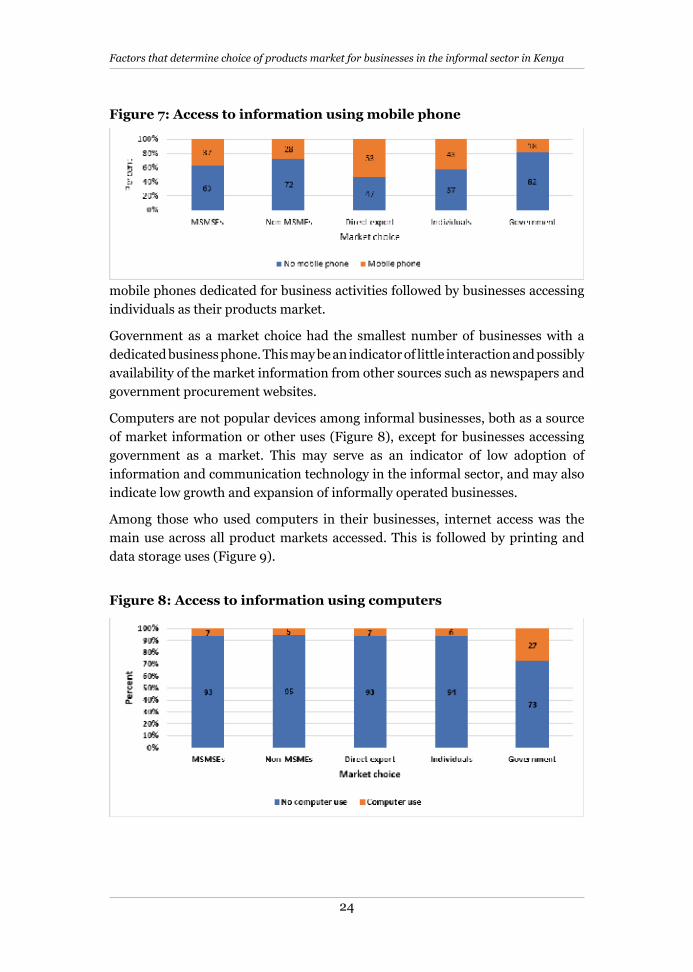
From Figure 7, mobile phone is relied more as a source of information across all product market choices. This is compared to the use of landline phones. Those accessing direct exports were reported to be the highest (53%) in having
Figure 6: Access to information using landline phones
Methodology
24
Factors that determine choice of products market for businesses in the informal sector in Kenya
mobile phones dedicated for business activities followed by businesses accessing individuals as their products market.
Government as a market choice had the smallest number of businesses with a dedicated business phone. This may be an indicator of little interaction and possibly availability of the market information from other sources such as newspapers and government procurement websites.
Computers are not popular devices among informal businesses, both as a source of market information or other uses (Figure 8), except for businesses accessing government as a market. This may serve as an indicator of low adoption of information and communication technology in the informal sector, and may also indicate low growth and expansion of informally operated businesses.
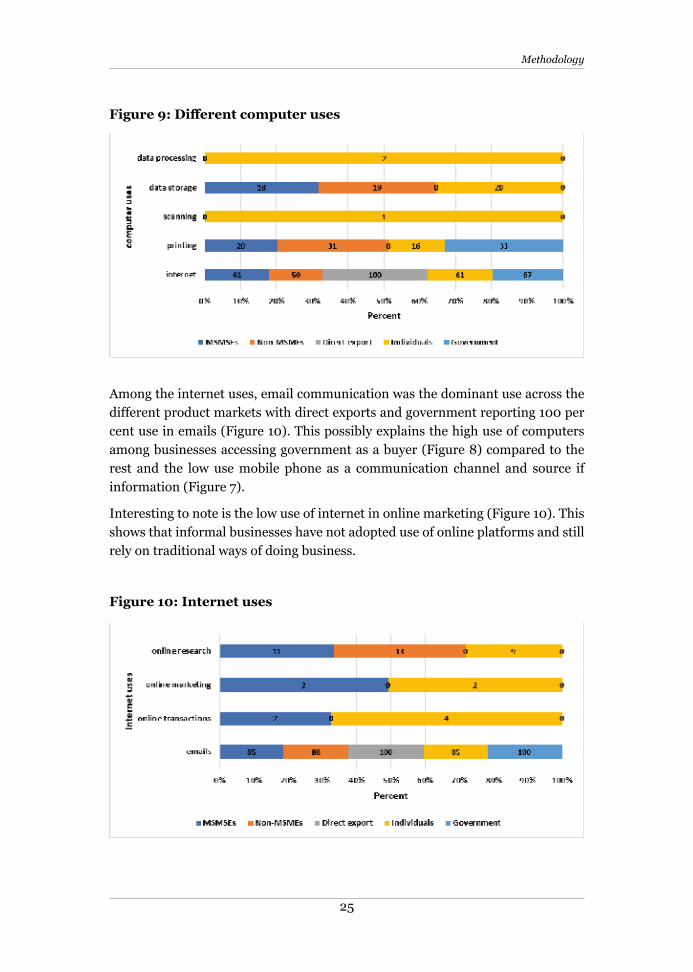
Among those who used computers in their businesses, internet access was the main use across all product markets accessed. This is followed by printing and data storage uses (Figure 9).
Figure 7: Access to information using mobile phone
Figure 8: Access to information using computers
25
Among the internet uses, email communication was the dominant use across the different product markets with direct exports and government reporting 100 per cent use in emails (Figure 10). This possibly explains the high use of computers among businesses accessing government as a buyer (Figure 8) compared to the rest and the low use mobile phone as a communication channel and source if information (Figure 7).
Interesting to note is the low use of internet in online marketing (Figure 10). This shows that informal businesses have not adopted use of online platforms and still rely on traditional ways of doing business.
Figure 9: Different computer uses
Figure 10: Internet uses
Methodology

26
Factors that determine choice of products market for businesses in the informal sector in Kenya
From Figure 11, majority of businesses did not access government services through internet. Those that did conducted filing of tax returns and accessing information from government websites. Filing of returns is contrary to expectation as the operational definition of an informal business is one without registration with Registrar of Companies and therefore not expected to file returns. This can only mean filing of personal income as opposed to declaring business income.
5.4.3 Contractual arrangements
From Figure 12, majority of the businesses did not have contractual agreements when buying inputs for their businesses.
Figure 11: Use of internet to access government services
Figure 12: Contractual arrangements when buying inputs

27
This means that businesses had to pay upfront when acquiring inputs and could not enjoy privileges that come with contracts such as acquiring inputs without necessarily paying on the spot.
Lack of contractual agreements with product markets is evident across all businesses in the informal sector (Figure 13). However, it is worth noting that some businesses (46%) of those having non-MSMEs as buyers do have contractual arrangements with fellow non-MSMEs and 36 per cent of businesses accessing government as a buyer have contractual arrangements with the government. This serves to show that as much as these businesses are informal, there must be an element in their operation that may allow consideration to contract such as an operating license.
5.4.4 Technology
Use of machines and equipment is used as a measure of level of technology adoption in businesses. It also serves as an indicator of level of operation, and investment in capital intensive production as opposed to labour intensive. Narrow business mindsets are found to affect business performance and access to wider markets. Batik microenterprises in Malaysia did not appreciate use of IT for advertising their work as they were afraid their designs would be stolen (Hairuddin et al., 2012). Similarly, microenterprises in Kenya were noted to have low use of technology and innovations in coming up with new metal work designs as they were afraid of being copied by competitors (Kabecha, 1999).
Figure 13: Contractual arrangements when selling products/services
Methodology

28
Factors that determine choice of products market for businesses in the informal sector in Kenya
Majority of informal businesses reported to have electrically-operated and fuel-operated machines and equipment as opposed to human-operated and animal-operated (Figure 14). Businesses exporting had a higher number of electrically-operated machines compared to the rest, followed by government. Businesses with hand-operated and fuel-operated are noted to mostly access individuals as their products market. This is an indicator of low level of operation and possibly the quality of products that are produced.
5.5 Social Amenities
The ease with which a business can operate plays a critical role on the level of production, which affects the kind of market accessed. From Table 7, over 70 per cent of all business establishments have reported access to electricity, with those business establishments exporting directly with the highest costs in a month. Piped water is reported to be main source of water, whether connected inside the business dwelling or within the yard. For informal establishments that sold their products to the government, 79 per cent had water within the premises, and 49 per cent of the establishments that sold their products to export markets had piped water within the compound. On telephone use, about 53.33 per cent of the informal enterprises that had a dedicated mobile phone sold their products to direct export market while only 18.18 per cent of business establishments that sold their products to the government had a dedicated fixed/landline telephone. Informal establishments that sold their products to government had the highest average telephone expenses per month.
Figure 14: Average number of machines/equipment owned by a business

29
Table 7: Descriptive statistics on social amenities among business establishments in the informal sector
Market choices
MSMEs Non-MSMEs
Direct Exports
Individual Consumers
Government
Electricity
Electricity access (%) 80.11 79.61 73.33 83.83 100.00
Average electricity cost per month (Ksh)
356.63 445.49 52104.10 436.61 836.53
Water sources (%)
Pond/dam 1.40 1.93 1.66 -
lake 0.28 0.55 0.55 -
Stream 4.40 7.99 6.57 -
Spring / well / borehole 15.56 16.80 13.33 16.82 9.09
Piped into dwelling 26.03 25.34 20.00 18.70 18.18
Piped into yard 11.30 25.62 13.33 9.87 36.36
Piped into outside tap 14.38 9.64 15.88 22.73
Rain/harvested 4.05 1.10 2.58
Water vendor 21.14 10.19 46.67 25.32 13.64
Average water cost per month (Ksh)
250.00 236.32 260.45 150.84 212.52
Distance to nearest water pipeline (%)
In premises 4.48 11.89 10.00 3.96
Within compound 8.67 3.50 50.00 6.60 20.00
Less than 100 meters 20.81 20.98 24.77 -
Less or equal to 500 metres 15.03 11.19 17.24 -
More than 500 metres 51.01 52.45 40.00 47.42 80.00
Telephone (%)
Dedicated fixed/landline telephone
3.49 12.40 13.33 2.47 13.64
Dedicated mobile phone for business
37.12 28.10 53.33 42.54 18.18
Average telephone cost per month (Ksh)
327.06 382.18 637.00 204.75 1374.35
5.6 Determinants of products market choice in informal businesses in Kenya
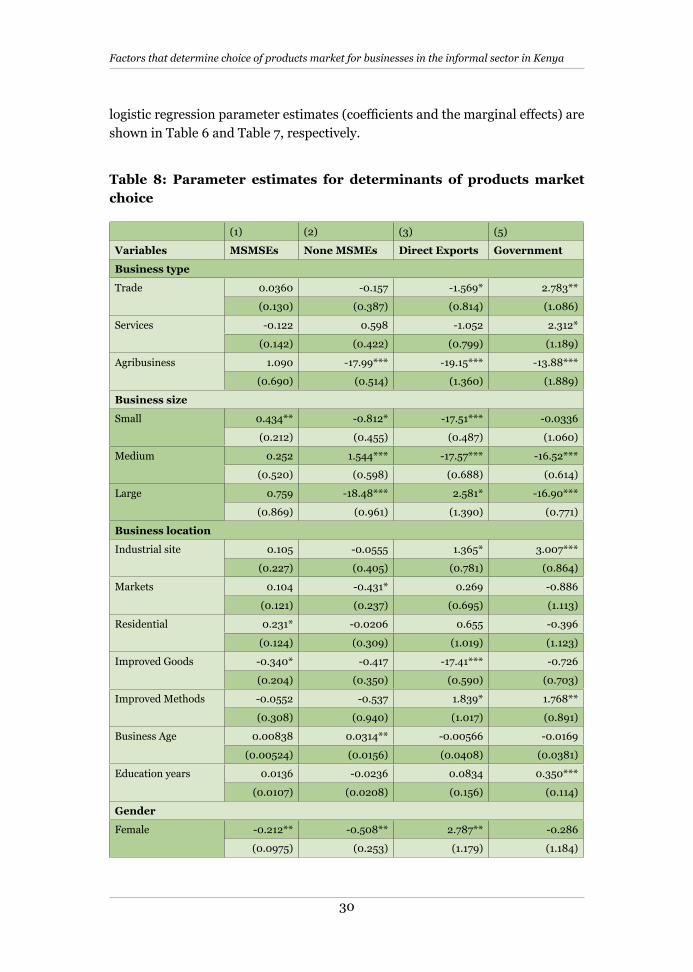
From the MNL model estimation, the McFadden R2 (Pseudo R2) was 0.0275 and the likelihood ratio was 339091.2 with 80 degrees of freedom. A small P value of 0.0000 was reported, which means the model fits the data well. The multinomial
Methodology
30
Factors that determine choice of products market for businesses in the informal sector in Kenya
logistic regression parameter estimates (coefficients and the marginal effects) are shown in Table 6 and Table 7, respectively.
Table 8: Parameter estimates for determinants of products market choice
(1) (2) (3) (5)
Variables MSMSEs None MSMEs Direct Exports Government
Business type
Trade 0.0360 -0.157 -1.569* 2.783**
(0.130) (0.387) (0.814) (1.086)
Services -0.122 0.598 -1.052 2.312*
(0.142) (0.422) (0.799) (1.189)
Agribusiness 1.090 -17.99*** -19.15*** -13.88***
(0.690) (0.514) (1.360) (1.889)
Business size
Small 0.434** -0.812* -17.51*** -0.0336
(0.212) (0.455) (0.487) (1.060)
Medium 0.252 1.544*** -17.57*** -16.52***
(0.520) (0.598) (0.688) (0.614)
Large 0.759 -18.48*** 2.581* -16.90***
(0.869) (0.961) (1.390) (0.771)
Business location
Industrial site 0.105 -0.0555 1.365* 3.007***
(0.227) (0.405) (0.781) (0.864)
Markets 0.104 -0.431* 0.269 -0.886
(0.121) (0.237) (0.695) (1.113)
Residential 0.231* -0.0206 0.655 -0.396
(0.124) (0.309) (1.019) (1.123)
Improved Goods -0.340* -0.417 -17.41*** -0.726
(0.204) (0.350) (0.590) (0.703)
Improved Methods -0.0552 -0.537 1.839* 1.768**
(0.308) (0.940) (1.017) (0.891)
Business Age 0.00838 0.0314** -0.00566 -0.0169
(0.00524) (0.0156) (0.0408) (0.0381)
Education years 0.0136 -0.0236 0.0834 0.350***
(0.0107) (0.0208) (0.156) (0.114)
Gender
Female -0.212** -0.508** 2.787** -0.286
(0.0975) (0.253) (1.179) (1.184)

31
Male-Female -0.491*** -0.124 2.528** 1.682*
(0.114) (0.243) (1.081) (0.932)
Skills Training -0.177* -0.195 1.105 0.652
(0.0981) (0.233) (0.861) (0.601)
Electric Operated 0.258*** -0.207 -1.378* 0.732
(0.0982) (0.209) (0.750) (1.056)
Mobile Phone -0.253*** -0.490** 0.576 -2.256***
(0.0881) (0.215) (0.662) (0.636)
Contractual agreement
-0.219** -0.552** -0.0460 -1.198
(0.0895) (0.237) (0.583) (1.199)
Constant -2.587*** -3.911*** -9.744*** -15.44***
(0.205) (0.480) (2.696) (3.143)
Observations 14,538 14,538 14,538 14,538
Robust standard errors in parentheses
*** p<0.01, ** p<0.05, * p<0.1
LR Chi2(80)=12092.99 Prob>chi2=0.0000
Pseudo R2=0.0275
Log likelihood=-339091.2
Individual consumers used as base
Table 9: Marginal effects from multinomial logistic regression estimates
MSME Non-MSME Direct exports Government
Margins Pvalues Margins Pvalues Margins Pvalues Margins Pvalues
Business characteristics
Business Type
Trade 0.002668 0.771 -0.00122 0.696 -0.00128 0.099* 0.001026 0.014**
Services -0.00862 0.372 0.006806 0.108 -0.00105 0.158 0.000624 0.059*
Agri-Business 0.120843 0.254 -0.00836 0.005*** -0.00163 0.026** -7E-05 0.341
Business Size
small (10-49 employees) 0.036405 0.075*3 -0.00527 0.009*** -0.00054 0.003*** -5.5E-05 0.948
medium (50-99 employees)
0.016144 0.704 0.030813 0.163 -0.00054 0.003*** -0.00087 0.001***
large (100+ employees) 0.072217 0.5 -0.00923 0.000*** 0.005813 0.452 -0.00087 0.001***
Business Location
Industrial site 0.006269 0.701 -0.00072 0.84 0.001237 0.255 0.012751 0.117
Market 0.007635 0.384 -0.0034 0.045** 0.000134 0.708 -0.00047 0.32
Residential 0.017097 0.08* -0.00039 0.892 0.000394 0.604 -0.00027 0.674
Revenue 3.82E-08 0.045** 1.17E-08 0.002*** 3.30E-10 0.561 4.83E-10 0.631
Methodology

32
Factors that determine choice of products market for businesses in the informal sector in Kenya
Business Age 0.000562 0.125 0.000272 0.063* -3.49E-06 0.874 -1.5E-05 0.654
Improved Goods -0.02262 0.111 -0.00336 0.286 -0.00949 0.003*** -0.00057 0.368
Improved Methods -0.00364 0.865 -0.00475 0.569 0.001006 0.073* 0.0015 0.081*
Entrepreneur characteristics
Education Years 0.000937 0.211 -0.00022 0.226 4.49E-05 0.609 0.000295 0.038**
Gender
Female -0.01522 0.029** -0.00403 0.043** 0.000989 0.061* -0.00011 0.825
Male-female -0.03224 0.000*** -0.00088 0.711 0.00076 0.043** 0.002023 0.063*
Skills Training -0.0123 0.073* -0.00161 0.444 0.00061 0.258 0.000563 0.263
Microeconomic characteristics
Electric operated machine
0.018135 0.008*** -0.00203 0.256 -0.00076 0.096* 0.000604 0.477
Mobile Phone -0.01714 0.005*** -0.00414 0.033** 0.000327 0.374 -0.00189 0.03**
Contractual agreement -0.01476 0.018** -0.00472 0.025** -1.4E-05 0.964 -0.00099 0.307
***,**,* Signficance levels at 1%, 5%, 10% respectively
Dy/dx is the discrete change from 0 to 1for a dummy variable
From the model in Table 8 and 9, the parameter estimates that significantly affected either positively or negatively the choice of a buyer included: business characteristics (type of business, size of business, location of the business, revenue, age of the business and improvement of the goods and services), entrepreneur characteristics (gender, education and skills development of the entrepreneur) and microeconomic characteristics (contractual agreement, access to market information and technology).
5.6.1 Business characteristics
Informal businesses engagement in trade and services relative to manufacturing significantly increases the probability of accessing government opportunities compared to individual customers. This possibly means that informal businesses are not directly engaged by government to supply locally manufactured goods, but rather they play a role in the value chains such as supply of contracting services such as mechanical building services, plumbing and car repairs. This may be the reason following the prerequisite conditions including business registration and holding of business licenses that are required prior to accessing such government opportunities. Being in agribusiness relative to manufacturing significantly reduces the probability of selling to non-MSMEs (large establishments) and direct exports compared to individual consumers. This is possibly because informal sector agribusiness is rudimentary artesian with little development and use of technology. The products are meagre and sold to final consumers who purchase in small scales.

33
Being a small business relative to a micro- business significantly increases the chance of selling to MSMEs compared to individual consumers. This is expected that as business grows it tends to move towards relatively bigger markets. Interestingly, the empirical results show that being small, medium and large relative to being micro significantly reduces the chance of selling to large establishments (non-MSMEs), export markets and access to government opportunities compared to individual consumers. This is contrary to expectation, and is an indicator of limited growth and tendencies to remain very small and in the confines of informality. This could possibly be because of personalized clientele relationships built over the years and, therefore, preference for individual consumers.
Having the business located in a market place relative to a commercial premise significantly reduces the chance of selling to non-MSMEs compared to individual consumers. This is as expected and possibly because of the strategic location where there is a large flow of people in the market place, and therefore easy accessibility of the business by individual consumers, and with minimal marketing costs. In contrast, having a business located in the residential area relative to commercial premise significantly increases the probability of selling to MSMEs compared to individual consumers. This is possibly the case because as much as the business costs in terms of rent are low, accessibility by individual consumers is hindered and therefore the business owner must invest a bit in looking for a market where regular supply is needed and in bigger volumes, hence MSMEs.
As the revenue among informal businesses increase, there is a significantly higher probability of selling to MSMEs and non-MSMEs relative to individual consumers. This is possibly because enterprises with higher revenue lead to business growth and the firm can differentiate its goods and services, and influence the price it charges and choose a market that yields high profits and buys in bulk. MSMEs and large establishments (Non-MSMEs) have a tendency of buying higher volumes of products, thus explaining why revenue increases significantly for informal enterprises that sell their products to these market segments.
As the age of an informal business increases, the probability of selling to non-MSMEs significantly increases relative to individual consumers. This is because as the firms age, they mature and learn by doing, create networks with other firms and strengthen customer relationships. They possibly choose non-MSMEs as their product market because of their larger order volumes, which increases their production.
Informal businesses investing in the improvement of their products and goods significantly reduce the probability of selling to export markets relative to individual consumers. Similarly, businesses investing in improving production methods significantly increase chances of selling to export markets and accessing
Methodology

34
Factors that determine choice of products market for businesses in the informal sector in Kenya
government opportunities compared to individual consumers. Product innovation has a significant impact on firms’ performance and acts as a mediator between quality and growth. Product improvements leads to high quality products, which increases customer satisfaction leading to customer loyalty and retention. Satisfied customers frequently speak of the quality products to friends and relatives who then become new customers, thus increasing sales to individual consumers.
5.6.2 Entrepreneur characteristics
For every one-year increase in education of the entrepreneur, an informal business significantly increases chances of accessing government opportunities relative to individual consumers. This is possibly because government as a market is demanding, and the stipulated specifications that the products need to meet to be accepted. Education equips entrepreneurs with both technical and business knowledge. With increased level of entrepreneur’s education, better management skills are applied in business operations, which results to production of quality products that meet specifications of the market (Martin, 2016). The quality of products coupled with bulk production and ability to understand the requirements when accessing government opportunities also makes it easy (Mamman, 2007).
Having a female-owned business relative to male-owned business significantly reduces the probability of selling to MSMEs and non-MSMEs compared to individual consumers, but significantly increases the chances of selling to export markets. Businesses with a male-female partnership relative to male-owned businesses significantly reduce the chance of selling to MSMEs compared to individual consumers but increases chances of selling to export markets and access to government opportunities relative to individual consumers. This is because women do not necessarily enter into business for financial gain or market expansion, but to mainly pursue intrinsic goals such as independence, social capital, flexibility to interface family and commitments, thus measuring their success in line with these achievements rather than market expansion and economic gains (Williams and Yousef, 2013). Similarly, access to export markets by female-owned informal businesses could also be an indicator of the line of business such as handicrafts and bead works, which do not necessarily demand business registration especially if the engagement is sub-contracting the products to be exported.
A business owners’ investment in skills training significantly reduces chances of selling to MSMEs compared to individual consumers. This is contrary to expectation. However, additional skills development leads to high competency and efficiency, thus producing high quality products. This would possibly lead to

35
customer satisfaction leading to more individual consumer referrals.
5.6.3 Microeconomic characteristics
Informal businesses owning a mobile phone (proxied as a source of information) significantly increase the probability of selling to individual consumers as opposed to MSMEs, non-MSMEs and government. This is possibly because of the ease with which informal business can reach to the individual consumer especially in one on one marketing through phone calls and text messages (Boateng, 2011; Jagun, 2008). Social networks and use of social media through the phone have become widespread and make it easier to reach individual consumers.
Having a contractual agreement significantly reduces the probability of selling to MSMEs and non-MSMEs relative to individual consumers. This is possibly because informal businesses do not want to incur extra transaction costs in form of contract enforcement costs. Informal businesses are small in scale and therefore chances of meeting contract requirements in terms of produce volume may be limiting. Informal businesses in Kenya are not engaged in primary production but rather trade intermediary goods and offer services which may be less restrictive, and businesses can enter and exit the market freely.
Technology use in a business as proxied by having an electrically operated machine significantly increases chances of selling to MSMEs compared to individual consumers, but significantly reduces chances of selling to export markets compared to individual consumers. Ability to access MSMEs when technology is accessed is an expected outcome, as there is increased productivity, efficiency and quality of products (Kabecha, 1998). However, inability to access export markets though technology is accessed may indicate possibility of a sub-contracted business (Hairuddin et al., 2012).
Methodology

36
Factors that determine choice of products market for businesses in the informal sector in Kenya
6. Conclusions and Recommendations
6.1 Conclusions
This paper attempted to answer a question on what factors determine choice of products market in informal businesses in Kenya with an aim of establishing how informally operated businesses in Kenya choose their product markets. The choice was made among five product market alternatives, including individual consumers, government, MSMEs, non-MSMEs and direct exports. In conclusion, business, entrepreneur and microeconomic characteristics influence the decision on where informal businesses in Kenya sell their products. These include type of business, size of business, revenue, age of the business, products improvement and the location of the business. Education level, gender of the entrepreneur, and skills training also influenced the decision on the choice of a product market. Access to information, proxied by mobile phone ownership, contractual arrangements, and technology proxied by use of electrically-operated machines had significant influence on the choice of a product market.
Businesses engaging in trade and services sector of the economy, unlike manufacturing, were able to access government opportunities. This is an indicator of lack of adequate resources by informal business to manufacture quality and competitive products. Preference for individual consumers is noted among informal businesses in agri-business sector, which shows little value addition of agricultural products and possibly the low production volumes that cannot satisfy wider markets. As the businesses grow larger, preference towards individual consumers is noted. While this is against the expectation, it serves as an indicator of limited growth and tendencies for businesses to remain in the confines of informality. The market place is seen to be a strategic location in terms of access to a large flow of customers, unlike those in the residential areas who possibly incur an extra cost in marketing strategies. Increased business revenue leads to business growth and creates a chance for access to wider markets, including large establishments. Businesses investing in improvement of products and methods of production meet the expectations of clients in terms of quality.
Education of the entrepreneur plays a key role in access to wider markets, including government opportunities. As an entrepreneur increases their level of education, wider markets are chosen. Gender of the entrepreneur determines the market choice. Female-owned businesses tend to have a limited scope and mostly access individual customers as the main buyers of their products. This indicates that women do not necessarily engage in business with growth and expansion as the main objective, but rather because of the need to be independent and create space for running a household without too much restrictions. For most women, time

37
spent on businesses is also limited as they gamble between taking care of families and running the business. Access to other markets such as as non-MMSEs and government requires extra commitment and resources, which are likely not to be available for women.
Access to market information proxied by presence of a mobile phone in the business setup is key. Empirical evidence shows that informal businesses owning a mobile phone are more likely to reach individual consumers as opposed to large establishments. The mobile phone is also a source of market information. This serves as an indicator to the increased adoption and acceptance of ICT in all spectrums of businesses, whether formal or informal. From the preference of contractual arrangements with individual consumers as opposed to MSMEs and large establishments, there is a clear indicator on the limitation of marketing strategies by businesses operating in the informal sector. This is possibly because of lack of the necessary requirements when engaging in a contact, or the need to lie low and avoid discovery by the authorities, especially tax authorities.
6.2 Recommendations
To enhance an informal business decision in choice of product market among the five alternatives, the government in its procurement processes should put more emphasis on promotion of locally manufactured products in Kenya. While there are prerequisite conditions to be met, most of which informal businesses do not have, the government should reduce red tape as the move may encourage more compliance with the prerequisite conditions. Businesses in the agri-business sector should be provided with support in value addition techniques and in strategies such as groups and cooperatives formation to increase the volume of produce and at the same time increase the bargaining power when accessing wider markets.
Emphasis should be placed on the need to change informal businesses mindset towards that of business growth and expansion as the size of business increases. This can be done through continuous training of informal businesses on strategies leading to business expansion and growth. Bodies such as Micro and Small Enterprises Authority (MSEA) need to be put to task in delivering the set mandate on training small businesses on issues such as importance of contractual arrangements, business record keeping, improvement in products and methods of production and increased investments through borrowing of credit for business expansion.
Market places provide strategic locations for informally operated businesses. To widen the products market scope, infrastructure such as market stalls and
Conclusions and recommendations
38
Factors that determine choice of products market for businesses in the informal sector in Kenya
designated selling points within markets should be provided and constantly maintained. This will enhance the business environment within which informal businesses operate, leading to growth and access to even more and wider markets.
Education and continuous skills development is crucial for entrepreneurs in informally-operated businesses. Policies should target increasing educational capacities of the entrepreneurs. For example, in the school’s curriculum, entrepreneurship and business-oriented classes should be introduced early to learners. This will ensure that nurturing and harnessing such skills is done at an early age. Similarly, policies should not only emphasize on vocational and technical skills such as artisanal skills, but should include managerial and marketing skills and strategies that can be employed. As much as price posting may not be the first choice as a marketing strategy, use of ICT including internet should be provided.
As much as women are engaged with family responsibilities and other intrinsic goals such as socialization, women empowerment should be emphasized. There is need for policy and programme actions that improve women’s access to scarce resources and valued resources of the societies, such as land, which they can use as collaterals to acquire financing of businesses. This will lead to growth of the businesses and thereby ability to access wider markets.
Therefore, there is need to encourage use of mobile phones in businesses both as a means of accessing information and reaching out to clients. Mobile phone through texting and calling, and social media make it very easy to reach a wider network of consumers. There is need to make use of mobile phones affordable to these cadre of businesses. This is through lowered tariffs and taxes imposed on data usage in the telephony industry, to encourage more use of the mobile phone in doing business among informal businesses.
39
References
AGPO (2019), Access to government procurement opportunities. Retrieved 19 February 2019 from https://agpo.go.ke/pages/about-agpo
Anbarci, N., Gomis-Porqueras, P. and Marcus, P. (2012), Formal and informal markets: A strategic and evolutionary perspective.
Banerji, A. and Jain, S. (2007), “Quality dualism”, Journal of Development Economics, 84(1): 234-250.
Bangasser, P. E. (2000), The ILO and the informal sector: An institutional history. Geneva: ILO.
Barrientos, A. and Barrientos, S. W. (2002), Extending social protection to informal workers in the horticulture global value chain (Vol. 216). Social protection discussion paper.
Beck, T., Lu, L. and Yang, R. (2015), “Finance and growth for microenterprises: evidence from rural China”, World Development, 67: 38-56.
Becker, K. F. (2004), The informal economy: Fact finding study, Vol. 76. Stockholm: SIDA.
Boateng, R. (2011), “Mobile phones and micro-trading activities–conceptualizing the link”, info, 13(5): 48-62.
Bohme, M. and Thiele, R. (2011), Is the informal sector constrained from the demand side? Evidence for six West African capitals. World Bank.
Bowen, M., Morara, M. and Mureithi, M. (2009), “Management of business challenges among small and micro enterprises in Nairobi-Kenya”, KCA Journal of Business Management, 2(1).
Chen, M. A. (2012), The informal economy: Definitions, theories and policies, Vol. 1, No. 26: 0141-4). WIEGO Working Paper.
Del Cid, M. (2003), Decent work and the informal economy in Central America. Available at SSRN 907437.
Ehebrecht, D., Heinrichs, D. and Lenz, B. (2018), “Motorcycle-taxis in Sub-Saharan Africa: Current knowledge, implications for the debate on ‘informal’ transport and research needs”, Journal of Transport Geography, 69: 242-256.
Gobena, G. K. and Amare, T. J. (2016), Access to market and growth of micro and small scale enterprises in Ethiopia: Evidence from Wolaita and Dawro Zones, Southern Ethiopia.
40
Factors that determine choice of products market for businesses in the informal sector in Kenya
Greene, W. H. (2003), Econometric analysis. Pearson Education India.
Gulyani, S. and Talukdar, D. (2010), “Inside informality: The links between poverty, microenterprises, and living conditions in Nairobi’s slums”, World Development, 38(12): 1710-1726.
Hairuddin, H., Noor, N. L. M. and Ab Malik, A. M. (2012), “Why do microenterprise refuse to use information technology: A case of batik microenterprises in Malaysia”, Procedia-Social and Behavioral Sciences, 57: 494-502.
Jagun, A., Heeks, R. and Whalley, J. L. (2008), “The impact of mobile telephony on developing country micro-enterprises: A Nigerian case study”, Information Technology and International Development, 4(4): 47-65.
Jagongo, A. and Kinyua, C. (2013), “The social media and entrepreneurship growth”, International Journal of Humanities and Social Science, 3(10): 213-227.
Magambo, E. N. (2015), “Factors affecting growth of SMEs: A case of jua kali motor garages in ShauriMoyo, Nairobi, City County”, Strategic Journal of Business and Change Management, 2(2), 1.
Maloney, W. F. and Saavedra-Chanduvi, J. (2007), “The informal sector: What is it, why do we care, and how do we measure it”, Informality: Exit and Exclusion, 21-42.
Mamman, A., Elridge, D. and Branine, M. (2007), “Skills need of SMEs and the informal sector in Africa: Problems prospects of employment creation in Nigeria”, Scientific Journal of Administrative Development, 1(5): 145-1777.
Martin, R. U. and Alejandro, M. (2016), “The role of education and learning by experience in the performance of microenterprises”, Procedia-Social and Behavioral Sciences, 228: 523-528.
Nguyen, N., Gan, C. and Hu, B. (2015), An empirical analysis of credit accessibility of small and medium sized enterprises in Vietnam.
Kar, S. P. and Jacobson, M. G. (2012), “NTFP income contribution to household economy and related socio-economic factors: Lessons from Bangladesh”, Forest Policy and Economics, 14(1): 136-142.
Kenya National Bureau of Statistics (2018), Economic Survey. Nairobi: Government Printer.
Kenya National Bureau of Statistics (2016), Micro, Small and Medium Establishments. Basic Report 2016. Nairobi: Government Printer.
41
Kotler, P. (1999), “Political marketing: Generating effective candidates, Campaigns, and Causes”, In Handbook of political marketing. Sage Publications.
Kyomugisha, H., Sebatta, C. and Mugisha, J. (2018), “Potato market access, marketing efficiency and on-farm value addition in Uganda”, Scientific African, 1, e00013.
Liedholm, C. E. and Mead, D. C. (2013), Small enterprises and economic development: The dynamics of micro and small enterprises. Routledge.
List, J. A. (2004), “Neoclassical theory versus prospect theory: Evidence from the marketplace”, Econometrica, 72(2): 615-625.
Lubaale, G. and Nyang’oro, O. (2013), Informal economy monitoring study: Street vendors in Nakuru, Kenya. Manchester, United Kingdom: Women in informal employment: Globalizing and organizing.
Ministry of Trade Kenya (2017), Buy Kenya Build Kenya Strategy.
Portes, A. and Haller, W. J. (2004), La economía informal. Cepal.
Rothenberg, A. D., Gaduh, A., Burger, N. E., Chazali, C., Tjandraningsih, I., Radikun, R. and Weilant, S. (2016), “Rethinking Indonesia’s informal sector”, World Development, 80: 96-113.
Salomon, R. and Shaver, J. M. (2005), “Export and domestic sales: Their interrelationship and determinants”, Strategic Management Journal, 26(9): 855-871.
Thai, M. T. T. and Turkina, E. (2014), “Macro-level determinants of formal entrepreneurship versus informal entrepreneurship”, Journal of Business Venturing, 29(4): 490-510.
Train, K. (2003), Mixed logit. Discrete choice methods with simulation, 139-154.
UNDP (2015), Micro, Small and Medium Enterprises (MSMEs) as suppliers to the extractive industry, (January), 1-72
USAID and PPOA (2009), Manual for Procurement and Management of Project, (June), 26-28.
Van Biesebroeck, J. (2005), “Exporting raises productivity in Sub-Saharan African manufacturing firms”, Journal of International Economics, 67(2): 373-391.
van Raaij, E. M., Stoelhorst, J. W. and van Engelen, J. M. L. (2002), Interaction between business and academia in marketing research: The issue of obtaining access to organizational reality.
References

42
Factors that determine choice of products market for businesses in the informal sector in Kenya
wa Kabecha, W. (1998), “Technological capability of the micro-enterprises in Kenya’s informal sector”, Technovation, 19(2): 117-126.
Williamson, O. E. (1993), “Transaction cost economics and organization theory”, Industrial and Corporate Change, 2(2): 107-156.
Williams, C. C. and Youssef, Y. (2013), “Evaluating the gender variations in informal sector entrepreneurship: Some lessons from Brazil”, Journal of Developmental Entrepreneurship, 18(01): 1350004.
Zott, C. and Amit, R. (2008), “The fit between product market strategy and business model: Implications for firm performance”, Strategic Management Journal, 29(1), 1-26.