Embed Size (px)
Citation preview
FACTORS INFLUENCING THE CHOICE OF PRODUCT
DISTRIBUTION CHANNELS FOR SMALL-SCALE MANUFACTURING
FIRMS: A CASE OF THIKA TOWN
By
Pius Kamau Ng’ang’a
/ i Almost)
UNIVERSITY OF NAIROBI LIBRARV
P. O. Box 30197 NAIROBI
A MANAGEMENT PROJECT SUBMITTED IN PARTIAL
FULFILLMENT OF THE REQUIREMENTS OF THE DEGREE OF
MASTER OF BUSINESS AND ADMINISTRATION
FACULTY OF COMMERCE
UNIVERSITY OF NAIROBI
JULY, 2000

DECLARATION
This management project is my original work and has not been presented for a degree in any other university.
Date,6 fu
This management project has been submitted for examination with my approval
Dr. Raymond M. Musyoka
Department of Business Administration
University of Nairobi

DEDICATION
To
my dear parents
Mr. Peter Ng’ang’a Kamau
and
Mrs. Felista Wangui
for their love for education
and
To
my brothers and sister
Sam, Ndungu, Rose and Githuku
for being a great source of
encouragement.
TABLE OF CONTENTS
TABLE OF CONTENTS
LIST OF TABLES
LIST OF ABBREVIATIONS
ACKNOWLEDGEMENT
ABSTRACT
CHAPTER ONE: INTRODUCTION PAGE
1.1 Background..................................................................................... 1
1.2 Significance of Small-Scale Enterprises.......................................... 3
1.3 Distribution Channels: An Overview.................................................. 4
1.4 Research Problem............................................................................ 5
1.4.1 Research Setting..................................................................... 7
1.5 Objectives of the Study..................................................................... 8
1.6 Importance of the Study..................................................................... 8
1.7 Definition of Working Concepts........................................................... 9
1.8 Overview of the Report........................................................................ 11
CHAPTER TWO: LITERATURE REVIEW
2.1 Introduction........................................................................................ 13
2.2 Empirical Literature............................................................................ 14
2.3 Distribution Channel Selection Process................................................ 17
2.4 Factors Influencing the Choice of Distribution Channels...................... 19
CHAPTER THREE: METHODOLOGY
3.1 Research Design.........................,r.................................................. . 24
i
3.2 Population................................................................................................^
3.3 Sampling Plan...................................................................................... 25
3.4 Data Collection Methods................................................................... 26
3.5 Data Analysis Methods....................................................................... 27
CHAPTER FOUR - DATA ANALYSIS AND FINDINGS
4.1 Profile of Respondents....................................................................... 29
4.2 Small-Scale Firm Characteristics........................................................ 32
4.3 Factors Influencing the Choice of Product
Distribution Channels................................................................... 36
4.4 Relative Importance of Various Factors in Selecting
Product Distribution Channels................................................. 39
4.5 Results of the Chi-Square Analysis of Association.................... 40
CHAPTER FIVE: SUMMARY AND POLICY RECOMMENDATIONS
5.1 Summary.............................. 43
5.2 Policy Implications ................................................................... 49
5.3 Limitations of the Study....................................................................... 52
5.4 Suggestions for Further Research.............................................. 53
BIBLIOGRAPHY...................................................................................... 54
APPENDICES
Appendix I : Cover Letter............................................................. 58
Appendix II : Questionnaire............................................................ 59
Appendix III : Relative Importance of Various Factors

in Selection of Distribution Channels............ 65
Appendix IV : Description of Chi-Square Technique used... 68
Appendix V : Calculation of the Chi-Square Test of
Association................................................. 71
LIST OF TABLES
PAGE
Table 1 : Sequence of Decisions to Design a Distribution Channel.......... 19
Table 2 : Distribution of Respondents According to Title Held in the Firms... 30
Table 3 : Distrbution of Respondents by Gender and Sub-Sector.......... 30
Table 4 : Respondents by Formal Education Attainment.............................. 31
Table 5 : Distribution of Respondents by Business Training.......................... 31
Table 6 : Firms Length of Time in Business by Sub-sector............................ 32
Table 7 : Mean Number of Employees by Sub-sector.................................. 33
Table 8 : Distribution of Firms by Ownership and Subsector........ 33
Table 9 : Distribution of Firms by Width of the Product Line...... 34
Table 10 : Distribution of Firms by the Market Coverage of their Products.... 35
Table 11 : Firms Strength of Financial Resources by Sub-sector................. 35
Table 12 . Impact of Current Economic Condition on Distribution Operation by
Sub-sector................................................................................... 36
Table 13 : Distribution Channels used by Firms by Sub-sector..................... 37
Table 14 : Factors Influencing the Choice of Product Distribution Channels.. 38
Table 15 : Relative Importance of Various Factors in Selection of Distribution
Channels.................................................................................. 39
Table 16 : Relative Importance of Various Factors in Selection of Distribution
Channels for the Metalwork Sub-Sector.................................... 65
Table 17 : Relative Importance of Various Factors in Selection of Distribution
Channels for the Woodwork Sub-Sector.................................... 66
Table 18 : Relative Importance of Various Factors in Selection of Distribution
Channels for the Leatherwork Subs-Sector................................. 67
IV

LIST OF ABBREVIATIONS
G.O.K. - Government of Kenya
I.L.O - International Labor Organization
K-REP - Kenya Rural Enterprise Program
SSE - Small-Scale Enterprises
SME - Small-Micro-Enterprises
UNDP United Nations Development Program

ACKNOWLEDGEMENT
I am greatly indebted to many people who assisted me in various ways in order to
complete my study.
My first gratitude goes to my supervisor, Dr. Raymond M. Musyoka who
dedicated a lot of his time and efforts to my work. This undertaking would not have
been possible without his sincere comments, advice, criticism and suggestions. I am
also grateful to Professor Francis N. Kibera, Principal College of Humanities and
Social Sciences, together with Mr. Charles N. Kariuki and Mr. Jackson K. Maalu of
the Faculty of Commerce. Their prompt and penetrating reading of my drafts and
accompanying comments helped to improve the quality of this study.
I would also like to thank most sincerely my parents, Mr. Peter N. Kamau and
Mrs. Felista Wangui without whose love, efforts and encouragement I could not have
gone this far in my studies.
There are others whose efforts cannot pass unappreciated who include my
classmates in the M B.A programme, Lee Maiyani, Joseph Lagat and Elias Mbau for
their companionship during the entire study period. I am also grateful to David
Kinyanjui, David Kagori, Peter Njaga, Joseph Murabula and Charles Gitonga for their
invaluable assistance during the various stages of this study. There are also friends
and relatives who wished me well during the course, to them I say thank you.
Lastly and not least, I wish to thank the small-scale entrepreneurs in Thika
Town who participated in this study, for their co-operation and the speed with which
they responded. But above all, I wish to acknowledge the hand of the Lord in what I
did during the period of this course. Finally, though I received all necessary
assistance, it is possible some errors may have occurred. For these, I take full
responsibility.
VI
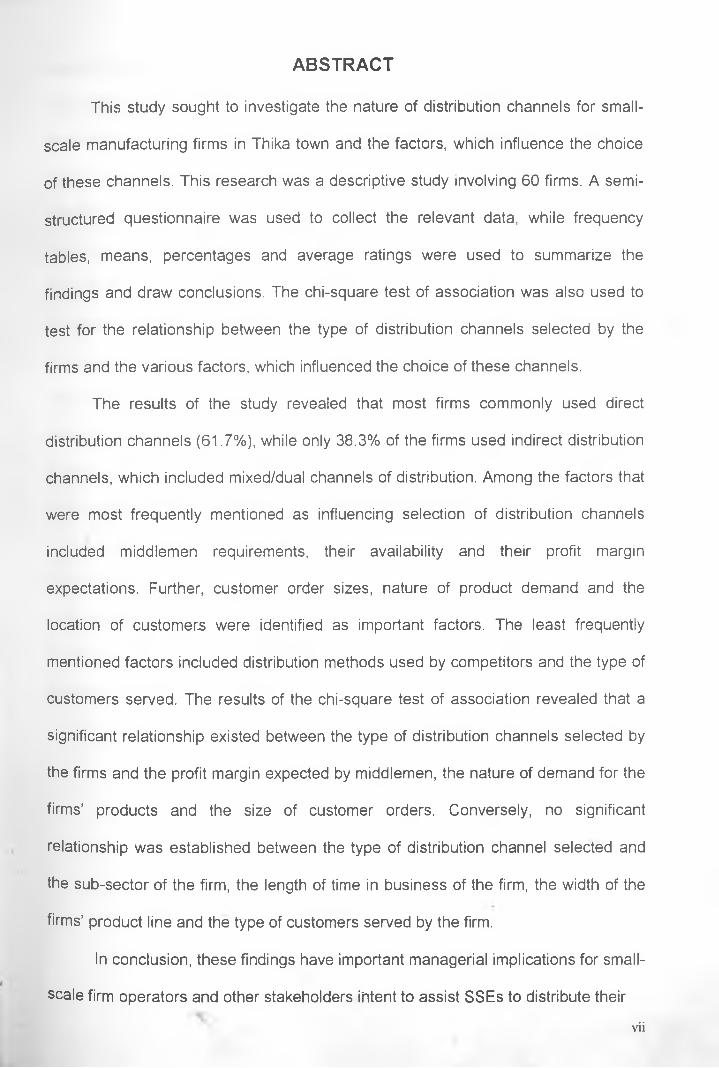
ABSTRACT
This study sought to investigate the nature of distribution channels for small-
scale manufacturing firms in Thika town and the factors, which influence the choice
of these channels. This research was a descriptive study involving 60 firms. A semi-
structured questionnaire was used to collect the relevant data, while frequency
tables, means, percentages and average ratings were used to summarize the
findings and draw conclusions. The chi-square test of association was also used to
test for the relationship between the type of distribution channels selected by the
firms and the various factors, which influenced the choice of these channels.
The results of the study revealed that most firms commonly used direct
distribution channels (61.7%), while only 38.3% of the firms used indirect distribution
channels, which included mixed/dual channels of distribution. Among the factors that
were most frequently mentioned as influencing selection of distribution channels
included middlemen requirements, their availability and their profit margin
expectations. Further, customer order sizes, nature of product demand and the
location of customers were identified as important factors. The least frequently
mentioned factors included distribution methods used by competitors and the type of
customers served. The results of the chi-square test of association revealed that a
significant relationship existed between the type of distribution channels selected by
the firms and the profit margin expected by middlemen, the nature of demand for the
firms’ products and the size of customer orders. Conversely, no significant
relationship was established between the type of distribution channel selected and
the sub-sector of the firm, the length of time in business of the firm, the width of the
firms’ product line and the type of customers served by the firm.
In conclusion, these findings have important managerial implications for small-
scale firm operators and other stakeholders intent to assist SSEs to distribute their
vii
products more effectively. One important managerial implication is that there are
high costs to making an incorrect channel decision. This is because once a channel
decision is made, (whether right or wrong) it tends to be reinforced over time as new
products are sold through these established channels. Thus, if the wrong channel is
selected, high costs of changing the channel may face the firm. Therefore, SSEs will
need to carefully consider the factors, which have been identified as influencing
channel selection decisions in their attempts to make decisions regarding the
distribution of their products^ For instance, this study has revealed that the existence
of demand for relatively small and large order sizes in served markets for SSEs may
justify the selection of alternative channels for the same market as a strategic
product distribution option. In essence therefore, if end customers are willing to buy
in large quantities, the firms should aim at serving them directly. Otherwise, it would
be more economical to serve them through channel intermediaries.
Finally in terms of public policy, it is recommended that the Government of
Kenya develops low-cost and affordable business training programs to equip small-
scale operators with the knowledge and skills to make optimal decisions regarding
the distribution of their products and on how to chose and retain the right
intermediaries for their products.
viii
CHAPTER ONE - INTRODUCTION
1.1 Background
The first problem to overcome in any study of small-scale enterprises is one of
definition (Glaser, 1989 and Maalu, 1990). However, at present there is no
universally acceptable definition of a small firm (Scarborough and Zimmerer, 1991).
The definitions used will differ according to the type of study one is carrying out or
the size of the economy being studied. Ombok (1990), observes that, the point under
which an enterprise is deemed to be small and the way in which its size is measured
has been a debatable subject for a long time. Thus, there is no general consensus
as to the definition of a small enterprise. Ekpenyong (1992), in his study on small
and medium-scale enterprises in Nigeria supports this view. In his definition, he
states that there is no generally accepted definition of a small firm because
classification of businesses into large-scale or small scale is a subjective and
qualitative judgement.
In a report by the Director General, the ILO (1991) defines the informal sector,
which generally encompasses most small-scale enterprises as, “very small-scale
units producing and distributing goods and services and consisting largely of
independent, self-employed producers in urban areas of developing countries. These
enterprises employ mainly family labor and or a few hired workers or apprentices;
which operate with very little capital, or none at all; which utilize a low level of
technology and skills; which therefore operate at low level of productivity. They are
informal in the sense that they are for the most part unregistered and unrecorded in
Official statistics; they tend to have little or no access to organized markets; to credit
institutions, to formal education and training or to many public services and
l
amenities; they are for the most part not recognized, supported or regulated by the
government.”
This definition of the informal sector carries over from an earlier time certain
notions that have been overtaken by events. For instance, it is no longer accurate to
state that this sector continues to be “unrecorded in official statistics or unrecognized
by the government.” However, as a conceptual definition of the informal sector, it
does on the whole clarify our understanding of the sector as we see it in Kenya to
day.
According to the G.O.K, ILO / UNDP Center Project (1989), the definition of
small-scale enterprises includes all enterprises consisting of 0-50 employees. This
definition includes all small-scale sectors, which comprise the following subsections:
(i) A survival subsection comprising of the “poorest of the poor” engaged in
economic activities of the last resort, whose returns are extremely low.
(ii) A micro-enterprise subsection made up of firms with up to ten workers using
traditional technologies and serving local markets. These firms are to be
found in the rural and urban areas and they account for the major part of
employment in retailing, services and transportation business.
(iii) A small scale enterprise subsection comprising of large firms having 10-50
workers. The share in employment of this sub-section is smaller than that of
micro-enterprises though the firms in it are more efficient.
Ndua and Ngethe (1984), in their study of Education, Training and Welfare in
the informal sector, define small enterprises as those firms comprising of nine and
less workers including the owner. This definition is in keeping with recent trends in
the definition of small enterprises where only one criterion is taken as the entry point
and then the other characteristics of the sector are built into the enterprises as the
research proceeds. Their definition has been adopted with slight modification in this2
study. Thus, for the purpose of this research, small-scale firms are defined as those
production units (manufacturing) which transform raw material to a product used by
the customers or other industries and employ less than 10 people.
1.2 Significance of Small-Scale Enterprises
Small enterprises have for a long time captured the attention of scholars,
organizations and governments worldwide. In developing countries, these
enterprises have increasingly been the focus of development support programs,
especially because of their employment creation potential (House, 1978). In Kenya,
the primary role of small-scale enterprises in generating employment opportunities
and strengthening the economy has been presented in Sessional Paper No. 1 of
1986 on “Economic Management for Renewed Growth”. According to this blueprint,
three broad goals are envisaged for such enterprises, provision of goods and
services for the domestic market; rapid job creation to meet the needs of the growing
labor force and indeginisation of the economy through the development of local
entrepreneurship. Other government publications such as the Sessional Paper No.2
of 1992 on “Small Enterprise and Jua-Kali Development in Kenya” and the eighth
National Development plan (1997-2001) have given prominence to the role of the
informal sector in stimulating national development.
The significance of the informal sector in creation of job opportunities is
demonstrated further in a baseline survey conducted by K-REP in 1993. This survey
revealed that over 910,000 small and micro-enterprises were operating in Kenya and
these had employed over two million people. This survey also pointed out that about
270,000 jobs are created each year by the same sector.
Despite their significance, it is generally recognized that small-scale
enterprises face unique problems, which affect their survival, growth and profitability3
and hence decrease their ability to contribute to sustainable development. Some of
these problems relate to management in general and financial management in
particular; demand, sales and marketing and problems related to inventory
management (Yambo, 1991). One issue that seriously complicates the problem of
small-scale enterprises is ineffective distribution of their products. Thus, lack of
access to wide markets coupled with the perceived low quality of their products
severely inhibits the survival and growth of these enterprises. Although a limited
access to wide markets for their products suggests that small enterprises may use
direct distribution channels, this researcher is not aware of any effort that has been
made to identify the nature of product distribution channels for the informal sector
and the factors influencing the choice of such channels.
1.3 Distribution Channels: An Overview
Kotler (1997) defines distribution channels as sets of institutions, agencies
and establishments through which a product must move from the producer to the
final consumer. According to Stern and El Ansary (1992), distribution channels
perform the work of moving goods from producers to consumers. Thus, they help
overcome the time, place and possession gaps that separate goods and services
from those who need or want them.
Baker (1992) contends with this view by asserting that distribution channels
provide a link between production and consumption by filling any gap or
discontinuity, which exists between them. Discontinuities between producers and
consumers may arise from a number of causes, namely:
(0 Geographical separation; the application of the theory of comparative
advantage leads to considerable concentration of production both at national
and international scale. At the same time, population and economic growth4'
have resulted in many more widely dispersed consumers wanting access to
these products. Thus, distribution creates utilities in place availability.
(ii) Time; since production and consumption rarely occur simultaneously, with the
exception of personal services, then distribution channels help to even out
fluctuation in supply and demand by holding stocks and through provision of
credit. These activities create time utility.
(iii) Information; the information needs of consumers vary widely and channel
intermediaries can provide a valuable service in advising producers of the
needs of consumers and advising consumers of the specific characteristics of
the offerings of different producers.
(iv) Offering; in addition to making goods physically available, channels also
provide the mechanism whereby transfer of the legal title to ownership may be
accomplished.
Additionally, members of the distribution channel will perform other key
functions like financing and risk taking (Kotler, 1997). In financing, the channel
members facilitate acquisition and allocation of funds required to finance inventories
at different levels of the distribution channel. Risk taking will involve the assumption
of risks connected with carrying out the channel work.\
\1.4 Research Problem * ^
Once a manufacturer has targeted his products to a particular market a
difficult question must be resolved. Should the products be distributed via company
owned distribution channels or is it more efficient to contract distribution to an
independent organization? This is a question of vertical integration in which the
choice is between primary captive agents (company sales force and company
distribution division) or primary independent intermediaries (outside sales agents andP 5
distributors). The former option is an integrated channel, which generally affords the
manufacturer more control than the latter, which is a non-integrated channel
(Anderson and Coughlan, 1987).
This study addressed this problem in the context of small-scale manufacturing
firms. Much research has been conducted on distribution channels and factors
influencing choice of product distribution channels (Stigler, 1951; Aspinwall, 1961;
Bucklin, 1966: Brady, 1978; Calvet 1981; McGuire and Stalin, 1983; Anderson, 1985;
Anderson and Coughlan, 1987 and Shaw and Gibbs, 1996). However, most of these
studies have been conducted in development countries and application of their
findings to small firms in developing countries may require an empirical investigation.
Chege (1996) and Amaa (1997) have conducted studies on the choice of product
distribution channels in a developing country context. These studies have been
based on large-scale industries in Kenya and Tanzania respectively and the
applicability of their findings to small-scale industries needs to be tested.
Yambo (1988), in his study on reconnaissance of Jua-Kali support activities in
Kenya, asserts that, some features of small-scale enterprises completely differ from
those of large-scale enterprises mainly because of the informality of most activities
carried out by these enterprises. There is no bookkeeping for instance and therefore
no auditing. The whole organization may be an adhoc arrangement “rearranged” as
one goes along. In many cases, there are no letters of appointment, job cards,
payslips or warning letters for employees, job titles are also oftenly unclear. It is also
likely that for most firms, there may be no business name, no permanent business
premises, no reliable address and no bank account for the business. Lastly, most
businesses may not be licensed to operate.
Further, literature indicates that insufficient distribution of products from the
small-scale firms inhibits the growth of these enterprises and leads to wastage of6

resources in the form of unsold stock (Ndua and Ng'ethe, 1984). Therefore, if these
enterprises are to graduate into medium and large-scale enterprises they will have to
make accurate decisions concerning the distribution of their products. Esbin (1994)
observes that few small-scale enterprises graduate into medium enterprises.
Accordingly, medium enterprises account for only 1.2 per cent of Kenya’s total
number of firm’s and yet these enterprises are necessary if vertical growth is to be
realized. This situation has oftenly been referred to as the “missing middle’’ which is
said to stunt economic development. It is against this backdrop that this research
sought answers to the question:
What factors influence the choice of product distribution channels for small-scale
manufacturing firms?
1.4.1 Research Setting
Thika town was selected as the focus of the current study. This is because it
is one of the principal towns in Kenya and is one of the designated “growth centres”
within Kenya’s regional - urban development strategy (Kiamba, 1983) This town
houses the headquarters of Thika District and is part of the Municipality division.
Other divisions in the district include; Kakuzi, Gatanga, Gatundu, Ruiru and
Kamwangi. Thika town is conveniently located forty-two kilometers from Nairobi, the
capital city of Kenya. The population of this town is approximately 101,948 persons
according to estimates in the 1997 - 2001 Thika District Development Report.
Further, the town serves as an industrial satellite for Nairobi. As a growth point in the
metropolitan area, it enjoys a natural attraction as an alternative industrial
decentralization to Nairobi. This satellite status has been instrumental in inducing
considerable amount of industrial and commercial activities in the town. It is also
asserted that, /_7
The proximity of Thika to Nairobi gives the former easy access to metropolitan market, skilled labor, commercial and other business services as well as extension of metropolitan infrastructure facilities and services to the town. The function of this town as an “industrial center” accords it “cumulative effect” advantage which gives the town a focal eminence in attracting industrial and commercial activities (Kiamba, 1983).
The economic base of the Municipality revolves around the manufacturing
activities, which account for about 69% of the total wage employment and 70% of the
total earnings of the town. Notably, small and micro-enterprises (SMES) have
become an important source of employment, with over 5000 person engaged by
these enterprises of which 2000 are members of the registered Jua-Kali Associations
(Thika District Development Report, 1997 -2001)
1.5 Objectives of the Study
The objectives of this study were:
1. To determine the factors that affect selection of product distribution channels by
small-scale manufacturing firms.
2. To determine the relative importance of these factors in selection of product
distribution channels.
\
1.6 Importance of the Study
It is hoped that the results of this study will be of help to owners of small-scale firms,
the government, consumers, society in general and other researchers.
1- Small-scale firm operators, seeking to sell their products to the market will, it is
hoped, use the results of this study to improve their performance of distribution
tasks.
8
2. Consumers will gain from a more efficient and effective distribution of products
because the products will hopefully be made available to them on time, at the
right place and possibly in better quality.
3. The government will use the results of the study to design public policy on small-
scale enterprises in order to assist the sector operators access wider markets for
their products.
4. Society will benefit, ideally from an economic point of view. Thus, if small firms
are able to make better decisions and hence more efficient utilization of the
resources at their disposal, such efficiency gains will accrue to society as a
whole.
5. This study will also be a foundation to other researchers interested in pursuing a
study in the same area and especially in the distribution of products from the
informal sector.
1.7 Definition of Working Concepts
1.7.1 Channel of Distribution
This is any entity consisting of a set of related marketing institutions, agencies and
establishments responsible for the physical and title flow of products from the
manufacturer to the consumer or end user (Stern and El Ansary, 1992).
1.7.2 Channel Structure
This refers to the different levels or stages of a channel (e.g., the various stages of a
distribution channel, from a manufacturer to a wholesaler to the final consumer).
Persons or agents handling the product at different stages of the channel are
referred to as channel members (Chege, 1996 and Baker, 1992).
9
1.7.3 Intermediary / Middlemen
This is an individual or business firm that operates between the manufacturer of a
product and the end consumer. These may include wholesalers, retailers, agents
and brokers (Lynn, 1969).
1.7.4 Channel Length
This is used as a shorthand to summarize the characteristics of a given channel
system. The greater the number of intermediaries, the longer the channel.
Conversely, the lesser the number of intermediaries, the shorter the channel (Simon
and Freimer, 1970)
1.7.5 Direct / Integrated Distribution Channel
This is the type of channel in which the firm sells directly to the final consumer,
without using intermediaries (Anderson, 1985).
1.7.6 Indirect / Non-lntegrated Channel
This describes a type of distribution channel in which the firm involves middlemen or
intermediaries in availing its products to final consumers (Anderson and Coughlan,
1987).
1.7.7 End Customer
This phrase refers to an individual, household or firm that buys the product for
incorporation into other products (e.g., individual use) or for consumption (Chege,
1996).
1.7.8 Entrepreneur/Firm Owner
This is an individual who takes the risk of starting and running an own business firm
or enterprise for the principal purpose of making profit and growing in business
(Bwisa, 1998).
10
1.7.9 Small-Scale Enterprise / Firm
In this study, these terms are used to represent any production unit
(Manufacturing) which transforms raw material to a product used by the customers,
or another industry, and employs less than 10 people. In Kenya, the popular
terminology of these enterprises is Jua-Kali, which literally means “hot sun”. This
reflects their beginnings when most of them had no shelter from the sun. This term
has however persisted even when the activities of these enterprises are carried out
in permanent structures.
According to Kibera (1997), majority of small-scale enterprises in Kenya are to
be found in the Informal Sector. This sector covers all semi-organized and
unregulated small-scale activities largely undertaken by the self-employed or those
who employ few workers. It excludes all farming and pastoralist activities. Informal
sector activities are carried out by artisans, traders and other operators under variety
of worksites such as temporary structures, markets, both developed and
undeveloped plots, residential premises or street pavements. This sector uses
simple technology and its main legal feature is that the businesses are not registered
with the registrar of companies. Further, operators of the Informal Sector may or may
not have licenses from relevant authorities for carrying out businesses (Economic
Survey, 1998).
1.8 Overview of the Report
This report is divided into five chapters. The first chapter, the introduction,
gives the background, the significance of small enterprises and an overview of
distribution channels. It also shows the research problem, highlights the research
setting, objectives of the study, importance of the study, definition of working
l i
concepts and an overview of the report. The literature review is contained in chapter
two. It gives an introduction, outlines empirical literature on distribution of products
from the small-scale enterprises, distribution channel selection process and the
factors influencing the choice of distribution channels. Chapter three discusses the
research design, the population, sampling plan, data collection and data analysis
methods. The fourth chapter gives a summary of the data analysis and a discussion
of the findings. This analysis is based entirely on the objectives of the study. Chapter
five presents a summary of the findings, policy implications, limitations of the study
and suggested areas for further research. The last section consists of the references
and appendices.

CHAPTER TWO - LITERATURE REVIEW
2.1 Introduction
Since the publication of the 1972, ILO report on Employment Incomes and
Equity in Kenya, the volume of literature on the informal sector and small enterprises
in the country and the world at large has been growing very fast. Aleke-Dondo
(1993), in his study on the informal sector in Kenya, argues that the attention to small
enterprises has been due to the following reasons:
(i) Employment grew faster in the informal sector than in the formal sector
between 1983 - 1987.
(ii) Goods and services generated by these enterprises have low foreign
exchange content. Mostly local goods are used as raw materials, therefore
they provide market for local produce and supplies, which is relevant to the
government’s efforts to save foreign exchange.
(iii) The sector improves the economic position of women (who own and manage
Micro-enterprises) by providing a source of income for them. Studies also
reveal that most school “drop outs” end up in this sector. Hence, youth and
women welfare is best handled in this policy.
(iv) This sector is pre-dominantly Kenyan-owned and operated. This augurs
well with the policy of Kenyanization of the economy.
(v) The sector also focuses on the strategy of district focus for rural development.
Thus, it ensures equitable development of all regions in Kenya and reduction
of rural-urban migration, which has become a menace.
(vi) This sector is quite dynamic which makes it a proper forum for future
industrialization.
13
i
Despite the abundance of literature on small and micro-enterprises, empirical
literature on the nature of distribution channels for informal sector products and the
factors influencing the choice of these channels is scarce or none at all. The much
scholars do in this area is highlight in passing the type of product distribution
channels used by firms in this sector. Indeed, to the best knowledge of the current
researcher, no attention has been committed to determine the nature of and factors
influencing the choice of product distribution channels for small-scale manufacturing
firms. This chapter reviews empirical literature on distribution of informal sector
products. Additionally, a review is also made of the distribution channel selection
process and the factors influencing channel choice.
2.2 Empirical Literature
Previous research has examined issues related to the nature, functions and
problems of distributing products from the small-scale enterprise sector.
ArapChepkurui (1981), in his study on the marketing of agricultural products in
Kenya, addressed himself to how open-air sellers made decisions regarding the
controllable marketing variables of price, product, place and promotion. His study
found that, decisions on marketing mix variables were very intelligently made. He
also found that roadside selling was the only source of income for the sellers and
that women formed the highest population of both sellers and buyers. ArapChepkurui
also mentioned in passing that the distribution channels used were mainly short.
However, he did not specifically address himself to the choice of product distribution
channels by these sellers.
In her study of rural markets, Muma (1982) found that rural markets played
both economic and social functions. She noted that rural markets were channels
through which products and ideas were changed. She also asserted that the14
distribution role of market places was likely to become even more important in the
future. This was because as urban centers continued to grow, open air as well as
enclosed markets would be built to serve the urban residents. Her findings confirmed
Carson’s (1963) assertion that, while market places diminished with economic
development in the industrialized economies, they tended to increase in importance
in Africa.
Kinsey (1988) summarized the nature of distribution channels in developing
countries by asserting that they are generally long, fragmented and inefficient. There
are a large number of intermediaries supplying an ever-increasing number of small
retailers. Quantities of product offerings are small and inaccurate measures, high
wastage and unsalable stocks in foodstuffs are common. Channels as whole are
labor rather than capital intensive, with numerous stages incorporated. They are
supplied by a large number of widely scattered manufacturers and producers, each
providing a limited output. Poor storage and inadequate transport, coupled with the
absence of other physical distribution support systems do contribute to this
inefficiency. Thus, multinationals in most developing countries tend to develop their
own distribution systems where possible.
In his investigation of the physical distribution problems faced by Nairobi’s
open-air vegetable and fruit sellers, Muiruri (1989) found that, open-air markets were
major channels through which vegetables and fruits reached the city residents.
These markets formed an important link between the farmers and the final
consumers. Moreover, they added time and place utility. They added time utility
because buyers could obtain the products at the time they required them. Place
utility was added because the sellers strategically positioned themselves on busy
streets or at bus stops making it easy for buyers to purchase the products on their
way home from their places of work. Thus, sellers took the products to the buyers.15
Muiruri also found that distribution problems faced by these traders related to
order processing, transportation, inventory management and warehousing. In order
processing, problems cited related to inability to obtain desired quantities from
suppliers and low bargaining power. Transportation problems included, high cost of
transport, goods in transit being seized by city council authorities and non-delivery of
goods by hand cart pullers. In inventory management, traders cited some of the
reasons why they were unable to satisfy customer needs as, seizure of goods by city
council askaris, buying of less quantity than demanded and lack of adequate
supplies. Amongst warehousing problems cited, every seller reported that he or she
sometimes had been unable to sell everything that had been bought. Hence, the
sellers made losses when the unsold products went bad.
Masinde (1996), in her study on small enterprises development through
outsourcing activities of large firms, found that although large manufacturing firms in
Kenya have the potential for vertical de-integration and outsourcing, the Kenyan
business environment provided few incentives for them to do so. In addition, the
perceived weakness of small local suppliers meant that they could not benefit from
such sub-contracting arrangements with bigger firms. Further, the demands for high
quality standards by consumers, influenced perception of lower quality of locally
produced parts and components.
Masinde suggested that small and micro-enterprises development could be
enhanced through sub-contracting activities with big firms. Therefore, the
government would need to improve the economic incentive structure to facilitate this
process. Small enterprises would also have a significant role to play. They would
have to develop their capacity to bargain with large firms in contractual relations
(through improved quality and availability) and with the government through business
associations. Indeed, as Kaplinsky (1991) notes, there exists evidence that various16
forms of clustering and networking are useful frameworks within which small
enterprises can develop considerable bargaining power.
Finally, Kibera (1997) in his paper on marketing strategies for the small
business in Kenya contends that most informal sector producers will mainly use non
shop channels and will normally sell directly to final consumers and end users.
Additionally, Market places especially in rural areas, will also play a major role in the
distribution of both locally produced and imported goods.
2.3 Distribution Channel Selection Process
Distribution channel decisions are among the most critical decisions facing
management. This is because channel choices once made, are often very difficult to
change. According to Kotler (1997), the company’s chosen channels ultimately affect
all other marketing decisions. Baker (1992) supports this view by noting that,
effective distribution is a sine qua non for marketing success. Therefore, before a
firm decides on the type of distribution channel to use, it has to specify the role of
distribution within the marketing mix. The firm must also decide whether distribution
will be used offensively or defensively. Stanton (1994) argues that defensive
distribution involves imitating the place strategies of competition while offensive
distribution strategy will aim at achieving differentiation by using unique distribution
strategies.
A firm will also select either direct or indirect channels of distribution. Chege
(1996) maintains that the firm will face similar choices concerning related distribution
functions such as transportation, advertising and warehousing. If a firm chooses to
distribute its products directly, it has to decide on the type of and number of own
outlets to involve in order to maximize channel output. On the other hand, selection
of an indirect distribution channel requires a decision as to the type and levels of17
intermediaries to involve in the performance of distributive tasks. Thus, the firm must
determine the appropriate intensity of distribution to use; intensive, exclusive or
selective distribution.
Intensive distribution involves the firm’s product being stocked by as many
outlets as possible. That is, any middleman who wants to distribute the product will
be allowed to do so. On the other hand, selective distribution entails a strategy of
using only some of all those potentially available to distribute the product. Finally, the
strategy of exclusive distribution involves getting into an agreement with a particular
middleman whereby the manufacturer gives that particular middleman exclusive right
to market the product in a given market. The middleman on the other hand usually
agrees not to carry any merchandize of competitors(kibera,1988).
Lastly, the firm has to choose specific channel members. It is expected that
different choice decisions will likely lead to different performance outcomes.
Measures of such performance outcomes include market share, profit, and sales
turnover and trade leverage. It is assumed that if a firm fails to achieve desired
outcomes, it will revise its choices until the most suitable outcome is achieved. A
model of the sequence of decision process followed in designing distribution
channels is presented in table 1
18
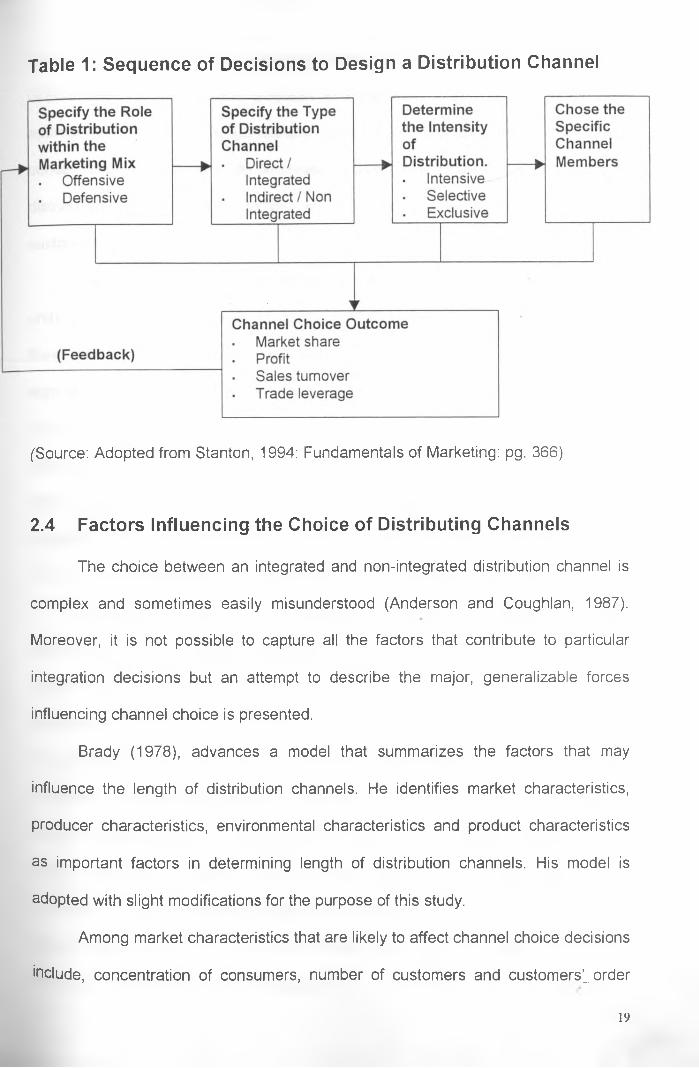
Table 1: Sequence of Decisions to Design a Distribution Channel
(Source: Adopted from Stanton, 1994: Fundamentals of Marketing: pg. 366)
2.4 Factors Influencing the Choice of Distributing Channels
The choice between an integrated and non-integrated distribution channel is
complex and sometimes easily misunderstood (Anderson and Coughlan, 1987).
Moreover, it is not possible to capture all the factors that contribute to particular
integration decisions but an attempt to describe the major, generalizable forces
influencing channel choice is presented.
Brady (1978), advances a model that summarizes the factors that may
influence the length of distribution channels. He identifies market characteristics,
producer characteristics, environmental characteristics and product characteristics
as important factors in determining length of distribution channels. His model is
adopted with slight modifications for the purpose of this study.
Among market characteristics that are likely to affect channel choice decisions
include, concentration of consumers, number of customers and customers’,, order
19
sizes. Thus, where customers are geographically dispersed, it will be difficult to sell
directly because of logistical problems and therefore long channels tend to be
appropriate (Miller, 1984). Conversely, markets characterized by relatively high
concentration of customers can be served by using direct channels. This is because
distribution costs are likely to be relatively low due to physical proximity of
customers.
Brady (1978) finds that where the number of customers served by business
units are many, long channels of distribution will be selected. On the other hand,
fewer numbers of customers will require the use of short channels of distribution and
application of personal selling efforts. Concerning the size of purchase orders made
by customers, Chege (1996) concludes that the size of the average order made is
positively related to choice of direct distribution channels. These findings are in
agreement with the study by Bucklin (1966), which suggests that purchasing in small
quantities would imply high service outputs being delivered and thus necessitating
the involvement of intermediaries in the distribution channel.
Company or producer characteristics will also determine channel structure.
Among the important factors include size of the firm, length of time in business and
market coverage desired. The market coverage desired by the firm may either be
intensive or exclusive. Exclusive distribution will involve severely limiting the number
of intermediaries handling the companies’ goods and services. This will involve
exclusive dealing arrangements in which resellers agree not to carry competing
brands (Stanton, 1994). In this case, short distribution channels will normally be
favored. Intensive distribution on the other hand involves placing goods and services
•n as many outlets as possible. Thus, when the consumer requires a great deal of
iocation convenience, it is important to offer great intensity of distribution. Long
distribution channels will then be selected.20
Firm size is also a major determinant of distribution channel structure.
Therefore, small companies with limited resources in a competitive industry will
normally delegate or “spin-off’ the distribution function to enterprises that specialize
in these functions. Through such delegation, the firm is able to lower its costs and
therefore improve its competitive position. Eventually, however, reintegration of
these function may be warranted as the firm’s output increases or technology
changes because the firm may then find itself capable of performing them at an
optimum scale (Stigler, 1951)
The length of time in business of a firm may also determine the nature of its
distribution channel. For new companies, long channels may be preferred. However,
this may depend on whether the intermediaries will be willing to assume the
responsibility from the new company. The latter may lack the power or the ability to
convince the intermediary to carry its product (Padolecchia, 1979). On the other
hand, for older companies, established in the market, short distribution channels will
normally be established.
Focussing on environmental characteristics, the number of competitors, and
ease of entry and exit of producers are critical factors that are likely to affect channel
selection. Brady (1978) recommends that where an industry is characterized by ease
of entry and exit, long channels of distribution will be suitable. Conversely, in cases
where entry and exit is limited, short channels may be selected. This may suggest
that for small firms in Kenya, long channels of distribution may be selected, since
these are characterized by ease of entry and exit as stated in the ILO (1972) report.
Competitive behavior may also influence channel selection decisions as well.
Thus, if firms already established in the market have integrated channels, an entrant
into the market may wish to have one also. In this way, entrants signal to customers
that they are committed to serving the market and are willing to dedicate resources2i
(e.g. personnel) to do so. Thus, competitors will imitate the establishments of
subsidiaries in each other’s markets (Calvet, 1981).
Turning to product characteristics, product service requirements, perishability
differentiation, regularity of demand and width of the product line are important
factors that may influence the channel choice decision. Product service requirements
will affect the channel selection decision. Thus, where the firm’s marketing strategy
calls for a high level of service (before or after sale), integrating the channel helps
ensure that the service will be performed (Keegan, 1984). Though performing
service can be specified in contracts with independent entities, ascertaining whether
the independent adheres to the contract can be difficult and costly because there are
few readily available indicators of service performance unless the firm integrates the
channel. Anderson (1995) finds that employee sales people are used more often
than contract independent entities for service intensive products.
Product differentiation may also influence the channel choice decision. The
extent to which a product is differentiated or standardized can result from a
combination of physical product characteristics, selling efforts by the channel
members and from the process of consumer choice. Hence a direct channel is likely
to be chosen if selling effort is particularly crucial to the differentiation process of a
certain product. McGuire and Stalin (1983), conclude that integration is more
profitable for a manufacturer than non-integration when consumers perceive
products of different manufacturers to be highly differentiated and not substitutable.
Perishability of a product is also important in determining the length of a
channel of distribution. If products are highly perishable, use of short channels is
called for. For instance, many agricultural products, which are highly perishable, will
normally be distributed using short channels. However, this situation may only be
true in developed countries. In most developing countries, poor infrastructure and22
particularly lack of all weather roads has meant that most produce goes to waste and
distribution is mainly through open air markets, hawking and road side selling
(Kinsey, 1988).
According to Brady (1978), where the width of a product line is narrow, long
channels of distribution may be selected. Similarly, where demand for a product is
regular, direct channels of distribution may be favored. On the other hand, a broad
product line and characterized by irregular demand may suggest the use of short
channels of distribution. Kibera (1997) further identifies middlemen characteristics
such as the markets, which the middlemen serve, financial requirements of the
intermediaries, services they provide and their availability as being important in
choosing between long or short channels of distribution. In Kenya especially, the
self-service supermarket is only available in urban centers. Therefore, marketers
have to rely on open-air market places and small traditional full service shops to
distribute their products in rural areas.
In sum, literature indicates a theoretical framework of distribution channel
selection depending on many factors. For the purpose of this study, selection
between direct and indirect channels will depend on:
1. The sub-sector of the firm; metal, wood or leatherworks.
2. The length of time the firm has been in business.
3. The profit margin expected by the firm’s middlemen.
4. The number of products within the firm’s main product line.
5. The regularity of demand for the firm’s main product.
6. The type of customer / end user.
7 The size of orders made by the firm’s customers.
23
CHAPTER THREE - METHODOLOGY
This chapter describes the research design, which was used to carry out the
research. It covers the research design, population, respondents, the sampling plan,
data collection and data analysis methods.
3.1 Research Design
This research was a descriptive study meant to establish factors that influence
the choice of product distribution channels for small-scale manufacturing firms in
Thika town. Cooper and Emory (1995), assert that a descriptive study is used to
learn the, who, what, when, where and how of a topic. Thus, a study of this nature
may be used to describe or develop a profile of what is being studied.
3.2 Population
The population of interest in this study consisted of all small-scale
manufacturing firms in Thika town. During the pilot study, it was found that most
small-scale manufacturing firms engaged in metalwork fabrication, shoe making and
leather goods production, and woodwork production. These three categories were
adopted for the purpose of the study. Information obtained from the pilot study also
revealed the main activities of woodwork, leatherwork and metalwork firms in Thika
town.
Woodwork artisans were engaged in production of furniture such as chairs,
tables, cardboards, beds, cabinets, coffins, desks, wooden carvings and wood
containers, lampshades, coat hangers and curios. In leatherwork production,
artisans produced footwear and other items such as handbags, belts, wallets,24
briefcases, bags and general upholstery. Metalwork firms were involved in
fabrication of products from metal. Their products included cooking pans, rain
gutters, grills, charcoal stores, wheel barrows, window frames, chicken feeders,
dustbins, lockers, water tanks, farm implements and general metal furniture.
3.3 Sampling Plan
It was not possible to draw up a sampling frame of the small-scale firms, due
to difficulties in getting a good enough estimate of the number of these enterprise^ in\
Thika town. This problem was partly due to the informal nature of some of thesd
enterprises. The sample was therefore drawn from the major Jua-Kali concentration
locations in Thika town (Kariuki, 1989). These locations were identified through a
pilot study as having the highest concentration of small-scale manufacturing firms.
The concentration regions included Thika Town area, Jamuhuri Market area, Thika
Industrial area and Madaraka Market area. Concentration locations, which were
identified for the three sub-sectors (Metal, wood and leather) include:
(a) Metalwork sub-sector
i) Thika Town area
ii) Jamhuri Market area
iii) Thika Industrial are
(b) Woodwork sub-sector
i) Thika Town area
ii) Jamhuri Market area
iii) Madaraka Market area
(c) Leatherwork sub-sector
i) Jamhuri Market area.
ii) Thika Industrial area25
iii) Madaraka Market area.
A random choice method was used in selecting the respondents to be
interviewed. Respondents to be interviewed were identified by estimating the number
of small-scale firms in the concentration locations and then interviewing every third
respondent along the street or avenue so chosen (Maalu, 1990). A sample of 65
small firms was visited and the respondents interviewed by the researcher with the
help of two research assistants. Out of the 65 responses, the researcher chose to
analyze 60 questionnaires, 20 from each of the sub-sectors identified (metal, wood
and leather), in order to provide an equal basis for comparison of the results.
3.4 Data Collection Methods
Primary data was required for this study. A pilot study was initially undertaken
where 10 firms were visited in order to identify factors to be added to or subtracted
from the questionnaire in addition to those from the literature review. A semi-
structured questionnaire including both open and closed was then used to collect the
data. This questionnaire was administered through interviews conducted by the
researcher and his two assistants. Personal interviews were considered necessary
since some respondents were found to be semi-illiterate and hence some questions
had to be asked in Kiswahili and Kikuyu languages.
The questionnaire was divided into five parts. Part one addressed issues
relating to the products manufactured by the firm. Part two, dealt with the customer
characteristics for the firms’ main product. Part three was concerned with selling and
distribution characteristics of the firm. Part four concerned itself with the
characteristics of the firm and the environment in which it operated and lastly, Part
five looked at the personal details of the respondents.
26
3.5 Data Analysis Methods
Data analysis methods were carried out using means, percentages and
proportion. Average ratings were also used to determine the relative importance of
various factors in selection of product distribution channels. Other researchers who
conducted surveys on small-scale enterprises including Kessio (1981), Me Cormick
(1986), Dossajee (1992), Wandungi (1994), and Muturia (1996) used these methods
of data analysis. Additionally, the chi-square test of association was used to test the
following null hypotheses (Appendix IV and Appendix V).
(i) Ho: There is no relationship between the type of distribution channel selected
(direct or indirect) and the sub-sector of the firm (metal, wood and leather).
(ii) Ho: There is no relationship between the length of time the firm has been in
business and the distribution method selected.
(iii) Ho: There is no relationship between the profit margin required by
middlemen and the type of distribution channel selected.j
(iv) Ho: There is no relationship between the width of the firm’s product line and
the distribution method selected.
(v) Ho: There is no relationship between regularity of demand for the firm's main
product and the type of distribution channel selected.
(vi) Ho: There is no relationship between the type of customer served by the firm
and the distribution method selected.
(vii) Ho: There is no relationship between the size of customer orders and type of
distribution channel selected.
The alternative hypothesis was:
Ho: There is a relationship between the type of distribution channel selected and the
(sub-sector of the firm, length of time in business of the firm, profit margins expected
27
by middlemen, width of the firm’s product line, regularity of demand, type of
customer served, and size of customer orders).
/
CHAPTER FOUR - DATA ANALYSIS AND FINDINGS
In this chapter, the data from the completed questionnaire is summarized and
presented in tables, percentages and average ratings. In addition, results of the chi-
square test of association between the type of distribution channel selected and
various factors are presented. The analysis and presentation of findings is done in
five sections.
(i) Profile of the respondents.
(ii) Small-scale firm characteristics.
(iii) Factors influencing the choice of product distribution channels.
(iv) Relative importance of various factors in the selection of product distribution
channels.
(v) The results of the chi-square test of association.
4.1 Profile of Respondents.0
A profile of respondents was considered necessary in this study inorder to
bring out a more clear understanding of small-scale enterprises and the environment
in which they operate. The respondents in this study consisted of the owners of
small-scale manufacturing firms in Thika town. However, in some instances, where
the owners could not be reached, the managers of the firm or the spouses were
interviewed. Table 2 reveals the distribution of respondents as per the title they held
in the firm.
29
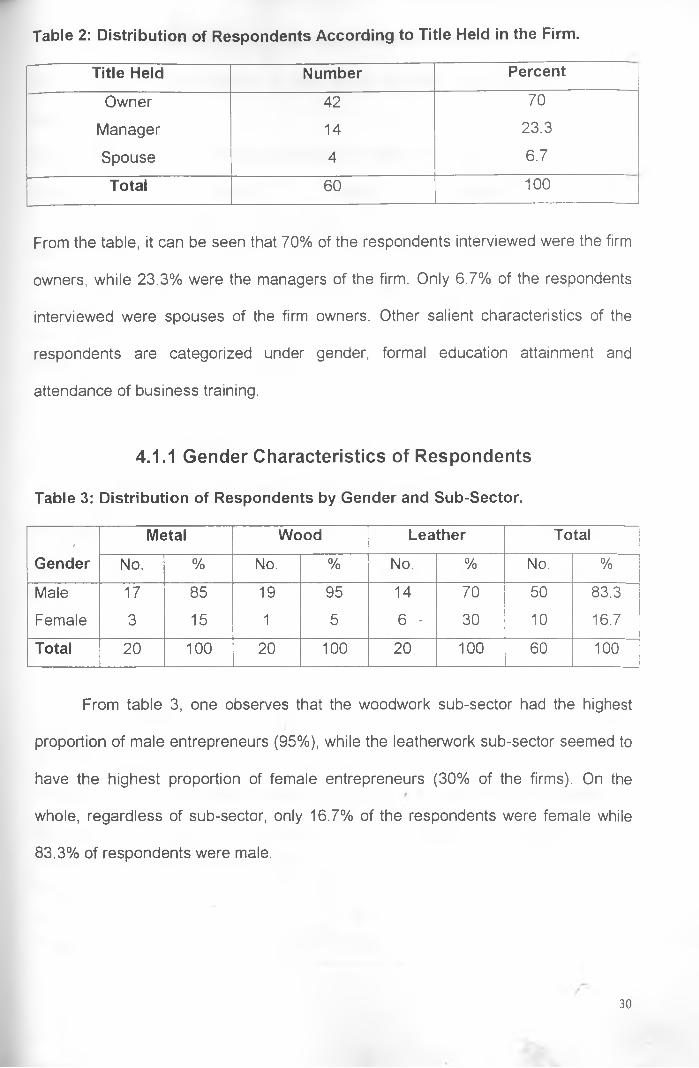
Table 2: Distribution of Respondents According to Title Held in the Firm.
Title Held Number Percent
Owner 42 70
Manager 14 23.3
Spouse 4 6.7
Total 60 100
From the table, it can be seen that 70% of the respondents interviewed were the firm
owners, while 23.3% were the managers of the firm. Only 6.7% of the respondents
interviewed were spouses of the firm owners. Other salient characteristics of the
respondents are categorized under gender, formal education attainment and
attendance of business training.
4.1.1 Gender Characteristics of Respondents
Table 3: Distribution of Respondents by Gender and Sub-Sector.
/Metal Wood Leather Total
Gender No. % No. % No. % No. %
Male 17 85 19 95 14 70 50 83.3
Female 3 15 1 5 6 - 30 10 16.7
Total 20 100 20 100 20 100 60 100
From table 3, one observes that the woodwork sub-sector had the highest
proportion of male entrepreneurs (95%), while the leatherwork sub-sector seemed to
have the highest proportion of female entrepreneurs (30% of the firms). On the
whole, regardless of sub-sector, only 16.7% of the respondents were female while
83.3% of respondents were male.
30
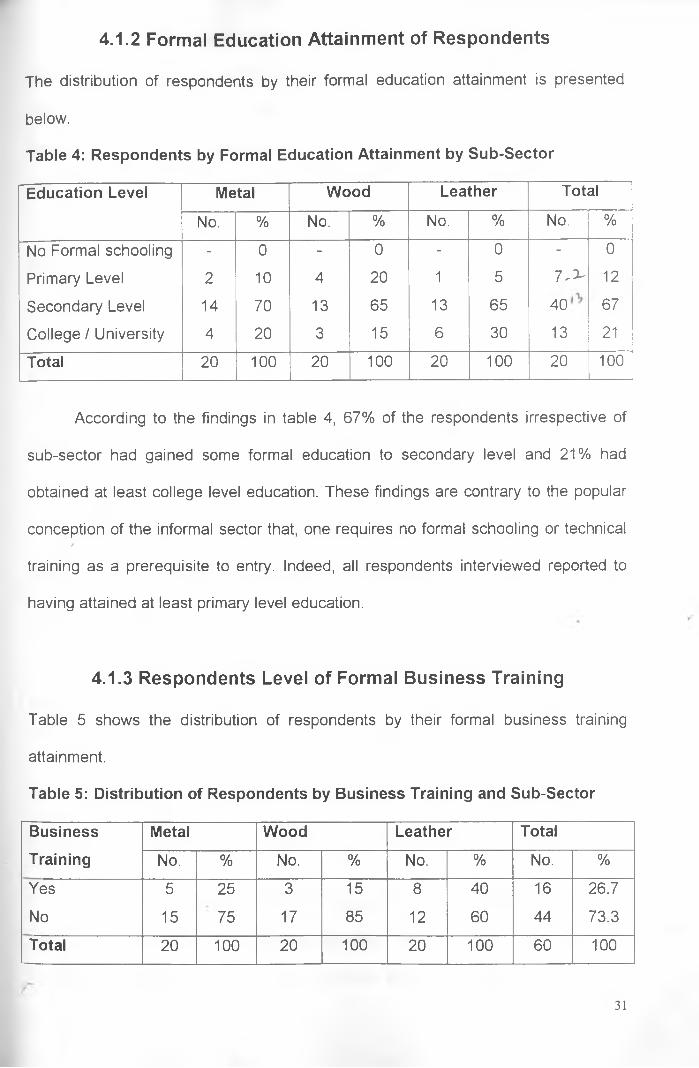
4.1.2 Formal Education Attainment of Respondents
The distribution of respondents by their formal education attainment is presented
below.
Table 4: Respondents by Formal Education Attainment by Sub-Sector
Education Level Metal Wood Leather Total
No. % No. % No. % No. %
No Formal schooling - 0 - 0 - 0 - 0
Primary Level 2 10 4 20 1 5 7 ^ 12
Secondary Level 14 70 13 65 13 65 40 67
College / University 4 20 3 15 6 30 13 21
Total 20 100 20 100 20 100 20 100
According to the findings in table 4, 67% of the respondents irrespective of
sub-sector had gained some formal education to secondary level and 21% had
obtained at least college level education. These findings are contrary to the popular
conception of the informal sector that, one requires no formal schooling or technical0
training as a prerequisite to entry. Indeed, all respondents interviewed reported to
having attained at least primary level education.
4.1.3 Respondents Level of Formal Business Training
Table 5 shows the distribution of respondents by their formal business training
attainment.
Table 5: Distribution of Respondents by Business Training and Sub-Sector
Business Metal Wood Leather Total
Training No. % No. % No. % No. %
Yes 5 25 3 15 8 40 16 26.7
No 15 75 17 85 12 60 44 73.3
Total 20 100 20 100 20 100 60 100
31
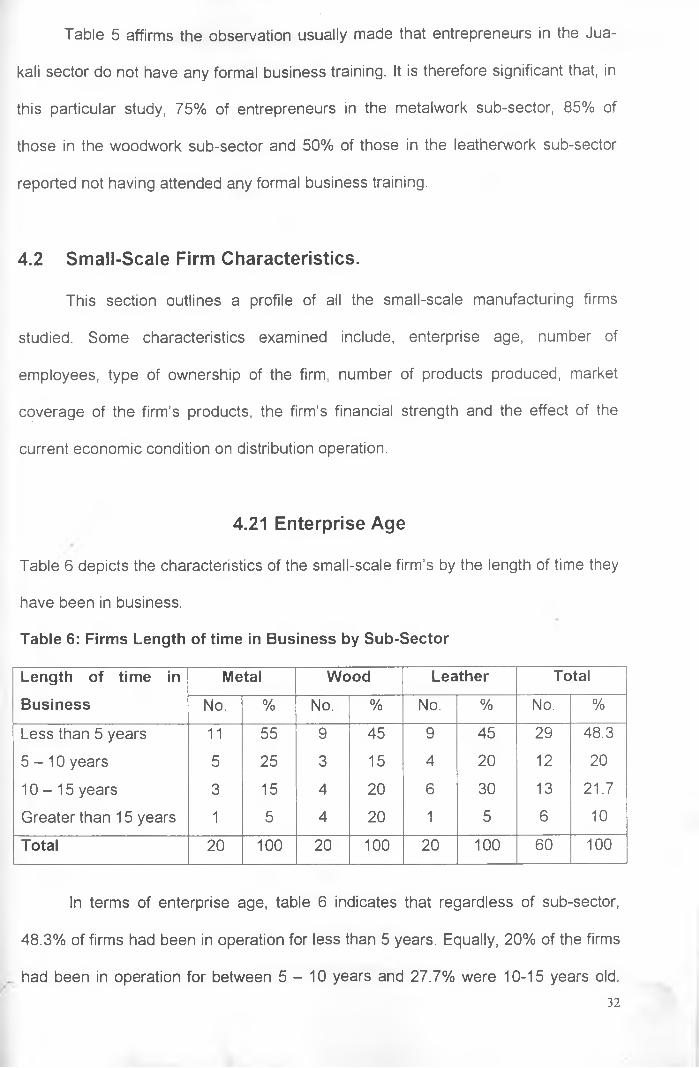
Table 5 affirms the observation usually made that entrepreneurs in the Jua-
kali sector do not have any formal business training. It is therefore significant that, in
this particular study, 75% of entrepreneurs in the metalwork sub-sector, 85% of
those in the woodwork sub-sector and 50% of those in the leatherwork sub-sector
reported not having attended any formal business training.
4.2 Small-Scale Firm Characteristics.
This section outlines a profile of all the small-scale manufacturing firms
studied. Some characteristics examined include, enterprise age, number of
employees, type of ownership of the firm, number of products produced, market
coverage of the firm’s products, the firm’s financial strength and the effect of the
current economic condition on distribution operation.
4.21 Enterprise Age
Table 6 depicts the characteristics of the small-scale firm’s by the length of time they
have been in business.
Table 6: Firms Length of time in Business by Sub-Sector
Length of time in
BusinessMetal Wood Leather Total
No. % No. % No. % No. %
Less than 5 years 11 55 9 45 9 45 29 48.3
5 - 1 0 years 5 25 3 15 4 20 12 20
1 0 -15 years 3 15 4 20 6 30 13 21.7
Greater than 15 years 1 5 4 20 1 5 6 10
Total 20 100 20 100 20 100 60 100
In terms of enterprise age, table 6 indicates that regardless of sub-sector,
48.3% of firms had been in operation for less than 5 years. Equally, 20% of the firms
had been in operation for between 5 - 1 0 years and 27.7% were 10-15 years old.32
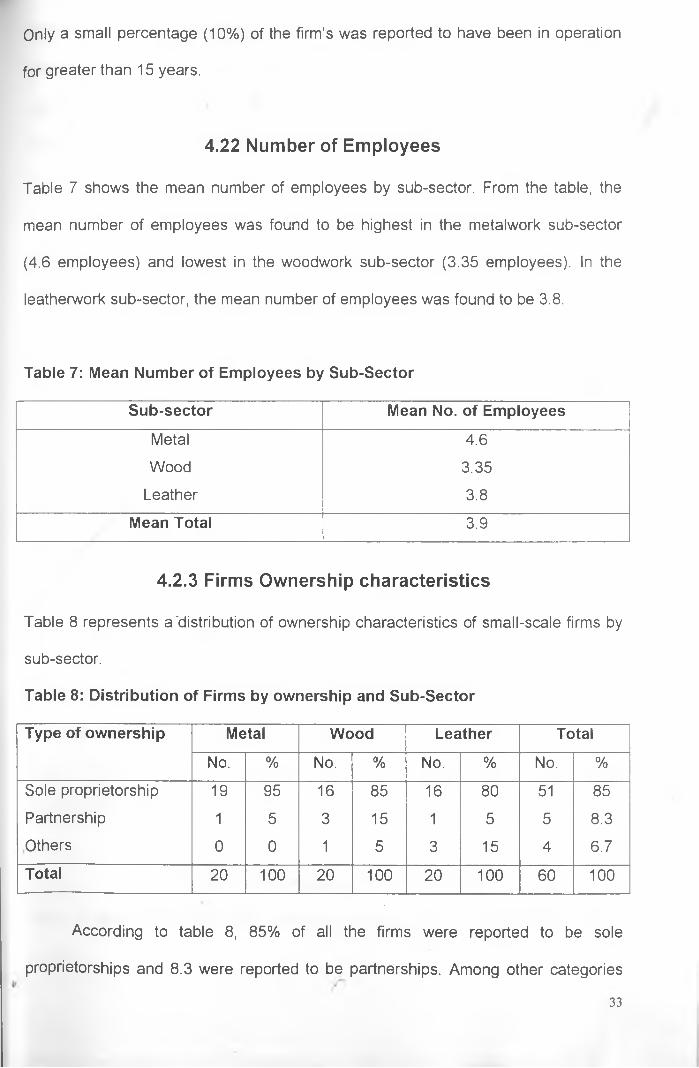
4.22 Number of Employees
Table 7 shows the mean number of employees by sub-sector. From the table, the
mean number of employees was found to be highest in the metalwork sub-sector
(4.6 employees) and lowest in the woodwork sub-sector (3.35 employees). In the
leatherwork sub-sector, the mean number of employees was found to be 3.8.
Only a small percentage (10%) of the firm’s was reported to have been in operation
for greater than 15 years.
Table 7: Mean Number of Employees by Sub-Sector
Sub-sector Mean No. of Employees
Metal 4.6
Wood 3.35
Leather 3.8
Mean Total 3.9
4.2.3 Firms Ownership characteristics
Table 8 represents a'distribution of ownership characteristics of small-scale firms by
sub-sector.
Table 8: Distribution of Firms by ownership and Sub-Sector
Type of ownership Metal Wood Leather Total
No. % No. % No. % No. %
Sole proprietorship 19 95 16 85 16 80 51 85
Partnership 1 5 3 15 1 5 5 8.3Others 0 0 1 5 3 15 4 6.7Total 20 100 20 100 20 100 60 100
According to table 8, 85% of all the firms were reported to be sole
proprietorships and 8.3 were reported to be partnerships. Among other categories
33
identified were, two firm’s being private limited companies and two others being co
operative welfare groups. An analysis by sub-sector revealed that the highest
number of sole proprietorships were reported in the metalwork sub-sector, while the
leatherwork sub-sector reported the highest number of firms in the ‘others’ category.
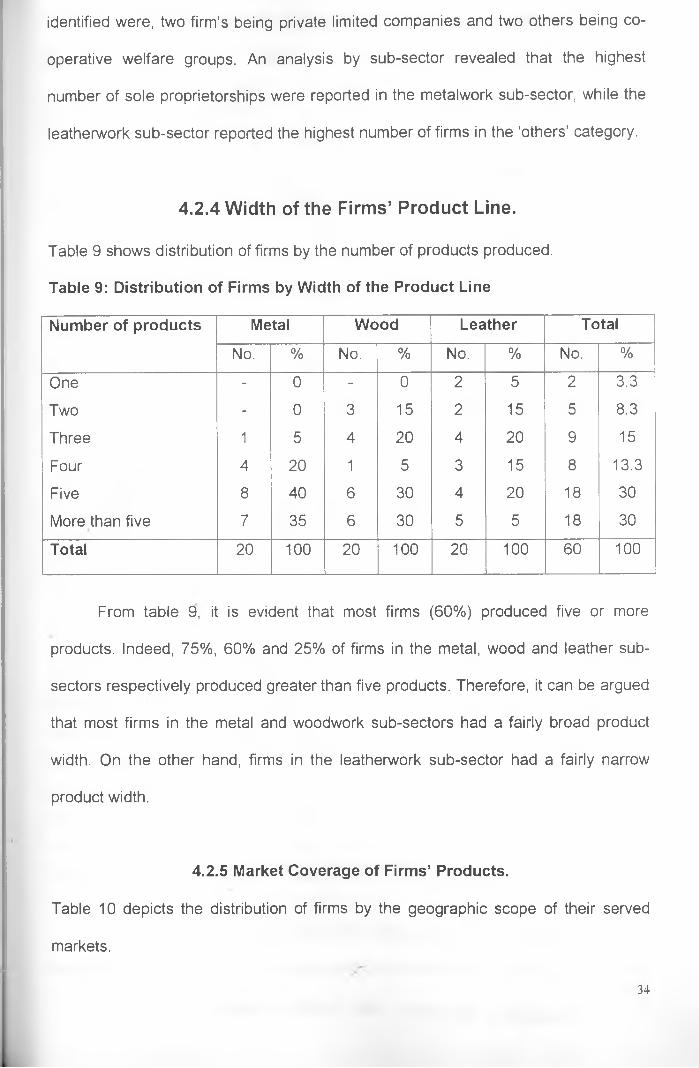
4.2.4 Width of the Firms’ Product Line.
Table 9 shows distribution of firms by the number of products produced.
Table 9: Distribution of Firms by Width of the Product Line
Number of products Metal Wood Leather Total
No. % No. % No. % No. %
One - 0 - 0 2 5 2 3.3
Two - 0 3 15 2 15 5 8.3
Three 1 5 4 20 4 20 9 15
Four 4 20 1 5 3 15 8 13.3
Five 8 40 6 30 4 20 18 30
More than five 7 35 6 30 5 5 18 30
Total 20 100 20 100 20 100 60 100
From table 9, it is evident that most firms (60%) produced five or more
products. Indeed, 75%, 60% and 25% of firms in the metal, wood and leather sub
sectors respectively produced greater than five products. Therefore, it can be argued
that most firms in the metal and woodwork sub-sectors had a fairly broad product
width. On the other hand, firms in the leatherwork sub-sector had a fairly narrow
product width.
4.2.5 Market Coverage of Firms’ Products.
Table 10 depicts the distribution of firms by the geographic scope of their served
markets.
34
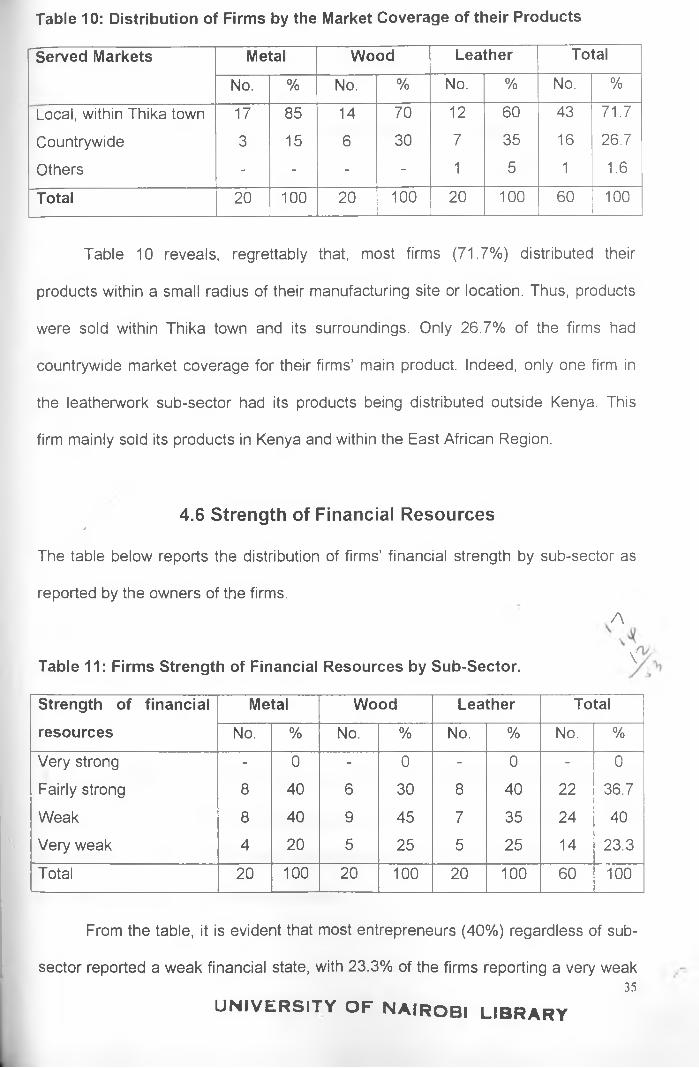
Table 10: Distribution of Firms by the Market Coverage of their Products
Served Markets Metal Wood Leather Total
No. % No. % No. % No. %
Local, within Thika town 17 85 14 70 12 60 43 71.7
Countrywide 3 15 6 30 7 35 16 26.7
Others - - - - 1 5 1 1.6
Total 20 100 20 100 20 100 60 100
Table 10 reveals, regrettably that, most firms (71.7%) distributed their
products within a small radius of their manufacturing site or location. Thus, products
were sold within Thika town and its surroundings. Only 26.7% of the firms had
countrywide market coverage for their firms’ main product. Indeed, only one firm in
the leatherwork sub-sector had its products being distributed outside Kenya. This
firm mainly sold its products in Kenya and within the East African Region.
4.6 Strength of Financial Resources*
The table below reports the distribution of firms’ financial strength by sub-sector as
reported by the owners of the firms.
Table 11: Firms Strength of Financial Resources by Sub-Sector.
A
\
Strength of financial resources
Metal Wood Leather Total
No. % No. % No. % No. %
Very strong - 0 - 0 - 0 - 0
Fairly strong 8 40 6 30 8 40 22 36.7
Weak 8 40 9 45 7 35 24 40
Very weak 4 20 5 25 5 25 14 23.3
Total 20 100 20 100 20 100 60 100
From the table, it is evident that most entrepreneurs (40%) regardless of sub
sector reported a weak financial state, with 23.3% of the firms reporting a very weak35
U N IV E R S IT Y O F N A IR O B I L IB R A R Y
state of their financial resources. Only 36.7% of the firms reported to have a fairly
strong state of their financial resources. None of the firms however, reported to
having a very strong financial position.
4.2.7 Effect of Current Economic Conditions
Table 12 reports the impact of the current economic condition of the distribution
operations of the firm.
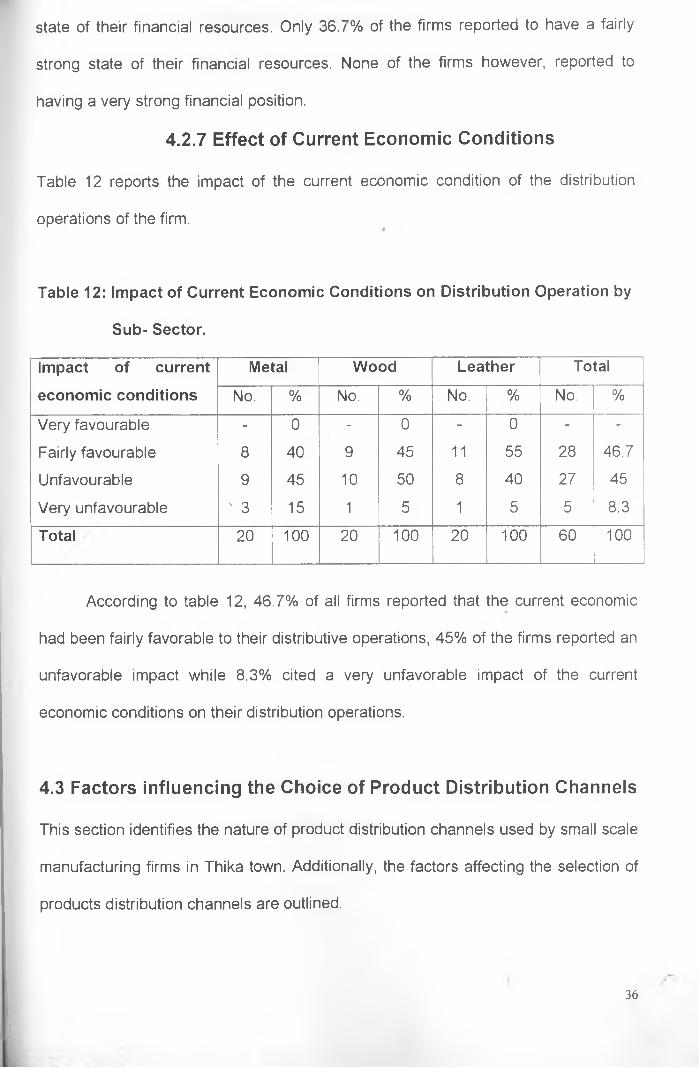
Table 12: Impact of Current Economic Conditions on Distribution Operation by
Sub- Sector.
Impact of current
economic conditions
Metal Wood Leather Total
No. % No. % No. % No. %
Very favourable - 0 - 0 - 0 - -
Fairly favourable 8 40 9 45 11 55 28 46.7
Unfavourable 9 45 10 50 8 40 27 45
Very unfavourable ' 3 15 1 5 1 5 5 8.3
Total 20 100 20 100 20 100 60 100
According to table 12, 46.7% of all firms reported that the current economic
had been fairly favorable to their distributive operations, 45% of the firms reported an
unfavorable impact while 8.3% cited a very unfavorable impact of the current
economic conditions on their distribution operations.
4.3 Factors influencing the Choice of Product Distribution Channels
This section identifies the nature of product distribution channels used by small scale
manufacturing firms in Thika town. Additionally, the factors affecting the selection of
products distribution channels are outlined.
36
4.3.1 Nature of Distribution Channels for Small-Scale Firms
Table 13 below depicts the distribution channels used by the small-scale firms by
sub-sector. Distribution channels used will either be direct or indirect. Direct
distribution will involve firms selling directly to the final consumer without using
intermediaries. On the other hand, indirect distribution channels which includes
mixed or dual distribution channels (where the firm combines both direct and indirect
channels) will involve firms availing their products to the target markets through
intermediaries.
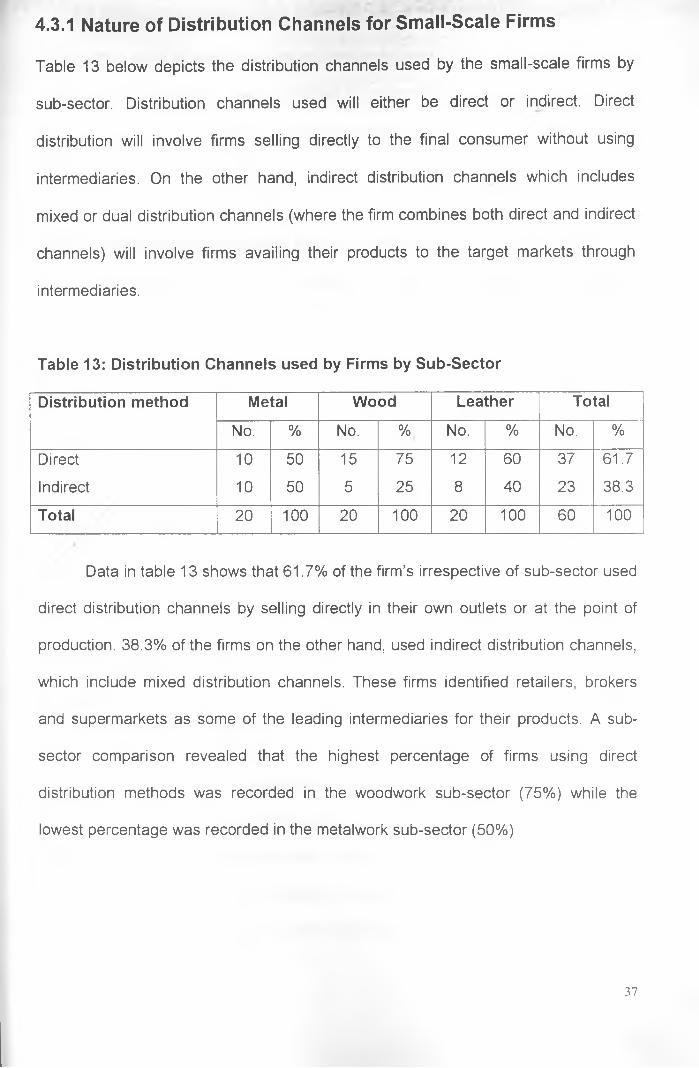
Table 13: Distribution Channels used by Firms by Sub-Sector
Distribution method Metal Wood Leather Total
No. % No. % No. % No. %
Direct 10 50 15 75 12 60 37 61.7
Indirect 10 50 5 25 8 40 23 38.3
Total 20 100 20 100 20 100 60 100
Data in table 13 shows that 61.7% of the firm’s irrespective of sub-sector used
direct distribution channels by selling directly in their own outlets or at the point of
production. 38.3% of the firms on the other hand, used indirect distribution channels,
which include mixed distribution channels. These firms identified retailers, brokers
and supermarkets as some of the leading intermediaries for their products. A sub
sector comparison revealed that the highest percentage of firms using direct
distribution methods was recorded in the woodwork sub-sector (75%) while the
lowest percentage was recorded in the metalwork sub-sector (50%)
37
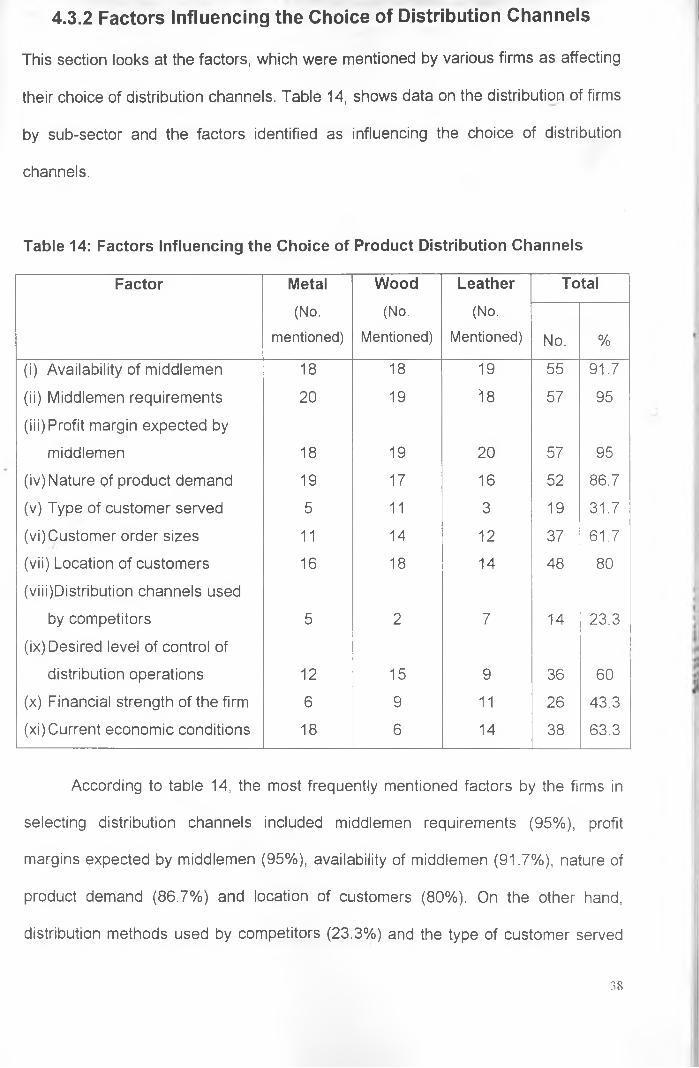
4.3.2 Factors Influencing the Choice of Distribution Channels
This section looks at the factors, which were mentioned by various firms as affecting
their choice of distribution channels. Table 14, shows data on the distribution of firms
by sub-sector and the factors identified as influencing the choice of distribution
channels.
Table 14: Factors Influencing the Choice of Product Distribution Channels
Factor Metal(No.
mentioned)
Wood(No.
Mentioned)
Leather(No.
Mentioned)
Total
No. %
(i) Availability of middlemen 18 18 19 55 91.7
(ii) Middlemen requirements 20 19 18 57 95
(iii) Profit margin expected by
middlemen 18 19 20 57 95
(iv) Nature of product demand 19 17 16 52 86.7
(v) Type of customer served 5 11 3 19 31.7
(vi)Customer order sizes 11 14 12 37 61.7
(vii) Location of customers 16 18 14 48 80
(viii)Distribution channels used
by competitors 5 2 7 14 23.3
(ix) Desired level of control of
distribution operations 12 15 9 36 60
(x) Financial strength of the firm 6 9 11 26 43.3
(xi)Current economic conditions 18 6 14 38 63.3
According to table 14, the most frequently mentioned factors by the firms in
selecting distribution channels included middlemen requirements (95%), profit
margins expected by middlemen (95%), availability of middlemen (91.7%), nature of
product demand (86.7%) and location of customers (80%). On the other hand,
distribution methods used by competitors (23.3%) and the type of customer served
38
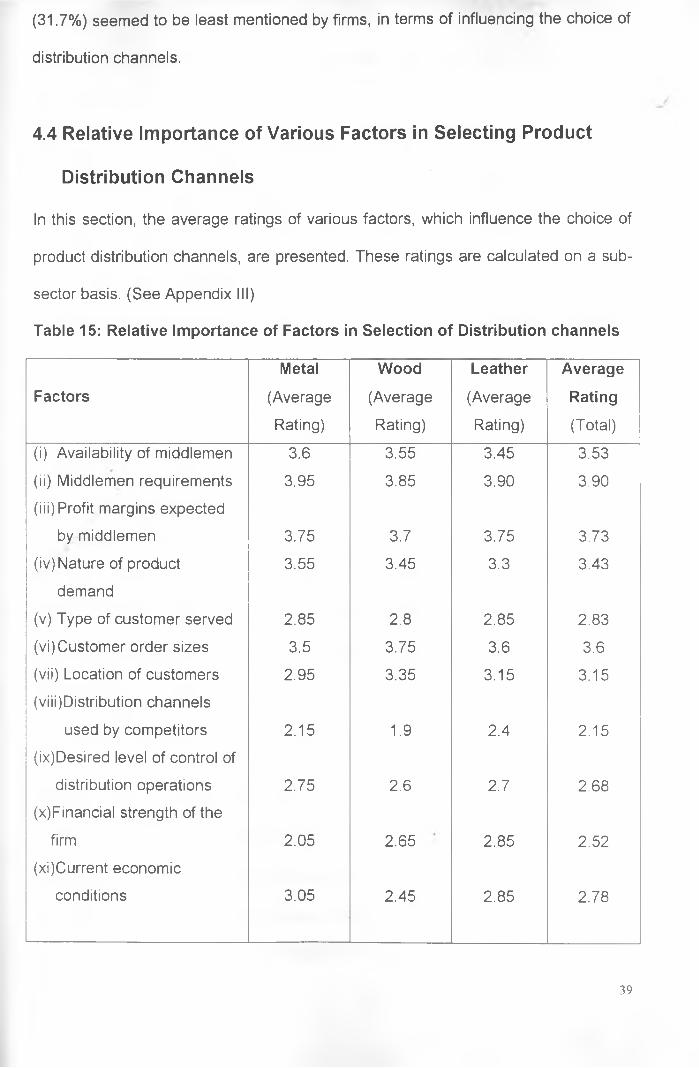
4.4 Relative Importance of Various Factors in Selecting Product
Distribution Channels
In this section, the average ratings of various factors, which influence the choice of
product distribution channels, are presented. These ratings are calculated on a sub
sector basis. (See Appendix III)
(31.7%) seemed to be least mentioned by firms, in terms of influencing the choice of
distribution channels.
Table 15: Relative Importance of Factors in Selection of Distribution channels
Metal Wood Leather AverageFactors (Average (Average (Average Rating
Rating) Rating) Rating) (Total)
(i) Availability of middlemen 3.6 3.55 3.45 3.53
(ii) Middlemen requirements 3.95 3.85 3.90 3.90
(iii) Profit margins expected
by middlemen 3.75 3.7 3.75 3.73
(iv) Nature of product 3.55 3.45 3.3 3.43
demand
(v) Type of customer served 2.85 2.8 2.85 2.83
(vi)Customer order sizes 3.5 3.75 3.6 3.6
(vii) Location of customers
(viii) Distribution channels
2.95 3.35 3.15 3.15
used by competitors 2.15 1.9 2.4 2.15(ix)Desired level of control of
distribution operations 2.75 2.6 2.7 2.68(x)Financial strength of the
firm 2.05 2.65 2.85 2.52(xi)Current economic
conditions 3.05 2.45 2.85 2.78
39
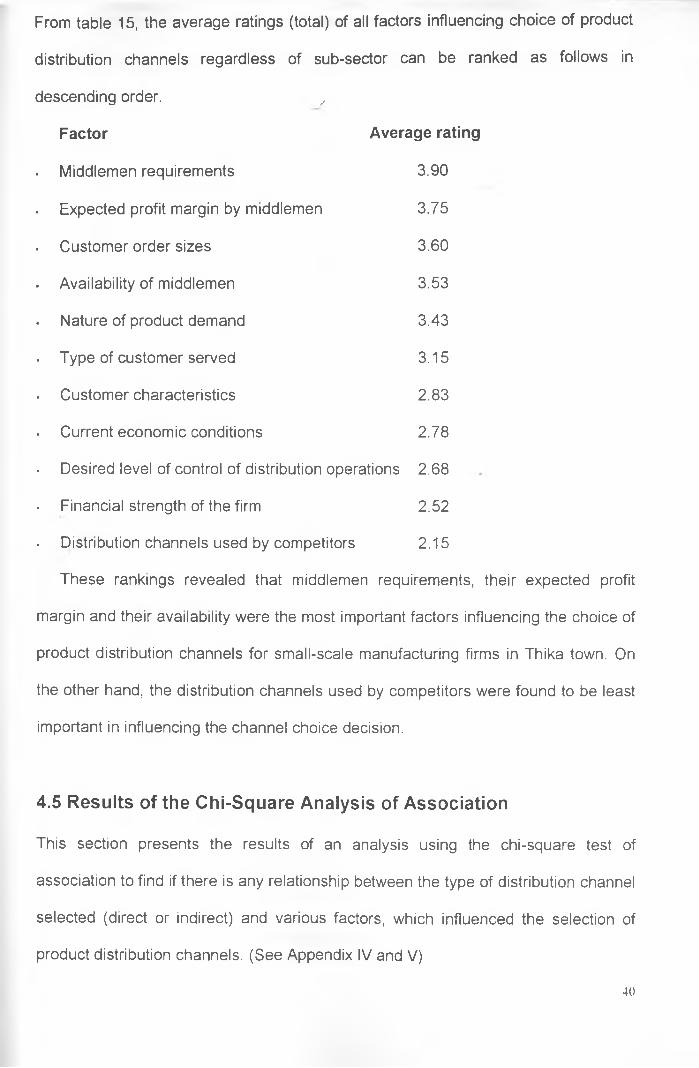
From table 15, the average ratings (total) of all factors influencing choice of product
distribution channels regardless of sub-sector can be ranked as follows in
descending order. /
Factor Average rating
. Middlemen requirements 3.90
. Expected profit margin by middlemen 3.75
Customer order sizes 3.60
. Availability of middlemen 3.53
Nature of product demand 3.43
. Type of customer served 3.15
. Customer characteristics 2.83
. Current economic conditions 2.78
. Desired level of control of distribution operations 2.68
Financial strength of the firm 2.52
Distribution channels used by competitors 2.15
These rankings revealed that middlemen requirements, their expected profit
margin and their availability were the most important factors influencing the choice of
product distribution channels for small-scale manufacturing firms in Thika town. On
the other hand, the distribution channels used by competitors were found to be least
important in influencing the channel choice decision.
4.5 Results of the Chi-Square Analysis of Association
This section presents the results of an analysis using the chi-square test of
association to find if there is any relationship between the type of distribution channel
selected (direct or indirect) and various factors, which influenced the selection of
product distribution channels. (See Appendix IV and V)
40
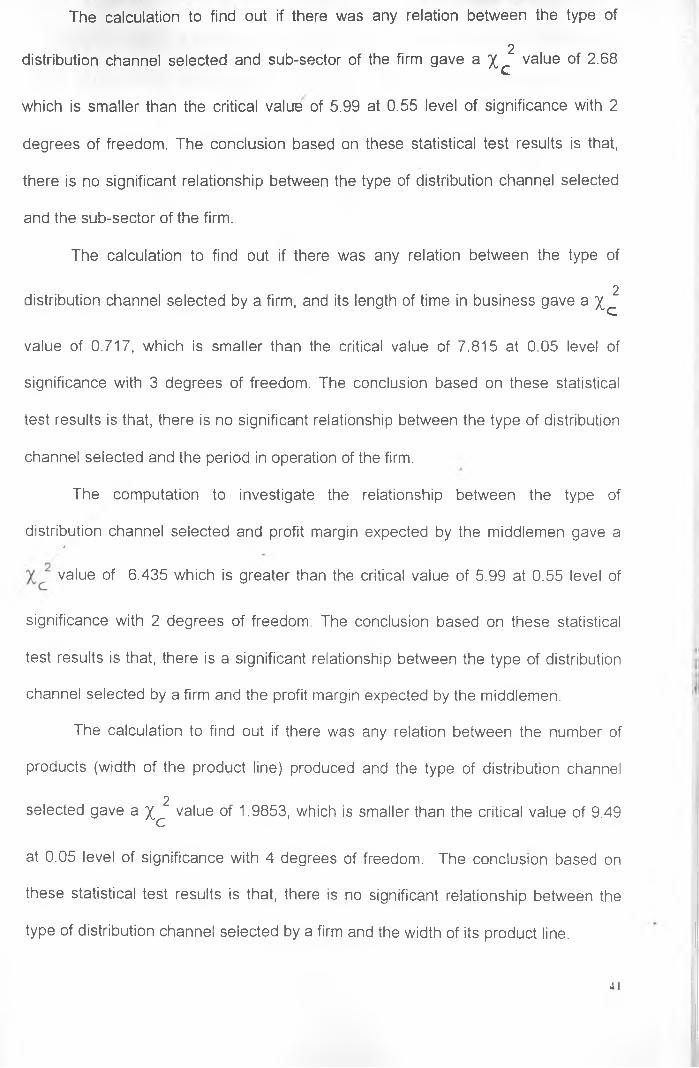
The calculation to find out if there was any relation between the type of
2distribution channel selected and sub-sector of the firm gave a X c value of 2.68
which is smaller than the critical value of 5.99 at 0.55 level of significance with 2
degrees of freedom. The conclusion based on these statistical test results is that,
there is no significant relationship between the type of distribution channel selected
and the sub-sector of the firm.
The calculation to find out if there was any relation between the type of
2distribution channel selected by a firm, and its length of time in business gave a Xc
value of 0.717, which is smaller than the critical value of 7.815 at 0.05 level of
significance with 3 degrees of freedom. The conclusion based on these statistical
test results is that, there is no significant relationship between the type of distribution
channel selected and the period in operation of the firm.
The computation to investigate the relationship between the type of
distribution channel selected and profit margin expected by the middlemen gave a/
value of 6.435 which is greater than the critical value of 5.99 at 0.55 level of
significance with 2 degrees of freedom. The conclusion based on these statistical
test results is that, there is a significant relationship between the type of distribution
channel selected by a firm and the profit margin expected by the middlemen.
The calculation to find out if there was any relation between the number of
products (width of the product line) produced and the type of distribution channel
2selected gave a X c value of 1.9853, which is smaller than the critical value of 9.49
at 0.05 level of significance with 4 degrees of freedom. The conclusion based on
these statistical test results is that, there is no significant relationship between the
type of distribution channel selected by a firm and the width of its product line.
4 I
2channel selected and the regularity of demand for the firm’s products gave a \
value of 6.115 which is greater than the critical value of 5.99 at 0.05 level of
significance with 2 degrees of freedom. The conclusion based on these statistical
test results is that, there is a significant relationship between the type of distribution
channel selected and the regularity of demand for the firm’s main product.
The computation to find out if there was any relation between the type of
2distribution channel selected and the type of customer served gave a X Q value of
0.5935 which is smaller than the critical value of 5.99 at 0.55 level of significance
with 2 degrees of freedom. The conclusion based on these statistical test results is
that, there is no significant relationship between the type of customer served by a
firm and the method of distribution used by the firm.
Finally, the calculation to investigate the relation between the size of customer
' 2 orders and the type of distribution channel selected gave a X c value of 9.2627
which is greater than the critical value of 7.815 at 0.05 level of significance with 3
degrees of freedom. The conclusion based on these statistical test results is that,
there is a significant relationship between the type of distribution channels selected
by the firm and the size of orders made by its customers.
The calculation to investigate the relationship between the type of distribution
42
CHAPTER FIVE: SUMMARY AND POLICY IMPLICATIONS
This chapter presents a summary of the findings, policy implications, limitations of
the study and some suggestions for further research.
5.1 Summary
The main aim of this study was to examine the factors that influence the
choice of product distribution channels for small-scale manufacturing firms and to
estimate the relative importance of these factors in channel choice selection. Based
on extant literature, seven factors were hypothesized to affect the choice of product
distribution channels. The sub-sector of the firm, the length of time in business of the
firm, the profit margins expected by middlemen, the width of the firm’s product line,
the regularity of demand for the firm’s products, the type of customer served by the
firm and the size of customer orders.
The effects of these factors on the channel selection decision are presented/ —
below. Additionally, this section also presents a summary of the profile of
respondents of the firm’s included in the study. This information has been included to
provide a deeper understanding of small-scale firms and the environment in which
they operate. Further it is believed this information would also give indications as to
why these firms made certain channel decisions.
It is evident from the profile of respondents that 93.3% of all respondents
consisted of owners and managers of the small-scale firms while only 6.7%
consisted of the spouses of the owners of these firms. Thus, since the firm owners
and managers are assumed to make important decisions for a business firm, it can
therefore be said that, the respondents in this study consisted of the people who
made important decisions for the small-scale firms, and more particularly, decisions
regarding the distribution of their products. An analysis of the entrepreneurs by
43
gender revealed that the highest percentage of male entrepreneurs was found in the
woodwork sub-sector (95%) while the highest percentage of female entrepreneurs
was found in the leatherwork sub-sector (30%). On the whole, regardless of sub
sector, 98% of entrepreneurs were male while 16.7% were female. These statistics
confirm the stereotype of male dominance in the Jua-kali sector.
Concerning education attainment, regardless of sub-sector, 12% of the
entrepreneurs had attained primary level education, 67% had attained secondary
level education and 21% had at least a college level education. These findings are
contrary to the popular opinion that most Jua-kali entrepreneurs did not have any
formal schooling. Regarding the level of business training, this study revealed that
irrespective of sub-sector, 73.3% of all entrepreneurs interviewed had not attended
any formal business training. These findings therefore affirm the observation usually
made that entrepreneurs in the Jua-kali sector did not have any formal business
training. Indeed, most entrepreneurs interviewed did not think that formal business
training was beneficial to their businesses and only viewed it as an additional
expense, which often they could not afford.
A focus on the characteristics of the firms revealed that, the majority of the
firms (48.3%), regardless for sub-sector had been in business for less than five
years, 20% had been in business of 5-10 years, 21.7% were in business for 10-15
years, and only 10% of the firms had been in business for greater than 15 years. In
terms of the mean number of employees of the firms, the metalwork sub-sector
recorded the highest mean (4.6 employees), while the woodwork sub-sector
recorded the lowest mean of 3.35 employees. On the whole, irrespective of sub
sector, the mean number of employees was 3.9. However, it is notable that most
employees of the firms were either immediate family members of the owner or part
44
time workers engaged when the demand for products was high or when customers
placed large orders, which required immediate attention.
Regarding the type of ownership of the firm, most enterprises were found to
be sole proprietorships (85%), while partnership consisted of 8.3% of the total. Only
6.7% of the firms were either private limited companies or co-operative societies.
The high percentage of sole proprietorships may be attributed to the fact that the
entry barriers into the Jua-Kali industry are quite low and hence most entrepreneurs
went into business on their own with a paltry amount of capital. Focussing on the
width of the firm’s product line, a great majority of the firms produced five or more
products. It is notable that, although most firms had a fairly large product width, most
of these products were not produced throughout the year, but according to certain
seasons.
In respect to market coverage or the geographic scope of the firms served
markets, it was found that most firms (71.7%) regardless of the sub-sector,
distributed their products within Thika town and it’s environs. Only a small number of
firms (26.7%) had countrywide market coverage. Further, only one firm out of the
total 60 firms sampled, exported its products to countries within the East African
Region. One factor limiting the market coverage for most of these firms was their
limited production capacity. Since most firms used labor-intensive production
techniques, their production capacities were severely limited and hence they could
only produce items to serve local markets.
Turning to financial strength of the firms’ resources, this study revealed that a
great majority of firms (63.9%) irrespective of sub-sector reported a weak financial
position. A weak financial position arose mainly from low level of savings by the
entrepreneurs, limited access to credit facilities, and low level of incomes resulting
from low profit margins on products coupled with depressed sales levels. Most
45
entrepreneurs interviewed, reported that a weak financial position negatively affected
their business operations and especially their distribution activities. Other findings
from the study revealed that, the current economic conditions had been generally
unfavorable to most firms’ (53.3%) marketing and distribution activities. Only 46.7%
of the firms reported a fairly favorable impact of the current economic activities on
the distribution of their products. In general, most firms identified the general
economic recession experienced in the country as affecting consumer’s purchasing
power and hence leading to depressed sales levels and piling of unsold stocks.
Liberalization of the economy had also affected negatively the performance of most
small-scale firms. Thus, with liberalization, the Kenyan markets had been flooded
with cheap imports which despite being cheaper than the local Jua-Kali products
were seemingly of a higher quality. The worst hit sub-sector was the leatherwork
sub-sector, which had witnessed the collapse of many firms. Lastly, the high interest
rates charged by most banks and financial institutions had tended to 'crowd out’
most small-scale firms from borrowing and hence severely affected their distribution
operations, therefore impeding their survival and growth prospects.
In regard to distribution channels used by the firms, it is evident from the study
that most firms (61.7%) regardless of sub-sector used direct distribution channels,
while 38.3% of the firms used indirect methods of distribution. Direct distribution
channels used by the firms’ owners included selling directly from the point of
production or peddling the products in market places, at bus stationer at roadside
location/-Indirect distribution channels included dual distribution channels where the
firm used two or more distribution channel structures for distributing the same
product to the target markets. The indirect distribution channels used by firms
included small retail shops, supermarkets and other manufacturing firms.
46
The study also found the various factors that influenced the choice of product
distribution channels by small-scale manufacturing firms in Thika town. The five most
frequently mentioned factors included middlemen requirements (95%), expected
profit margin by the middlemen (95%), availability of middlemen (91.7%), nature of
product demand for the firm’s products (86.7%) and location of customers (80%).
Only 23.3% of the firms mentioned distribution channels used by competitors as a
factor to be considered in selecting distribution method for a firm’s product.
Middlemen requirements cited by the firm owners included their desire to buy
products on credit and their high quality expectations. Thus, where the level of credit
required by the intermediary was high, most firms chose to sell directly at their own
outlets than use the intermediaries. On the other hand, cash purchases by
middlemen encouraged Jua-Kali entrepreneurs to use indirect channels of
distribution. High quality expectations by middlemen implied that,, only those
products which met the quality expectation of intermediaries would be bought, hence
the firm owners had to use other channels (direct channels) to distribute the products
that did not meet the quality expectations of the intermediaries.
Concerning profit margins expected by middlemen, it was established that
most intermediaries required a fairly high profit margin on the sale of these products.
Thus, where it was possible to provide such a margin, the firms chose to use the
intermediaries, on the other hand, where provision of such margin to middlemen
would affect the manufacturing firm’s profits, the firm would choose to use short
channels of distribution. Availability of middlemen was also very frequently
mentioned as a factor influencing the choice of product distribution channels. Thus
where intermediaries were available and willing to stock the firms products, the
entrepreneur would chose to use these intermediaries. However in most cases,
intermediaries were not available to stock the firms products, and where they were
47
available, most of them were unwilling to stock products from Jua-Kali industries,
mainly because of low quality perception of products from the industry. Hence,in this
case the firms had no alternative but to integrate the distribution channels.
Regarding regularity of demand, majority of the firms regardless of sub-sector
indicated that most of their products were characterized by an irregular and seasonal
demand. Thus, during peak periods of demand, the firms chose to sell directly at
their production locations, and during periods of low demand, the firms would try to
sell through intermediaries. Focusing on location of customers, it was evident that
most firms used long channels where their customers were geographically dispersed
and short channels where their customers were geographically concentrated.
A ranking of various factors influencing the choice of product distribution
channels using average ratings revealed that middlemen requirements, the profit
margin expected by middlemen, availability of intermediaries, the nature of demand
for products and the type of customer served were ranked as five most important
factors in making the channel cnoice decision. The distribution channels used by
competitors were ranked lowest as a factor to be considered when selecting a type
of product distribution channel. J
A further analysis using the chi-square test of association revealed that, a
significant relationship existed betweep'the type of distribution channel selected by a
firm and the profit margin expecte^ by middleman, the regularity of demand for a
firm’s products and the size of orders made by the firm’s customers at 0.05 level of
significance. On the other hafid, it was found that no significant relationship existed
between the type of distribution channel selected by a firm and the sub-sector of the
firm, the length of time/n business of the firm, the width of the firms product line and
type of customer se/ved at 0.05 level of significance.
48
5.2 POLICY IMPLICATIONS
The results of this study have important managerial implications for small-scale firm
operators and other stakeholders who are intent to assist SSES to distribute their
products more effectively.
One important managerial implication is that there are high costs to making an
incorrect channel decision. Evidence from the study reveals that once a channel
decision is made (whether right or wrong), it tends to be reinforced over time as new
products are sold through established channels. Thus, if the ‘wrong1 channel is
selected, high costs of changing the channel may face the firm. This possibility
emphasizes the importance of a firm taking a long-run dynamic view of distribution
channel choice rather than settling on an alternative that meets only transient criteria
(such as convenience and availability). Thus, any attempts to improve the
distribution of products from small-scale enterprises must first consider the factors,
which have been identified as having a significant influence in the channel selection
decision. Indeed, empirical evidence reinforces the long-held institutional view that
distribution channel choice is a significant investment that should not be make lightly
(Becker and Thorelli, 1980)
This study also finds support for the service output theory advanced by
Bucklin(1966). The points in this theory is that unlike small order sizes, larger order
sizes would be characterized by less service outputs and are thus more economical
for the company to handle. Thus, from a managerial viewpoint, if end customers are
willing to buy in large quantities, the company should aim at serving them directly. "
Otherwise, it would be more economical to serve them through channel
intermediaries. ThuSjthe existence of demand for relatively small and larger order
sizes in the served markets would justify the use of alternative channels for the same
market as a strategic product distribution option. However, delegation of the
49
responsibility for handling increased order frequencies is likely to depend on the
suitability of existing distributors. If these are unsuitable according to the firms’
requirements, the firm may opt to handle the increased orders through a direct
distribution channel, at perhaps increased costs to the buyer. Alternatively, the firm
could induce buyers to reduce their purchase frequencies by encouraging them to
buy in large quantities through, for example, offering quantity discounts.
The findings of this study also revealed that middlemen availability and their
expected profit margins were important factors in the selection of product distribution
channels. Thus, it seemed plausible that most firms faced by the lack of suitable
intermediaries willing to carry their products, chose to use integrated distribution
channels (Stem and El-Ansary, 1992). The major challenge for small-scale firms in
this case would be how to overcome their inefficiencies due to company size and the
perceived poor quality of their products. A possible strategic alternative is for the
firms to pool resources with other small firms, perhaps through joint venture
arrangements or co-marketing alliances in order to reduce their inefficiencies due to
company size. As Masinde (1996) notes, these alliances would also be important if
these enterprises are to develop a capacity to bargain in contractual relationships
with intermediaries.^On the same note, small firms will need to invest in product
development in order to counter the perceived poor quality of their products that
inhibits their ability to use middlemen to distribute their products. Perhaps by
changing their strategy from reactive to proactive strategies towards product
development, SSES would be able to overcome many bottlenecks in the marketing
and distribution of their products. Boyd and Walker (1990), suggest that proactive
strategies will include: a research and development strategy which endeavors to
come up with superior technical products, a marketing strategy which is predicated
50
An interesting variable this study did not consider is the extent of product
differentiation for the products manufactured by small-scale firms. These data would
have been extremely difficult to obtain and an estimation of this variable would only
have been an arbitrary exercise. However, McGuire and Stalin (1983), contend that
the extent of product differentiation or standardization can be an important factor in
the choice of distribution channels. Product differentiation or standardization can
result from a combination of physical product characteristics, selling efforts by the
channel members and from the process of consumer choice. Therefore, a direct
channel is likely to be chosen if the selling effort is particularly crucial to the process
of differentiation of a certain product. McGuire and Stalin conclude that integration is
more profitable for a manufacturer than non-integration when consumers perceive
products of different manufacturers to be highly differentiated and not substitutable.
Coughlan (1985), supports this conclusion with the preposition that highly
differentiated products are more likely to be sold through integrated channels.
A big challenge for small-scale operators in this case would be for them to
adopt a differentiated marketing strategy that allows them to integrate their
distribution operations. Thus, by attempting to concentrate their efforts on certain
market segments through differentiated products and services, SSES would be able
to specialize and this would also give them an opportunity to carefully analyze the
customer needs, and wants and put all their efforts into satisfying the needs of these
segments. Indeed, it is argued that the small firms’ strength often results from their
ability to render a specific product or service competitively. Therefore,limited
markets, too small for big firms would provide the best opportunity for these firms
(Kibera, 1996).
on identifying consumer needs, an entrepreneurial strategy which structures an
organization is a way that will encourage innovativeness and an acquisition strategy.
51
Finally, this study has important implications in terms of public policy. The
government on its part will need to develop low cost and affordable business training
programmes that equip small-scale operators with the knowledge and skills to make
optimal decisions regarding the distribution of their products and on how to chose
and retain the right intermediaries for their products. Further, the government will
need to assist small-scale firms distribute their products more effectively and widely
by creating an economic incentive structure, that encourages procurement of
supplies by itself, other industries and organizations from small-scale industries. For
instance, by ensuring that a fair proportion of its total purchases, contracts and sub
contracts for property and services are placed with small-scale enterprises, the
government can ensure that SSES have access to wider markets for their products
and hence can be able to distribute their products more extensively and probably
even more effectively.
5.3 Limitations of the Study
This study had the following limitations:% /
1. Due to the absence of a sampling frame, a non-conventional sampling technique
was used to select the sample to be/Studied. Thus, the results of the study may
only apply t o / h e population studied and generalizing these to a wider population
may be erroneous.
2. Lack of co-operation from some respondents reduced the sample size. Thus,
despite the fact that the researcher explained to each respondent the purpose of
the study some still feared that this was aimed at forcing them to pay taxes.
3. The nature of some respondents required that some questions had to be
explained in the Kikuyu and Kiswahili languages. In the process it is possible that
some of the original meanings may have been distorted.
52
5.4 Suggestions for further Research
The following areas deserve further research:
1. A study may need to be carried out to compare the choice of product distribution
channels in large-scale and small-scale enterprises. This would possibly lead to
more conclusive results regarding the channel structure decisions of firms.
2. A more comprehensive market research should be carried out to determine the
relationship between the distribution channels selected by a firm and their
performance.
3. Given the recent emphasis by the government of Kenya on an export led growth
strategy as opposed to the import substitution strategy, attention could perhaps
be focused on the factors that determine selection of product distribution
channels in foreign markets by locally based business enterprises.
/
53

BIBLIOGRAPHY
Aleke - Dondo (1993), “Assisting the Informal Sector in Kenya: A Comparative Analysis of the Performance of K-Rep Assisted NGOS”. K-Reo Research PaperNo. 3
Amaa, Kweku, 0 (1997), “ An Analysis of Demand Factors for Improving Distribution of Beer in Tanzania”. Nairobi Journal of Management, Vol. 3. January / April.
Anderson, E (1985), “The Sales Person as Outside Agent or Employee: A Transaction Cost Analysis”. Marketing Science, Vol. 4 (Summer).
Anderson, E and Anne J. Coughlan (1987), “International Market Entry andExpansion via Independent or Integrated Channels of Distribution”. Journal of Marketing, Vol. 51,No.1, (January).
ArapChepkurui, P.G (1981), A study of the Marketing of Agricultural Products byRoadside Traders in Nairobi. Unpublished MBA Thesis, University of Nairobi.
Aspinwall, Leo. V (1961), “ The Marketing Characteristics of Goods and ParallelSystems of Promotion and Distribution” . In Marketing Classics: A Selection of Influential Articles, Ben M. Enis and Keith K. Cox, Boston: Allyn and Bacon, 1981.
Baker, Michael ,J (1992), Marketing Strategy and Management. London: Macmillan.
Becker, Helmut and Hans Thorelli (1980), “Strategic Planning in InternationalMarketing”, in International Marketing Strategy, rev. ed., Hans Thorelli and HelmutBecker, Eds. New York: The Pegamon Press.
Boyd, H.W and Orville C. Walker (1990), Marketing Management: A Strategic , Approach. Homewood: Richard D. Irwin.
Brady, D.L (1978), “ An Analysis of Factors Affecting the Methods of Exporting Used By Small Manufacturing Firms.” In Marketing Strategy and Management Michael J.Baker, London: Macmillan, 1992.
Bucklin, Louis, P (1966), “A Theory of Distribution Channel Structure” .In Marketing Strategy and Management. Michael J. Baker, London:Macmillan, 1992.
Bwisa, Henry M. (1998), How to Find and Evaluate a Business Opportunity: A Guide For Those Contemplating Starting a New Business. Nairobi: Mukmik Consultants.
Calvet, A.L (1981), “ A Synthesis of Foreign Direct Investment Theories and Theories of the Multinational Firm”. Journal of International Business Studies. Vol. 12, (Spring-Summer).
Carson, David (1963), “ Wholesaling in Tropical Africa” In Robert Bartels (Ed.)Comparative Marketing: Wholesaling in Fifteen Countries. Chicago: American Marketing Association.
54

Chege, J.M (1996), “ Factors Influencing the Choice of Product Distribution Channels In Kenya”. Unpublished Ph.D. Thesis, Kenyatta University.
Cooper D. R and Emory C. William (1995, Business Research Methods. Chicago: McGraw- Hill.
Coughlan, Anne T. (1985), “Competition and Co-operation in Marketing ChannelChoice: Theory and Application”, Marketing Science, Vol. 4, No.2.
Dossajee, H. (1992), Factors Perceived to Contribute to Success in Small Business: The Case of K-Map Trainers and Clients. Unpublished MBA Thesis, University of Nairobi.
Ekpenyong, David (1992), “Small and Medium-Scale Enterprises in Nigeria. Their Characteristics, Problems and Sources of Finance”. African Economic Research Consortium, Research Paper No. 16 (December).
Esbin. H. B. (1994), The Marketing and Promotion of Jua Kali by Government and Institutional Partners. Geneva: International Labor Office.
Glaser, T (1989), “Small and Medium Enterprises” The Courier, May - June.
Government of Kenya (1986), Sessional Paper No.1 on Economic Management for Renewed Growth. Nairobi: Government Printer.
GOK / ILO / UNDP (1989), “A Strategy for Small Enterprise Development in Kenya Towards the year 2000. A GOK / ILO / UNDP Report. Nairobi.
Government of Kenya (1992), Sessional Paper No.2 on Small Enterprise and Jua- Kali Development in Kenya Nairobi: Government Printer.
Government of Kenya (1997), Thika District Development Plan 1997-2000. Nairobi: Government Printer
Government of Kenya (1998), Economic Survey 1998. Nairobi: Government Printer.
House, William (1978), “ The Urban Informal Sector: It’s Potential of GeneratingIncome Employment in Kenya”, Institute of Development Studies, University of Nairobi, Working Paper No.347.
Kaplinsky, F (1991), “ From Mass Production to Flexible Specialization: A Case Study From a Semi-Industrialized Country” . IDS, Sussex Discussion Paper No. 295, IDS Publication.
ILO (1972), Employment, Incomes and Egualitv: A Strategy for IncreasingProductive Employment in Kenya. Geneva: International Labour Office.
ILO (1991), The Dilema of the Informal Sector: Report of the Director General (Part 1). Geneva: International Lobour Office.
Kariuki, Charles, N (1989), “Apriori Determinants of Performance of Entrepreneurs in55

the Jua Kali Sector; The Case of Nairobi Eastlands”. Unpublished MBA Thesis, University of Nairobi.
Keegan, Warren J. (1984) Multinational Marketing Management. New Jersey: Prentice- Hall.
Kessio, K.J (1981), Study of The Problems Facing Small Business and the Effect of Management Training on the Performance of Properties. A Case Study of Nandi District. Unpublished MBA Thesis, University of Nairobi.
Kiamba, C.M (1983), “ The Role of Small and Intermediate Cities in NationalDevelopment:The Case Study of Thika , Kenya”. Institute of Development Studies, University of Nairobi.
Kibera.F.N and B. Waruingi (1988), Fundamentals of Marketing: An African Perspective. Nairobi:Kenya Literature Bureau.
Kibera, F. N. (1997), “ Marketing Strategies for the Small Business in Kenya”. Nairobi Journal of Management. Vol. 3 January / April.
Kinsey, Joanna (1988), Marketing in Developing Countries. London: Macmillan.
Kotler, Philip (1997), Marketing Management: Analysis, Planning, Implementation and Control. New Jersey: Prentice-Hall.
Lynn, Robert (1969), Marketing Principles and Market Action. New York: McGraw-Hill./
Maalu, Jackson K. (1990), Factors Influencing Record Keeping in Small-Scale Enterprises: A Case of Micro-Enterprises in the Eastlands of Nairobi. Unpublished MBA Thesis, University of Nairobi.
Masinde, C.K. (1996), “Small Enterprise Development through Outsourcing Activities of Large Firms in Kenya’s Motor Industry”. Nairobi Journal of Management. Vol. I2, October.
Me Cormick D, “Small Manufacturing Enterprises in Nairobi” Department of Economics Working Paper 1986, University of Nairobi.
McGuire, Timothy W and Richard Stalin (1983), “An Industry Equilibrium: Analysis of Downstream Vertical Integration”. Journal of Marketing. Vol. 2, No. (Spring).
Muiruri, P. N. (1989), The Physical Distribution Problems Facing Nairobi City Center Open-Air Vegetable and Fruit Sellers. Unpublished MBA Thesis, University of Nairobi.
Muma , Leah Achieng (1982), Marketing in Kenya : A Case of Rural Markets in Kisumu District. Unpublished MBA Thesis, University of Nairobi.
Muturia, J. M. (1996), Factors Influencing Credit Delivery Systems to Small-Scale Enterprises. Unpublished MBA Thesis, University of Nairobi.
56
Ndua Gichiri and Njuguna Ng’ethe (1984), “The Role of the Informal Sector in Development of Small and Intermediate Cities: A Case Study of Nakuru”. Institute of Development Studies, University of Nairobi.
Ombok, M.A. (1990), Factors that Determine Entrepreneurial Behavior: A Case Study of Small-Scale Enterprises in Kisumu. Unpublished MBA Thesis, University of Nairobi.
Padolecchia, Siro, P (1979), Marketing in the Developing World. New Delhi: Vikas Publishing House.
Parker J. L. and Torries R.T. (1993), “Micro and Small Enterprises in Kenya” K-REP National Baseline Surverv Research Paper No. 24. Nairobi (March).
Scarborough, Norman and T. M. Zimmerer (1991), Effective Small Business Management. Columbus: Merrill.
Shaw, Susan. A and Juliette Gibbs (1996), “ The Role of Marketing Channels in the Determination of Horizontal Market Structure: The Case of Fruit and Vegetable Marketing by British Growers”. International Review of Retail. Distribution and Consumer Research, Vol.6, No. 3, (July)
Stanton, William .J, Et al (1994), Fundamentals of Marketing. New York: McGraw Hill.
Stern,Louis W and A. El- Ansary (1992) Marketing Channels. New Jersey: Prentice Hall.
/
Stigler, George .J (1951), “ The Division of Labor Is Limited by the Extent of the Market” In Michael, J.Baker, Marketing Strategy and Management. London: Macmillan
Wandungi, M. Ngugi (1994), Some Factors Influencing the Performance of Small- Scale Industries: A Case of Kiambu Town. Unpublished MBA Thesis, University of Nairobi.
Yambo, Mauri (1988), “ Reconnaissance of Jua-Kali Support Activities in Kenya”. Nairobi: Institute of Development Studies, University of Nairobi.
57
APPENDICES
Appendix I: Covering Letter.
University of Nairobi Faculty of Commerce
Department of Business Administration P.0. Box 30197
Nairobi.
March, 2000
Dear Respondent,
I am a postgraduate student in the Faculty of Commerce, University of Nairobi. Currently, I am conducting a Management Research Project on “ FACTORS INFLUENCING THE CHOICE OF PRODUCT DISTRIBUTION CHANNELS FOR SMALL-SCALE MANUFACTURING FIRMS: A CASE OF THIKA TOWN”. This is in partial fulfillment of the requirements for the Master of Business Administration (MBA) degree.
I am kindly requesting you to fill in the attached questionnaire the soonest possible and to the best of your knowledge. The information you give is needed purely for academic research purposes and will therefore be treated with strict confidence. In no way will your name appear in the final report.
A copy of the final report will be made available to you upon request
Your assistance and co-operation will be highly appreciated. Thank you in advance.
Yours faithfully,
Pius K. Nq’anq’a MBA STUDENT
Dr. R. M. Musyoka SUPERVISOR
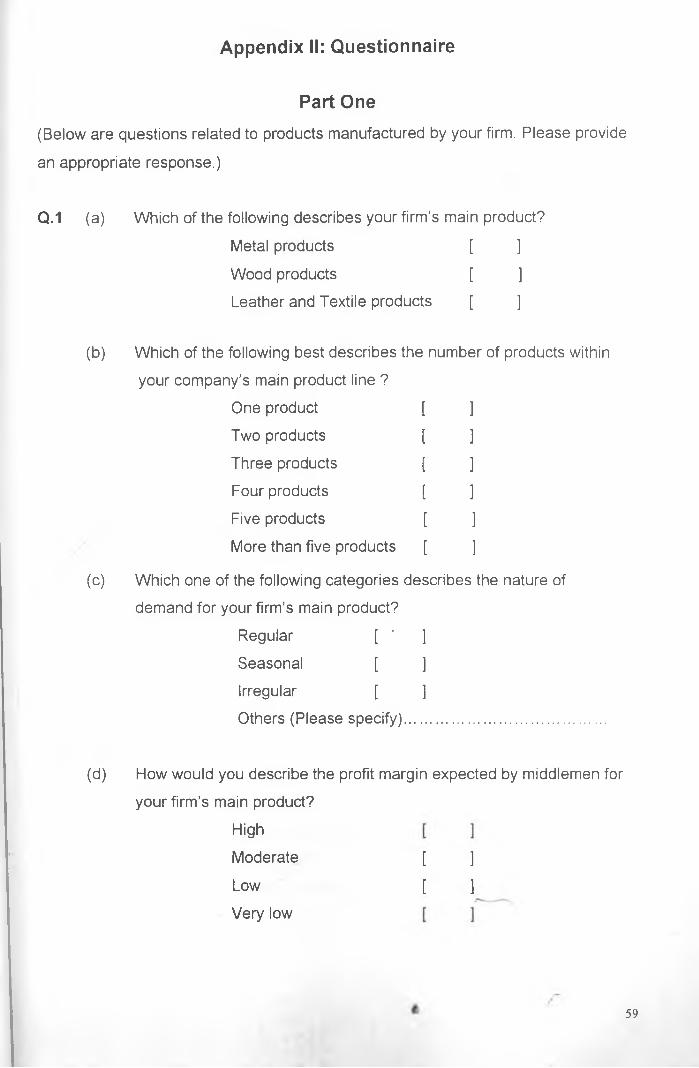
Appendix II: Questionnaire
Part One(Below are questions related to products manufactured by your firm. Please provide
an appropriate response.)
Q.1 (a) Which of the following describes your firm’s main product?
Metal products [ ]
Wood products [ ]
Leather and Textile products [ ]
(b) Which of the following best describes the number of products within
your company’s main product line ?
One product [ ]
Two products [ J
Three products [ ]
Four products [ ]
Five products [ ]
More than five products [ ]
(c) Which one of the following categories describes the nature of
demand for your firm’s main product?
Regular [ ' ]
Seasonal [ ]
Irregular [ ]
Others (Please specify)....................................
(d) How would you describe the
your firm’s main product?
High
Moderate
Low
Very low
profit margin expected by middlemen for
[ ]
[ ]
59
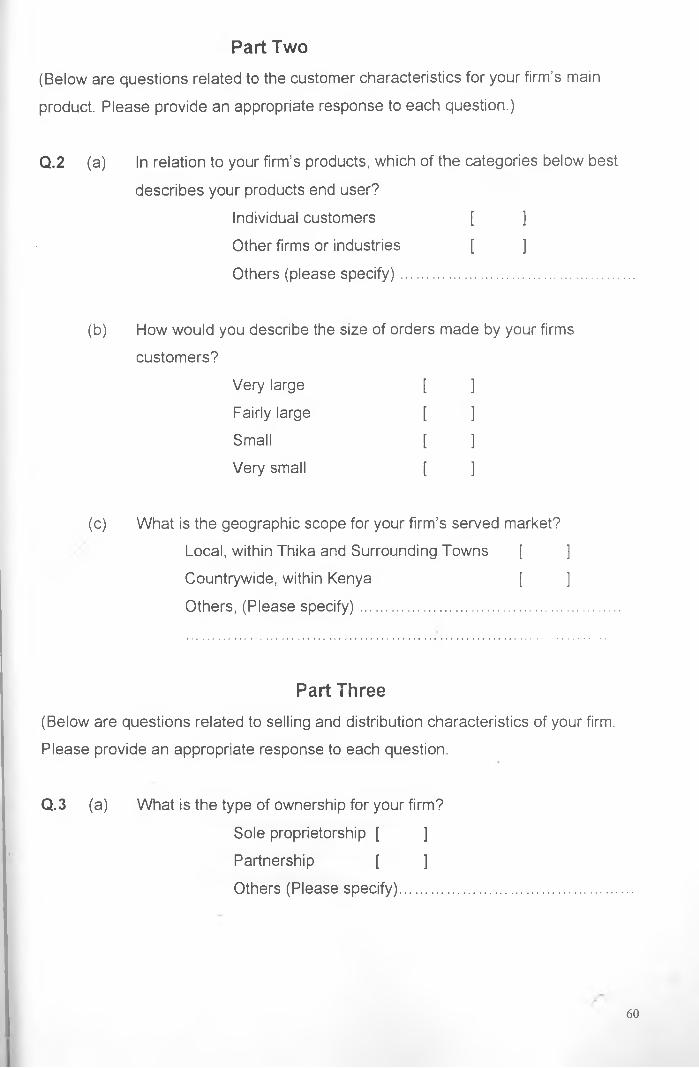
Part Two(Below are questions related to the customer characteristics for your firm’s main
product. Please provide an appropriate response to each question.)
Q.2 (a) In relation to your firm’s products, which of the categories below best
describes your products end user?
Individual customers [ ]
Other firms or industries [ ]
Others (please specify).................................................
(b) How would you describe the size of orders made by your firms
customers?
Very large [ ]
Fairly large [ ]
Small [ ]
Very small [ ]
(c) What is the geographic scope for your firm’s served market?
Local, within Thika and Surrounding Towns [ ]
Countrywide, within Kenya [ ]
Others, (Please specify)..........................................................
Part Three(Below are questions related to selling and distribution characteristics of your firm.
Please provide an appropriate response to each question.
Q.3 (a) What is the type of ownership for your firm?
Sole proprietorship [ ]
Partnership [ ]
Others (Please specify).................................................
60
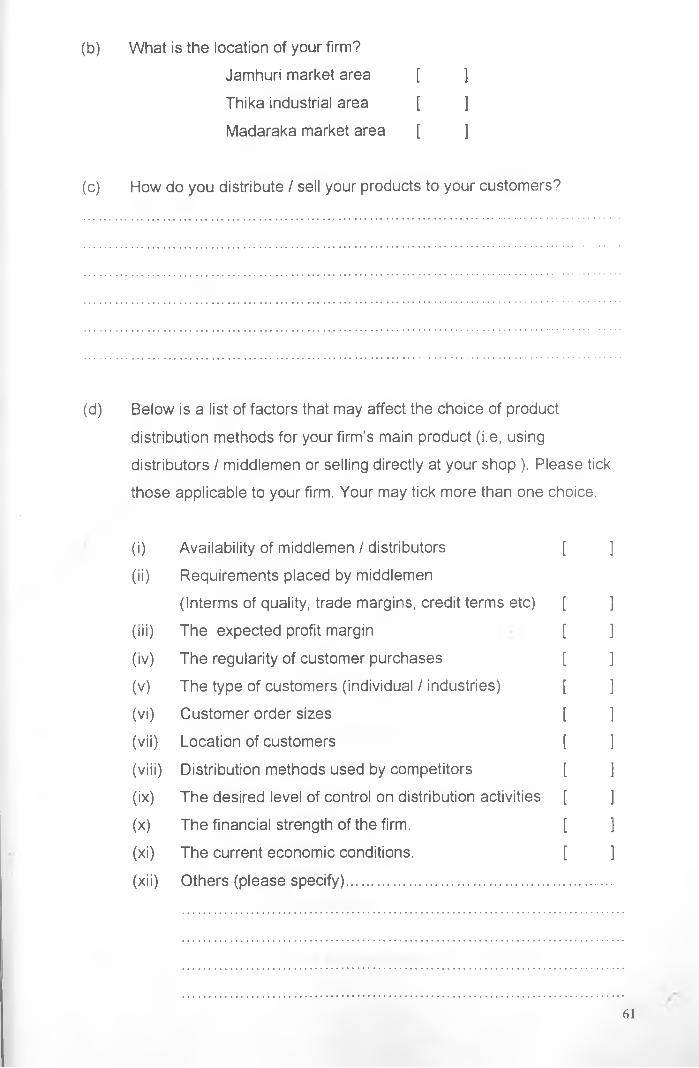
(b) What is the location of your firm?
Jamhuri market area [ ]
Thika industrial area [ ]
Madaraka market area [ ]
(c) How do you distribute / sell your products to your customers?
(d) Below is a list of factors that may affect the choice of product
distribution methods for your firm’s main product (i.e, using
distributors / middlemen or selling directly at your shop ). Please tick
those applicable to your firm. Your may tick more than one choice.
(i)
(ii)
Availability of middlemen / distributors
Requirements placed by middlemen[ ]
(Interms of quality, trade margins, credit terms etc) [ ](iii) The expected profit margin [ ](iv) The regularity of customer purchases [ ]
(v) The type of customers (individual / industries) [ ](Vi) Customer order sizes [ ](vii) Location of customers [ ]
(viii) Distribution methods used by competitors [ ](ix) The desired level of control on distribution activities [ ]
(x) The financial strength of the firm. [ ](xi) The current economic conditions. [ ](xii) Others (please specify)..............................................
61
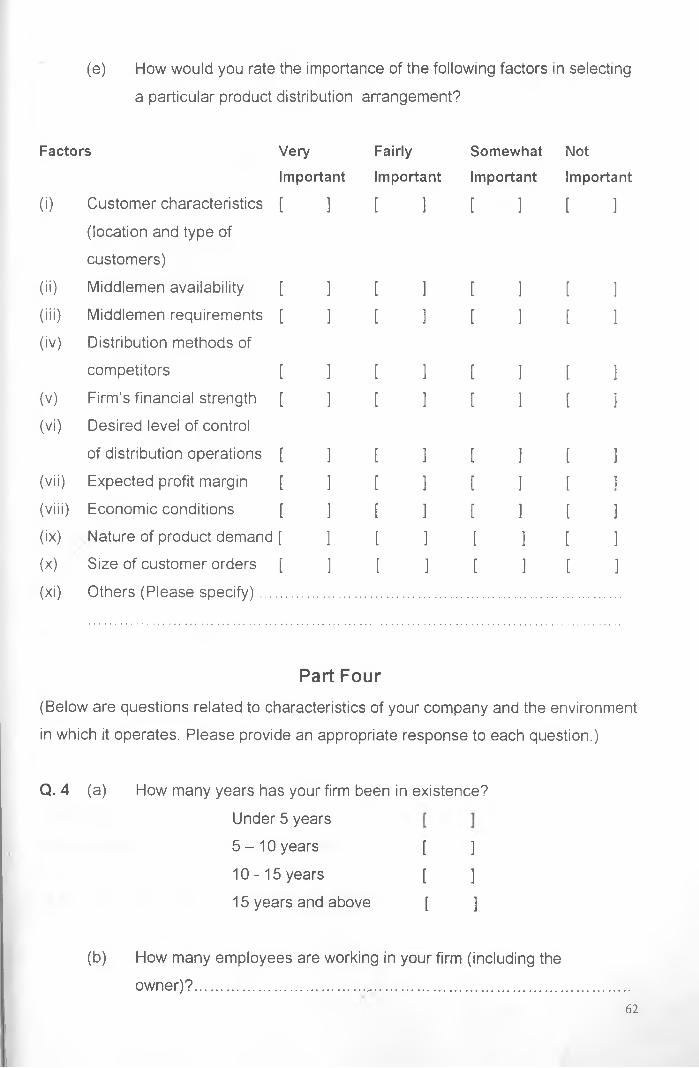
(e) How would you rate the importance of the following factors in selecting
a particular product distribution arrangement?
Factors VeryImportant
(i) Customer characteristics [ ](location and type of
customers)
(ii) Middlemen availability [ ](iii) Middlemen requirements [ ](iv) Distribution methods of
competitors [ ](v) Firm’s financial strength [ ](vi) Desired level of control
of distribution operations [ ](vii) Expected profit margin [ ](viii) Economic conditions [ ](ix) Nature of product demand [ ](x) Size of customer orders [ ](xi) Others (Please specify) ...
Fairly Somewhat NotImportant Important Important
[ ] [ ] [ ]
[ ] [ ] [ ][ ] [ ] [ ]
[ ] [ ] [ ][ ] [ ] [ ]
[ ] [ ] [ ][ ] [ ] [ 3
[ ] [ ] [ 3
[ ] [ ] [ 3
[ ] [ ] [ 3
Part Four(Below are questions related to characteristics of your company and the environment
in which it operates. Please provide an appropriate response to each question.)
Q. 4 (a) How many years has your firm been in existence?
Under 5 years
5 - 1 0 years [ ]
10-15 years [ ]
15 years and above [ ]
(b) How many employees are working in your firm (including the
owner)?..................................... .............................................62
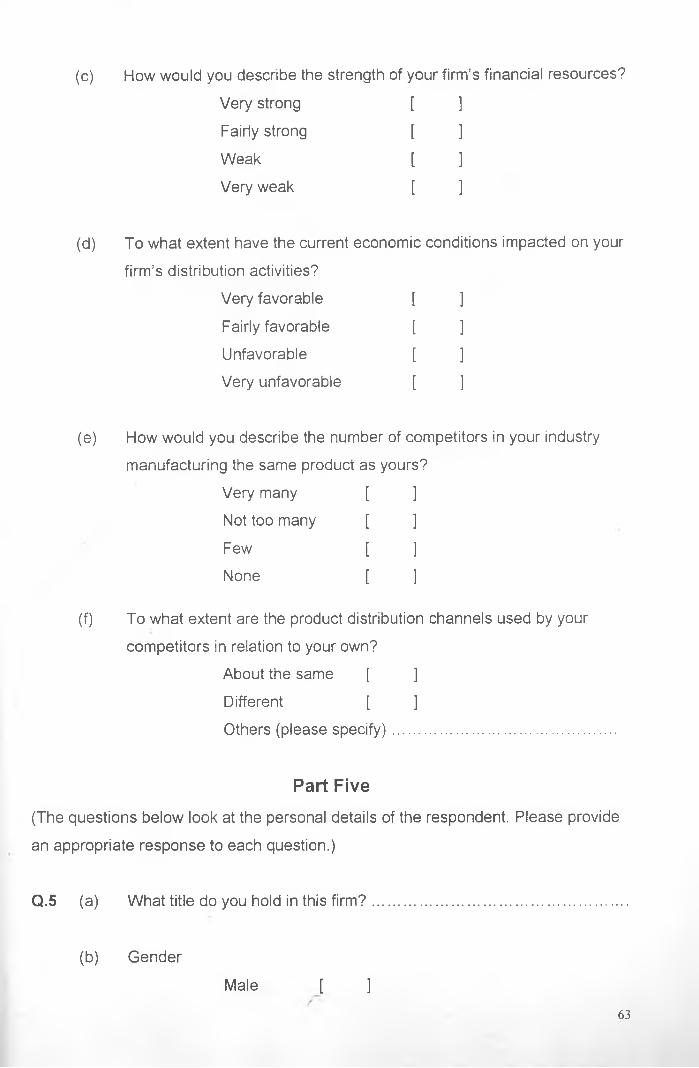
(c) How would you describe the strength of your firm’s financial resources?
Very strong [ ]
Fairly strong [ ]
Weak [ ]
Very weak [ ]
(d) To what extent have the current economic conditions impacted on your
firm’s distribution activities?
Very favorable [ ]
Fairly favorable [ ]
Unfavorable [ ]
Very unfavorable [ ]
(e) How would you describe the number of competitors in your industry
manufacturing the same product as yours?
Very many [ ]
Not too many [ ]
Few [ ]
None [ ]
(f) To what extent are the product distribution channels used by your
competitors in relation to your own?
About the same [ ]
Different [ ]
Others (please specify)...............................................
Part Five(The questions below look at the personal details of the respondent. Please provide
an appropriate response to each question.)
Q.5 (a) What title do you hold in this firm?
(b) Gender
Male [ 163

Female
(c) What is your highest formal education attainment?
No formal schooling at all
Primary school level [ ]
Secondary school level [ ]
College / University level [ ]
Others (please specify)...........................
(d) Have you ever attended any formal business training?
Yes [ ]
No [ ]
THANK YOU FOR YOUR CO-OPERATION
64
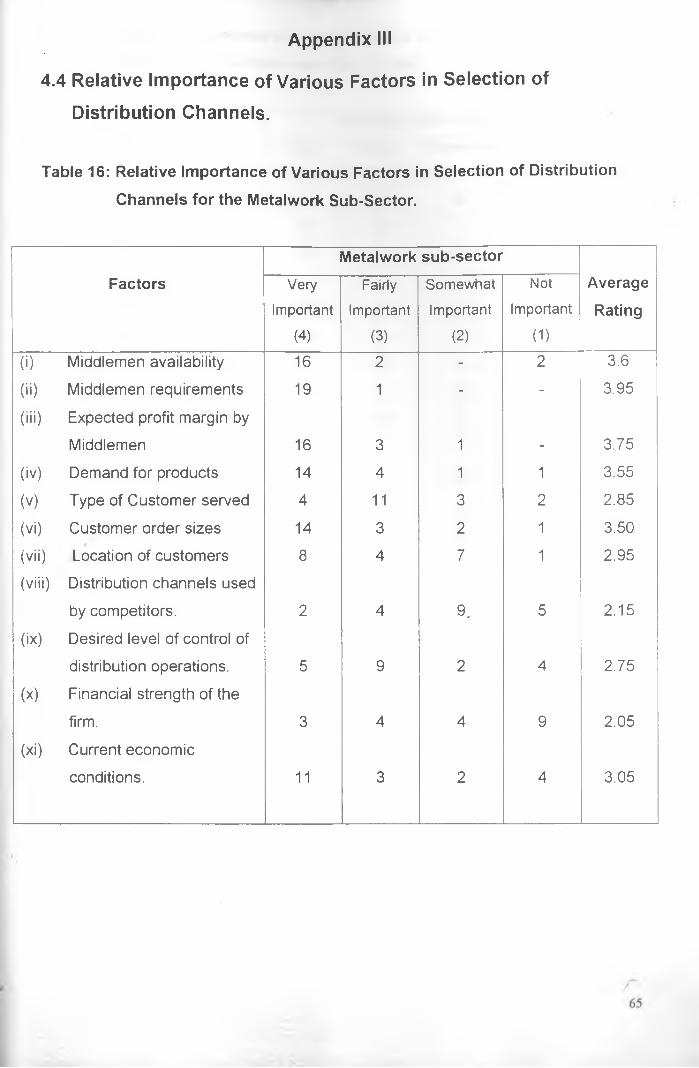
Appendix III
Table 16: Relative Importance of Various Factors in Selection of Distribution
Channels for the Metalwork Sub-Sector.
4.4 Relative Importance of Various Factors in Selection of
Distribution Channels.
Metalwork sub-sectorFactors Very Fairly Somewhat Not Average
Important Important Important Important Rating(4) (3) (2) (1)
(i) Middlemen availability 16 2 - 2 3.6
(ii) Middlemen requirements 19 1 - - 3.95
(iii) Expected profit margin by
Middlemen 16 3 1 - 3.75
(iv) Demand for products 14 4 1 1 3.55
(v) Type of Customer served 4 11 3 2 2.85
(Vi) Customer order sizes 14 3 2 1 3.50
(vii)s
Location of customers 8 4 7 1 2.95
(viii) Distribution channels used
by competitors. 2 4 9. 5 2.15
(ix) Desired level of control of
distribution operations. 5 9 2 4 2.75
(x) Financial strength of the
firm. 3 4 4 9 2.05
(xi) Current economic
conditions. 11 3 2 4 3.05
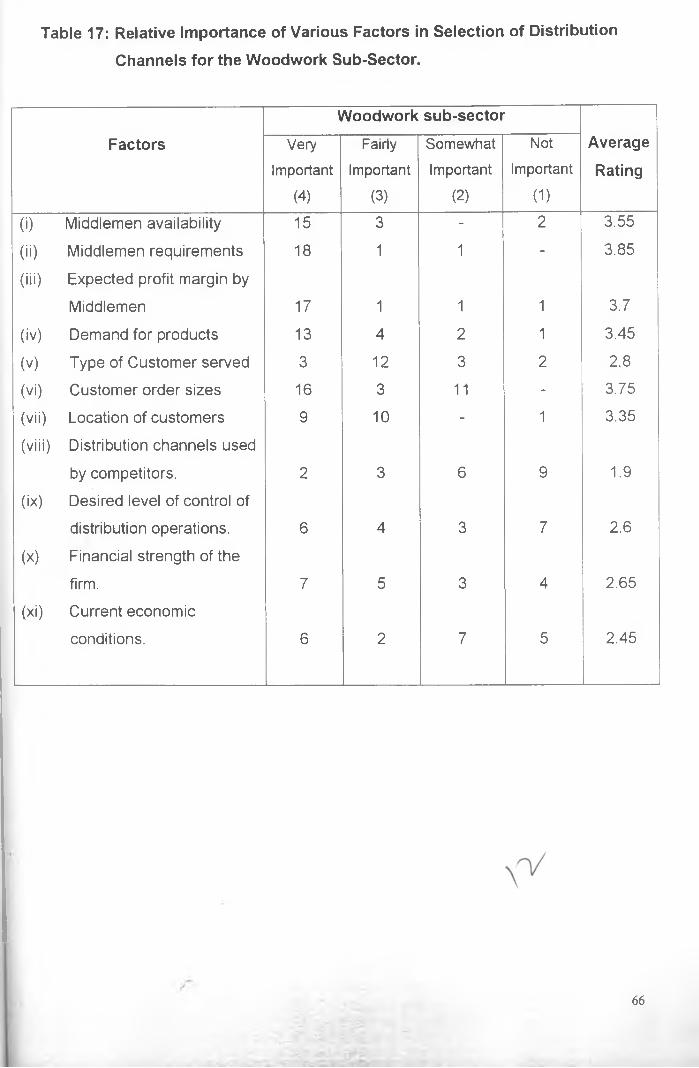
Table 17: Relative Importance of Various Factors in Selection of Distribution
Channels for the Woodwork Sub-Sector.
Woodwork sub-sector
Factors Very Fairly Somewhat Not AverageImportant Important Important Important Rating
(4) (3) (2) (1)
(0 Middlemen availability 15 3 - 2 3.55
(ii) Middlemen requirements 18 1 1 - 3.85
(iii) Expected profit margin by
Middlemen 17 1 1 1 3.7
(iv) Demand for products 13 4 2 1 3.45
(v) Type of Customer served 3 12 3 2 2.8
(Vi) Customer order sizes 16 3 11 - 3.75
(vii) Location of customers 9 10 - 1 3.35
(viii) Distribution channels used
by competitors. 2 3 6 9 1.9
(ix) Desired level of control of
distribution operations. 6 4 3 7 2.6
(x) Financial strength of the
firm. 7 5 3 4 2.65
(xi) Current economic
conditions. 6 2 7 5 2.45
66
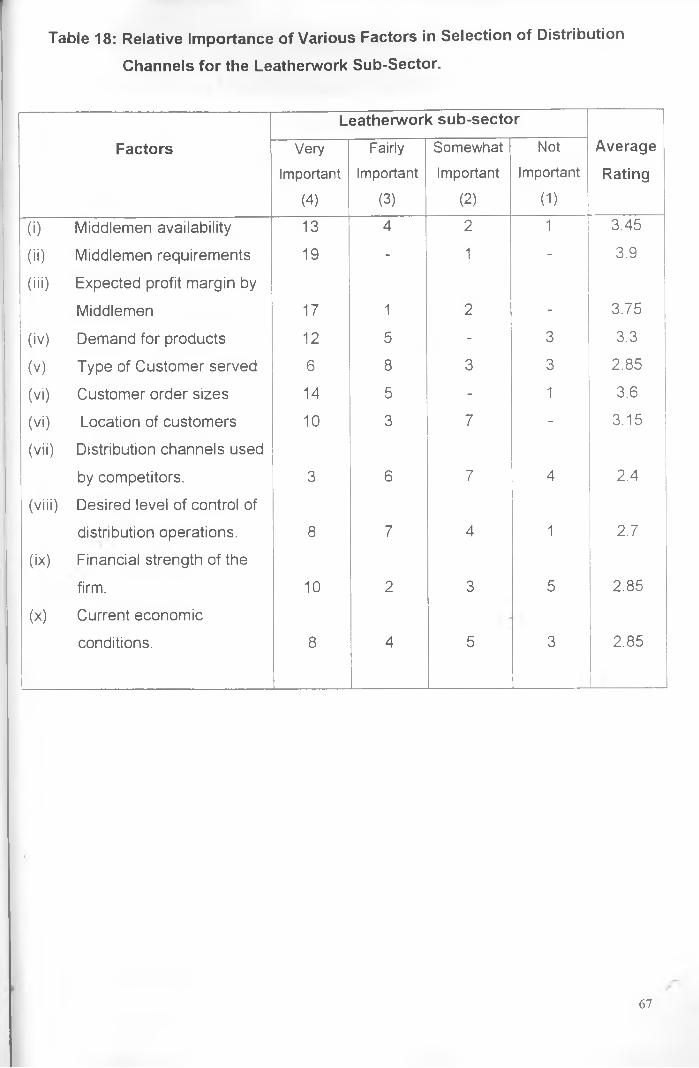
Table 18: Relative Importance of Various Factors in Selection of Distribution
Channels for the Leatherwork Sub-Sector.
Leatherwork sub-sector
Factors Very Fairly Somewhat Not AverageImportant Important Important Important Rating
(4) (3) (2) (1)
(i) Middlemen availability 13 4 2 1 3.45
(ii) Middlemen requirements 19 - 1 - 3.9
(iii) Expected profit margin by
Middlemen 17 1 2 - 3.75
(iv) Demand for products 12 5 - 3 3.3
(v) Type of Customer served 6 8 3 3 2.85
(vi) Customer order sizes 14 5 - 1 3.6
(Vi) Location of customers 10 3 7 - 3.15
(vii) Distribution channels used
by competitors. 3 6 7 4 2.4
(viii) Desired level of control of
distribution operations. 8 7 4 1 2.7
(ix) Financial strength of the
firm. 10 2 3 5 2.85
(x) Current economic
conditions. 8 4 5 3 2.85
67

Appendix IV
3.5.1 Description of the Chi-Square Technique Used.
In order to carry out the chi-square test, a random sample is selected from the
population and observed frequencies are presented in a cross-classification
contingency table. If a frequency table has got R rows and C columns it is known as
R * C contingency table. The entries in this table are made in little squares in the
table called the cells and the frequencies in these cells are called cell frequencies.
The totals of the frequencies in each row and column are called marginal
frequencies. Expected frequencies are then calculated according to the rules of
probability theory namely, if two variables are statistically independent then their joint
probability is the product of their individual probabilities.
Where;
e,j = expected frequencies for a cell that belongs to the ith row and jth column.
R, = corresponding row total
Cj = corresponding column total.
T = Grand total
ey = (R, * Cj) / T
The test statistic is the chi-square expected and the
observed frequencies using the following formulae:
= I ( Oi - e,)2 / ei
Where
Oj = observed cell frequency.68
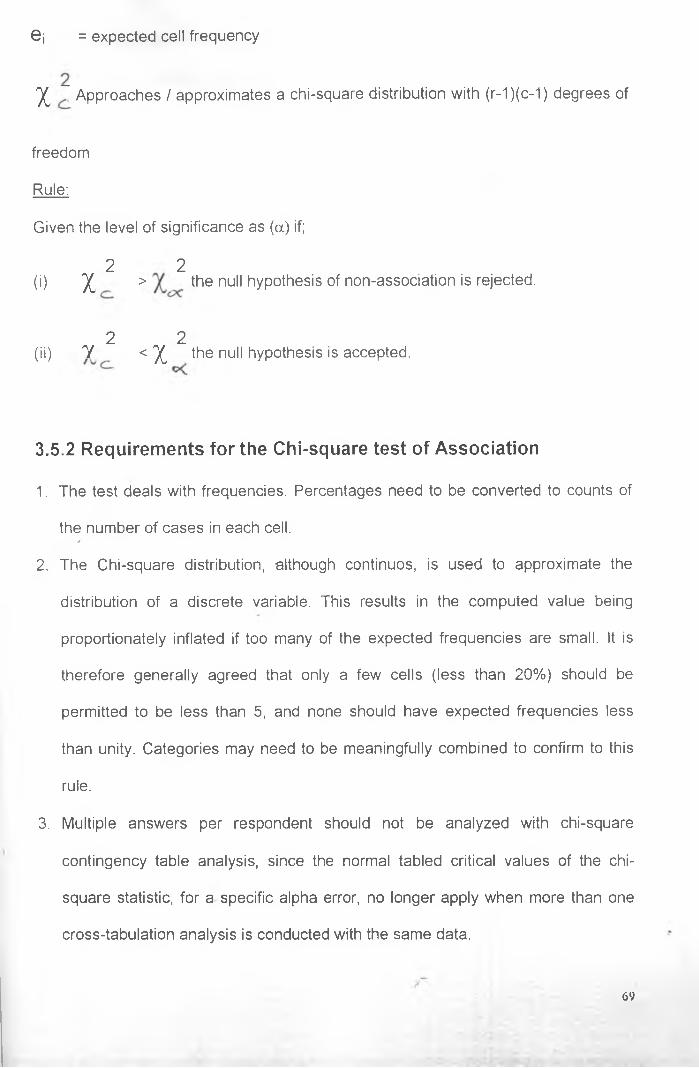
= expected cell frequencyej
% ~ Approaches / approximates a chi-square distribution with (r-1)(c-1) degrees of
freedom
Rule:
Given the level of significance as (a) if;
2 2(i) % > the null hypothesis of non-association is rejected.
2 2(ii) Y < % the null hypothesis is accepted.
3.5.2 Requirements for the Chi-square test of Association
1. The test deals with frequencies. Percentages need to be converted to counts of
the number of cases in each cell./2. The Chi-square distribution, although continuos, is used to approximate the
distribution of a discrete variable. This results in the computed value being
proportionately inflated if too many of the expected frequencies are small. It is
therefore generally agreed that only a few cells (less than 20%) should be
permitted to be less than 5, and none should have expected frequencies less
than unity. Categories may need to be meaningfully combined to confirm to this
rule.
3. Multiple answers per respondent should not be analyzed with chi-square
contingency table analysis, since the normal tabled critical values of the chi-
square statistic, for a specific alpha error, no longer apply when more than one
cross-tabulation analysis is conducted with the same data.
69

4. Each observation should be independent of the others. The chi-square test would
not be appropriate, for example, for analyzing observations on the same
individuals on a pretest - post test experiment.
Finally, though the chi-square test of association can be used to indicate if there is
any relation between two variables, it does not give the strength of the relationship
that may exist.
70
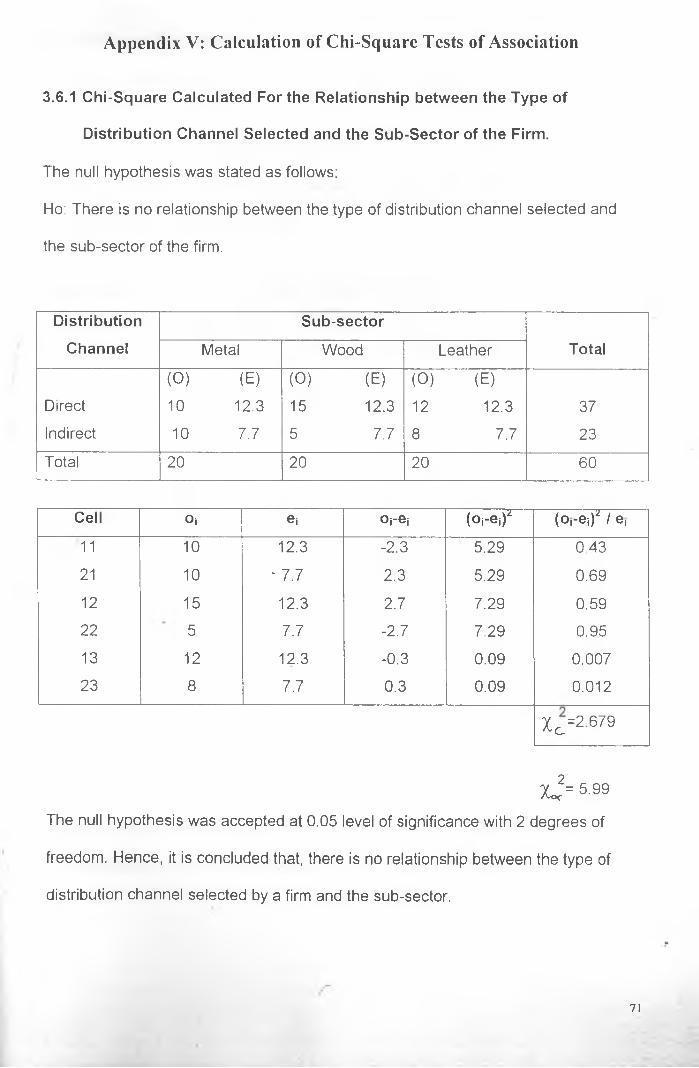
Appendix V: Calculation of Chi-Square Tests of Association
3.6.1 Chi-Square Calculated For the Relationship between the Type of
Distribution Channel Selected and the Sub-Sector of the Firm.
The null hypothesis was stated as follows:
Ho: There is no relationship between the type of distribution channel selected and
the sub-sector of the firm.
DistributionChannel
Sub-sectorTotalMetal Wood Leather
(0) (E) (O) (E) (O) (E)Direct 10 12.3 15 12.3 12 12.3 37Indirect 10 7.7 5 7.7 8 7.7 23
Total 20 20 20 60
Cell Oj ei Oj-ej (Oj-ej)* (0\-e \)2 1 e,
11 10 12.3 -2.3 5.29 043
21 10 - 7.7 2.3 5.29 0.69
12 15 12.3 2.7 7.29 0.5922 5 7.7 -2.7 7.29 0.95
13 12 12.3 -0.3 0.09 0.00723 8 7.7 0.3 0.09 0.012
X c=2679
x j= 5.99The null hypothesis was accepted at 0.05 level of significance with 2 degrees of
freedom. Hence, it is concluded that, there is no relationship between the type of
distribution channel selected by a firm and the sub-sector.
7 1
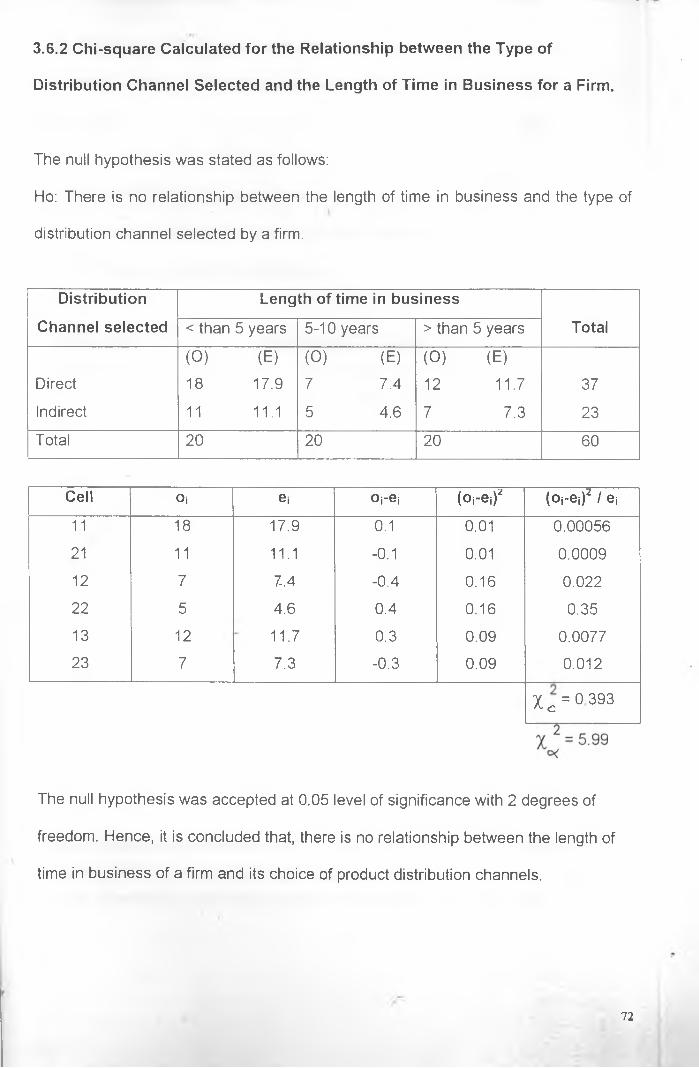
3.6.2 Chi-square Calculated for the Relationship between the Type of
Distribution Channel Selected and the Length of Time in Business for a Firm.
The null hypothesis was stated as follows:
Ho: There is no relationship between the length of time in business and the type of
distribution channel selected by a firm.
Distribution
Channel selected
Length of time in business
Total< than 5 years 5-10 years > than 5 years
(0) (E) (0) (E) (O) (E)Direct 18 17.9 7 7.4 12 11.7 37
Indirect 11 11.1 5 4.6 7 7.3 23
Total 20 20 20 60
Cell Oj ei Oi-ej (O i-e ,)z (Oj-ej)* / ej
11 18 17.9 0.1 0.01 0.00056
21 11 11.1 -0.1 0.01 0.000912 7 7.4 -0.4 0.16 0.02222 5 4.6 0.4 0.16 0.3513 12 11.7 0.3 0.09 0.007723 7 7.3 -0.3 0.09 0.012
X c = 0393
The null hypothesis was accepted at 0.05 level of significance with 2 degrees of
freedom. Hence, it is concluded that, there is no relationship between the length of
time in business of a firm and its choice of product distribution channels.
72
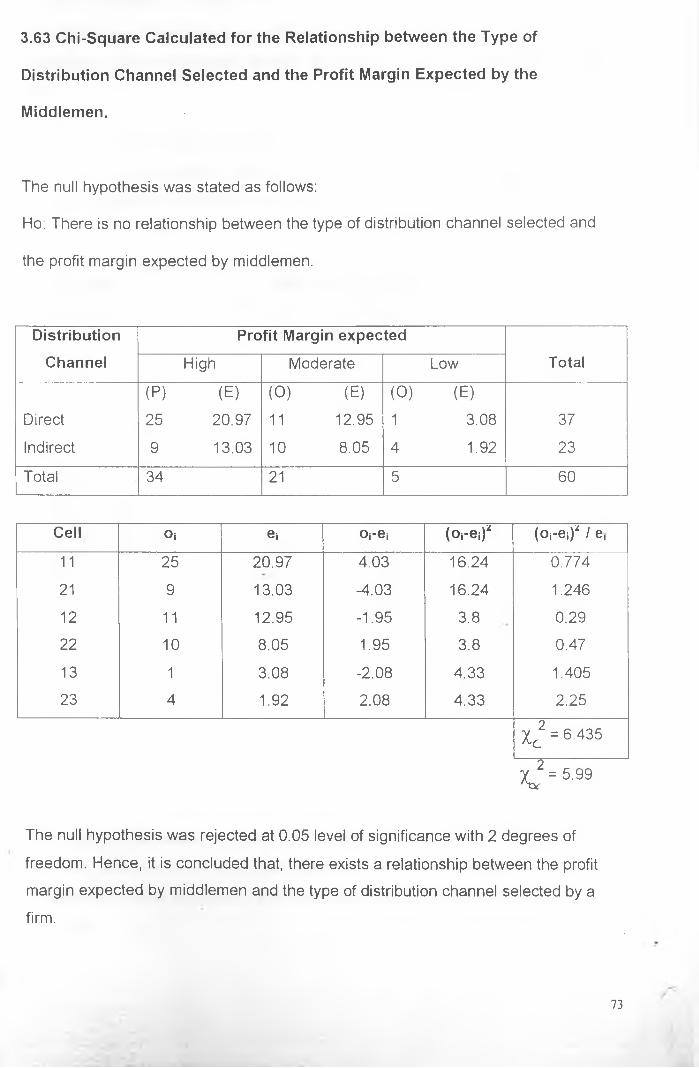
3.63 Chi-Square Calculated for the Relationship between the Type of
Distribution Channel Selected and the Profit Margin Expected by the
Middlemen.
The null hypothesis was stated as follows:
Ho: There is no relationship between the type of distribution channel selected and
the profit margin expected by middlemen.
DistributionChannel
Profit Margin expectedTotalHigh Moderate Low
(P) (E) (0) (E) (0) (E)Direct 25 20.97 11 12.95 1 3.08 37
Indirect 9 13.03 10 8.05 4 1.92 23
Total 34 21 5 60
Cell Oj ei Oj-ei (Oj-ej)" (Oj-ej)" / e,
11 25 20.97 4.03 16.24 0.774
21 9 13.03 -4.03 16.24 1.246
12 11 12.95 -1.95 3.8 0.29
22 10 8.05 1.95 3.8 0.47
13 1 3.08 -2.08 4.33 1.405
23 4 1.92 2.08 4.33 2.25
Xc2 = 6.435
X j = 5.99
The null hypothesis was rejected at 0.05 level of significance with 2 degrees of
freedom. Hence, it is concluded that, there exists a relationship between the profit
margin expected by middlemen and the type of distribution channel selected by a
firm.
73
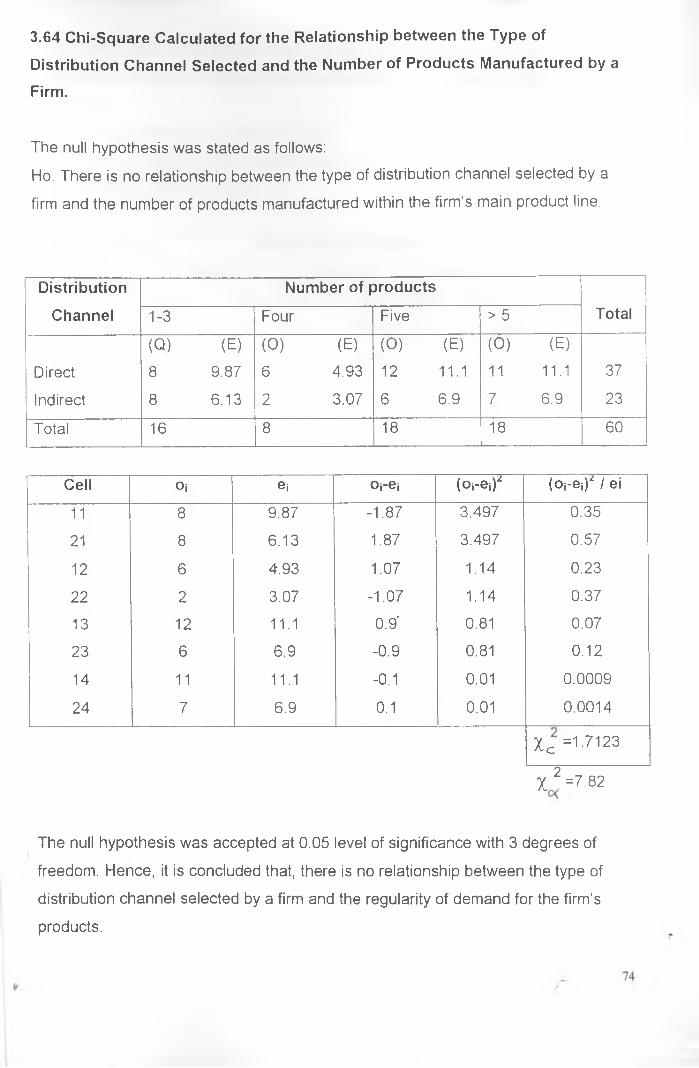
The null hypothesis was stated as follows:
Ho: There is no relationship between the type of distribution channel selected by a
firm and the number of products manufactured within the firm’s main product line.
3.64 Chi-Square Calculated for the Relationship between the Type of
Distribution Channel Selected and the Number of Products Manufactured by a
Firm.
DistributionChannel 1-3
(Q)Direct
Indirect
Total
8
8
~16
Number of products
Four Five > 5
(E) (0) (E) (O) (E) (O)
9.87 6 4.93 12 11.1 11
6.13 2 3.07 6 6.9 7
8 18 18
Total
l E j
11.1 37
6.9 23
66~~
Cell Oi ei Oj-e-, (Oi-ei)z (Oi-eO" / ei
11 8 9.87 -1.87 3.497 0.35
21 8 6.13 1.87 3.497 0.57
12 6 4.93 1.07 1.14 0.23
22 2 3.07 -1.07 1.14 0.37
13 12 11.1 0.9' 0.81 0.07
23 6 6.9 -0.9 0.81 0.12
14 11 11.1 -0.1 0.01 0.0009
24 7 6.9 0.1 0.01 0.0014
Xc =1-7123
X 2 =7.82
The null hypothesis was accepted at 0.05 level of significance with 3 degrees of
freedom. Hence, it is concluded that, there is no relationship between the type of
distribution channel selected by a firm and the regularity of demand for the firm’s
products.
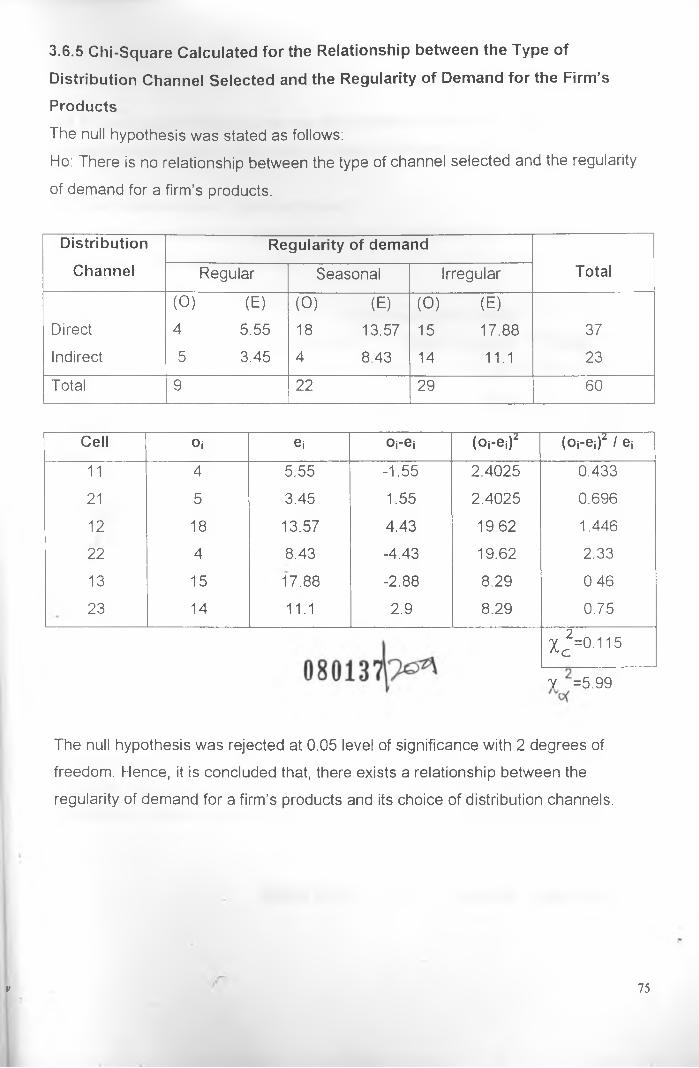
3.6.5 Chi-Square Calculated for the Relationship between the Type of Distribution Channel Selected and the Regularity of Demand for the Firm’s
Products
The null hypothesis was stated as follows:
Ho: There is no relationship between the type of channel selected and the regularity
of demand for a firm’s products.
DistributionChannel
Regularity of demand
Regular Seasonal Irregular
(0) (E)4 5.55
5 3.45
(0) (E)
18 13.57
4 8.43
(0) (E)
15 17.88
14 11.1
9 22 29
Total
Direct
Indirect
Total
37
23
~60~
Cell Oj ei Oj-ej (os-eO* (Oj-ei)* / ej
11 4 5.55 -1.55 2.4025 0.433
21 5 3.45 1.55 2.4025 0.696
12 18 13.57 4.43 19.62 1.446
22 4 8.43 -4.43 19.62 2.33
13 15 17.88 -2.88 8.29 0.46
23 14 11.1 2.9 8.29 0.75
Xc2=0.115
7 =5.99
The null hypothesis was rejected at 0.05 level of significance with 2 degrees of
freedom. Hence, it is concluded that, there exists a relationship between the
regularity of demand for a firm’s products and its choice of distribution channels.
V 75
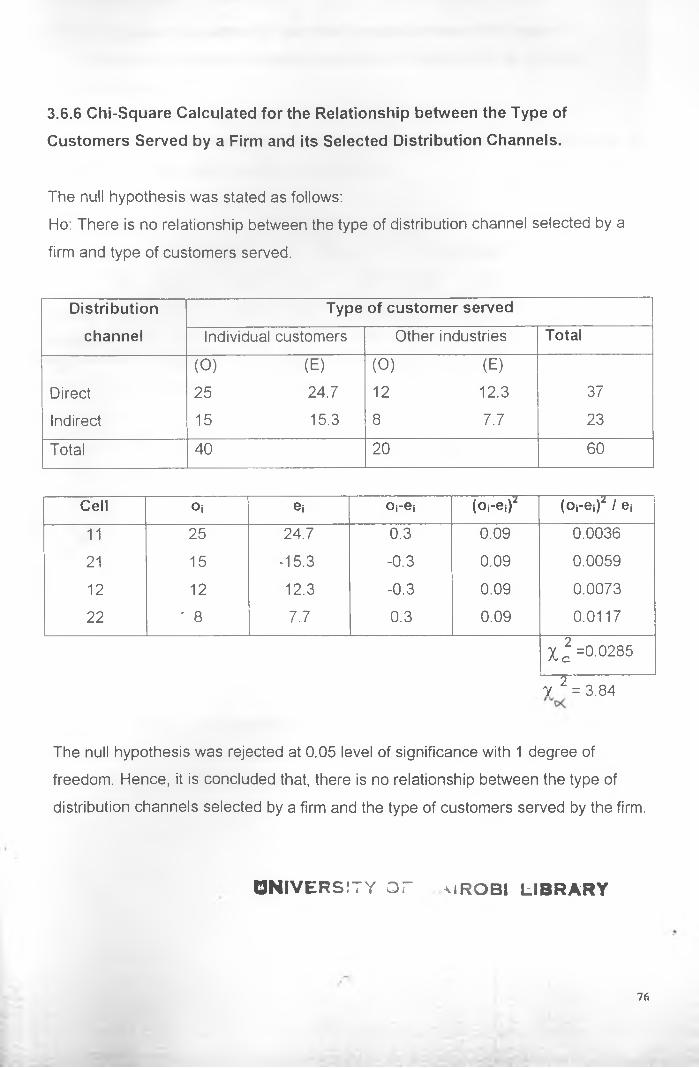
3.6.6 Chi-Square Calculated for the Relationship between the Type of Customers Served by a Firm and its Selected Distribution Channels.
The null hypothesis was stated as follows:
Ho: There is no relationship between the type of distribution channel selected by a
firm and type of customers served.
Distributionchannel
Type of customer served
Individual customers Other industries Total
(0) (E) (0) (E)
Direct 25 24.7 12 12.3 37
Indirect 15 15.3 8 7.7 23
Total 40 20 60
Cell Oi ei Oj-ej (Oi-eO* (Oj-ej)* / ei
11 25 24.7 0.3 0.09 0.0036
21 15 -15.3 -0.3 0.09 0.0059
12 12 12.3 -0.3 0.09 0.0073
22 ' 8 7.7 0.3 0.09 0.0117
% l =0.0285
7 2 = 3.84
The null hypothesis was rejected at 0.05 level of significance with 1 degree of
freedom. Hence, it is concluded that, there is no relationship between the type of
distribution channels selected by a firm and the type of customers served by the firm.
O N IV E R S :T Y OF a iRO BI l i b r a r y
76
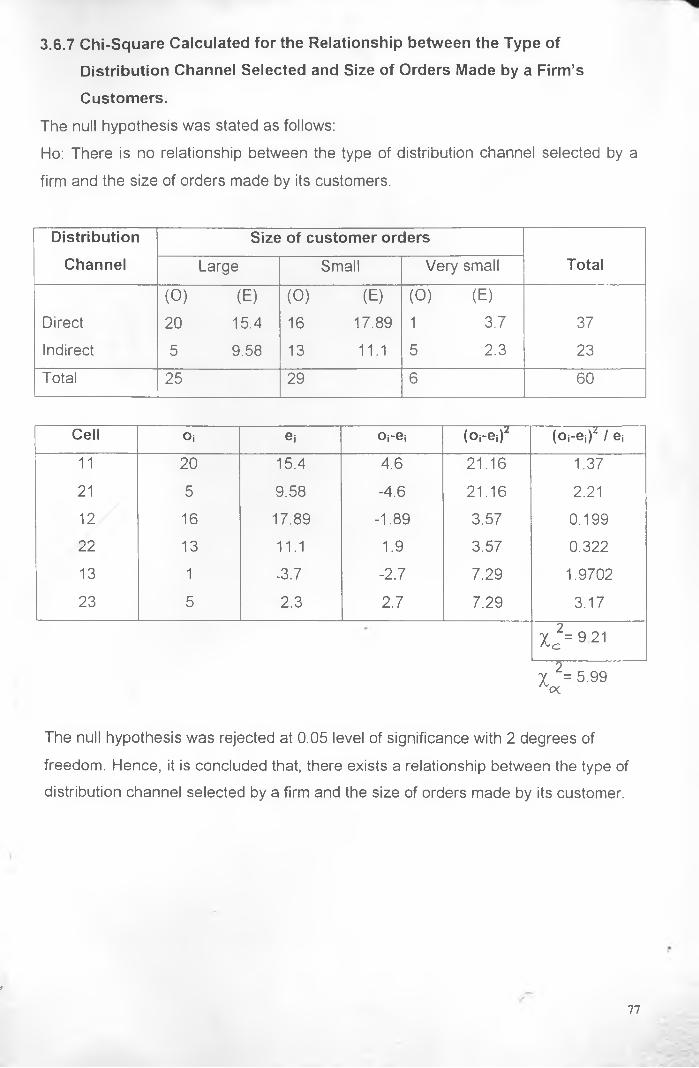
3.6.7 Chi-Square Calculated for the Relationship between the Type of Distribution Channel Selected and Size of Orders Made by a Firm’s
Customers.The null hypothesis was stated as follows:
Ho: There is no relationship between the type of distribution channel selected by a
firm and the size of orders made by its customers.
DistributionChannel
Size of customer ordersTotalLarge Small Very small
(0) (E) (0) (E) (O) (E)Direct 20 15.4 16 17.89 1 3.7 37
Indirect 5 9.58 13 11.1 5 2.3 23
Total 25 29 6 60
Cell Oj ei Oj-ej (Oi-ej)* (os-eO* / ei
11 20 15.4 4.6 21.16 1.37
21 5 9.58 -4.6 21.16 2.21
12 16 17.89 -1.89 3.57 0.199
22 13 11.1 1.9 3.57 0.322
13 1 -3.7 -2.7 7.29 1.9702
23 5 2.3 2.7 7.29 3.17
Xc2= 9 21
X 2=5.99oc
The null hypothesis was rejected at 0.05 level of significance with 2 degrees of
freedom. Hence, it is concluded that, there exists a relationship between the type of
distribution channel selected by a firm and the size of orders made by its customer.
1
77