Embed Size (px)
Citation preview
FACTORS INFLUENCING MARKETING STRATEGY FORMULATION FOR SMALL
AND MEDIUM ENTERPRISES IN POLOKWANE
by
Legodi Cedric Phokwane
Student number: 4828-797-0
submitted in accordance with the requirements
for the degree of
Master of Commerce
in the subject
Business Management
at the
University of South Africa
Supervisor: Prof K.M MAKHITHA
January 2020
i
DECLARATION
I declare that “FACTORS INFLUENCING MARKETING STRATEGY FORMULATION
FOR SMALL AND MEDIUM ENTERPRISES IN POLOKWANE” is my own work, which
has not been submitted for any other examination in any other university, and that all
the sources consulted or used have been acknowledged by means of a complete list
reference.
Legodi Cedric Phokwane Student number: 4828-797-0
31 January 2020

ii
DEDICATION
This study is especially devoted to my mother, late father (Bro Steve), and late
exceptional younger sister (Rakgadi), the vows to change the title continue.

iii
ACKNOWLEDGEMENTS
I wish to express my gratitude to the following people; without their endurance and
support this work would not have been completed.
• My wife (Ms P), my children, Israel, Tamara and Malope; you have spent
sometimes alone, while I was always communicating with the laptop.
• Dr Aderibigbe O.A.O (Madala master of all), you have played your role thoroughly,
without you, giving up would have been an option.
• Prof Makhitha K.M., you have played your great role, stretching my mind beyond
limits to great heights; with the help and endurance you showed, I have already
completed the next level before starting.
• Ms Dina Venter, the statistician, you have done your great role for statistics
• Ms Linda Scott, the language editor, you have played your language role
• To my Angel and the Angel of IHPGM (The Angel that knows no defeat) you have
spoken, and I surrender.
iv
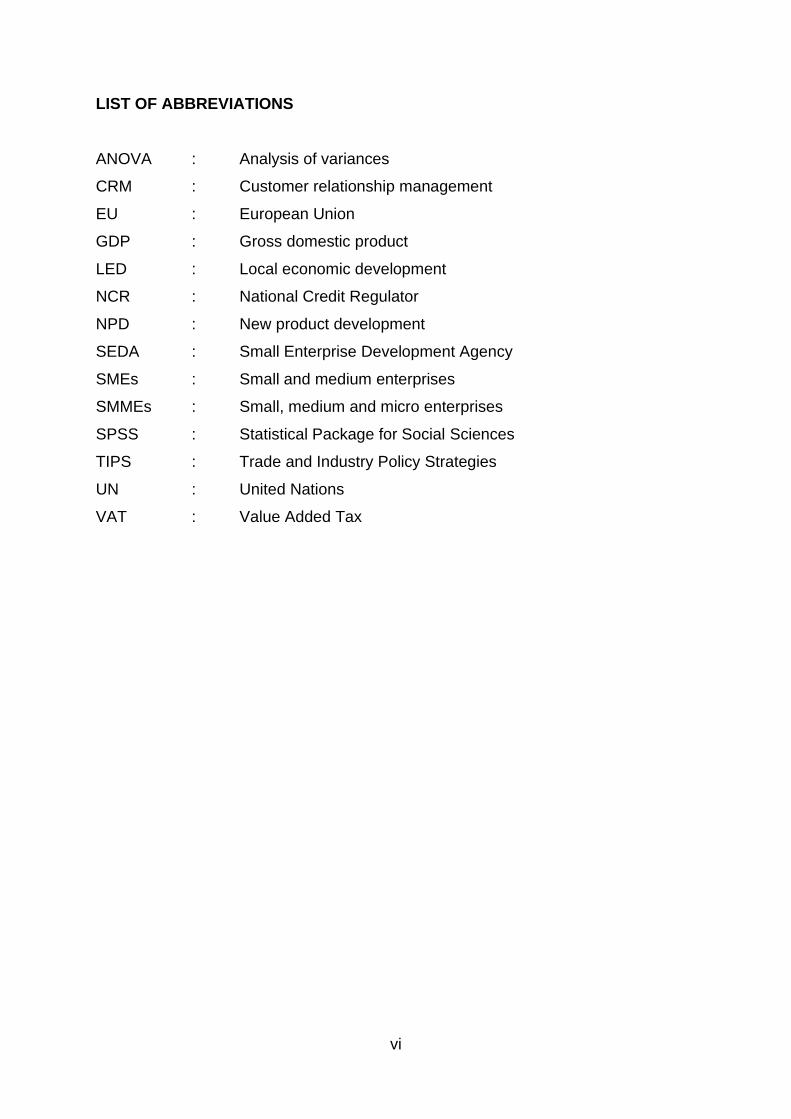
ABSTRACT
The aim of the study was to investigate the factors influencing marketing strategy
formulation for small and medium enterprises (SMEs) in Polokwane. SMEs,
worldwide, are regarded as the cornerstone for economic development. However,
SMEs are faced with business marketing constraints that lead to their downfall.
The study objectives were set and led to the formation of the hypotheses. The study
adopted a quantitative approach and collected data from a sample of 412 SMEs from
Polokwane using non-probability sampling methods, which are convenience and
snowball sampling. A survey questionnaire sought responses from the respondents.
The pilot test was done, and responses were used to eliminate unnecessary and
confusing statements. The respondents were required to indicate their agreement or
disagreement with questions on a five-point Likert scale. Descriptive statistical
analysis, factor analysis, ANOVA and regression analysis were done to determine if
the objectives of the study were achieved and to test hypotheses.
SMEs were found to be using sales promotions, digital marketing, business branding,
personal selling and email communication as part of marketing communication
strategies. Product strategies used are product quality and packaging, branding and
collaborative product development. The findings of the study depict that SMEs
marketing communications and product strategies have a positive influence on their
performance. The main challenges experienced by SMEs are lack of understanding
for marketing research, lack of finance, lack of business planning, inexperienced
employees and, the least experienced challenge, lack of customer demands. It was
further found that demographic factors (business operation/ maturity, business training
and annual turnover) have a significant influence on the marketing communication
strategies adopted and the challenges facing SMEs. SMEs that have been in
existence for over 10 years perceive marketing challenges differently from SMEs with
less than 10 years of operation.
It is necessary for the government to put in place progressive policies that can assist
SMEs to improve their marketing strategy. It was recommended that SMEs attend
training related to marketing to be equipped with marketing and business operations

v
knowledge to minimise the experienced marketing challenges. Training will enable
SMEs to do better in marketing communication or/and product strategies.
vi
LIST OF ABBREVIATIONS
ANOVA : Analysis of variances
CRM : Customer relationship management
EU : European Union
GDP : Gross domestic product
LED : Local economic development
NCR : National Credit Regulator
NPD : New product development
SEDA : Small Enterprise Development Agency
SMEs : Small and medium enterprises
SMMEs : Small, medium and micro enterprises
SPSS : Statistical Package for Social Sciences
TIPS : Trade and Industry Policy Strategies
UN : United Nations
VAT : Value Added Tax
vii
TABLE OF CONTENTS
DECLARATION ........................................................................................................... i
DEDICATION .............................................................................................................. ii
ACKNOWLEDGEMENTS .......................................................................................... iii
ABSTRACT ................................................................................................................ iv
LIST OF ABBREVIATIONS ........................................................................................ vi
LIST OF TABLES ..................................................................................................... xiii
LIST OF FIGURES .................................................................................................... xv
CHAPTER 1: INTRODUCTION AND BACKGROUND OF THE STUDY ................... 1
1.1 INTRODUCTION AND BACKGROUND ............................................................... 1
1.1.1 The Small and Medium businesses in South Africa .......................................... 4
1.2 PROBLEM STATEMENT ..................................................................................... 6
1.3 PURPOSE OF THE RESEARCH ......................................................................... 8
1.4 RESEARCH OBJECTIVES AND HYPOTHESES ................................................ 8
1.4.1 Primary objective: .............................................................................................. 8
1.5 RESEARCH METHODOLOGY .......................................................................... 10
1.5.1 Research Design ............................................................................................. 10
1.5.2 Sampling Plan ................................................................................................. 11
1.6 ETHICAL CONSIDERATION ............................................................................. 15
1.7 STUDY LIMITATION .......................................................................................... 16
1.8 CHAPTER OUTLINE .......................................................................................... 16
1.9 CONCLUSION ................................................................................................... 17
CHAPTER 2: THE SMALL AND MEDIUM (SMEs) SECTOR IN SOUTH AFRICA .. 18
2.1 INTRODUCTION ................................................................................................ 18
2.2 UNDERSTANDING THE SME SECTOR ........................................................... 18
2.2.1 Global small and medium businesses (SMEs) ................................................ 18
2.3 AN OVERVIEW AND ROLE OF THE SMES SECTOR IN THE SA ECONOMY 21
2.4 FACTORS AFFECTING THE MARKETING STRATEGIES OF SMEs IN SA .... 23
2.4.1 Marketing ........................................................................................................ 24
2.4.2 Marketing research .......................................................................................... 27
2.4.3 Lack of access to market ................................................................................. 27
2.4.4 Competition ..................................................................................................... 28
2.4.5 Lack of management skills and training .......................................................... 29
2.4.6 Business culture .............................................................................................. 30
viii
2.4.7 Lack of branding .............................................................................................. 32
2.4.8 Government rules and regulations .................................................................. 33
2.4.9 Lack of clear business planning ...................................................................... 33
2.4.10 Financial resources and support ................................................................... 34
2.4.11 Crime ............................................................................................................. 35
2.5 GOVERNMENT SUPPORT POLICY FOR SMES AND INSTITUTIONAL
FRAMEWORK IN SOUTH AFRICA ......................................................................... 35
2.5.1 The SMEs support at provincial and local level ............................................... 38
2.6 CONCLUSION ................................................................................................... 39
CHAPTER 3: MARKETING STRATEGIES IN SMALL AND MEDIUM BUSINESSES
(SMEs) ..................................................................................................................... 41
3.1 INTRODUCTION ................................................................................................ 41
3.2 DEFINING MARKETING .................................................................................... 42
3.3 SITUATION ANALYSIS ...................................................................................... 44
3.4 MARKETING STRATEGY .................................................................................. 45
3.5 ELEMENTS OF THE MARKETING STRATEGY ............................................... 47
3.5.1 Market segmentation, targeting and positioning .............................................. 48
3.5.2 Target Market .................................................................................................. 50
3.5.3 Positioning ....................................................................................................... 51
3.5.5 Price Strategy .................................................................................................. 59
3.5.6 Place Strategy ................................................................................................. 61
3.5.7 Marketing Communication Strategy ................................................................ 65
3.5.8 Elements of the marketing communication strategy ........................................ 67
3.6 THE IMPACT OF MARKETING STRATEGIES ON BUSINESS PERFORMANCE
................................................................................................................................. 75
3.7 FORMULATING HYPOTHESES ........................................................................ 77
3.7.1 Demographic factors and marketing strategies (product strategies and marketing
communication strategies) ....................................................................................... 77
3.7.2 Demographic and factors influencing marketing strategies (product strategies
and marketing communication strategies) ................................................................ 78
3.7.3 The impact of marketing strategies (product strategies and marketing
communication strategies) on performance of SMEs ............................................... 79
3.8 CONCLUSION ................................................................................................... 80
CHAPTER 4: RESEARCH METHODOLOGY .......................................................... 81
ix
4.1 INTRODUCTION ................................................................................................ 81
4.2 RESEARCH METHODOLOGY .......................................................................... 81
4.2.1 Research paradigm ......................................................................................... 81
4.2.2 Research Design ............................................................................................. 83
4.2.3 Research Approach ......................................................................................... 85
4.3 SAMPLING PLAN .............................................................................................. 88
4.3.1 Target Population ............................................................................................ 88
4.3.2 Sampling Frame .............................................................................................. 89
4.3.3 Sampling Method ............................................................................................ 89
4.3.4 Sample Size .................................................................................................... 91
4.3.5 Data Collection Methods ................................................................................. 92
4.4 DATA PREPARATION ....................................................................................... 95
4.4.1 Editing ............................................................................................................. 95
4.4.2 Coding ............................................................................................................. 95
4.4.3 Data Capturing ................................................................................................ 96
4.4.4 Data cleaning .................................................................................................. 96
4.4.5 Data analysis ................................................................................................... 96
4.4.6 Quantitative data analysis ............................................................................... 97
4.5 VALIDITY AND RELIABILITY ISSUES .............................................................. 98
4.5.1 Validity (External and Internal) ........................................................................ 98
4.5.2 Reliability ......................................................................................................... 99
4.6 ETHICAL CONSIDERATIONS ........................................................................... 99
4.7 CONCLUSION ................................................................................................. 100
CHAPTER 5: ANALYSIS OF THE RESULTS AND FINDINGS ............................. 101
5.1 INTRODUCTION .............................................................................................. 101
5.2 VALIDITY AND RELIABILITY .......................................................................... 101
5.2.1 Validity ........................................................................................................... 101
5.2.2 Reliability ....................................................................................................... 104
5.3 RESPONDENTS DEMOGRAPHIC CHARACTERISTICS ............................... 106
5.3.1 Gender of the respondents ............................................................................ 106
5.3.2 Business registration ..................................................................................... 106
5.3.3 The role in the business ................................................................................ 107
5.3.4 Age of the respondents ................................................................................. 107
5.3.5 Business years of operation .......................................................................... 108
x
5.3.6 Business marketing training .......................................................................... 109
5.3.7 Number of employees in the business .......................................................... 109
5.3.8 Business development stage......................................................................... 110
5.3.9 Business ownership ...................................................................................... 111
5.3.10 Business annual turnover ............................................................................ 111
5.4 DESCRIPTIVE STATISTICS ............................................................................ 112
5.4.1 SMEs attitude towards marketing communication ......................................... 112
5.4.2 Marketing strategies (product strategies and marketing communication
strategies) adopted by SMEs in Polokwane ........................................................... 116
5.4.3 Factors that affect the formulation of SMEs marketing strategies ................. 124
5.4.4 The impact of marketing strategies (product strategies and marketing
communication strategies) on SMEs performance ................................................. 128
5.5 FACTOR ANALYSIS: MARKETING COMMUNICATION STRATEGIES ......... 130
5.5.1 Sample adequacy .......................................................................................... 130
5.6 FACTOR ANALYSIS: PRODUCT STRATEGIES ............................................. 144
5.6.1 Sample adequacy .......................................................................................... 144
5.7 TESTING HYPOTHESES 1: MARKETING COMMUNICATION STRATEGIES
AND DEMOGRAPHIC FACTORS (BUSINESS OPERATION, TRAINING AND
ANNUAL TURNOVER) AND .................................................................................. 153
5.7.1 Business operation (business maturity) and marketing communication ........ 154
5.7.2 Business marketing training and marketing communication .......................... 158
5.7.3 Business annual turnover and marketing communication ............................. 160
5.8 TESTING HYPOTHESES 2: DEMOGRAPHICS (BUSINESS OPERATION,
TRAINING AND ANNUAL TURNOVER) AND FACTORS INFLUENCING
MARKETING STRATEGIES .................................................................................. 165
5.8.1 Business operation (business maturity) and factors influencing marketing
strategies ................................................................................................................ 165
5.8.2 Business marketing training and factors influencing marketing strategies .... 166
5.8.3 Business turnover and factors influencing marketing strategies .................... 167
5.9 TESTING HYPOTHESES 3: THE IMPACT OF MARKETING STRATEGIES ON
PERFORMANCE OF SMES .................................................................................. 168
5.9.1 Marketing communication strategy and SMEs performance (Hypotheses 3a –
H3a) ....................................................................................................................... 169
5.9.2 Product strategy and SMEs performance (Hypotheses 3b – H3b) ................. 181
xi
5.10 SUMMARY ..................................................................................................... 186
CHAPTER 6: CONCLUSIONS, AND RECOMMENDATIONS. .............................. 188
6.1 INTRODUCTION .............................................................................................. 188
6.2 OVERVIEW OF RESEARCH OBJECTIVES .................................................... 188
6.3 CONCLUSIONS OF FINDINGS ....................................................................... 188
6.3.1 Conclusions of findings: Marketing strategies (Marketing communication and
product strategies) adopted by SMEs .................................................................... 189
6.3.2 Conclusions regarding marketing challenges faced by SMEs ....................... 191
6.3.3 Conclusions of findings: Demographics and marketing communication ........ 192
6.3.4 Conclusions of findings: demographics and factors influencing marketing
strategies ................................................................................................................ 193
6.3.5 Conclusions for the impact of marketing communication and product strategies
on the performance of SMEs .................................................................................. 193
6.4 RECOMMENDATIONS .................................................................................... 194
6.4.1 Recommendations about marketing communications and product strategies
............................................................................................................................... 194
6.4.1.3 Recommendations regarding factors influencing marketing strategies of
SMEs ...................................................................................................................... 198
6.4.1.4 Recommendations about the impact of marketing communication and product
strategies on the performance of SMEs ................................................................. 199
6.4.1.5 Recommendations about the influence of demographic factors (business
operation, business training, and business turn-over) on marketing communication
strategies. ............................................................................................................... 199
6.4.1.6 Recommendations about the influence of demographic factors (business
operation, business training, and business turn-over) on factors influencing marketing
strategies of SMEs ................................................................................................. 200
6.5 LIMITATIONS AND RECOMMENDATIONS FOR FURTHER STUDY ............ 200
6.6 STUDY SIGNIFICANCE ................................................................................... 201
REFERENCES ....................................................................................................... 203
APPENDIX 1: ETHICAL CLEARANCE .................................................................. 256
APPENDIX 2: LANGUAGE EDITING LETTER ...................................................... 258
APPENDIX 3: QUESTIONNAIRE .......................................................................... 259
APPENDIX 4: CORRELATIONS MATRIX: MARKETING COMMUNICATION
STRATEGY. ........................................................................................................... 268

xii
APPENDIX 5: CORRELATIONS MATRIX: PRODUCT STRATEGY ..................... 269
xiii
LIST OF TABLES
Table 1.1: Types of SMMEs in South Africa ............................................................... 6
Table 2.1: Summarised SME definition for selected countries ................................. 20
Table 2.2: The established structure for SMEs support............................................ 37
Table 5.1: Total coefficient value: Marketing communication ................................. 105
Table 5.2: Total coefficient value: Product strategy ................................................ 105
Table 5.3. Business registration status ................................................................... 107
Table 5.4: SMEs attitude towards marketing communication ................................. 115
Table 5.5: The adoption of marketing communication strategies ........................... 118
Table 5.6: The adoption of product strategies ........................................................ 122
Table 5.7: Factors that affects the formulation of SMEs marketing strategies ........ 126
Table 5.8: The impact of marketing strategies on SMEs performance. .................. 129
Table 5.9: KMO and Bartlett’s test.......................................................................... 131
Table 5.10: Communalities (Principle component analysis) ................................... 132
Table 5.11: Total Variance Explained by Exploratory Factor Analysis (Principal
Component Analysis) ............................................................................................. 133
Table 5.12: Rotated Pattern Matrix: Principal Component Analysis with Promax
rotation (Kaiser Normalisation) ............................................................................... 135
Table 5.13: KMO and Bartlett’s test: Product development and innovation ............ 144
Table 5.14: Communalities (principle component analysis) ................................... 145
Table 5.15: Total Variance Explained by Exploratory Factor Analysis (Principal
Component Analysis) ............................................................................................. 146
Table 5.16: Rotated Pattern Matrix: Principal Component Analysis with Promax
rotation (Kaiser Normalization) ............................................................................... 148
Table 5.17: Business maturity (business years of operation) ................................. 155
Table 5.18: Independent samples test ................................................................... 159
Table 5.19: Business annual turnover .................................................................... 161
Table 5.20: Extent of the existence of marketing challenges for SMEs .................. 165
Table 5.21: ANOVA: Extent of the existence of marketing challenges for SMEs ... 166
Table 5.22: Group statistics: Business Marketing Training ..................................... 167
Table 5.23: Independent samples test: Extent of the existence of marketing challenges
for SMEs ................................................................................................................ 167
xiv
Table 5.24: ANOVA: Q4 Extent of the existence of marketing challenges for SMEs
............................................................................................................................... 168
Table 5.25: Test Statistics a: The implementation of marketing strategies has resulted
in sales increase in our business ........................................................................... 169
Table 5.26: Test Statistics a: Marketing communication helped us to build more
relationships with customers .................................................................................. 170
Table 5.27: Test Statistics a: Branding has resulted in sales increase in our business
............................................................................................................................... 171
Table 5.28: Test Statistics a: Branding has resulted in increased customer loyalty
towards our business ............................................................................................. 172
Table 5.29: Test Statistics a: Marketing communication has resulted in increased
customer loyalty towards our business ................................................................... 174
Table 5.30: Test Statistics a: Marketing communication helped us to better retain loyal
customers ............................................................................................................... 175
Table 5.31: Test Statistics a: Marketing communication resulted in increased
profitability for our business .................................................................................... 176
Table 5.32: Test Statistics a: Marketing communication helped us in identifying new
customers ............................................................................................................... 177
Table 5.33: Test Statistics a: Marketing communication increased our competitiveness
in the market .......................................................................................................... 178
Table 5.34: Test Statistics a: Product development and innovation increased our sales
............................................................................................................................... 179
Table 5.35: Test Statistics a: Product development and innovation strengthened our
relationship with customers. ................................................................................... 182
Table 5.36: Test Statistics a: Product development increased our market share ... 182
Table 5.37: Test Statistics a: Product development and innovation increased our
competitiveness in the market ................................................................................ 183
Table 5.38: Test Statistics a: Product quality increased our product/service
performance ........................................................................................................... 184
Table 5.39: Test Statistics a: Product innovation and development increased customer
satisfaction ............................................................................................................. 185
Table 5.40: Objectives, hypotheses and statistical analysis ................................... 186
xv
LIST OF FIGURES
Figure 3.1: Distribution channels. ............................................................................. 64
Figure 5.1: Gender ................................................................................................. 106
Figure 5.2: The role in business ............................................................................. 107
Figure 5.3: Age of the respondents ........................................................................ 108
Figure 5.4: Business years of operation ................................................................. 108
Figure 5.5: Business marketing training ................................................................. 109
Figure 5.6: Number of business employees ........................................................... 110
Figure 5.7: Business development stage ............................................................... 110
Figure 5.8: Business ownership ............................................................................. 111
Figure 5.9: Business annual turnover ..................................................................... 112
Figure 5.10: Scree Plot: Marketing communications .............................................. 134
1
CHAPTER 1: INTRODUCTION AND BACKGROUND OF THE STUDY
1.1 INTRODUCTION AND BACKGROUND
Small and medium enterprises (SMEs) play an important part in the development of
the country’s economy as they contribute towards poverty alleviation through the
creation of employment and wealth, revenue generation and technological
advancement (Razak 2012; Ciubotariu 2013). Kongolo (2010) and SBP (2011) state
that the South African SMEs account for almost 91 percent of businesses. SMEs in
South Africa make 60 percent contribution to the country’s employment and between
51 percent and 57 percent to the gross domestic product (GDP). This shows how
important they are to the country’s economic development and growth (Benneh-
Mensah & Nyadu-Ado 2012). The SME sector fuels the developing economies and
makes positive contributions towards the GDP and employment towards any country
(Zikode 2012).
The SMEs daily running and their long-term success and continuity are affected by a
variety of exogenous and endogenous factors and this results in the struggle for SMEs
to operate in the multifaceted and economical business environment (Cant, Wiid &
Hung 2013). This leads to the high failure rate of SMEs. Bisseker (2014) concur with
Kongolo (2010) and SBP (2011) that SMEs within South Africa (SA) constitute about
60% of total employment as compared with 77 percent of the global average. But,
notwithstanding the substantial grant funding and different support programmes
offered by the government, some researchers (Fatoki 2014; Kalane 2015; Douglas,
Douglas, Muturi & Ochieng 2017) show that up to 76 percent of all SMEs fail within
two years of operation. The current failure rate does not differ from the previous overall
South African failure rate that was estimated at 70 percent to 80 percent; whereby,
marketing strategies and deficiencies in marketing contributed to the failure (Brink &
Cant 2009; Adeniran & Johnston 2011).
Kotler, Gary, Lloyd and Nigel (2013) define marketing strategy as the marketing
judgment; whereby, businesses strive to achieve marketing goals. Berndt and Tait
(2012) state that the aim of marketing strategy is to gratify present customers fully and
comprehensively and, as a result, they do word-of-mouth advertising about how
2
satisfied they are with the product/service. Marketing strategy aims to demonstrate to
the customer that it cares enough about the current well-served customers as much
as SMEs do with the new customers and show that customer satisfaction is the SMEs’
core business.
It is the responsibility of any business enterprise to differentiate itself from its
competitors, through making use of its relative business strengths to gratify customer
needs appropriately within a certain environmental setting. This requires that SMEs
owners or managers be familiar and gain knowledge of marketing and running their
businesses successfully to make positive contributions (Lekhanya 2010; Ciubotariu
2013). Schmid and Kotulla (2011) found that SMEs managers make decisions
depending on the sensitivity of the firm’s position. For SMEs managers to understand
how detailed marketing strategies are, situational factors influencing strategic
decisions must be considered. Lack of time and funds to invest in the establishment
of target markets and customer trends is part of the owner managers’ perception
related to SME marketing (Van Scheers 2012).
GEM (2011) states that poor market research and the absence of a viable business
idea and lack of access to vibrant markets are some of the most factors that hinder
the progression of SMEs in South Africa including Limpopo. The failure for SMEs to
access proper markets is a major factor that threatens their longevity. One of the
criteria that SME funders look at is the access to market − without access to the market
it becomes difficult for SMEs to be funded and mentored (SEDA 2016). The City of
Polokwane still needs to identify innovative ways on how it can provide support to
SMEs, SMMEs and cooperatives to promote the establishment of new businesses and
sustainable livelihoods. Maboa (2011) state that according to some studies, SMEs in
the municipalities face a challenge of not being able to look out for markets for their
own products and services. It is reported that South Africa’s SMEs are less vibrant
than those in other countries with the majority lingering in the emerging and enterprise
stages (Malefane 2013).
Lekhanya (2015) asserts that the research findings revealed that there are no
sufficient marketing expertise and knowledge and there is a dominance of limited
practice of marketing strategies within the SMEs by the owners/managers. Webb,
Ireland, Hitt, Kistruck and Tihanyi (2011) state that “if marketing conceptions can be
3
carefully thought and combined with the business processes, they can help in
expanding an enterprise performance”. According to Neneh and Van Zyl (2012),
magnifying an enterprise performance using differentiation strategy is directly allied to
the marketing practices of the business. Ruhdelius (2011) proclaim that marketing is
a device to empower the firm to advance its objective, it is a strategy that organizations
implement to support both the organizations’ and management’s objectives in the
fulfilment profitability and success. Dzisi and Ofosu (2014) define marketing as a
matrix of commercial activities structured to promote, plan, price, produce; distribute
goods, service and ideas for the fulfilment of appropriate customers and clients
strategically. Maboa (2011) found that most SMEs do not possess any marketing
expertise and are incapable in finding the available markets for their products and
services and, as a result, they collapse.
Owomoyela, Oyeniyi and Ola (2013) perceives marketing strategy as process of
delivering a distinct product that fulfils all the needs of customers, proposing
reasonable prices and engaging in broader distribution and support it with a real
promotional strategy. Ghouri, Khan and Razzaq (2011) asserts that executing
appropriate marketing strategy advances the overall activities of the business
excellently and further strengthens the market share and the firm’s competitive
advantage. Kotler and Keller (2014) state that the relationship between marketing and
marketing strategy is the “formation and maintenance of commonly satisfying
interchange relationships”.
Gbolagade, Adesola, and Oyewale (2013) found that marketing strategies significantly
influence business performance. Owomoyela et al. (2013) concur with Gbolagade et
al. (2013) that “previous researches have established a profitable relationship between
the marketing strategies and the business performance”. Arsalan, Naveed and
Muhammad (2011) state that it is essential to formulate the marketing strategies in
every entity as it enables the business to broaden its territory. Marketing strategy is
one of the key efficient strategies that SMEs adopt to enhance performance (Dzisi &
Ofosu 2014).
Van Scheers (2011) recommends that small business managers understand and
create small business marketing strategies for products and services, as their success
is based on the capacity to shape an increasing body of satisfied clients. Therefore,
4
marketing strategies serve as the main pillar and add value in enhancing the
organisational performance (Hassan, Qureshi, Sharif & Mukhtar 2013). This research
aims to determine the marketing strategies (marketing communication and product
strategies) and the impact on the SMEs’ performance. The research further aims to
contribute to the current knowledge of marketing influence on the SMEs performance.
1.1.1 The Small and Medium businesses in South Africa
The South African National Small Business Act of 1996, as amended in 2003 and 2004
(Department of Trade and Industry 2004) offers a South African definition of an SME,
which is referred to as SMME; however, diverse organisations and research institutes
do not make use of this definition, making it hard to benchmark diverse studies and
information on SMMEs (Republic of South Africa National Credit Regulator 2011).
The commonly used definition of an SMMEs is based on the number of people
employed within a business or upon a yearly turnover (Mabuza 2016). The National
Small Business Act of 1996, as amended in 2004, define an SMMEs as a single and
different business unit, counting co-operative enterprises and non-governmental
organisations, including its branches, if available, is mainly accepted in any economic
sector or sub-sector (Department of Trade and Industry 2004).
The National Small Business Act 102 of 1996 as amended in 2004 sets the most
extensively used context for the South African SMMEs, which describe and define the
five categories of businesses in the country. As described by Davis Tax Committee
(DTC) (2014) and Trade and Industry Policy Strategies (TIPS) (2017) the definition is
centred on the number of people employed in an enterprise in relation with their yearly
turnover classifications. Turnover and the number of employees for each category is
summarised in Table 2.2. The categories are as follows:
• Survivalist enterprises.
Focuses much on the survival of an individual as it generally generates income that is
below the minimum poverty line with no employees. The value of its assets is minimal.
The main economic activity is to keep the owner alive. The turnover generated is less
than R100 000
• Micro enterprises.

5
Lies between the survivalist and small enterprises generating an annual gross income
that is below the Value Added Tax (VAT) registration boundary being R250 000 per
annum. Normally does not adhere to many regulations like registering for formal tax,
following accounting procedures, adhering to labour regulations and normally it
employs less than five people.
• Very small enterprises
Normally employs 20 people or less and is unique to South Africa. It operates in a
formal economy and is VAT registered, with some limited technological business
operations. There are 20 or fewer than 20 employees and the turnover is between
R500 000 to R6m.
• Small enterprise
Having the maximum number of 50 employees. These enterprises are mostly
reputable and organised, unlike the very small enterprise and show more complex
professional practices. The annual turnover is between R2m to R5m
• Medium enterprise
The number of employees is between 100 and 200. These enterprises are frequently
characterised by delegation of power to a supplementary management level. The
annual turnover is between R5m to R64m
The table 2.2 below summarises the number of employees and the revenue
generated by the South African SMMEs.
6
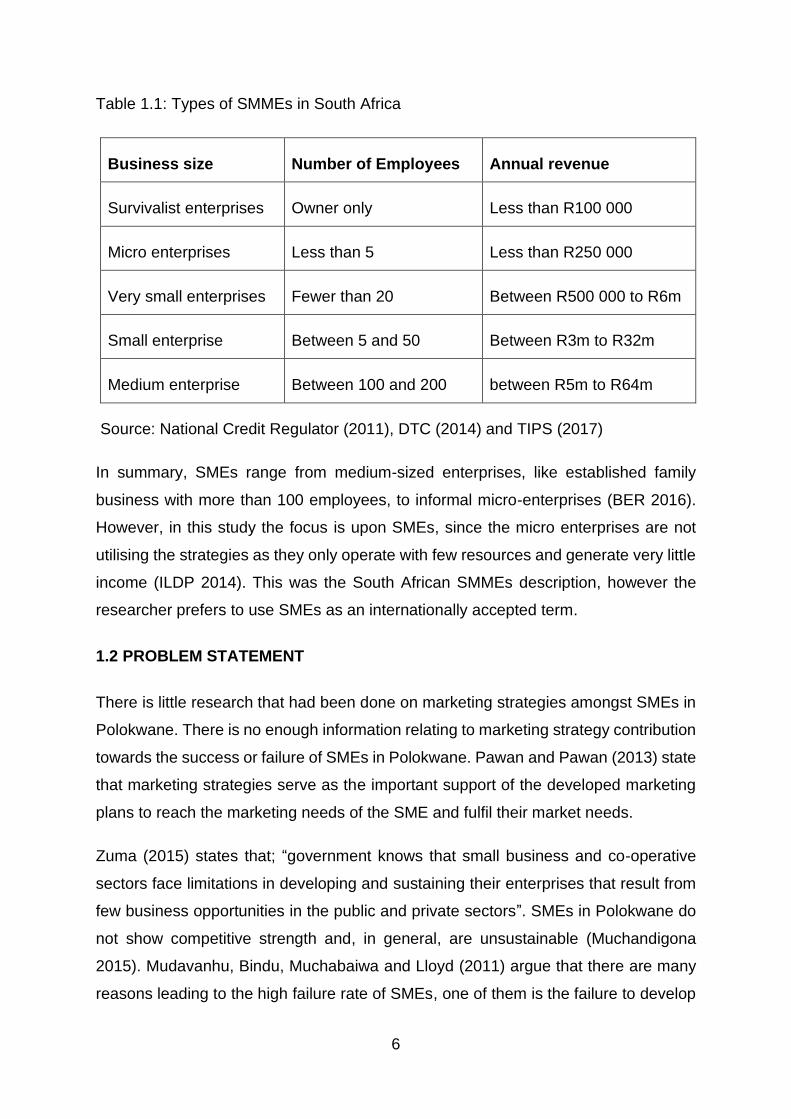
Table 1.1: Types of SMMEs in South Africa
Business size Number of Employees Annual revenue
Survivalist enterprises Owner only Less than R100 000
Micro enterprises Less than 5 Less than R250 000
Very small enterprises Fewer than 20 Between R500 000 to R6m
Small enterprise Between 5 and 50 Between R3m to R32m
Medium enterprise Between 100 and 200 between R5m to R64m
Source: National Credit Regulator (2011), DTC (2014) and TIPS (2017)
In summary, SMEs range from medium-sized enterprises, like established family
business with more than 100 employees, to informal micro-enterprises (BER 2016).
However, in this study the focus is upon SMEs, since the micro enterprises are not
utilising the strategies as they only operate with few resources and generate very little
income (ILDP 2014). This was the South African SMMEs description, however the
researcher prefers to use SMEs as an internationally accepted term.
1.2 PROBLEM STATEMENT
There is little research that had been done on marketing strategies amongst SMEs in
Polokwane. There is no enough information relating to marketing strategy contribution
towards the success or failure of SMEs in Polokwane. Pawan and Pawan (2013) state
that marketing strategies serve as the important support of the developed marketing
plans to reach the marketing needs of the SME and fulfil their market needs.
Zuma (2015) states that; “government knows that small business and co-operative
sectors face limitations in developing and sustaining their enterprises that result from
few business opportunities in the public and private sectors”. SMEs in Polokwane do
not show competitive strength and, in general, are unsustainable (Muchandigona
2015). Mudavanhu, Bindu, Muchabaiwa and Lloyd (2011) argue that there are many
reasons leading to the high failure rate of SMEs, one of them is the failure to develop
7
proper marketing strategies and little effort by SMEs owners/ managers to market their
businesses. According to Van Scheers (2011), marketing skills is considered one of
the most active factors towards the organisations’ growth and survival. Lack of
marketing skills undesirably impacts the SMEs success.
According to Omar and Anas (2014), effective marketing influences the success of
any business entity, including the SMEs. Bouazza, Ardjouman and Abada (2015)
assert that “marketing plays a substantial role in the success or failure of SMEs, it also
regarded as the biggest challenge faced by SMEs in their business processes”.
There is a sturdy relationship amongst the SMEs marketing strategies and
performance in terms of revenue growth, wider customer connections, improved
efficiency and capacity to compete fairly with larger firms (David, Neeraj, Derek, John,
Michael, Ruba, Julia & Julio 2013). Yan and Chew (2011) state that SMEs
performance is influenced by the relative marketing strategy, competitive marketing
strategy and lastly the business environment.
Mbedzi (2011) states that Limpopo SMEs that are part of business associations and
co-operatives have an advantage of joint marketing schemes and technical marketing
services, but on their own they can’t perform marketing. Seeletse (2012) articulates
that SMEs are inadequate in market research aspects since many SMEs were totally
not involved in evaluating clients’ satisfaction as part of their marketing strategy.
Although numerous studies have been conducted on causes prominent to success or
failure of SMEs (Mbedzi 2011; Nkonde 2012; Seeletse 2012) few have studied the
SMEs marketing strategies and the factors impacting on their marketing strategies in
Polokwane. The study observes the use of marketing strategies (product strategies
and marketing communication strategies) and their impact on SMEs performance in
Polokwane, together with factors that affect their marketing strategy formulation. The
elements of the marketing strategies chosen for the purpose of the study were product
strategies and marketing communication strategies. The two strategies are believed
to have much impact on the success and failure of the SMEs.
8
1.3 PURPOSE OF THE RESEARCH
The study investigates the factors impacting on marketing strategies formulation of
SMEs in Polokwane. The study also investigates how marketing strategies influence
SMEs performance.
1.4 RESEARCH OBJECTIVES AND HYPOTHESES
1.4.1 Primary objective:
The primary research objective is to investigate the factors influencing the marketing
strategies (product strategies and marketing communication strategies) of the SMEs
in Polokwane.
1.4.1.1 Secondary objectives:
• To determine the marketing strategies (product strategies and marketing
communication strategies) adopted by SMEs in Polokwane
• To identify the factors that affect the SMEs marketing strategies (product
strategies and marketing communication strategies).
• To determine the effect of marketing strategies (product strategies and marketing
communication strategies) on SMEs performance.
1.4.1.2 Research Hypotheses
Both the primary and secondary research objectives directed the formulation of the
hypotheses
Hypotheses 1
H1 Marketing strategies (product strategies and marketing communication
strategies) of SMEs differ across demographics (business operation, training and
annual turnover)
H0 Marketing strategies (product strategies and marketing communication
strategies) of SMEs do not differ across demographics (business operation, training
and annual turnover).
9
Sub-hypotheses:
H1a Marketing strategies (product strategies and marketing communication
strategies) of SMEs differ across the business operation of SMEs.
H1b Marketing strategies (product strategies and marketing communication
strategies) of SMEs differ across the training attended by SMEs.
H1c Marketing strategies (product strategies and marketing communication
strategies) of SMEs differ across the business turnover of SMEs.
Hypotheses 2
H2 Factors influencing marketing strategies (product strategies and marketing
communication strategies) differ across the demographics of SMEs (business
operation, training, annual turnover)
H0 Factors influencing marketing strategies (product strategies and marketing
communication strategies) do not differ across the demographics of SMEs (business
operation, training, annual turnover).
Sub-hypotheses:
H2a Factors influencing marketing strategies (product strategies and marketing
communication strategies) differ across the business operation experience of SMEs.
H2b Factors influencing marketing strategies (product strategies and marketing
communication strategies) differ across the training attended by SMEs.
H2c Factors influencing marketing strategies (product strategies and marketing
communication strategies) differ across the business turnover of SMEs.
Hypotheses 3
H3 The marketing strategies (product strategies and marketing communication
strategies) have an impact on the performance of SMEs.
H0 The marketing strategies (product strategies and marketing communication
strategies) do not have an impact on the performance of SMEs.
10
Sub-hypotheses:
H3a. Marketing communication strategies have an impact on the performance of SMEs
H3b Product strategies have an impact on the performance of SMEs.
1.5 RESEARCH METHODOLOGY
1.5.1 Research Design
Research design is a strategy according to which a scholar finds the study participants
and gathers relevant data from them, with a vision of making inferences about the
research problems (Boeije 2010; Krishnaswami & Satyaprased 2010). Malhotra
(2010) and Aarker, Kumar, Leone and Day (2013) asserts that research design
comprises full techniques used in the selection of sources to gather needed
information to solve the research problem.
Cresswell (2014) concur with Boeije (2010) Krishnaswami et al. (2010) and Aarker et
al. (2013) by explaining that research design refers to plans that direct the researcher
during the collection of data, analysing of data and interpreting observations and offers
organised techniques to be followed by the researchers. According to Malhotra (2010),
a progressive and effective research is confirmed when a solid research design basis
has been laid. The choice of a research design rest upon the nature of matters being
researched, the researchers’ personal skills and the study audience. Creswell (2014)
highlights three approaches to research: qualitative, quantitative and mixed methods.
Qualitative and quantitative techniques offer a trade-off between the extensiveness
and depth and targeting to specific populations. Qualitative methods, including in-
depth interviewing, focus groups and observations, need good and substantial
supervision to produce trustworthy data. Qualitative research design tends to place
emphasis on the gathering of comprehensive primary data from a reasonable small
sample through observing behaviour or asking questions. Qualitative data can be
gathered within a short period of time, however, sometimes is not easy to summarise
or quantify the data into expressive forms or numbers (Kumar 2011; Creswell 2014).
Ivankova, Creswell and Clark (2016) views qualitative research as an investigation
procedure of understanding, where a researcher analyses words, conduct research
11
and reports detailed views of informants. Nieuwenhuis (2016a) concur with Ivankova
et al. (2016) that a qualitative research methodology deals with understanding the
process, social and cultural contexts, which underlie different behavioural patterns.
Cant (2010) describe quantitative research as being descriptive and used to define a
study, which is structured and quantifiable as it is reported in a numeric format.
According to Johnson and Christensen (2012), quantitative research design involves
gathering quantitative data such as variables, structured data-collection instruments,
numerical data and identification of statistical relationships among variables. The
objective is to make generalisations centred on the results of the population sample
and the findings are subjected to numerical manipulation to create broad data
representation (Creswell 2014). The collected data using quantitative methods are
frequently understood to return more objective and truthful information because they
are collected using standardised methods (Allwood 2012).
Mixed methods is an approach to investigation, which involves the collection of both
quantitative and qualitative data, incorporating the two forms of data and by means of
distinct designs that may comprise philosophical norms and hypothetical framework
(Creswell 2014). Cameron (2011) and Bryan and Bell (2011) mentions that mixed
methods has gradually become used and recognised as a research method for doing
research in different disciplines, such as business, social sciences, education, health,
political science, behavioural sciences and human sciences.
The quantitative research approach is adopted for the study and the survey method is
employed to gather data for the testing of the framed objectives.
1.5.2 Sampling Plan
This section place emphasis on the discussion of the sampling population, sampling
frame, sampling method, sampling size, data collection and data collection instrument.
Sampling is a comprehensive outline of which dimensions will be engaged at what
times, in which manner, on which material and by whom. Therefore, it should be
planned in such a way that the consequential data will comprise a reminiscent sample
of the parameters of importance and consent for all questions, as specified in the goals
(Kumar 2011).
12
1.5.2.1 Sampling Population
According to Lior (2012), population is the whole group of people or any study objects
that the researcher wants to describe and understand. The main objective of the study
was to determine the use of marketing strategies in the SMEs. The target population
for this study involved the SMEs around Polokwane. The foremost aim of this research
was to determine the marketing strategies of SMEs and the impact thereof on their
performance. Therefore, the SMEs serve as the unit of analysis and owners and/or
managers had completed the questionnaire.
1.5.2.2 Sampling Frame
Wiid and Diggines (2013) define sampling frame as the reliable list from where the
research sample will be drawn. Within this population, there will probably be only
certain groups that will be of interest to a study (Walliman 2011). In Polokwane, the
total number of SMEs is unknown. Convenience and snowball sampling were
considered suitable in this quantitative study, especially in cases where the sample
selection is from hard-to-find population or there is no sampling frame (Christensen,
Johnson & Turner 2011).
1.5.2.3 Sampling Method
With the sampling method the researcher wishes to determine if probability or non-
probability sampling will be useful in order to make the sample. Zikmund and Babin
(2015) define a sample as a depiction of the essentials of the targeted population.
Sampling methods are divided into two broad type, namely probability (random) and
non-probability and each broad type has sub-types (non-random) sampling (Wilson
2010; Walliman 2011). Probability sampling comprises simple random, stratified,
cluster and systematic sampling, while non-probability includes convenience,
sequential, quota, judgmental and snowball sampling.
Probability sampling is a sampling technique wherein the samples are collected in a
process that gives all individuals in the population an equal chance of being selected.
In non-probability sampling, units are deliberately selected to reflect features within a
sampled population and, hence, the characteristics of the population are used as the
basis for selection (Walliman 2011; Ritchie & Lewis 2012).
13
The researcher uses non-probability sampling and snowball sampling. According to
Saunders and Lewis (2012), the use of non-probability sampling methods is best when
one does not have a comprehensive list of population and the likelihood of being
selected from the population members is unknown. There was no clear number of the
study population; therefore, convenience and snowball sampling were chosen.
Snowball sampling is a technique used to find research subjects; the researcher
requests the first subject to identify another prospective subject who also meets the
research criteria. Each subject after being interviewed is asked to identify one or more
others in the field (Aaker, Kumar, Day & Leone 2013).
1.5.2.4 Sampling Size
Aaker et al., (2013) indicate that the sample size can be dictated by considering the
cost to collect data, greater accuracy and the speed required for data collection. There
was no frame of reference for the standard sample size. The sample size for existing
studies on marketing and SMEs ranged from 100 to 300, Masocha, (2019) sample
size 238, Sarango-Lalangui, Alvarez-Garcia and Rio-Rama (2018) samples size 188,
Mohutsiwa (2012) sample size 206, Hove (2012) sample size 211, Choeu (2013)
sample size 200, Soke (2014) sample size 273 and Chingwaru (2014), 278. Stam,
Arzlanian and Elfring (2014) report that sample sizes for previous similar studies
ranged from as little as 40 to as large as 756.
In this study the sample size of 412 was deemed appropriate to represent the
population. This was based upon the principle that a larger sample size ensure the
inclusion of people with diverse backgrounds, thus making the sample representative
of the study population (Kumar 2011). According to Kotler and Keller (2012), large
samples give more reliable results, but it is not necessary to sample the entire target
population to achieve reliable results.
1.5.2.5 Data Collection and data Instrument
As per the researcher’s knowledge, data collection contributes to the effective sample
control. Dependability is to be enhanced in this research using a data collection
instrument. Data collection instrument refers to the method used in gathering or
14
obtaining data for any research (Walliman 2011). Malhotra (2010) and Cooper and
Schindler (2011) state that in quantitative research, primary data are collected from a
great number of respondents with the intention of generalising about a certain
population and the verdicts are subjected to mathematical analysis. It includes survey,
observations and experiments.
• Survey
According to Malhotra (2010), surveys encompasses the gathering of primary data
using structured questions that needs the participants to select from an encoded
answer.
• Observations
Observation research offers opportunities to assist the researcher as an instrument to
record the data (Kapoor & Kulshrestha 2010; Belk, Fischer & Kozinets 2013).
• Experiments
Malhotra (2010) state that the researcher uses experiments to manipulate one or more
independent variables and measure their impact on the dependent variables.
Survey methods was used for data collection, with structured questionnaires, which
involved SMEs managers or owners completing the questionnaire to ensure honest
and a high rate of response. Wegner (2012) state that survey is a research method
whereby primary data are gathered through direct questioning of respondents using a
questionnaire to structure the collected data. Leedy and Ormrod (2014) concur with
Wegner (2012) by defining a survey as a research design where a researcher poses
some questions to enthusiastic participants, makes a summary of the responses using
frequency counts, percentages or more statistical indices and then draws inferences
about a population from the sample responses. A questionnaire is an organised list of
questions circulated to a population sample with the purpose of drawing information
from each respondent (Sekaran & Bougie 2010; Kumar 2011).
According to Graziano and Raulin (2013), when designing a questionnaire all
guidelines and questions should be clear however, the questionnaire focus should be
straightforward and defined by the research questions. Aaker, Kumar, Day and Leone
(2011) recommend that a questionnaire be pre-tested to determine its success in
providing relevant information to make responses for the research questions. When
15
developing the questionnaire, the researcher was guided by previous researches on
marketing.
1.5.2.6 Data analysis
Data analysis involves reducing gathered data to a manageable data size after its
collection (Cooper & Schindler 2013). The collected data will be analysed and tested
using the Statistical Package for Social Science (SPSS), version 23. To draw
conclusions from the collected data, two types of statistical tools will be used, namely
descriptive and inferential statistics.
Creswell (2014) articulates that descriptive statistics describe the summarising and
organising of quantitative data. Descriptive statistics is beneficial as it recapitulates
outcomes for an experiment, thus consenting for more productive research and,
subsequently, comprehensive analysis. The descriptive statistics to be used in this
study is frequencies.
Inferential statistics involves using sample statistics to make estimations on the
population considerations (Rosenthal 2011). ANOVA and regression are the
inferential statistics to use in this study.
1.6 ETHICAL CONSIDERATION
Research should be planned in a way that the subjects are not exposed to any
discomfort, physical harm, or even loss of privacy (Cooper & Schindler 2011). There
is no potential harm that can possibly arise from the research and this is grounded on
honesty and is not conducted with fraudulent intentions. The data collected is only
used for this research purpose. The confidentiality of all the respondents in this study
is kept. Ethical approval for this research was obtained from the University of South
Africa, Department of Marketing and Retail Management Research and Ethics.
The researcher considers the following as ethical guidelines and policies regarding;
informed consent, deception, confidentiality, anonymity, privacy and caring (McMillan
& Schumacher 2010).
• Informed consent and voluntary participation
16
McMillan and Schumacher (2010) is of the view that informed consent is attained when
explanations of the study are provided to the participants. The participants will be given
advice concerning termination of participation at any given time with no penalty and
clarity is given in terms of any risks associated with the research.
• Protection from harm
McMillan and Schumacher (2010) state that research or a study should never result in
any bodily or mental worry to participants.
• Privacy, confidentiality and anonymity
The participants’ privacy must be protected. The following restrictions must be applied
to achieve the privacy for the research: participants’ responses, characteristics,
behaviour and other significant information (McMillan & Schumacher 2010)
1.7 STUDY LIMITATION
The main constraint for the study was the cost involved and the amount of time
available to collect data and a lack of access to a database of SMEs in Limpopo. The
outcomes of this research resulted from the responses received from the SME
owners/managers around Polokwane. Therefore, the recommendations might not
apply to all SMEs in other provinces. But the study findings could be used as a source
for more and large-scale research on the effect of marketing strategies utilised by the
SMEs.
1.8 CHAPTER OUTLINE
This section discusses the work that was covered in each chapter
Chapter 2 discusses the SMEs sector in South Africa.
In Chapter 3 covers the factors affecting marketing strategy formulation as well as
discussion of the marketing strategy.
In Chapter 4, the research methodology followed is discussed. The chapter provides
detailed information on the research method followed, such as the type of research
17
design, sampling methods, data collection, data processing, data analysis and ethical
considerations.
In Chapter 5, the results and findings of the research as well as the analysis of these
findings is presented
Chapter 6 discusses the conclusion and recommendations of the study
1.9 CONCLUSION
In this chapter, the background of the research, problem statement, research purpose
and objectives and research methodology applied were discussed. The summary of
chapters covered were also presented. In the next chapter, the SMEs sector in South
Africa including Limpopo is discussed.
18
CHAPTER 2: THE SMALL AND MEDIUM (SMEs) SECTOR IN SOUTH AFRICA
2.1 INTRODUCTION
SMEs have been recognised for the contributions made towards economic
developments. Regardless of the contributions made, they face difficulties that hinder
them from operating successfully in both the developed and the developing countries.
The importance of these SMEs is acknowledged worldwide, but it is still a challenge
to outline what constitutes the definition of an SME, globally, as there is no single
accepted universal definition (Ardic, Mylenko & Saltane 2011; Kiseleva &
Pinkovetskaia 2016).
According to Mabuza (2016), in the South African context an SME definition is based
on the number of people employed and the yearly turnover. Mabuza (2016) and Trade
and Industry Policy Strategies (TIPS) (2017) states that the SME definition is centred
on the number of employees in an enterprise in relation to their yearly turnover
classifications. The chapter outlines all the challenges and the benefits SMEs face.
2.2 UNDERSTANDING THE SME SECTOR
2.2.1 Global small and medium businesses (SMEs)
According to Lucca and Lee (2016), there are different definitions for SMEs. Lucca
and Lee (2016) further state that owing to the prominence and the economic role SMEs
play around the globe, both the governmental bodies and the academics have their
own definitions and these descriptions reveal the national perspective as diverse
countries have their own definitions and the meaning of SMEs.
There is no uniform definition of an SME. This reflects the relative nature of the small-
and medium-sized businesses, which can relate differently to businesses in
agricultural, manufacturing and service sectors (Berisha & Pula 2015). In the United
States (US) an SME is defined as a business entity comprising of a single or more
domestic formations under collective ownership or control (United States International
Trade Commission 2010). SMEs serves as the backbone for economy and
employment in the US (TradeUp Capital Fund & Nextrade Group, LLC 2015).
19
Regardless of uncertainty, SMEs in the US put much focus on growth and
developmental strategies to expand their financial performance (American Express
2017). It is widely viewed worldwide, including in the US and Japan that the SME
sector will likely push the economy out of the recession because it is regarded as the
engine for job creation (Calcagnini & Favaretto 2011)
Upon analysing the definitions of the SME, it is apparent that the definition depends
on the party or person defining it and from which point one define it (Garikai 2011;
Ward 2018). However, the importance of these SMEs is acknowledged worldwide, but
it is still a challenge to define it globally as there is currently no single accepted
universal description for SME (Ardic et al. 2011; Madani 2018). In SA, SMEs
definitions make use of the number of employees within an entity and the annual
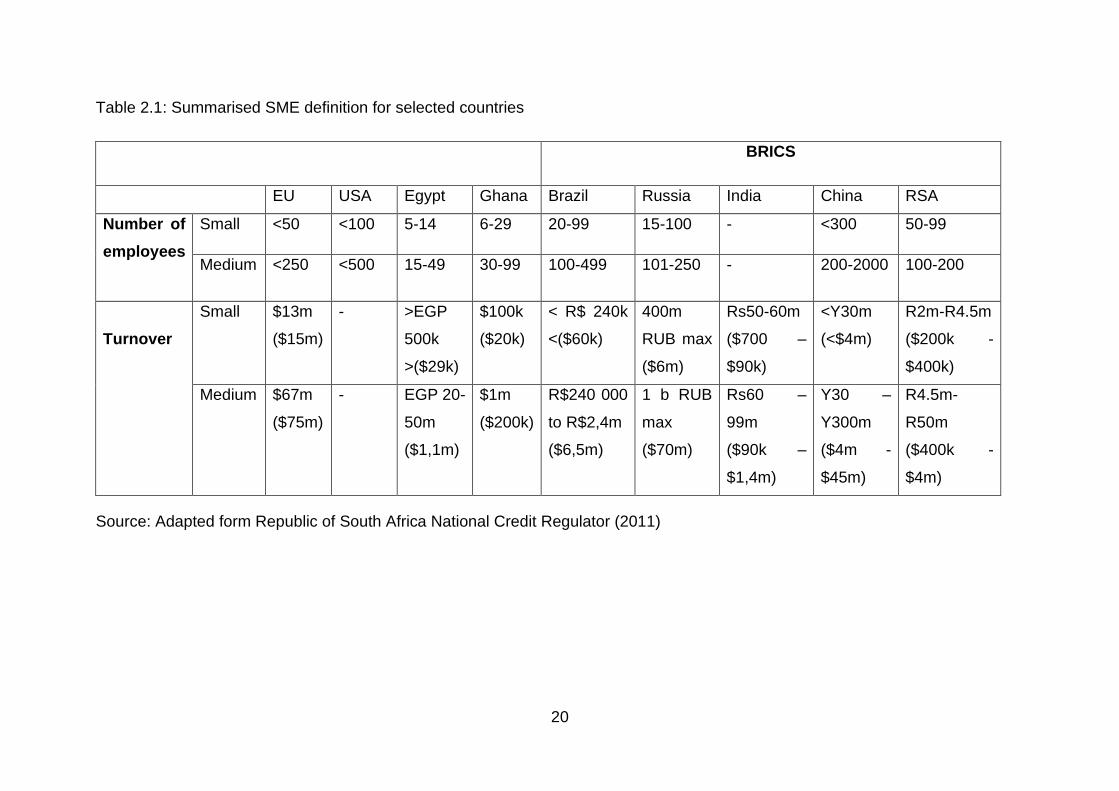
turnover of the business (Garikai 2011). South Africa is part of the BRICS and Table
2.1 below outlines SMEs in some selected countries and BRICS countries.
In reference to Table 2.1, India defines the SMEs looking at the business turnover,
which results from the investment in terms of machinery, plants and equipment, which
are known as the three-tier Indian SMEs classification (Jain & Gandhi 2016). While
other countries within BRICS, Egypt and Ghana define SMEs differently, using the
revenue generated and employment, most researches outlines an SME through the
number of employees (Nwankwo & Gbadamosi 2011; Yoshino & Taghizadeh-Hesary
2016). United Kingdom (UK) defines an SME as any organisation that hires below 250
employees, the US defines SME as any commercial entity that employs fewer than
500 employees, while the European Union (EU) define SMEs as any liberated
business with not more than 25 percent owned by an alternative enterprise and having
less than 250 employees (Patterson & Winston 2017).
20
Table 2.1: Summarised SME definition for selected countries
BRICS
EU USA Egypt Ghana Brazil Russia India China RSA
Number of
employees
Small <50 <100 5-14 6-29 20-99 15-100 - <300 50-99
Medium <250 <500 15-49 30-99 100-499 101-250 - 200-2000 100-200
Turnover
Small $13m
($15m)
- >EGP
500k
>($29k)
$100k
($20k)
< R$ 240k
<($60k)
400m
RUB max
($6m)
Rs50-60m
($700 –
$90k)
<Y30m
(<$4m)
R2m-R4.5m
($200k -
$400k)
Medium $67m
($75m)
- EGP 20-
50m
($1,1m)
$1m
($200k)
R$240 000
to R$2,4m
($6,5m)
1 b RUB
max
($70m)
Rs60 –
99m
($90k –
$1,4m)
Y30 –
Y300m
($4m -
$45m)
R4.5m-
R50m
($400k -
$4m)
Source: Adapted form Republic of South Africa National Credit Regulator (2011)
21
2.3 AN OVERVIEW AND ROLE OF THE SMES SECTOR IN THE SA ECONOMY
SMEs serve as an economic inducement and have become the building blocks of
business formations. Looking at the US and other industrialised nations, SMEs
account for the majority of jobs, creating new jobs and growth in the economy
(Valadez, 2011). Hussain, Farooq and Akhtar (2012) agree with Valadez (2011) by
stating that SMEs are imperative for economic growth of any country, particularly in
the emerging world, through job creation and poverty alleviation.
South Africa is still a developing country and in developing countries, SMEs play a
significant role and have the potential to advance the country’s income distributions,
reduce poverty through the creation of employment and impact on the facilitation of
export growth (Love & Roper 2013). According to Mohutsiwa (2012), South Africa as
a developing country is facing the pressure of job creation. Therefore, the formation of
new SMEs and the enhancement of the current ones could help in assuaging the
situation (Ramukumba 2014).
The small business sector contributes positively towards the economic growth of any
country in the world (Wielicki & Arendt 2010). Valadez (2011) and Malefane (2013)
articulates that SMEs serve as the main pillar of job creation, which helps in lowering
the socio-demographic challenges, such as unemployment as well as income and
occupation that result from high population growth. They serve as the driving force of
economic strength due to the jobs created, which will then positively affect the national
economy (Smit & Watkins 2012). Discovering novel customs to improve and advance
the country’s SME sector will contribute to the improvement of the South African
economic problems (Sowetan Live 2012).
Al-Mubaraki and Aruna (2013) and Ayandibu and Houghton (2017) ascertain that
SMEs play the following roles in any economy: (a) have the responsibility to grow
employment at a quicker rate than large organisations (b) increase the market
competitive intensity and decrease the dominance position of larger businesses; and
(c) encourage the placement of business skills and innovation. Smit & Watkins (2012)
alludes to the fact that the issue of SMEs as the central part of instituting employment
and establishing the economic growth has been thoroughly debated.
22
Department of Trade and Industry (2012), Timm (2012) and Sibanda (2013) advocates
that over 800 000 SMEs exist within the country and project their overall economic
outputs to be around 50 percent of the GDP and 55 percent towards employment.
Subsequently, SMEs accounts for approximately 95percent of the world’s employed
inhabitants and serve as the centre of employment in emerging countries (Abor &
Quartey 2010; Chang, Wu & Cho 2011). The SMEs sector in South Africa make
60percent contribution to the country’s employment and 42 percent to the GDP
(Statistics South Africa 2015). This resulted in the governments worldwide supporting
the development of SME sector in promotion of economic development (Fatoki &
Garwe 2010; Fatoki & Odeyemi 2011; Rungani & Potgieter 2018). SMEs make a fair
contribution towards the provision of products and services to humanity. With the
current expanding customer base, large firms may not meet the high demand of goods
and services alone, SMEs are needed (Katua 2014).
The National Development Plan (NDP) sets out numerous goals for the SME sector in
South Africa - including the target for 90 percent of created employment opportunities
by this sector by the end of 2030. The NDP envisages the growth of South African
economy by at least 5.4 percent per year within the next 15 years and identified the
SME sector as a pivotal player in pushing this growth (SBP 2014). Comparing African
SMEs with other SMEs across the world, in Africa SMEs are not doing well because
of the small local markets, difficult business conditions and undeveloped regional
integration, which include burdensome official procedures, deprived infrastructure and
derisory financial systems (Akugri, Bagah & Wulifan 2015).
Moreover, the contributions of SMEs towards the economy, like creation of
employment, GDP contributions and poverty reductions differs across countries (Zafar
& Mustafa 2017). Meaning that SMEs can accelerate economic progression since they
create new jobs, enlarge the tax base and encourage innovation. Not all SMEs are
appropriate to be vital drivers for economic growth (Shinozaki 2012). Shinozaki (2012)
further state that there are two categories for SMEs for the role they play towards
national economy, namely stability-orientated and growth-orientated. Stability-
orientated SMEs are not very interested in business development, as they are usually
family businesses catering only for basic needs. While growth-orientated SMEs are
23
insignificant in size, however, rising and exploring innovative business opportunities
with advanced expertise.
Factors affecting SMEs marketing strategy formulations are discussed on the next
section.
2.4 FACTORS AFFECTING THE MARKETING STRATEGIES OF SMEs IN SA
According to Kamunge, Njeru and Tirimba (2014), SMEs face difficulties that hinder
their long-term survival. Aren and Sibindi (2014) discovers that 75 percent of the South
African SMEs do not become established businesses, which contribute to the
country’s SMEs higher failure rate.
The marketplace today is branded by robust competition, swiftness and change as a
mutual characteristic. The way business is done today is affected by new technologies
and technology intensifies new market opportunities for businesses. These factors
force businesses to respond swiftly to novel deviations and demand conditions within
a short product life cycle and this is done through marketing and formulation of
marketing strategies (Marjanova & Stajanova 2012). Hadiyati (2015) state that
development of innovative technologies influences the system of running the business
and advances the opportunities for new-found markets as customers have more
expectations for new features and transformation of current products from time to time.
Compared to large enterprises, SMEs faces different challenges such as lack of
experience for conducting market researches, limited resources, marketing skills,
competition, building appropriate relationships with those customers and the trend of
limiting marketing to selling (Aigbavboa & Thwala 2014; Makhitha 2016). Strategic and
tactical customer related problems, business size, poor cash flow and marketing
expertise are amongst the aspects that hinder the SMEs to perform the marketing
function (Marjanova & Stojanovski 2012). Yan and Chew (2011) asserts that the
development of marketing principles and strategies within SMEs is narrow and often
relies on the small business traditional marketing model.
The research conducted by Lekhanya (2014) shows that most of the SMEs do not
have marketing in mind and do not see the importance of marketing. Furthermore, the
large number of respondents in Lekhanya (2014) assume that marketing needs
24
extraordinary skills and is costly, so lack of funds, lack of experience and knowledge
were considered the foremost cause for them not to implement marketing.
There are other internal and external factors that have an effect on the SMEs, such as
lack of marketing knowledge, lack of funding, competitions, economic and the legal
influence. (Fatoki 2014; Lekhanya 2015). Therefore, it is apparent that the SMEs
across the country and other nations are faced with constraints in marketing, market
research, market access, management skills and other related factors. These are
discussed in the next sections.
2.4.1 Marketing
According to Van Scheers (2011) and Gabrielli and Balboni (2010), marketing is one
of the most important activities for SME success. SEDA (2012) assert that the South
African SMEs face high levels of failure rate, which lack of marketing skills makes a
huge contribution. Cant (2012) indicates that the absence of marketing skills has a
bad effect on the success of SMEs.
Market knowledge is essential since it helps SMEs in identifying the prospective
competitors in the market (Marjanova & Stojanovaski 2012). Furthermore, Marjanova
and Stojanovaski (2012) state that SMEs owners are not knowledgeable in running
the business and have no thorough understanding of the marketing practices and its
impact to business success in a market economy. All these facts make the enterprise
vulnerable in the market competition. Ebitu et al. (2015) recommends that SMEs
managers should be effectively educated on the principles of marketing and on
marketing practices. The SMEs marketing strategy aims to position resources and
abilities to face competition in the market; it is reported that resources are an essential
part in implementing the strategies; hence, SMEs do not have enough (Ardjouman &
Asma 2015).
According to SAICA (2015), finding customers and marketing the business well are
the biggest operational obstacles that SMEs come across. Many SMEs do not
exercise the marketing model, which acknowledge the power of the customer and
guarantees customer satisfaction.
Market knowledge assists SMEs to cultivate a competitive advantage through an
understanding of customer demand and knowledge, which results in positioning itself
25
in a strong market position (Hadiyati 2015). Most SMEs have limited resources
assigned for marketing and managers are inexperienced in marketing and focus on
the activities they are familiar with, which leads to little engagement of marketing by
SMEs (Carter & Jones-Evans 2012). A great deficiency in SMEs marketing is
incompetence to forecast future product demands, where it results in a slow and
passive response to restructurings and developments within the marketing
environments (Jovanov & Conevska 2011).
Bellamy (2009) in Lekhanya (2010) assert that there is a great need for SMEs
marketing managers to properly plan as they operate under unsettled environment.
According to Sarma (2013) and Hadiyati (2015) SMEs are faces a fundamental
marketing challenge to succeed and the foremost challenges SMEs face are product
and market competitions and access to market information in support of marketing.
Venkatesh and Kumar (2015) asserts that SMEs do not have enough resources in
place therefore, there is a need for government support to make contribution in the
area of marketing. Omar and Anas (2014) state that SMEs need both financial and
non-financial support programs to make improvements in marketing, through
partnering with big firms in exploiting all marketing opportunities.
SMEs owners implement the marketing concept differently to traditional marketing.
Marketing concepts has remained the concept for discussion in many textbooks. This
concept that was initially developed for bigger firms cannot be used without alterations
or adaptations for SMEs. It shows that the approach of the marketing concept
necessitates some adjustments to match with the SMEs characteristics as opposed to
big firms (Sarma, Septiani, Dewi & Siregar 2013). According Omar and Anas (2014)
and Leboea (2017), challenges in the SME market and marketing are experienced
because of factors such as quality of goods (most produced goods are of lesser
quality), inferior raw materials, unattractive product designs and lower level of workers’
skills and expertise, therefore, to some extent the success of SMEs is influenced by
ineffective marketing elements.
Enough revenue cannot be generated by selling out-fashioned products to the very
same market in the same old way (Trivedi 2013). According to Ventatesh and Kumari
(2015), marketing serves as a strategic instrument for business enhancement and has
an effect on the growth and existence of the business. As a result of lack of resources,
26
lack of information and disorganised ways of marketing, the SME sector continuously
faces problems in exploring fresh markets and keeping the old ones.
Awan and Hashmi (2014) state that marketing is informal and unstructured within the
SMEs. According to Fischer, Nebe and Klompmaker (2011), marketing is a discipline
that helps in delivering business-oriented market strategies that will enable it to meet
customers at the point of their needs and surpass customers’ expectations.
Chuwiruch, Jhundra-Indra and Boonlua (2012) asserts that for the firm to successfully
compete and become sustainable with all the high level of environmental changes and
uncertainty, it is vital to develop new practices and strategies to appeal to the great
masses of customers and retain competitive advantage. The victory of business is
based on its capability to satisfy customer needs, it is done through adopting relevant
marketing strategies and improvement in communication technologies (Li & Zhou
2010; Voronkova, Kurochkina, Firova & Bikezina 2017).
SMEs product and brand failures transpire on a continuing basis to varying degrees;
this negatively affect the development and the product marketing processes (Berry
2010). It is a common issue that businesses and products that are not adequately
marketed are likely to perform poorly (Tlhomola, Rankhumise & van Niekerk 2010).
Therefore, it is important for SMEs to improve on the way they market their product
and services.
The current and upcoming prospective businesses and product growth depend much
on the marketing activities (Paull & Duarte 2010). Most SME owners are seriously
constrained as they are unable to invest much in marketing and lack the essential
marketing skills (International Monetary Fund 2013). According to January (2013),
SMEs marketing is ordinarily disregarded, and this can be ascribed to motives such
as shortage of funding for market researches for specific product and services, lack of
exposure about the significance of corporate marketing training and lack of self-
confidence to explore different market opportunities.
The research conducted by Xaba (2012) shows that some SMEs success depends on
sales and marketing, therefore, without sales and marketing the business cannot
guarantee a future patronage. Xaba (2012) further state that SMEs needs to engage
on marketing and promotional works to ensure that clients are aware of their business,
product and service existence.
27
2.4.2 Marketing research
Any business enterprise should have an intelligence marketing system in place to help
them acquire useful information about consumer needs and wants and gather all the
marketing intelligence that will ensure they have an understanding on how to satisfy
consumer needs efficiently (Aaker, Kumar, Leone & Day 2012).
Marketing research serves as a contribution to the product design decisions and
guides the new product development (Kahn 2013). Furthermore, Kahn (2013) assert
that a well performed marketing research linked to customers’ needs is certainly a
substantial step in the National Development Plan process since it allows the
marketing team to find information about what customers want and their willingness to
pay for the offerings. Marketing research application is a crucial part of marketing
activity for SMEs. SMEs effective marketing strategy formulation is centred upon
consumer consideration and their behaviour. Therefore, consumers can be
understood through the results of marketing research (Ogbadu 2013).
Executing SME market research can contribute to the SMEs to better identify a group
of customers and may assist them serve different types of customers better and
develop relevant products (Van Swinderen 2015). Van Swinderen (2015) further state
that market research allows a firm to realise the target market and the way consumers
think about the product before it can be placed on the shelves.
Making vital decisions can be extremely dangerous if thorough study of the market, its
customers and competitors is not done, which is also relevant for SMEs regardless of
their size (Kaden, Linda & Prince 2012). As with the inconsistency of marketing
planning, SMEs essential limits make it almost difficult for such enterprises to do
market research. Lack of funds and proficiency joined with limited time scales makes
it questionable that SMEs owners/ managers do a thorough market research (Ruzzier,
Ruzzier & Hisrich 2013)
2.4.3 Lack of access to market
In the developing countries, SMEs finds it difficult to access the markets and even if
they can have access to finance, adequate and educated labour force and
technological advancements, it could face failure if it does not have access to markets
28
(Hussain, Farooq & Akhtar 2012). The current technological advancements expose
SMEs to seek both local and international markets (Al-Mubaraki & Aruna 2013).
Kockaya and Wertheimer (2016) define market access as the term used to denote
different strategies and methods the firm uses to gain access to customers for their
products and services. Access to markets is regarded as one of the critical
requirements for SMEs to access funding and mentoring at the early stages of
operation (SEDA 2016). However, Ladzani and Netswera (2009) mentions that some
SMEs, particularly in the rural areas, are less advantaged as compared to their urban
counterparts, as the access to both the market and funding’s are not the same.
Therefore, inadequate resources make a huge contribution to lack of market access.
Makhitha (2016) state that because of insufficient access to the markets, small
businesses find it difficult to market their product successfully. Therefore, proper
marketing strategies guide SMEs concerning price distribution, products, target
markets and all factors of the marketing communication relevant for the target market,
which will result in SMEs accurately accessing the markets (Ackah & Vuvor 2011;
Makhitha 2016).
2.4.4 Competition
Competition is the key force in a competitive market that has an impact on the firm’s
pricing decisions and other things, such as products. Therefore, a marketer should
study the competitors’ present pricing strategies and analyse them to work out their
upcoming pattern and should, consequently, structure the pricing policies (Sahaf
2013). Awan and Hashmi (2014) in Makhitha (2016) observes that SMEs are operating
and contending in an environment that is comprehensive in scope, knowledge-based
and information rich, which keeps on influencing the techniques of their business
operations.
Adequately, the government should play a central position in removing all the
obstacles that prevents rational competition within the SME sector (Mafuya 2013). As
part of marketing, competition is always available and SME owners should be
knowledgeable about business processes and clearly understand the marketing
processes to survive the competition in the market (Ebitu & Ufot 2015). Ebitu and Ufot
29
(2015) further asserts that all mentioned facts lead to SMEs losing the battle with
competition if they cannot clearly define both the business and marketing strategies.
2.4.5 Lack of management skills and training
Bola and Richard (2012) make reference to manufacturing SMEs in South Africa and
in their study, they state that SMEs fail to grow due to deficiency of entrepreneurial
and managerial skills and business skills. Zeleke (2013) concurs with Bola and
Richard (2012) by establishing that the long-term existence and probability of the
SMEs are seriously damaged by lack of entrepreneurial skills, lack of professional
expertise and lack of managerial improvements to newly established businesses.
Aghim (2013) articulate that management skills are recognised as one of the
substantial elements for an entrepreneurial victory.
In support of Aghim (2013), January (2013) emphasise the importance of training and
skills for business management and state that the enterprise managers should
possess business and marketing skills or appoint an employee in possession of it or
have a ready access to training to accomplish these skills. These skills will help them
function in a professional way in their enterprises, work effectively with others, lead,
have time management and clearly negotiate the business deals (Karanja, Muturi,
Mukabi, Kabata, Wahome & Kayogo 2013)
Likewise, the SMEs managers often lack knowledge and expertise and these
businesses often rely on a few individuals, often deprived of the sustenance of the
correct management (Mbonyane 2009). Agbim (2013) recommends that SME
managers possess the management skills to plan and budget for marketing strategy
that offers assortment of products together with abilities to quickly act upon perceiving
vagaries in the environment and maintain virtuous customer relations. Yahya, Fatt,
Othma, Rahman and Moen (2011) recommend that SME managers obtain relevant
business training and management skills to empower them to manage the enterprise
effectively, make the right decisions to attract and preserve proficient employees.
Since SMEs function within an environment that changes swiftly because of
globalisation, this assist the labour force within the SMEs to gain a particular level of
education to match the ever-changing trends of the markets (Al-Dairi, McQuaid &
Adams 2012). Radipere and Dhliwayo (2014) supports the findings of Ai-Dairi et al.
30
(2012) by articulating that the SMEs owners with higher qualifications contribute
positively to better business performance, as they have acquired enough knowledge.
Smit and Watkins (2012) found that the failure rate of SMEs is increasing in South
Africa due to, but not limited to owner-managers’ small knowledge concerning the
problems encountered in their business operations. Work experience and skills, the
level of education, the age of the owner and the area in which the business operate
in, have an essential impact on the business productivity (Norman & Mornay 2012).
Wanigasekara and Surangi (2012) backs Norman and Mornay (2012) by stating that
many scholars have realised a solid connection between education, business
knowledge and business success.
Boris and Reggie (2012) state that a business person’s technical and operational
proficiencies serve as an imperative custom of a proficient power that advance the
execution of the business visions and strategy. Lack of business skills and financial
support makes it difficult for owner-managers to be open minded, as they usually focus
much on the short-term objectives like being profit centred (Laos, Southiseng & Walsh
2010). The study pioneered by Costin (2011) shows that SME’s growth depends on
the entrepreneurs’ opinion and intention for growth. Therefore, lack of resources limits
SMEs marketing and often the same lack of resources affects the business growth. In
most cases business owners lack marketing skills and have no resources, like finance,
available to outsource experts in marketing (Needle 2010; Van Scheers 2011; Lucca
& Lee 2016).
The size of the SME oftentimes finds it difficult to access necessary business
resources and are forced to work with little available resources. Nevertheless, the
availability of resources differs a lot between large firms and financial and human
resources are narrow within an SME, where it may be necessary for an employee to
multi-task (Cruz-Cunha & Varajao 2011). As articulated in the marketing and
entrepreneurship literatures SMEs are repeatedly affected by the shortage of
resources, namely human capital (Lucca & Lee 2016).
2.4.6 Business culture
Within the business and management framework, the word culture is used
interchangeably with the term organisational culture. This refers to the process, beliefs
31
and practices of firms. Lucca and Lee (2016) state that to understand culture in a small
business setting where the founder is in control of the business, there is a need to
consider how the set of rules and ethical beliefs acquired from the environment affects
our actions in society. Adelekan (2016) define organisational culture as part of
knowledge concern with whole fundamental traditions that a certain assembly has
developed while learning to resolve the adaptation problems to the internal integration
(Adelekan 2016).
Maher (2014) confers that organisational culture significantly deters or simplifies the
maintenance and execution of innovation and marketing strategies within an SME.
This is a crucial factor, which affects the rate of marketing strategy and innovation.
Businesses whose culture encourages innovations when there are resources
available, like finance and human resources, have a habit of implementing more
innovations, marketing strategies and advancing competitive advantage (Hughes &
Morgan 2007).
The performance of an SME is affected by culture, cultural upbringings, aspirations,
ambitions and the business owner’s intentions that affect operational processes
(Lucca & Lee 2016). Consequently, cultural factors and networks accessible by
entrepreneurs can have an effect, not necessarily on the choice of an activity to be
assumed, but also the outcomes of the very same activity (Petro, Annastazia & Robert
2014). Organisational culture can successfully encourage or prevent teamwork,
sharing of knowledge, skills and ideas.
Different business owners are different in terms of styles of management and are
inspired by various aspects of business life. Therefore, some SME owners/managers
have no special interest for growth and shows hesitancy to participate in growth-
inspiring activities such as increasing the number of staff members within an enterprise
(Lucca & Lee 2016). Within the SMEs where there are few employees, like less than
10, the owner normally has a strong impact on the business culture, policies and
business’s actions unlike in big businesses (Ferreira 2011). Organisational culture
within an SME affects numerous employee’s and business outcomes. Burns (2011)
state that organisational culture affects employee behaviour, creativity and innovation,
knowledge management, learning and development and business performance.
Felicia, George, Owoyemi and Adegboye (2013) indicate that social and cultural
32
standards and beliefs concerning entrepreneurship have a significant influence on
inspirational background of entrepreneurial aims and trade performance.
2.4.7 Lack of branding
Branding is one of the major concepts in the field of marketing and is vital for all
businesses, irrespective of the size (Pencak 2012). If it is well organised and planned,
branding drives the business sales, creates a brand value, builds customer loyalty and
promotes business growth. According to Cant, Wiid and Hung (2013), it is unfortunate
that SMEs are aware of the benefits derived from branding, but they are too concerned
about their daily business operations and neglect branding due to their attitude that
branding is costly and is applicable for big businesses.
According to Muhammed, Mohd and Halim (2012), branding is generally assumed by
SMEs to be the business of large firms and this is because branding for small
businesses has been mostly ignored. One of the objectives of branding is to create
uniqueness of a brand on proportions that are appropriate and preferred by
consumers, which is something that is needed in the SMEs (Gouliamos, Theocharous
& Newman 2013). Brand can create an exclusive identity to distinguish products and
services and to stimulate consumer demands (Kapferer 2012).
Branding it’s an element that affects marketing strategy of a company; nevertheless,
marketing within the SMEs may be different from marketing of big companies, likewise
branding matters of SMEs may also differ from branding issues of large companies
(Tock & Baharun 2013). Odoom, Narteh and Boateng (2017) recommend branding for
the improvement of SMEs performance, even though branding, as a concept, is
invisible, but renowned brands are likely to be unforgettable by consumers and play
an important role when there is no clear variation amongst products.
Nevertheless, SMEs in SA encounters many general challenges that prevent their
progression (Nikolic, Dhamo, Schulte, Mihajlovic & Kume 2015). The significance of
an SME growth involves its capacity to survive any change in its environment.
Therefore, firms’ strategies should not only be pointed on simple business survival,
but instead focus the strategies on enhancing continuity and growth (Lucca & Lee
2016; Vemic 2017).
33
2.4.8 Government rules and regulations
The SME sector activities are regulated and are an essential function for any
government (International Labour Organization 2016). Government policies has also
been cited as a main limitation to entrepreneurial activities in South Africa (Simrie,
Herrington, Kew & Turton 2012). However, Brazil increased its entrepreneurial
activities resulting from well managed and stimulating government policies (Simrie et
al., 2012). As part of harsh business regulatory systems within the country, South
Africa was rated 28 out of 30 economies, which mainly consists of developed countries
(World Bank & International Finance Corporation 2012).
World Bank economists reveals that in countries with many business start-up
regulations, its entrepreneurs start few new businesses (Shane 2011). According to
Rankhumise (2010), the right or adverse environment for business evolution is created
and influenced by government. The challenges emanating from the terms of wages
framework, opportunities, taxation, technological support, licencing and infrastructure
pave the way towards the success or failure of the SMEs (Aren & Sibindi 2014).
Subject to the regulatory frameworks laid down by the government, it can certainly
break or stimulate the small business economy (Kamunge, Njeru & Tirimba 2014).
2.4.9 Lack of clear business planning
The starting point in establishing a business is the discovery of a business prospect
therefore, to transform it into a commercial entity it needs a sound plan or a feasibility
study, which can be documented as a business plan (Kalanwa 2014). Business plan
functions as a support to aid the enterprise to find its relevant target markets (Cant,
Ardis & Sephapho 2014). This is thought-provoking because when drafting business
plan, it is necessary to conduct consumer analysis and feasibility studies as
prerequisites to identify the market (Halton Business 2011). Chimucheka (2012) states
that some SMEs encounter problems controlling their cash flow and collapse, resulting
from the absence of a business plan as it gives business direction.
Planning plays an imperative role in a business of any size and should never be taken
casually (Pride, Hughes & Kapoor 2013). According to SBP (2014), SMEs without a
comprehensive business plan have little chance for survival and success. Hisrich,
Peters and Shepherd (2010) and Chimucheka (2012) found that a business plan helps
34
SMEs in applying for business loans or funding with the financial institutions, which is
a prerequisite. However, if an incomplete business plan is presented it will be difficult
for an enterprise to be given funding or credit by the bank in South Africa (Chimucheka
2013). Therefore, business owners and managers must work tirelessly and be
prepared to devote enough time on planning to succeed (Muske 2011). An SME that
has an outstanding performance makes good planning more frequently and
sometimes looks at the broad situation and analyse far much better than the
competing SMEs (Makhitha 2016).
It was proven that SMEs with high performance have annual or long-term marketing
planning, consider comprehensive situational analysis, often do internal market
research often, are not reactional but proactive in terms of future planning and set an
adequate marketing objective (Makhitha & Bresler 2011).
2.4.10 Financial resources and support
SME owners or entrepreneurs usually hear about several financial institutions;
however, they do not know what they offer, since obtaining this information may be
costly (Magesa, Shimba & Magombola 2013). Rambo (2013) and Botrić and Božić
(2017) concur with Magesa et al. (2013) by observing that most SMEs do not have
information about the funding programmes and some face complications in accessing
funds to sustain and increase their business investments
Harelimana (2017) recommend that, SMEs should be informed about the availability
of funding opportunities and financial structures offered by the government and the
private sector. However, Kihimbo, Ayako and Omoka (2012) assert that apart from
adequate information about financing and business plans, collateral in the financial
institutions should be lessened. This Lack of and limited financial resources make it
hard for the SMEs to function well, therefore, a lot of challenges emanate (Cruz-Cunha
& Varajao 2011; Leboea 2017).
According to Chimucheka (2013), there is a substantial link amongst the accessibility
of finances and business growth, therefore, every business need finances to exploit
growth, grab investment opportunities in the market and attain more valuable assets.
In South Africa, there are numerous funding programmes and financing structures
from public and private sectors. It was revealed that most of the South African SMEs
35
are not aware of the funding opportunities and finance remain the main challenge to
execute marketing (NCR 2011).
Walt (2013) states that with basic financial problems for marketing, SMEs are faced
with the onslaught of larger enterprise scales in terms of product quality, assessments
of marketing scenarios, costs and changes in the market. Agwa-Ejon and Mbowa
(2015) state that until SMEs have the required proficiency to modify their operations
to the transformed marketing situations, they will not easily make it. Therefore,
financing for SMEs marketing practices will remain a challenge
2.4.11 Crime
Crime is a main concern that adversely shakes local economic development (Motta
2017). It is apparent that crime is a crucial issue, not only having a bad effect upon
SMEs but South Africa at large. SMEs often lack the skill to detect and trace criminal
acts at an early stage, therefore, crime makes it difficult for SMEs to survive as they
incur profit losses due to crime and security measures (Cant & Wiid 2013).
Due to the high level of employee theft and professional thieves SMEs incur much
costs not only to protect their products but customers as well (Cant & Wiid 2013).
Within the emerging world situation, growing crime experienced by firms can have
direct consequences, as the already susceptible business climate in developing
markets can further weaken. Crime may also hinder the progress and performance of
SMEs (Islam 2014).
This is a crucial problem that undesirably distresses local development in developing
countries and also affects the SMEs growth through extra costs for upgrading their
security systems and reimbursement of employees affected by such acts of crime
(Mbonyane & Ladzani 2012). According to Kimou (2015), the increase in the crime
rates primarily affects the firm’s profits
2.5 GOVERNMENT SUPPORT POLICY FOR SMES AND INSTITUTIONAL
FRAMEWORK IN SOUTH AFRICA
For the past years the government of South Africa has financed the initiatives intended
to support and grow the SME sector. This was done through the South African small
36
business policy that was guided by the 1995 White Paper on national strategy
concerning the expansion and promotion of small businesses in the country (Timm
2011). Amra, Hlatshwayo and McMillan (2013) state that the White Paper stressed the
necessity intended for access to finance, information and reasonable physical
infrastructures for SMEs. The aim being to strengthen the capability of SMEs to strive
and operate in both the national and international markets
The 1995 White Paper objectives presently find practical manifestation in the
Integrated Small Business Development Strategy for 2005 to 2014. The strategy is
based upon the following pillars:
• To increase the source of financial and non-financial support;
• Making demands for products produced by SMEs; and
• Dropping regulatory restraints.
In South Africa the government is aware and acknowledges the importance of SMEs
and developed the framework to support SMEs. The South African government has
made some initiatives in support of the SME economy (BANKSETA 2015). The
Government’s chief agencies and treasuries are spread transversely in five different
departments, as shown in the table 2.2.
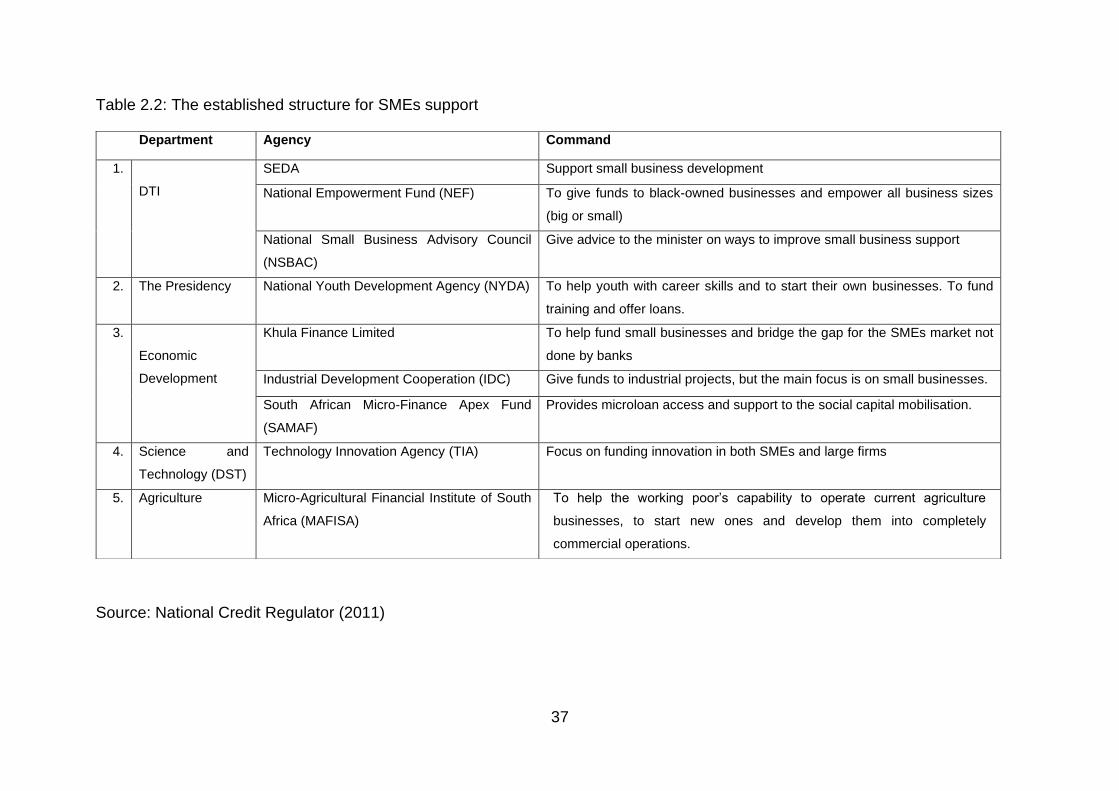
37
Table 2.2: The established structure for SMEs support
Source: National Credit Regulator (2011)
Department Agency Command
1.
DTI
SEDA Support small business development
National Empowerment Fund (NEF) To give funds to black-owned businesses and empower all business sizes
(big or small)
National Small Business Advisory Council
(NSBAC)
Give advice to the minister on ways to improve small business support
2. The Presidency National Youth Development Agency (NYDA) To help youth with career skills and to start their own businesses. To fund
training and offer loans.
3.
Economic
Development
Khula Finance Limited To help fund small businesses and bridge the gap for the SMEs market not
done by banks
Industrial Development Cooperation (IDC) Give funds to industrial projects, but the main focus is on small businesses.
South African Micro-Finance Apex Fund
(SAMAF)
Provides microloan access and support to the social capital mobilisation.
4. Science and
Technology (DST)
Technology Innovation Agency (TIA) Focus on funding innovation in both SMEs and large firms
5. Agriculture Micro-Agricultural Financial Institute of South
Africa (MAFISA)
To help the working poor’s capability to operate current agriculture
businesses, to start new ones and develop them into completely
commercial operations.
38
SEDA, in association with the Department of Small Business Development (DSBD),
has embarked on the Gazelles Programme, which strives for transforming the
landscape in the SMME sector within the country (SEDA 2017). Nevertheless,
according to Ryan (2012), Themba (2012) and Nkwinika and Munzhedzi (2016), few
business owners/ managers are impressed that government is doing something to
nurture SME development, entrepreneurship, innovation and job creation.
2.5.1 The SMEs support at provincial and local level
The South African government has vowed to support the SME initiatives and each
province has established a support base, including the National Support offices, which
are based in all the provinces, like NYDA (Malefane 2013). In Limpopo, the
Department of Economic Development, Environment and Tourism (LEDET) is in
charge for implementing the provincial support initiatives for small businesses. Some
structures or institutions are in place to give small businesses support: Limpopo
Development Agency (LIMDEV), Limpopo Business Support Agency (LIBSA),
Limpopo Tourism and Parks, Limpopo Agribusiness Development Corporation
(LADC) and Trade and Investment Limpopo (TIL). LIMDEV is responsible for finances
and also renders trading and industrial space for SMEs and LIBSA helps in the
business registrations, compilation of business plans, business training, mentoring
and marketing the trade shows. TIL offers investors an inclusive one-stop service to
make provision and facilitate investment and extension into South African, African and
other international markets (Mbedzi 2011; Maloka 2013; DTI 2017).
Some of the previously mentioned agencies (LIBSA, TIL, LADC, LIMDEV) have been
amalgamated into Limpopo Economic Development Agency (LEDA), which is guided
by the Limpopo Development Corporation Act, Act No.5 of 1994, as amended, and
conforms with the Public Finance Management Act (PFMA) (LEDA 2013/14). It has
been established as a special purpose vehicle.
The SMEs developments in the local governments symbolise part of Local Economic
Development (LED) strategy whereby it aims at promoting economic development
(Africa Growth Institute 2010). Meyer and Venter (2013) describes LED as an
undertaking whereby local people across different sectors working collectively to
encourage local profitable activities, resulting in a strong and viable economy. LED is
39
a national government policy drive concerning financial developments that allow and
inspire local people to work collectively to accomplish workable growth and
development (Sibanda 2013). The local government in Limpopo lacks indispensable
economic and human resource capability to make provisions of the basic services for
SMEs and essential structures (Nkwinika & Munzhedzi 2016).
SEDA has formed several main programmes that are designed to guide small
businesses through their specific problem areas, including offering support for growth
and advancement. For instance, SEDAs Franchise Support Programme sponsors
franchising businesses to new and current entrepreneurs, offering advice concerning
possible franchisee and franchisor opportunities
Munzhedzi (2015) postulates that the LED programmes chaired by municipalities have
not made a great impression. Conversely, Nkwinika and Munzhedzi (2016) posits that
LED encourages the public, private and civil society divisions to form partnerships and
act as a team to discover solutions to mutual commercial challenges.
2.6 CONCLUSION
An SME has been defined from the perspective of different countries and authors. The
literature also showed the role SMEs play towards the country’s economic
development; it also showed the recognition of SMEs’ impact internationally. The
South African government has acknowledged the impact that small businesses have
towards the economy and put some measures in place to support their formation and
sustainability through funding, business advice and so on. However, some of the
SMEs still fail due to factors like lack of resources, finance, lack of access to markets
and managerial.
Technology has affected the way business is done today and it also intensifies new
market opportunities for businesses. This forces businesses to respond swiftly to novel
deviations and demand conditions within a short product life cycle, which is done
through marketing and formulation of marketing strategies, which sometimes causes
the SMEs to collapse. This was confirmed by the study conducted by Marjanova and
Stajanova (2012).

40
Government acknowledgement and support towards the SMEs was also discussed
whereby LEDs where developed with the aim of promoting economic development.
The next chapter discusses the marketing strategies within the SMEs.
41
CHAPTER 3: MARKETING STRATEGIES IN SMALL AND MEDIUM BUSINESSES
(SMEs)
3.1 INTRODUCTION
The preceding chapter discussed the SME sector. The literature review in this chapter
covers the marketing strategy as well as factors affecting performance of small
businesses. As alluded to by Solomon, Marshall and Stuart (2011) businesses are
there to satisfy the consumer needs and wants profitably. Therefore, an understanding
of consumer needs will enable businesses to satisfy them appropriately and this can
be done through the proper use of marketing and marketing strategies.
Van Scheers (2010) and Gabrielli and Balboni (2010) state that marketing can be seen
as one of the most essential tasks for SMEs and that the necessary skills about
marketing and marketing strategies are important for SMEs to survive. Lamb, Hair and
McDaniel (2012) state that SMEs need the marketing strategies to select and unfold
one and/more of the target markets and conserving and developing a marketing mix
that yields positive results.
Subsequently, Makhitha (2016), ascertain that decisions about the business marketing
strategy for products to be offered must take note of the target markets’ needs and
satisfaction. Therefore, a business must strive to satisfy customer needs. According
to Akroush (2012), there are some components of marketing strategy, which must be
adhered to: target market, product, price, place and marketing communication
strategy. Borza and Borza (2014), concur with Akroush (2012) by stating that for
businesses to achieve goals, they must follow the well-known typical marketing
strategies, which are target markets, price, product, place and promotion strategies.
Gomez and Perez (2018) state that businesses need to implement marketing
communications in order to achieve good brand positioning of their products and of
the business itself because a favourable perception by consumers makes it easy to
remain in the market. Therefore, effective communication needs to be maintained with
customers to increase and strengthen loyalty and customer retention levels (Flores &
Yapuchura 2012). The elements of the marketing strategies investigated within the
study are product strategies and marketing communication.
42
3.2 DEFINING MARKETING
According to Solomon, Marshall and Stuart (2011), firms exist to satisfy both wants
and needs of consumers. Therefore, an understanding of consumer needs will enable
businesses to satisfy them appropriately and this can be done through proper
marketing. Kotler and Keller (2012) define marketing as a collective process by which
the businesses meet customers’ needs and wants through manufacturing, offering and
trading products and services of worth. Mullins and Walker (2013) concur with Kotler
and Keller (2012) by defining marketing as a collective practice containing all the
relevant activities in support of both the organisations and individuals to attain their
needs and wants through a mutual exchange and develop a continuous relationship.
Lekhanya (2015) sums up these definitions by defining marketing as the point whereby
the desired goods and services are created and delivered to prospective customers
and it involves all possible events linked with winning and holding customers that are
loyal to the firms. Therefore, understanding and knowing firms’ target customers’
demands, needs and wants are prerequisite before competitors can meet customer
needs and demands through offering of exceptional products, needs and wants and
further offer customer services convenience to retain them.
On the other hand Armstrong and Kotler (2013) simplify marketing as “managing
customer relationships profitably and it does happen when consumers choose to
satisfy their needs and wants in an exchange relationship”. Awan and Hashmi (2014)
describes marketing as a way to inform the consumers regarding the firm, its product
and services offered. However, SME marketers are concerned in keeping and building
customer relationships, aiming at sales generation.
Ebitu, Ufot and Olom (2015) state that marketing simplifies the process of exchange
by giving a diversity of marketing activities that benefit stakeholders and customers. It
encompasses focusing and aligning all the business activities to customers and
stakeholders’ needs. Marketing plays a major role in every business entity; however,
the marketing theories have been developed in line with big firms. The existence and
implementation of marketing in the SMEs is different from the conventional or straight
marketing, while there is no difference between the basic principles applied (Hasan
2011).
43
Awan and Hashmi (2014) assert that marketers in the SMEs consider marketing as
the substitute of advertising or selling. SMEs need marketing in a plan that is well-
matched with their owner and business characteristics and it must be well planned
(Marjanova & Stojanovaski 2012). This can be done through the marketing plan. A
marketing plan is an outlined projection of action that leads an enterprise to set
marketing objectives and formulate adequate plans to accomplish those objectives
(Chaffey & Ellis-Chadwick 2012). Marketing plan lists specific actions needed in the
implementation of the strategy for the product and the setting of specific timelines and
milestones, clear statements of responsibility and the spending pattern for each
activity are outlined (Mullins & Walker 2013).
At an SME level, marketing plan can form part of a business plan or a document that
adds additional information and details regarding the marketing issues for the SME
(Ruzzier, Ruzzier & Hisrich 2013). A marketing plan helps businesses to determine
how to grow and where the business is going, which is significant since one expects
people to flock to the business without any business efforts (Sandlin 2014). The
marketing plan sets clear goals that must be achieved with the marketing activities
planned, presents strategies and tactics that will be implemented to reach these
objectives and identifies key performance indicators that will be used to measure
effectiveness and efficiency (Reic 2017)
The marketing plan is important when authenticating and setting targets and business
objectives while recognising probable competitive issues (Beamish 2012). It is
designed to detail the marketing strategy of the firm’s offering. Its purpose is to
influence all the firm’s stakeholders (suppliers, executives, distributers) to make or
continue their investments and efforts to ensure success (Tanner & Raymond 2012).
To ensure the effective marketing of businesses and their products, firms do situation
analysis before they formulate the marketing strategy; therefore, the next section
discussed the situation analysis.
44
3.3 SITUATION ANALYSIS
As defined by the American Marketing Association (AMA), situation analysis is the
disciplined assortment and study of historical and current information to find
developments and situations with the potential to impact business performance and
the selection of suitable strategies (CTI Reviews 2016). According to Ferrell and
Hartline (2014), situation analysis is one of the common methods that firms use to
collect and analyse marketing information, with the purpose of empowering the owner-
manager with relevant information to adequately make prospective business
decisions. Dann and Dann (2011), alludes to the fact that situation analysis comprises
taking effects apart, whether it is a product (to understand the link between product
features and consumer needs) or customer segments and competitors, with the aim
to assess the firm’s weaknesses and strength against the competitors.
An extensive analysis of the situation in which the firm is operating serves as the base
for discovering opportunities to fulfil the unmet consumer needs and encounter
constraints faced by the business, which is fuelled by economic, technological, political
and sociological factors (Muller, Bezuidenhout & Jooste 2011). Marketers within an
SME must have clear understanding of the actual and potential environment that
business products and services will be marketed in; therefore, the firm ought to
determine its strengths and weaknesses and examine external opportunities and
threats (Lamb, Hair & McDaniel 2012).
Upon grouping the internal strengths and weaknesses, the business owner-manager/
marketers ought to emphasise the business resources, such as marketing skills,
employee competences, technology, production costs and the available finances
(Lamb et al. 2012). The analysis is naturally on-going and subject to alterations as the
firm remains monitoring the internal and external factors affecting the business’s
marketing and operational environment, with the purpose of understanding the
strategic challenges encountered by the firm and opportunities related to these
continuous changes (Gershon 2013)
Reece and Blanchard (2010) state that situation analysis is like a balance sheet as it
gives a snapshot of the firm’s present state since it provides adequate overview that
a marketer, a reader or owner-manager will understand the firm’s offerings and the
45
value it provides to customers. The situation analysis offers the research basis that is
utilised to help in advancing the imminent marketing strategies as well as refining the
existing ones notwithstanding their elements (Gerson 2013). Marketing strategy is
discussed on the next section.
3.4 MARKETING STRATEGY
Kotler and Armstrong (2011) define marketing strategy as the marketing rationality
whereby firms have hopes of creating value, building and accomplishing customer
relationships, which benefit the firm. However, in the process of tactical planning, a
firm must conduct a situation analysis before it can take decisions on any definite
arrangements. Situation analysis encompasses analysing the internal (company) and
external (macro and micro factors outside the organisation) business environments.
The internal environment includes the technology, financial resources and the
competencies and performance of the workforce, which should be examined
thoroughly (Tanner & Raymond 2012). The purpose of doing internal environment
analysis is to find, periodically, the definite strengths and weaknesses of a business
(Havaldar 2010). This encompasses an analysis of all the factors within a firm,
including finance, marketing, R&D, organisational structure, manufacturing and
human resources (Saleem 2010)
Any organisation’s current and proficient growth is dependent on the kind of
environment in which it functions directly or indirectly (Babatunde & Adebisi 2012).
Babatunde and Adebisi (2012) further asserts that an understanding of management
strategy and its efficiency is not as easy as people believe; it needs to observe how
the firm is faced with obstacles and opportunities ahead of it. External environment is
comprised of market (customers, competitors and suppliers) and macro environment
(economic, natural, demographic, technological, government, cultural and social and
public) (Havaldar 2010). When analysing the external environment, the business will
have a clear forecast of developments that affect the business either negatively or
positively (Aswathappa 2010)
According to Lamb et al. (2012), marketing strategy involves all the processes of
choosing and unfolding one or other of the target markets and rising and conserving
a marketing mix that produces a satisfying relationship with targets market.
46
Furthermore, Karimi and Naghibi (2015), define marketing strategy as a process that
makes it easy for the business to channel its available resources in a way that it will
benefit through the increased sales and obtain a competitive advantage in the targeted
market.
Marketing strategy focuses on allocating and coordinating all the marketing activities
and resources to help in achieving the business objective (Mullins & Walker 2013).
Kimani (2014), concur with Mullins and Walker (2013) by stating that the formulation
and selection of marketing strategy contributes positively to achieving business goals
and objectives. When designing a persuasive marketing strategy, marketing
managers must try to answer the most important questions: What is the firm’s target
market and what is the firm’s value proposition (Kotler & Armstrong 2011).
Marketing strategy summaries the way the firm aims to create significance for the
target customers to gain value in return (Kotler & Armstrong 2011). Kotler and
Armstrong (2011) further state that marketing strategy is representing the marketing
sense whereby businesses hopes to build customers worth and accomplish gainful
relationships. Akroush (2012), highlights the components of marketing strategy
consisting of product, price, place and marketing communication strategy. Kotler and
Armstrong (2012) support Akroush (2012) by asserting that marketing strategy
summarises the overall marketing logic whereby firms have the anticipation of the
creation of efficient customer value and commercial relationship and the essentials of
positioning, marketing expenses and the target market.
A comprehensive marketing strategy entails a clear target market and is centred on
the consumer needs (Gershon 2013). Borza and Borza (2014) concur with Akroush
(2012); Kotler and Armstrong (2012) and Gershon (2013), by stating that for
businesses to achieve goals, they must follow the well-known marketing strategies,
which are product, place, price and promotion strategies. The exact product or service
for the target market needs to be established. Distribution channels must be organised
and observed endlessly. Communication must be done on the realities of the
enterprises’ products and services to the target customers using different promotional
mixes and the appropriate pricing structure should be set to elicit customers and
generate more revenue (Abasilim 2015). Kotler and Armstrong (2012) alludes to the
fact that the marketing strategy choices vary due to the business situations, objectives,
47
the stage of their growth, dominance in the market and the environment in which they
operate.
Ogundele, Akingbade, Saka, Elegunde and Aliu (2013) emphasise that SMEs,
predominantly in the developing countries like Nigeria and South Africa, apply
numerous marketing practices, which include sales promotion, relationship marketing
strategy, technology-based marketing strategies, new product development strategy,
direct distribution, segmentation and personal selling.
SMEs do not follow the traditional marketing strategies; they follow and develop their
own distinctive marketing practices. Some SMEs rely on word-of-mouth as their main
marketing communication tool (Awan & Hashmi 2014). Marketing strategies serve as
a vital factor for the sustainability of the business and are intended to satisfy the market
needs and obtain marketing goals. Commonly, big firms develop marketing strategies
as a yearly plan, with strategic plan specifying activities to be attained in the current
year, while in the SMEs, marketing strategies are partially planned (Pawan & Pawan
2013). Kotler and Armstrong (2012) highlight the elements of the marketing mix
strategy (target market, product, pricing, place and marketing communication
strategies), which was discussed next.
3.5 ELEMENTS OF THE MARKETING STRATEGY
A good marketing strategy considers and combine all four elements of the marketing
program and the offering rather than emphasising a single element (Ferrell & Hartline
2014). This section covered the market segmentation, targeting and positioning, target
market, product, pricing, place and marketing communication strategies. However, the
study focused on two elements of the marketing strategy, which are; marketing
communication and product strategies only.
There is a need for the SMEs to undertake appropriate marketing. Oji, Iwu and Hydam
(2017) found that SMEs fail due to lack of appropriate marketing communication
strategies. SMEs face challenges from the ability to adapt to rapidly changing market
demand, technological change, and capacity constraints relating to knowledge,
innovation and creativity, which can be changed through the implementation of product
and marketing communication strategies (Yoshino & Taghizadeh-Hesary 2016).
Marketing communication strategy as an element of the marketing strategy require the
48
SMEs to know how to communicate with customers about their products and services
(Makhitha 2019).
According to Kottler and Keller (2009), the financial success of SMEs often depends
on their marketing communication ability. Ebitu (2016) recommends that the goal of
marketing communication within the SMEs be to increase understanding of marketing
information and influence the acceptance of a business’s products and services.
Makhitha (2019) state that until customers are familiar with the SMEs products and its
existence their products will not be purchased. Pangemanan and Walukov (2018)
recommend that SMEs develop an effective product strategy, marketing networks and
marketing communication strategies.
Ramasobana (2017) articulates that limited researches had been done on the sphere
of the SMEs marketing communication strategies especially in Limpopo. On the other
side Debeila (2018) state that SMEs in some parts of Limpopo are encountering some
product development problems, which shows lack of proper product strategies. The
above information let the researcher to focus on the two elements of the marketing
strategy (product and marketing communication strategies)
3.5.1 Market segmentation, targeting and positioning
Segmentation can be defined as the method of dividing the markets into sets of
possible customers with comparable needs and characteristics and who are most
probable of exhibiting the same purchasing behaviour and respond to the same
marketing strategies (Stokes & Chen 2009; Weinstein 2019). Market segmentation is
the process of separating a market of prospective customers into diverse groups,
according to their various characteristics (Shank & Lyberger 2015). With
segmentation, the business is trying to accurately develop a strong and expressive
understanding of the population sub-groups that share the same characteristics.
Segmentation is mainly supported by the view that it is likely that people classified as
being in a certain segment respond similarly to the set of social marketing interventions
(Dietrich, Kubacki & Rundle-Thiele 2017).
The importance of segmentation is that it can augment value to most mutual
techniques that are frequently, but not continuously, applied as part of social marketing
programs. Its main purpose is to assist in understanding dissimilar people and their
49
needs to tailor products, services and some social programs for the segments (Dietrich
at al. 2017). Therefore, the benefits of segmenting the market is to let the business
categorise key consumer groups and assess their value, which helps the business to
service these key consumers successfully (Freathy & O’Connell 2012).
There are common ways of segmenting the market, according to Martins (2012);
Shank and Lyberger (2015) and Weinstein (2019).
• Demographic segmentation is grouping the markets based on the feasible
customers’ demographic factors such as the household size, race, educational
level, occupation, age and gender (Martins 2012).
• Psychographic segmentation is described as grouping consumers based on the
common lifestyle preference and personality; this allows the business to
understand why customers buy (Shank & Lyberger 2015) (social class, lifestyles,
values and personality).
• Geographic segmentation is a common segmentation strategy whereby the
business serves customers in a certain area, or when the broad target market has
diverse preferences based on their geographic location (Ferrell & Hartline 2008;
Larsen 2010). This can be useful in making broad distinctions among local,
regional, national and international market segments.
• Behavioural segmentation is the act of grouping consumers based on how they
make purchases, how often they purchase and how loyal they are to a particular
product or service (Shank & Lyberger 2015).
• Benefits segmentation is segmentation by separating the market into segments,
whereby marketing managers can gain an improved knowledge about the needs
and wants of customers. This allows the business to modify the marketing
practices more precisely and reliably to the individual customers’ preferences
(Camilleri 2018)
When market segmentation is executed competently, it results in concrete benefits,
with an improved understanding of consumer differences, which improves the match
between the business strengths and consumer needs (Dolnicar, Grun & Leisch 2018).
50
3.5.2 Target Market
Pride, Hughes and Kapoor (2014) define the target market as the group of individuals
or societies, for which a firm cultivates a marketing mix that suits the definite needs
and choices of that specific group. Within the marketing strategy, a thoroughly defined
and chosen target market is the first component (CTI Reviews 2016). Target marketing
helps the business in setting the platform for product development and the design of
a marketing program that can efficiently deliver the product offering to the targeted
customers (Ferrell & Hartline 2014).
An SME must have enough monetary and human capital to fulfil the needs and wants
of chosen target consumers. However, in general SMEs lack some resources and so
it is essential to cautiously consider the segments that can be reached cost effectively
with the limited resources (Ruzzier, Ruzzier & Hisrich 2013).
3.5.2.1 Target Market Strategies
The target market strategies refer to how an enterprise markets its products and
services towards specific target markets being guided by the enterprise’s marketing
objectives, which highlight or define the targeted customers’ purchasing behaviour
(Wah 2017). An SME can make use of the following target marketing strategies:
differentiated, undifferentiated, concentrated and micromarketing (Boone & Kurtz
2015).
• Differentiated marketing strategy
When using a differentiated or segmented marketing strategy, an SME bases its deeds
on two or more carefully chosen segments and for each of the chosen segments
makes a distinctive marketing mix. The SME utilises a differentiated marketing
strategy to realise higher profits and a solid position in each of the target segments
(Ferrell & Hartline 2011; Ruzzier et al. 2013).
• Undifferentiated marketing strategy
This is the marketing approach that considers the market to be one large market
without looking at single segments and makes use of a single marketing mix (Lamb,
Hair & McDaniel 2009). This strategy is followed when the firm chooses to ignore the
51
existence of diversity or differences in the markets and only sells a specific offering to
the whole market with the use of a single marketing mix (Boone & Kurtz 2015). This
strategy put much focus on the average target market expectations and concentrates
its marketing determinations on the fundamentals of target segments’ needs and
conduct rather than deviances (Ray 2015). Lamb et al. (2009) further state that most
of the SMEs make use of the strategy as it does not require a lot of resources to be
employed, as the firm undertakes that individual customers have comparable needs
that can be fulfilled using the same marketing mix.
• Concentrated target marketing strategy
Most SMEs choose to use the concentrated marketing strategy, rather than focusing
on a lesser segment of a larger market. They choose to fill a large share of one niche
with the aim of achieving the utmost dominant market position in an anticipated
segment (Ruzzier et al. 2013). With concentrated marketing strategy, the firm tries to
capture a large share of one or a few smaller market segments of niches
(Schlegelmilch 2016). Concentrated marketing encompasses the firm in separating a
very narrow number of segments upon which it successively focuses its efforts
(Gilligan & Hird 2013).
• Micro marketing
This can be defined as the act of adapting products and marketing programs to match
the tastes of entities and locations (Kotler & Armstrong 2012). It also adjusts the
marketing mix of products to individuals and to exact locations. It comprises both the
individual and local marketing. The Internet makes it easier for marketers to pursue
micro marketing effectively, it can help in tracking the definite demographic and
individual information, then marketers can direct emails to specific consumers most
likely to purchase their products (Ruzzier et al. 2013; Boone & Kurtz 2015).
3.5.3 Positioning
Positioning is the process of packaging the company for a specific market and
determining how to define it relative to the competition in the market (Demkin 2008).
Positioning is more than manipulating the market’s perception about the business, this
is the pure statement of the firm’s real value and its stand in the minds of customers
52
and potential customers (Levinson & Levinson 2011). An effective positioning serves
as an important factor for the business’ long-term success. This helps in fixing the
business entity in the minds of consumers within the target markets (Shank & Lyberger
2015)
Positioning displays the place or the image where current products are placed in the
market by the consumers in comparison to the same products from the competitors
(Karadeniz 2009). Positioning deals with applying the business’s brand to a detailed
market segment. The worth of market position becomes most superficial when a
business pursues an opportunity. Demkin (2008) states that the business’s positioning
is the preliminary stage and involves what customers and potential customers think of
the firm before they can engage with it. This is simply placing the business image first
within the target market’s minds.
Target marketing is basically defining the business’s potential primary customers,
therefore, that market should be quantifiable, large enough and reachable (Ferrell &
Hartline 2008). Targeting involves social marketers using segmentation analysis to
choose the targeted segments and trying to participate in social programs; therefore,
it is essential for these groups to be sufficiently large to be feasible in terms of provision
of resources for investment (Camilleri 2018).
3.5.4 Product Strategy
Makhitha (2016) indicates that decisions about the business marketing strategy for
products to be offered must take note of the specific target markets’ needs and
satisfaction. Cant and van Heerden (2013); Cravens and Piercy (2013) define product
as any tangible or non-tangible objects or services offered by a firm for customers in
exchange for something of value. Product can be anything, either favourable or
unfavourable for customers to satisfy their needs or wants through an exchange
process (Lamb, Hair & McDaniel 2012; Armstrong & Kotler 2013). Product strategy
embraces product mix, product lines, product branding, labelling and packaging and
guaranties and warranties (Kotler & Keller 2014). Product strategy should be a
continuous process that steadily evaluates the existing products, make necessary
product modifications, get rid of unwanted products and introduce new products
(Kotler & Keller 2014).
53
McGuinness and Hutchinson (2013) asserts that a good knowledge of the product
leads to good product strategies, which is very important as it helps the business to
become more prosperous and competitive against the competition. Gomes (2010) in
Cant and Wiid (2015) state that tactical decisions about products within SMEs are
made mainly by the business owners and are commonly centred around the owners
sentiments. Therefore, developing product strategies when making a decision about
which product to sell, is important in every SME as it add to the success factors or
failure of the entity. Ebitu (2016) recommends that SMEs should strategically invest
much on the quality of their product rather than advertising or promoting too much, as
this would improve and sustain the firm’s profitability. Also, SMEs must ensure that
customers are treated as kings, as amiable relations between the business and
customers, consequently, increases their market share. Product includes all features
and attributes that are connected to it and heightens the consumers’ product
experiences (Cant & Wiid 2015).
3.5.4.1 Product Mix
Product mix is a variety of related products that produce more sales income when
promoted collectively than when marketed separately (Lamb et al. 2012).
Theoretically, product mix is supplementary to arise in firm’s production for the
established products to the market (Mayer, Melitz & Ottaviano 2014). Product mix
comprises all the product lines and items the firm sells and every product item in the
product mix may require a diverse marketing strategy. Nevertheless, product lines and
even the entire firm’s product mix share some marketing strategy elements (Lamb et
al. 2011; Kotler, Burton, Deans, Brown & Armstrong 2013).
Product line refers to a collection of products that are meticulously allied, as a result
functioning in an analogous mode, are traded to similar customers, marketed over the
same types of channels, or are within certain price series (Kotler & Armstrong 2011).
According to Ferrell, Niininen and Lukas (2015), a firm can make a product
improvement through product line extension and product modifications.
• Product line extension
This transpires once a firm’s management make a decision to make an addition of
products towards their current product line with the aim of bursting competition (Lamb,
54
Hair & McDaniel 2011). These products are produced mostly like the existing once,
but they are specifically designed to cater somewhat different customer needs (Pride
& Ferrell 2010). The business simply makes an additional product to the product line
with the aim of competing broadly within the industry (Lamb, Hair, McDaniel, Kapoor,
Klaise & Appleby 2010)
• Product modification
This refers to the act of altering one or more features or characteristics of the product
and it differs from product line extension since the original product does not continue
to be on the product line (Pride & Ferrell 2017).
• Product items
Is a specific kind of a product, which can be chosen separately from amongst the firm’s
products (Lamb et al. 2011). Product item symbolises a definite model, brand or size
of a product that a firm offers and is the single product that a specific customer may
buy (Kahn 2011). Therefore, each product item must be packaged in an appealing
way.
3.5.4.2 Branding
The success of any product offering, or business depends largely on the target
customer’s ability to distinguish between products (Lamb et al. 2012). Branding helps
in identifying and differentiating the products or services of one business from the
competing product of other businesses. Branding is important to both businesses and
their consumers because it makes shopping simple, facilitates information
dispensation alarmed with the buying preferences, gives assurance that the
consumer’s purchase was right. It further helps in ensuring quality and fulfils positive
customer needs (Mullins & Walker 2013). Kotler and Armstrong (2012) assert that the
majority of consumers see brand as an essential fragment of the product since it can
augment the actual product. Therefore, it is advisable for SMEs to develop and have
a vibrant brand.
Branding benefits consumers in various ways. It helps consumers recognise products
that might have their expected value. Brands also emphasise the product quality and
dependability. Consumers who always purchase similar brands know that exactly the
55
same benefits, features and quality will be found whenever they buy the product
(Gordon & Wilson 2015). Branding also offers some advantages to the seller. The
brand name develops the base whereby a complete story concerning a product’s
distinctive features can be built upon (Armstrong, Adam, Denize & Kotler 2015).
Mitchell, Hutchinson and Bishop (2012) found that some of the owner/managers within
the SMEs lead and influence branding and drive all the marketing activities in line with
their own knowledge, business styles, personal networks and competencies, which
may influence the business positively. SMEs research about the possible branding
strategies and choose the suitable one (Spence & Essoussi 2010). Reijonen,
Laukkanen, Komppula and Tuominen (2012) assert that the rising enterprises accept
market and brand orientation to a larger magnitude than stable or deteriorating SMEs.
Some research findings pointed that branding has much impact on the firm’s sales
performance (Hsiao & Chen 2013; Agostini, Filippini & Nosella 2015).
Suggestions from the branding literatures advocate that SMEs who develop and make
an implementation of strong branding exertions can gain financial performance
benefits (such as profit margin and sales returns) and non-financial performance
benefits (Hsiao & Chen 2013; Asamoah 2014).
3.5.4.3 Packaging
Packaging includes all actions involved in planning and creating the vessel for a
product. Product package is the first thing that consumers’ see when looking at the
product; therefore, it must the designed in such a way that it pulls consumers attention
and encourages the product choice and purchase (Kotler & Keller 2014). Kotler and
Keller (2012) further state that an excellent packaging serves as a vital part of a
brand’s parity.
The product packaging serves several functions: protecting, simplifying the use of and
promoting the product, as well as providing information about the product and its use
(Lamb, Hair & McDaniel 2017). It can give the product a strong promotional support at
the point of purchase, as many customers may see the package unlike the
advertisement and at a more opportune time (Mullins & Walker 2013). Consumers
today expect products and services to satisfy their needs.
56
According to Ardhianto and Hardjana (2016), some of the SMEs have some limitations
in terms of knowledge and technology for packaging purposes, which leads to some
wrapping or packaging products with simplicity. Chukwuma, Ezenyilimba and Agbara
(2018) state that if packaging is adopted and practiced effectively within the SMEs it
influences their performance and leads to the increase in sales volume or
performance.
According to Adnan, Nafi and Mohamed (2016), it is important for an SME to have a
suitable packaging as all details that are exhibited on it about the products and
manufacturers are acknowledged and will assist the consumers in making proper
purchasing decisions. Chukwuma et al. (2018) recommends that if SMEs are not really
conversant with packaging, they must seek services from professional about customer
reactions towards the displays on the product packaging to boost their performance.
3.5.4.4 New product development and innovation
Loch and Kavadias (2008) define new product development (NPD) as a “set of all
activities starting with the discernment of the market opportunities, product production,
sales and the delivery of the product”. This is backed by Simon (2009), by defining
new product development as the method whereby the company produces new
products with the aim of entering new markets or continuing to serve the current
markets. NPD involves the process of transforming opportunities and technical ideas
into a new product that will serve the current or new markets
According to Rubera and Cornelia (2013), the introduction of new and innovative
products has a positive influence of the firm’s value by increasing the market share.
An effective NPD strategy helps in maintaining the market share to keep the firm’s
growth (Liu, Li & Chang 2014). Fantazy and Salem (2016) concur with Liu et al. (2014)
by stating that NPD serves as the fundamental factor that drives the firm’s success.
Understanding customer needs/requirements during NPD enables the firm or
producer to cultivate products and services that deliver extra worth and creating
solution to the problems encountered by customers (Fantazy & Salem 2016). Taking
the inputs from the customer’s knowledge in product development should empower
57
the producer to produce products and services that offer more value in resolving
customer problems. Using the understanding of customers’ needs through product
configurations in NPD necessitates both customers and suppliers to make a pledge to
the relationship (Svendsen, Haugland, Gronhaug & Hammervoll 2011). Upon the
development of new products, SMEs must strive to produce innovative products that
surpass consumer needs (Al-Askari 2011).
Svendsen et al. (2011) state that customers, suppliers and the business enterprise
must actively work together during the development of new innovative products.
Customer involvement using marketing tools such as marketing survey, interviews,
field research, mass media and other direct communication techniques such as
telephones and emails is an essential foundation of a new product development
(Chang & Tayler 2016). Chang and Tayler (2016) further stresses that customer
involvement will help the business to gain a wealth of insights into the customers’
unique needs and requirements. Involving suppliers in the initial phases of product
development helps in reducing costs, shortening time to market the product and make
improvements on the product qualities (Eisto, Holtta, Mahlamaki, Kollanus, &
Nieminen 2010).
Therefore, the understanding of NPD enables firms to attain quick speed to market,
effective development costs and superior new product quality and makes a fair
contribution towards the firm’s status, long-term profitability and market share (Koski
& Kretschner 2010; Racela 2015). SMEs that follow NPD are more profitable than
those who do not follow it (Tajvidi & Karami 2015).
Kahraman, Kerre and Bozbura (2012) define innovation as the comprehension of an
innovative product, method or service for which a technical solution is essential, where
the results should be assumed as firms’ innovation with a strong influence on the
market. Product innovation is connected to the exploration of changes and innovations
in the product category. It helps the firm to map out changes in the enterprise’s product
and refers to all new developments and improvements in an existing product (Rahman
& Ramos 2012). Amongst SMEs, product innovation is one of the greatest precarious
elements for their existence, competitiveness and growth. Nevertheless, product
innovation in SMEs has remained low, due to several issues and trials (Pyeman,
Rashid, Hanif, Mohamad & Tan 2016)
58
The significance of product innovation is seen when the market expands. Amongst
SMEs, product innovation is one of the serious elements for their subsistence,
progression and competitiveness (Pyeman, Edura, Rashid, Hanif, Jamal, Nasis,
Mohamad & Tan 2014). Though technological and market fluctuations can never be
in an SMEs control, pre-emptive new product development is considered the most
potential basis for competitive advantage (Berchicci 2009). There is a need for the
SME sector to make improvements on how they innovate, reduce costs and timing to
become more competitive (Krause, Schutte & du Preez 2012). Sometimes SMEs are
at a disadvantage because of lack of investment on innovation and NPD to meet the
ever-changing customer needs (Sindakis 2015). The SME’s ability to deliver and
satisfy customer needs is the threshold level to continue business (Zuluaga 2008).
The on-going development and introduction of new innovated product offerings is
considered a substantial strategy for a firm’s sustained success. New innovated
products can improve a firm’s whole performance by fulfilling customer needs more
successfully than current products or competitors’ offerings (Tsiakis 2015). Innovation
can also be realised on the improvement of the current business products. It is
necessary for the firm to market both the new products and the improvement of the
existing products for continuous survival since this has a substantial role in developing
a competitive advantage and can make a significant contribution to a firm’s
progression and success (Tsiakis 2015). It is apparent that within the SME sector,
product innovation is still a problem due to the costs involved and other challenges
(Pyeman et al. 2016).
NPD and innovation involve revising, adding or improving product attributes, which is
discussed on the next section.
3.5.4.5 Product attributes
Product attributes are the identifiable features that consumers look for on the product.
Malasi (2012) asserts that product attributes are all the characteristics that an item
may or may not have. Houseman and Mandel (2015) backs Malasi (2012) by defining
product attributes as all the physiognomies of the product item when it is first sold by
the producer that remain to be the product item’s characteristics, irrespective of the
way it could be resold to the end user.
59
In developing an offering (product or service) businesses must define the benefits
offered to the end-user and those benefits are conveyed by attributes, such as
features, quality, product style and design.
• Product features − serves as the most crucial competitive factor for distinguishing
the firm’s products and services from the competing products and services. A firm
can compete effectively by being the first to produce or introduce the most needed
and valued product features (Malasi 2012). Therefore, knowing the reason behind
consumers choosing a particular product helps marketers realise, which brands
and products consumers prefer. Like product flexibility.
• Product quality – is regarded as the main product positioning factor. Marketers
have an interest in all quality dimensions, since appealing to and retaining
customers means not only giving the quality of the product wanted, but additionally
being supportive to the product quality through technical, quality administration
and giving after-sales service (Jooste 2010). Subsequently, it is constantly
significant to assess quality through the customers’ eyes, as quality has a direct
impression on a product or service performance; hence, it is narrowly associated
with customer value and satisfaction (Petruzzellis & Winer 2016).
• Product style and design – this is an additional technique used towards
enhancing customer preferences. Some firms have a status for unique style and
design (Jooste 2010). Extraordinary styles may snatch attention and produce a
lovely aesthetics product to perform much better in an improved way. An upright
design makes a positive contribution towards a product’s and appearance
(Verweire 2014).
Product attributes lead to customer satisfaction, which can further be met through
offering different but related firms’ products and services as discussed. Product
attributes help in determining the profitable and reasonable price for the product.
Pricing strategy was discussed next.
3.5.5 Price Strategy
Price is what a consumer must offer to get a product or service of equal value (Kotler
& Armstrong 2012; Armstrong & Kotler 2013). Price serves as an essential pillar within
the firm since it influences the revenue of the business. It is furthermore a competitive
60
weapon for all firms (Lamb et al. 2012). Marketers must determine the amount of
money customers are ready to spend before arriving at a final product or service price
(Lamb et al. 2012). Formulation of pricing strategy starts by shaping the pricing
intentions, which will then guide the development of the pricing strategy (Cravens &
Piercy 2013). Price strategy serves as a simple, long-term pricing structure, which
forms the preliminary product price and the intended price movement directions over
the product life cycle (Lamb et al. 2012).
Understanding the impact of pricing on demand is one of the most fundamental
requirements to price a product or service effectively (Boshoff 2014). Determining
suitable pricing strategy for products is not easy because of some market’s
deregulations, strong global competition, knowledgeable buyers, slow market growth
and the opportunity for the firms to strengthen the market position (Cravens & Piercy
2013). Pricing strategies provide a structure within which conclusions can be made
with reliability and with the approval of the firm (Brassington & Pettit 2013). Omar
(2014) assert that the knowledge of marketing strategy, experience in pricing,
competition, product demand and consumer tastes must be considered when pricing.
Fassnacht and Husseini (2013) state that pricing strategy, in most cases, is viewed as
a short-term judgement made on a daily basis, unlike a long-term decision, whereby
price wars and price promotion setups are easy.
According to Mbonyane and Ladzani (2011), pricing poses a thoughtful challenge for
small businesses. SMEs fail to stick to the right price set-ups and without mechanisms
in place to help in adapting to the varying business ultimatum. Beesley (2012) highlight
that SMEs fail because they lack product pricing knowledge and do not know how to
determine prices. Pride, Hughes and Kapoor (2010) asserts that regardless of how
best the product has been designed and featured, it will not benefit the business in
any way if it is priced incorrectly. Therefore, the SME managers are responsible for
any detrimental outcomes arising from the pricing decision and should consider the
evaluation of the main components (qualities, features) when pricing products
(Forman & Hunt 2013).
Pricing decisions are mostly complex and are influenced by several interrelated and
diverse factors that marketers must take into consideration. Some of these factors can
be controlled by the firm and others are out of the business’s control and the marketer
61
but can correspondingly influence any pricing decision (Gbadamosi, Bathgate &
Nwankwo 2013).
Firms must support the internal managerial deliberations with external market forces
and aspects in the process of price set-ups. Internal factors include marketing mix
strategy, costs, organisational considerations and marketing objectives. External
factors include competitors’ charges and offerings, market demands and some other
external factors (Kotler, Burton, Deans, Brown & Armstrong 2013). Price decisions can
be challenging because of several factors that need to be considered, like the
insecurity concerning the responses to prices amongst buyers, competitors and
distribution channel members (Pride, Ferrell, Lukas, Schembri & Niininen 2011).
Rajagopal (2013) backs Pride et al. (2011) by asserting that the standing and the
prospective competition in the markets directed by the firm limits the flexibility of the
pricing decisions. As the market demand comprises a variety of products that
consumers would be keen to buy at various prices at a given time or conditions, they
buy more products at a lower price than they will at the higher prices (Sahaf 2013).
However, consumers also consider an enterprise location before making the
purchase. Place strategy follows.
3.5.6 Place Strategy
Place states where the product or service will be made accessible to the customers
(Brassington & Pettit 2013). Place influences the delivery of the product to the correct
customers with the right channel (Moderandi 2013). Therefore, it is a potential waste
of time and money to try and distribute the product without the knowledge of customer
requirements in terms of the form of distribution channel. Moderandi (2013) ascertain
that to make a decent distribution platform, the business must put much focus upon
the consumer needs. For instance, sometimes SMEs may find that targeted end-users
find it difficult to reach the distribution wholesaler, retailer or even to use the Internet;
hence, these are used as the business distribution channels. This led to business
failure due to the poor distribution program.
Place strategies deals with the availability of products and services at the right position
when needed by customers. Place encompasses all the business undertakings
concerned with storage and transportation of either raw material or complete products,
62
with the goal of maintaining safe delivery of products to the desired destination while
still in a usable condition (Lamb et al. 2012). Therefore, the decision about the place
is important because the firm is making a large, semi-permanent commitment of
resources that can reduce its future flexibility and affect the firm’s profitability and
future growth (Kotler & Armstrong 2012). The firm’s marketing strategy realisation
process lies not specifically on the achievement of specific production objectives and
an accurate communication during the promotion phase, adequately the availability of
products for the convenience of the consumers at the right place is much important
(Szopa & Pekala 2012). Therefore, an appropriate channel of distribution for finished
products is needed.
3.5.6.1 The distribution channel
Hill (2010) defines distribution channel as one or more enterprises participating in the
dissemination of the business’s products and services to consumers. Distribution
strategy is an essential decision for firms to make and ensure that the products will be
in the reach of customers. According to Segetlija, Maseric and Dujak (2011), it is
advisable for the firms to build a good relationship with the clients, suppliers and
middlemen when producing and delivering products or services. Each participant in
the distribution channel becomes another level in the channel and their number
determines the length of the channel. Adequately, Saremi and Zadeh (2014), state
that distribution channels’ progress and significance have increased in the current
years, therefore, having an efficient distribution channel can be regarded as a good
advantage for manufacturing SMEs, as the manufactured products will reach the
relevant target effectively.
As alluded by Voortman and Makhitha (2014) over the SMEs growth it is important to
recognise new market opportunities and advance the distribution channels to enable
the small businesses to service its markets with the required products and services.
Most producers sell straight to consumers, not passing through intermediaries like
brokers, retailers or wholesalers who participate in moving products from the
manufacturer to the businesses and/ end-users (Scribe 2010).
Distribution channels are used by marketers to exhibit, sell, or supply the end products
to the consumers. These channels might be classified into direct or indirect distribution
channels.
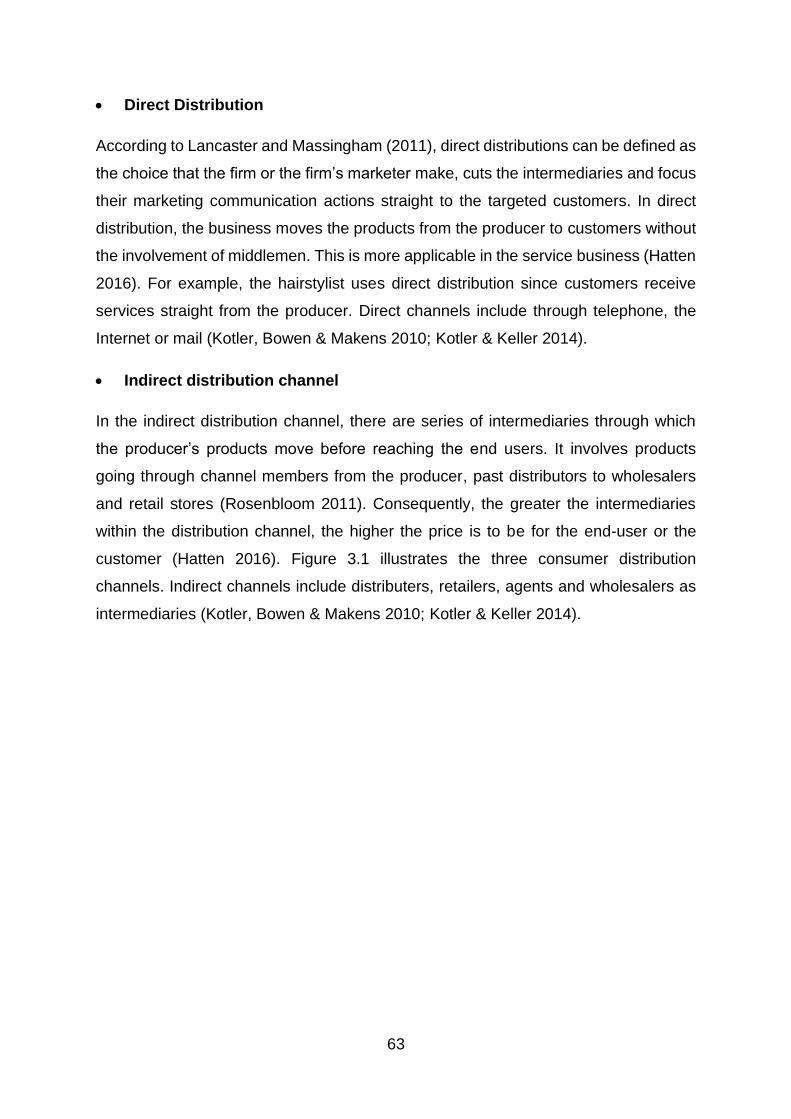
63
• Direct Distribution
According to Lancaster and Massingham (2011), direct distributions can be defined as
the choice that the firm or the firm’s marketer make, cuts the intermediaries and focus
their marketing communication actions straight to the targeted customers. In direct
distribution, the business moves the products from the producer to customers without
the involvement of middlemen. This is more applicable in the service business (Hatten
2016). For example, the hairstylist uses direct distribution since customers receive
services straight from the producer. Direct channels include through telephone, the
Internet or mail (Kotler, Bowen & Makens 2010; Kotler & Keller 2014).
• Indirect distribution channel
In the indirect distribution channel, there are series of intermediaries through which
the producer’s products move before reaching the end users. It involves products
going through channel members from the producer, past distributors to wholesalers
and retail stores (Rosenbloom 2011). Consequently, the greater the intermediaries
within the distribution channel, the higher the price is to be for the end-user or the
customer (Hatten 2016). Figure 3.1 illustrates the three consumer distribution
channels. Indirect channels include distributers, retailers, agents and wholesalers as
intermediaries (Kotler, Bowen & Makens 2010; Kotler & Keller 2014).
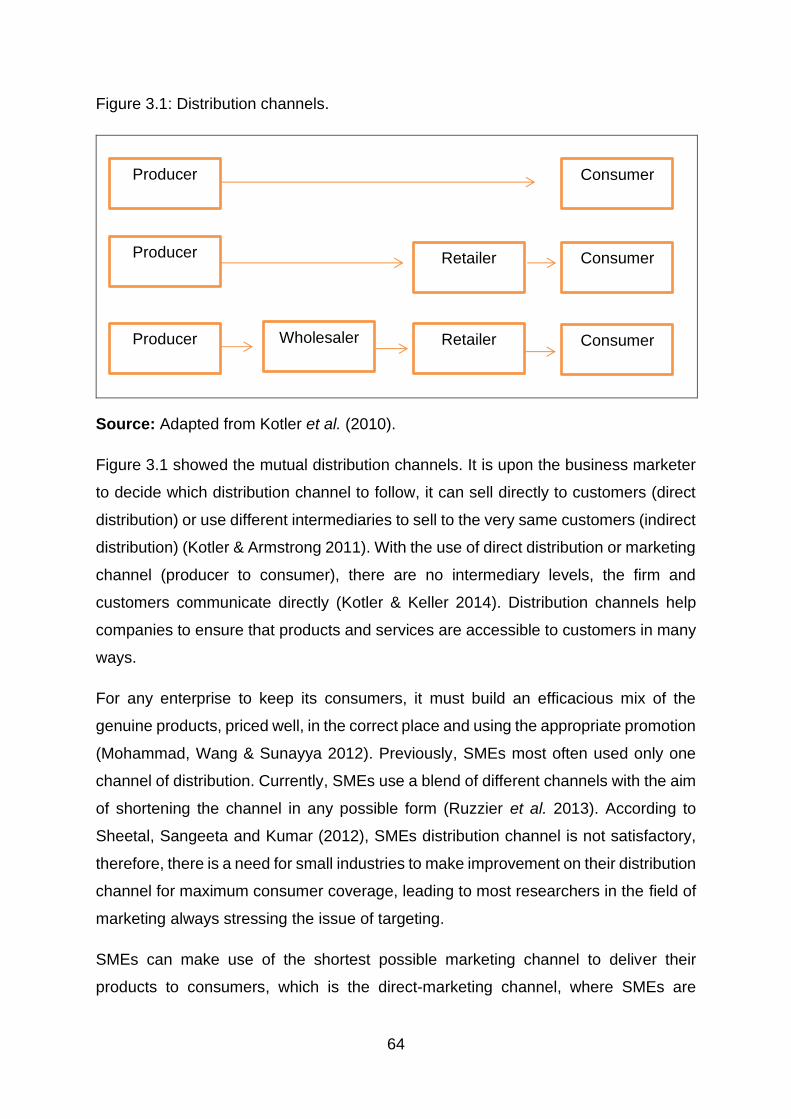
64
Figure 3.1: Distribution channels.
Source: Adapted from Kotler et al. (2010).
Figure 3.1 showed the mutual distribution channels. It is upon the business marketer
to decide which distribution channel to follow, it can sell directly to customers (direct
distribution) or use different intermediaries to sell to the very same customers (indirect
distribution) (Kotler & Armstrong 2011). With the use of direct distribution or marketing
channel (producer to consumer), there are no intermediary levels, the firm and
customers communicate directly (Kotler & Keller 2014). Distribution channels help
companies to ensure that products and services are accessible to customers in many
ways.
For any enterprise to keep its consumers, it must build an efficacious mix of the
genuine products, priced well, in the correct place and using the appropriate promotion
(Mohammad, Wang & Sunayya 2012). Previously, SMEs most often used only one
channel of distribution. Currently, SMEs use a blend of different channels with the aim
of shortening the channel in any possible form (Ruzzier et al. 2013). According to
Sheetal, Sangeeta and Kumar (2012), SMEs distribution channel is not satisfactory,
therefore, there is a need for small industries to make improvement on their distribution
channel for maximum consumer coverage, leading to most researchers in the field of
marketing always stressing the issue of targeting.
SMEs can make use of the shortest possible marketing channel to deliver their
products to consumers, which is the direct-marketing channel, where SMEs are
Producer
Producer
Producer
Consumer
Consumer Retailer
Retailer Consumer
Wholesaler
65
directly linked with the consumers, which will then affect their marketing
communication strategy (Ruzzier et al. 2013). Marketing communication strategy was
discussed below.
3.5.7 Marketing Communication Strategy
Marketing communication involves all the methods used in building communication
opportunities and conveying messages to and getting responses from consumers, with
the aim of creating the preferred reactions from the target audience (Kanibira,
Saydanb & Nartc 2014). It is the business marketer’s responsibility to ensure that
marketing communication informs, reminds and persuades prospective customers of
a product or service offering to provoke a response (Lamb et al. 2012). Cravens and
Piercy (2013) state that the purpose of marketing communication within the firm’s
marketing is to reach management’s anticipated communication goals with every
targeted audience.
The marketing communication strategy is the plan for the ultimate usage of all the
promotional mix elements (Lamb et al. 2012). The marketing communication strategy
conveys equally satisfying exchanges with the target markets by persuading,
educating, informing and reminding them about the benefits of the firm or products
and services. All elements of marketing communications are co-ordinated and
managed to assist in building a promotional composite (Lamb et al. 2012).
Odunlami and Emmanuel (2014) assert that every business must have a favourable
and available medium that makes it easy for the enterprise’s products and services to
be well known by the target market. Lamb et al. (2012) state that a well-planned
marketing communication strategy will grow the sales of the business or different
products or services. The design of promotion strategies is guided by the market the
firm is targeting and it’s positioning.
Performance will be enhanced if there is mutual understanding about the objectives
the promotional tools must achieve. Every business sets marketing communication
objectives. Setting marketing communications objectives is imperative because they
act as a means of weighing how best to build continuing dialogues with consumers to
save the brand and sustain competitive advantage; they also offer a check on the use
of marketing resources in the communication process (Dahlen, Lange & Smith 2010).
66
As Yeshin (2012) states that “the fundamental imperative is the need for an
identification of clear, brief and assessable communication objectives that will allow
the selection of the suitable communications tools to realise the tasks set”. Some of
the business marketing communication objectives include increasing general
awareness levels, attracting new customers and increasing the usage of the product
and services by the existing customers.
3.5.7.1 Purpose of marketing communication
The purpose of marketing communication strategy is to help in managing the firm’s
communication initiatives, coordinating and integrating all marketing communication
elements to communicate with consumers and others who influence purchasing
(Cravens & Piercy 2013). Egan (2011) asserts that when the enterprise’s offerings
entice customers, customers will form a relationship with an enterprise and are more
likely to remain and increase their purchases. This helps in increasing the overall
visibility of the business and enhance its reputation. Marketing communications is just
part of the marketing mix, with the role of communicating information of various kinds
about the business and its products and services to a target audience (Hughes & Fill
2006). However, it is not as easy as this might suggest; its role may differ based on
the situations and the actual task at hand.
3.5.7.2 Steps in designing a marketing communication strategy
According to Cravens and Piercy (2013), numerous steps are involved in designing a
firm’s marketing communication strategy:
(1) Setting communication objectives – help in determining how the components of the
marketing communication strategy are used in the marketing program; pure set
objectives will help in ensuring that every effort made is channelled in a specific field
(2) Deciding the roles each of the components perform in the promotion component –
it is essential to set guidelines as to the projected contribution for every component of
the promotion. It helps in determining the strategy for each promotion component.
(3) Estimating the promotional budget – the business promotional budget is likely to
highlight cultivating the effectiveness of promotion unlike looking for the optimal size
of the budget. Promotional budget in some businesses may consist of only the
67
projected advertising and sales promotion costs; the marketer must ensure that every
cent spent on marketing communication helps to realise the marketing communication
objectives. It is thus needed for the marketing manager to find out which marketing
communication methods worked well in a certain year and which methods worked for
which products (Gerber 2009). This will help in ensuring that the money in the budget
is spent as effectively as possible.
(4) Selection of the strategies for each promotion element – it is essential for these
strategies to be consistent with target market strategy and contribute to the preferred
brand positioning. To determine strategies for each promotion element, one needs to
consider the previous events.
(5) Integrating and executing the promotional components strategies – developing and
implementing integrated communications strategies are essential for manufacturers
as well as SMEs and for both consumer and business products.
(6) Assessing the usefulness of the integrated promotion strategies – it is important
that every method to be used is thoroughly assessed to check if it is suitable for the
intended use.
The elements of marketing communication are public relations, direct marketing,
advertising, sales promotion, personal selling, packaging and sponsorship (Cravens
& Piercy 2013; Polyorat 2014).
3.5.8 Elements of the marketing communication strategy
3.5.8.1 Public relations
Public relations is defined as the act of managing information distribution between an
organisation and the public (Ale 2016). It helps the organisations to successfully
network and communicate with their public and manage the relationships (Black
2011). It is a prearranged and continued determination to create and sustain a
common understanding between an enterprise and its societies (Muchilwa, Otieno,
Oginda & Oima 2014). Many SMEs do not know how to plan and implement a public
relations strategy to generate consistent publicity (Kallier 2017).
68
3.5.8.2 Direct marketing
Direct marketing comprises several communication channels that assist businesses
to make direct communication with consumers. It gives marketers the opportunity to
gain direct access to buyers using telemarketing, digital marketing, electronic
shopping, SMS and others (Cravens et al. 2013).
• Telemarketing – mobile phones have changed the method in which individuals
receive or access valuable information (Gopaul & Bothma 2015). Telemarketing
is a form of direct marketing, you can buy a very specific list and hire inexpensive
telemarketers, even students, to sell your products or services over the phone
(Gibson 2011). Telemarketing is not an appropriate tool for SMEs since it involves
too much money. Telemarketing is one of the methods in direct marketing whereby
it involves a salesperson soliciting potential customers or other businesses to
purchase products or services offered (Siddiqui 2015). The salesperson directly
contacts the consumers to check if they would be attracted to purchasing the
business’s products and facilitates all the purchasing processes over the phone
(Cant 2016).
• Digital marketing - refers to the new marketing approach, which is advanced by
digital elements, with dynamics and features, which must be comprehended to
enable the SMEs to choose effective marketing strategies (Liu, Karahanna &
Watson 2011). Sawicki (2016) define digital marketing as the heavy use of digital
technologies to achieve business goals, through high levels of consumer needs
fulfilment, businesses create channels to influence prospective recipients. Due to
advanced digital technologies, brands can reach consumers with its products.
Digital marketing involves the promotion of business products and brands using
either one or other supplementary digital formats (Jarvinen, Tollinen, Karjaluoto &
Jayawardhena 2012).
Digital marketing offers SMEs opportunities to draw new customers and reach
current customers more proficiently (Deiss & Henneberry 2016). Digital marketing
brings some substantial opportunities to SMEs such as attaining the novel target
audience, growing performance and productivity and refining growth (Shideler &
Badasyan 2012). The marketing realities of SMEs is far from that of large firms;
digitisation remains a bigger problem due to lack of resources like finance. Heini
69
& Heikki (2015) state that most of the SMEs seem not focused in using digital
channels to the potential capability. It should be apparent that the use of digital
channels is significant for business brands, therefore, SMEs should adopt it if they
want to grow, be relevant and competitive. Galloway (2007) claim that “the starting
of digital world has brought more chances of survival for SMEs and opportunities
such as improvement in performance, improvement in competitive advantages,
efficiency and reaching new target audiences”.
Digital marketing, grounded on technologies, must put efforts on standards,
returns and opportunities presented. According to Wind and Mahajan (2002) and
Nair (2016), everyone dealing with marketing operations its essential to
understand and realise the digital realities and concentrate on new philosophies
of market contact, therefore, growing their segment and becoming effective in the
untidy changing environment. Digital marketing makes use of all digital medias,
including the Internet, mobile and communicating channels to advance
communication and exchanges with customers (Pride & Ferrell 2017).
• Mobile marketing - According to Dzisi and Ofosu (2014), SMEs should not rely
only on the word-of-mouth but embrace extra current technological marketing tools
such as mobile marketing to reach potential customers, establish their brands and
improve their performance. Mobile marketing can be defined as the established
practices that improve an enterprise’s engagement and communication with their
audience in a way that is cooperative and relevant, using mobile devices and/or
networks (Karthikeyan & Balamurugan 2012).
Karthikeyan and Balamurugan (2012) further emphasise the convenience of
mobile marketing in sending promotional messages to individual customers that
gave it immense popularity in the business world working to the SMEs advantage
as it is affordable. Mobile advertising offers potential for customisation, since
portable devices typically hold the user’s given identity and it can use time, action
and location awareness as customisation variables (Pousttchi & Wiedemann
2010). Pousttchi and Wiedemann (2010) further alludes that the feature of
customisation turns mobile advertising into a significant mobile commerce
application, as it consents the use of demographic information gathered by
network service providers and information on the recent location.
70
• Social media can be defined as digital and Internet tools that have less to do with
normal media; it offers a device for the audience to connect, talk and network with
others (Al-Deen & Hendricks 2012). The term social media/social network is used
for the Internet-based applications that form on the conceptual and scientific
grounds of Web 2.0 this let the formation of user created content (Benson 2014).
Social media can be used by an enterprise as an effective tool to involve users
with the aim of making profit (Meiselwitz 2016).
Marketers can use social media to listen and advance insight about what is being
said about products and services and interact with the potential and current
customers (Calitz & Cullen 2012). Social media is a communication system that
helps to advance brand recognition, increase awareness and reach customers
effectively (Bullock & Deragon 2009). Social media appears to be an effective tool
for customer engagement, brand building and building an exclusive relationship
with customers. Rishika, Kumar, Janakiraman and Bezawada (2013) articulates
that the use of social media can induce sales-related results; customers who are
steadfast through social media to the business are lucrative than those who are
not loyal to the products or brands on social media.
SMEs take time to adapt social media because of their adverse views about their
effectiveness (Meiselwitz 2014). Therefore, it is important to choose social media
or networking that can be easily aligned to the business objectives without
misusing the social network in reaching small customers (Jantsch 2011). The
successful application of social media depends on the full participation of the
business or the marketing strategy. Mangold and Faulds (2009) contends that
social media should be comprised within the marketing mix when developing and
implementing the communication strategy. Businesses are gradually using social
media sites to market products and services and engage in social marketing
campaigns. Spenner and Freeman (2012) points that the benefits of social media
practices in SMEs are that it gives consumers information about the good deals,
products and services, which is what consumers are looking for.
According to Rufai (2014), SMEs functioning in the African markets have
enormous opportunities to reduce their expenditures, raise their production and
generation of enough revenue by leveraging on the business transformational
71
capabilities of communication technologies. Communication technologies (Twitter,
Facebook, Instagram, WhatsApp) have made a huge contribution to the evolution
and improvement of SMEs by dropping transactional costs, improving employee’s
productivity, reducing the communication costs between SMEs and customers,
humanising corporate communication, helping the SMEs acquire more work
knowledge, extended markets and have improved relationships with suppliers
(Paul 2012). Therefore, the acceptance of technology in marketing strategies can
be put into the SMEs improvement plans and that marketing strategy is a genuine
instrument for viable SMEs development (Ardjouman & Asma 2015).
Social media serves as an essential part of the business’s marketing
communication and branding, like Facebook, which has become a crucial channel
that businesses use to engage consumers and create brand awareness (Bruhn,
Schoenmueller & Schafer 2012)
3.5.8.3 Advertising
Advertising refers to the paid, facilitated form of communication by an enterprise or an
identifiable source with the aim of persuading the receiver (consumer) to react towards
the advertised product or service at that moment or in future. According to Hollensen
(2010), advertising is regarded as the greatest dominant form of communication and
perhaps the one that has the utmost impact over our daily lives, it does not matter
where one is, it is probable that we are surrounded by magazines, newspapers, radios,
banners or even billboards advertising regularly.
Advertising puts much focus on creating awareness and delivers information
concerning the existence of the business products, its accessibility and prices
(Adesoga 2016). According to de Mooij (2010), the enterprise uses advertising to
attach the significance of brands and these significances are taken in the light of the
targeted audience’s motivations and ambitions. Most businesses use advertising in
promoting products and services, but it also serves as a source for creating a long-
term business perspective. It is possible that there have been numerous
advertisements that stick in consumers’ minds, which have impacted them and created
a certain perception in their minds (Hughes & Fill 2006).
72
Advertising is viewed as the most noticeable form of marketing communication. Some
of the objectives of advertising are to persuade consumers to make a positive buying
decision in favour of the business, making the business products and services known
and increasing the product demands (Hollensen 2010). Advertising is one of the most
powerful forms of marketing communications and the one that possibly has the most
effect on our daily lives. It does not matter where we go throughout the day, it is
possible that we see either by billboard, radio, magazine, cinema, newspaper, TV or
banner advertising regularly (Hughes 2006). This can also build a long-term business
image.
Advertising plays a valuable part in the promotion of brand promises and backs a
product or service with visible worth, but it is the sales personnel who carry the promise
and boost the need for internal branding (Ncube 2016). Advertising can be informative
and influential; using both the mass and new medias to convince consumers to buy
products and services and it may also be besieged at promoting an existing or new
product (Terkan 2014). Advertising has progressively become common as more
individuals and businesses go for as an element to make their products and services
well known by consumers, there are some pop ups advertisements that just appear
on different websites and can also be executed in all kinds of uncommon areas
(Trehan & Trehan 2010).
This is a low-cost method of transmitting the selling message to potential customers;
it can pave a way for the salesmen by persuading audiences to request information
and identify businesses selling the products (Adesago 2016). Advertising, if done by
the manufacturers, can force retailers to buy products to meet consumer demands.
Advertising acts as a means to fight competition; businesses use innovative and
interesting advertisements to lure consumers to continue to be loyal or switch from
competing brands and capture consumer attention (Dominick 2013). For any
advertisement to be effective and creative, it must comprise a unique selling
proposition. The graphic features serve a purpose and entail several components that
are joined in precise setups to create a brand message that will appeal to the audience
(Dominick 2013).
73
Advertising creates positive brand awareness for the SMEs, it is a clear method of
generating a large customer base and it boasts their sales volume (Gitau 2012).
Advertising is used in persuading customers to make a purchase decision and
familiarising customers with products. Habib, Hossain and Oma (2015) recommend
that SMEs should use advertising as it influences consumer attitude, opinion about the
business and attitude, which will result in changing consumers purchasing behaviour.
Habib et al. (2015) further state that advertising helps in changing the product image
in the consumer’s mind.
3.5.8.4 Sales promotion
Sales promotion plays a key role in retaining current consumers and drawing new
ones. Kotler, Bowen and Makens (2010) define sales promotion as a varied collection
of enticement tools, frequently short-term, intended to stimulate more and quicker
consumer purchases for the enterprise’s products and services. Singh & Gupta (2014)
supports Kotler et. al. (2010) by alluding to the fact that it comprises all those activities
(excluding: personal selling, advertising and publicity), which encourage the market
demand for the products over some short-range stimuli, which are non-recurring in
nature and temporary and through referrals of satisfied customers.
Sales promotion is primarily considered for short-term practice and there are a variety
of promotional incentives that are intended for consumers such as prices, coupons,
bonus packs, premiums, warrantees, free trials, free goods and samples. Incentive
elements are planned to meet explicit customer anticipation or reinforce current
customer relationships (Kottler et al. 2009), while others might include rebates, price-
offs, loyalty programmes and contests (Belch & Belch 2007).
Sometimes sales promotions are misinterpreted as advertising, as many times they
use advertising to make promotional offer awareness. Arens, Weigold and Arens
(2011) state that sales promotion is usually known for providing consumers with
rewards for showing certain behaviours, it focuses on provoking an immediate target
market response by presenting price incentives to either distribution channel members
or final consumers. Marketers are responsible for selecting the most suitable sales
promotions technique that suit a certain market segment or, sometimes to choose the
suitable sales promotion techniques to successfully boost the anticipated results on
consumer buying behaviour (Marais, de Klerk & Bevan-Dye 2014). Although various
74
sales promotion techniques focus on a similar primary objective of growing business
sales by encouraging buying, each technique is different and is established to
accomplish explicit objectives, such as to encourage continuous buying, stimulating
the continuous use of the brand and encouraging customers to switch from other
brands (Belch & Belch 2012).
The most frequently used sales promotion activities within the SMEs include refunds,
contests, rebates, quantity deals, packaged premiums, discounts, gifts and samples.
The main aim of sales promotion for the SME is to increase the sales volume. Sales
promotion for SMEs involves making cognisance of the firm, its products and services
while giving customers reasons to make a purchase (Ruzzier et al. 2013).
Sales promotions are among the most effective methods for persuading consumer
purchasing behaviour and influencing consumers to buy a certain product or brand,
which ultimately advances awareness where there is brand dominance and
competition, leading to customer retention (Kotler et al. 2009; Ouwersloot & Duncan
2008).
3.5.8.5 Personal Selling
Personal selling is a process whereby the sales consultants communicate directly with
the prospective buyer in which the two share their offering experiences or needs and
the salesperson tries to meet the prospective customers needs through a definite
product offering available for purchase (van Heerden & Drotsky 2011). Armstrong and
Kotler (2013) define personal selling as the presentation of products and services to
the prospective buyer, which persuades them to make the purchase.
It involves personal interaction and physical confirmation of the product. SMEs make
little use of personal selling because it is expensive and requires too much time
however, this is suitable for well established businesses (Hiduke & Ryan 2014). Some
concerns have been raised about the relevance of personal selling however, many
complex and high value products still need a salesperson, therefor personal selling it
is still an essential promotional method that continue to promote products and increase
business sales (Adesoga 2016). Unlike other elements, personal selling allows the
message adjustments according to the customers, control over audience and gain the
insight about consumer behaviour and the market trends.
75
Personal selling can be expressed through personal exhibition of products and ideas
to the customer, in which the seller is persuading and helping the consumer to make
the purchasing decision (Todorova 2015). Personal selling is amongst the first
methods of promotion, which defines the method whereby the sales representatives
ascertain and stimulate consumer needs or wants (Adesoga 2016). With personal
selling salesmen are used to communicate the value of the services to clients thus
growing customer’s level of satisfaction and ensuring that customers get the right
quality of services needed while also improving information to suit customer needs
(Olumoko, Abass & Dansu 2012).
3.5.8.6 Sponsorship
Sponsorship is about the contribution outside of an individual or a firm’s usual kind of
activities, with the objectives of making the public aware of the firm or organisation,
developing the bonds and altering the consumer’s perception about a brand or firm
(Egan 2015). With sponsorship, the enterprise is spending some money to support a
cause or an event that is constant with the business goals, such as cultivating brand
cognisance or improving a company image (Fortunato 2013; Cornewell 2014).
According to Plewa and Conduit (2016), SMEs do sponsorship and are seen in a
positive light and there is no much difference amongst the larger organisations and
SMEs sponsorship.
Kolabi, Hosseini, Mehrabi and Salamzedah (2011) state that SMEs rely on the
interactive methods like word of mouth marketing to thoroughly communicate the firm’s
product and services message and develop customer referrals. Word of mouth in small
businesses is still taking a lead as a marketing tool that is relied upon, for gaining
customers (Karimi & Naghibi 2015).
3.6 THE IMPACT OF MARKETING STRATEGIES ON BUSINESS PERFORMANCE
The right marketing strategies embrace not only creating an increasing market share
but discovering an improved way to meet consumers’ needs and desires. Marketing
strategy is one of the significant efficient strategies that SMEs implement to boost
performance (Dzisi & Ofosu 2014). Businesses, including SMEs, have become aware
of the necessity to establish approaches that will assist them to advance their
understanding of the market, customers and competitors (Dzisi & Ofosu 2014). As
76
highlighted by Karthikeyan and Dharmaraj (2015) a single strategy may not directly
have an impact on the overall business performance, but a combination of strategies
has a great impact on business performance.
The greatest needs of SME managers are to have a perfect understanding of and to
cultivate marketing strategies for their product and service offerings. SMEs’ success
is centred on the capability to build a rising body of contented and loyal customers
(Van Scheers 2011). Kotler and Armstrong (2011) state that marketing seeks to appeal
to new customers by making promises of great values and retaining current customers
through satisfaction. Today, SMEs are characterised by high competition, therefore,
there is a need to have some steadfast strategies in order to survive. With an
appropriate strategy, SMEs can enhance their performance to gain an increase of
market share (Dewi 2016). Molly (2013) recommends that businesses build a worthy
and solid customer base and establish contacts with relevant stakeholders to help the
business to grow; however, when assessing the business performance, there is a
need for the business to make some quantifiable measures by finding aspects that
need some enhancements.
Performance measurement is the process whereby the target and value the business
generates from their stakeholders is measured against how well the business is
managed (Illmer 2011). Ringim (2012) states that performance measurement enables
the business to focus on the elements that need some enhancements by assessing
the evolution of work through quality, cost and time and making consolidations on
areas with high level of outputs. Continuous performance is any business’s objective
because only through performance, it enables businesses growth and progress
(Gavrea 2011).
David, Neeraj, Derek, John, Michael, Ruba and Julio (2013) found that there is a
substantial connection between the SMEs marketing strategies and performance in
case of broader customer relations, income growth and employment opportunities and
enhanced proficiency. Marketing strategy if cautiously adjusted to the local market,
has the power to meet with customer needs and subsequently improve the business
performance (Zeriti, Robson, Spyropoulou & Leonidou 2014). Dzisi and Ofosu (2014)
states that marketing strategies that are applied by SMEs have great impact on their
performance in terms of brand cognisance, market share and success. A good
77
marketing strategy supports sales and expansion and makes a significant contribution
to the businesses’ market share growth (Marjanova et al. 2012).
3.7 FORMULATING HYPOTHESES
A research hypotheses is the statement that researchers create when they venture
unto the results of an experiment and a well worked-out hypotheses represents half
the answer of the formulated research question (Mourougan & Sethuraman 2017). A
good hypotheses also indicates the researcher’s knowledge in the field undertaken in
the study. With this study, the researcher focused on identifying the factors that
influence the formulation of marketing strategies for SMEs in Polokwane.
3.7.1 Demographic factors and marketing strategies (product strategies and
marketing communication strategies)
Yan and Chew (2011) assert that the development of marketing strategies within
SMEs is narrow and often relies on the small business traditional marketing model,
which is influenced by marketing knowledge, training and funds. The SMEs marketing
strategy aims to position business resources and abilities to contest in the market. It
is reported that resources within the SMEs are an essential part in implementing the
marketing strategies, hence SMEs do not have enough resources (Ardjouman & Asma
2015). Marketing strategy offers the avenue for using the business resources
proficiently to attain its set goals and objectives (Adewale et al. 2013).
Hypotheses 1
H1 Marketing strategies (product strategies and marketing communication
strategies) of SMEs differ across demographics (business operation, training and
annual turnover).
H0 Marketing strategies (product strategies and marketing communication
strategies) of SMEs do not differ across demographics (business operation, training
and annual turnover).
Sub-hypotheses were formulated for each demographic factor.
H1a Marketing strategies (product strategies and marketing communication
strategies) of SMEs differ across the business operation of SMEs.
78
H1b Marketing strategies (product strategies and marketing communication
strategies) of SMEs differ across the training attended by SMEs
H1c Marketing strategies (product strategies and marketing communication
strategies) of SMEs differ across the business turnover of SMEs
3.7.2 Demographic and factors influencing marketing strategies (product
strategies and marketing communication strategies)
Ardjouman and Asma (2015) assert that while big businesses can swiftly move from
one business to the next, SME businesses are limited or stagnant as a result of
inadequate resources, which limit the strategies from being effectively implemented.
The availability of suitable financial resources is significant for business development
(Tustin 2003). Business managers who have acquired relevant skills and training are
likely to able to get the market for business products, scan the environment and
produce products that can stand in the market and compete (Czinkota & Ronkainen
2003). Abilities and capacities of management within an SME are factors connected
to the success of the business as they give the entrepreneur the aptitude to perform
successfully and the authority to act excellently in a specific range of possible future
context (Ibrahim & Soufani 2002). Leitao and Franco (2011) found that the marketing
strategies and performance of SMEs are influenced by the high levels of SME owner’s
education and training, SME owners that have received training are likely get and
develop skills to sustain the business.
The study conducted by Sharmilee and Muhammad (2016) discovers that more than
half of the respondents regarded managerial training and lack of competency as a
factor that affects the implementation of marketing strategies and performance of the
business. This finding is supported by the study of Martin and Staines (2008) which
found that managerial training and competencies certainly affect the implementation
of strategies within the SMEs.
This leads to the second hypothesis.
H2 Factors influencing marketing strategies (product strategies and marketing
communication strategies) differ across the demographics of SMEs (business
operation, training, annual turnover).
79
H0 Factors influencing marketing strategies (product strategies and marketing
communication strategies) do not differ across the demographics of SMEs (business
operation, training, annual turnover).
Sub-hypotheses were formulated for each demographic factor:
H2a Factors influencing marketing strategies (product strategies and marketing
communication strategies) differ across the business operation experience of SMEs.
H2b Factors influencing marketing strategies (product strategies and marketing
communication strategies) differ across the training attended by SMEs.
H2c Factors influencing marketing strategies (product strategies and marketing
communication strategies) differ across the business turnover of SMEs.
3.7.3 The impact of marketing strategies (product strategies and marketing
communication strategies) on performance of SMEs
Owomoyela et al. (2013) view marketing strategy as way of providing quality products
that satisfies customer needs, offering reasonable prices and engaging in extensive
distribution and backed with effective promotional strategy. With reference to the study
conducted by Adewale et al. (2013) found that marketing strategies were expressively
independent and positively influenced the business performance.
Marketing communication, as part of the marketing strategies, has a positive impact
on business performance, which is also triggered by the effects of brand knowledge
and brand awareness (Buil, de Chernatony & Martinez 2013). Chandy and Zia (2014)
found that marketing communication strategies positively impact on the business’s
overall performance. Some studies discovered that product consideration has an
influence on business performance in terms of expansion, market share, profitability
and so on. Product performance is based on the most important single new product
that is considered in terms of sales turnover and thus contribute to the long-term profit
performance (Strydom 2011).
Hypotheses 3
H3 Marketing strategies (product strategies and marketing communication
strategies) have an impact on the performances of SMEs.
80
H0 The marketing strategies (product strategies and marketing communication
strategies) of SMEs do not have an impact on the performance of SMEs.
Sub-hypotheses were formulated for each demographic factor:
H3a. Marketing communication strategies have an impact on the performance of SMEs
H3b Product strategies have an impact on the performance of SMEs.
3.8 CONCLUSION
The focus of this chapter was to discuss the marketing strategies of the SMEs and
how they affect the SMEs performance. Elements of the marketing strategy (market
segmentation, targeting, positioning, target market, product, pricing, place and
marketing communication strategies) were outlined, which has indicated its
importance and the application within the SMEs. The reviewed literature showed that
SMEs do not use marketing strategies very effectively or somehow marketing
strategies are not used at all. It was assumed that marketing strategy was something
that can mainly be applied by big companies while others believe that marketing needs
some special skills, and this has some impact on the overall performance of the SME.
The next chapter discusses the research methodology adopted in this study.
81
CHAPTER 4: RESEARCH METHODOLOGY
4.1 INTRODUCTION
The purpose of this chapter was to outline the framework of research methods that
were used for the research. The sampling plan and the methods used to analyse the
collected data were discussed, describing the research design chosen for the purpose
of this research and the reason behind the choice of the research design. Also, the
instrument used for data collection was described. Lastly, the ethical considerations
that were followed during the research process were deliberated.
4.2 RESEARCH METHODOLOGY
Welman, Kruger and Mitchel (2013) define research methodology as the practice for
considering and clearing up the sense about the research methods and procedures to
discover a phenomenon. Research methodology is further defined by Babbie and
Mouton (2006) as methods, techniques and procedures applied when executing the
research design as well as the fundamental ideologies and assumptions that
emphasise their use.
4.2.1 Research paradigm
This study adopted the post-positivist approach in understanding how the adoption of
marketing strategies impact on the performance and business outcomes of SMEs. The
literature has identified different research paradigms that guide studies in the field of
business studies. These range from positivist, post-positivist, phenomenology,
interpretivist to activist. Research paradigm is the philosophical outlook of the
researcher, which shapes the way the researcher sees reality, known as ontology and
how he seeks knowledge, which is known as epistemology.
Mack (2010) in distinguishing between ontology and epistemology, notes that ontology
may be simply regarded as the way an individual sees reality and epistemology as the
way we acquire knowledge. Ontology may thus suggest identifying the reality as one
sees it in existence. Ontologist study the meaning when one says something is real,
then an epistemologist studies the meaning when we say we have a knowledge of
something.
82
A research paradigm according to Lather (1986) and Talmy (2010), fundamentally
shows the researcher’s views about the world is living in and also want to be in. This
institutes the intellectual beliefs and moralities that outline how the researcher looks
at the world and how everything is interpreted in that world. A paradigm can be used
in three ways in human sciences, namely for the institutionalisation of knowledgeable
motion, comprehensive groupings of methods and perceptions to the research of any
subject and for describing the extensive research approaches (Hussain, Elyas &
Nasseef 2013). It is mostly observed that the paradigms we figure in our thoughts have
an authoritative outcome as they make the lens through which we view the world (Shah
& Al-Bargi 2013).
4.2.1.1 Positivist
The positivist paradigm stresses that honest and factual activities could be observed
and studied scientifically and could as well be explained by means of lucid and rational
analysis and investigations (Aliyu, Bello, Kasim & Martin 2014) The positivist paradigm
explore social realities based on the impression that the understanding of human
behaviour can be gained through observations. Taylor and Medina (2013) state that
knowledge is often derived from observations and this approach consider the factual
and understanding of information in our disposal.
4.2.1.2 Philosophical approach to the study – Post positivist
Post-positivists pursued the understanding of causal relationships; hence,
correlational and experimentation studies are used. Furthermore, according to
Creswell (2009), as knowledge is cautious, hypotheses are not verified but basically
not excluded. In postpositivist paradigm, the latter admits that reality is deficient, and
that truth is not complete but feasible. It allows for remarks without construction of
hypotheses to be tested (McGregor & Murnane 2010).
According to McGregor and Murnane (2010), in post-positivist paradigm, instead of
attempting to describe how something works, researchers attempt: (a) to disclose
power relationships and structures or (b) to know why people operate in the way they
operate. The post-positivist paradigm undertakes that research should not be value-
free and unprejudiced but be loaded with value, subjective and intersubjective.
83
In this paradigm, exploration should occur in public and in the day-to-day lives of the
people, in natural situations rather than in a laboratory (Zammito 2004). The
researcher needs to understand how the adoption of marketing strategy impacts on
the performance and business outcomes of SMEs, which is the reason why a post-
positivist approach is used.
4.2.2 Research Design
Research design is viewed as the directing plan, which states all approaches and
procedures in the collection and analysing of data for research or study purposes
(Zikmund, Babin, Carr & Griffin 2012). Through the research design the researcher
can get the study or research subjects and gather necessary data from them with the
intention of reaching decisions for the research problem (Boeije 2010). Bezuidenhout
(2011) see research design as the action plan or process that serves as the main
guideline for any research purpose. According to Saunders, Lewis and Thornhill
(2009), this process assists the researcher in gaining a comprehensive knowledge in
planning the research, the reason behind the way of conducting it and the implications
thereof.
The choice of a research design was influenced by the nature of matters being
researched, the researchers’ experience and the audience for the study (Creswell
2014). When conducting research, a researcher can make use of the main types of
research designs to gather data: exploratory research, descriptive research and
causal research (Cooper & Schindler 2011). When using exploratory research, the
researcher pushes to gain understandings of the common nature of the problem, the
probable options and the significant variables that need to be deliberated upon in
forthcoming researches (Aaker, Kumar, Leone & Day 2013)
According to Hair, Bush & Ortinau (2006) and Cooper and Schindler (2011), a
researcher can select a research design from many kinds of research designs, namely
exploratory research, causal research and descriptive research. Exploratory research
is used when a researcher needs to understand or get an insight into a phenomenon
or individual and it is convenient when the researcher desires to elucidate his own
understanding about the research problem (Saunders 2009). Wiid and Diggines
(2013) state that causal research shows the connection between variables and helps
to identify and explain a link between the dependent and independent variables.
84
According to Sreejesh, Mohapatra and Anusree (2014), the basic aim of causal
research is to find the cause and effect relations amongst variables. Descriptive
research design explains the variables being studied and makes it flexible to examine
a problem from different approaches (Boswell & Cannon 2017).
The descriptive research was deemed appropriate for the study and it is discussed
next.
4.2.2.1 Descriptive research
The objective of the descriptive research design is to describe a correct profile of an
individual, events or circumstances (Saunders et al. 2009). According to Dantzker and
Hunter (2012), a descriptive research design is appropriate for our research since it
stresses the description of facts and physiognomies of a particular population, policy
or any given area of interest in an organised and detailed manner. Descriptive
research is different from exploratory research as it is known by prior formulation of
the problem/specific hypotheses while exploratory research is commonly used for
problem formulation (Creswell 2014). The information gained from a descriptive study
can offer understandings or perceptions not known in previous researches and it can
also lead to the study becoming inferential (Dantzker & Hunter 2012).
An inferential study generalises findings from a sample group and applies them to the
larger population (Dantzker & Hunter 2012). If one is going to make inferences from
the descriptive research or study, they must be sure that the population is well
represented within the sample studied (Dantzker & Hunter 2012). Descriptive research
design is used when the aim of the study is to have knowledge about who, what, when,
where and how, concerning the research topic (Creswell 2014; Sahu & Singh 2017).
Two forms of descriptive research can be followed, namely cross-sectional and
longitudinal study. In a cross-sectional descriptive research study, researchers gather
and measure the gathered information from any specified sample of population
elements once only (Burns & Bush 2010; Churchill, Brown & Suter 2010). With
longitudinal descriptive research, a static sample of population elements is measured
repetitively on the same variables (Wilson 2012). The study follows the cross-sectional
descriptive research since the data were collected from a given sample at a given time.
85
The objective of this study was to identify factors influencing the formulation of
marketing strategies for SMEs in Polokwane.
4.2.3 Research Approach
Creswell (2014) highlighted three approaches to research, namely qualitative,
quantitative and mixed methods.
4.2.3.1 Qualitative Research
Qualitative research aims to address the research aims using the method that allows
the researcher to thoroughly interpret occurrences not dwelling much on numeric
measurements (Zikmund et al. 2012). It is usually used in answering questions
concerning the multifaceted nature of the occurrences, with the motive to describe and
understand the sensations from the participants’ viewpoints (Veal 2011). Qualitative
research method aims to study behaviours in cultural, social and political situations
(Salkind 2012).
Not all researchers have positive opinions about the reliability of qualitative research
outcomes, when compared to a quantitative research method. Klenke (2016) posit that
positivists usually question its dependability, because their reliability and validity
concepts cannot be addressed the same as in a quantitative research. Subsequently
researchers who follow qualitative research state that figures do not produce adequate
insight concerning matters at hand (Verhoeven 2011).
Qualitative research differs from quantitative research based on its significance
dedicated to expressing the opinions and perceptions of the research participants (Yin
2016). According to Silverman (2010), qualitative methods should not be regarded as
intrinsically greater and quantitative research approach may undeniably be more
suitable for most research problems.
Qualitative research is a research technique that obtains data from a fairly small group
of participants. When compared to quantitative research, quantitative research obtains
data from a large sample size, which provides data that are statistically analysed
(Lehmann 2006). Using a qualitative research method, a researcher can avoid
statistical techniques and mechanics associated with the quantitative research method
(Silverman 2010).
86
4.2.3.2 Quantitative Research
According to Keyton (2010), quantitative research methods can be defined as the
research methods whereby the researcher depends much on the statistical information
given by the participants. It begins with the formulation of hypotheses, which should
be easy to understand (Fain 2017). The researcher in quantitative research
investigates theory through the formulation of hypotheses, data collection and
thereafter analyses the collected data to back or refute the set hypotheses (Creswell
2009; Laura & James 2014).
Quantitative research seeks to discover new understanding by focusing on the
investigation of issues within the natural environment (Laura & James 2014). Thus,
the focus of quantitative research is upon the methodologies that stress data
verifications, measurements of variables, variables explanations, statistical
significance and internal validity (Fain 2017). Quantitative research is mostly used in
investigating whether there are statistically substantial variances between dependent
variables based on an independent variable (Stein, Rice & Cutler 2013). Most often
quantitative research focuses on the research of the characteristics of variables within
a short period of time obtaining the results that can be generalised (Flick 2015).
Quantitative research is repeatedly branded with the common scientific method that
collects data empirically in a structured, systematic and organised way for the
discoveries to be generalised to other situations (Boswell & Cannon 2017).
Quantitative research seeks to understand the connection between variables
(Saunders, Lewis & Thornhill 2012). In a quantitative study, the researcher tries to
define the cause and effect connection between variables (Bryman 2012).
Quantitative research, like qualitative research, specifies the research purpose, the
research participants, the type of data being collected, time frame for data collection
and how data are to be collected (Boswell & Cannon 2017). Certainty in the
fundamentals of a quantitative angle leads a researcher to review questions
concentrated on relationships between variables, while being outcome-oriented (Fain
2017).
Quantitative research target for detachment, scientific independence and objectivity
when stating their research questions and the hypotheses (Laura & James 2014). Flick
87
(2015) states that quantitative research can also be used when selecting the research
participants, collecting data to respond the research questions, doing analysis and
making their conclusions. In quantitative research methods, the relationship between
the researcher and the participants’ is minimised and the value of the research is
quarantined as much as possible (Laura & James 2014).
Boswell and Cannon (2017) emphasise that it is essential for the researcher in a
quantitative study to be in control of effect from inconsequential variables, such as
ethnicity, age and gender. According to McKenzie (2013), quantitative methods are
objective and easily administrated and interpreted, with the research outcomes that
are conveyed in numeric format and easy to standardise. Veal (2011) indicate that the
usual methods of quantitative data collection comprise surveys, experiments and case
studies. The purpose is to simplify the results to a comprehensive setting, centred on
the results of a sample of the population, which is illustrative (Kalane 2015).
4.2.3.3 Mixed Methods
Mixed methods encompass the integration of both the qualitative and quantitative
research methods in one research study (Creswell 2014). The central principle of the
mixed methods is that the use of qualitative and quantitative methods together offers
enhanced understanding of the research problems (Creswell & Plano-Clark 2007).
According to Hartley (2011), diverse methods of research have their own distinctive
strengths and weaknesses and researchers are combining methodological
approaches with the determination of using the strength of another method to
overcome the weaknesses of the other method.
The chosen method for this research study was quantitative research method and data
was gathered by means of a survey using a structured and self-administered
questionnaire. The study has adopted a descriptive study using quantitative data. The
reason behind choosing quantitative research design was because it can be used to
determine the acquaintances between different variables, describe variables and be
used to test the cause and effect connections between variables. Some previous
studies on the SMEs used the quantitative method, such as Wiese (2014); Gaweseb
(2015); Lekhanya (2016); Seukindo (2017).
88
4.3 SAMPLING PLAN
Sampling is the method of deciding on the number of individuals for a research study
in a manner that the chosen individuals signify the greater or whole group from which
they were carefully chosen (McDaniel & Gates 2010; Bezuidenhout 2011). Sampling
allows the researcher to come to conclusions through evaluating or analysing the
acquired data from the selected sample (Khure 2013).
Sampling is a suitable part of the population that the researcher chooses to partake in
a research, whereby the needed information for the research will be acquired from
(Sekaran & Bouble 2010; McDaniel & Gates 2010). According to Makhitha (2013), the
sampling plan details the sampling population, sampling method, sampling frame and
the sampling size of the study.
4.3.1 Target Population
The target population is described by Graziano and Raulin (2013) as the population
by which the information is wanted from and study findings will be based on. Welman
et al. (2013) describe a population as the collection of constituents such as individual
offerings, persons, administrations, occasions and associations. Jha (2014) agree with
Welman et al. (2013) by stating that research population refers to the group samples
that share certain characteristics that can be related to the researcher’s project.
Population is the group of entities that meet the specific needs of the researcher and
which are proposed to be used to generalise the research results (McMillan &
Schumacher 2010). Cooper and Schindler (2011) state that population refers to the
comprehensive collection of elements whereby statistical inferences are to be made.
Population is the intellectual idea of a group of several cases from which a researcher
takes a sample and to which outcomes from the chosen sample are generalised
(Neuman 2011). The target population for this study was the SMEs operating in
Polokwane except Hawkers. Graziano and Raulin (2013) describes a target population
as citizens by which the researcher it is expected to make inferences of the research
findings from. Once a population is identified for a specific research project, the search
begins for a good sampling frame
89
4.3.2 Sampling Frame
Several commercial establishments offer a database of names, telephone numbers
and addresses of the possible sampling frame for numerous studies. Irrespective of
the sources, it is very difficult and expensive to get the exact or representative
sampling framed (Shukla 2008). Wiid and Diggines (2013) define sampling frame as
the reliable list used to draw research sample. Within this population, there will
probably be only certain groups that will be of interest to the study (Walliman 2011).
In Polokwane, the total number of SMEs is unknown. Snowball and convenience
sampling were considered suitable in this quantitative study especially in cases where
the sample selection is from a hard-to-find population or there is no sampling frame
(Christensen, Johnson & Turner 2011).
4.3.3 Sampling Method
Sampling plan can be categorised into probability and non-probability sampling. Both
the sampling methods recommend the selection of elements of the population by
chance (Walliman 2011; Jha 2014). The researcher made use of non-probability
sampling as it is convenient and representative of the population.
Probability sampling establishes a non-zero and a known chance of each member of
the defined target population to be nominated as part of a sample, while non-
probability sampling fails to ascertain the same chance and thus not provide for
members of the population to be selected in the sample (Jha 2014). According to
Sekaran and Bougie (2013), in probability sampling, members of the known population
stand a chance to be chosen in the sample for the research purpose. Dixon, Singleton
and Straits (2016) concur with Sekaran and Bougie (2013) by stating that probability
sampling is based on a method of unsystematic selection that offers each case in the
population the same opportunity to be incorporated in the sample.
A non-probability sampling technique can be described as a random and subjective
technique whereby the chances of being selected as a sample are not open or
members of the inhabitants do not have a known or non-zero selection chance
(Cooper & Schindler 2008). Ritchie and Lewis (2012) mentions that in non-probability
sampling, units are consciously nominated to reveal certain features in a sampled
90
population, therefore, the population’s characteristics are used as the basis for
selection (Ritchie & Lewis 2012).
Non-probability sampling is established on selection by accidental means and is much
appropriate where it is challenging to get access to the entire inhabitants (Walliman
2011). The non-probability methods include quota, purposive, convenience and
snowball sampling (Burns & Bush 2010; Jha 2014). Quota sampling encompasses
designing the population into fractions of certain groups needed by the researcher to
be represented in the sample (Bachman & Schutt 2013).
According to McMillan and Schumacher (2010), when following purposive sampling,
the researcher chooses certain traits from the population that will be useful concerning
the researched topic. Snowball sampling is considered suitable for quantitative studies
mainly in cases where there is no sampling frame (Christensen, Johnson & Turner
2011). According to Cooper and Schindler (2011), in convenience sampling, the
researcher chooses any enthusiastically accessible units as participants and it is also
economical. Mustapha (2010) mentions that the convenience sampling approach
includes the study participants that take part in the research based on their willingness
and availability, regardless of their group associations. This method is convenient for
researchers as they can gather data from everyone whom they can contact. Therefore,
after looking at the sampling methods available, non-probability sampling,
convenience and snowball sampling were considered for this study. Since there is no
reliable database for SMEs in Polokwane, through snowball sampling, SMEs told the
researcher about other SMEs and convenience sampling was also applied for those
who were readily accessible to take part in the study and is cheaper and easier to
conduct.
Saunders, Lewis and Thornhill (2009) state that convenience sampling is the best
imperative kind of non-probability sampling. This is because researchers trust their
research experience and inventiveness to consciously get population members, in a
way that the secured sample may be considered as an applicable population
representative.
In a convenience sampling method, the sample selection process is continuous until
the necessary sample size has been reached (Cooper & Schindler 2011). The decision
91
to use non-probability sampling depends on the unit of analysis, data collection
methods and the research questions (Dixon, Singleton & Straits 2016).
4.3.4 Sample Size
Sample size is described as a group that is a subdivision of the research population
(Saunders et al. 2009). Kapoor and Kulshrestha (2010) articulates that when deciding
on the sample size, the sample must not be more than necessary to waste resources
and time; however, a sample must not be too small to bring inaccurate outcomes.
According to Muday (2013), larger sample size can bring better and more trustworthy
research findings.
Blumberg et al. (2008) specify that the sample size can be influenced by the costs
involved when collecting data. Cooper and Schindler (2008) state that, data gathered
from samples can be used to make conclusions about a population without probing
every member of that population. Therefore, enough samples are needed to represent
the population.
For any form of quantitative research analysis there is a minimum sample size of at
least 100 required to determine simple fractions for each variable (Kent 2007). There
are some rules involved when determining the sample size (Sekaran & Bougie 2013):
• The sample size of 30 to 500 is appropriate for many researches.
• Where samples need to be divided into sub-samples, a sample size of 30 is
needed for every category.
• In multivariate researches, the sample size ought to be sometimes as large as the
number of variables in the study.
Aaker et al. (2013) shows that the sample size can be uttered by bearing in mind the
cost involved in collecting data, reliability and the pace required for data collection.
There is no frame of reference for the standard sample size. The sample size for
existing studies on marketing and SMEs ranges from 100 to 350, for example, Soke
(2014) sample size 273; Chingwaru (2014) sample size 278; Makhitha (2016) sample
size 200; Rungani and Potgieter (2018) sample size 350; and Makhubela (2019)
sample size 300. As reported by Stam, Arzlanian and Elfring (2014) the sample sizes
for the past similar studies ranged 40 to 756.
92
Therefore, being guided by the above statements, the researcher chose 412 samples
to represent the population. According to Struwig and Stead (2013), it is hard to
determine if the sample size is good or bad, however, it is suggested that the
researcher should be guided by the research purpose and goals. Determining an
acceptable population sample size involves knowing that the larger the sample size
the more likely it is to obtain the research results that can be generalised.
In the absence of the sampling frame the researcher can focus on non-probability
sampling methods for the study (Adams, Khan and Raeside 2014). There was an
absence of the sampling frame for the SMEs in Polokwane which necessitated the
researcher to use both the snowball and convenience sampling for the SMEs, whereby
the researcher was moving from street to street approaching the SMEs
owners/managers that were readily available for the purpose of research. All the
participants signed the consent form to ensure that everyone is aware that the
research participation was voluntary.
4.3.5 Data Collection Methods
4.3.5.1 Survey
Saunders, Lewis and Thornhill (2012) articulate that a survey research includes all the
approaches that an investigator needs to create conclusions from a sample about
inhabitants to respond to the research questions and to meet research goals. The aim
of a survey is to develop analogous data through the subdivisions of the preferred
sample, the aim being to find resemblances and variances (Cooper & Schindler 2011).
Survey research can be described as a cross-sectional design relative to which data
are gathered mostly by a self-completion questionnaire or by well-organised interviews
on more than one case (Bryman 2012). According to Saunders et al. (2012), surveys
help the researcher in collecting quantitative data, which quantitative analysis can be
made from, using both descriptive and inferential statistics.
Survey techniques are allied with the descriptive and causal research and allow a
researcher to gather more quantity of information from a set population cost effectively
(Gaweseb 2015).
93
When using the survey research method, primary data are collected directly from the
respondents or the sample and the questionnaire is used to structure and record the
collection of data (Wegner 2012). In this study, the survey research was piloted, and
using a questionnaire to gather primary data from the SMEs in Polokwane. Distribution
and collection of the questionnaire was done by the researcher alone.
4.3.5.2 Questionnaire
The primary data in this study were gathered using questionnaires. According to Collis
and Hussey (2009), a questionnaire is a list of cautiously arranged questions, which
have been chosen to obtain reliable responses from a study sample. Brace (2013)
defines a questionnaire as the communication method between the researcher and
the subject, although occasionally administered on the researcher’s behalf by an
interviewer.
Questionnaires offer the researcher a good administrative advantage and present a
comprehensive way of collecting data (Robert 2013). A good questionnaire should
reduce the response problems to boost the prospects for a good response rate
(Denscombe 2014).
A good written questionnaire is a low-cost choice for a survey and can deliver the most
accurate answers (Brace 2013). It is in the researcher’s jurisdiction, being guided by
the research or study objectives, to formulate questions, which require answers and
through the questionnaire the respondents will convey the answers back to the
researcher (Brace 2013)
When creating a questionnaire, all information and questions should be to the point
and very clear and outlined by the research questions (Graziano & Raulin 2013). Pre-
testing the questionnaire is recommended before it can be presented to the
respondents. Pre-testing the questionnaire determines its success and provides
relevant information to respond to the set research questions (Aaker et al. 2011). The
questionnaire was pre-tested and all errors or comments, were rectified or changed
before being presented to the respondents.
94
4.3.5.3 Questionnaire Design
Questionnaire design and layout are essential features of a questionnaire, which help
in capturing the interest of the participants. There are different considerations when
designing a questionnaire, which comprise the types of questions, introduction,
wording and the number of questions combined in a questionnaire (Horn 2012). The
questionnaire was selected as the method to gather data since it can easily be
managed and distributed. It also ensures that the entire sample can receive the same
questions, which ensure consistency of the questions asked to all the respondents.
The types of questions used in this study included the Likert scale, closed,
dichotomous and open-ended questions.
Closed questions can be responded to with one word or short phrase, while open-
ended questions afford the respondent the opportunity to give a long answer or
express himself to a particular question (Johnson & Christensen 2012). A
questionnaire based on closed-ended items is typically used in quantitative research
(Johnson & Christensen 2012). Dichotomous questions have only two alternative
responses, such as male or female, yes or no and so on (Shukla 2010). Dichotomous
questions signify the first and simplest form of the closed question format, as the
respondent is limited to two fixed alternatives (Wilson 2012)
Welman et al. (2013) state that Likert scale questions allow the ratings and
measurements of the respondents in line with different ideas, topics or conditions.
Likert scale is rated as the most frequently used method of scale in marketing research
and it is easy to manage (Zikmund & Babin 2010). The Likert scale is convenient in
determining the total score for each of the respondents concerning each score.
Malhotra (2009) states that it is vital to use a steady scoring method so that the low or
high score reflects a constructive response. The questionnaire length must be kept
reasonably short, thus certifying that it is not complicated to manage as well as to
undertake the coding of the responses (Horn 2012). To ensure anonymity, participants
were not requested to specify their names on the questionnaires.
Codes were assigned to each of the possible responses that respondents chose.
Instructions were added on the questionnaire cover page, persuading the respondents
to be honest and critical as they select the best response. The respondents were
advised to request the results of the research, should they need them.
95
The existing literature was used to design the questionnaire items. Questions on
marketing attitude were designed using information sourced from Brooksbank,
Thompson and Williams (2008), for marketing orientation, Keh, Nguyen and Ping
(2007); Tsikirayi, Muchenje and Katsidzira (2013) for marketing communications,
Lekhanya (2015); Mohammad and Neda (2012) for product innovation, Keizer,
Dijkstra and Halman (2002); Oke, Burke and Myers (2007); Osei, Yunfei, Appienti and
Forkuoh (2016) for questions related to SMEs factors/challenges, Lekhanya (2010);
Lekhanya (2015); Zhou (2015); Aigbavboa and Thwala (2014) for questions related to
performance, and also from Oke, Burke and Myers (2007); Terziovski (2010);
Osei,Yunfei, Appienti and Forkuoh (2016) for the overall design of the questionnaire.
To ensure that all possible errors (like inadequate time limits, unclear instructions)
within the questionnaire are avoided or addressed early, pilot testing was done. Pilot
testing is very useful if the measuring instrument has been formulated mainly for the
research study (Welman et al. 2013). Saunders et al. (2009) assert that with pilot
testing, the researcher is able to determine the respondents’ behaviour about the
research questions.
4.4 DATA PREPARATION
4.4.1 Editing
Editing helps to identify unanswered questions and is also useful to check the
consistency of the responses. If responses are unsatisfactory, the researcher returns
to the field to reconnect with the respondents to get better or more complete data
(Makhitha 2013)
4.4.2 Coding
Data coding, in this instance, encompasses allocating numbers to answers to group
responses into a limited number of classes and groups. Arrangement of data into
limited categories is essential for effective analysis (Chazireni 2017). Coding assisted
the researcher to reduce the large number of qualitative responses into just a few
manageable categories that hold critical information vital for analysis. In the research,
coding was done on the questionnaire for all the variables from v1 to v135.
96
4.4.3 Data Capturing
Data capturing is a data preparation stage where data are transcribed by being
transferred from questionnaires onto a disk or directly into a computer (Cooper &
Schindler 2011). The data capturers checked for errors during data capturing.
Thereafter, the researcher and the research supervisor also checked the final captured
data to confirm that no wrong codes and mistakes were made. The questionnaires
were checked for mistakes, then later captured for analysis.
4.4.4 Data cleaning
Data cleaning involves making sure that raw data values were accurately entered into
a computer readable file. The main aim for cleansing the data is to identify the dirty or
unnecessary data (irrelevant, incorrect, or incomplete data) and to either alter or
remove it to confirm that a given set of data is correct and consistent with other sets
in the system (Rana, Negi & Kapoor 2016)
4.4.5 Data analysis
The researcher administered the questionnaire to be used in obtaining information for
this study. The responses to the questionnaire were manually analysed, entered into
Microsoft Excel database and prepared for SPSS analysis.
The first thing to do when analysing the collected data is to describe them (Salkind
2009). Data analysis entails the reduction of collected data to a controllable size,
making summaries, considering the available patterns and making use of the available
statistical techniques to interpret the data (Cooper & Schindler 2008).
Burns and Bush (2014) state that data analysis assists the researcher to abstract data
that is expressive and correctly describes essential characteristics of the phenomena.
Furthermore, data analysis is significant since raw data offer tiny details and meaning
to researchers (Msoza 2015). Once the sample of data has been described, the
descriptive information is used to deduce or infer from the sample, which the data was
collected from the sample (Salkind 2009).
97
4.4.6 Quantitative data analysis
Quantitative data, before being processed and evaluated, carries only slight
significance (Welman et al. 2013). Therefore, there is a need to process and transform
data into codes. Veal (2011) articulate that there is a commonly used statistical
package to code data, namely Statistical Packages for Social Sciences (SPSS). For
the purposes of this research, SPSS, version 24 was used to capture and analyse
data. Data analysis was done in the following way:
4.4.6.1 Descriptive Statistics
Descriptive statistics are regarded as the most effective means of summarising the
characteristics of huge sets of data (Kent 2007). In addition, descriptive statistics
designate the sample characteristics.
Descriptive statistics are used to review, discover and show the collected data
(Coakes 2013). Likewise, Graziano and Raulin (2013) affirms the description of data
is done in descriptive statistics and then analysed by means of inferential statistics.
Zikmund et al. (2010) state that frequency and distribution percentages can also be
utilised to recapitulate and describe data. As stated by Bartholomew, Knott & Moustaki
(2011) factor analysis functions on the belief that quantifiable and observable variables
can be reduced to fewer latent variables with mutual variances.
There are two main factor analysis techniques which are Exploratory Factor Analysis
(EFA) and Confirmatory Factor Analysis (CFA). The EFA was adopted in the study.
EFA is used when the researcher wants to uncover the multifaced patters by exploring
the dataset and examining the data predictions (Yong & Pearce 2013).
4.4.6.2 Inferential statistics
Njue (2015) describes inferential statistics as the system that uses the probability
concept to infer the properties of a population from the analysis of the sample. The
aim of inferential statistics is to make inferences from the sampled population
concerning the population that the sample was drawn from (Quinlan 2011)
Walliman (2011) articulates that inferential statistics are analytical, based on
implications made from analysed facts. The predictive element is made on the basis
98
that certain qualities that are predominant in a sample will be evident for the whole
population.
4.4.6.3 ANOVA and regression
ANOVA and regression were also applied to determine the impact of marketing
strategies on business performance. ANOVA is most appropriate when the researcher
is interested in testing the differences between three or more groups and the
dependent variable is continuous and if there is only one independent variable, a one-
way ANOVA is deemed appropriate (Frederick & James 2006). The regression model
is a statistical procedure that lets the researcher make estimations of the linear, or
straight line, relationship that connects two or more variables. The most frequently
used type of regression is linear regression, which measures the degree to which the
relationship between independent variables and dependant variables can be signified
by a straight line (Scott 2018)
4.5 VALIDITY AND RELIABILITY ISSUES
In both quantitative and qualitative studies, validity and reliability are critical aspects
of instruments (e.g. questionnaire) (Laura & James 2014). Bryman and Bell (2015)
concur with Laura and James (2014) by articulating that validity and reliability are the
greatest criteria’s when assessing a study. Both the study’s validity and reliability were
discussed:
4.5.1 Validity (External and Internal)
According to Leedy and Ormrod (2014), validity is the point to which the research tool
measures what it is envisioned to measure. Validity refers to the degree to which a
particular measurement offers data that relate to frequently believed significances of
a specific concept (Rubin & Babbie 2017). McMillan and Schumacher (2010) articulate
that quantitative research design validity contains suggestions centred on content in
terms of the sampling evidence based on the response processes within the
questionnaire and on internal structure relative to the traits evident in the grade head
system
99
A researcher can use different types of validity tests to determine if he managed to
make good measurements. The types of validity tests are content, construct and
criterion validity. Content validity helps the researcher to determine how accurately an
assessment tool taps into various aspects of the specific construct in question and
criterion validity is established when there is a close relationship between the results
of the measured concept and other results from other measurements (Salkind 2009).
Construct validity demonstrates how well the results found from utilising the instrument
match the concepts it is envisioned to measure (Cooper & Schindler 2008).
4.5.2 Reliability
Leedy and Ormrod (2014) define reliability as the uniformity with which a measuring
tool produces certain, reliable outcomes when the entity being measured has no
difference. It refers to the probability that a measurement procedure will produce a
similar explanation of a given phenomenon if that dimension is repetitive (Rubin &
Babbie 2017). Tavakol and Dennick (2011) and Laura and James (2014) describe
reliability as the consistency of measurement in a research study and the credibility of
the findings. Therefore, the reliability of the research lies on its ability to demonstrate
the availability of good or similar results from a group of respondents
The statistical programme SPSS 24.0 was chosen to analyse data from the
respondents because of its reliability. In determining whether the findings are reliable,
the following question must be asked: Will the evidence and inferences stand up to
the closest scrutiny? The Cronbach’s alpha will also be used as a test of core
uniformity and is commonly used to calculate the relationship values between the
answers on the assessment tools.
4.6 ETHICAL CONSIDERATIONS
Any research that involves contact with human populations comprises ethical
considerations and the respondents must be safeguarded (Blumberg, Cooper &
Schindler 2008). In this research, the free will to participate by the respondents was
discussed, the respondents’ right to confidentiality and permission were acquired and
respondents advised and assured about the right to withdraw from the study at any
given time.
100
The researcher considered the subsequent as ethical rules and policies: informed
consent, protection from harm, confidentiality, privacy, anonymity and caring
(McMillan & Schumacher 2010). Informed consent is attained when explanation of the
study is given to the participants. The participants were given advice concerning
termination of their participation at any time with no consequence and clarity is given
in terms of any risks associated with the research.
McMillan and Schumacher (2010) further state that research or study should at no
time result in any bodily or mental worry to participants. The participants’ privacy must
be protected. The following restrictions must be applied to achieve privacy:
participants’ responses, characteristics, behaviour and other significant information
(McMillan & Schumacher 2010)
Ethical approval for this research was obtained from the University of South Africa,
Department of Marketing and Retail Management Research and Ethics.
4.7 CONCLUSION
This chapter concentrated on the methodology used in this study. The description of
quantitative research as a method used for the study, research design, sampling plan
and data analysis methods was given. Measures followed during the data collection
were also discussed. The chapter adopted the survey method using a questionnaire
to collect data. The questionnaire for this study was designed using the literature, this
discussion was followed by how the questionnaire was developed. Both the snowball
and convenience sampling methods were adopted for the study. Efforts were made in
ensuring that mistakes were lessened and that the right sample was attained. The
chapter to follows provides the detailed presentation and discussion of the research
findings attained from the questionnaires.
101
CHAPTER 5: ANALYSIS OF THE RESULTS AND FINDINGS
5.1 INTRODUCTION
The chapter provides detailed analysis of the findings and interpretations of the study
results. The purpose of the study was to identify factors influencing marketing strategy
formulation for SMEs in Polokwane.
The analysis of the results entails the use of descriptive statistical analysis, factor
analysis and inferential statistics (ANOVA and regression). Some of the information
was presented in the form of figures and tables to clarify the study findings.
5.2 VALIDITY AND RELIABILITY
Leedy and Ormrod (2013) state that the reliability and validity of a research instrument
must be calculated to determine if the used instrument has in fact measured the
envisioned concepts, together with its consistency in measuring the concepts. This
section presents the basis on which the factors analysed were considered.
5.2.1 Validity
As discussed in 4.5.1 in the previous chapter, in quantitative research design, validity
contains suggestions centred on content in terms of the sampling, evidence based on
response processes within the questionnaire and on internal structure with relation to
the traits evident in the grade head system (McMillan & Schumacher 2010). Bougie
and Sekaran (2010) concur with McMillan and Schumacher (2010) by articulating that
validity refers to the honesty of the instrument and its provision of accurate responses
to what the researcher requires.
The questionnaire was evaluated, and pilot testing was done with 10 SMEs to
determine the suitability of the questionnaire and to eliminate the vague and unrelated
questions. Participants’ attitude towards the questions within the questionnaire were
observed during the pilot testing. The questionnaire was kept short, vague questions
removed to avoid discouragement and unrelated questions to the objectives were
removed.
102
According to Ibrahim, Shiratuddin and Wong (2015), the recommended acceptable
value for item loadings for each of the corresponding research construct is 0.40. As
shown in Table 5.10 and Table 5.14 all the items show communalities above 0.4, which
range from 0.432 – 0.798 and 0.415 – 0.733 for both marketing communication and
product strategy respectively. The analysis meets the minimum requirement of items
correlation, KMO and Bartlett’s test of sphericity. The KMO for marketing
communication strategy is 0.729 as shown in Table 5.09 and for product strategy is
0.665 as shown in Table 5.13, indicating acceptable content and convergent validity
in the current study. Appendix 4 and 5 show the correlations matrix: marketing
communication strategy and product strategy.
The presented results in Appendix 4 about marketing communication strategies
indicates that there is a substantial positive relationship between sales promotions and
digital marketing (r= .373; medium effect; p<.001), business branding (r= .321;
medium effect; p<.001), personal selling (r= .352; medium effect, p<.001), traditional
media (r= .100; small effect; p<.001) and a substantial negative relationship with
public relations (r= -.058; small effect; p<.001), word of mouth (r= -.138; small effect;
p<.001)
The results shows a substantial negative relationship between digital marketing and
public relations (r= -.249; small effect; p<.001), email communication (r= -.018; small
effect; p<.001), and a substantial positive relationship with business branding (r= .314;
medium effect; p<.001), telemarketing (r= .251; medium effect; p<.001), personal
selling (r= .243; medium effect; p<.001), traditional media (r= .089; small effect;
p<.001).
There was a substantial positive relationship between public relations and email
communication (r= .214; small effect; p<.001), traditional media (r= .220; small effect;
p<.001), word of mouth (r= .031; small effect; p<.001), and a negative relationship with
business branding (r= -.103; small effect; p<.001), telemarketing (r= -.132; small effect;
p<.001), personal selling (r= -.089; small effect; p<.001).
Appendix 4 shows that there was a substantial positive relationship between email
marketing and personal selling (r= .018; small effect; p<.001), traditional media (r=
.170; small effect; p<.001), word of mouth (r= .008; small effect; p<.001), and a
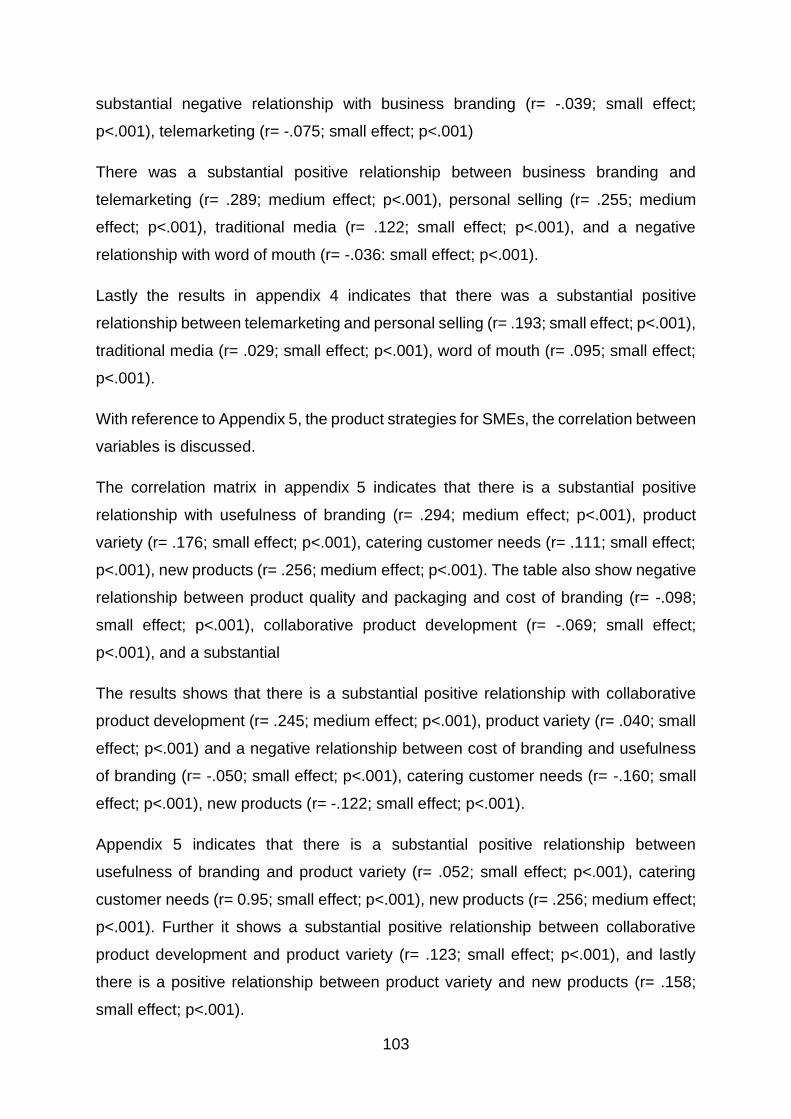
103
substantial negative relationship with business branding (r= -.039; small effect;
p<.001), telemarketing (r= -.075; small effect; p<.001)
There was a substantial positive relationship between business branding and
telemarketing (r= .289; medium effect; p<.001), personal selling (r= .255; medium
effect; p<.001), traditional media (r= .122; small effect; p<.001), and a negative
relationship with word of mouth (r= -.036: small effect; p<.001).
Lastly the results in appendix 4 indicates that there was a substantial positive
relationship between telemarketing and personal selling (r= .193; small effect; p<.001),
traditional media (r= .029; small effect; p<.001), word of mouth (r= .095; small effect;
p<.001).
With reference to Appendix 5, the product strategies for SMEs, the correlation between
variables is discussed.
The correlation matrix in appendix 5 indicates that there is a substantial positive
relationship with usefulness of branding (r= .294; medium effect; p<.001), product
variety (r= .176; small effect; p<.001), catering customer needs (r= .111; small effect;
p<.001), new products (r= .256; medium effect; p<.001). The table also show negative
relationship between product quality and packaging and cost of branding (r= -.098;
small effect; p<.001), collaborative product development (r= -.069; small effect;
p<.001), and a substantial
The results shows that there is a substantial positive relationship with collaborative
product development (r= .245; medium effect; p<.001), product variety (r= .040; small
effect; p<.001) and a negative relationship between cost of branding and usefulness
of branding (r= -.050; small effect; p<.001), catering customer needs (r= -.160; small
effect; p<.001), new products (r= -.122; small effect; p<.001).
Appendix 5 indicates that there is a substantial positive relationship between
usefulness of branding and product variety (r= .052; small effect; p<.001), catering
customer needs (r= 0.95; small effect; p<.001), new products (r= .256; medium effect;
p<.001). Further it shows a substantial positive relationship between collaborative
product development and product variety (r= .123; small effect; p<.001), and lastly
there is a positive relationship between product variety and new products (r= .158;
small effect; p<.001).
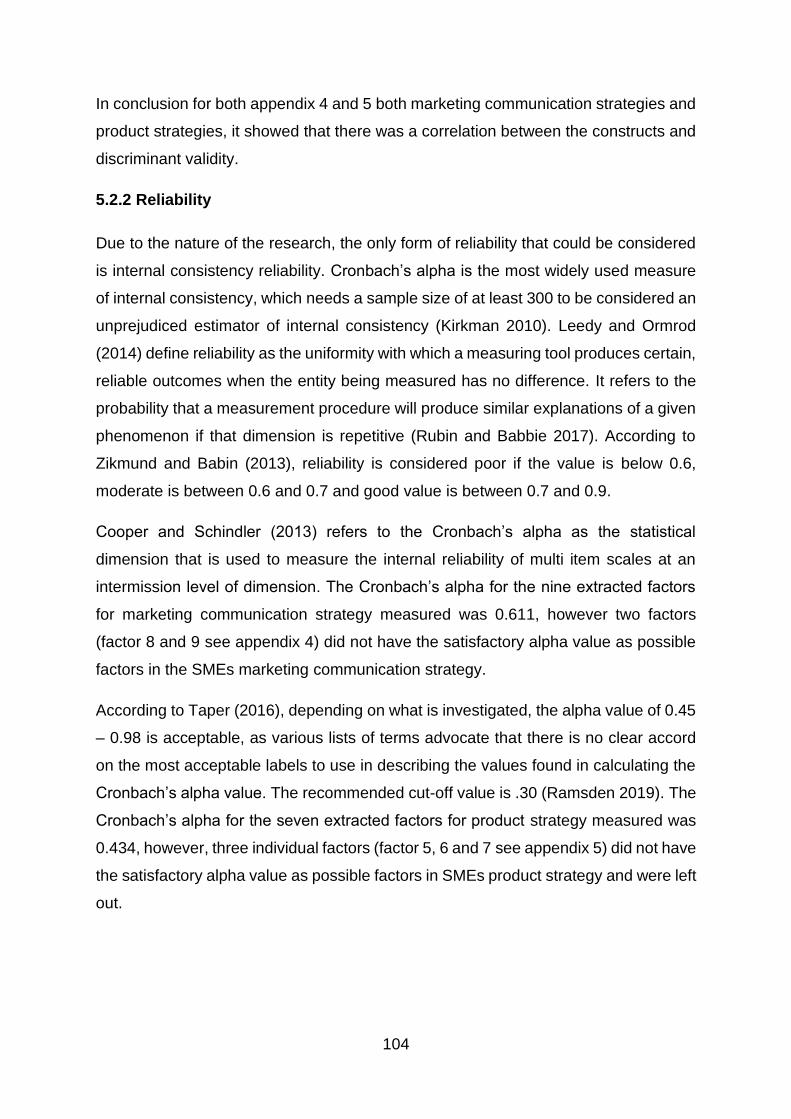
104
In conclusion for both appendix 4 and 5 both marketing communication strategies and
product strategies, it showed that there was a correlation between the constructs and
discriminant validity.
5.2.2 Reliability
Due to the nature of the research, the only form of reliability that could be considered
is internal consistency reliability. Cronbach’s alpha is the most widely used measure
of internal consistency, which needs a sample size of at least 300 to be considered an
unprejudiced estimator of internal consistency (Kirkman 2010). Leedy and Ormrod
(2014) define reliability as the uniformity with which a measuring tool produces certain,
reliable outcomes when the entity being measured has no difference. It refers to the
probability that a measurement procedure will produce similar explanations of a given
phenomenon if that dimension is repetitive (Rubin and Babbie 2017). According to
Zikmund and Babin (2013), reliability is considered poor if the value is below 0.6,
moderate is between 0.6 and 0.7 and good value is between 0.7 and 0.9.
Cooper and Schindler (2013) refers to the Cronbach’s alpha as the statistical
dimension that is used to measure the internal reliability of multi item scales at an
intermission level of dimension. The Cronbach’s alpha for the nine extracted factors
for marketing communication strategy measured was 0.611, however two factors
(factor 8 and 9 see appendix 4) did not have the satisfactory alpha value as possible
factors in the SMEs marketing communication strategy.
According to Taper (2016), depending on what is investigated, the alpha value of 0.45
– 0.98 is acceptable, as various lists of terms advocate that there is no clear accord
on the most acceptable labels to use in describing the values found in calculating the
Cronbach’s alpha value. The recommended cut-off value is .30 (Ramsden 2019). The
Cronbach’s alpha for the seven extracted factors for product strategy measured was
0.434, however, three individual factors (factor 5, 6 and 7 see appendix 5) did not have
the satisfactory alpha value as possible factors in SMEs product strategy and were left
out.
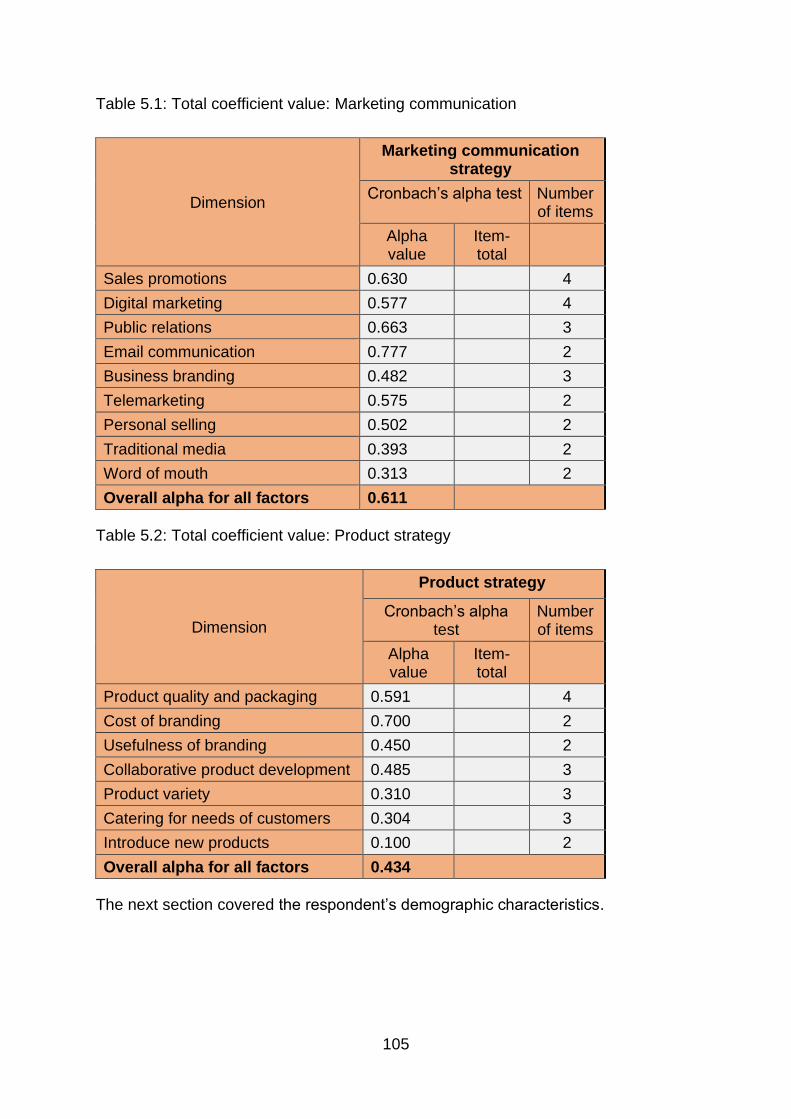
105
Table 5.1: Total coefficient value: Marketing communication
Dimension
Marketing communication strategy
Cronbach’s alpha test Number of items
Alpha value
Item-total
Sales promotions 0.630 4
Digital marketing 0.577 4
Public relations 0.663 3
Email communication 0.777 2
Business branding 0.482 3
Telemarketing 0.575 2
Personal selling 0.502 2
Traditional media 0.393 2
Word of mouth 0.313 2
Overall alpha for all factors 0.611
Table 5.2: Total coefficient value: Product strategy
Dimension
Product strategy
Cronbach’s alpha test
Number of items
Alpha value
Item-total
Product quality and packaging 0.591 4
Cost of branding 0.700 2
Usefulness of branding 0.450 2
Collaborative product development 0.485 3
Product variety 0.310 3
Catering for needs of customers 0.304 3
Introduce new products 0.100 2
Overall alpha for all factors 0.434
The next section covered the respondent’s demographic characteristics.
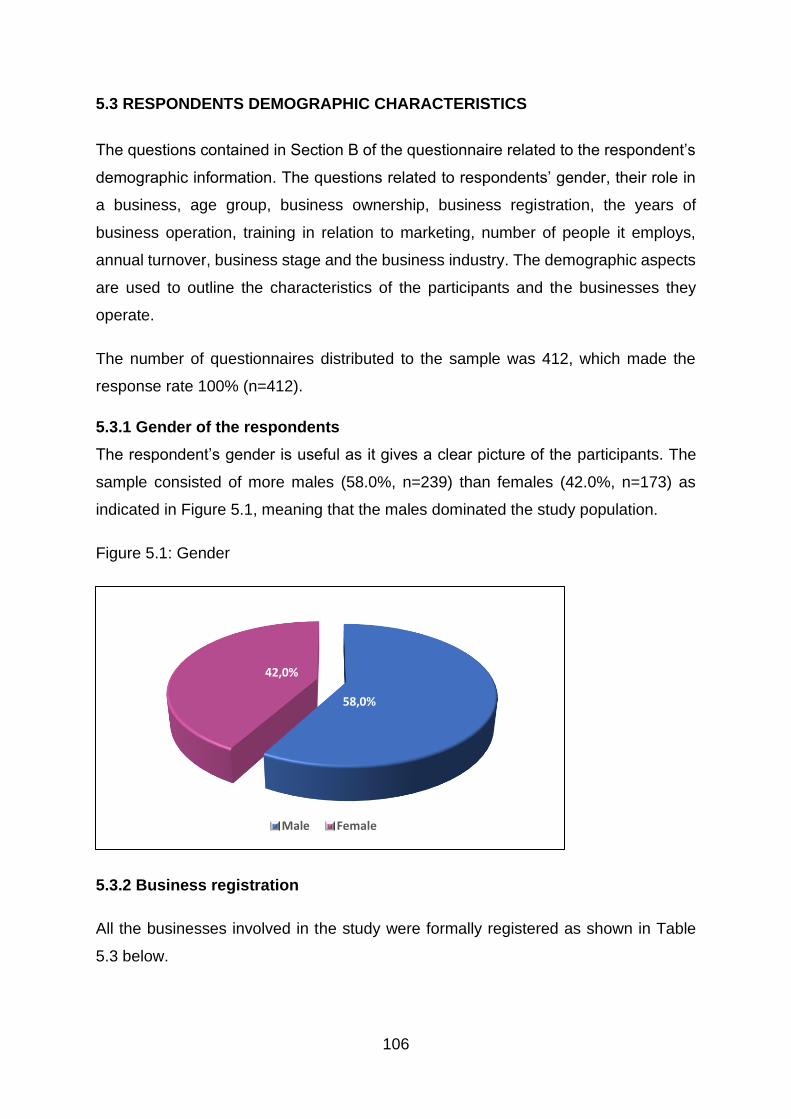
106
5.3 RESPONDENTS DEMOGRAPHIC CHARACTERISTICS
The questions contained in Section B of the questionnaire related to the respondent’s
demographic information. The questions related to respondents’ gender, their role in
a business, age group, business ownership, business registration, the years of
business operation, training in relation to marketing, number of people it employs,
annual turnover, business stage and the business industry. The demographic aspects
are used to outline the characteristics of the participants and the businesses they
operate.
The number of questionnaires distributed to the sample was 412, which made the
response rate 100% (n=412).
5.3.1 Gender of the respondents
The respondent’s gender is useful as it gives a clear picture of the participants. The
sample consisted of more males (58.0%, n=239) than females (42.0%, n=173) as
indicated in Figure 5.1, meaning that the males dominated the study population.
Figure 5.1: Gender
5.3.2 Business registration
All the businesses involved in the study were formally registered as shown in Table
5.3 below.
58,0%
42,0%
Male Female
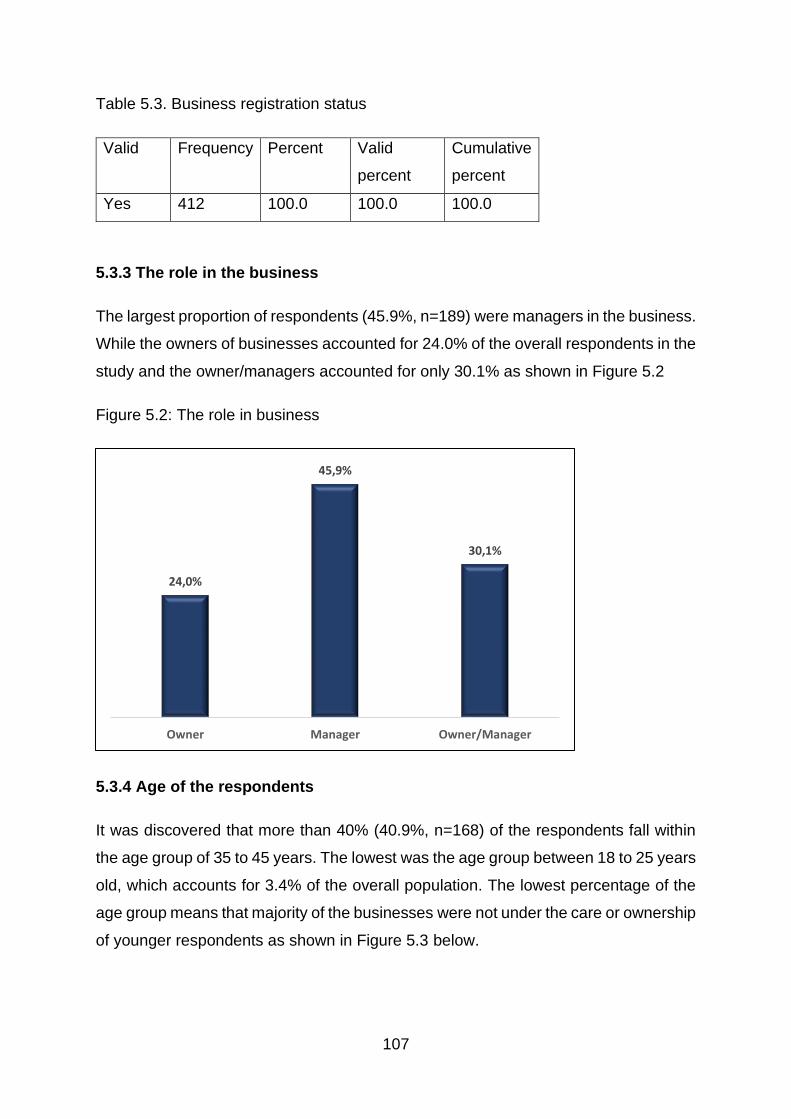
107
Table 5.3. Business registration status
Valid Frequency Percent Valid
percent
Cumulative
percent
Yes 412 100.0 100.0 100.0
5.3.3 The role in the business
The largest proportion of respondents (45.9%, n=189) were managers in the business.
While the owners of businesses accounted for 24.0% of the overall respondents in the
study and the owner/managers accounted for only 30.1% as shown in Figure 5.2
Figure 5.2: The role in business
5.3.4 Age of the respondents
It was discovered that more than 40% (40.9%, n=168) of the respondents fall within
the age group of 35 to 45 years. The lowest was the age group between 18 to 25 years
old, which accounts for 3.4% of the overall population. The lowest percentage of the
age group means that majority of the businesses were not under the care or ownership
of younger respondents as shown in Figure 5.3 below.
24,0%
45,9%
30,1%
Owner Manager Owner/Manager
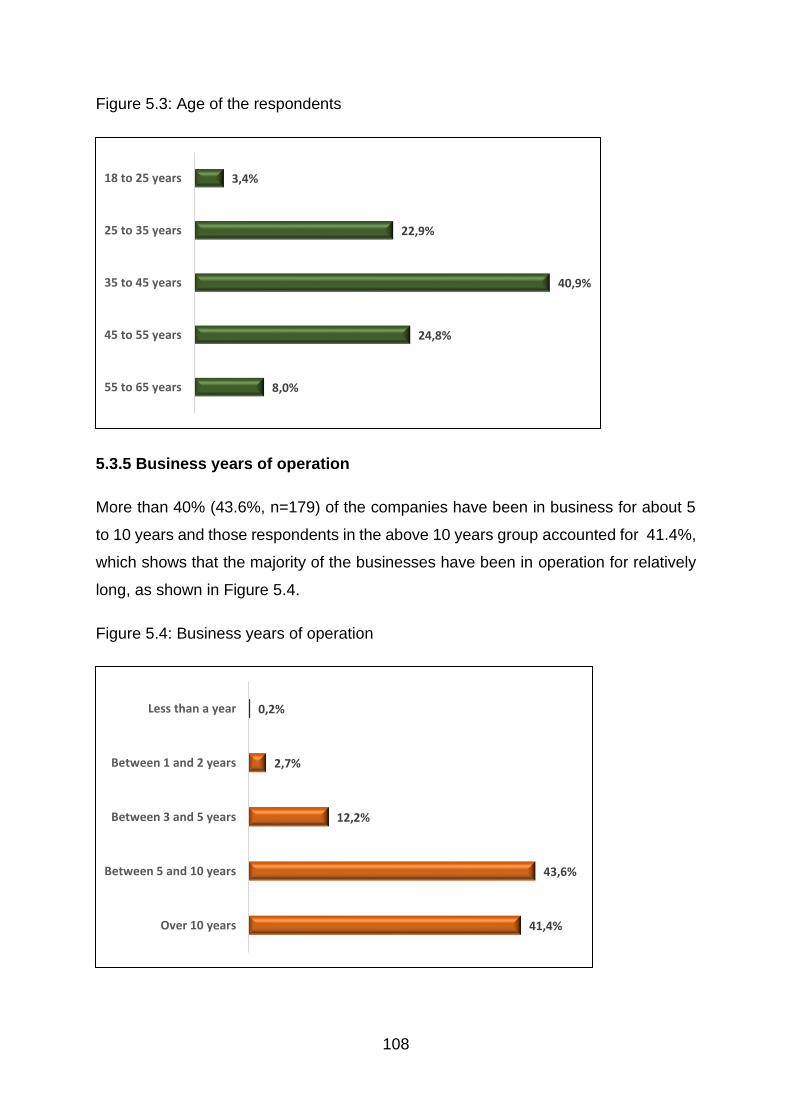
108
Figure 5.3: Age of the respondents
5.3.5 Business years of operation
More than 40% (43.6%, n=179) of the companies have been in business for about 5
to 10 years and those respondents in the above 10 years group accounted for 41.4%,
which shows that the majority of the businesses have been in operation for relatively
long, as shown in Figure 5.4.
Figure 5.4: Business years of operation
3,4%
22,9%
40,9%
24,8%
8,0%
18 to 25 years
25 to 35 years
35 to 45 years
45 to 55 years
55 to 65 years
0,2%
2,7%
12,2%
43,6%
41,4%
Less than a year
Between 1 and 2 years
Between 3 and 5 years
Between 5 and 10 years
Over 10 years
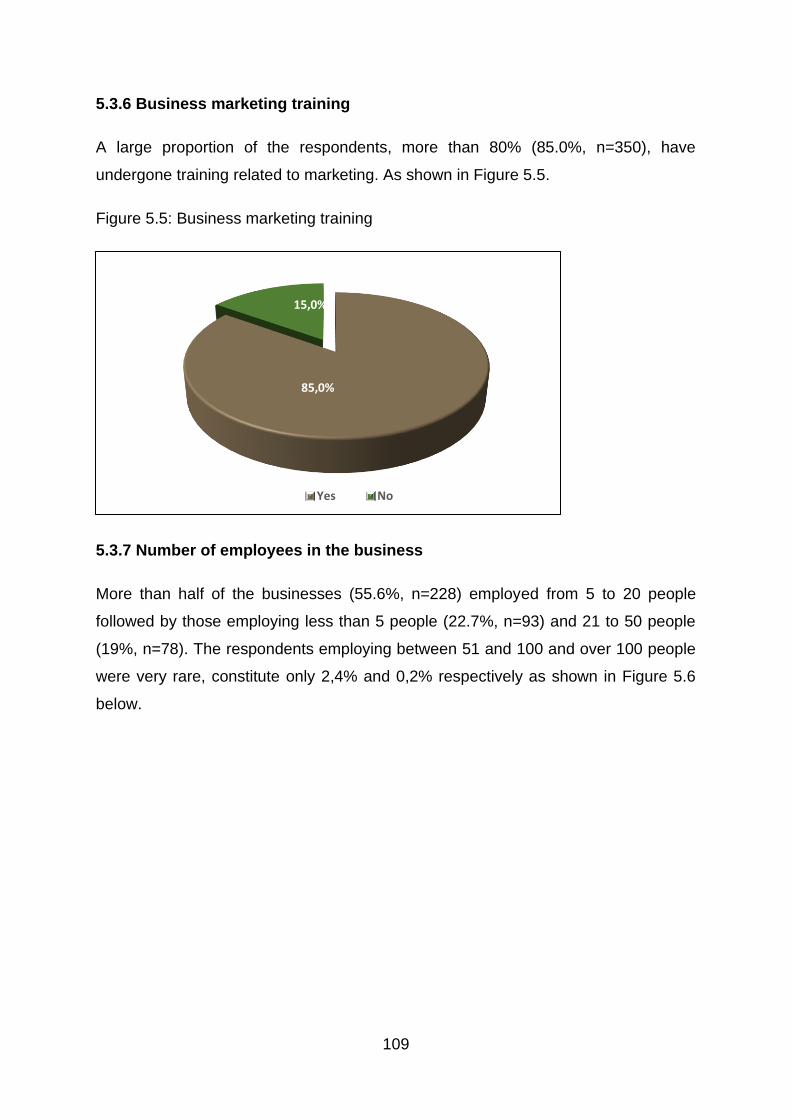
109
5.3.6 Business marketing training
A large proportion of the respondents, more than 80% (85.0%, n=350), have
undergone training related to marketing. As shown in Figure 5.5.
Figure 5.5: Business marketing training
5.3.7 Number of employees in the business
More than half of the businesses (55.6%, n=228) employed from 5 to 20 people
followed by those employing less than 5 people (22.7%, n=93) and 21 to 50 people
(19%, n=78). The respondents employing between 51 and 100 and over 100 people
were very rare, constitute only 2,4% and 0,2% respectively as shown in Figure 5.6
below.
85,0%
15,0%
Yes No
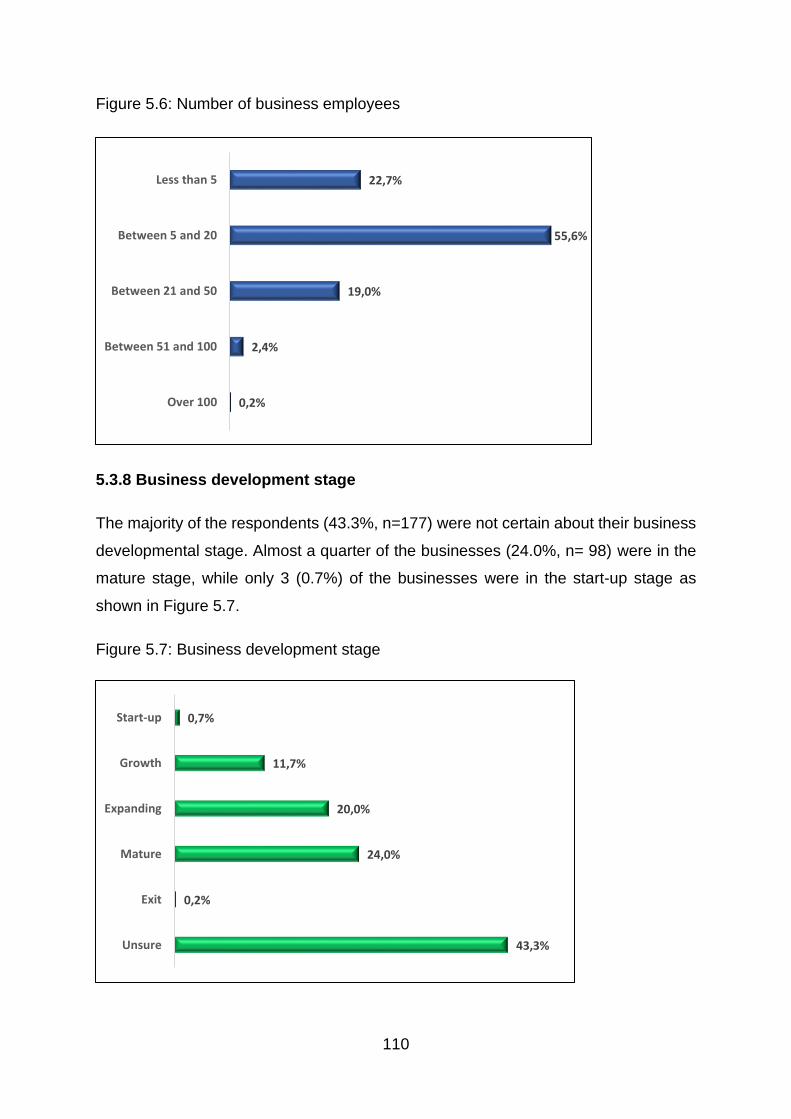
110
Figure 5.6: Number of business employees
5.3.8 Business development stage
The majority of the respondents (43.3%, n=177) were not certain about their business
developmental stage. Almost a quarter of the businesses (24.0%, n= 98) were in the
mature stage, while only 3 (0.7%) of the businesses were in the start-up stage as
shown in Figure 5.7.
Figure 5.7: Business development stage
22,7%
55,6%
19,0%
2,4%
0,2%
Less than 5
Between 5 and 20
Between 21 and 50
Between 51 and 100
Over 100
0,7%
11,7%
20,0%
24,0%
0,2%
43,3%
Start-up
Growth
Expanding
Mature
Exit
Unsure
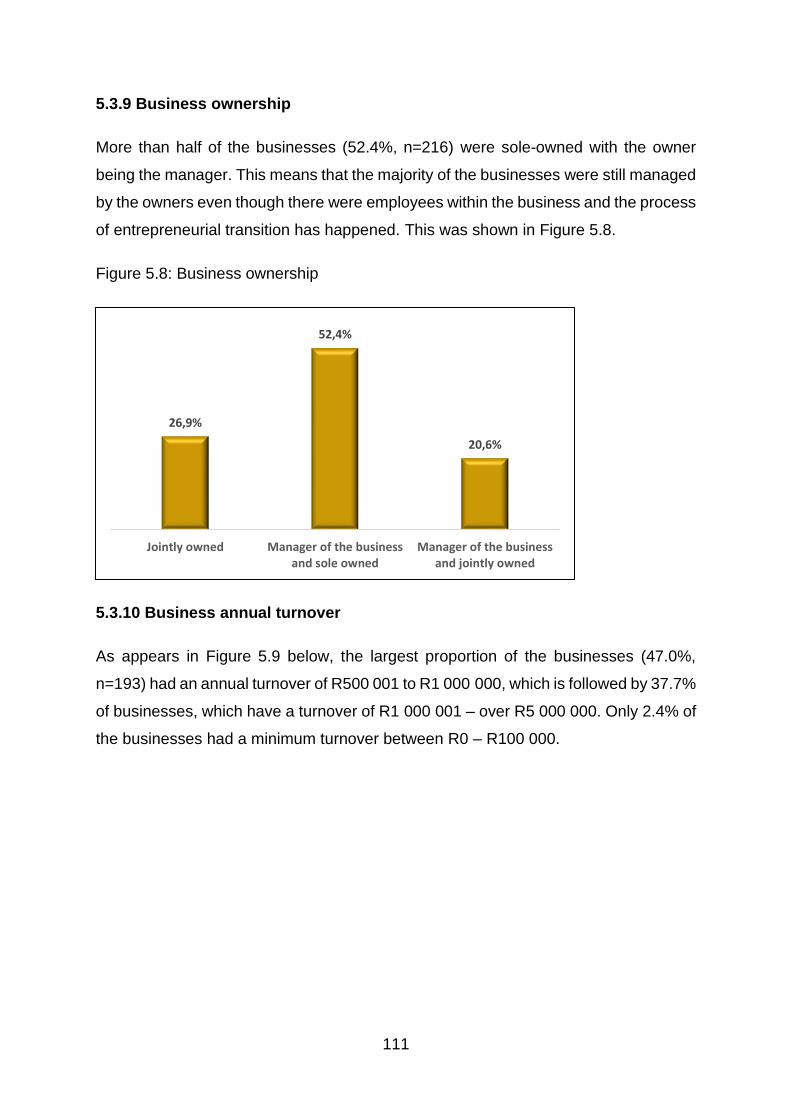
111
5.3.9 Business ownership
More than half of the businesses (52.4%, n=216) were sole-owned with the owner
being the manager. This means that the majority of the businesses were still managed
by the owners even though there were employees within the business and the process
of entrepreneurial transition has happened. This was shown in Figure 5.8.
Figure 5.8: Business ownership
5.3.10 Business annual turnover
As appears in Figure 5.9 below, the largest proportion of the businesses (47.0%,
n=193) had an annual turnover of R500 001 to R1 000 000, which is followed by 37.7%
of businesses, which have a turnover of R1 000 001 – over R5 000 000. Only 2.4% of
the businesses had a minimum turnover between R0 – R100 000.
26,9%
52,4%
20,6%
Jointly owned Manager of the businessand sole owned
Manager of the businessand jointly owned
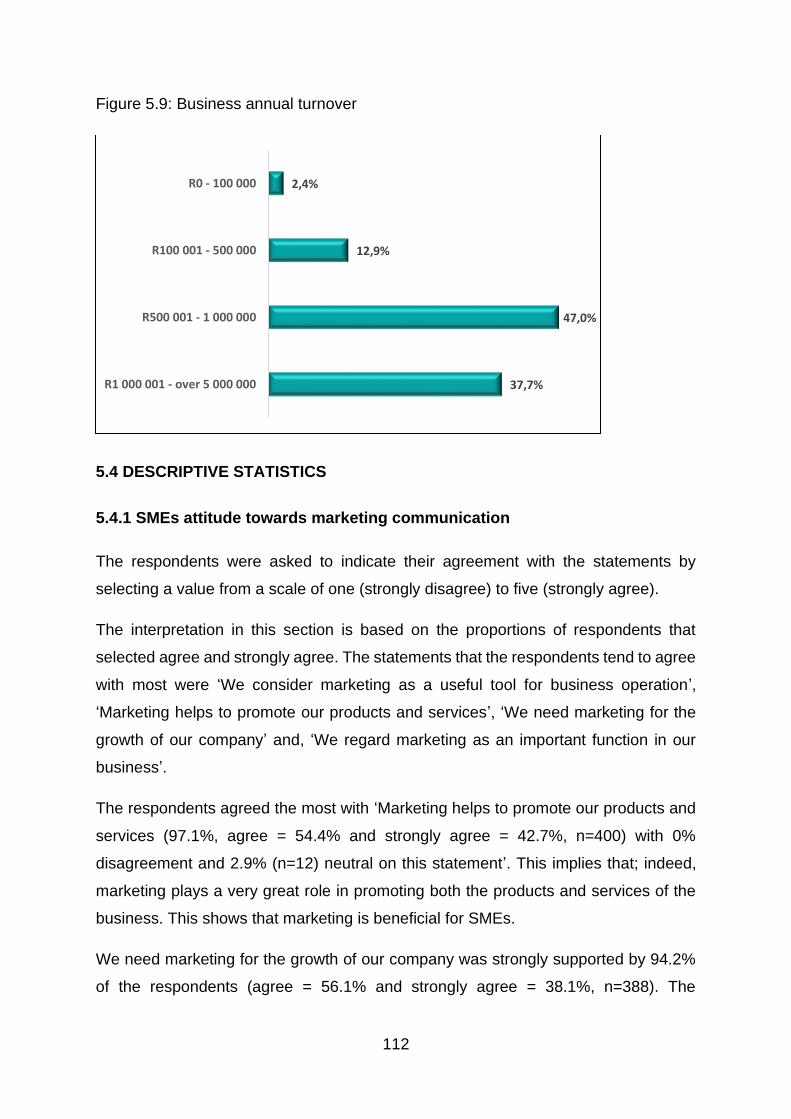
112
Figure 5.9: Business annual turnover
5.4 DESCRIPTIVE STATISTICS
5.4.1 SMEs attitude towards marketing communication
The respondents were asked to indicate their agreement with the statements by
selecting a value from a scale of one (strongly disagree) to five (strongly agree).
The interpretation in this section is based on the proportions of respondents that
selected agree and strongly agree. The statements that the respondents tend to agree
with most were ‘We consider marketing as a useful tool for business operation’,
‘Marketing helps to promote our products and services’, ‘We need marketing for the
growth of our company’ and, ‘We regard marketing as an important function in our
business’.
The respondents agreed the most with ‘Marketing helps to promote our products and
services (97.1%, agree = 54.4% and strongly agree = 42.7%, n=400) with 0%
disagreement and 2.9% (n=12) neutral on this statement’. This implies that; indeed,
marketing plays a very great role in promoting both the products and services of the
business. This shows that marketing is beneficial for SMEs.
We need marketing for the growth of our company was strongly supported by 94.2%
of the respondents (agree = 56.1% and strongly agree = 38.1%, n=388). The
2,4%
12,9%
47,0%
37,7%
R0 - 100 000
R100 001 - 500 000
R500 001 - 1 000 000
R1 000 001 - over 5 000 000
113
statement, ‘We regard marketing as an important function in our business’ was
supported by 93.4% of the respondents (agree = 54.1% and strongly agree = 39.3%,
n= 385). Respondents also agreed/strongly agreed with ‘We consider marketing as a
useful tool for business operation’ (93.2%, agree = 48.1% and strongly agree = 45.1%,
n=384)
On average the statement that the respondents agreed and strongly agreed with the
most were ‘Marketing helps to promote our products and services’ (97.1%). Therefore,
this is apparent that majority of the respondents agree that marketing is a very useful
function in every business regardless of the size or the industry. This enable the
business transactions between customers and businesses to happen, meaning that
for customers to know about the business, business marketing must take place.
SMEs and large businesses use marketing to get the attention of the consumers in
order help their growth (Senthur, Jegatheesam & Sakthi 2013). Zachary, McKenny,
Short and Payne (2011) found that marketing information enables the business to alter
their market offerings to meet the customer preferences, thereby playing a critical role
in the financial performance of the business.
According to the study conducted by Parrott, Azam and Holliman (2010), a direct
relationship between the business size and the application of effective marketing
planning is witnessed, and this results in a constructive relationship between the
evaluation of marketing activities and business growth. Though the growth of the
business is influenced by several other factors within the business, the relationship
between the business and its customers attests the worth of the marketing function in
attaining improved business results (Vilnius & Vitautas 2008)
There are three statements that the respondents tends to disagree/strongly disagree
with, which were: ‘we are doing well without marketing; marketing is an unnecessary
burden on our business, and we are yet to experience the benefits of marketing’.
86.2% (disagree = 48.3% and strongly disagree = 37.9%, n= 355) of the respondents
shows that marketing has a tremendous impact on the business by disagreeing with
the statement that state ‘we are doing well without marketing’ on the other side 79.4%
(disagree = 54.9% and strongly disagree = 24.5%, n= 327) disagreed that ‘marketing
is an unnecessary burden on our business’ however 19.7% of the respondents neither
114
agree or disagree with the statement. This simply support that there is no business
without marketing.
The principle of the marketing concept articulates that business realises success by
defining and satisfying the needs and wants of the target markets. Therefore, SMEs
need to regularly transform and appraise their business operations, this makes it vital
as market knowledge separates the victors from the losers (Marjanova & Stojanovski
2012). SMEs need to have the capacity to continuously change and update the way
they operate their businesses. This makes it vital to be market-driven when launching
a product since market knowledge differentiates the winners from the losers. Walsh
and Lipinski (2009) emphasise that marketing functions contributed to the success of
SMEs and the capability to think tactically.
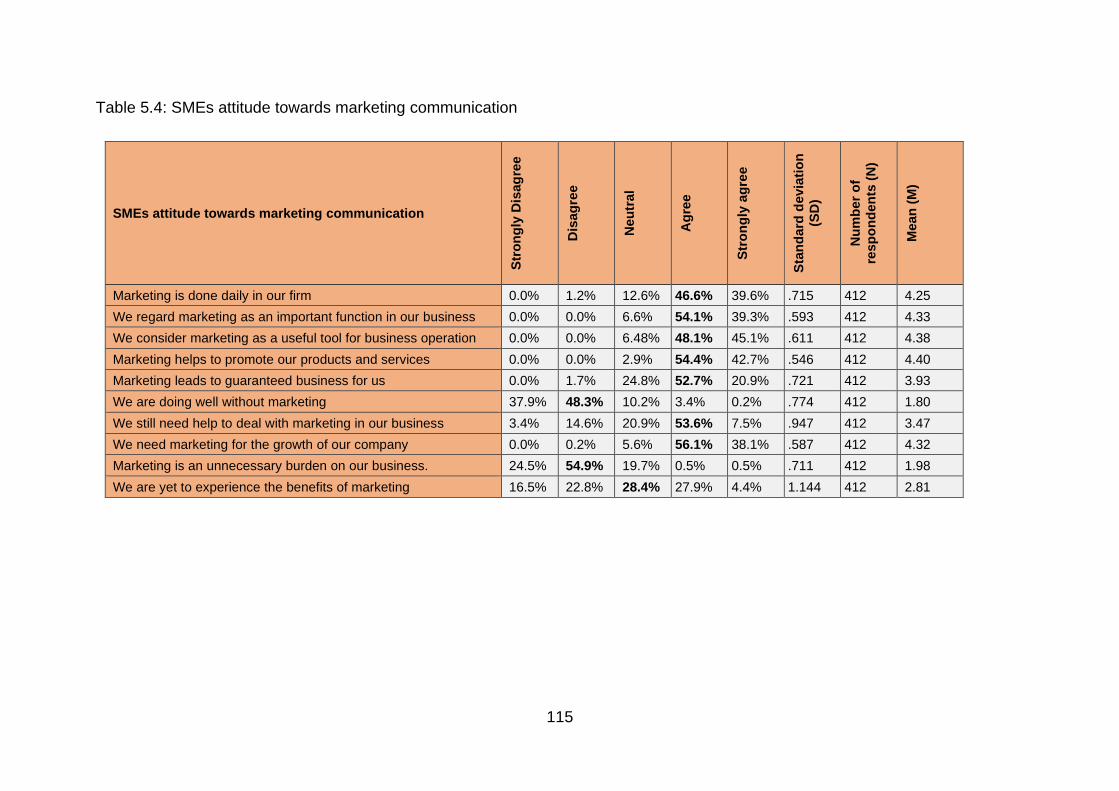
115
Table 5.4: SMEs attitude towards marketing communication
SMEs attitude towards marketing communication
Str
on
gly
Dis
ag
ree
Dis
ag
ree
Neu
tral
Ag
ree
Str
on
gly
ag
ree
Sta
nd
ard
devia
tio
n
(SD
)
Nu
mb
er
of
resp
on
den
ts (
N)
Mean
(M
)
Marketing is done daily in our firm 0.0% 1.2% 12.6% 46.6% 39.6% .715 412 4.25
We regard marketing as an important function in our business 0.0% 0.0% 6.6% 54.1% 39.3% .593 412 4.33
We consider marketing as a useful tool for business operation 0.0% 0.0% 6.48% 48.1% 45.1% .611 412 4.38
Marketing helps to promote our products and services 0.0% 0.0% 2.9% 54.4% 42.7% .546 412 4.40
Marketing leads to guaranteed business for us 0.0% 1.7% 24.8% 52.7% 20.9% .721 412 3.93
We are doing well without marketing 37.9% 48.3% 10.2% 3.4% 0.2% .774 412 1.80
We still need help to deal with marketing in our business 3.4% 14.6% 20.9% 53.6% 7.5% .947 412 3.47
We need marketing for the growth of our company 0.0% 0.2% 5.6% 56.1% 38.1% .587 412 4.32
Marketing is an unnecessary burden on our business. 24.5% 54.9% 19.7% 0.5% 0.5% .711 412 1.98
We are yet to experience the benefits of marketing 16.5% 22.8% 28.4% 27.9% 4.4% 1.144 412 2.81
116
5.4.2 Marketing strategies (product strategies and marketing communication
strategies) adopted by SMEs in Polokwane
This section is divided into two sections: The adoption of marketing communication
strategies and product strategies whereby the respondents were also asked to indicate
their agreement or disagreement with both the marketing communication and product
strategies statements by selecting a value from a scale of one (strongly disagree) to
five (strongly agree). The two were discussed respectively, see also Table 5.5 and
Table 5.6
5.4.2.1 Marketing Communication Strategy
The respondents were asked to indicate their agreement or disagreement with the
statements regarding the marketing communication strategy by selecting a value from
a scale of one (strongly disagree) to five (strongly agree).
There were statements that the respondents tend to agree and strongly agree with the
most, which are; ‘We give out business cards’ (98.8%= agree 30.6% and strongly
agree 68.2%, n=407);’ Marketing communication helps us build a strong brand identity’
(97.6%=agree 46.1% and strongly agree 51.5%, n=402); ‘Marketing communication
helps us to build relationships with customers (98%= agree 62.1% and strongly agree
35.9%, n=404); We distribute flyers and leaflets (97.5%, agree 25.7% and strongly
agree 71.8%, n=402) and ‘Brochures are handed out as part of communications with
our customers’ (95.2%= agree 65.8% and strongly agree 29.4%, n=392).Respondents
agree/strongly agree that ‘word-of-mouth influences customer decision making’
(93.2%, agree 57.5 and strongly agree 35.7%, n=384). We use social media to
communicate our special offers 93.2% (agree 42.2% and strongly agree 51%, n=384).
Consumers are living in times where social media plays a great role of information
circulations, as a result most of the businesses are engaging with customers through
the use of social medias like Twitter and Facebook. ‘Networking helps us expand our
business’s ability to grow’ 91.6% (agree 54.9% and strongly agree 36.7%, n=377).
The statement ‘We prefer word of mouth advertising’ 90.1% (agree 49.8% and strongly
agree 40.3%, n=371) shows that word of mouth plays an important role for every
business whereby advertisements are run without any payments from the business. It
is common that most of the people have been introduced to other products through
117
word-of-mouth and majority made the purchases (Resnick, Cheng, Simpson and
Lourenco 2016).
There were only two statements that respondents tend to disagree with: We believe
that telemarketing is not an appropriate tool for SMEs since it involves too much money
68.4% (disagree 41.5% and strongly disagree 26.9%, n = 280), while 21% neither
agree nor disagree with the statement (neutral 21.1%, n=87). We make use of national
advertising 47.5% (disagree 38.3% and strongly disagree 9.2%, n=377), while the
once who neither agree nor disagree is 28.4% (neutral 28.4%, n=117). This implies
that majority of the SMEs does not use national advertising and they also believe that
telemarketing can yield positive results for the SMEs.
Table 5.5 shows the adoption of marketing communication strategies.
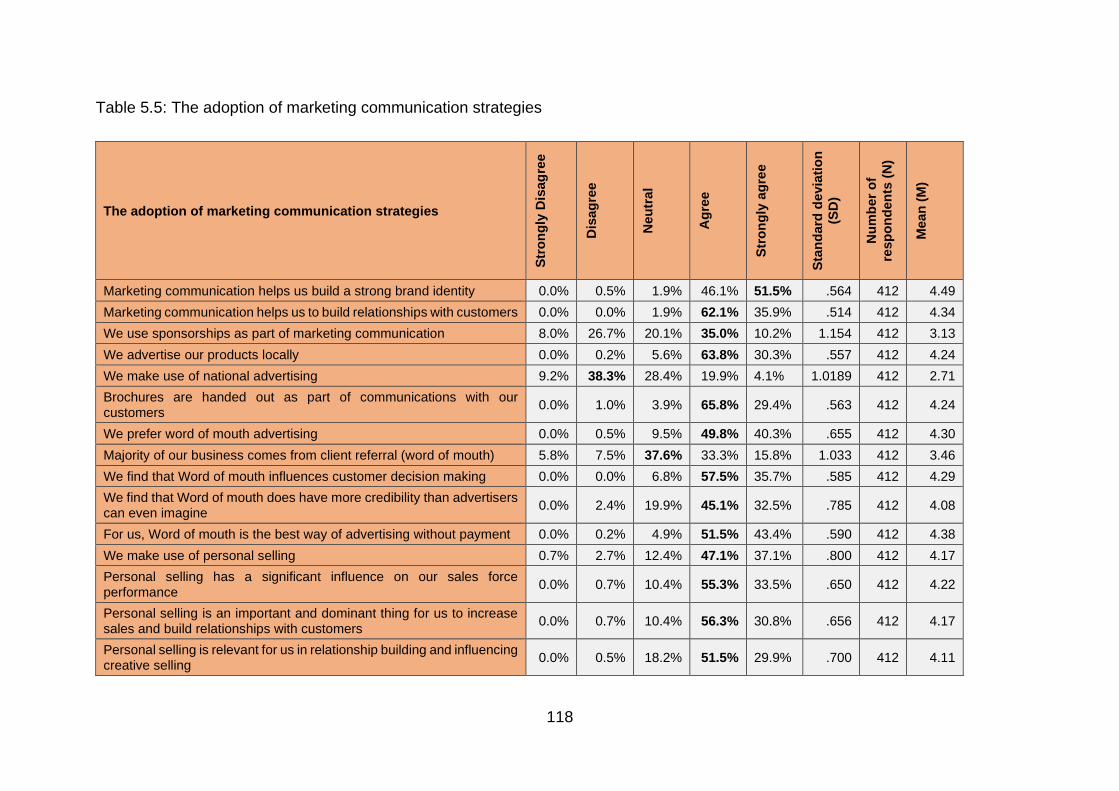
118
Table 5.5: The adoption of marketing communication strategies
The adoption of marketing communication strategies
Str
on
gly
Dis
ag
ree
Dis
ag
ree
Neu
tral
Ag
ree
Str
on
gly
ag
ree
Sta
nd
ard
devia
tio
n
(SD
)
Nu
mb
er
of
resp
on
den
ts (
N)
Mean
(M
)
Marketing communication helps us build a strong brand identity 0.0% 0.5% 1.9% 46.1% 51.5% .564 412 4.49
Marketing communication helps us to build relationships with customers 0.0% 0.0% 1.9% 62.1% 35.9% .514 412 4.34
We use sponsorships as part of marketing communication 8.0% 26.7% 20.1% 35.0% 10.2% 1.154 412 3.13
We advertise our products locally 0.0% 0.2% 5.6% 63.8% 30.3% .557 412 4.24
We make use of national advertising 9.2% 38.3% 28.4% 19.9% 4.1% 1.0189 412 2.71
Brochures are handed out as part of communications with our customers
0.0% 1.0% 3.9% 65.8% 29.4% .563 412 4.24
We prefer word of mouth advertising 0.0% 0.5% 9.5% 49.8% 40.3% .655 412 4.30
Majority of our business comes from client referral (word of mouth) 5.8% 7.5% 37.6% 33.3% 15.8% 1.033 412 3.46
We find that Word of mouth influences customer decision making 0.0% 0.0% 6.8% 57.5% 35.7% .585 412 4.29
We find that Word of mouth does have more credibility than advertisers can even imagine
0.0% 2.4% 19.9% 45.1% 32.5% .785 412 4.08
For us, Word of mouth is the best way of advertising without payment 0.0% 0.2% 4.9% 51.5% 43.4% .590 412 4.38
We make use of personal selling 0.7% 2.7% 12.4% 47.1% 37.1% .800 412 4.17
Personal selling has a significant influence on our sales force performance
0.0% 0.7% 10.4% 55.3% 33.5% .650 412 4.22
Personal selling is an important and dominant thing for us to increase sales and build relationships with customers
0.0% 0.7% 10.4% 56.3% 30.8% .656 412 4.17
Personal selling is relevant for us in relationship building and influencing creative selling
0.0% 0.5% 18.2% 51.5% 29.9% .700 412 4.11
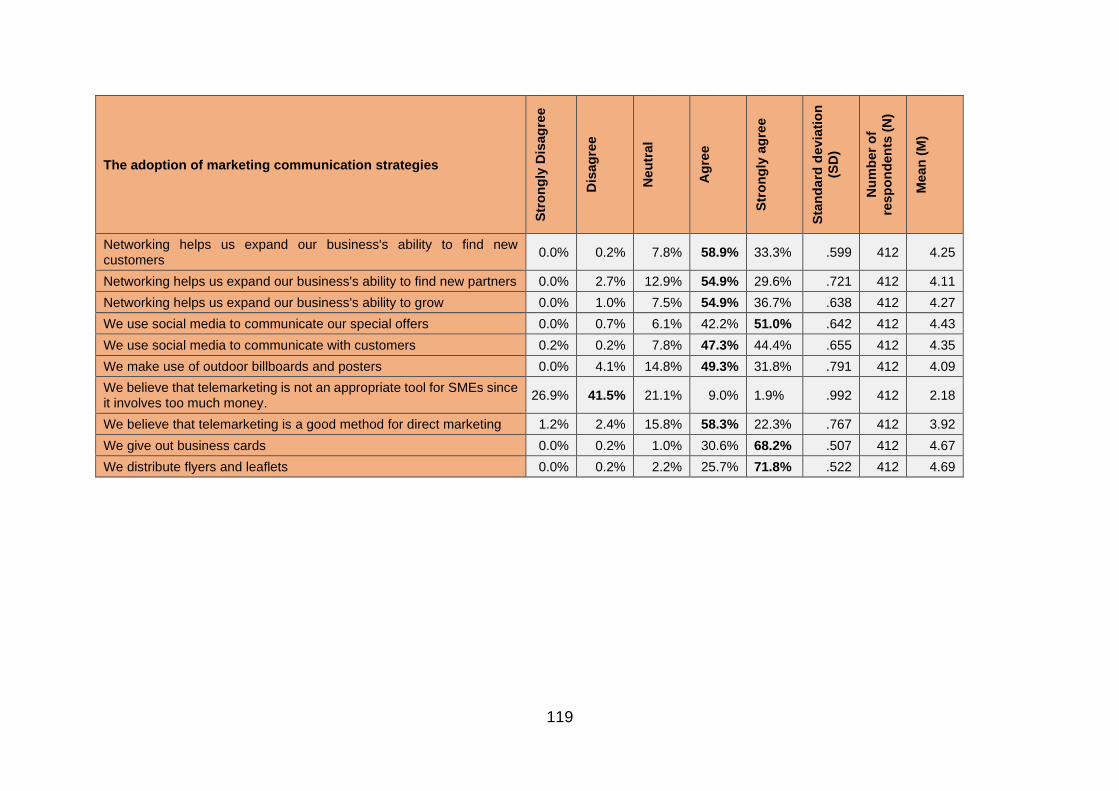
119
The adoption of marketing communication strategies
Str
on
gly
Dis
ag
ree
Dis
ag
ree
Neu
tral
Ag
ree
Str
on
gly
ag
ree
Sta
nd
ard
devia
tio
n
(SD
)
Nu
mb
er
of
resp
on
den
ts (
N)
Mean
(M
)
Networking helps us expand our business's ability to find new customers
0.0% 0.2% 7.8% 58.9% 33.3% .599 412 4.25
Networking helps us expand our business's ability to find new partners 0.0% 2.7% 12.9% 54.9% 29.6% .721 412 4.11
Networking helps us expand our business's ability to grow 0.0% 1.0% 7.5% 54.9% 36.7% .638 412 4.27
We use social media to communicate our special offers 0.0% 0.7% 6.1% 42.2% 51.0% .642 412 4.43
We use social media to communicate with customers 0.2% 0.2% 7.8% 47.3% 44.4% .655 412 4.35
We make use of outdoor billboards and posters 0.0% 4.1% 14.8% 49.3% 31.8% .791 412 4.09
We believe that telemarketing is not an appropriate tool for SMEs since it involves too much money.
26.9% 41.5% 21.1% 9.0% 1.9% .992 412 2.18
We believe that telemarketing is a good method for direct marketing 1.2% 2.4% 15.8% 58.3% 22.3% .767 412 3.92
We give out business cards 0.0% 0.2% 1.0% 30.6% 68.2% .507 412 4.67
We distribute flyers and leaflets 0.0% 0.2% 2.2% 25.7% 71.8% .522 412 4.69
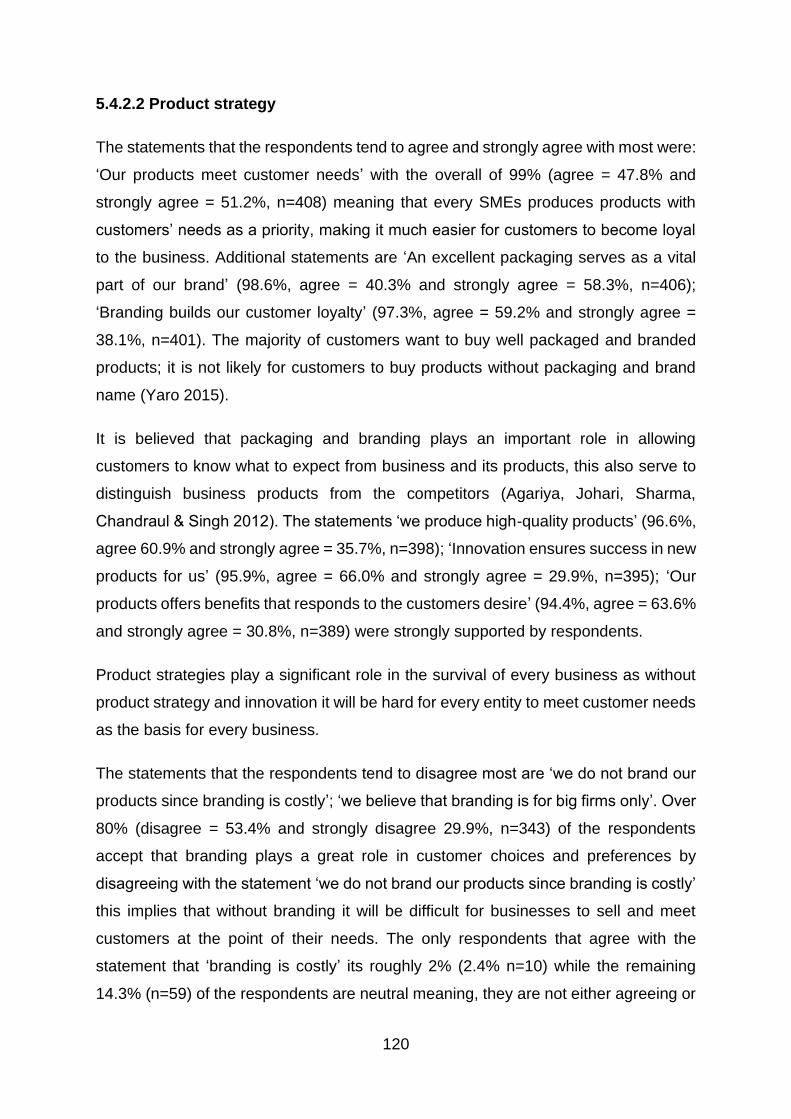
120
5.4.2.2 Product strategy
The statements that the respondents tend to agree and strongly agree with most were:
‘Our products meet customer needs’ with the overall of 99% (agree = 47.8% and
strongly agree = 51.2%, n=408) meaning that every SMEs produces products with
customers’ needs as a priority, making it much easier for customers to become loyal
to the business. Additional statements are ‘An excellent packaging serves as a vital
part of our brand’ (98.6%, agree = 40.3% and strongly agree = 58.3%, n=406);
‘Branding builds our customer loyalty’ (97.3%, agree = 59.2% and strongly agree =
38.1%, n=401). The majority of customers want to buy well packaged and branded
products; it is not likely for customers to buy products without packaging and brand
name (Yaro 2015).
It is believed that packaging and branding plays an important role in allowing
customers to know what to expect from business and its products, this also serve to
distinguish business products from the competitors (Agariya, Johari, Sharma,
Chandraul & Singh 2012). The statements ‘we produce high-quality products’ (96.6%,
agree 60.9% and strongly agree = 35.7%, n=398); ‘Innovation ensures success in new
products for us’ (95.9%, agree = 66.0% and strongly agree = 29.9%, n=395); ‘Our
products offers benefits that responds to the customers desire’ (94.4%, agree = 63.6%
and strongly agree = 30.8%, n=389) were strongly supported by respondents.
Product strategies play a significant role in the survival of every business as without
product strategy and innovation it will be hard for every entity to meet customer needs
as the basis for every business.
The statements that the respondents tend to disagree most are ‘we do not brand our
products since branding is costly’; ‘we believe that branding is for big firms only’. Over
80% (disagree = 53.4% and strongly disagree 29.9%, n=343) of the respondents
accept that branding plays a great role in customer choices and preferences by
disagreeing with the statement ‘we do not brand our products since branding is costly’
this implies that without branding it will be difficult for businesses to sell and meet
customers at the point of their needs. The only respondents that agree with the
statement that ‘branding is costly’ its roughly 2% (2.4% n=10) while the remaining
14.3% (n=59) of the respondents are neutral meaning, they are not either agreeing or

121
disagreeing with the statement ‘we believe that branding is for big firms only’ was
supported by 83% of the respondents (disagree = 48.8% and strongly disagree =
34.2%, n=342). This shows that regardless of the business size or even the years of
operation it is necessary for businesses to have brands for the offered products as
part of the product identity. Table 5.6 showed the adoption of product strategies.
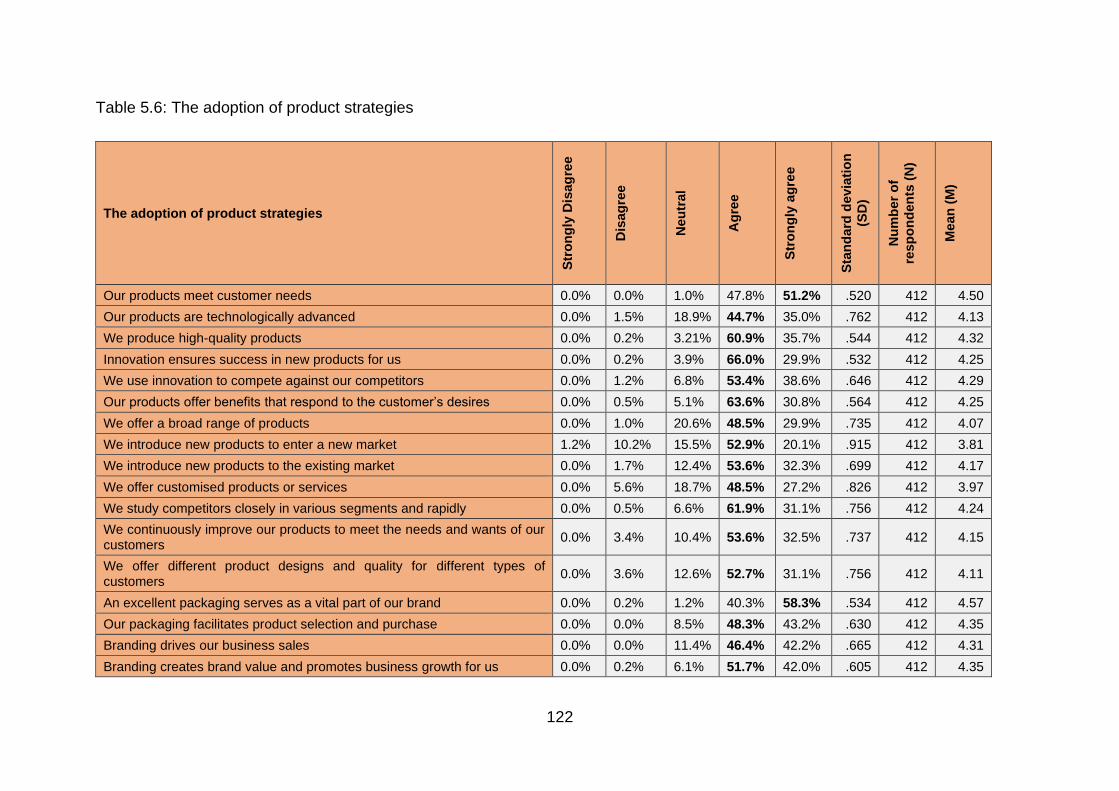
122
Table 5.6: The adoption of product strategies
The adoption of product strategies
Str
on
gly
Dis
ag
ree
Dis
ag
ree
Neu
tral
Ag
ree
Str
on
gly
ag
ree
Sta
nd
ard
devia
tio
n
(SD
)
Nu
mb
er
of
resp
on
den
ts (
N)
Mean
(M
)
Our products meet customer needs 0.0% 0.0% 1.0% 47.8% 51.2% .520 412 4.50
Our products are technologically advanced 0.0% 1.5% 18.9% 44.7% 35.0% .762 412 4.13
We produce high-quality products 0.0% 0.2% 3.21% 60.9% 35.7% .544 412 4.32
Innovation ensures success in new products for us 0.0% 0.2% 3.9% 66.0% 29.9% .532 412 4.25
We use innovation to compete against our competitors 0.0% 1.2% 6.8% 53.4% 38.6% .646 412 4.29
Our products offer benefits that respond to the customer’s desires 0.0% 0.5% 5.1% 63.6% 30.8% .564 412 4.25
We offer a broad range of products 0.0% 1.0% 20.6% 48.5% 29.9% .735 412 4.07
We introduce new products to enter a new market 1.2% 10.2% 15.5% 52.9% 20.1% .915 412 3.81
We introduce new products to the existing market 0.0% 1.7% 12.4% 53.6% 32.3% .699 412 4.17
We offer customised products or services 0.0% 5.6% 18.7% 48.5% 27.2% .826 412 3.97
We study competitors closely in various segments and rapidly 0.0% 0.5% 6.6% 61.9% 31.1% .756 412 4.24
We continuously improve our products to meet the needs and wants of our customers
0.0% 3.4% 10.4% 53.6% 32.5% .737 412 4.15
We offer different product designs and quality for different types of customers
0.0% 3.6% 12.6% 52.7% 31.1% .756 412 4.11
An excellent packaging serves as a vital part of our brand 0.0% 0.2% 1.2% 40.3% 58.3% .534 412 4.57
Our packaging facilitates product selection and purchase 0.0% 0.0% 8.5% 48.3% 43.2% .630 412 4.35
Branding drives our business sales 0.0% 0.0% 11.4% 46.4% 42.2% .665 412 4.31
Branding creates brand value and promotes business growth for us 0.0% 0.2% 6.1% 51.7% 42.0% .605 412 4.35
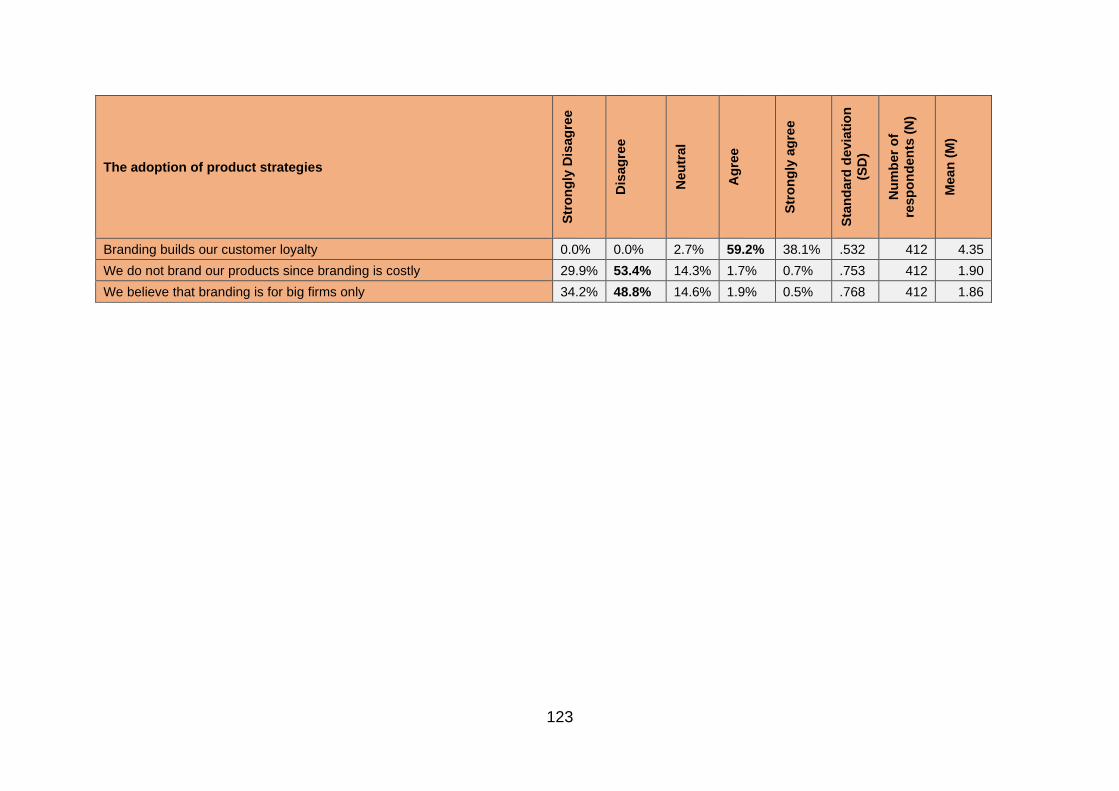
123
The adoption of product strategies
Str
on
gly
Dis
ag
ree
Dis
ag
ree
Neu
tral
Ag
ree
Str
on
gly
ag
ree
Sta
nd
ard
devia
tio
n
(SD
)
Nu
mb
er
of
resp
on
den
ts (
N)
Mean
(M
)
Branding builds our customer loyalty 0.0% 0.0% 2.7% 59.2% 38.1% .532 412 4.35
We do not brand our products since branding is costly 29.9% 53.4% 14.3% 1.7% 0.7% .753 412 1.90
We believe that branding is for big firms only 34.2% 48.8% 14.6% 1.9% 0.5% .768 412 1.86
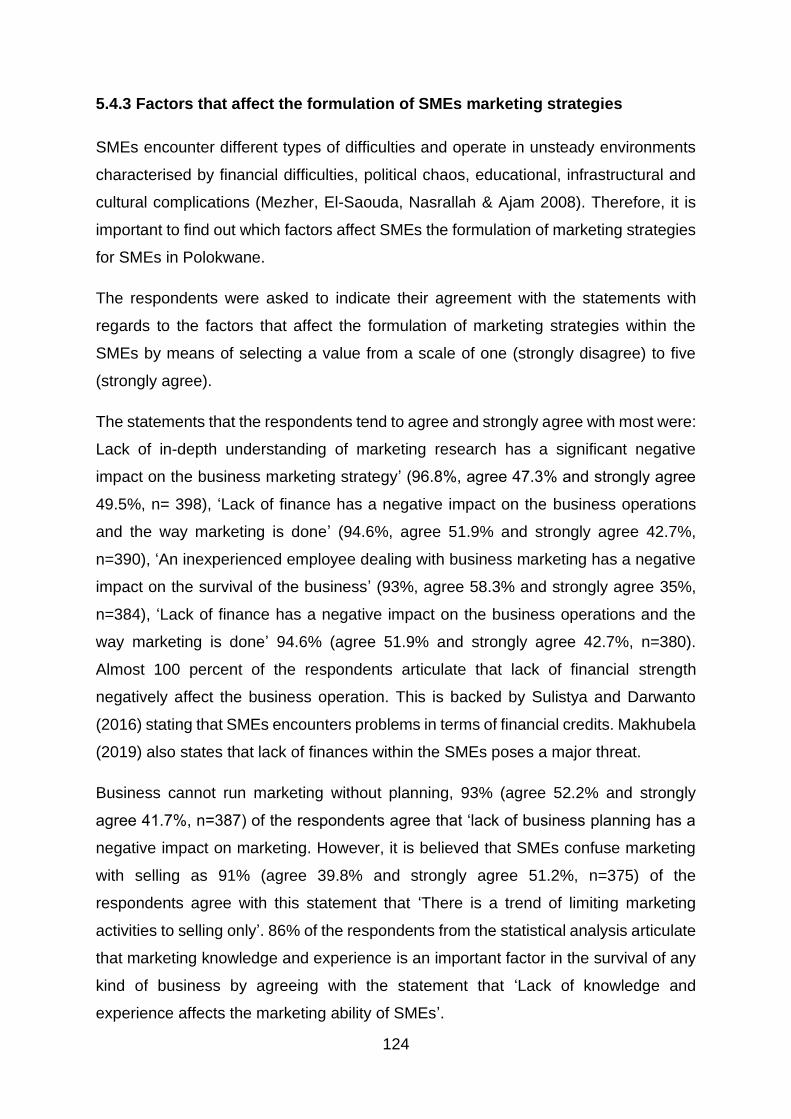
124
5.4.3 Factors that affect the formulation of SMEs marketing strategies
SMEs encounter different types of difficulties and operate in unsteady environments
characterised by financial difficulties, political chaos, educational, infrastructural and
cultural complications (Mezher, El-Saouda, Nasrallah & Ajam 2008). Therefore, it is
important to find out which factors affect SMEs the formulation of marketing strategies
for SMEs in Polokwane.
The respondents were asked to indicate their agreement with the statements with
regards to the factors that affect the formulation of marketing strategies within the
SMEs by means of selecting a value from a scale of one (strongly disagree) to five
(strongly agree).
The statements that the respondents tend to agree and strongly agree with most were:
Lack of in-depth understanding of marketing research has a significant negative
impact on the business marketing strategy’ (96.8%, agree 47.3% and strongly agree
49.5%, n= 398), ‘Lack of finance has a negative impact on the business operations
and the way marketing is done’ (94.6%, agree 51.9% and strongly agree 42.7%,
n=390), ‘An inexperienced employee dealing with business marketing has a negative
impact on the survival of the business’ (93%, agree 58.3% and strongly agree 35%,
n=384), ‘Lack of finance has a negative impact on the business operations and the
way marketing is done’ 94.6% (agree 51.9% and strongly agree 42.7%, n=380).
Almost 100 percent of the respondents articulate that lack of financial strength
negatively affect the business operation. This is backed by Sulistya and Darwanto
(2016) stating that SMEs encounters problems in terms of financial credits. Makhubela
(2019) also states that lack of finances within the SMEs poses a major threat.
Business cannot run marketing without planning, 93% (agree 52.2% and strongly
agree 41.7%, n=387) of the respondents agree that ‘lack of business planning has a
negative impact on marketing. However, it is believed that SMEs confuse marketing
with selling as 91% (agree 39.8% and strongly agree 51.2%, n=375) of the
respondents agree with this statement that ‘There is a trend of limiting marketing
activities to selling only’. 86% of the respondents from the statistical analysis articulate
that marketing knowledge and experience is an important factor in the survival of any
kind of business by agreeing with the statement that ‘Lack of knowledge and
experience affects the marketing ability of SMEs’.
125
‘Lack of knowledge and experience affects the marketing ability of SMEs’ 86% (agree
57.5% and strongly agree 28.9%, n=356) this indicates that majority of the
respondents lack marketing knowledge. Kamunge et al. (2014) mentioned that even if
SMEs might have knowledge on how to run a business if there are no marketing
communication knowledge and skills the business will still fail. ‘Inability to analyse and
capture market opportunities is one of the problems facing small business marketing’
78.9% (agree 51.0% and strongly agree 27.9%, n=325) agree to this statement. Table
5.7 shows the common factors that affects the formulation of SMEs marketing
strategies
.
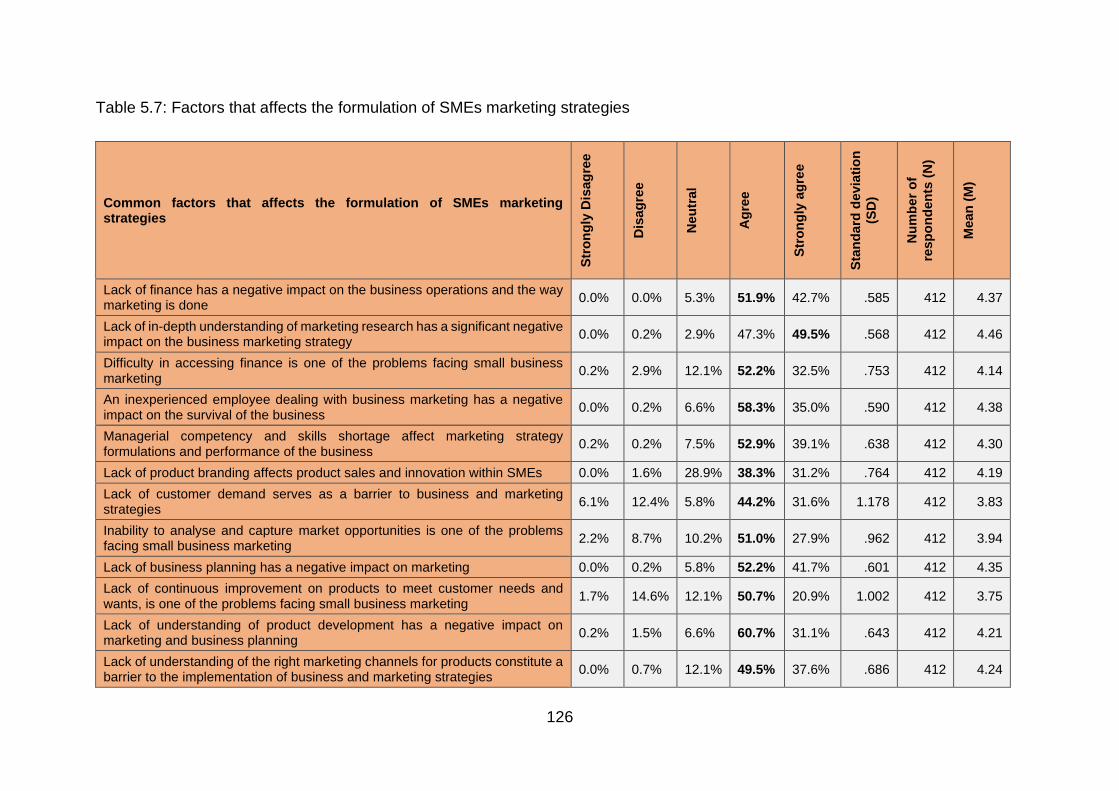
126
Table 5.7: Factors that affects the formulation of SMEs marketing strategies
Common factors that affects the formulation of SMEs marketing strategies
Str
on
gly
Dis
ag
ree
Dis
ag
ree
Neu
tral
Ag
ree
Str
on
gly
ag
ree
Sta
nd
ard
devia
tio
n
(SD
)
Nu
mb
er
of
resp
on
den
ts (
N)
Mean
(M
)
Lack of finance has a negative impact on the business operations and the way marketing is done
0.0% 0.0% 5.3% 51.9% 42.7% .585 412 4.37
Lack of in-depth understanding of marketing research has a significant negative impact on the business marketing strategy
0.0% 0.2% 2.9% 47.3% 49.5% .568 412 4.46
Difficulty in accessing finance is one of the problems facing small business marketing
0.2% 2.9% 12.1% 52.2% 32.5% .753 412 4.14
An inexperienced employee dealing with business marketing has a negative impact on the survival of the business
0.0% 0.2% 6.6% 58.3% 35.0% .590 412 4.38
Managerial competency and skills shortage affect marketing strategy formulations and performance of the business
0.2% 0.2% 7.5% 52.9% 39.1% .638 412 4.30
Lack of product branding affects product sales and innovation within SMEs 0.0% 1.6% 28.9% 38.3% 31.2% .764 412 4.19
Lack of customer demand serves as a barrier to business and marketing strategies
6.1% 12.4% 5.8% 44.2% 31.6% 1.178 412 3.83
Inability to analyse and capture market opportunities is one of the problems facing small business marketing
2.2% 8.7% 10.2% 51.0% 27.9% .962 412 3.94
Lack of business planning has a negative impact on marketing 0.0% 0.2% 5.8% 52.2% 41.7% .601 412 4.35
Lack of continuous improvement on products to meet customer needs and wants, is one of the problems facing small business marketing
1.7% 14.6% 12.1% 50.7% 20.9% 1.002 412 3.75
Lack of understanding of product development has a negative impact on marketing and business planning
0.2% 1.5% 6.6% 60.7% 31.1% .643 412 4.21
Lack of understanding of the right marketing channels for products constitute a barrier to the implementation of business and marketing strategies
0.0% 0.7% 12.1% 49.5% 37.6% .686 412 4.24
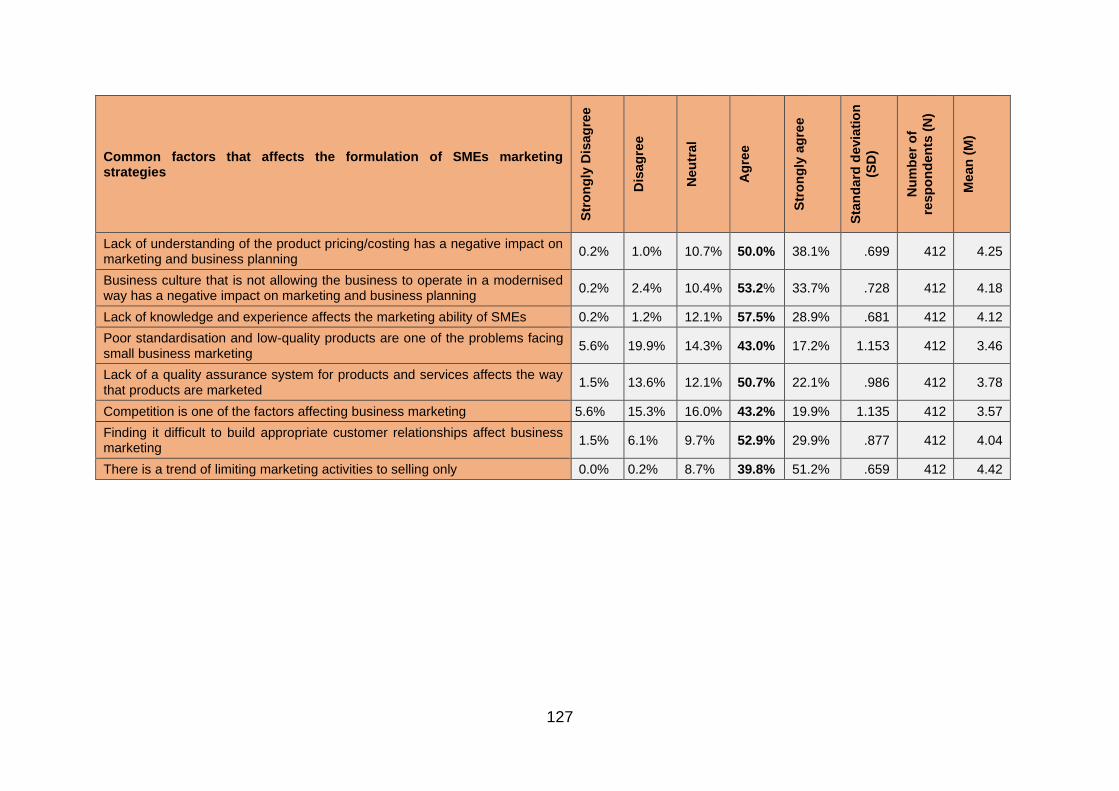
127
Common factors that affects the formulation of SMEs marketing strategies
Str
on
gly
Dis
ag
ree
Dis
ag
ree
Neu
tral
Ag
ree
Str
on
gly
ag
ree
Sta
nd
ard
devia
tio
n
(SD
)
Nu
mb
er
of
resp
on
den
ts (
N)
Mean
(M
)
Lack of understanding of the product pricing/costing has a negative impact on marketing and business planning
0.2% 1.0% 10.7% 50.0% 38.1% .699 412 4.25
Business culture that is not allowing the business to operate in a modernised way has a negative impact on marketing and business planning
0.2% 2.4% 10.4% 53.2% 33.7% .728 412 4.18
Lack of knowledge and experience affects the marketing ability of SMEs 0.2% 1.2% 12.1% 57.5% 28.9% .681 412 4.12
Poor standardisation and low-quality products are one of the problems facing small business marketing
5.6% 19.9% 14.3% 43.0% 17.2% 1.153 412 3.46
Lack of a quality assurance system for products and services affects the way that products are marketed
1.5% 13.6% 12.1% 50.7% 22.1% .986 412 3.78
Competition is one of the factors affecting business marketing 5.6% 15.3% 16.0% 43.2% 19.9% 1.135 412 3.57
Finding it difficult to build appropriate customer relationships affect business marketing
1.5% 6.1% 9.7% 52.9% 29.9% .877 412 4.04
There is a trend of limiting marketing activities to selling only 0.0% 0.2% 8.7% 39.8% 51.2% .659 412 4.42
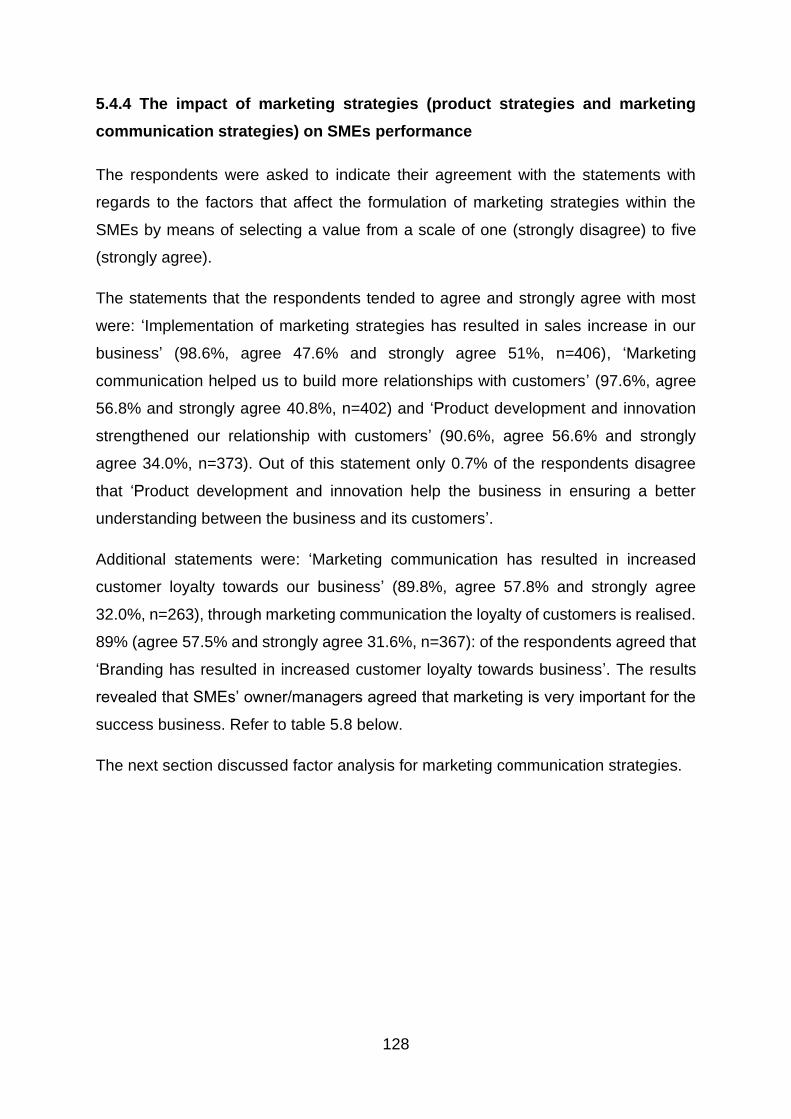
128
5.4.4 The impact of marketing strategies (product strategies and marketing
communication strategies) on SMEs performance
The respondents were asked to indicate their agreement with the statements with
regards to the factors that affect the formulation of marketing strategies within the
SMEs by means of selecting a value from a scale of one (strongly disagree) to five
(strongly agree).
The statements that the respondents tended to agree and strongly agree with most
were: ‘Implementation of marketing strategies has resulted in sales increase in our
business’ (98.6%, agree 47.6% and strongly agree 51%, n=406), ‘Marketing
communication helped us to build more relationships with customers’ (97.6%, agree
56.8% and strongly agree 40.8%, n=402) and ‘Product development and innovation
strengthened our relationship with customers’ (90.6%, agree 56.6% and strongly
agree 34.0%, n=373). Out of this statement only 0.7% of the respondents disagree
that ‘Product development and innovation help the business in ensuring a better
understanding between the business and its customers’.
Additional statements were: ‘Marketing communication has resulted in increased
customer loyalty towards our business’ (89.8%, agree 57.8% and strongly agree
32.0%, n=263), through marketing communication the loyalty of customers is realised.
89% (agree 57.5% and strongly agree 31.6%, n=367): of the respondents agreed that
‘Branding has resulted in increased customer loyalty towards business’. The results
revealed that SMEs’ owner/managers agreed that marketing is very important for the
success business. Refer to table 5.8 below.
The next section discussed factor analysis for marketing communication strategies.
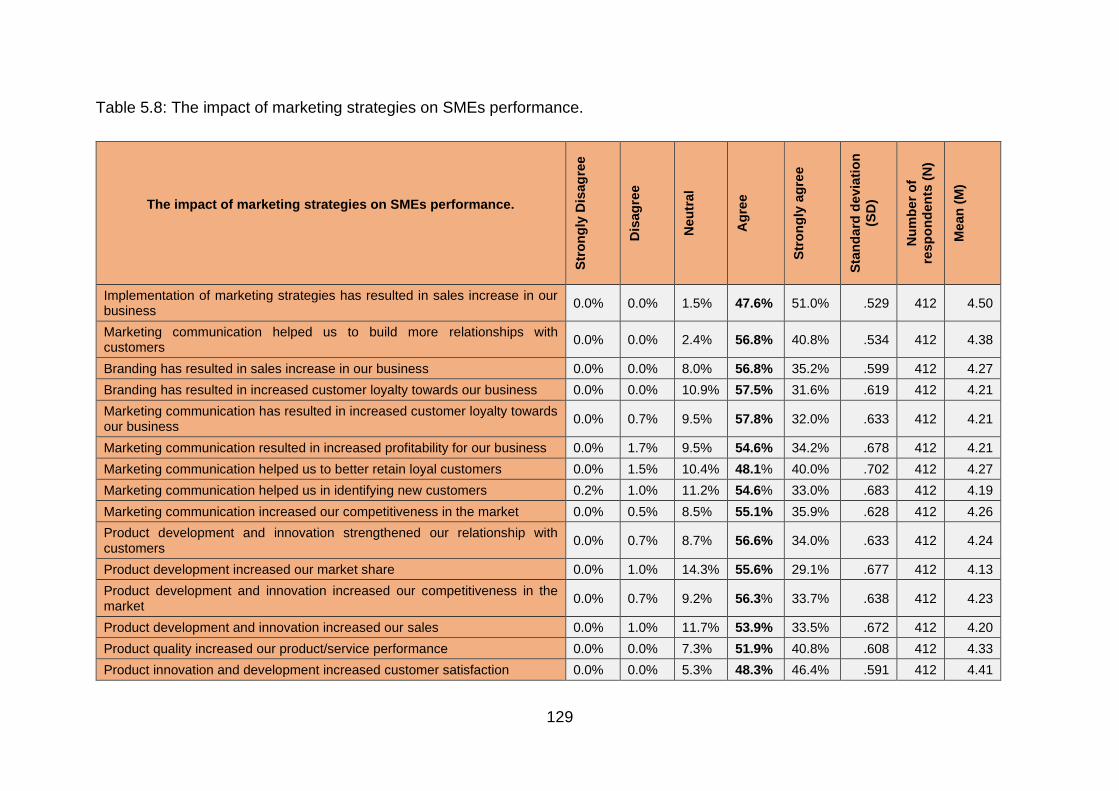
129
Table 5.8: The impact of marketing strategies on SMEs performance.
The impact of marketing strategies on SMEs performance.
Str
on
gly
Dis
ag
ree
Dis
ag
ree
Neu
tral
Ag
ree
Str
on
gly
ag
ree
Sta
nd
ard
devia
tio
n
(SD
)
Nu
mb
er
of
resp
on
den
ts (
N)
Mean
(M
)
Implementation of marketing strategies has resulted in sales increase in our business
0.0% 0.0% 1.5% 47.6% 51.0% .529 412 4.50
Marketing communication helped us to build more relationships with customers
0.0% 0.0% 2.4% 56.8% 40.8% .534 412 4.38
Branding has resulted in sales increase in our business 0.0% 0.0% 8.0% 56.8% 35.2% .599 412 4.27
Branding has resulted in increased customer loyalty towards our business 0.0% 0.0% 10.9% 57.5% 31.6% .619 412 4.21
Marketing communication has resulted in increased customer loyalty towards our business
0.0% 0.7% 9.5% 57.8% 32.0% .633 412 4.21
Marketing communication resulted in increased profitability for our business 0.0% 1.7% 9.5% 54.6% 34.2% .678 412 4.21
Marketing communication helped us to better retain loyal customers 0.0% 1.5% 10.4% 48.1% 40.0% .702 412 4.27
Marketing communication helped us in identifying new customers 0.2% 1.0% 11.2% 54.6% 33.0% .683 412 4.19
Marketing communication increased our competitiveness in the market 0.0% 0.5% 8.5% 55.1% 35.9% .628 412 4.26
Product development and innovation strengthened our relationship with customers
0.0% 0.7% 8.7% 56.6% 34.0% .633 412 4.24
Product development increased our market share 0.0% 1.0% 14.3% 55.6% 29.1% .677 412 4.13
Product development and innovation increased our competitiveness in the market
0.0% 0.7% 9.2% 56.3% 33.7% .638 412 4.23
Product development and innovation increased our sales 0.0% 1.0% 11.7% 53.9% 33.5% .672 412 4.20
Product quality increased our product/service performance 0.0% 0.0% 7.3% 51.9% 40.8% .608 412 4.33
Product innovation and development increased customer satisfaction 0.0% 0.0% 5.3% 48.3% 46.4% .591 412 4.41
130
5.5 FACTOR ANALYSIS: MARKETING COMMUNICATION STRATEGIES
Factor analysis (FA) is defined as an investigative technique applied to an established
variable that tries to find the subsets of variables from which the observed variables
were made (Field 2000). To lessen the dimensionality of the data, principle component
analysis (PCA) with IBM, SPSS Statistics 26 was used to study patterns of
relationships among the questions used to elicit the respondents’ perceptions
regarding the marketing communications in their businesses.
The factorability of the correlation matrix was investigated using Pearson’s product-
moment correlation coefficient. Preliminary distribution analyses indicated that the
assumptions of normality, linearity and homoscedasticity were not violated.
5.5.1 Sample adequacy
Exploratory factor analysis (EFA) is defined as finding few substantial and new
variables by considering the relations amongst the variables by merging quite a few
interconnected variables (Altunisik, Coşkun, Bayraktaroglu & Yildirim 2005). While the
PCA basically tries to scientifically derive a fairly smaller quantity of variables to use
to convey as much of the information in the observed variables as possible.
The factorability of the correlation matrix was investigated using Pearson’s product-
moment correlation coefficient. Preliminary distribution analyses showed that the
standards of normality, linearity and homoscedasticity were not dishonoured.
Bartlett’s Test of Sphericity has been used for the conformity of data with factor
analysis and KaiserMeyer-Olkin coefficient (KMO) has been used for the
appropriateness of sample size. If KMO value is lower than 0.50, it is not appropriate
to continue factor analysis. In this case, it is advisable to upsurge the figure of
observations (Field 2009).
The Kaiser-Meyer-Olkin value was 0.729, above the recommended minimum value of
0.50 (Kaiser, 1970, 1974; Field, 2009; Yayar & Karaca 2017) and the Bartlett’s test of
sphericity (Bartlett, 1954) reached statistical significance, p<.001. Thus, the correlation
matrix was assumed to be factorable. See Table 5.9.
131
Table 5.9: KMO and Bartlett’s test
KMO and Bartlett’s Test
Kaiser-Meyer-Olkin Measure of Sampling Adequacy. 0.729
Bartlett's Test of Sphericity Approx. Chi-Square 1830.130
df 276
Sig. 0.000
Table 5.9 displays the results of KMO measures of the sampling adequacy, and it
further describes the results of Bartlett’s test of sphericity. The tests were steered to
create the sample adequacy for the factoring correlation matrix. The Bartlett’s test of
sphericity (Bartlett 1954) reached statistical significance, p<.001. The KMO index,
which measures the communalities of the items, reached 0.729. Both the KMO and
Bartlett’s test meet the statistical significance of EFA analysis. Thus, the correlation
matrix was assumed to be factorable.
To reduce the dimensionality of the data, Principle Component Analysis (PCA) with
IBM SPSS Statistics 26 was used to examine patterns of correlations among the
questions used to elicit the respondents’ perceptions regarding the marketing
communications in their businesses. PCA is applied to extract maximum variance from
the data set with each factor thus dropping a great number of variables into reduced
number of factors (Tabachnick & Fidell 2007).
Table 5.10 shows the communalities. Communalities are regarded as a continuance
of factor loadings. According to Rietveld and Van Hout (1993), the communality of a
variable is the sum of the loadings of this variable on all extracted factors, which then
shows the correlations between these items. When a value is near 1 it shows an item
that correlates extremely with the other items. For the 24 items examined to elicit the
respondents’ perceptions regarding the marketing communications in their
businesses, the communalities are rational, because the communalities range from a
minimum of 0.432 to the maximum of 0.798. Some studies on marketing
communication find the reasonable communalities with the minimum of 0.430
(Makhubela 2019)
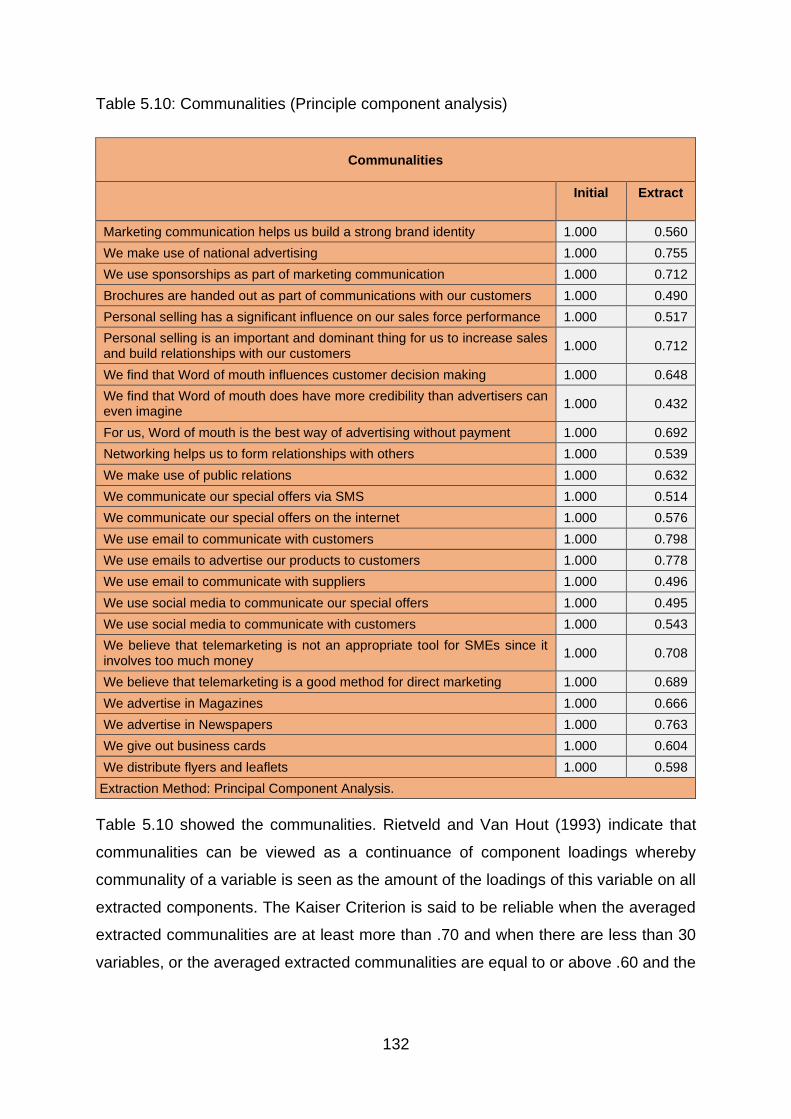
132
Table 5.10: Communalities (Principle component analysis)
Communalities
Initial Extract
Marketing communication helps us build a strong brand identity 1.000 0.560
We make use of national advertising 1.000 0.755
We use sponsorships as part of marketing communication 1.000 0.712
Brochures are handed out as part of communications with our customers 1.000 0.490
Personal selling has a significant influence on our sales force performance 1.000 0.517
Personal selling is an important and dominant thing for us to increase sales and build relationships with our customers
1.000 0.712
We find that Word of mouth influences customer decision making 1.000 0.648
We find that Word of mouth does have more credibility than advertisers can even imagine
1.000 0.432
For us, Word of mouth is the best way of advertising without payment 1.000 0.692
Networking helps us to form relationships with others 1.000 0.539
We make use of public relations 1.000 0.632
We communicate our special offers via SMS 1.000 0.514
We communicate our special offers on the internet 1.000 0.576
We use email to communicate with customers 1.000 0.798
We use emails to advertise our products to customers 1.000 0.778
We use email to communicate with suppliers 1.000 0.496
We use social media to communicate our special offers 1.000 0.495
We use social media to communicate with customers 1.000 0.543
We believe that telemarketing is not an appropriate tool for SMEs since it involves too much money
1.000 0.708
We believe that telemarketing is a good method for direct marketing 1.000 0.689
We advertise in Magazines 1.000 0.666
We advertise in Newspapers 1.000 0.763
We give out business cards 1.000 0.604
We distribute flyers and leaflets 1.000 0.598
Extraction Method: Principal Component Analysis.
Table 5.10 showed the communalities. Rietveld and Van Hout (1993) indicate that
communalities can be viewed as a continuance of component loadings whereby
communality of a variable is seen as the amount of the loadings of this variable on all
extracted components. The Kaiser Criterion is said to be reliable when the averaged
extracted communalities are at least more than .70 and when there are less than 30
variables, or the averaged extracted communalities are equal to or above .60 and the
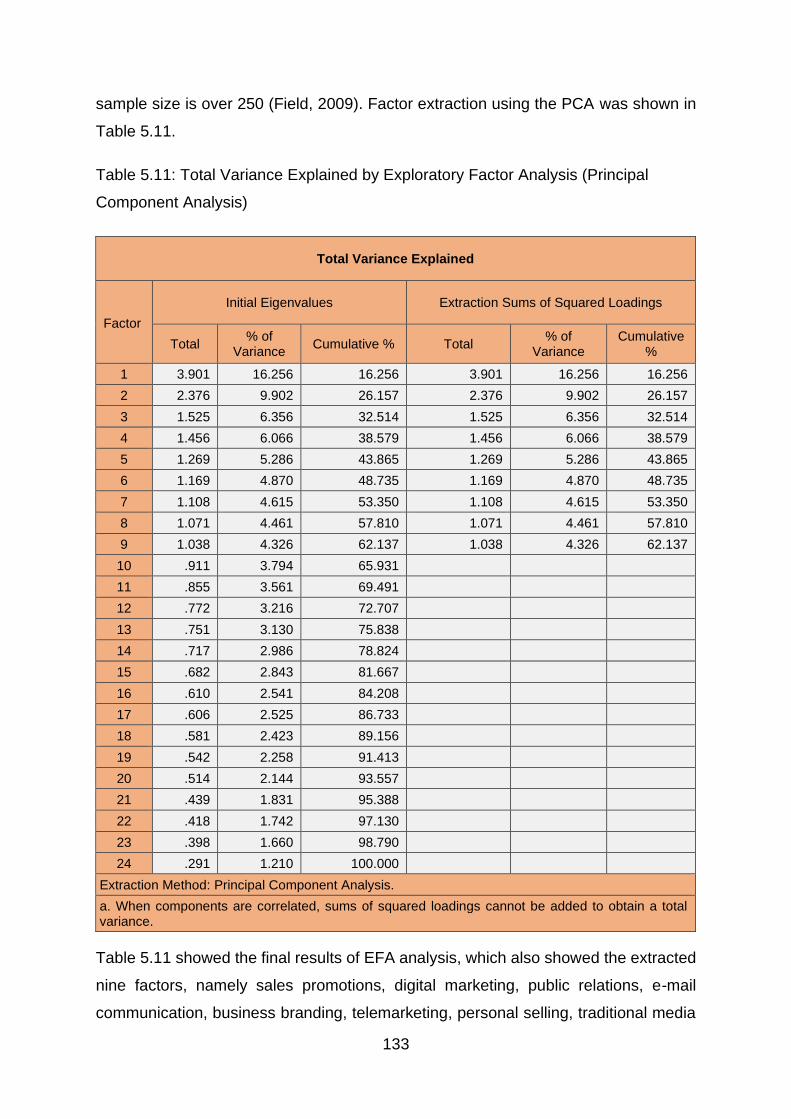
133
sample size is over 250 (Field, 2009). Factor extraction using the PCA was shown in
Table 5.11.
Table 5.11: Total Variance Explained by Exploratory Factor Analysis (Principal
Component Analysis)
Total Variance Explained
Factor
Initial Eigenvalues Extraction Sums of Squared Loadings
Total % of
Variance Cumulative % Total
% of Variance
Cumulative %
1 3.901 16.256 16.256 3.901 16.256 16.256
2 2.376 9.902 26.157 2.376 9.902 26.157
3 1.525 6.356 32.514 1.525 6.356 32.514
4 1.456 6.066 38.579 1.456 6.066 38.579
5 1.269 5.286 43.865 1.269 5.286 43.865
6 1.169 4.870 48.735 1.169 4.870 48.735
7 1.108 4.615 53.350 1.108 4.615 53.350
8 1.071 4.461 57.810 1.071 4.461 57.810
9 1.038 4.326 62.137 1.038 4.326 62.137
10 .911 3.794 65.931
11 .855 3.561 69.491
12 .772 3.216 72.707
13 .751 3.130 75.838
14 .717 2.986 78.824
15 .682 2.843 81.667
16 .610 2.541 84.208
17 .606 2.525 86.733
18 .581 2.423 89.156
19 .542 2.258 91.413
20 .514 2.144 93.557
21 .439 1.831 95.388
22 .418 1.742 97.130
23 .398 1.660 98.790
24 .291 1.210 100.000
Extraction Method: Principal Component Analysis.
a. When components are correlated, sums of squared loadings cannot be added to obtain a total variance.
Table 5.11 showed the final results of EFA analysis, which also showed the extracted
nine factors, namely sales promotions, digital marketing, public relations, e-mail
communication, business branding, telemarketing, personal selling, traditional media
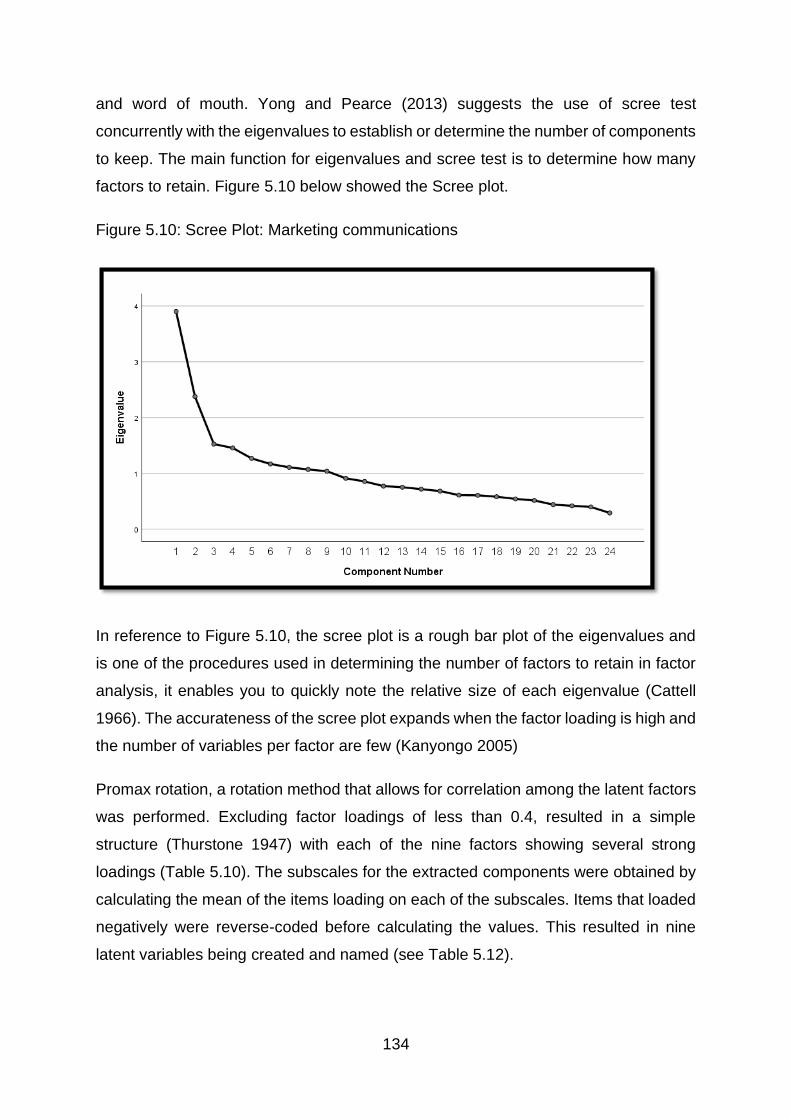
134
and word of mouth. Yong and Pearce (2013) suggests the use of scree test
concurrently with the eigenvalues to establish or determine the number of components
to keep. The main function for eigenvalues and scree test is to determine how many
factors to retain. Figure 5.10 below showed the Scree plot.
Figure 5.10: Scree Plot: Marketing communications
In reference to Figure 5.10, the scree plot is a rough bar plot of the eigenvalues and
is one of the procedures used in determining the number of factors to retain in factor
analysis, it enables you to quickly note the relative size of each eigenvalue (Cattell
1966). The accurateness of the scree plot expands when the factor loading is high and
the number of variables per factor are few (Kanyongo 2005)
Promax rotation, a rotation method that allows for correlation among the latent factors
was performed. Excluding factor loadings of less than 0.4, resulted in a simple
structure (Thurstone 1947) with each of the nine factors showing several strong
loadings (Table 5.10). The subscales for the extracted components were obtained by
calculating the mean of the items loading on each of the subscales. Items that loaded
negatively were reverse-coded before calculating the values. This resulted in nine
latent variables being created and named (see Table 5.12).
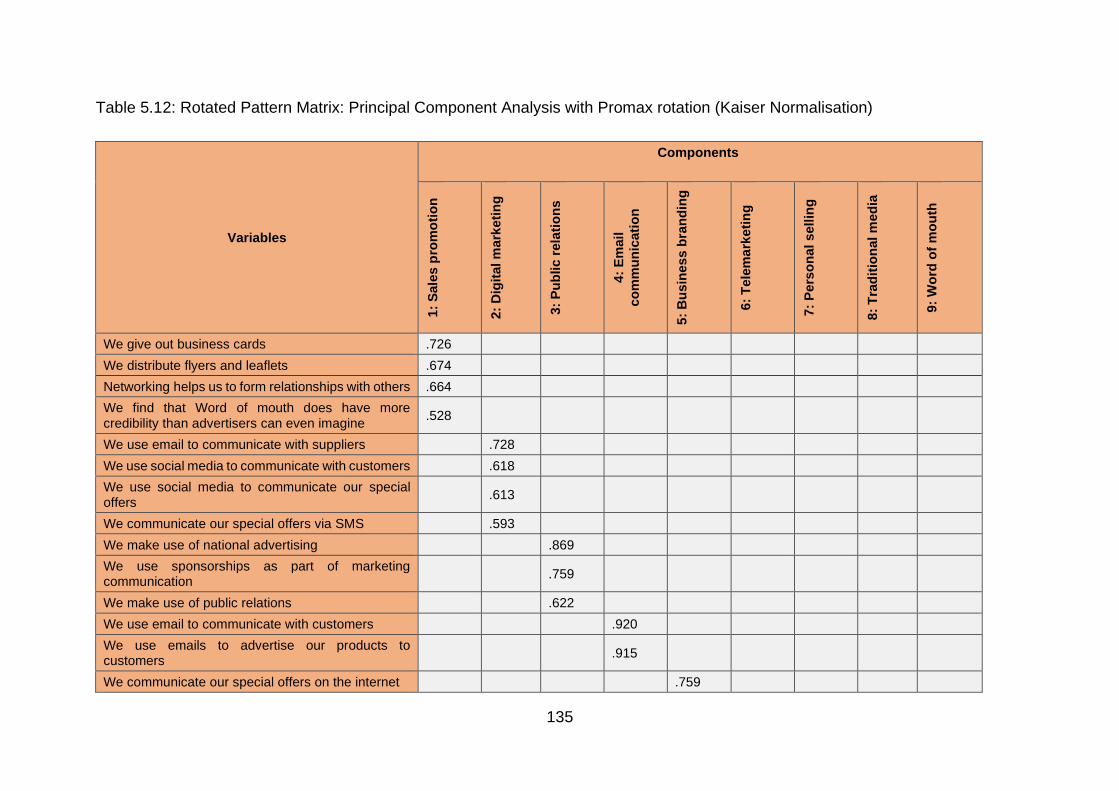
135
Table 5.12: Rotated Pattern Matrix: Principal Component Analysis with Promax rotation (Kaiser Normalisation)
Variables
Components
1:
Sale
s p
rom
oti
on
2:
Dig
ital m
ark
eti
ng
3:
Pu
blic r
ela
tio
ns
4:
Em
ail
co
mm
un
icati
on
5:
Bu
sin
es
s b
ran
din
g
6:
Tele
ma
rketi
ng
7:
Pe
rso
nal
sell
ing
8:
Tra
dit
ion
al m
ed
ia
9:
Wo
rd o
f m
ou
th
We give out business cards .726
We distribute flyers and leaflets .674
Networking helps us to form relationships with others .664
We find that Word of mouth does have more credibility than advertisers can even imagine
.528
We use email to communicate with suppliers .728
We use social media to communicate with customers .618
We use social media to communicate our special offers
.613
We communicate our special offers via SMS .593
We make use of national advertising .869
We use sponsorships as part of marketing communication
.759
We make use of public relations .622
We use email to communicate with customers .920
We use emails to advertise our products to customers
.915
We communicate our special offers on the internet .759
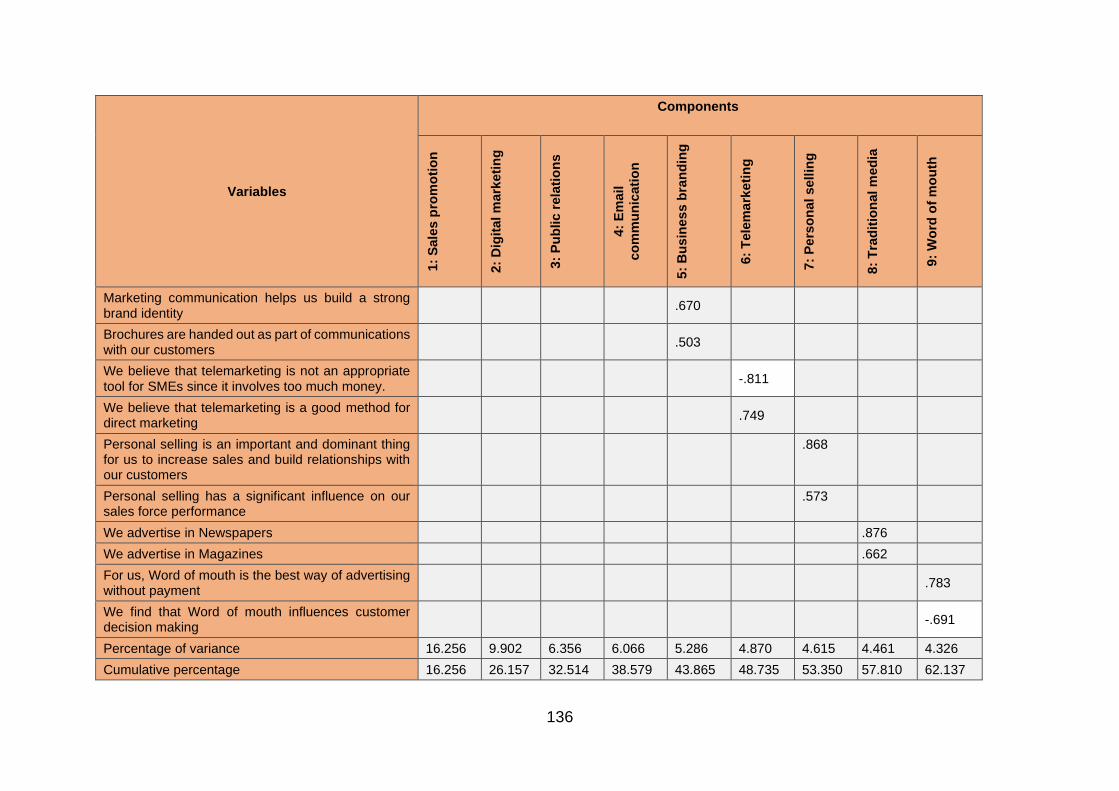
136
Variables
Components
1:
Sale
s p
rom
oti
on
2:
Dig
ital m
ark
eti
ng
3:
Pu
blic r
ela
tio
ns
4:
Em
ail
co
mm
un
icati
on
5:
Bu
sin
es
s b
ran
din
g
6:
Tele
ma
rketi
ng
7:
Pe
rso
nal
sell
ing
8:
Tra
dit
ion
al m
ed
ia
9:
Wo
rd o
f m
ou
th
Marketing communication helps us build a strong brand identity
.670
Brochures are handed out as part of communications with our customers
.503
We believe that telemarketing is not an appropriate tool for SMEs since it involves too much money.
-.811
We believe that telemarketing is a good method for direct marketing
.749
Personal selling is an important and dominant thing for us to increase sales and build relationships with our customers
.868
Personal selling has a significant influence on our sales force performance
.573
We advertise in Newspapers .876
We advertise in Magazines .662
For us, Word of mouth is the best way of advertising without payment
.783
We find that Word of mouth influences customer decision making
-.691
Percentage of variance 16.256 9.902 6.356 6.066 5.286 4.870 4.615 4.461 4.326
Cumulative percentage 16.256 26.157 32.514 38.579 43.865 48.735 53.350 57.810 62.137
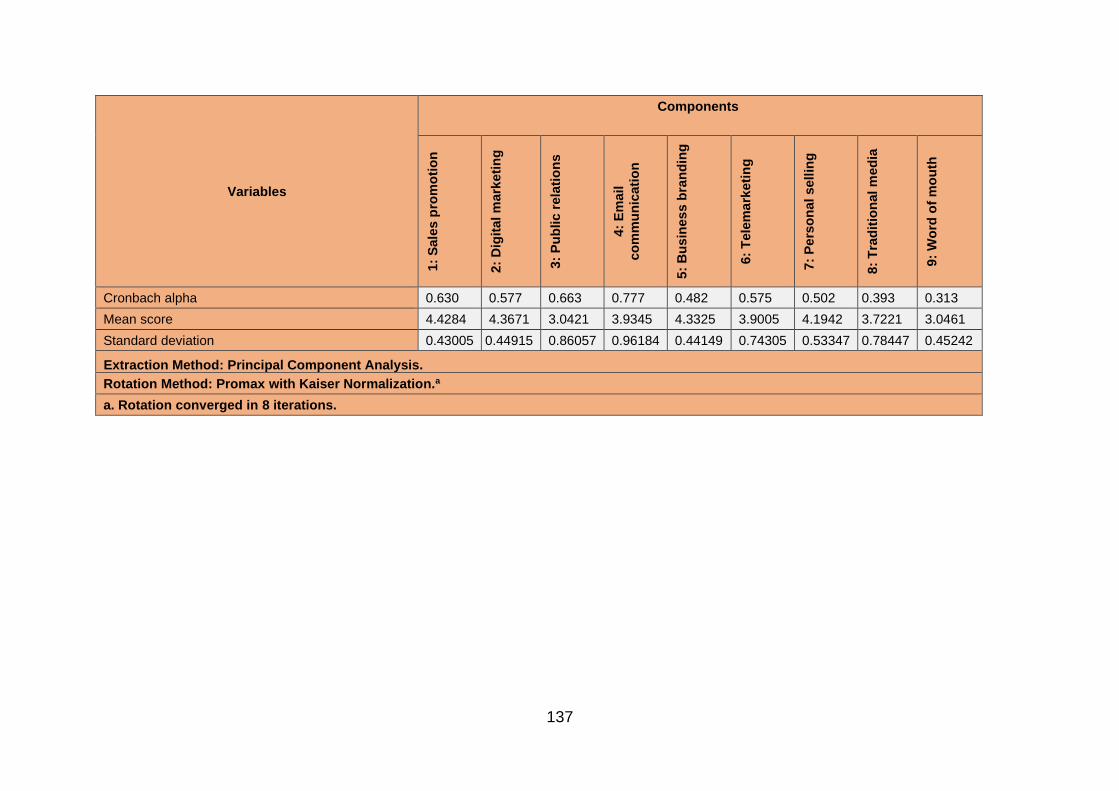
137
Variables
Components
1:
Sale
s p
rom
oti
on
2:
Dig
ital m
ark
eti
ng
3:
Pu
blic r
ela
tio
ns
4:
Em
ail
co
mm
un
icati
on
5:
Bu
sin
es
s b
ran
din
g
6:
Tele
ma
rketi
ng
7:
Pe
rso
nal
sell
ing
8:
Tra
dit
ion
al m
ed
ia
9:
Wo
rd o
f m
ou
th
Cronbach alpha 0.630 0.577 0.663 0.777 0.482 0.575 0.502 0.393 0.313
Mean score 4.4284 4.3671 3.0421 3.9345 4.3325 3.9005 4.1942 3.7221 3.0461
Standard deviation 0.43005 0.44915 0.86057 0.96184 0.44149 0.74305 0.53347 0.78447 0.45242
Extraction Method: Principal Component Analysis.
Rotation Method: Promax with Kaiser Normalization.a
a. Rotation converged in 8 iterations.
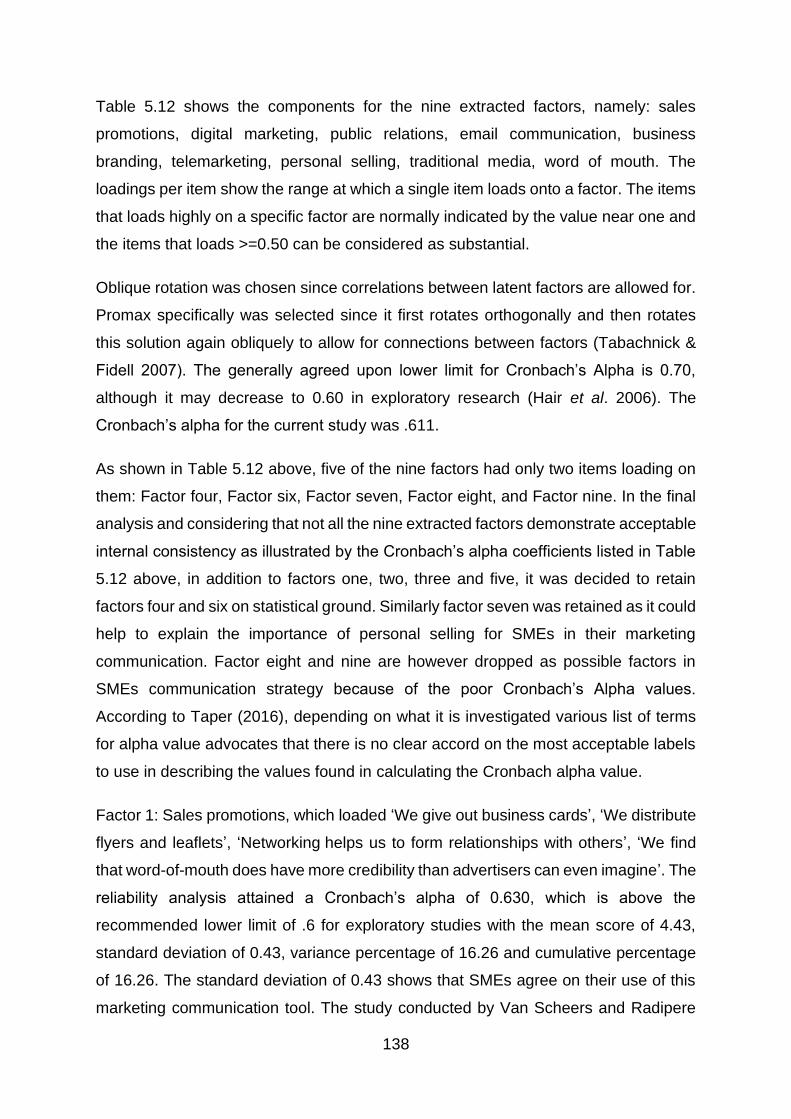
138
Table 5.12 shows the components for the nine extracted factors, namely: sales
promotions, digital marketing, public relations, email communication, business
branding, telemarketing, personal selling, traditional media, word of mouth. The
loadings per item show the range at which a single item loads onto a factor. The items
that loads highly on a specific factor are normally indicated by the value near one and
the items that loads >=0.50 can be considered as substantial.
Oblique rotation was chosen since correlations between latent factors are allowed for.
Promax specifically was selected since it first rotates orthogonally and then rotates
this solution again obliquely to allow for connections between factors (Tabachnick &
Fidell 2007). The generally agreed upon lower limit for Cronbach’s Alpha is 0.70,
although it may decrease to 0.60 in exploratory research (Hair et al. 2006). The
Cronbach’s alpha for the current study was .611.
As shown in Table 5.12 above, five of the nine factors had only two items loading on
them: Factor four, Factor six, Factor seven, Factor eight, and Factor nine. In the final
analysis and considering that not all the nine extracted factors demonstrate acceptable
internal consistency as illustrated by the Cronbach’s alpha coefficients listed in Table
5.12 above, in addition to factors one, two, three and five, it was decided to retain
factors four and six on statistical ground. Similarly factor seven was retained as it could
help to explain the importance of personal selling for SMEs in their marketing
communication. Factor eight and nine are however dropped as possible factors in
SMEs communication strategy because of the poor Cronbach’s Alpha values.
According to Taper (2016), depending on what it is investigated various list of terms
for alpha value advocates that there is no clear accord on the most acceptable labels
to use in describing the values found in calculating the Cronbach alpha value.
Factor 1: Sales promotions, which loaded ‘We give out business cards’, ‘We distribute
flyers and leaflets’, ‘Networking helps us to form relationships with others’, ‘We find
that word-of-mouth does have more credibility than advertisers can even imagine’. The
reliability analysis attained a Cronbach’s alpha of 0.630, which is above the
recommended lower limit of .6 for exploratory studies with the mean score of 4.43,
standard deviation of 0.43, variance percentage of 16.26 and cumulative percentage
of 16.26. The standard deviation of 0.43 shows that SMEs agree on their use of this
marketing communication tool. The study conducted by Van Scheers and Radipere
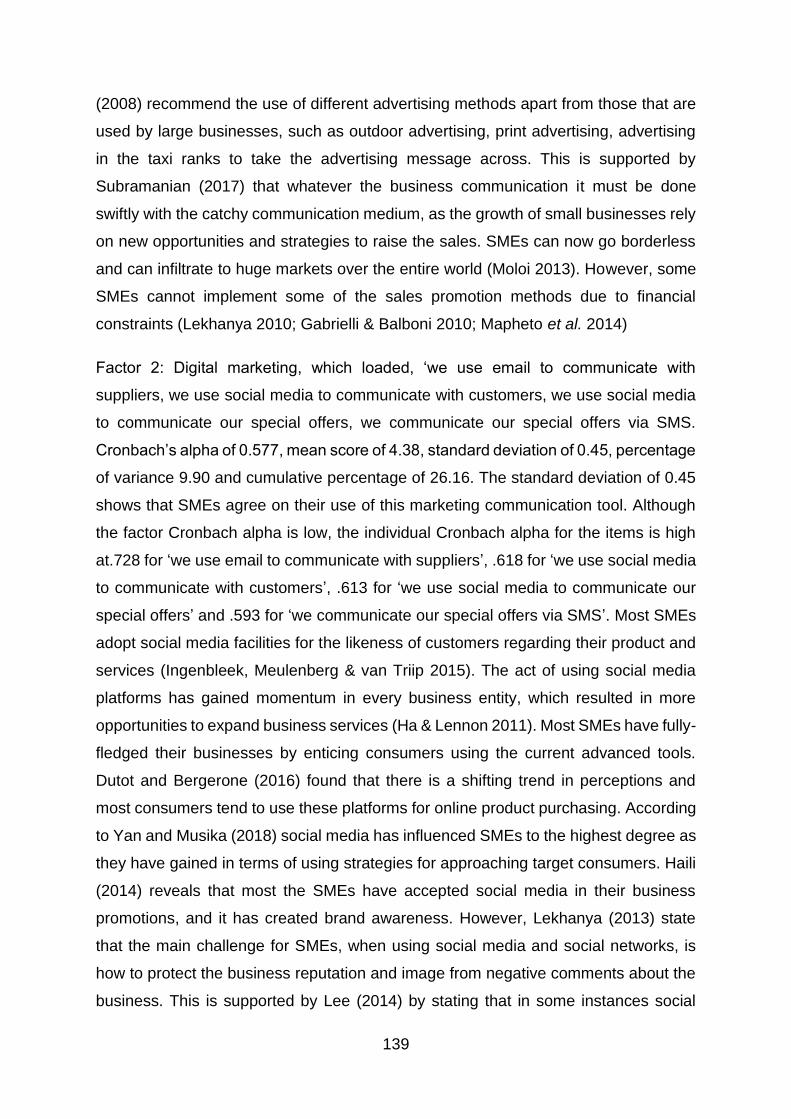
139
(2008) recommend the use of different advertising methods apart from those that are
used by large businesses, such as outdoor advertising, print advertising, advertising
in the taxi ranks to take the advertising message across. This is supported by
Subramanian (2017) that whatever the business communication it must be done
swiftly with the catchy communication medium, as the growth of small businesses rely
on new opportunities and strategies to raise the sales. SMEs can now go borderless
and can infiltrate to huge markets over the entire world (Moloi 2013). However, some
SMEs cannot implement some of the sales promotion methods due to financial
constraints (Lekhanya 2010; Gabrielli & Balboni 2010; Mapheto et al. 2014)
Factor 2: Digital marketing, which loaded, ‘we use email to communicate with
suppliers, we use social media to communicate with customers, we use social media
to communicate our special offers, we communicate our special offers via SMS.
Cronbach’s alpha of 0.577, mean score of 4.38, standard deviation of 0.45, percentage
of variance 9.90 and cumulative percentage of 26.16. The standard deviation of 0.45
shows that SMEs agree on their use of this marketing communication tool. Although
the factor Cronbach alpha is low, the individual Cronbach alpha for the items is high
at.728 for ‘we use email to communicate with suppliers’, .618 for ‘we use social media
to communicate with customers’, .613 for ‘we use social media to communicate our
special offers’ and .593 for ‘we communicate our special offers via SMS’. Most SMEs
adopt social media facilities for the likeness of customers regarding their product and
services (Ingenbleek, Meulenberg & van Triip 2015). The act of using social media
platforms has gained momentum in every business entity, which resulted in more
opportunities to expand business services (Ha & Lennon 2011). Most SMEs have fully-
fledged their businesses by enticing consumers using the current advanced tools.
Dutot and Bergerone (2016) found that there is a shifting trend in perceptions and
most consumers tend to use these platforms for online product purchasing. According
to Yan and Musika (2018) social media has influenced SMEs to the highest degree as
they have gained in terms of using strategies for approaching target consumers. Haili
(2014) reveals that most the SMEs have accepted social media in their business
promotions, and it has created brand awareness. However, Lekhanya (2013) state
that the main challenge for SMEs, when using social media and social networks, is
how to protect the business reputation and image from negative comments about the
business. This is supported by Lee (2014) by stating that in some instances social
140
media have led to a destruction of consumers, making it more difficult in some respects
for SMEs to reach the targeted audiences.
Factor 3, which is the public relations, loaded three variables which are, ‘We make use
of national advertising’, ‘We use sponsorships as part of marketing communication’,
‘we make use of public relations’ (v14, v15, v34 respectively). These variables loaded
satisfactorily together on factor 3 in the final EFA analysis. Obtaining the reliability
analysis on Cronbach’s alpha of 0.663, mean score of 3.04, standard deviation of 0.86
and percentage of variance 6.36 and cumulative percentage 32.51.
Venter et al. (2007) pronounced that public relations promote the success and growth
of the business by establishing goodwill and maintaining good lines of communication
between business and the public. This gives credibility to the business brands and
businesses are continuously attaining organisational goals through the sponsorship
activities. Amoako, Dartey-Baah, Dzogbenuku and Kwasie (2012) found that
sponsorship has progressively been observed to create audience awareness and an
association with the sponsored entity. Therefore, all SMEs should practice
sponsorship as it communicates positive image or message to the target audience
and the public at large. Sponsorship grow the SMEs marketing communication
performance because it stimulates and creates desire, awareness, action and
increases sales of the business (Allen 2010).
Factor 4, named email communication/marketing, loaded, ‘we use email to
communicate with customers v41’, ‘We use emails to advertise our products to
customers, v42’. The correlation between the two items loading on this factor, V41 and
V42, is 0.635 (medium to large). The Cronbach’s alpha for the factors is 0.777, which
is above the recommended lower limit of 0.6 for exploratory studies, with the mean
score of 3.93, standard deviation of 0.962 and percentage of variance 6.07 and
cumulative percentage 38.58.
Email offers interactive and conversational communications, which leads to the growth
of the SMEs in the fast-growing world of digital communications (Bourn 2014).
According to Waheed and Yang (2017), email-marketing/communication gives twice
the return on investment as compared to other forms of online marketing. Shenoy
(2008) also acknowledged the efficiency of email advertising in daily business
141
operations. It was found that universal use of an email service is one of the substantial
accomplishments in business communication (Zhang, Kumar & Cosguner 2017)
However, the success of email-marketing or email as a business communication
method relies much on how customer privacy and respect is managed (Bolos,
Idemudia, Mai, Rasinghani & Smith 2016). The more informative and entertaining the
emails’ contents with a high level of privacy, the more it attracts customers towards
email-advertising (Jamalzadeh, Behravan & Masoudi 2012).
There were three factors loading in Factor 5 (Business branding), namely ‘we
communicate our special offers on the internet’, ‘marketing communication helps us
build a strong brand identity’, ‘brochures are handed out as part of communications
with our customers’. Cronbach’s alpha of 0.482, mean score of 4.33, standard
deviation of 0.44, percentage of variance 5.29 and cumulative percentage of 43.89.
Although the factor Cronbach’s alpha is low, the individual Cronbach’s alpha for the
items is high at .869 for ‘We make use of national advertising’ .759 for ‘We use
sponsorships as part of marketing communication’ and .622 for ‘We make use of public
relations’. Zellweger, Kellermanns, Eddleston and Memili (2012) contend that
business branding can either positively or negatively impact business success.
Blomback and Craig (2014) suggest that SMEs should develop an exclusive business
branding, even though there is limited information existing on the branding and
marketing practices within the SMEs.
Branding contributes positively to the financial performance of the SMEs operating
within the evolving countries like South Africa (Farrington & Venter 2018). Blomback
and Ramirez-Passillas (2012) state that business branding or image is fashioned by
presenting the business, advertising and communicating an anticipated business
brand to the public. It is necessary for SMEs to understand that branding has
undertaken a massive change, from being an identification component to the creation
of emotional attachment with customer, which create a unique brand value (Amin &
Nika 2019).
Factor 6, named telemarketing, loaded two factors, which are, ‘We believe that
telemarketing is not an appropriate tool for SMEs since it involves too much money’,
‘We believe that telemarketing is a good method for direct marketing’. The correlation
between the two items loading on this factor is -.417 (medium). The correlation is
142
negative, therefore, ‘We believe that telemarketing is not an appropriate tool for SMEs
since it involves too much money’ was reverse-coded to force the same direction for
the perceptions. The use of reversed variables together with direct variables infers that
reversed variables must be recoded to attain the total score of the scale (Javier,
Pedrosa, Lozano, Eduardo, Marcelino & Muniz 2018)
The Cronbach’s alpha is 0.575, just below to the recommended lower limit of .6 for
exploratory studies. Although the factor Cronbach’s alpha is low, the individual
Cronbach’s alpha for the items is high at -.811 for ‘We believe that telemarketing is not
an appropriate tool for SMEs since it involves too much money’ and .749 for ‘We
believe that telemarketing is a good method for direct marketing’. Mean score 3.90,
standard deviation of 0.74, percentage of variance 4.87 and cumulative percentage of
48.74. The standard deviation of 0.74 shows that SMEs agree on their perception of
this marketing communication tool. Telemarketing is a good method of setting
appointments for the salespeople, inviting prospective customers to visit a trade show,
etcetera (Kotler & Keller 2014).
According to Noh and Park (2014), telemarketing is a good and efficient method of
communication that businesses practice with the aim of creating value for the
customers and receiving feedback about customer preferences. The study conducted
by Tiwari and Gupta (2012) found that with the future of telemarketing, majority of the
respondents appeared to be in favour of telemarketing since nearly half of the
respondents said it should be continued while few numbers was not so sure about it.
Artraya (2013) advised that arousing the prospects curiosity is the major pillar in
telemarketing, prospects should be given enough chance and opportunity to ask
related questions while the aim is that the prospect gets enough and clear information
as the basis for consideration.
Factor 7, named personal selling, loaded two variables, which are, ‘personal selling is
an important and dominant thing for us to increase sales and build relationships with
our customers’, ‘personal selling has a significant influence on our sales force
performance’. Cronbach’s alpha for the factors is 0.502, Mean score of 4.19, standard
deviation of 0.533 and percentage of variance 4.16 and cumulative percentage 53.35.
Although the factor Cronbach’s alpha is low, the individual Cronbach’s alpha for the
items is high at .573 for ‘Personal selling has a significant influence on our sales force
143
performance’ and .868 for ‘Personal selling is an important and dominant thing for us
to increase sales and build relationships with our customers’.
The correlation between the two items loading on this factor (7) is 0.335 (acceptable).
The Cronbach’s alpha is 0.502, below to the suggested lower limit of 0.6 for exploratory
studies. However, this factor 7 was retained as it could help to explain the importance
of personal selling for SMEs in their marketing communication. Personal selling
ensures customers post-purchase satisfaction and build profitable long-term
relationships, that is built on trust. Khan (2014) reports that personal selling is another
method of promotion that SME owners should use to market their products effectively.
Personal selling should be applied within the SMEs to persuade customers to make
additional purchases of products and meet the business’s revenue goals (Mohammed,
Rashid & Tahir 2014). Kihanya (2013) found that personal selling positively influences
the business performance.
Factor 8: traditional media, loaded only two variables, ‘we advertise in Newspapers’,
‘we advertise in Magazines’. The correlation between the two items loading on this
factor is 0.255 (small). Each of these two variables correlates with several other
variables. At face value, the two items seem to refer to something similar; advertising
in traditional media.
The Cronbach’s alpha is 0.393, more than 0.1 lower than the suggested lower limit of
0.6 for exploratory studies. Based on the above weak statistical support for it, this
factor was dropped.
Factor 9: word-of-mouth advertising, which loaded, ‘for us, word-of-mouth is the best
way of advertising without payment’, ‘we find that Word of mouth influences customer
decision making’. The correlation between the two items loading on this factor is -.186
(very small, effectively non-existent). Neither of these two variables correlate with any
of the other variables. At face value, the two items seem to refer to something similar;
the value of word of mouth as a tool.
The Cronbach’s alpha is 0.313, way lower than the recommended lower limit of .6 for
exploratory studies. Based on the above weak statistical support for it, this factor is
dropped.
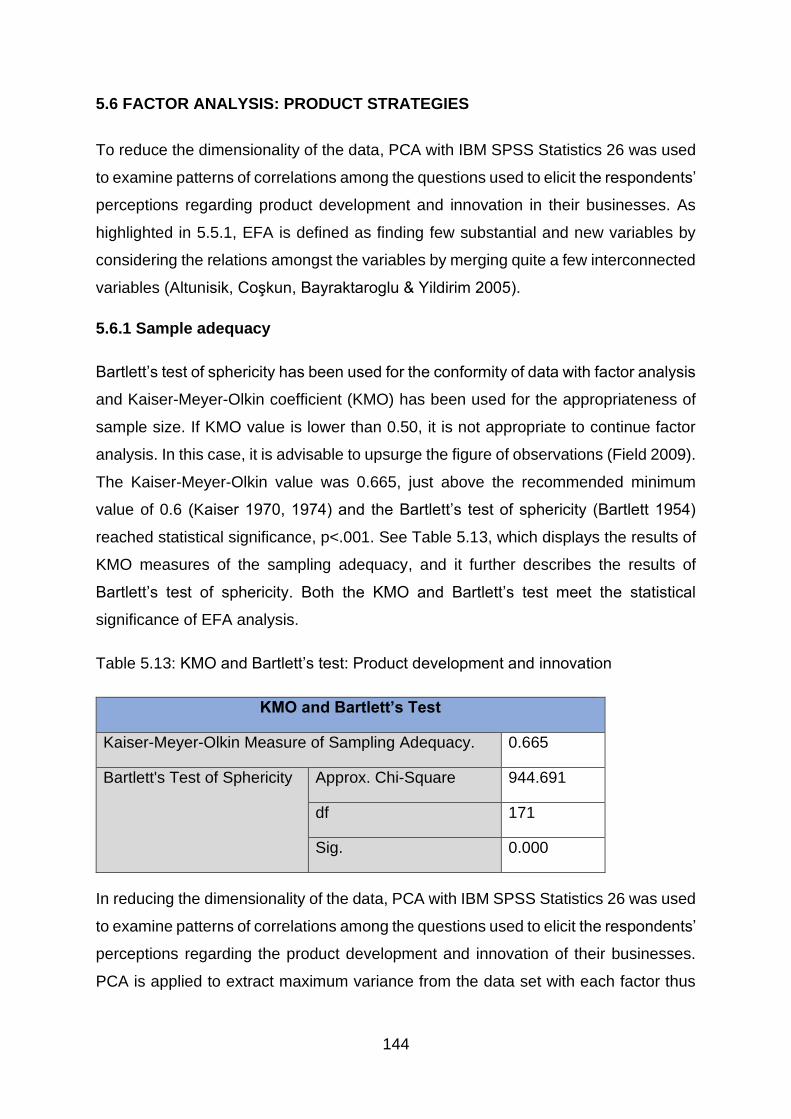
144
5.6 FACTOR ANALYSIS: PRODUCT STRATEGIES
To reduce the dimensionality of the data, PCA with IBM SPSS Statistics 26 was used
to examine patterns of correlations among the questions used to elicit the respondents’
perceptions regarding product development and innovation in their businesses. As
highlighted in 5.5.1, EFA is defined as finding few substantial and new variables by
considering the relations amongst the variables by merging quite a few interconnected
variables (Altunisik, Coşkun, Bayraktaroglu & Yildirim 2005).
5.6.1 Sample adequacy
Bartlett’s test of sphericity has been used for the conformity of data with factor analysis
and Kaiser-Meyer-Olkin coefficient (KMO) has been used for the appropriateness of
sample size. If KMO value is lower than 0.50, it is not appropriate to continue factor
analysis. In this case, it is advisable to upsurge the figure of observations (Field 2009).
The Kaiser-Meyer-Olkin value was 0.665, just above the recommended minimum
value of 0.6 (Kaiser 1970, 1974) and the Bartlett’s test of sphericity (Bartlett 1954)
reached statistical significance, p<.001. See Table 5.13, which displays the results of
KMO measures of the sampling adequacy, and it further describes the results of
Bartlett’s test of sphericity. Both the KMO and Bartlett’s test meet the statistical
significance of EFA analysis.
Table 5.13: KMO and Bartlett’s test: Product development and innovation
KMO and Bartlett’s Test
Kaiser-Meyer-Olkin Measure of Sampling Adequacy. 0.665
Bartlett's Test of Sphericity Approx. Chi-Square 944.691
df 171
Sig. 0.000
In reducing the dimensionality of the data, PCA with IBM SPSS Statistics 26 was used
to examine patterns of correlations among the questions used to elicit the respondents’
perceptions regarding the product development and innovation of their businesses.
PCA is applied to extract maximum variance from the data set with each factor thus
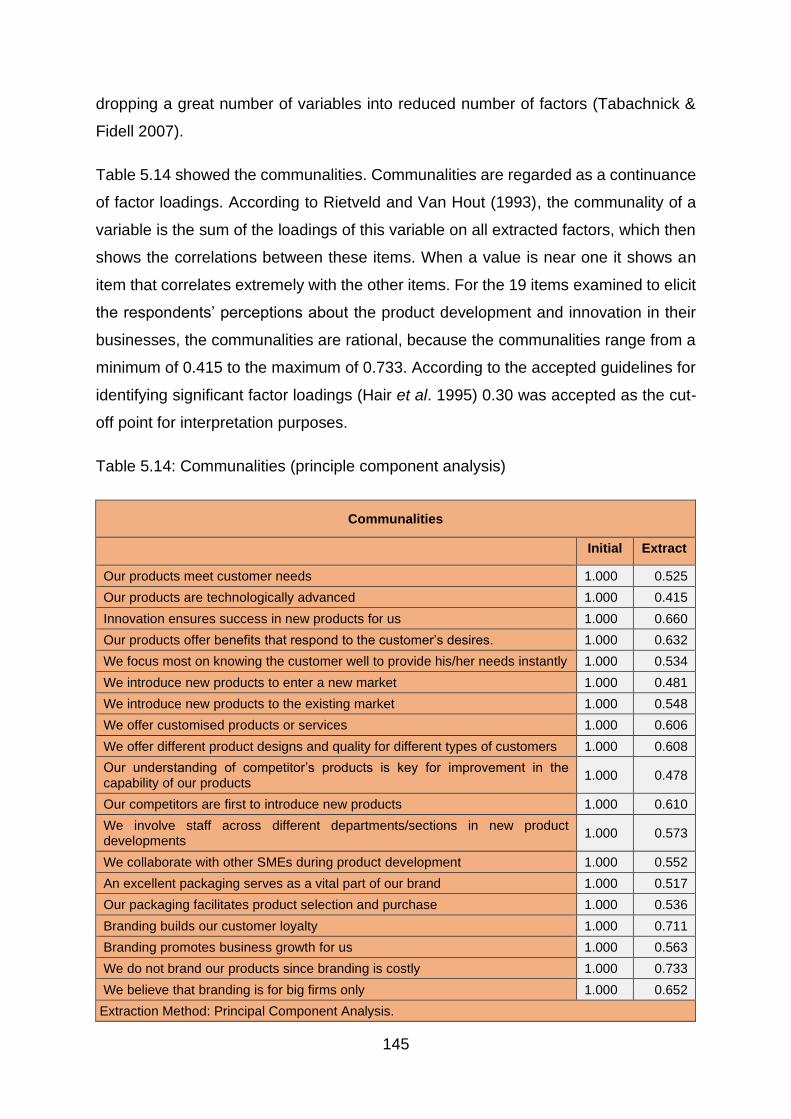
145
dropping a great number of variables into reduced number of factors (Tabachnick &
Fidell 2007).
Table 5.14 showed the communalities. Communalities are regarded as a continuance
of factor loadings. According to Rietveld and Van Hout (1993), the communality of a
variable is the sum of the loadings of this variable on all extracted factors, which then
shows the correlations between these items. When a value is near one it shows an
item that correlates extremely with the other items. For the 19 items examined to elicit
the respondents’ perceptions about the product development and innovation in their
businesses, the communalities are rational, because the communalities range from a
minimum of 0.415 to the maximum of 0.733. According to the accepted guidelines for
identifying significant factor loadings (Hair et al. 1995) 0.30 was accepted as the cut-
off point for interpretation purposes.
Table 5.14: Communalities (principle component analysis)
Communalities
Initial Extract
Our products meet customer needs 1.000 0.525
Our products are technologically advanced 1.000 0.415
Innovation ensures success in new products for us 1.000 0.660
Our products offer benefits that respond to the customer’s desires. 1.000 0.632
We focus most on knowing the customer well to provide his/her needs instantly 1.000 0.534
We introduce new products to enter a new market 1.000 0.481
We introduce new products to the existing market 1.000 0.548
We offer customised products or services 1.000 0.606
We offer different product designs and quality for different types of customers 1.000 0.608
Our understanding of competitor’s products is key for improvement in the capability of our products
1.000 0.478
Our competitors are first to introduce new products 1.000 0.610
We involve staff across different departments/sections in new product developments
1.000 0.573
We collaborate with other SMEs during product development 1.000 0.552
An excellent packaging serves as a vital part of our brand 1.000 0.517
Our packaging facilitates product selection and purchase 1.000 0.536
Branding builds our customer loyalty 1.000 0.711
Branding promotes business growth for us 1.000 0.563
We do not brand our products since branding is costly 1.000 0.733
We believe that branding is for big firms only 1.000 0.652
Extraction Method: Principal Component Analysis.
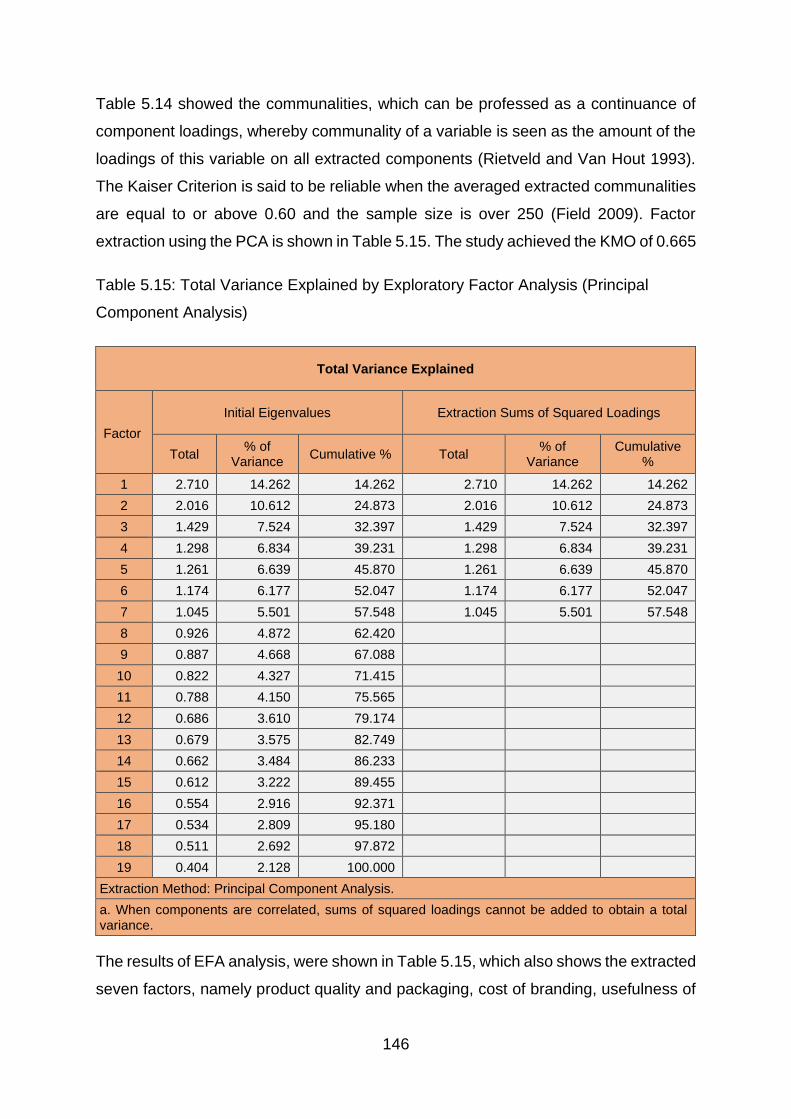
146
Table 5.14 showed the communalities, which can be professed as a continuance of
component loadings, whereby communality of a variable is seen as the amount of the
loadings of this variable on all extracted components (Rietveld and Van Hout 1993).
The Kaiser Criterion is said to be reliable when the averaged extracted communalities
are equal to or above 0.60 and the sample size is over 250 (Field 2009). Factor
extraction using the PCA is shown in Table 5.15. The study achieved the KMO of 0.665
Table 5.15: Total Variance Explained by Exploratory Factor Analysis (Principal
Component Analysis)
Total Variance Explained
Factor
Initial Eigenvalues Extraction Sums of Squared Loadings
Total % of
Variance Cumulative % Total
% of Variance
Cumulative %
1 2.710 14.262 14.262 2.710 14.262 14.262
2 2.016 10.612 24.873 2.016 10.612 24.873
3 1.429 7.524 32.397 1.429 7.524 32.397
4 1.298 6.834 39.231 1.298 6.834 39.231
5 1.261 6.639 45.870 1.261 6.639 45.870
6 1.174 6.177 52.047 1.174 6.177 52.047
7 1.045 5.501 57.548 1.045 5.501 57.548
8 0.926 4.872 62.420
9 0.887 4.668 67.088
10 0.822 4.327 71.415
11 0.788 4.150 75.565
12 0.686 3.610 79.174
13 0.679 3.575 82.749
14 0.662 3.484 86.233
15 0.612 3.222 89.455
16 0.554 2.916 92.371
17 0.534 2.809 95.180
18 0.511 2.692 97.872
19 0.404 2.128 100.000
Extraction Method: Principal Component Analysis.
a. When components are correlated, sums of squared loadings cannot be added to obtain a total variance.
The results of EFA analysis, were shown in Table 5.15, which also shows the extracted
seven factors, namely product quality and packaging, cost of branding, usefulness of
147
branding, collaborative product development, product variety, meeting customer
needs and introduction of new products. The use of scree test concurrently with the
eigenvalues is recommended to determine the number of components to keep (Yong
& Pearce 2013). The main function for eigenvalues and scree test is to determine how
many factors to retain.
Promax rotation, a rotation method that allows for correlation among the latent factors
was performed. Excluding factor loadings of less than 0.4 resulted in a simple structure
(Thurstone 1947), with each of the seven factors showing several strong loadings
(Table 5.16). Not all the extracted factors demonstrate the acceptable internal
consistency as illustrated by the Cronbach’s alpha coefficients listed in Table 5.16.
The subscales for the extracted components were obtained by calculating the mean
of the items loading on each of the subscales (Table 5.16).
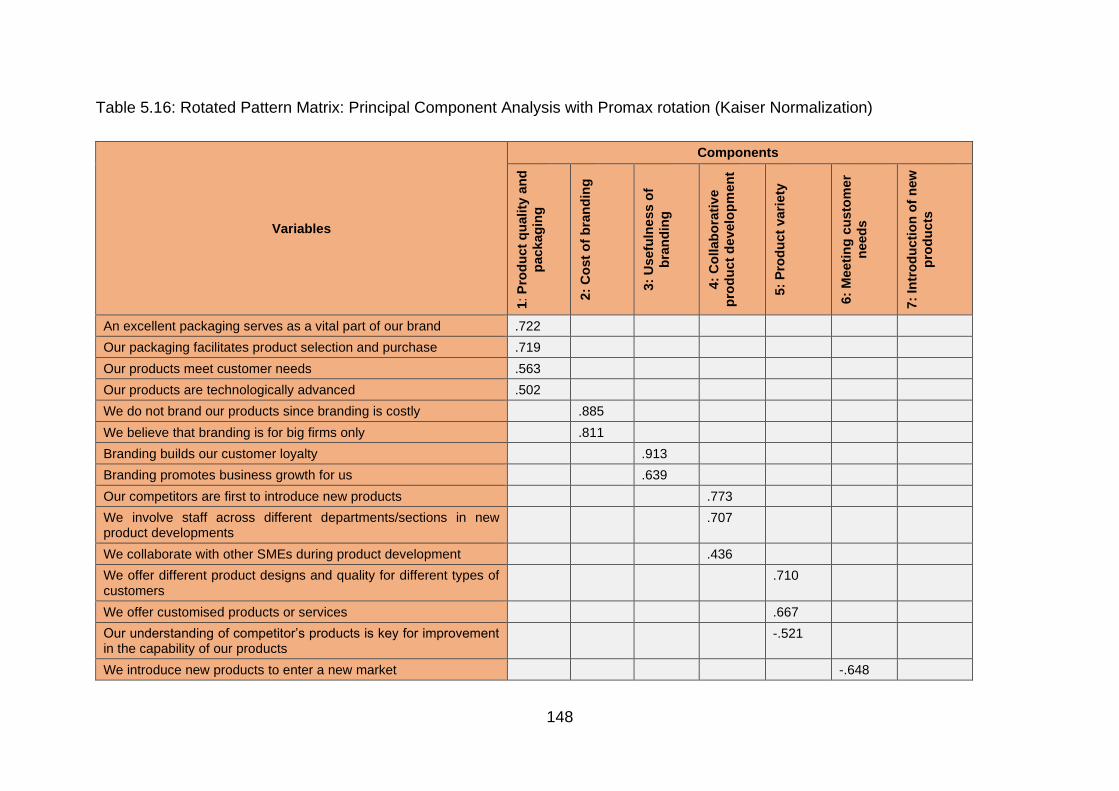
148
Table 5.16: Rotated Pattern Matrix: Principal Component Analysis with Promax rotation (Kaiser Normalization)
Variables
Components
1: P
rod
uct
qu
ality
an
d
packag
ing
2:
Co
st
of
bra
nd
ing
3:
Usefu
lne
ss o
f
bra
nd
ing
4:
Co
llab
ora
tive
pro
du
ct
develo
pm
en
t
5:
Pro
du
ct
vari
ety
6:
Meeti
ng
cu
sto
mer
need
s
7:
Intr
od
ucti
on
of
new
pro
du
cts
An excellent packaging serves as a vital part of our brand .722
Our packaging facilitates product selection and purchase .719
Our products meet customer needs .563
Our products are technologically advanced .502
We do not brand our products since branding is costly .885
We believe that branding is for big firms only .811
Branding builds our customer loyalty .913
Branding promotes business growth for us .639
Our competitors are first to introduce new products .773
We involve staff across different departments/sections in new product developments
.707
We collaborate with other SMEs during product development .436
We offer different product designs and quality for different types of customers
.710
We offer customised products or services .667
Our understanding of competitor’s products is key for improvement in the capability of our products
-.521
We introduce new products to enter a new market -.648
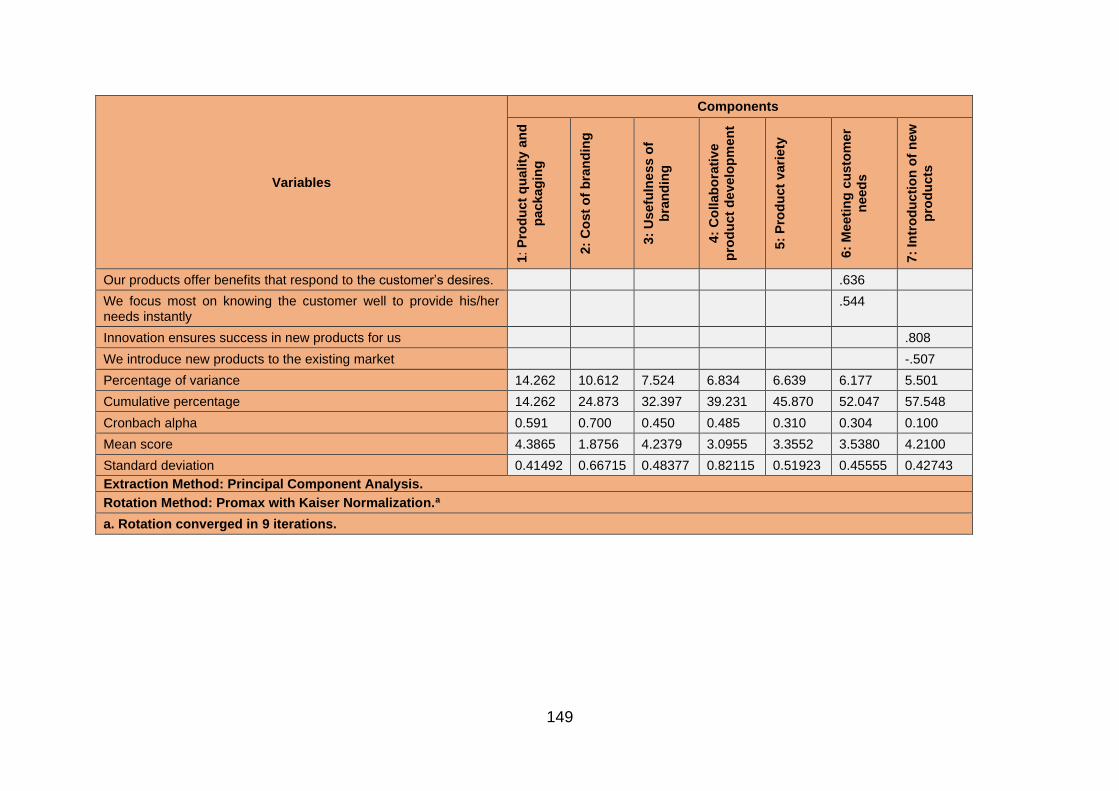
149
Variables
Components
1:
Pro
du
ct
qu
ality
an
d
packag
ing
2:
Co
st
of
bra
nd
ing
3:
Usefu
lne
ss o
f
bra
nd
ing
4:
Co
llab
ora
tive
pro
du
ct
develo
pm
en
t
5:
Pro
du
ct
vari
ety
6:
Meeti
ng
cu
sto
mer
need
s
7:
Intr
od
ucti
on
of
new
pro
du
cts
Our products offer benefits that respond to the customer’s desires. .636
We focus most on knowing the customer well to provide his/her needs instantly
.544
Innovation ensures success in new products for us .808
We introduce new products to the existing market -.507
Percentage of variance 14.262 10.612 7.524 6.834 6.639 6.177 5.501
Cumulative percentage 14.262 24.873 32.397 39.231 45.870 52.047 57.548
Cronbach alpha 0.591 0.700 0.450 0.485 0.310 0.304 0.100
Mean score 4.3865 1.8756 4.2379 3.0955 3.3552 3.5380 4.2100
Standard deviation 0.41492 0.66715 0.48377 0.82115 0.51923 0.45555 0.42743
Extraction Method: Principal Component Analysis.
Rotation Method: Promax with Kaiser Normalization.a
a. Rotation converged in 9 iterations.
150
Table 5.16 showed the components for the seven extracted factors. Oblique rotation
was chosen since correlations between latent factors are allowed for. Promax
specifically was chosen since it first rotates orthogonally and then rotates this solution
again obliquely to allow for correlations among factors (Tabachnick & Fidell 2007).
According to a rule of thumb, using a Cronbach’s alpha level of .01 (two-tailed), a
rotated factor loading for a sample size of at least 300 would need to be at least .32 to
be considered statistically meaningful (Tabachnick & Fidell 2007). When the factor
loading is at least 0.4 sturdily suggest that a specific variable is attributable to factors
(Cutillo 2019). The correlation r must be 0.30 or greater since anything lower would
suggest a weak relationship between the variables (Tabachnick & Fidell 2007). Often
variables with low communalities (less than .20) are removed from the analysis since
the aim of factor analysis is to try and describe the variance through the common
factors (Child 2006).
As shown in Table 5.18 above, three of the seven extracted factors had only two items
loading on them: Factor 2 ‘We do not brand our products since branding is costly’, ‘We
believe that branding is for big firms only’, Factor 3 ‘Branding builds our customer
loyalty’, ‘Branding promotes business growth for us’, Factor 7 ‘Innovation ensures
success in new products for us’, ‘We introduce new products to the existing market’.
In the final analysis,’ not all the 7 extracted factors demonstrate acceptable internal
consistency as illustrated by the Cronbach’s alpha coefficients listed in Table 5.16
above. Factors 5, 6 and 7 are, however, dropped as possible factors in SMEs product
strategy because of the poor Cronbach’s alpha values. Taper (2016) state that
depending on what it is investigated the alpha value of 0.45 – 0.98 is acceptable,
however, Taper (2016) articulate that various lists of terms advocate that there is no
clear accord on the most acceptable labels to use in describing the values found in
calculating the Cronbach’s alpha value.
Factor 1: Product quality and packaging, which loaded ‘An excellent packaging serves
as a vital part of our brand’, ‘Our packaging facilitates product selection and purchase’,
‘Our products meet customer needs’, ‘Our products are technologically advanced’.
The reliability analysis attained a Cronbach’s alpha of 0.591, which is slightly below
the recommended lower limit of .6 for exploratory studies with the mean score of 4.39,
standard deviation of 0.41, variance percentage of 14.26 and cumulative percentage
151
of 14.26. Molina-Castillo, Munuera-Aleman and Calantone (2011) consider product
quality as a serious element for the business to obtain a competitive advantage, it is
further assumed to be of high importance to the existence and success of a product.
Product quality and packaging are a good combination for product success. Abdalkrim
and AL-Hrezat (2018) found that there is a significant statistical effect of the packaging
role in protecting the products and consumer on the consumer's perception of product
quality at the point of purchase. This is in line with Heising, Dekker, Bartels and Van
Boekel (2014) who found that expediency is another function of packaging that
consumers often look for at the point of purchase, the package size may also narrate
to the product's storage and convenience of use.
Factor 2: Cost of branding, which loaded ‘We do not brand our products since branding
is costly’, ‘We believe that branding is for big firms only’. The reliability analysis
attained a Cronbach’s alpha of .700, which is above the recommended lower limit of
.6 for exploratory studies with the mean score of 1.88, standard deviation of 0.67,
variance percentage of 10.61 and cumulative percentage of 24.87. SMEs are faced
with some financial constraints, which make it difficult to do branding. Odoom (2017)
found that these financial limitations for branding force SMEs to focus on short term
branding strategies, this resulted in SMEs opting to develop long-term branding
strategies as a secondary priority. The element of financial resources to develop
branding for SMEs has been noted as the core component for engendering strategic
branding efforts in SMEs (Merrilees, Rundle-Thiele & Lye 2011).
Factor 3: Usefulness of branding, ‘Branding builds our customer loyalty’, ‘Branding
promotes business growth for us’. The reliability analysis attained a Cronbach’s alpha
of 0.450, which is below the recommended lower limit of .6 for exploratory studies.
However, this is in line with the recommendation made by Taper (2016), that
depending on what is researched the alpha value of 0.45 – 0.98 is acceptable. The
mean score of 4.24, standard deviation of 0.48, variance percentage of 7.52 and
cumulative percentage of 32.40. Yaro (2015) states that branding is an important
aspect for the business as it adds value to a product, serves as a product differentiation
strategy and allows the SMEs to charge higher prices on the products than they would
if products were viewed as identical by consumers. This is in line with the study
conducted by Lake (2012) that states branding helps in enhancing product image and
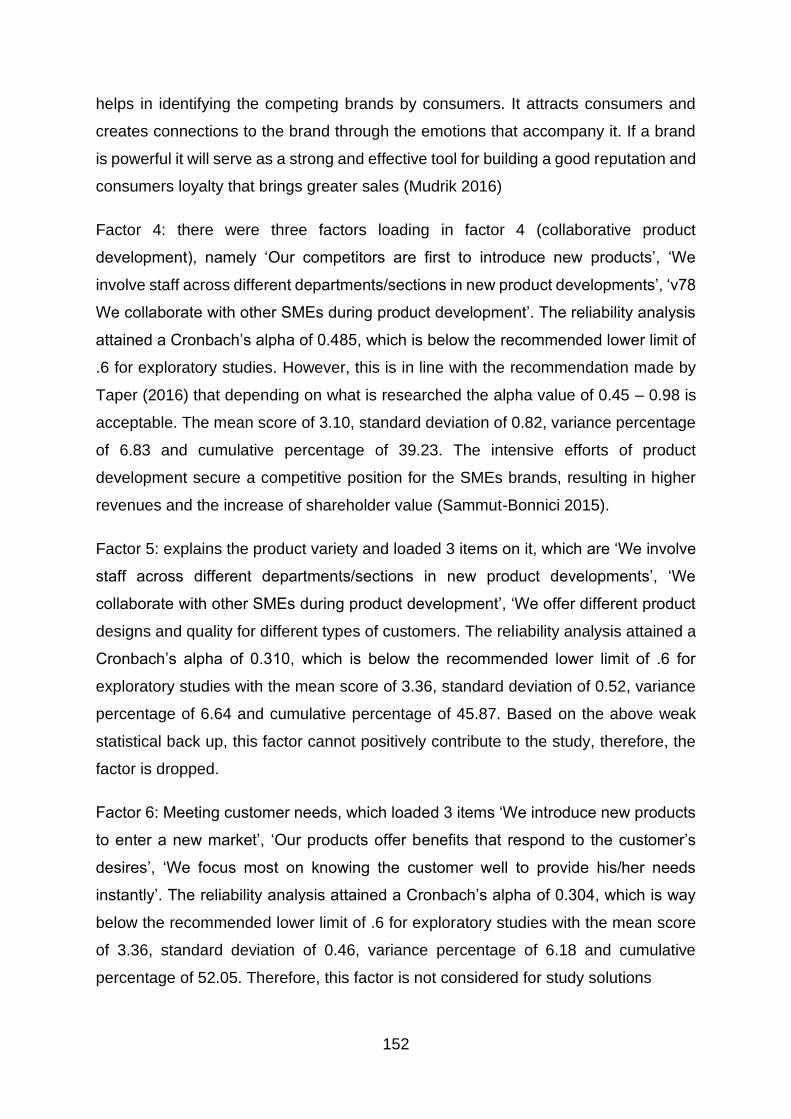
152
helps in identifying the competing brands by consumers. It attracts consumers and
creates connections to the brand through the emotions that accompany it. If a brand
is powerful it will serve as a strong and effective tool for building a good reputation and
consumers loyalty that brings greater sales (Mudrik 2016)
Factor 4: there were three factors loading in factor 4 (collaborative product
development), namely ‘Our competitors are first to introduce new products’, ‘We
involve staff across different departments/sections in new product developments’, ‘v78
We collaborate with other SMEs during product development’. The reliability analysis
attained a Cronbach’s alpha of 0.485, which is below the recommended lower limit of
.6 for exploratory studies. However, this is in line with the recommendation made by
Taper (2016) that depending on what is researched the alpha value of 0.45 – 0.98 is
acceptable. The mean score of 3.10, standard deviation of 0.82, variance percentage
of 6.83 and cumulative percentage of 39.23. The intensive efforts of product
development secure a competitive position for the SMEs brands, resulting in higher
revenues and the increase of shareholder value (Sammut-Bonnici 2015).
Factor 5: explains the product variety and loaded 3 items on it, which are ‘We involve
staff across different departments/sections in new product developments’, ‘We
collaborate with other SMEs during product development’, ‘We offer different product
designs and quality for different types of customers. The reliability analysis attained a
Cronbach’s alpha of 0.310, which is below the recommended lower limit of .6 for
exploratory studies with the mean score of 3.36, standard deviation of 0.52, variance
percentage of 6.64 and cumulative percentage of 45.87. Based on the above weak
statistical back up, this factor cannot positively contribute to the study, therefore, the
factor is dropped.
Factor 6: Meeting customer needs, which loaded 3 items ‘We introduce new products
to enter a new market’, ‘Our products offer benefits that respond to the customer’s
desires’, ‘We focus most on knowing the customer well to provide his/her needs
instantly’. The reliability analysis attained a Cronbach’s alpha of 0.304, which is way
below the recommended lower limit of .6 for exploratory studies with the mean score
of 3.36, standard deviation of 0.46, variance percentage of 6.18 and cumulative
percentage of 52.05. Therefore, this factor is not considered for study solutions
153
Factor 7: Introduction of new products, which loaded two items ‘Innovation ensures
success in new products for us’, ‘We introduce new products to the existing market’.
The reliability analysis attained a Cronbach’s alpha of 0.100, the mean score of 4.21,
standard deviation of 0.43, variance percentage of 5.50 and cumulative percentage of
57.55
The correlation between the two items loading on this factor is.-.055 (effectively non-
existent). ‘Personal selling has a significant influence on our sales force performance’
also has small correlations with 3 other variables but ‘Personal selling is an important
and dominant thing for us to increase sales and build relationships with our customers’
does not correlate with any of the other variables. At face value, the two items refer to
new products but do not really address the same aspect around new products. This
explains the non-existent correlation between them. The Cronbach’s alpha is .100,
way below the suggested lower limit of .6 for exploratory studies. Based on the weak
statistical and theoretical motivation for retaining this factor, it was dropped from the
study solution.
The next section discussed the results of the hypotheses tested in this study.
5.7 TESTING HYPOTHESES 1: MARKETING COMMUNICATION STRATEGIES
AND DEMOGRAPHIC FACTORS (BUSINESS OPERATION, TRAINING AND
ANNUAL TURNOVER) AND
H1a Marketing strategies of SMEs differ across demographics business operation
of SMEs.
H1b Marketing strategies of SMEs does differ across business training attended by
SMEs owners/managers.
H3a Marketing strategies of SMEs differ across demographics business turnover, of
SMEs.
Hypotheses 1 tests whether marketing communication strategies differs across the
demographic factors of the SMEs. The following demographic factors were tested:
business operation, business marketing training and business turnover.

154
5.7.1 Business operation (business maturity) and marketing communication
The one-way ANOVA and Welch ANOVA tests were used to investigate whether
business maturity has a significant effect on the respondents’ attitudes towards
marketing communication. The one-way ANOVA and Welch ANOVA tests found that,
on average, business maturity has a highly significant effect on the respondents’
agreement level with statements about the business marketing communications in
their businesses regarding all the dimensions except C3 and C7. Refer to the Table
5.17.
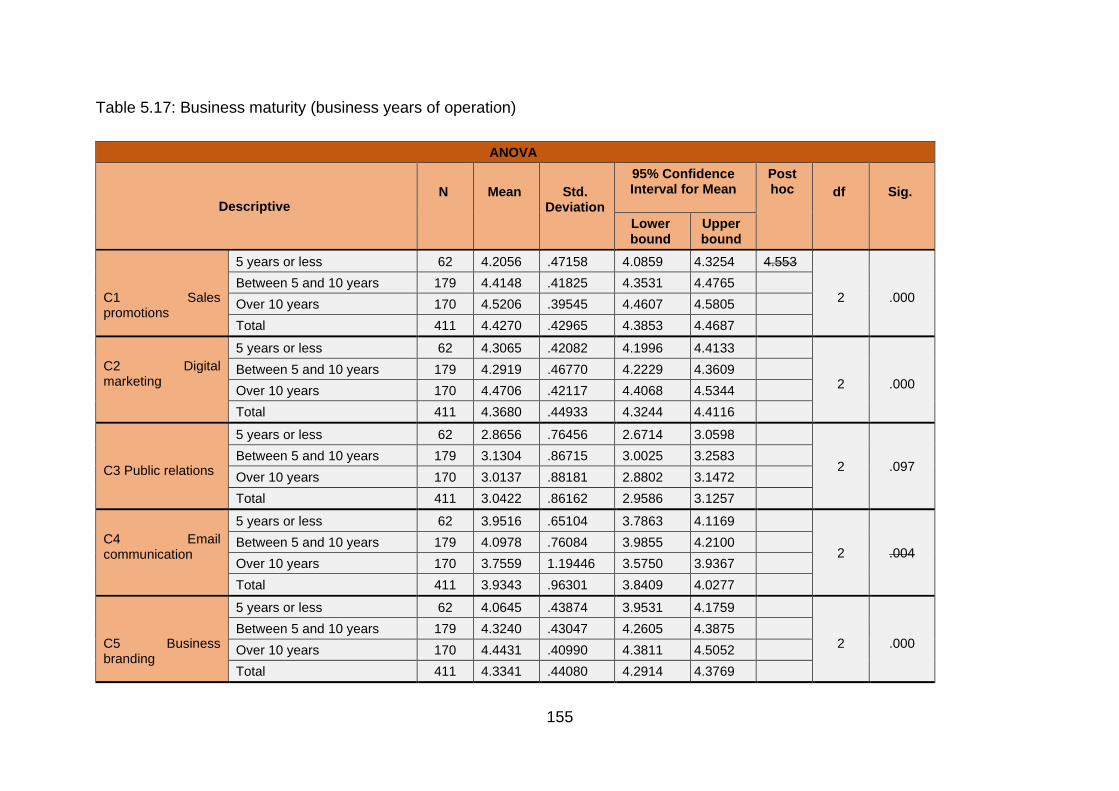
155
Table 5.17: Business maturity (business years of operation)
ANOVA
Descriptive
N
Mean
Std. Deviation
95% Confidence Interval for Mean
Post hoc
df
Sig.
Lower bound
Upper bound
C1 Sales promotions
5 years or less 62 4.2056 .47158 4.0859 4.3254 4.553
2
.000 Between 5 and 10 years 179 4.4148 .41825 4.3531 4.4765
Over 10 years 170 4.5206 .39545 4.4607 4.5805
Total 411 4.4270 .42965 4.3853 4.4687
C2 Digital marketing
5 years or less 62 4.3065 .42082 4.1996 4.4133
2
.000 Between 5 and 10 years 179 4.2919 .46770 4.2229 4.3609
Over 10 years 170 4.4706 .42117 4.4068 4.5344
Total 411 4.3680 .44933 4.3244 4.4116
C3 Public relations
5 years or less 62 2.8656 .76456 2.6714 3.0598
2 .097 Between 5 and 10 years 179 3.1304 .86715 3.0025 3.2583
Over 10 years 170 3.0137 .88181 2.8802 3.1472
Total 411 3.0422 .86162 2.9586 3.1257
C4 Email communication
5 years or less 62 3.9516 .65104 3.7863 4.1169
2 .004 Between 5 and 10 years 179 4.0978 .76084 3.9855 4.2100
Over 10 years 170 3.7559 1.19446 3.5750 3.9367
Total 411 3.9343 .96301 3.8409 4.0277
C5 Business branding
5 years or less 62 4.0645 .43874 3.9531 4.1759
2
.000 Between 5 and 10 years 179 4.3240 .43047 4.2605 4.3875
Over 10 years 170 4.4431 .40990 4.3811 4.5052
Total 411 4.3341 .44080 4.2914 4.3769
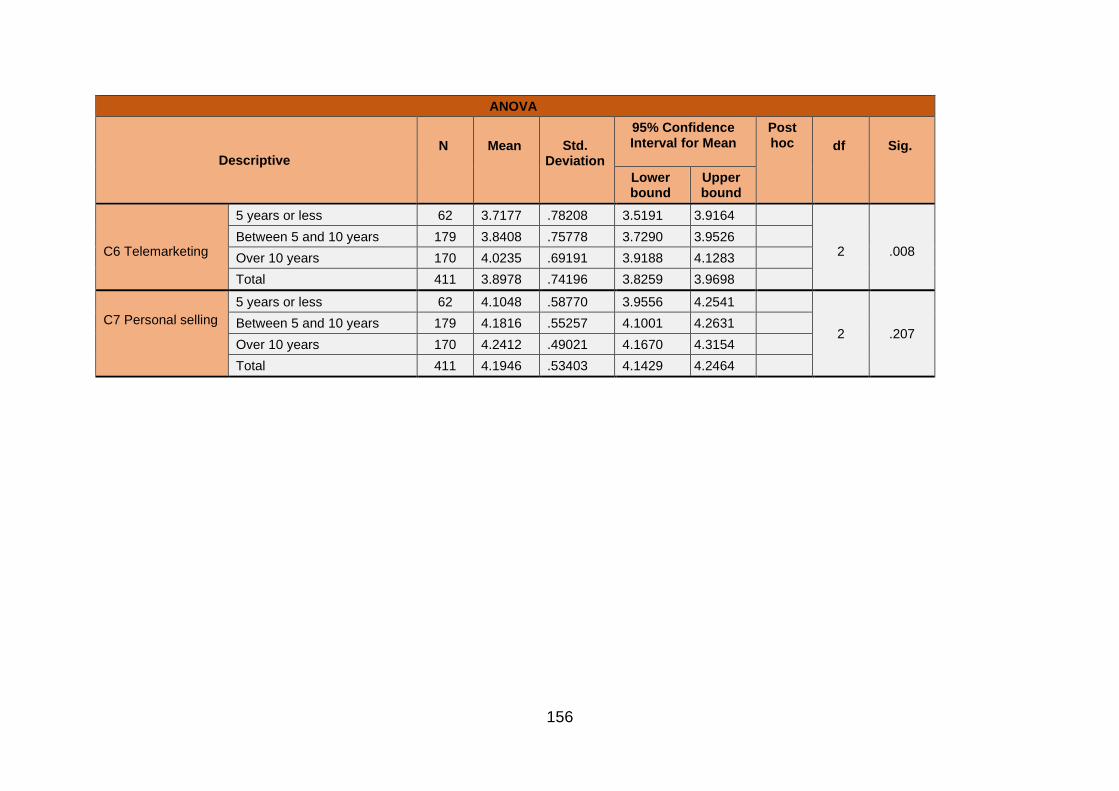
156
ANOVA
Descriptive
N
Mean
Std. Deviation
95% Confidence Interval for Mean
Post hoc
df
Sig.
Lower bound
Upper bound
C6 Telemarketing
5 years or less 62 3.7177 .78208 3.5191 3.9164
2
.008 Between 5 and 10 years 179 3.8408 .75778 3.7290 3.9526
Over 10 years 170 4.0235 .69191 3.9188 4.1283
Total 411 3.8978 .74196 3.8259 3.9698
C7 Personal selling
5 years or less 62 4.1048 .58770 3.9556 4.2541
2 .207 Between 5 and 10 years 179 4.1816 .55257 4.1001 4.2631
Over 10 years 170 4.2412 .49021 4.1670 4.3154
Total 411 4.1946 .53403 4.1429 4.2464
157
Specifically, in the case where a business have been in existence for 5 years or less
(M=4.21, SD=.472), respondents score significantly lower on the C1 digital marketing
dimension than respondents from businesses that are between 5 and 10 years
(M=4.41, SD=.418) old, as well as those from businesses that have been in existence
for more than 10 years (M=2.33, SD=.65). Respondents from businesses that are
between 5 and 10 years (M=4.41, SD=.418) score significantly (marginally) lower on
this dimension than respondents from businesses that have been in existence for more
than 10 years (M=2.33, SD=.65). In the case where a business has been in existence
for more than 10 years (M=4.47, SD=.421), respondents score significantly higher on
the C2 use of digital marketing dimension than respondents from businesses that are
between 5 and 10 years (M=4.29, SD=.468) old, as well as marginally higher than
those from businesses that have been in existence for more than 5 years or less
(M=2.31, SD=.421).
The study found that the more the years of business operation, the easier the
acceptance of relevant marketing communication strategies. For example, SMEs that
have been in existence for more than 10 years scored significantly high in both the
sales promotions and digital marketing usage. This is backed by the study conducted
by Buil et al. (2013) that marketing communication strategy positively impacts on
SMEs performance, which is caused by the impact on business experience, brand
knowledge, etcetera. Business maturity has a tremendous impact of the adoption of
new marketing strategies and the way the owners/manager respond to business
marketing, which ensures the good performance and business competitiveness
(Kariithi 2015). Also, Tsikirayi et al. (2013) state that, the more the SME has been in
operation the more the positive attitude towards applying marketing communication
strategies. Van Scheers and Radipere (2008) also emphasise the importance of
positive attitudes towards marketing communication strategies as this leads to the
success of the entity. Wamb and Carter (2016) found that most of the SMEs have
adopted social media as part of marketing communication tools. In summary, the
agreement level goes up as the maturity increases.
In the case where a business has been in existence for more than 10 years (M=3.76,
SD=1.194), respondents score significantly lower on the C4 the use email as a
communication tool dimension than respondents from businesses that are between 5
158
and 10 years (M=4.10, SD=.761) old. In the case where a business have been in
existence for 5 years or less (M=4.06, SD=.439), respondents score significantly lower
on the C5 Business branding dimension than respondents from businesses that are
between 5 and 10 years (M=4.32, SD=.430) old as well as those from businesses that
have been in existence for more than 10 years (M=4.44, SD=.410). Respondents from
businesses that are between 5 and 10 years (M=4.32, SD=.430) score significantly
lower on this dimension than respondents from businesses that have been in
existence for more than 10 years (M=4.44, SD=.410). In summary, the agreement
level goes up as the maturity increases.
In the case where a business has been in existence for more than 10 years (M=4.02,
SD=.692), respondents score significantly higher on the C6 telemarketing dimension
than respondents from businesses that are between 5 years or less old (M=3.72,
SD=.782). Based on the above findings, it is apparent that business maturity goes with
marketing communication understanding, however with the use of email to
communicate with customers is visa-versa, because businesses that are above 10
years in operation seems not to understand the usage of email to communicate with
customers. However, the study conducted by Cant et al. (2016) found that emails were
the utmost internet-based method used by SMEs to communicate their special offers.
The findings of the study about branding is in line with Razeghi, Roosta, Alemtabriz
and Gharache (2014) branding brought SMEs differentiation and consistency of image
with reality, it was also found that SMEs that operated for a long-time understand
branding and its impact.
5.7.2 Business marketing training and marketing communication
The independent samples t-test was used to investigate whether the respondents
have attended training has a significant effect on the level of agreement with
statements about the business marketing communications in their businesses. refer
to Table 5.18.
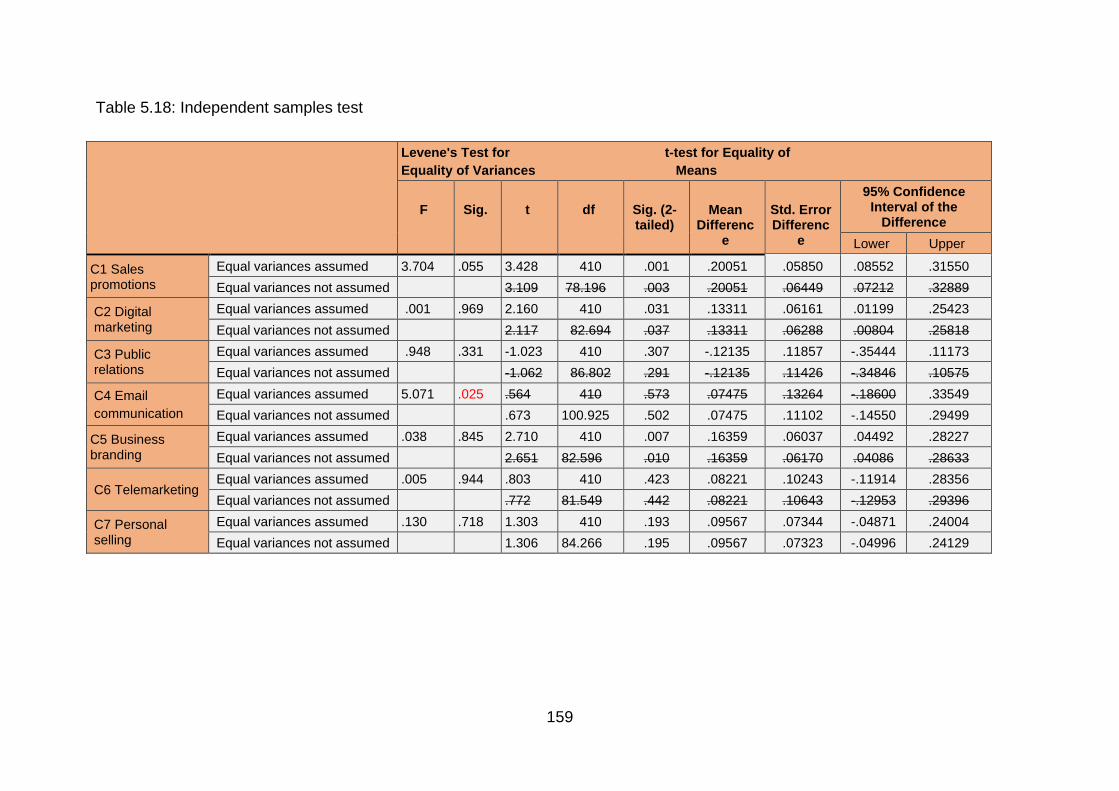
159
Table 5.18: Independent samples test
Levene's Test for t-test for Equality of
Equality of Variances Means
F
Sig.
t
df
Sig. (2-tailed)
Mean Differenc
e
Std. Error Differenc
e
95% Confidence Interval of the
Difference
Lower Upper
C1 Sales promotions
Equal variances assumed 3.704 .055 3.428 410 .001 .20051 .05850 .08552 .31550
Equal variances not assumed 3.109 78.196 .003 .20051 .06449 .07212 .32889
C2 Digital marketing
Equal variances assumed .001 .969 2.160 410 .031 .13311 .06161 .01199 .25423
Equal variances not assumed 2.117 82.694 .037 .13311 .06288 .00804 .25818
C3 Public relations
Equal variances assumed .948 .331 -1.023 410 .307 -.12135 .11857 -.35444 .11173
Equal variances not assumed -1.062 86.802 .291 -.12135 .11426 -.34846 .10575
C4 Email
communication
Equal variances assumed 5.071 .025 .564 410 .573 .07475 .13264 -.18600 .33549
Equal variances not assumed .673 100.925 .502 .07475 .11102 -.14550 .29499
C5 Business branding
Equal variances assumed .038 .845 2.710 410 .007 .16359 .06037 .04492 .28227
Equal variances not assumed 2.651 82.596 .010 .16359 .06170 .04086 .28633
C6 Telemarketing Equal variances assumed .005 .944 .803 410 .423 .08221 .10243 -.11914 .28356
Equal variances not assumed .772 81.549 .442 .08221 .10643 -.12953 .29396
C7 Personal selling
Equal variances assumed .130 .718 1.303 410 .193 .09567 .07344 -.04871 .24004
Equal variances not assumed 1.306 84.266 .195 .09567 .07323 -.04996 .24129
160
The independent samples t-test found that whether the respondents have attended
training on average has a significant effect on C1 sales promotion (t (92.02) =-2.492,
p<.05), C2 digital marketing (t (410) = -3.696, p<.001) and C5 Business branding (t
(410) =-3.696, p<.001). Specifically, those who have attended training (M=4.46,
SD=.414) have a significantly higher agreement score than those who have not
attended training (M=4.26, SD=.477) regarding C1 Sales promotions.
Those who have attended training (M=4.39, SD=.445) have a significantly higher
agreement score than those who have not attended training (M=4.25, SD=.058)
regarding C2 Use of digital marketing. Those who have attended training (M=4.37,
SD=.436) have a significantly higher agreement score than those who have not
attended training (M=4.19, SD=.057) regarding C5 Business branding. From the study
findings it is obvious that marketing training plays a very important role in marketing
SMEs since the respondents that attended marketing training have lesser challenges
in understanding marketing communication strategies. The study conducted by Van
Scheers (2011) found that the enhancement of SME managers’ marketing skills will
improve business success and rejuvenate economy. In summary, training seems to
lead to higher levels of agreement on the C1, C2 and C5 dimensions. Refer to Table
5.18.
5.7.3 Business annual turnover and marketing communication
The one-way ANOVA test was used to investigate whether annual turnover has a
significant effect on the level of agreement with statements about the business
marketing communication in their businesses. The one-way ANOVA and Welch
ANOVA tests found that, on average, annual turnover has a highly significant effect
on the respondents’ agreement level with statements regarding the business
marketing communication strategies in their businesses regarding 5 of the dimensions
(C1, C2, C5, C6, C7) as shown in Table 5.19.
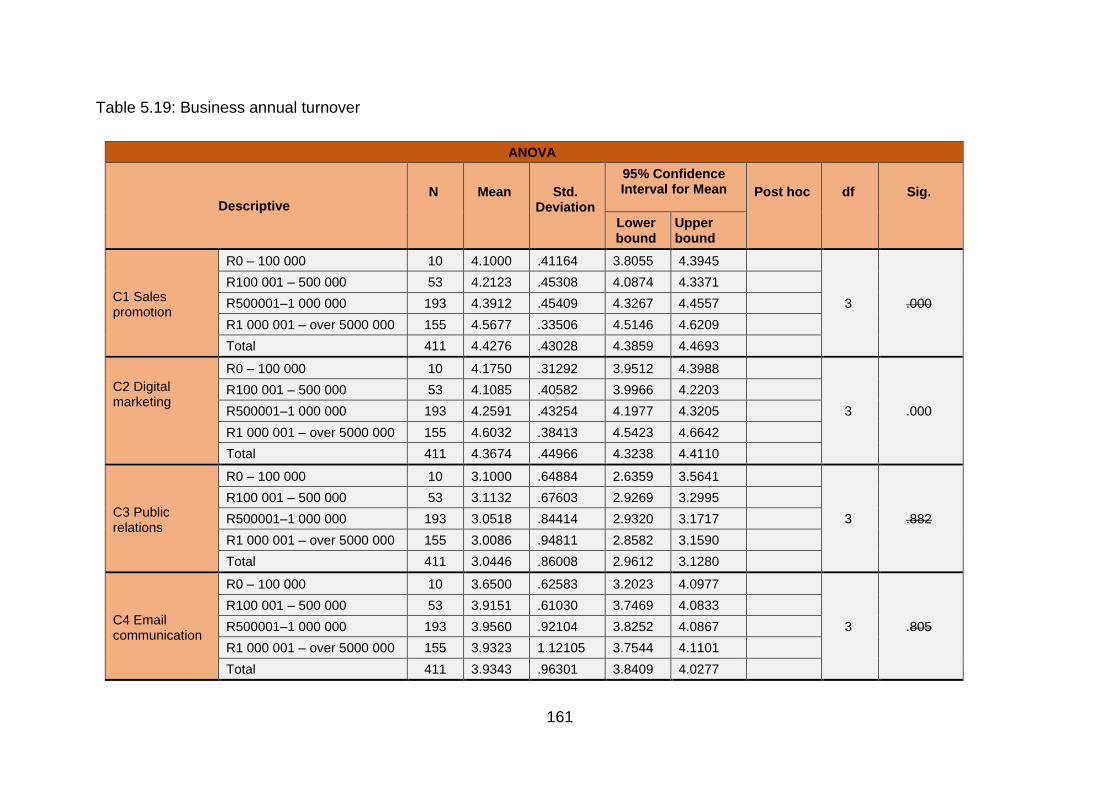
161
Table 5.19: Business annual turnover
ANOVA
Descriptive
N
Mean
Std. Deviation
95% Confidence Interval for Mean
Post hoc
df
Sig.
Lower bound
Upper bound
C1 Sales promotion
R0 – 100 000 10 4.1000 .41164 3.8055 4.3945
3 .000
R100 001 – 500 000 53 4.2123 .45308 4.0874 4.3371
R500001–1 000 000 193 4.3912 .45409 4.3267 4.4557
R1 000 001 – over 5000 000 155 4.5677 .33506 4.5146 4.6209
Total 411 4.4276 .43028 4.3859 4.4693
C2 Digital marketing
R0 – 100 000 10 4.1750 .31292 3.9512 4.3988
3 .000
R100 001 – 500 000 53 4.1085 .40582 3.9966 4.2203
R500001–1 000 000 193 4.2591 .43254 4.1977 4.3205
R1 000 001 – over 5000 000 155 4.6032 .38413 4.5423 4.6642
Total 411 4.3674 .44966 4.3238 4.4110
C3 Public relations
R0 – 100 000 10 3.1000 .64884 2.6359 3.5641
3 .882
R100 001 – 500 000 53 3.1132 .67603 2.9269 3.2995
R500001–1 000 000 193 3.0518 .84414 2.9320 3.1717
R1 000 001 – over 5000 000 155 3.0086 .94811 2.8582 3.1590
Total 411 3.0446 .86008 2.9612 3.1280
C4 Email communication
R0 – 100 000 10 3.6500 .62583 3.2023 4.0977
3 .805
R100 001 – 500 000 53 3.9151 .61030 3.7469 4.0833
R500001–1 000 000 193 3.9560 .92104 3.8252 4.0867
R1 000 001 – over 5000 000 155 3.9323 1.12105 3.7544 4.1101
Total 411 3.9343 .96301 3.8409 4.0277
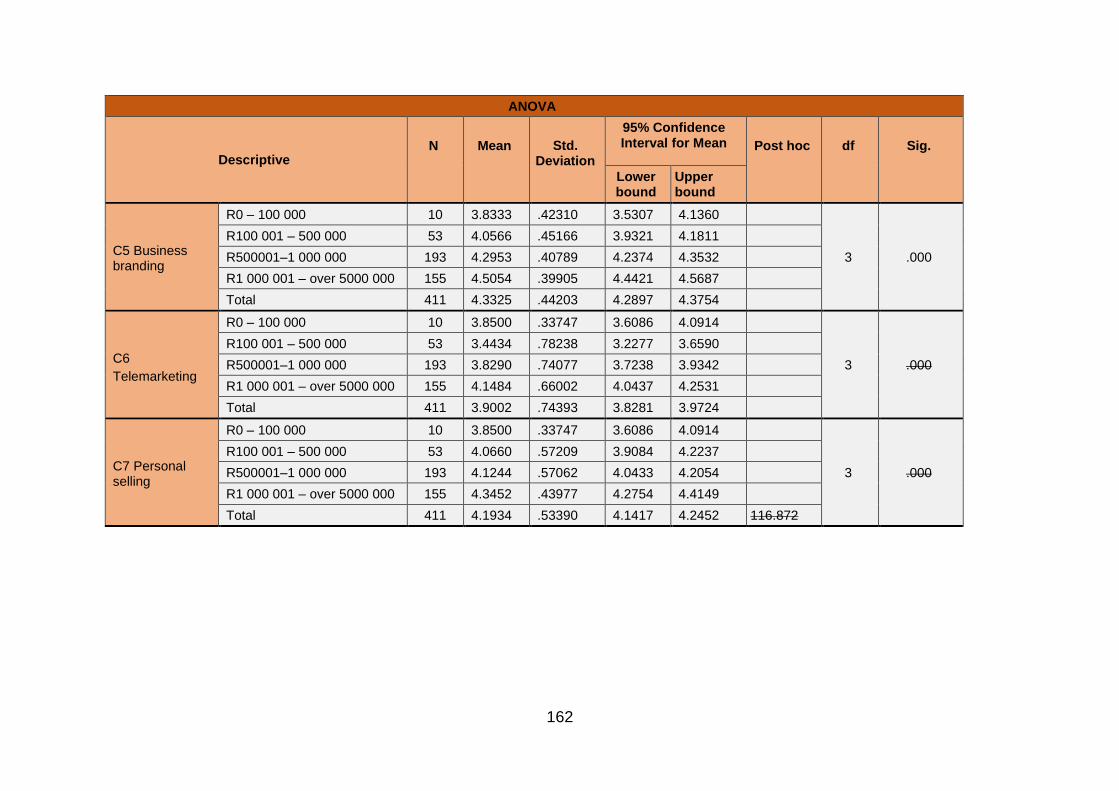
162
ANOVA
Descriptive
N
Mean
Std. Deviation
95% Confidence Interval for Mean
Post hoc
df
Sig.
Lower bound
Upper bound
C5 Business branding
R0 – 100 000 10 3.8333 .42310 3.5307 4.1360
3 .000
R100 001 – 500 000 53 4.0566 .45166 3.9321 4.1811
R500001–1 000 000 193 4.2953 .40789 4.2374 4.3532
R1 000 001 – over 5000 000 155 4.5054 .39905 4.4421 4.5687
Total 411 4.3325 .44203 4.2897 4.3754
C6
Telemarketing
R0 – 100 000 10 3.8500 .33747 3.6086 4.0914
3 .000
R100 001 – 500 000 53 3.4434 .78238 3.2277 3.6590
R500001–1 000 000 193 3.8290 .74077 3.7238 3.9342
R1 000 001 – over 5000 000 155 4.1484 .66002 4.0437 4.2531
Total 411 3.9002 .74393 3.8281 3.9724
C7 Personal selling
R0 – 100 000 10 3.8500 .33747 3.6086 4.0914
3 .000
R100 001 – 500 000 53 4.0660 .57209 3.9084 4.2237
R500001–1 000 000 193 4.1244 .57062 4.0433 4.2054
R1 000 001 – over 5000 000 155 4.3452 .43977 4.2754 4.4149
Total 411 4.1934 .53390 4.1417 4.2452 116.872
163
Specifically, in the case where a business has an annual turnover of R1 000 001 to
over R5 000 000 (M=4.57, SD=.335), respondents score significantly higher on the C1
sales promotion dimension than respondents from businesses with an annual turnover
of R0 to R100 000 (M=4.10, SD=.412), an annual turnover of R100 001 to R500 000
(M=4.21, SD=.453) as well as those from businesses that have an annual turnover of
R500 001 to R1 000 000 (M=4.39, SD=.454). Respondents from businesses with an
annual turnover of R500 001 to R1 000 000 (M=4.39, SD=.454) score significantly
higher on this dimension than respondents from businesses that have annual
turnovers of R100 001 to R500 000 (M=4.21, SD=.453) on this dimension. In
summary, the agreement level goes up as the annual turnover increases.
In the case where a business has an annual turnover of R1 000 001 to over R5 000
000 (M=4.60, SD=.384), respondents score significantly higher on the C2 digital
marketing dimension than respondents from businesses with an annual turnover of R0
to R100 000 (M=4.18, SD=.313), an annual turnover of R100 001 to R500 000
(M=4.11, SD=.406) as well as those from businesses that have an annual turnover of
R500 001 to R1 000 000 (M=4.26, SD=.433). Respondents from businesses with an
annual turnover of R500 001 to R1 000 000 (M=4.26, SD=.433) score significantly
higher on this dimension than respondents from businesses that have annual
turnovers of R100 001 to R500 000 (M=4.11, SD=.406) on this dimension.
As outlined in the above table, in cases where a business has an annual turnover of
R1 000 001 to over R5 000 000 (M=4.51, SD=.399), respondents score significantly
higher on the C5 Business branding dimension than respondents from businesses
with an annual turnover of R0 to R100 000 (M=3.83, SD=.423), an annual turnover of
R100 001 to R500 000 (M=4.06, SD=.452) as well as those from businesses that has
an annual turnover of R500 001 to R1 000 000 (M=4.30, SD=.408). Additionally
respondents from businesses with an annual turnover of R500 001 to R1 000 000
(M=4.30, SD=.408) score significantly higher on this dimension than respondents from
businesses that have annual turnovers of R0 to R100 000 (M=3.83, SD=.423) and
R100 001 to R500 000 (M=4.06, SD=.452) on this dimension. In summary, the
agreement level goes up as the annual turnover increases.
The findings are backed by Mumel, Hocovar and Snoi (2007) stating that there is a
significant relationship between marketing communication strategies and business
164
turnover; the higher the turnover the higher the application of marketing
communication activities. However, SMEs seeking better business turnover and
performance should focus more on using specific marketing communication activities
(Abernathy, Kubick & Masli 2013). In summary, the agreement level goes up as the
annual turnover increases.
As mentioned in Table 5.17, in the case where a business has an annual turnover of
R1 000 001 to over R5 000 000 (M=4.15, SD=.660), respondents score significantly
higher on the C6 telemarketing dimension than respondents from businesses with an
annual turnover of R100 001 to R500 000 (M=3.44, SD=.782) as well as those from
businesses that have an annual turnover of R500 001 to R1 000 000 (M=3.83, SD=
.741). Additionally, respondents from businesses with an annual turnover of R500 001
to R1 000 000 (M=3.83, SD=.741) score significantly higher on this dimension than
respondents from businesses that have annual turnovers of R100 001 to R500 000
(M=3.44, SD=.457822) on this dimension.
In the case where a business has an annual turnover of R1 000 001 to over R5 000
000 (M=4.35, SD=.440), respondents score significantly higher on the C7 Personal
selling dimension than respondents from businesses with an annual turnover of R0 to
R100 000 (M=3.85, SD=.337), an annual turnover of R100 001 to R500 000 (M=4.07,
SD=.572) as well as those from businesses that has an annual turnover of R500 001
to R1 000 000 (M=4.12, SD=.5. This shows that businesses with higher turnover are
likely to use and experience the benefits of personal selling than the once with
minimum turnover. Personal selling as part of Marketing communication strategies
offers the path for using the business resources competently to accomplish its
established goals and objectives (Adewale et al. 2013).
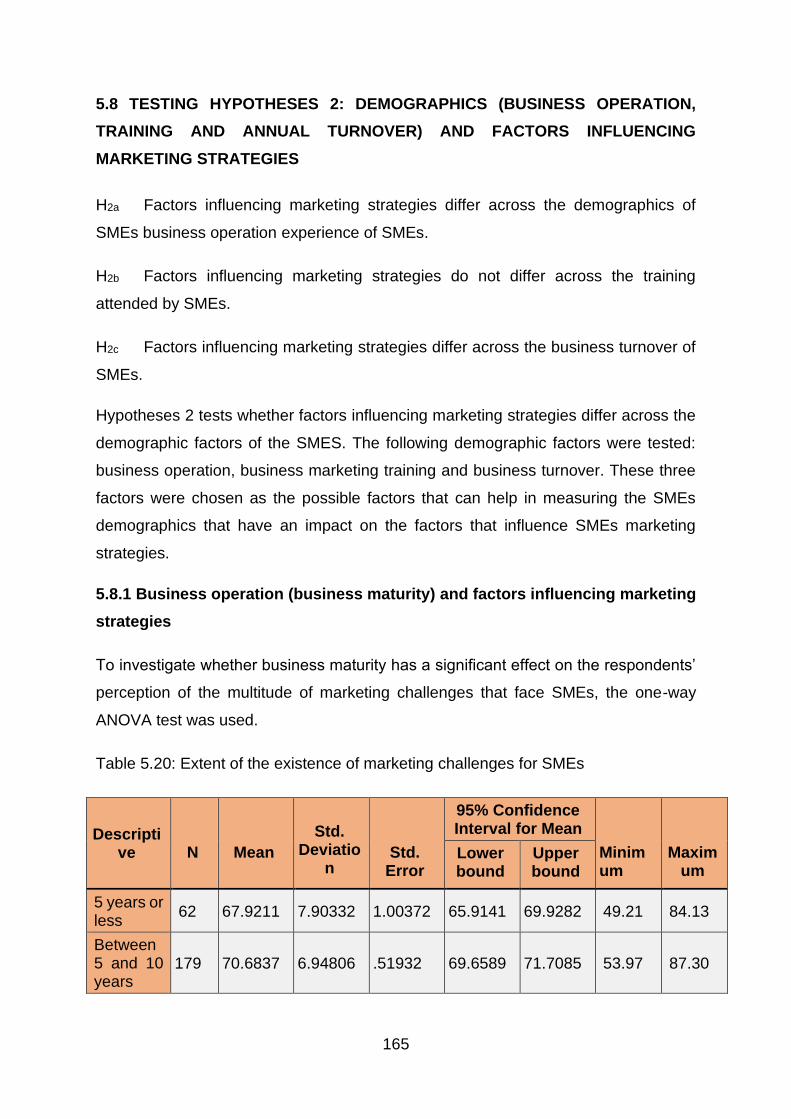
165
5.8 TESTING HYPOTHESES 2: DEMOGRAPHICS (BUSINESS OPERATION,
TRAINING AND ANNUAL TURNOVER) AND FACTORS INFLUENCING
MARKETING STRATEGIES
H2a Factors influencing marketing strategies differ across the demographics of
SMEs business operation experience of SMEs.
H2b Factors influencing marketing strategies do not differ across the training
attended by SMEs.
H2c Factors influencing marketing strategies differ across the business turnover of
SMEs.
Hypotheses 2 tests whether factors influencing marketing strategies differ across the
demographic factors of the SMES. The following demographic factors were tested:
business operation, business marketing training and business turnover. These three
factors were chosen as the possible factors that can help in measuring the SMEs
demographics that have an impact on the factors that influence SMEs marketing
strategies.
5.8.1 Business operation (business maturity) and factors influencing marketing
strategies
To investigate whether business maturity has a significant effect on the respondents’
perception of the multitude of marketing challenges that face SMEs, the one-way
ANOVA test was used.
Table 5.20: Extent of the existence of marketing challenges for SMEs
Descriptive
N
Mean
Std. Deviatio
n
Std. Error
95% Confidence Interval for Mean
Minimum
Maximum
Lower bound
Upper bound
5 years or less
62 67.9211 7.90332 1.00372 65.9141 69.9282 49.21 84.13
Between 5 and 10 years
179 70.6837 6.94806 .51932 69.6589 71.7085 53.97 87.30
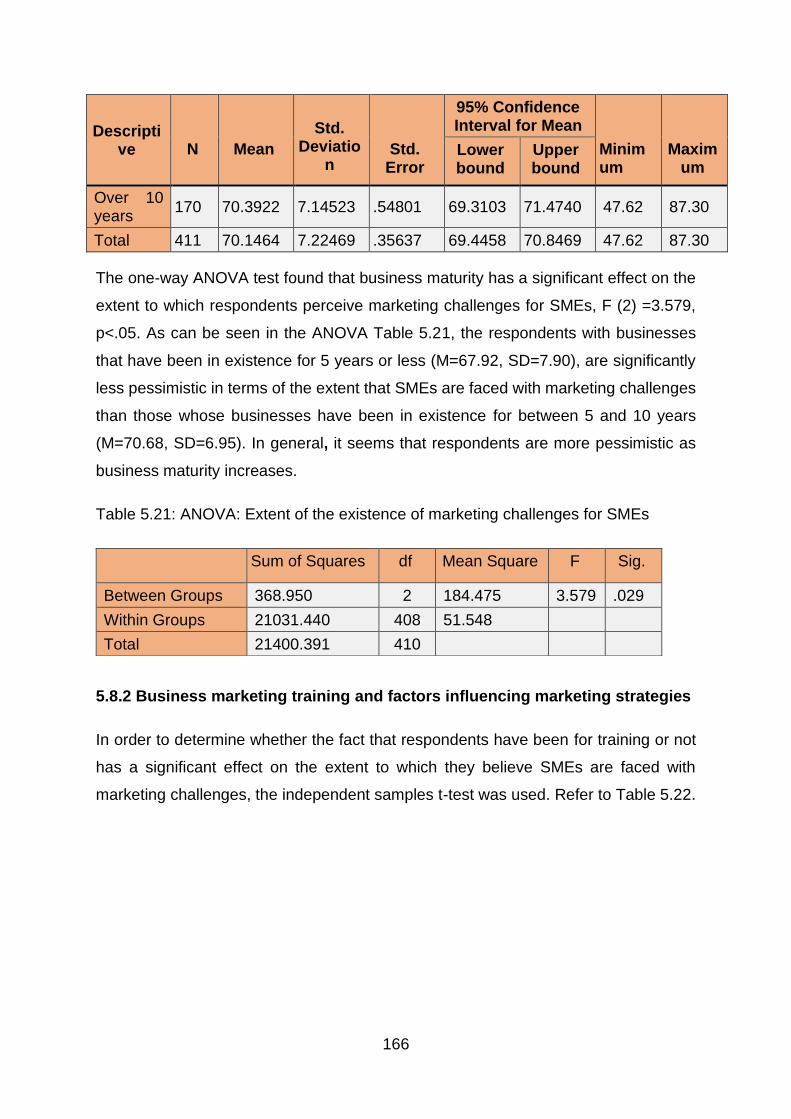
166
Descriptive
N
Mean
Std. Deviatio
n
Std. Error
95% Confidence Interval for Mean
Minimum
Maximum
Lower bound
Upper bound
Over 10 years
170 70.3922 7.14523 .54801 69.3103 71.4740 47.62 87.30
Total 411 70.1464 7.22469 .35637 69.4458 70.8469 47.62 87.30
The one-way ANOVA test found that business maturity has a significant effect on the
extent to which respondents perceive marketing challenges for SMEs, F (2) =3.579,
p<.05. As can be seen in the ANOVA Table 5.21, the respondents with businesses
that have been in existence for 5 years or less (M=67.92, SD=7.90), are significantly
less pessimistic in terms of the extent that SMEs are faced with marketing challenges
than those whose businesses have been in existence for between 5 and 10 years
(M=70.68, SD=6.95). In general, it seems that respondents are more pessimistic as
business maturity increases.
Table 5.21: ANOVA: Extent of the existence of marketing challenges for SMEs
5.8.2 Business marketing training and factors influencing marketing strategies
In order to determine whether the fact that respondents have been for training or not
has a significant effect on the extent to which they believe SMEs are faced with
marketing challenges, the independent samples t-test was used. Refer to Table 5.22.
Sum of Squares df Mean Square F Sig.
Between Groups 368.950 2 184.475 3.579 .029
Within Groups 21031.440 408 51.548
Total 21400.391 410
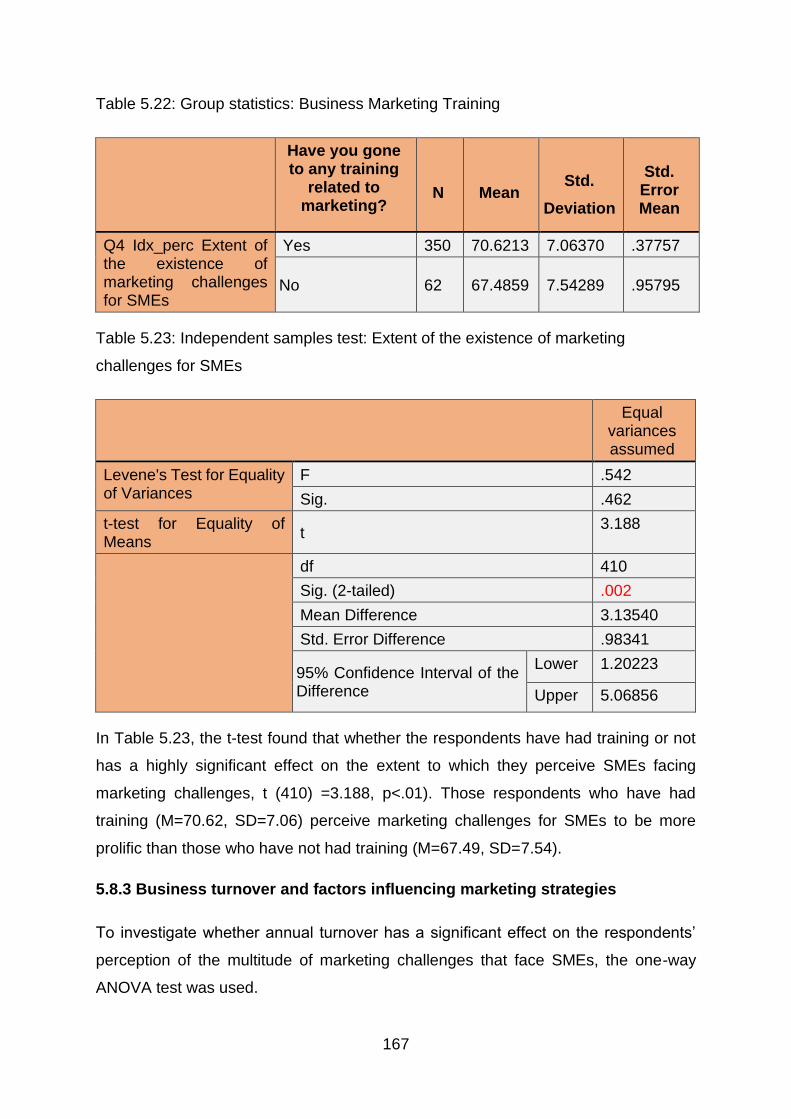
167
Table 5.22: Group statistics: Business Marketing Training
Have you gone to any training
related to marketing?
N
Mean
Std.
Deviation
Std. Error Mean
Q4 Idx_perc Extent of the existence of marketing challenges for SMEs
Yes 350 70.6213 7.06370 .37757
No 62 67.4859 7.54289 .95795
Table 5.23: Independent samples test: Extent of the existence of marketing
challenges for SMEs
Equal
variances assumed
Levene's Test for Equality of Variances
F .542
Sig. .462
t-test for Equality of Means
t 3.188
df 410
Sig. (2-tailed) .002
Mean Difference 3.13540
Std. Error Difference .98341
95% Confidence Interval of the Difference
Lower 1.20223
Upper 5.06856
In Table 5.23, the t-test found that whether the respondents have had training or not
has a highly significant effect on the extent to which they perceive SMEs facing
marketing challenges, t (410) =3.188, p<.01). Those respondents who have had
training (M=70.62, SD=7.06) perceive marketing challenges for SMEs to be more
prolific than those who have not had training (M=67.49, SD=7.54).
5.8.3 Business turnover and factors influencing marketing strategies
To investigate whether annual turnover has a significant effect on the respondents’
perception of the multitude of marketing challenges that face SMEs, the one-way
ANOVA test was used.
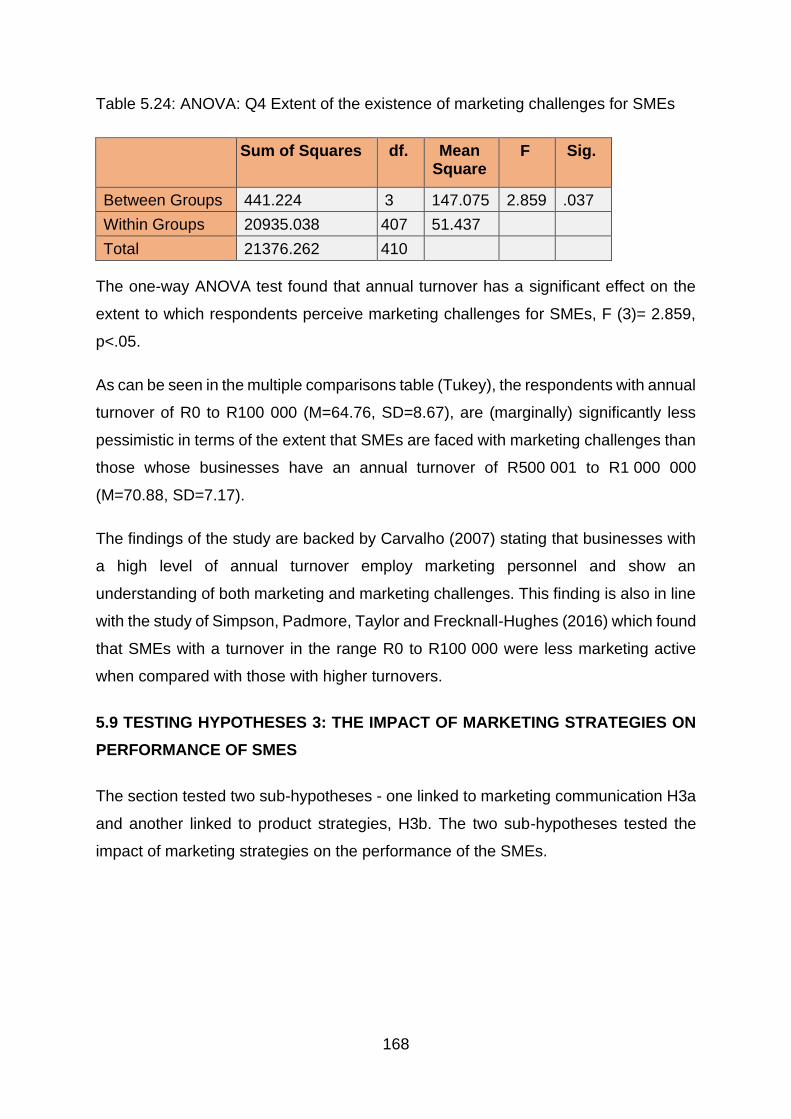
168
Table 5.24: ANOVA: Q4 Extent of the existence of marketing challenges for SMEs
Sum of Squares df. Mean
Square F Sig.
Between Groups 441.224 3 147.075 2.859 .037
Within Groups 20935.038 407 51.437
Total 21376.262 410
The one-way ANOVA test found that annual turnover has a significant effect on the
extent to which respondents perceive marketing challenges for SMEs, F (3)= 2.859,
p<.05.
As can be seen in the multiple comparisons table (Tukey), the respondents with annual
turnover of R0 to R100 000 (M=64.76, SD=8.67), are (marginally) significantly less
pessimistic in terms of the extent that SMEs are faced with marketing challenges than
those whose businesses have an annual turnover of R500 001 to R1 000 000
(M=70.88, SD=7.17).
The findings of the study are backed by Carvalho (2007) stating that businesses with
a high level of annual turnover employ marketing personnel and show an
understanding of both marketing and marketing challenges. This finding is also in line
with the study of Simpson, Padmore, Taylor and Frecknall-Hughes (2016) which found
that SMEs with a turnover in the range R0 to R100 000 were less marketing active
when compared with those with higher turnovers.
5.9 TESTING HYPOTHESES 3: THE IMPACT OF MARKETING STRATEGIES ON
PERFORMANCE OF SMES
The section tested two sub-hypotheses - one linked to marketing communication H3a
and another linked to product strategies, H3b. The two sub-hypotheses tested the
impact of marketing strategies on the performance of the SMEs.
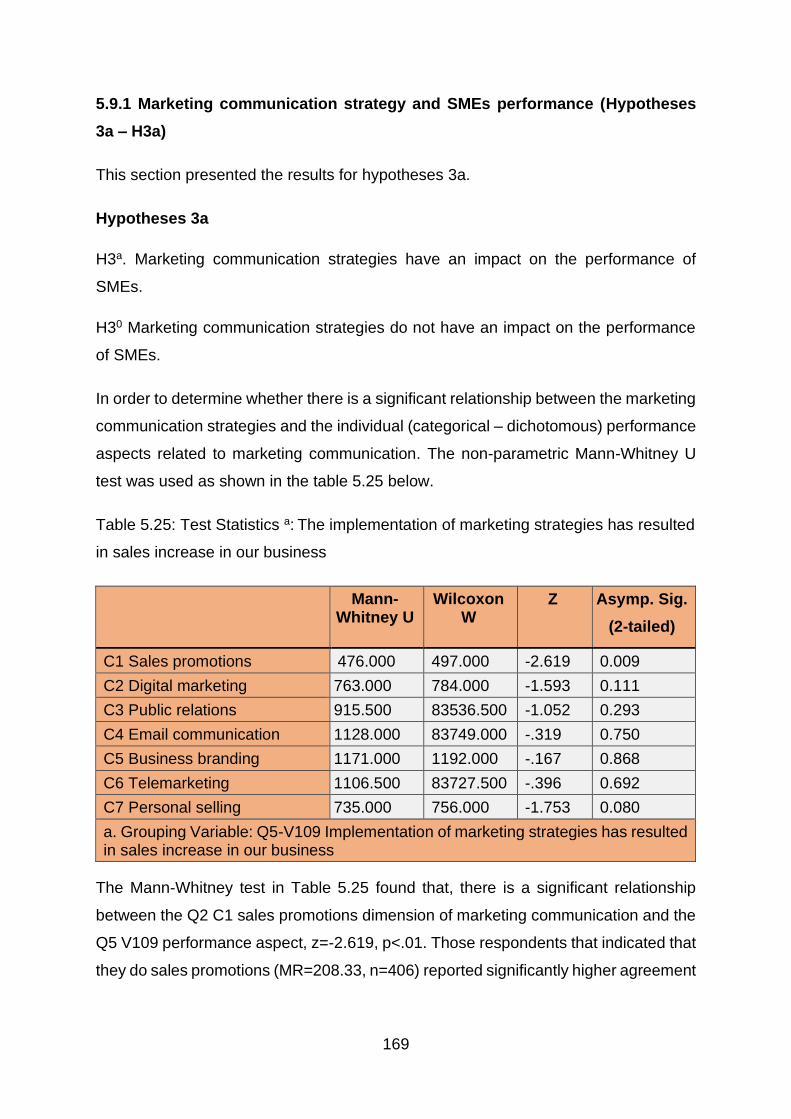
169
5.9.1 Marketing communication strategy and SMEs performance (Hypotheses
3a – H3a)
This section presented the results for hypotheses 3a.
Hypotheses 3a
H3a. Marketing communication strategies have an impact on the performance of
SMEs.
H30 Marketing communication strategies do not have an impact on the performance
of SMEs.
In order to determine whether there is a significant relationship between the marketing
communication strategies and the individual (categorical – dichotomous) performance
aspects related to marketing communication. The non-parametric Mann-Whitney U
test was used as shown in the table 5.25 below.
Table 5.25: Test Statistics a: The implementation of marketing strategies has resulted
in sales increase in our business
Mann-
Whitney U Wilcoxon
W Z Asymp. Sig.
(2-tailed)
C1 Sales promotions 476.000 497.000 -2.619 0.009
C2 Digital marketing 763.000 784.000 -1.593 0.111
C3 Public relations 915.500 83536.500 -1.052 0.293
C4 Email communication 1128.000 83749.000 -.319 0.750
C5 Business branding 1171.000 1192.000 -.167 0.868
C6 Telemarketing 1106.500 83727.500 -.396 0.692
C7 Personal selling 735.000 756.000 -1.753 0.080
a. Grouping Variable: Q5-V109 Implementation of marketing strategies has resulted in sales increase in our business
The Mann-Whitney test in Table 5.25 found that, there is a significant relationship
between the Q2 C1 sales promotions dimension of marketing communication and the
Q5 V109 performance aspect, z=-2.619, p<.01. Those respondents that indicated that
they do sales promotions (MR=208.33, n=406) reported significantly higher agreement
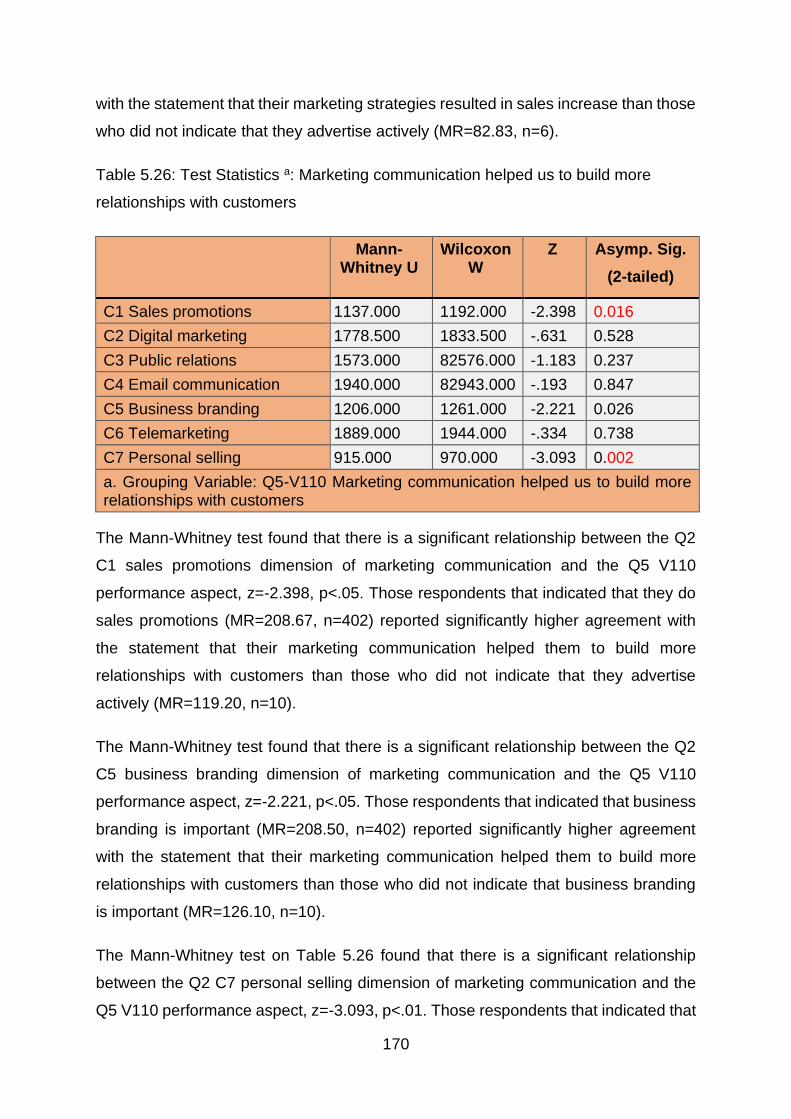
170
with the statement that their marketing strategies resulted in sales increase than those
who did not indicate that they advertise actively (MR=82.83, n=6).
Table 5.26: Test Statistics a: Marketing communication helped us to build more
relationships with customers
Mann-
Whitney U Wilcoxon
W Z Asymp. Sig.
(2-tailed)
C1 Sales promotions 1137.000 1192.000 -2.398 0.016
C2 Digital marketing 1778.500 1833.500 -.631 0.528
C3 Public relations 1573.000 82576.000 -1.183 0.237
C4 Email communication 1940.000 82943.000 -.193 0.847
C5 Business branding 1206.000 1261.000 -2.221 0.026
C6 Telemarketing 1889.000 1944.000 -.334 0.738
C7 Personal selling 915.000 970.000 -3.093 0.002
a. Grouping Variable: Q5-V110 Marketing communication helped us to build more relationships with customers
The Mann-Whitney test found that there is a significant relationship between the Q2
C1 sales promotions dimension of marketing communication and the Q5 V110
performance aspect, z=-2.398, p<.05. Those respondents that indicated that they do
sales promotions (MR=208.67, n=402) reported significantly higher agreement with
the statement that their marketing communication helped them to build more
relationships with customers than those who did not indicate that they advertise
actively (MR=119.20, n=10).
The Mann-Whitney test found that there is a significant relationship between the Q2
C5 business branding dimension of marketing communication and the Q5 V110
performance aspect, z=-2.221, p<.05. Those respondents that indicated that business
branding is important (MR=208.50, n=402) reported significantly higher agreement
with the statement that their marketing communication helped them to build more
relationships with customers than those who did not indicate that business branding
is important (MR=126.10, n=10).
The Mann-Whitney test on Table 5.26 found that there is a significant relationship
between the Q2 C7 personal selling dimension of marketing communication and the
Q5 V110 performance aspect, z=-3.093, p<.01. Those respondents that indicated that
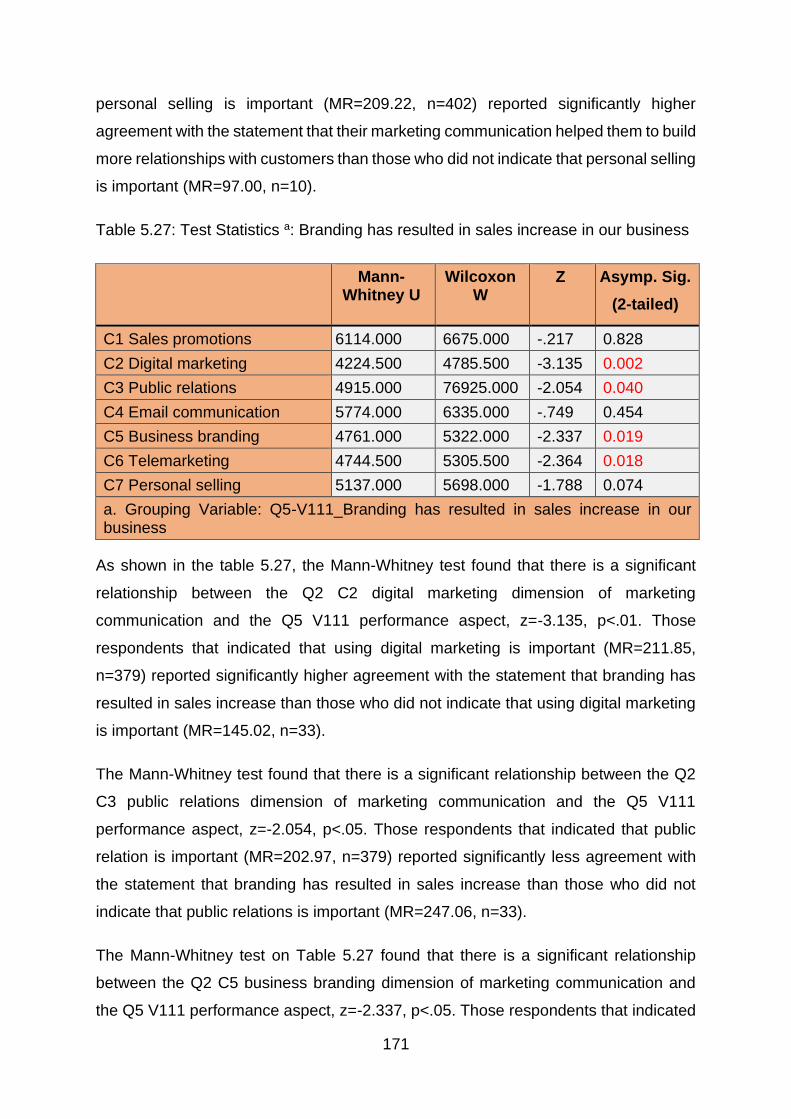
171
personal selling is important (MR=209.22, n=402) reported significantly higher
agreement with the statement that their marketing communication helped them to build
more relationships with customers than those who did not indicate that personal selling
is important (MR=97.00, n=10).
Table 5.27: Test Statistics a: Branding has resulted in sales increase in our business
Mann-
Whitney U Wilcoxon
W Z Asymp. Sig.
(2-tailed)
C1 Sales promotions 6114.000 6675.000 -.217 0.828
C2 Digital marketing 4224.500 4785.500 -3.135 0.002
C3 Public relations 4915.000 76925.000 -2.054 0.040
C4 Email communication 5774.000 6335.000 -.749 0.454
C5 Business branding 4761.000 5322.000 -2.337 0.019
C6 Telemarketing 4744.500 5305.500 -2.364 0.018
C7 Personal selling 5137.000 5698.000 -1.788 0.074
a. Grouping Variable: Q5-V111_Branding has resulted in sales increase in our business
As shown in the table 5.27, the Mann-Whitney test found that there is a significant
relationship between the Q2 C2 digital marketing dimension of marketing
communication and the Q5 V111 performance aspect, z=-3.135, p<.01. Those
respondents that indicated that using digital marketing is important (MR=211.85,
n=379) reported significantly higher agreement with the statement that branding has
resulted in sales increase than those who did not indicate that using digital marketing
is important (MR=145.02, n=33).
The Mann-Whitney test found that there is a significant relationship between the Q2
C3 public relations dimension of marketing communication and the Q5 V111
performance aspect, z=-2.054, p<.05. Those respondents that indicated that public
relation is important (MR=202.97, n=379) reported significantly less agreement with
the statement that branding has resulted in sales increase than those who did not
indicate that public relations is important (MR=247.06, n=33).
The Mann-Whitney test on Table 5.27 found that there is a significant relationship
between the Q2 C5 business branding dimension of marketing communication and
the Q5 V111 performance aspect, z=-2.337, p<.05. Those respondents that indicated
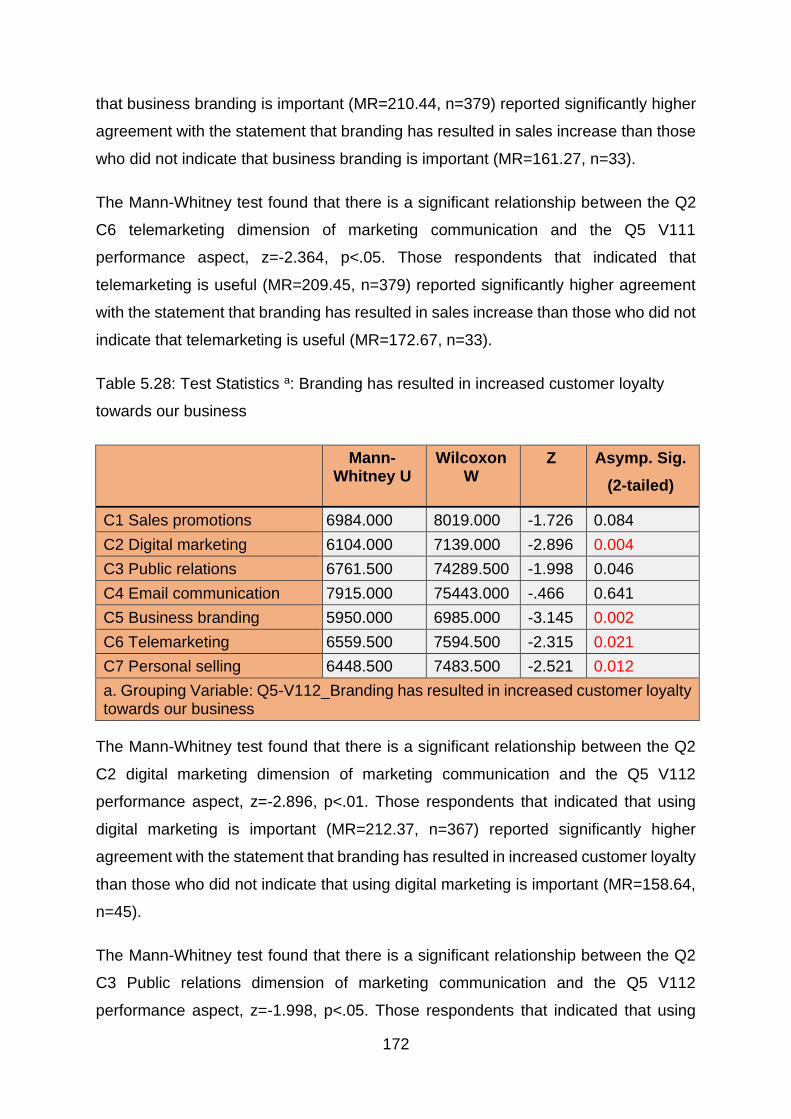
172
that business branding is important (MR=210.44, n=379) reported significantly higher
agreement with the statement that branding has resulted in sales increase than those
who did not indicate that business branding is important (MR=161.27, n=33).
The Mann-Whitney test found that there is a significant relationship between the Q2
C6 telemarketing dimension of marketing communication and the Q5 V111
performance aspect, z=-2.364, p<.05. Those respondents that indicated that
telemarketing is useful (MR=209.45, n=379) reported significantly higher agreement
with the statement that branding has resulted in sales increase than those who did not
indicate that telemarketing is useful (MR=172.67, n=33).
Table 5.28: Test Statistics a: Branding has resulted in increased customer loyalty
towards our business
Mann-
Whitney U Wilcoxon
W Z Asymp. Sig.
(2-tailed)
C1 Sales promotions 6984.000 8019.000 -1.726 0.084
C2 Digital marketing 6104.000 7139.000 -2.896 0.004
C3 Public relations 6761.500 74289.500 -1.998 0.046
C4 Email communication 7915.000 75443.000 -.466 0.641
C5 Business branding 5950.000 6985.000 -3.145 0.002
C6 Telemarketing 6559.500 7594.500 -2.315 0.021
C7 Personal selling 6448.500 7483.500 -2.521 0.012
a. Grouping Variable: Q5-V112_Branding has resulted in increased customer loyalty towards our business
The Mann-Whitney test found that there is a significant relationship between the Q2
C2 digital marketing dimension of marketing communication and the Q5 V112
performance aspect, z=-2.896, p<.01. Those respondents that indicated that using
digital marketing is important (MR=212.37, n=367) reported significantly higher
agreement with the statement that branding has resulted in increased customer loyalty
than those who did not indicate that using digital marketing is important (MR=158.64,
n=45).
The Mann-Whitney test found that there is a significant relationship between the Q2
C3 Public relations dimension of marketing communication and the Q5 V112
performance aspect, z=-1.998, p<.05. Those respondents that indicated that using
173
public relations is important (MR=202.42, n=367) reported significantly less agreement
with the statement that branding has resulted in increased customer loyalty than those
who did not indicate that using public relations is important (MR=239.74, n=45).
The Mann-Whitney test found that there is a significant relationship between the Q2
C5 Business branding dimension of marketing communication and the Q5 V112
performance aspect, z=-3.145, p<.01. Those respondents that indicated that business
branding is important (MR=212.79, n=367) reported significantly higher agreement
with the statement that branding has resulted in increased customer loyalty than those
who did not indicate that Business branding is important (MR=155.22, n=45).
In reference to Table 5.28 the Mann-Whitney test found that there is a significant
relationship between the Q2 C6 telemarketing dimension of marketing communication
and the Q5 V112 performance aspect, z=-2.315, p<.05. Those respondents that
indicated that telemarketing is useful (MR=211.13, n=367) reported significantly higher
agreement with the statement that branding has resulted in increased customer loyalty
than those who did not indicate that telemarketing is useful (MR=166.30, n=45).
The Mann-Whitney test found that there is a significant relationship between the Q2
C7 personal selling dimension of marketing communication and the Q5 V112
performance aspect, z=-2.521, p<.05. Those respondents that indicated that personal
selling is important (MR=211.43, n=367) reported significantly higher agreement with
the statement that branding has resulted in increased customer loyalty than those who
did not indicate that personal selling is important (MR=166.30, n=45).
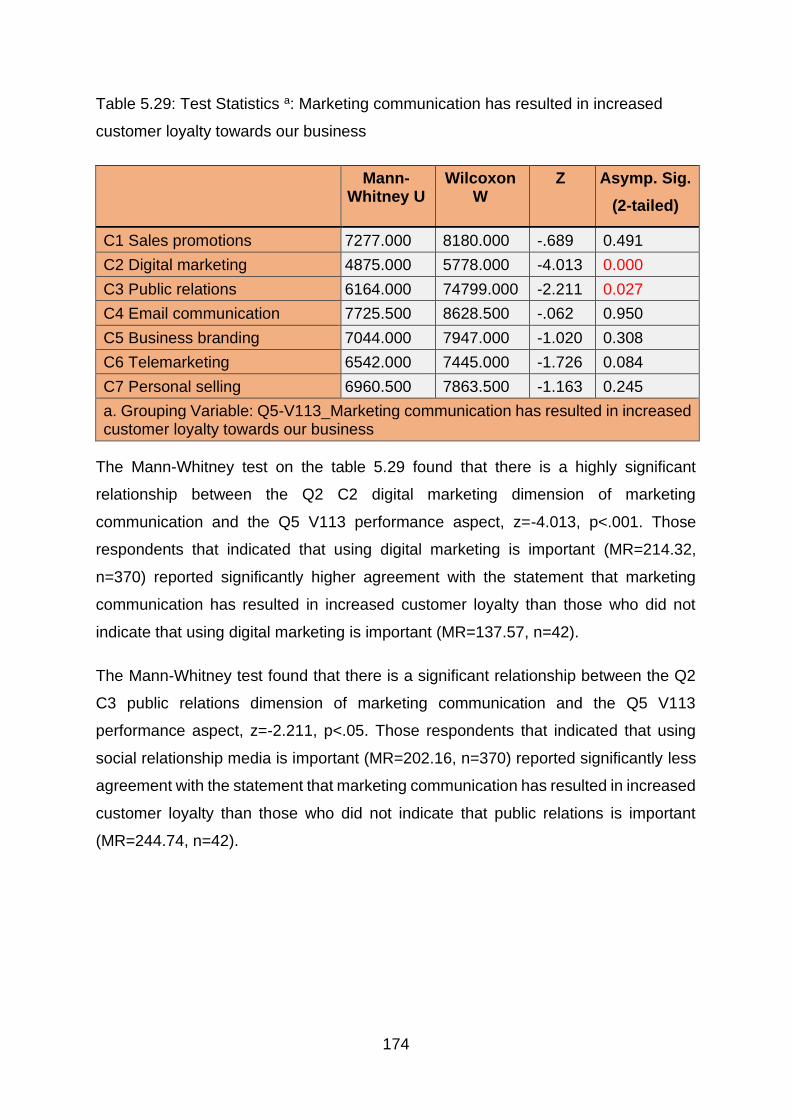
174
Table 5.29: Test Statistics a: Marketing communication has resulted in increased
customer loyalty towards our business
Mann-
Whitney U Wilcoxon
W Z Asymp. Sig.
(2-tailed)
C1 Sales promotions 7277.000 8180.000 -.689 0.491
C2 Digital marketing 4875.000 5778.000 -4.013 0.000
C3 Public relations 6164.000 74799.000 -2.211 0.027
C4 Email communication 7725.500 8628.500 -.062 0.950
C5 Business branding 7044.000 7947.000 -1.020 0.308
C6 Telemarketing 6542.000 7445.000 -1.726 0.084
C7 Personal selling 6960.500 7863.500 -1.163 0.245
a. Grouping Variable: Q5-V113_Marketing communication has resulted in increased customer loyalty towards our business
The Mann-Whitney test on the table 5.29 found that there is a highly significant
relationship between the Q2 C2 digital marketing dimension of marketing
communication and the Q5 V113 performance aspect, z=-4.013, p<.001. Those
respondents that indicated that using digital marketing is important (MR=214.32,
n=370) reported significantly higher agreement with the statement that marketing
communication has resulted in increased customer loyalty than those who did not
indicate that using digital marketing is important (MR=137.57, n=42).
The Mann-Whitney test found that there is a significant relationship between the Q2
C3 public relations dimension of marketing communication and the Q5 V113
performance aspect, z=-2.211, p<.05. Those respondents that indicated that using
social relationship media is important (MR=202.16, n=370) reported significantly less
agreement with the statement that marketing communication has resulted in increased
customer loyalty than those who did not indicate that public relations is important
(MR=244.74, n=42).
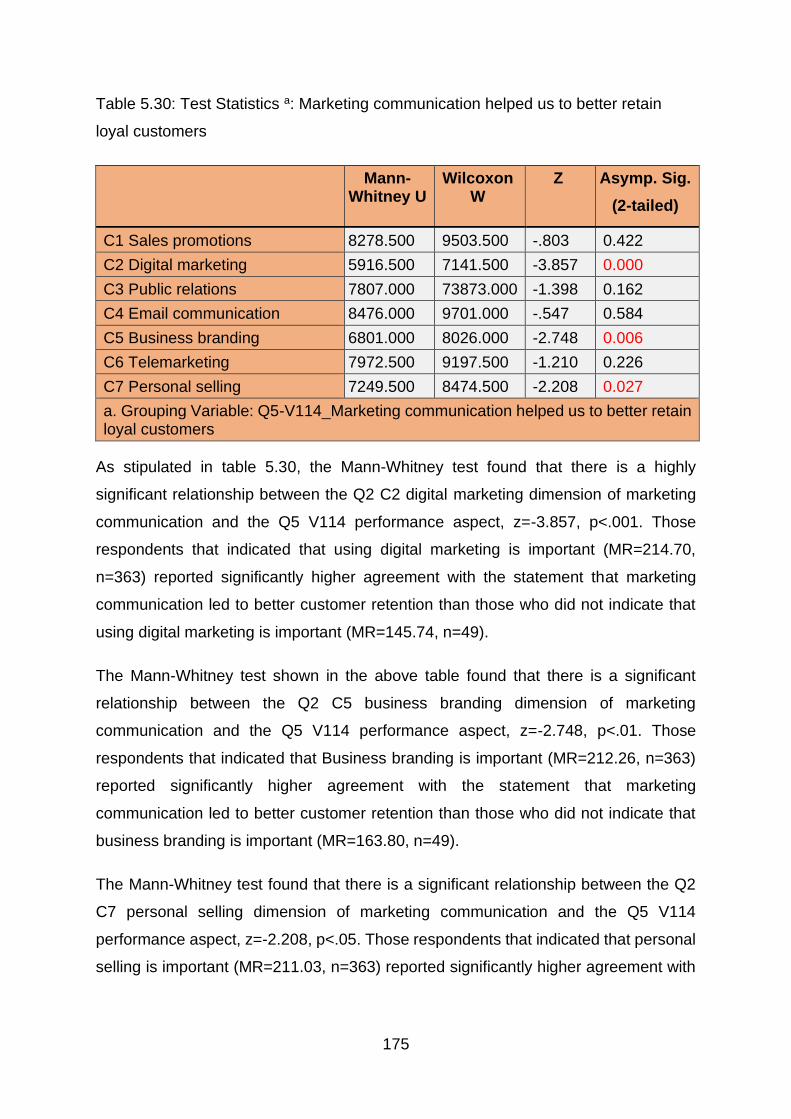
175
Table 5.30: Test Statistics a: Marketing communication helped us to better retain
loyal customers
Mann-
Whitney U Wilcoxon
W Z Asymp. Sig.
(2-tailed)
C1 Sales promotions 8278.500 9503.500 -.803 0.422
C2 Digital marketing 5916.500 7141.500 -3.857 0.000
C3 Public relations 7807.000 73873.000 -1.398 0.162
C4 Email communication 8476.000 9701.000 -.547 0.584
C5 Business branding 6801.000 8026.000 -2.748 0.006
C6 Telemarketing 7972.500 9197.500 -1.210 0.226
C7 Personal selling 7249.500 8474.500 -2.208 0.027
a. Grouping Variable: Q5-V114_Marketing communication helped us to better retain loyal customers
As stipulated in table 5.30, the Mann-Whitney test found that there is a highly
significant relationship between the Q2 C2 digital marketing dimension of marketing
communication and the Q5 V114 performance aspect, z=-3.857, p<.001. Those
respondents that indicated that using digital marketing is important (MR=214.70,
n=363) reported significantly higher agreement with the statement that marketing
communication led to better customer retention than those who did not indicate that
using digital marketing is important (MR=145.74, n=49).
The Mann-Whitney test shown in the above table found that there is a significant
relationship between the Q2 C5 business branding dimension of marketing
communication and the Q5 V114 performance aspect, z=-2.748, p<.01. Those
respondents that indicated that Business branding is important (MR=212.26, n=363)
reported significantly higher agreement with the statement that marketing
communication led to better customer retention than those who did not indicate that
business branding is important (MR=163.80, n=49).
The Mann-Whitney test found that there is a significant relationship between the Q2
C7 personal selling dimension of marketing communication and the Q5 V114
performance aspect, z=-2.208, p<.05. Those respondents that indicated that personal
selling is important (MR=211.03, n=363) reported significantly higher agreement with
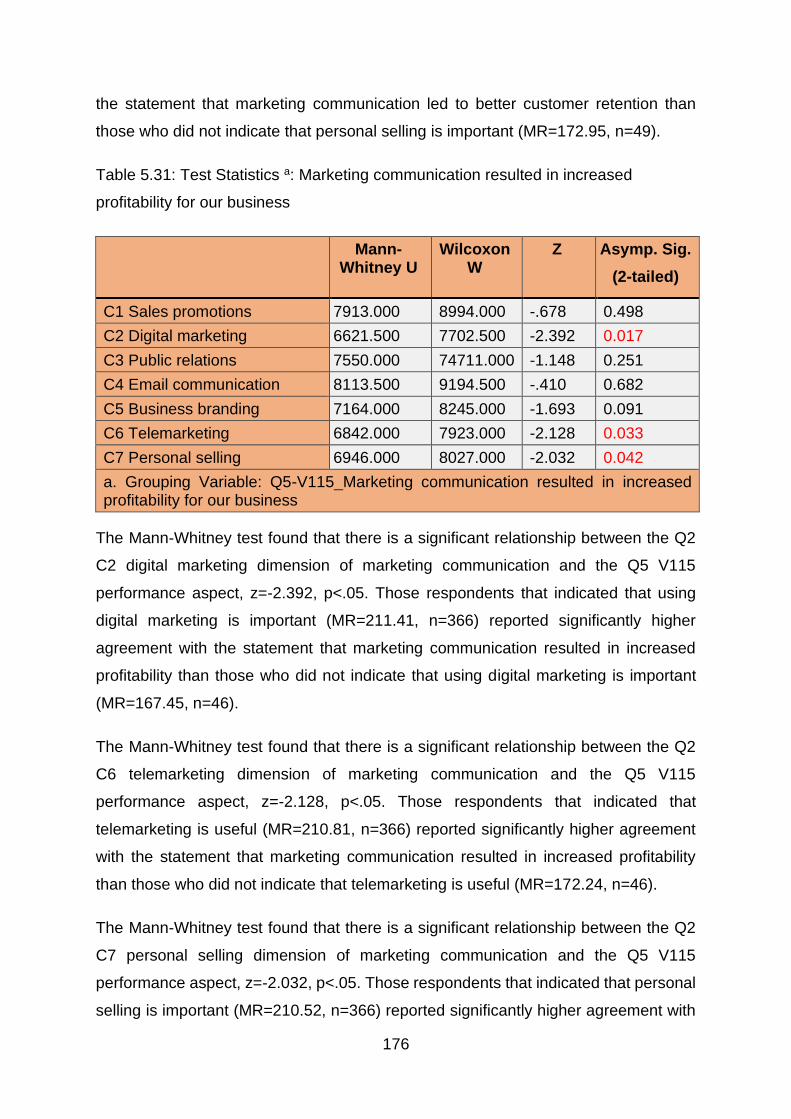
176
the statement that marketing communication led to better customer retention than
those who did not indicate that personal selling is important (MR=172.95, n=49).
Table 5.31: Test Statistics a: Marketing communication resulted in increased
profitability for our business
Mann-
Whitney U Wilcoxon
W Z Asymp. Sig.
(2-tailed)
C1 Sales promotions 7913.000 8994.000 -.678 0.498
C2 Digital marketing 6621.500 7702.500 -2.392 0.017
C3 Public relations 7550.000 74711.000 -1.148 0.251
C4 Email communication 8113.500 9194.500 -.410 0.682
C5 Business branding 7164.000 8245.000 -1.693 0.091
C6 Telemarketing 6842.000 7923.000 -2.128 0.033
C7 Personal selling 6946.000 8027.000 -2.032 0.042
a. Grouping Variable: Q5-V115_Marketing communication resulted in increased profitability for our business
The Mann-Whitney test found that there is a significant relationship between the Q2
C2 digital marketing dimension of marketing communication and the Q5 V115
performance aspect, z=-2.392, p<.05. Those respondents that indicated that using
digital marketing is important (MR=211.41, n=366) reported significantly higher
agreement with the statement that marketing communication resulted in increased
profitability than those who did not indicate that using digital marketing is important
(MR=167.45, n=46).
The Mann-Whitney test found that there is a significant relationship between the Q2
C6 telemarketing dimension of marketing communication and the Q5 V115
performance aspect, z=-2.128, p<.05. Those respondents that indicated that
telemarketing is useful (MR=210.81, n=366) reported significantly higher agreement
with the statement that marketing communication resulted in increased profitability
than those who did not indicate that telemarketing is useful (MR=172.24, n=46).
The Mann-Whitney test found that there is a significant relationship between the Q2
C7 personal selling dimension of marketing communication and the Q5 V115
performance aspect, z=-2.032, p<.05. Those respondents that indicated that personal
selling is important (MR=210.52, n=366) reported significantly higher agreement with
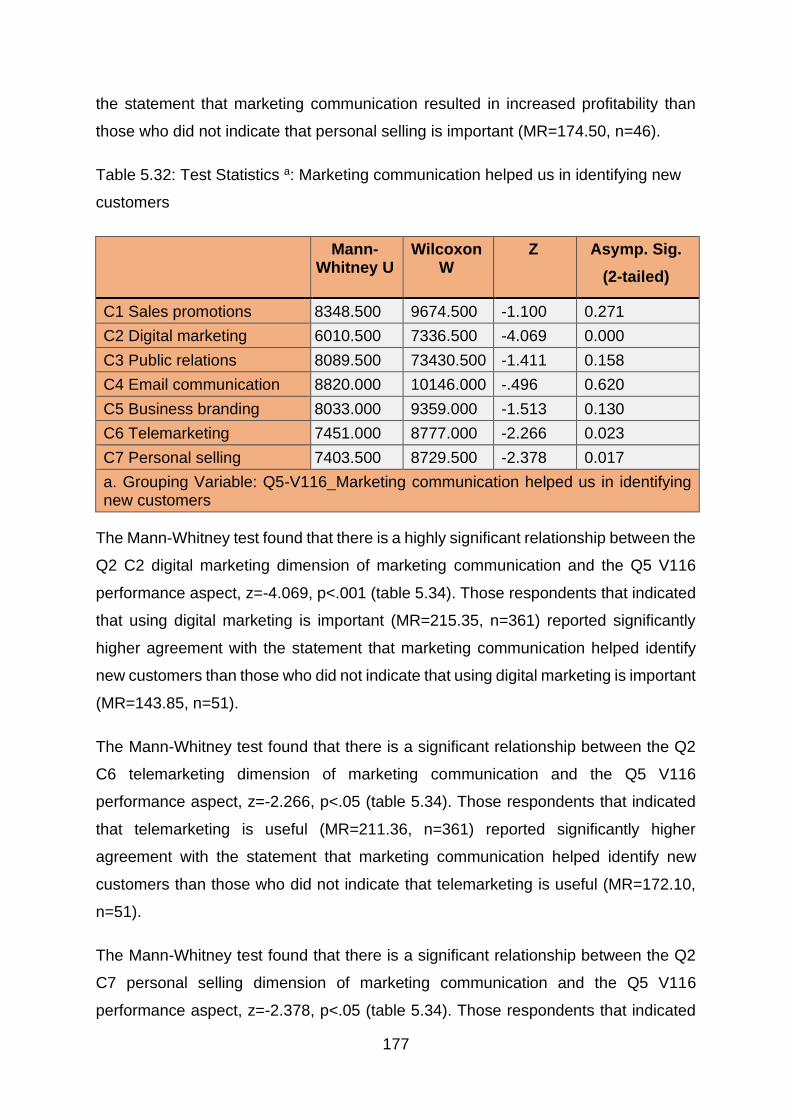
177
the statement that marketing communication resulted in increased profitability than
those who did not indicate that personal selling is important (MR=174.50, n=46).
Table 5.32: Test Statistics a: Marketing communication helped us in identifying new
customers
Mann-
Whitney U Wilcoxon
W Z Asymp. Sig.
(2-tailed)
C1 Sales promotions 8348.500 9674.500 -1.100 0.271
C2 Digital marketing 6010.500 7336.500 -4.069 0.000
C3 Public relations 8089.500 73430.500 -1.411 0.158
C4 Email communication 8820.000 10146.000 -.496 0.620
C5 Business branding 8033.000 9359.000 -1.513 0.130
C6 Telemarketing 7451.000 8777.000 -2.266 0.023
C7 Personal selling 7403.500 8729.500 -2.378 0.017
a. Grouping Variable: Q5-V116_Marketing communication helped us in identifying new customers
The Mann-Whitney test found that there is a highly significant relationship between the
Q2 C2 digital marketing dimension of marketing communication and the Q5 V116
performance aspect, z=-4.069, p<.001 (table 5.34). Those respondents that indicated
that using digital marketing is important (MR=215.35, n=361) reported significantly
higher agreement with the statement that marketing communication helped identify
new customers than those who did not indicate that using digital marketing is important
(MR=143.85, n=51).
The Mann-Whitney test found that there is a significant relationship between the Q2
C6 telemarketing dimension of marketing communication and the Q5 V116
performance aspect, z=-2.266, p<.05 (table 5.34). Those respondents that indicated
that telemarketing is useful (MR=211.36, n=361) reported significantly higher
agreement with the statement that marketing communication helped identify new
customers than those who did not indicate that telemarketing is useful (MR=172.10,
n=51).
The Mann-Whitney test found that there is a significant relationship between the Q2
C7 personal selling dimension of marketing communication and the Q5 V116
performance aspect, z=-2.378, p<.05 (table 5.34). Those respondents that indicated
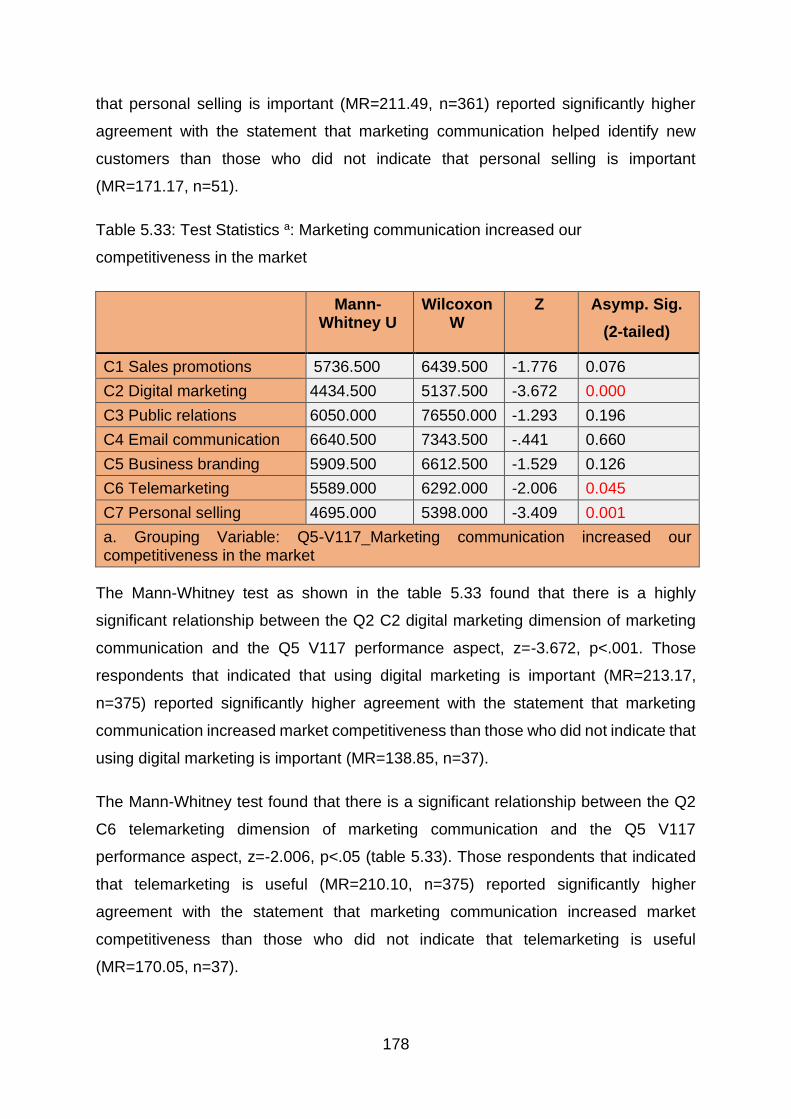
178
that personal selling is important (MR=211.49, n=361) reported significantly higher
agreement with the statement that marketing communication helped identify new
customers than those who did not indicate that personal selling is important
(MR=171.17, n=51).
Table 5.33: Test Statistics a: Marketing communication increased our
competitiveness in the market
Mann-
Whitney U Wilcoxon
W Z Asymp. Sig.
(2-tailed)
C1 Sales promotions 5736.500 6439.500 -1.776 0.076
C2 Digital marketing 4434.500 5137.500 -3.672 0.000
C3 Public relations 6050.000 76550.000 -1.293 0.196
C4 Email communication 6640.500 7343.500 -.441 0.660
C5 Business branding 5909.500 6612.500 -1.529 0.126
C6 Telemarketing 5589.000 6292.000 -2.006 0.045
C7 Personal selling 4695.000 5398.000 -3.409 0.001
a. Grouping Variable: Q5-V117_Marketing communication increased our competitiveness in the market
The Mann-Whitney test as shown in the table 5.33 found that there is a highly
significant relationship between the Q2 C2 digital marketing dimension of marketing
communication and the Q5 V117 performance aspect, z=-3.672, p<.001. Those
respondents that indicated that using digital marketing is important (MR=213.17,
n=375) reported significantly higher agreement with the statement that marketing
communication increased market competitiveness than those who did not indicate that
using digital marketing is important (MR=138.85, n=37).
The Mann-Whitney test found that there is a significant relationship between the Q2
C6 telemarketing dimension of marketing communication and the Q5 V117
performance aspect, z=-2.006, p<.05 (table 5.33). Those respondents that indicated
that telemarketing is useful (MR=210.10, n=375) reported significantly higher
agreement with the statement that marketing communication increased market
competitiveness than those who did not indicate that telemarketing is useful
(MR=170.05, n=37).
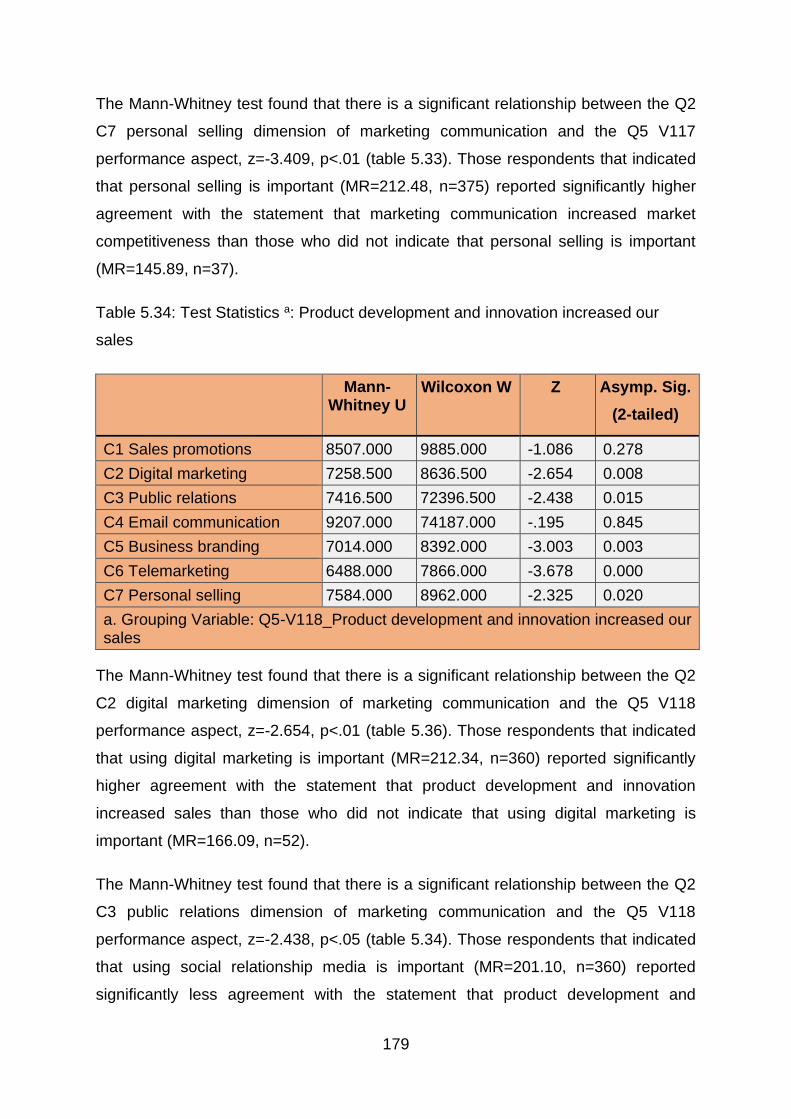
179
The Mann-Whitney test found that there is a significant relationship between the Q2
C7 personal selling dimension of marketing communication and the Q5 V117
performance aspect, z=-3.409, p<.01 (table 5.33). Those respondents that indicated
that personal selling is important (MR=212.48, n=375) reported significantly higher
agreement with the statement that marketing communication increased market
competitiveness than those who did not indicate that personal selling is important
(MR=145.89, n=37).
Table 5.34: Test Statistics a: Product development and innovation increased our
sales
Mann-
Whitney U Wilcoxon W Z Asymp. Sig.
(2-tailed)
C1 Sales promotions 8507.000 9885.000 -1.086 0.278
C2 Digital marketing 7258.500 8636.500 -2.654 0.008
C3 Public relations 7416.500 72396.500 -2.438 0.015
C4 Email communication 9207.000 74187.000 -.195 0.845
C5 Business branding 7014.000 8392.000 -3.003 0.003
C6 Telemarketing 6488.000 7866.000 -3.678 0.000
C7 Personal selling 7584.000 8962.000 -2.325 0.020
a. Grouping Variable: Q5-V118_Product development and innovation increased our sales
The Mann-Whitney test found that there is a significant relationship between the Q2
C2 digital marketing dimension of marketing communication and the Q5 V118
performance aspect, z=-2.654, p<.01 (table 5.36). Those respondents that indicated
that using digital marketing is important (MR=212.34, n=360) reported significantly
higher agreement with the statement that product development and innovation
increased sales than those who did not indicate that using digital marketing is
important (MR=166.09, n=52).
The Mann-Whitney test found that there is a significant relationship between the Q2
C3 public relations dimension of marketing communication and the Q5 V118
performance aspect, z=-2.438, p<.05 (table 5.34). Those respondents that indicated
that using social relationship media is important (MR=201.10, n=360) reported
significantly less agreement with the statement that product development and
180
innovation increased sales than those who did not indicate that using public relations
is important (MR=243.88, n=52).
The Mann-Whitney test found that there is a significant relationship between the Q2
C5 business branding dimension of marketing communication and the Q5 V118
performance aspect, z=-3.003, p<.01 (table 5.36). Those respondents that indicated
that business branding is important (MR=213.02, n=360) reported significantly higher
agreement with the statement that product development and innovation increased
sales than those who did not indicate that business branding is important (MR=161.38,
n=52).
The Mann-Whitney test as shown in Table 5.34 above found that there is a highly
significant relationship between the Q2 C6 Telemarketing dimension of marketing
communication and the Q5 V118 performance aspect, z=-3.678, p<.001 (table 5.34).
Those respondents that indicated that telemarketing is useful (MR=214.48, n=360)
reported significantly higher agreement with the statement that product development
and innovation increased sales than those who did not indicate that telemarketing is
useful (MR=151.27, n=52).
The Mann-Whitney test found that there is a significant relationship between the Q2
C7 personal selling dimension of marketing communication and the Q5 V118
performance aspect, z=-2.325, p<.05 (table 5.34). Those respondents that indicated
that personal selling is important (MR=211.43, n=360) reported significantly higher
agreement with the statement that product development and innovation increased
sales than those who did not indicate that personal selling is important (MR=172.35,
n=52).
Koekemoer (2014) state that marketing communication strategies like personal
selling, public relations, advertising and direct marketing are effective when used to
communicate with all relevant stakeholders for the SMEs. Ramasobana (2017) found
that there is a substantial difference in the performance of SMEs based on the
marketing communication strategy implemented.
Jerman and Zayrsnik (2012) confirm that marketing communication strategies has a
positive impact on the SMEs performance. The SMEs financial success is influenced
by the ability of the implemented marketing communication strategies (Kotler & Keller
181
2009). According to Esposito (2013), marketing communication help the SMEs in
developing, establishing and maintaining long term relationship with customers and
potential consumers.
There are marketing communication strategies that were adopted within the study
namely: sales promotions, digital marketing, public relations, personal selling, email
communication and telemarketing. The study results showed that positive contribution
to the SMEs performance. Therefore, H3 (H3a): indicating that there is a positive
impact of marketing strategies on performance of SMEs (H3a: marketing
communication strategy and SMEs performance), was accepted.
5.9.2 Product strategy and SMEs performance (Hypotheses 3b – H3b)
The purpose of this section is to determine the effect of Q3 components (product
strategies dimensions in their businesses) on the individual Q5 variables (V119-V124).
This is done through the discussions and presentations of results for Hypotheses 3b.
Due to factor 2 loading very low Cronbach alpha, it was excluded from further analysis
in this section.
Hypotheses 3b
H3b Product strategies have an impact on the performance of SMEs.
H30 Product strategies do not have an impact on the performance of SMEs.
In order to determine whether there is a significant relationship between the
continuous product strategies dimensions and the individual (categorical –
dichotomous- V119-V124) performance aspects, the non-parametric Mann-Whitney U
test was used.
The Mann-Whitney test found that there is a significant relationship between the Q3
C2 cost of branding dimension of product development and innovation and the Q5
V119 performance aspect, z=-2.765, p<.01. Those respondents that indicated that
they find branding too costly to do (MR=201.48, n=373) reported significantly less
agreement with the statement that product development and innovation strengthened
customer relationships than those who did not indicate that they find branding too
costly to do (MR=254.55, n=39).
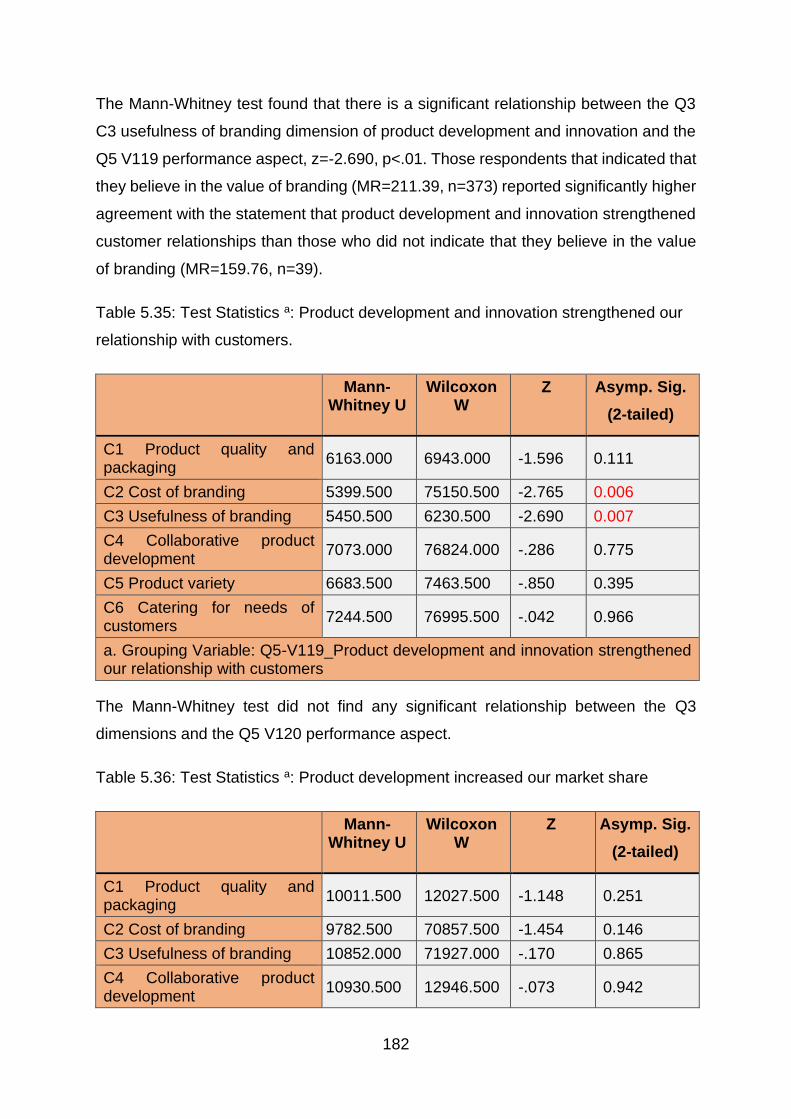
182
The Mann-Whitney test found that there is a significant relationship between the Q3
C3 usefulness of branding dimension of product development and innovation and the
Q5 V119 performance aspect, z=-2.690, p<.01. Those respondents that indicated that
they believe in the value of branding (MR=211.39, n=373) reported significantly higher
agreement with the statement that product development and innovation strengthened
customer relationships than those who did not indicate that they believe in the value
of branding (MR=159.76, n=39).
Table 5.35: Test Statistics a: Product development and innovation strengthened our
relationship with customers.
Mann-
Whitney U Wilcoxon
W Z Asymp. Sig.
(2-tailed)
C1 Product quality and packaging
6163.000 6943.000 -1.596 0.111
C2 Cost of branding 5399.500 75150.500 -2.765 0.006
C3 Usefulness of branding 5450.500 6230.500 -2.690 0.007
C4 Collaborative product development
7073.000 76824.000 -.286 0.775
C5 Product variety 6683.500 7463.500 -.850 0.395
C6 Catering for needs of customers
7244.500 76995.500 -.042 0.966
a. Grouping Variable: Q5-V119_Product development and innovation strengthened our relationship with customers
The Mann-Whitney test did not find any significant relationship between the Q3
dimensions and the Q5 V120 performance aspect.
Table 5.36: Test Statistics a: Product development increased our market share
Mann-
Whitney U Wilcoxon
W Z Asymp. Sig.
(2-tailed)
C1 Product quality and packaging
10011.500 12027.500 -1.148 0.251
C2 Cost of branding 9782.500 70857.500 -1.454 0.146
C3 Usefulness of branding 10852.000 71927.000 -.170 0.865
C4 Collaborative product development
10930.500 12946.500 -.073 0.942
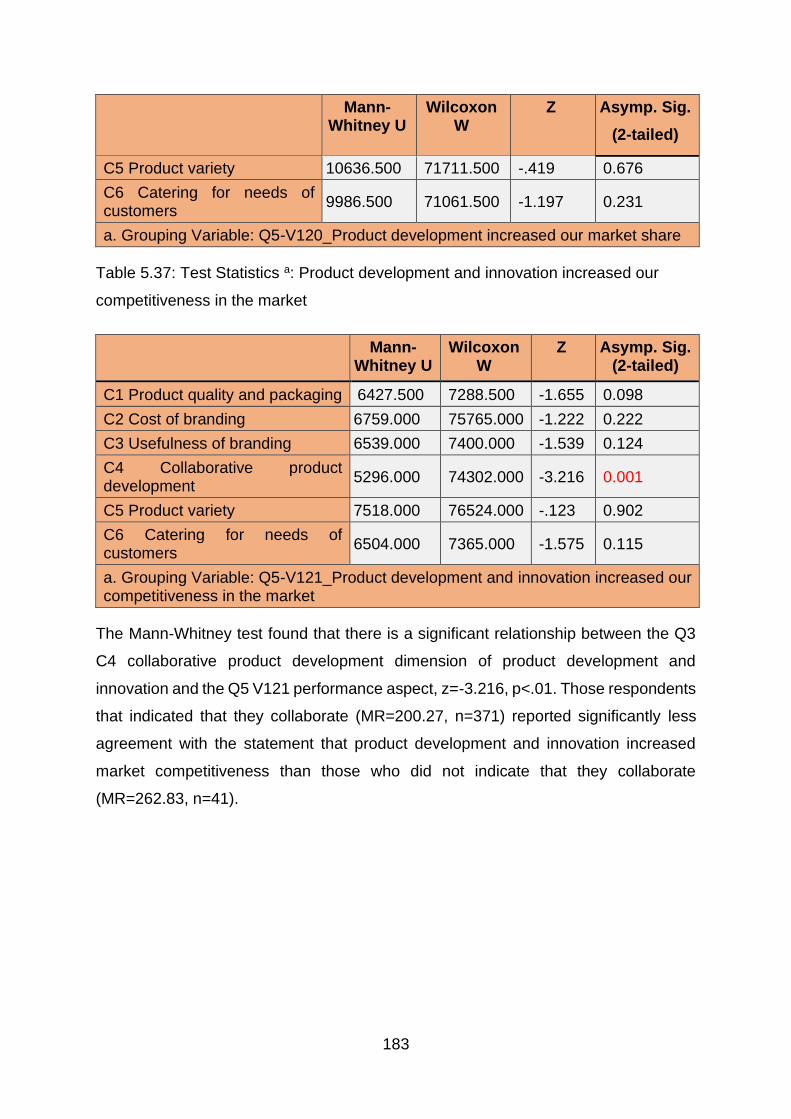
183
Mann-
Whitney U Wilcoxon
W Z Asymp. Sig.
(2-tailed)
C5 Product variety 10636.500 71711.500 -.419 0.676
C6 Catering for needs of customers
9986.500 71061.500 -1.197 0.231
a. Grouping Variable: Q5-V120_Product development increased our market share
Table 5.37: Test Statistics a: Product development and innovation increased our
competitiveness in the market
Mann-
Whitney U Wilcoxon
W Z Asymp. Sig.
(2-tailed)
C1 Product quality and packaging 6427.500 7288.500 -1.655 0.098
C2 Cost of branding 6759.000 75765.000 -1.222 0.222
C3 Usefulness of branding 6539.000 7400.000 -1.539 0.124
C4 Collaborative product development
5296.000 74302.000 -3.216 0.001
C5 Product variety 7518.000 76524.000 -.123 0.902
C6 Catering for needs of customers
6504.000 7365.000 -1.575 0.115
a. Grouping Variable: Q5-V121_Product development and innovation increased our competitiveness in the market
The Mann-Whitney test found that there is a significant relationship between the Q3
C4 collaborative product development dimension of product development and
innovation and the Q5 V121 performance aspect, z=-3.216, p<.01. Those respondents
that indicated that they collaborate (MR=200.27, n=371) reported significantly less
agreement with the statement that product development and innovation increased
market competitiveness than those who did not indicate that they collaborate
(MR=262.83, n=41).
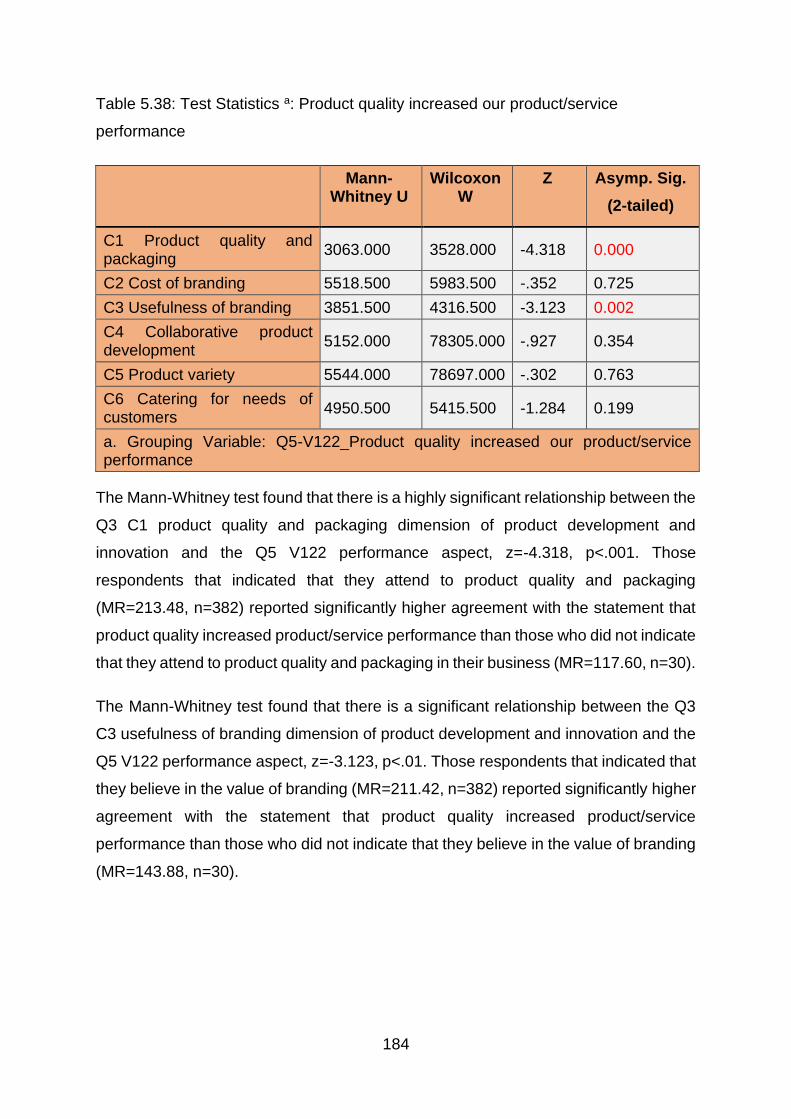
184
Table 5.38: Test Statistics a: Product quality increased our product/service
performance
Mann-
Whitney U Wilcoxon
W Z Asymp. Sig.
(2-tailed)
C1 Product quality and packaging
3063.000 3528.000 -4.318 0.000
C2 Cost of branding 5518.500 5983.500 -.352 0.725
C3 Usefulness of branding 3851.500 4316.500 -3.123 0.002
C4 Collaborative product development
5152.000 78305.000 -.927 0.354
C5 Product variety 5544.000 78697.000 -.302 0.763
C6 Catering for needs of customers
4950.500 5415.500 -1.284 0.199
a. Grouping Variable: Q5-V122_Product quality increased our product/service performance
The Mann-Whitney test found that there is a highly significant relationship between the
Q3 C1 product quality and packaging dimension of product development and
innovation and the Q5 V122 performance aspect, z=-4.318, p<.001. Those
respondents that indicated that they attend to product quality and packaging
(MR=213.48, n=382) reported significantly higher agreement with the statement that
product quality increased product/service performance than those who did not indicate
that they attend to product quality and packaging in their business (MR=117.60, n=30).
The Mann-Whitney test found that there is a significant relationship between the Q3
C3 usefulness of branding dimension of product development and innovation and the
Q5 V122 performance aspect, z=-3.123, p<.01. Those respondents that indicated that
they believe in the value of branding (MR=211.42, n=382) reported significantly higher
agreement with the statement that product quality increased product/service
performance than those who did not indicate that they believe in the value of branding
(MR=143.88, n=30).
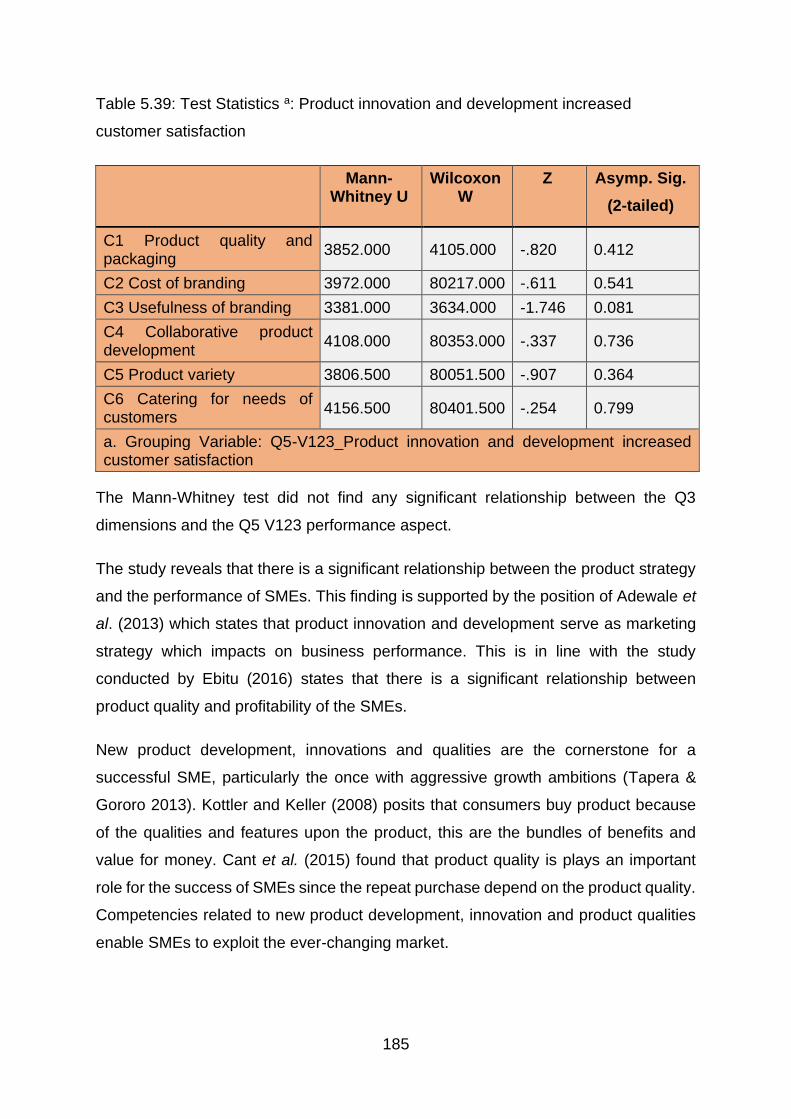
185
Table 5.39: Test Statistics a: Product innovation and development increased
customer satisfaction
Mann-
Whitney U Wilcoxon
W Z Asymp. Sig.
(2-tailed)
C1 Product quality and packaging
3852.000 4105.000 -.820 0.412
C2 Cost of branding 3972.000 80217.000 -.611 0.541
C3 Usefulness of branding 3381.000 3634.000 -1.746 0.081
C4 Collaborative product development
4108.000 80353.000 -.337 0.736
C5 Product variety 3806.500 80051.500 -.907 0.364
C6 Catering for needs of customers
4156.500 80401.500 -.254 0.799
a. Grouping Variable: Q5-V123_Product innovation and development increased customer satisfaction
The Mann-Whitney test did not find any significant relationship between the Q3
dimensions and the Q5 V123 performance aspect.
The study reveals that there is a significant relationship between the product strategy
and the performance of SMEs. This finding is supported by the position of Adewale et
al. (2013) which states that product innovation and development serve as marketing
strategy which impacts on business performance. This is in line with the study
conducted by Ebitu (2016) states that there is a significant relationship between
product quality and profitability of the SMEs.
New product development, innovations and qualities are the cornerstone for a
successful SME, particularly the once with aggressive growth ambitions (Tapera &
Gororo 2013). Kottler and Keller (2008) posits that consumers buy product because
of the qualities and features upon the product, this are the bundles of benefits and
value for money. Cant et al. (2015) found that product quality is plays an important
role for the success of SMEs since the repeat purchase depend on the product quality.
Competencies related to new product development, innovation and product qualities
enable SMEs to exploit the ever-changing market.
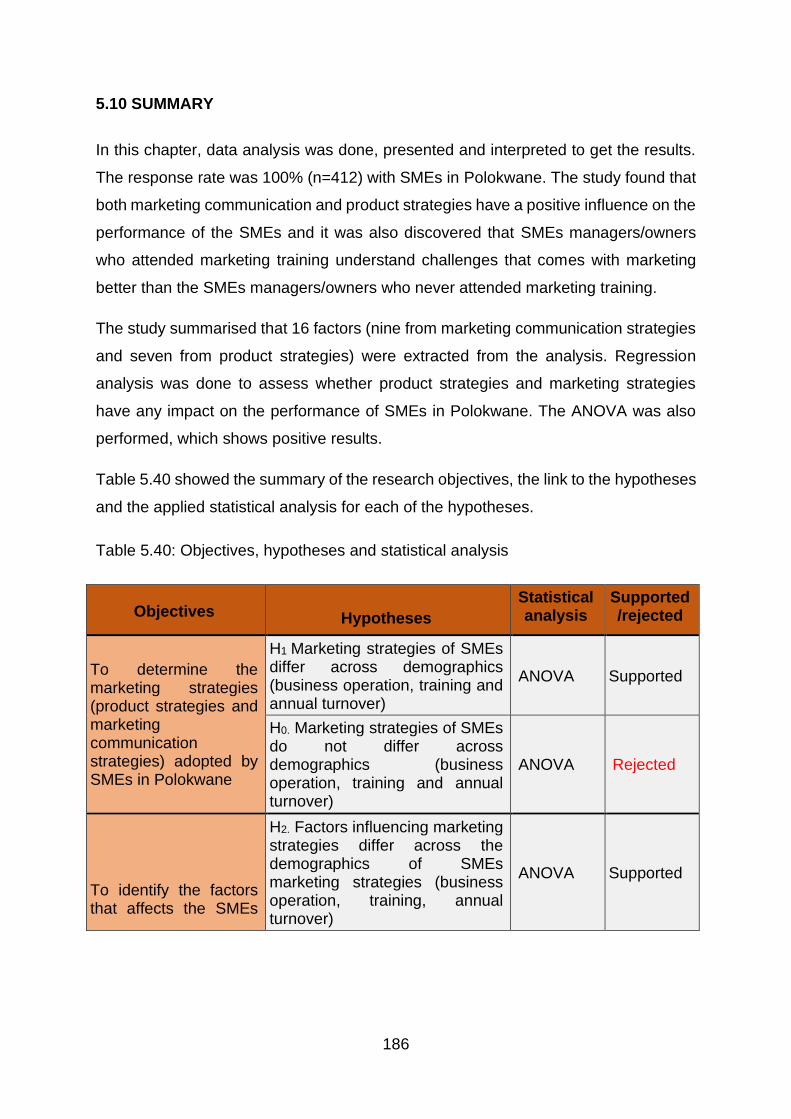
186
5.10 SUMMARY
In this chapter, data analysis was done, presented and interpreted to get the results.
The response rate was 100% (n=412) with SMEs in Polokwane. The study found that
both marketing communication and product strategies have a positive influence on the
performance of the SMEs and it was also discovered that SMEs managers/owners
who attended marketing training understand challenges that comes with marketing
better than the SMEs managers/owners who never attended marketing training.
The study summarised that 16 factors (nine from marketing communication strategies
and seven from product strategies) were extracted from the analysis. Regression
analysis was done to assess whether product strategies and marketing strategies
have any impact on the performance of SMEs in Polokwane. The ANOVA was also
performed, which shows positive results.
Table 5.40 showed the summary of the research objectives, the link to the hypotheses
and the applied statistical analysis for each of the hypotheses.
Table 5.40: Objectives, hypotheses and statistical analysis
Objectives
Hypotheses
Statistical analysis
Supported/rejected
To determine the marketing strategies (product strategies and marketing communication strategies) adopted by SMEs in Polokwane
H1 Marketing strategies of SMEs differ across demographics (business operation, training and annual turnover)
ANOVA Supported
H0. Marketing strategies of SMEs do not differ across demographics (business operation, training and annual turnover)
ANOVA Rejected
To identify the factors that affects the SMEs
H2. Factors influencing marketing strategies differ across the demographics of SMEs marketing strategies (business operation, training, annual turnover)
ANOVA Supported
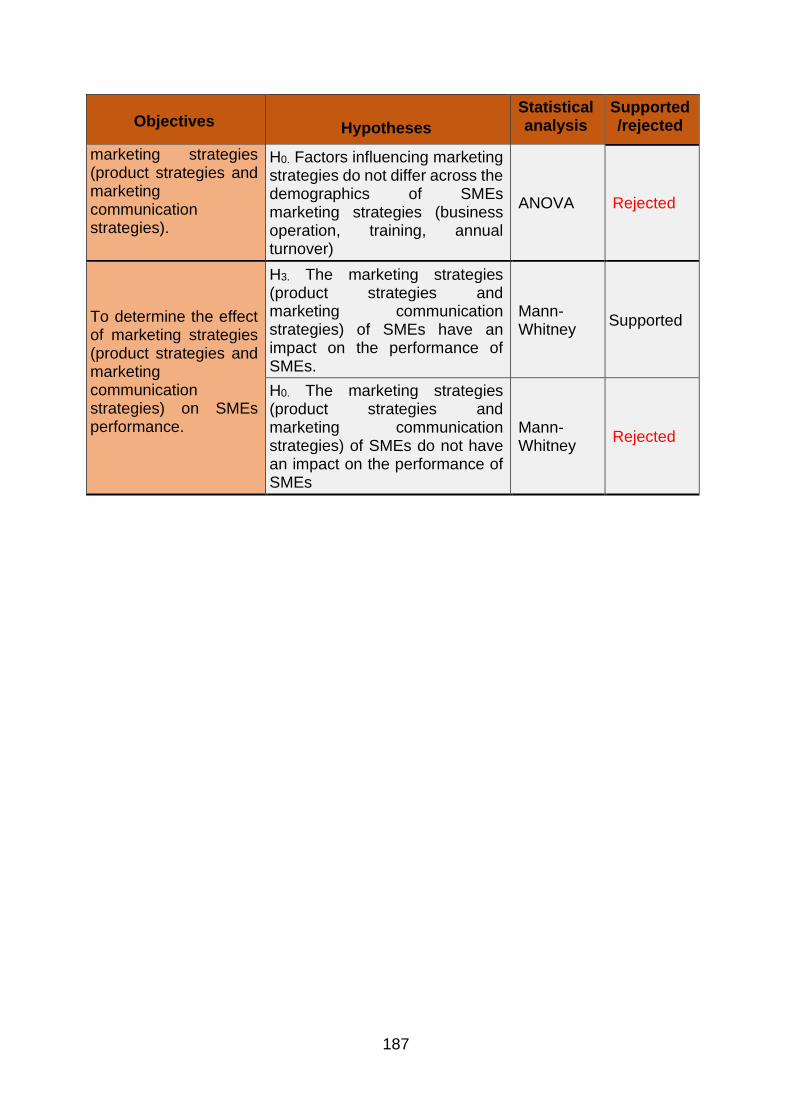
187
Objectives
Hypotheses
Statistical analysis
Supported/rejected
marketing strategies (product strategies and marketing communication strategies).
H0. Factors influencing marketing strategies do not differ across the demographics of SMEs marketing strategies (business operation, training, annual turnover)
ANOVA Rejected
To determine the effect of marketing strategies (product strategies and marketing communication strategies) on SMEs performance.
H3. The marketing strategies (product strategies and marketing communication strategies) of SMEs have an impact on the performance of SMEs.
Mann-Whitney
Supported
H0. The marketing strategies (product strategies and marketing communication strategies) of SMEs do not have an impact on the performance of SMEs
Mann-Whitney
Rejected
188
CHAPTER 6: CONCLUSIONS, AND RECOMMENDATIONS.
6.1 INTRODUCTION
The study focused of factors influencing marketing strategy formulations for SMEs in
Polokwane. The distinctiveness of the study was being able to realise all the factors
affecting SMEs when formulating marketing within their business enterprises.
While Chapter 5 presented the research results of the study, the aim of this chapter
was to provide a summary of the main hypothetical and practical findings and then
recommended ways of filling the gaps that were recognised within the study.
The objectives of the study were achieved after analysing and comparing the results
of the study with the reviewed literature, thus allowing new information to fill the gaps
and formulating with recommendations, how the findings could enhance the SMEs.
This chapter also outlines the conclusions, recommendations and study significance
and provided a chapter summary.
6.2 OVERVIEW OF RESEARCH OBJECTIVES
The primary research objective of the study was to investigate the factors influencing
the formulation of marketing strategies (product strategies and marketing
communication strategies) for SMEs in Polokwane. This was followed by the three
secondary objectives being: (1) determining the marketing strategies (product and
marketing communication strategies) adopted by SMEs, (2) identifying the factors that
affects the SMEs marketing strategies and (3) determining the effects of marketing
strategies (product strategies and marketing communication strategies) on SMEs
performance.
6.3 CONCLUSIONS OF FINDINGS
Dzisi and Ofosu (2014) state that SMEs have the need to establish marketing
strategies that help them to gain a reflective understanding of customers and
competitive advantages over competitors. The findings of Ramasobana (2017)
concluded that there is a significant difference in the performance of SMEs based on
product and marketing communication strategies adopted. The adopted marketing
189
strategies within the SMEs enables them to compete with the established businesses
(David et al. 2013).
6.3.1 Conclusions of findings: Marketing strategies (Marketing communication
and product strategies) adopted by SMEs
6.3.1.1 Conclusions of findings for marketing communication strategies
The major marketing communication strategies adopted within the SMEs are (in terms
of importance): sales promotions, digital marketing, business branding, personal
selling, email communication, telemarketing, and public relations.
In the study, it was confirmed that SMEs ‘strongly agree’ (M=4.43) to the use of sales
promotions. Sales promotion can be described as a technique that impact on the buyer
through a systematic marketing instruments to fast-track the purchase process with
the short-term effects (Genchev & Todorova 2017). Sales promotions help the SMEs
in stimulating consumer purchases and transactional SME performance by adding
product value for a limited time period. It usually involves lowering the price of a
product and improves customer’s perceived product value (Familmaleki Aghighi &
Hamidi 2015). SMEs use sales promotions to get rid of old stock, promoting new
products to both new and old customers, and to retain existing customers (Dzisi &
Ofosu 2014).
Sales promotion was deemed an important marketing communication strategy used
by the SMEs followed by the use of digital marketing (M=4.37). According to Yasmin,
Tasneem and Fatema (2015), digital marketing is widely used by SMEs to promote
products and services by means of digital channels. Yaseen, Al-Adwan and Al-
Madadha (2019) found that the majority of the SMEs are using digital marketing,
however some have limited the usage to social media as a common tool for digital
marketing. Digital marketing provides opportunities for SMEs to appeal to new
customers and encourage current customers to buy (Matt 2015).
The next marketing communication strategy SMEs agreed with is the use of business
branding as shown by the ‘strong agreement’ of M=4.33 from the SMEs. Banerjee and
Dasgupta (2009) found that branding helps to strengthen the competitive advantages
for the SMEs and leads to the profitable long run survival.
190
Furthermore, SMEs strongly use personal selling (M=4.19). This finding was also
backed by Mapheto et al. (2014) that personal selling is most used by SMES as the
marketing communication strategy. Kihanya (2013) found that personal selling
positively influences the business performance
In addition, the research study indicated that SMEs ‘agree’ (M=3.93) that email
communication has a positive impact on the performance of the SMEs. According to
Waheed and Yang (2017), email-communication gives twice the return on investment
as compared to other forms of online marketing. The more informative and entertaining
the emails’ contents with a high level of privacy, the more it attracts customers towards
email-advertising (Jamalzadeh, Behravan & Masoudi 2012).
The study revealed that SMEs ‘moderately agree’ to the use of telemarketing
(M=3.72). As indicated by Noh and Park (2014) telemarketing is a good and efficient
method of communication that businesses practice with the aim of creating value for
the customers and receiving feedback about customer preferences. The study
conducted by Tiwari and Gupta (2012) found that SMEs are in favour of telemarketing.
The study revealed that public relations (M=3.04) is the least used marketing
communication strategy. Oduanlami and Emmanuel (2014) assert that every
organisation must have a favourable and available medium that makes it easy for the
enterprise’s products and services to be well known by the target market. Black (2011)
state that the use of public relations as a marketing communication strategy helps the
organisations to successfully network and communicate with their public and manage
the relationships.
6.3.1.2 Conclusions of findings for product strategies
The research study found that product quality and packaging (M= 4.39) have a positive
impact on the performance of the SMEs. Molina-Castillo, Munuera-Aleman and
Calantone (2011) considers product quality as a serious element for the business to
obtain a competitive advantage. It is further assumed to be of high importance to the
existence and success of a product. Abdalkrim and Al-Hrezat (2018) found that there
is a significant statistical effect of the packaging role in protecting the products and
consumer on the consumer's perception of product quality at the point of purchase.
191
The current study agree with the above study as it was found that excellent packaging
serves as a vital part of the SMEs brand (99 percent).
This study confirmed that SMEs ‘strongly agree’ (M=4.24) that they do branding.
Branding is an important marketing communication strategy used by the SMEs.
Branding plays an important role in changing consumers perceptions about the
business and its products (Agariya et al. 2012). However, Pyeman et al. (2016) found
that product innovation and branding as part of the product strategy within the SME
sector is still a problem due to the costs involved and other challenges. SMEs are
disadvantaged due to lack of investment on product innovations to meet the ever-
changing customer needs (Sindakis 2015).
Product strategies are tremendously changing the landscape for the SMEs business
operation, focusing on the consumer promises. SMEs ‘agree moderately’ (M=3.10) to
the impact that collaborative product development is having on the performance of the
SMEs.
Further, based on the research findings SMEs ‘strongly disagree' (M=1.88), with the
fact that branding is costly, and this has the lowest mean score. It is believed that
SMEs brand products. This is contrary to Agostini et al. (2014) who found that amongst
SMEs there is no widespread use of branding due to financial constraints. Odoom
(2016) state that SMEs should use branding as part of the differentiation strategies.
Therefore, SMEs should plan, organise, implement and coordinate branding in a way
that brings out maintainable competitive advantage for the SME (Kapferer 2012).
Over 80 percent of the respondents accept the positive impact made by branding, by
disagreeing with the statement ‘We do not brand our products since branding is costly’.
6.3.2 Conclusions regarding marketing challenges faced by SMEs
The reviewed literature found that SMEs face many challenges, namely marketing
communication and product challenges, which are crucial for the existence of every
SME. Ebitu (2015) observe that most of the challenges were because most of the
managers within the SMEs are not knowledgeable about the principles and practices
of marketing. The SMEs experienced challenges in line with their business operation,
namely lack of understanding for marketing research, lack of finance, lack of business
192
planning, inexperienced employees and lack of understanding for correct marketing
channels, while the least challenges experienced are lack of access to finance, lack
of product branding and lack of customer demands
Lack of in-depth understanding of marketing research and lack of finance has a
significant negative impact on the business marketing strategy, growth and survival of
the SMEs (Contessi & De Nicola 2012; Ogbadu 2013). It was also found that lack of
business planning, inexperienced employee, lack of understanding of the right
marketing channels and lack of managerial competency and skills negatively affect
marketing strategy formulations, business growth and performance of the business
(Cant 2012; Oji, Iwu & Haydam 2017; Adetayo 2018).
The least challenges that are negatively affecting the SMEs operation and
performance are lack of access to finance, lack of product branding and lack of
customer demands. If the market is properly analysed and the right decision is taken
about market opportunities it is likely that an SME will not fail. As highlighted by
Czarniewski (2014) communicating customer value and preference leads to customer
demand, which has a positive influence on the survival and the success of an SME.
6.3.3 Conclusions of findings: Demographics and marketing communication
The study confirmed that the demographic factors (business operation, training and
annual turn-over) have an impact on the marketing communication strategies of the
SMEs.
Marketing communication strategies adopted by SMEs differ according to how long
they have been operation. It was found that SMEs that have been in operation for
more than 10 years use more digital marketing and new media marketing than those
that have been in operation for less than 10 years.
It was found that SMEs that attended training understand marketing communication
better and use sales promotion and business branding than others.
SMEs with the high turnover rate (R1 000 000 to R5 000 000) tend to adopt to
marketing communication than SMEs with a lower turn-over rate. It was found that
SMEs with the higher turnover use sales promotion, digital marketing and business
193
branding more than the other marketing communication strategies. This shows that
marketing communication strategies are adopted more in SMEs with larger annual
turnovers than SMEs with lower turnover.
6.3.4 Conclusions of findings: demographics and factors influencing marketing
strategies
SMEs must become more marketing active to attain better performance. However, the
study found that SMEs who have been in operation for longer experience less
challenges than those that have been in operation for less than five years. SMEs that
have attended training tend to understand marketing and the study found that SMEs
that had not attended training experience more marketing related challenges than
those who attended training. The SMEs with managers that have attended trainings
related to marketing are more likely to overcome marketing challenges.
The influence of business annual turnover on the existing marketing challenges was
tested using the one-way ANOVA test and found that annual turnover has a significant
effect on the extent to which respondents perceive marketing challenges for SMEs.
This finding is also in line with the study of Simpson et al. (2016) which found that
SMEs with a turnover in the range R0 to R100 000 were less marketing active when
compared with those with higher turnovers.
6.3.5 Conclusions for the impact of marketing communication and product
strategies on the performance of SMEs
The current study confirmed that there is a significant relationship between both the
marketing communication strategies and product strategies with the SMEs
performance. Marketing communication and product strategies were found to
influence the SMEs performance in respect of the following: market share, expansion
and return on investment.
As highlighted by Karthikeyan and Dharmaraj (2015) a single strategy may not directly
have an impact on the overall business performance, but a combination of strategies
has a great impact on business performance. Adewale et al. (2013) found a significant
positive relationship between product strategy and the SMEs performance. Marketing
communication strategies have a positive impact on the SMEs success and can
194
enhance the SMEs performance (Wang, Pauleen & Zhang 2016). Owomoyela et al.
(2013) found that product strategies have a significant influence on the SMEs
performance. These findings are in line with Lekhanya (2015) who highlights that very
few tools for marketing communication and product strategies are fully applied to boost
the SMEs growth.
David et al. (2013) found a significant correlation between marketing strategies and
performance of SMEs in terms of improved efficiency, increased revenue (turnover),
wider connection with customers, etc. SMEs engaging in traditional marketing to
attract new customers and to retain the current customers increases their sales
(Oboreh, Ogechukwu & Francis 2011). The study revealed that there is a positive
relationship between marketing strategies and the performance of SMEs (Dzisi &
Ofosu 2014)
6.4 RECOMMENDATIONS
This section covered recommendations based on the findings of the study to help
SMEs to improve their marketing strategies.
6.4.1 Recommendations about marketing communications and product
strategies
6.4.1.1 Recommendations about marketing communications
The study extracted nine factors about marketing communication strategies.
Marketing communication strategies that are mostly used are sales promotions (M=
4.43), digital marketing (M= 4.37), business branding (M=4.33), personal selling
(M=4.19), email communication (M= 3.93) and telemarketing (M= 3.90), and marketing
communication strategies that are used the least are traditional media (M= 3.72),
word-of-mouth (M= 3.05) and public relations (M= 3.04).
The following recommendations were made based on the study findings on marketing
communication strategies
Based on the research outcomes, which discovered that SMEs strongly agree that
they use sales promotions methods, the distribution of flyers and business cards
topped the list. The study recommended that the SMEs continue using the sales
195
promotion. Subramanian (2017) supports this, that whatever the business has to
communicate must be done swiftly with a catchy communication medium, as the
growth of small businesses rely on new opportunities and strategies to raise the sales.
However, Mapheto et al. (2014) recommends that some of the sales promotion
methods are not implemented within the SMEs due to financial constraints.
Based on the study results, social media as part of digital marketing showed a positive
response. Social media has a positive effect on the SMEs performance. It is therefore
important for every SME to adopt social media like Facebook and Twitter to promote
the business offerings, as these are low-cost online platforms for sharing and
gathering information from customers. Haili (2014) reveal that most of the SMEs have
accepted social media in their business promotions, and it has created brand
awareness.
Although public relations was found to be least used within the SMEs operation with
the mean score of 3.04, it is recommended that SMEs should still use public relations
as part of their marketing communication strategies, particularly sponsorships.
Amoako et al. (2012) found that sponsorship has progressively been observed to
create audience awareness and an association with the sponsored entity. Therefore,
SMEs should practice sponsorship as it communicates positive images or messages
to the target audience and the public at large.
The traditional media for SMEs did not yield better results due to the nature thereof
(M= 3.72) it is therefore, recommended that SMEs refrain from using the traditional
media as they involve a large amount of money. Word-of-mouth and telemarketing did
not bear statistically significant results on the study, meaning they seem, currently, to
have no benefit on the business. Therefore, it is recommended that word-of-mouth
and telemarketing should not be relied upon. Telemarketing is not recommended for
SMEs since it involves extensive funds, which is a problem for the SMEs. However,
SMEs should improve the product/service quality to get customers chatting about their
products and services. SMEs should improve the use word-of-mouth since it is less
expensive, flexible, spreads information faster and allows SMEs to have a closer
contact with customers (Franco et al. 2014).
196
6.4.1.2 Recommendations about product strategies
The study extracted seven factors about product strategies. Product strategies that
are mostly used are Product quality and packaging (M= 4.39), Business branding (M=
4.24), introducing new products (M= 4.21), Meeting customer needs (M= 3.54),
Product variety (M= 3.36). The continuous use of these strategies will continue to
positively influence the performance of the SMEs.
The following recommendations were made based on the study findings: product
strategies.
Based on the research outcomes, which discovered that SMEs ‘strongly agree’ that
product quality and packaging plays an important role in distinguishing the business
and products from those of competitors. Molina-Castillo et al. (2011) considers product
quality to be of high importance to the existence and success of a product. It is
therefore recommended that SMEs focus on product quality and packaging as part of
their daily plan. SMEs must seek the services of the experienced professionals dealing
with consumer behaviours in order to improve their product features (quality) and
packaging to boost their performance.
Cant, Kallier and Wiid (2016) found that SMEs consider product quality as the most
significant product characteristic that consumers look at when making a purchase
decision. This recommendation came as a result of the respondents’ ‘strongly
agreeing’ that ‘An excellent packaging serves as a vital part of our brand’ and ‘We
produce high-quality products’.
The study found that the cost of branding does not play any major role in preventing
SMEs to brand products. However, SMEs are faced with some financial constraints,
which makes it difficult to do branding. SME respondents disagree with the statements:
‘We do not brand our products since branding is costly’ and ‘We believe that branding
is for big firms only’. The respondents accept that branding plays a major role in
customer choices and preferences. Regardless of business size or the years of
operation, branding is vital for SMEs offered products as part of the product identity.
Odoom et al. (2017) articulate that the financial limitations of the SMEs force them to
focus on short-term branding strategies. Therefore, the study recommends that SMEs
focus on branding rather than looking at the cost involved, this will help an SME to
197
gain the competitive market share. When the SME brands, it must bear in mind that
branding must project the business in the mind of customers.
A high number of respondents (90.6%) agreed that ‘Product development and
innovation strengthened our relationship with customers’, meaning that product
development is important for the survival of the SMEs. It is recommended for SMEs to
have varieties of product to meet the customer demands. Cant and Wiid (2013) found
that some SMEs failures resulted from lack of products variety and strategic planning.
Therefore, it is essential for SMEs to consider having different varieties in their product
offerings and offer personalised products. Deloite (2015) state that apart from enticing
consumers with the right products contents, research shows that majority of
consumers like personalised products and services. According to El-Maraghy Schum,
E-lMaraghy and Piller (2013), products are designed and produced to meet customers’
needs, therefore, in order to address different customer needs variety of products are
created to meet the varied customer requirements.
It is important for SMEs to select the right products to sell, as selling the wrong
products can result in loss of profit for the SME as the needs of customers will not be
met. Cant et al. (2016) recommends that SMEs must have different product strategies
or consider various factors when making decisions regarding the products to sell.
It is recommended that SMEs strive to meet customer needs through the development
of different products that match customer requirements. SMEs can assess customer
needs by analysing factors such as what they buy, who they are, and why they buy it
(Ramees & Safeena 2016). Camilleri (2018) states that SMEs should continuously do
market research to get to know their customers’ needs and wants, this leads to building
customer loyalty with increased satisfaction.
SMEs tend to agree that branding is an expensive and fruitless exercise. Blomback
and Craig (2014) suggest that SMEs should develop an exclusive business branding,
even though there is limited information existing on the branding and marketing
practices within the SMEs. The study further recommends that SMEs brand their own
product to build both the business and product identity. Since branding is not all about
the product, this is how a business can be identified and this can be done through
designing of business logo, business cards and signage etcetera.
198
6.4.1.3 Recommendations regarding factors influencing marketing strategies of
SMEs
It was found that SMEs that have been operating for more than five years shows high
levels of marketing understanding. SMEs agreed that ‘Lack of in-depth understanding
of marketing research has a significant negative impact on the business marketing
strategy’ (96%). On the other hand, ‘Lack of finance has a negative impact on the
business operations and the way marketing is done 95%’, ‘Lack of business planning
has a negative impact on marketing’ (94%), and ‘Managerial competency and skills
shortage affect marketing strategy formulations and performance of the business’
(92%) were slightly less.
SMEs owners or managers needs training to be in a better position to compete
profitably. The study recommends that SMEs owners/managers go for marketing or
any other business-related programmes/training to understand how to deal with these
marketing challenges. As highlighted by Bola and Richard (2012) with reference to the
South African SMEs, SMEs fails to grow due to deficiency of entrepreneurial,
managerial and marketing skills. January (2013) emphasise the importance of training
for SMEs owners and managers, stating that the enterprise managers should possess
business and marketing skills or appoint personnel with the required skills. Marketing
skills and any other business skills will help SMEs to operate professionally and be in
a better position to negotiate the business deals successfully (Karanja, Muturi, Mukabi,
Kabata, Wahome & Kayogo 2013).
Al-Shatanawi, Osman and Halim (2014) state that SMEs should conduct marketing
research as it provides the SMEs with relevant information to help in solving marketing
challenges experienced and it also serves as the basis for business planning.
Marketing research if properly followed, helps in processing the primary and
secondary information about customers’ attitudes and product demands. Makhubela
(2019) state that SMEs should approach the Small Enterprise Finance Agency
(SEFA), which provides retail and wholesale finance to SMEs in South Africa. SEFA
offers services such as direct financial lending to SMEs in the form of loans from
R500.00 to R5 000 000.00. It is recommended that SMEs do business planning as it
helps in determining the management actions to design new ways of business
operation and product expansion processes (Beckett 2012)
199
Every business entity including SMEs, needs progressive and dynamic managers to
succeed in today’s highly competitive business environment. Crook et al. (2011)
articulates that SMEs should strive to train managers to be competent as there is a
positive relationship between SMEs managerial competencies and success.
Competent managers provide the basis for consistent, reliable and positive
performance standards (Veliu & Manxhari 2017).
6.4.1.4 Recommendations about the impact of marketing communication and
product strategies on the performance of SMEs
The current study confirmed the impact of marketing communication strategies on the
SMEs performance and success. Therefore, it is recommended that SMEs should
continue the use of sales promotions, digital marketing, business branding, personal
selling and email marketing as they positively impact on their performance. The study
further revealed that there is a significant relationship between the product strategy
and the performance of SMEs. The findings are backed by Cant et al. (2015) who
found that product quality, as part of product strategy, acts as a push factor for the
success of SMEs since repeat purchase depends on the product quality. It is
recommended for SMEs to continue managing their relationships with customers
profitably.
Therefore, it is recommended that SMEs produce products of a high quality, use
attractive packaging for the products, continue to produce different product varieties,
charge competitive prices, offer after sales services (repairs, product maintenance,
training, etc), position appropriately themselves and provide other distinctive product
benefits to consumers.
6.4.1.5 Recommendations about the influence of demographic factors (business
operation, business training, and business turn-over) on marketing
communication strategies.
The study found that SMEs with fewer years of operation (less than 10 years) they do
adopt marketing strategies but to a lesser extent than those who have been in
operation for ten or more years. Therefore, the study recommended that SMEs with
fewer years of operation must attend marketing and business operations related
trainings to understand the importance and the impact of marketing on their survival.
200
It is further recommended that SMEs with more than ten years of operation, that are
likely to adopt marketing communication strategies, continue to attend marketing-
related training to better improve their marketing communication strategies.
The study found that there is a link between business annual turnover and the
likeliness of SMEs to adopt marketing strategies. Therefore, SMEs with higher annual
turnover must continue the use of marketing strategies as it yields positive results.
However, the study recommends that SMEs with lesser turnover focus on marketing
communication strategies that do not require much funds, like word-of-mouth.
As the SME is one of the prime prospects for the government, government has set
entities like SEDA, LEDA, SEFA, etcetera that gives SMEs financial assistance,
business incubation programmes and other related services. It is recommended that
the government support services be advertised thoroughly for the SMEs to know about
their existence, since some may not be aware of the services offered.
6.4.1.6 Recommendations about the influence of demographic factors (business
operation, business training, and business turn-over) on factors influencing
marketing strategies of SMEs
The study recommended that business turnover and the years of operation should not
be regarded as a major problem for the SMEs for not applying marketing, SMEs must
be trained, as the trained SMEs’ employees dealing with marketing are more likely to
understand marketing operations as training significantly influence the way SMEs
perceive marketing. SMEs must seek the help of government entities (NTSIKA, SEDA,
LEDA, LIBSA, etc.) to deal with marketing regardless of the annual turnover.
6.5 LIMITATIONS AND RECOMMENDATIONS FOR FURTHER STUDY
Only one province (Limpopo) was included in the study, in future the research must
be carried out in other provinces to make provincial comparisons, which may yield
results that can be generalised. A database for all SMEs in Limpopo was not
accessible, which limited the accessibility of SMEs in the area. This could be
considered as a further limitation
201
The recommendations are articulated and conferred in order to assist in improving the
way SMEs perceive marketing and perhaps the ignored factors that pertain to the
survival of these SMEs in terms of marketing. As highlighted by Wanga et al. (2016) it
is evident that marketing communication strategies positively affect the SMEs
performance. It was found in the current study that not all marketing communication
strategies contribute positively towards the performance of the SMEs. Word-of-mouth,
personal selling, telemarketing and traditional media still need further investigation as
to why they did not have an impact in predicting the performance of an SME.
A further comparative study is needed on the SMEs about product strategies and the
challenges impacting bon the SMEs performance, for the generalisation of the
findings, similarity and different market strategies employed by other organisations
6.6 STUDY SIGNIFICANCE
The significance of this research study is that it provides information about marketing
communication and product strategies for both the SMEs and governments, and how
they can influence the SMEs operations and performance. The SMEs may consider
utilising marketing communication and product strategies, which are significant (sales
promotions, digital marketing, personal selling, branding, new products, product
quality and packaging) and new ones for future use. The findings of this study will
serve as a guideline in developing marketing communication and product strategies
to SMEs in Polokwane and other sectors and overcoming challenges they experience
in their businesses.
6.8 CONCLUSION
The chapter discussed the literature summaries and the primary study summaries.
The chapter also presented the recommendations for marketing strategies (marketing
communication and product strategies) and recommendations for further study. The
study aimed to identify factors
affecting the formulation of marketing strategies within the SMEs in Polokwane and
the objective of the study was achieved.
202
The study was not only significant for understanding factors that affect SMEs
marketing strategy formulation and the adoption of marketing strategies, but it also
contributes to the literature on marketing strategies and factors affecting marketing
strategies on the basis for SMEs and large businesses. The study achieved the
research objectives. The findings of the objectives are as follows (1) determining the
marketing strategies (product and marketing communication strategies) adopted by
SMEs, it was found that SMEs use both the marketing communication strategies
(sales promotions, digital marketing, business branding, personal selling, email
communication, telemarketing and public relations) and product strategies (product
quality and packaging, branding, collaborative product development).
(2) identifying the factors that affects the SMEs marketing strategies, the findings
showed that inexperienced marketing personnel and difficulties in accessing finance
have a significant impact on the adoption of marketing strategies within the SMEs. (3)
determining the effects of marketing strategies (product strategies and marketing
communication strategies) on SMEs performance, the study found that marketing
communication and product strategies has a positive significant influence on the
performance of the SMEs.
203
REFERENCES
Aaker, D., Kumar, V., Day, G. & Leone, R. 2011. Marketing research. (10th ed). New
Jersey: Wiley.
Aaker, D., Kumar, V., Day, G. & Leone, R.P. 2013. Marketing research. (11th ed). New
Jersey: Wiley & Sons
Abasilim, A.N. 2015. Extent of application of marketing mix strategy by small and micro
scale enterprises in Osun State, Nigeria, 7(2): 16-19.
Abdullah, R.B. 2012. The relationship between store band and customer loyalty in
relating in Malaysia. Asian Social Science, 8(2): 117-185.
Abernathy, J.L., Kubick, T.R. & Masli, A. 2013. The Economic Relevance of Chief
Marketing Officers in Firms’ Top Management Teams. Journal of Business &
Economics Research. 11(12): 555-568.
Abor, J. & Quartey, P. 2010. Issues in SME development in Ghana and South Africa.
International Research Journal of Finance and Economics, 1(39): 218–228
Abugu, J.O. 2014. The Principles and Practice of Modern Marketing. First Second.
Enugu. Newmoon Publishers.
Ackah, J. & Vuvor, S. 2011. The Challenges faced by Small & Medium Enterprises
(SMEs) in Obtaining Credit in Ghana. Master’s Thesis in Business Administration.
Unpublished.
Adams, J., Khan, H.T.A. & Raeside, R. 2014. Research methods for graduate
business and social science students. (2nd ed). New Delhi: SAGE Publications Inc.
Adelekan, S.A. 2016. The impact of organizational culture on innovation capability of
SMEs case study of SMEs in Alimosho and Ojo local government area of Lagos state,
Nigeria. International Journal of Economics, Commerce and Management, 8(9): 158-
181
Adeniran, T. & Johnston, A. 2011. Investigating the Level of Internet Capabilities of
South African Small and Medium Enterprises in Changing Environments. From
204
<www.zaw3.co.za/index.php/ZAWWW/2011/paper/view/450> [Accessed on 18
March 2016].
Adesoga, A. 2016. Examination of the relevance of Personal Selling in Marketing
Activities: A Descriptive Method. Journal of Accounting and Management, 06(2): 103-
116.
Adetayo, A.S. 2018. Impact of Strategic Planning on Organizational Performance: A
Study of Unilever Nigeria PLC and May & Baker Nigeria PLC. International Journal of
Scientific & Engineering Research, 9(2): 1256-1262.
Adewale, A.G., Adesola M.A. & Oyewale, I. 2013. Impact of Marketing Strategy on
Business Performance A Study of Selected Small and Medium Enterprises (SMEs) In
Oluyole Local Government, Ibadan, Nigeria. IOSR Journal of Business and
Management, 11(4): 59-66.
Adnan, Z.S., Nafi, S.N.M. & Mohamed, Z. 2016. Technology Sharing in SME Product
Packaging: Barriers and Opportunities. Asian Business Seminar Circuit (ABSC2012)
Africa Growth Institute. 2010. South African SMME Business Confidence Index
Report: 1st-4thquarters. [online] http: www.africagrowth.com/report April 2010.pdf.
[Accessed 08 September 2016]
African Development Bank. 2012. Bank financing to small and medium enterprises in
East Africa: Findings of as Survey in Kenya, Tanzania, Uganda and Zambia. Tunis:
African Development Bank. Working Paper Series no. 146, March.
Agbim, K.C. 2013. The Relative Contribution of Management Skills to Entrepreneurial
Success: A Survey of Small and Medium Enterprises (SMEs) in the Trade Sector.
Journal of Business and Management, 7(1): 08-16.
Agostini, L., Filippini, R. & Nosella, A. 2015. Brand‐building efforts and their
association with SME sales performance. Journal of Small Business Management,
53(1): 161-173.
Aigbavboa, C.O. & Thwala, W.D. 2014. Challenges Facing Black Owned Small and
Medium Construction Companies: A Case Study of Nelspruit – Mbombela
205
Municipality, South Africa. Journal of Economics and Behavioral Studies, 6(10): 771-
778.
Ainin, S., Parveen, F., Moghavvemi, S., Jaafar, N.I. & Mohd Shuib, N.L. 2015. ‘Factors
influencing the use of social media by SMEs and its performance outcomes’. Industrial
Management and Data Systems, 115(3): 570-588.
Akroush, M. 2012. An empirical model of Marketing strategy and shareholder value: A
value-based marketing perspective, Competitiveness Review: An international
Business Journal incorporating Journal of Global Competitiveness, 22(1): 48-89.
Akugri, M.S., Bagah, D.A. & Wulifan, J.K. 2015. The Contributions of Small and
Medium Scale Enterprises to Economic Growth: A Cross-Sectional study of Zebilla in
the Bawku West District of Northern Ghana. European Journal of Business and
Management, 7(9): 2222-2839.
Al-Askari, A.H. 2011. The impact of entrepreneurship and innovation on developing
the marketing strategy in business organizations: An analytical study. Journal of
Business and Retail Management Research, 5(2):105-117.
Al-Dairi, A., McQuaid, R. & Adams, J. 2012. ‘Entrepreneurship training to promote
start-ups an innovation in Bahrain’, International Journal of Innovation and Knowledge
in Middle East and North Africa, 1(2): 179–210.
Ale, F.B. 2016. Ethics, values and relevance of public relations and information
management.
Aliyu, A.A., Bello, M.U., Kasim, R. & Martin, D. 2014. Positivist and Non-Positivist
Paradigm in Social Science Research: Conflicting Paradigms or Perfect Partners?
Journal of Management and Sustainability; 4(3): 79-95
Allen, S. 2010. How to become successful at sponsorship sales. Trafford, Victoria.
Allwood, C.M. 2011. The distinction between qualitative and quantitative research
methods is problematic. Qual Quant, 46:1417-1429.
AL-Mubaraki, H. & Aruna, M. 2013. ‘Technology innovation for SME growth: A
perception for the emerging economies’, Journal of Economics and Sustainable
Development, 4(3): 156–163.
206
Altunışık, R., Coşkun, R., Bayraktaroğlu, S. & Yıldırım, E. 2005. Sosyal Bilimlerde,
Araştırma Yöntemleri: SPSS Uygulamalı. (4rd ed). Sakarya: Sakarya Kitabevi.
American Express. 2017. U.S. Small and Medium Enterprises Optimistic About
Business Prospects in 2017 and Beyond. (Press Release). New York.
Amin, F. & Nika, F.A. 2019. Brand Experience and Brand Equity. The Journal of
Business Perspective.
Amoako, G.K., Dartey-Baah, K., Dzogbenuku, R.K. & Kwasie, S. 2012. The effect of
sponsorship on marketing communication performance: A case study of Airtel Ghana.
African Journal of Marketing Management, 4(2): 65-79.
Amra, R., Hlatshwayo, A. & McMillan, L. 2013. SMME employment in South Africa.
Paper to be presented at the biennial conference of the Economic Society of South
Africa, Bloemfontein, 25-27.
Ardhianto, P & Hardjana, A.C. 2016. SMEs Traditional Packaging Technology as a
Part of Building Brand Soul of Product. International Journal of Computational
Engineering Research, 6(7): 10-13.
Ardic, O.P., Mylenko, N., & Saltane, V. 2011. Small and Medium Enterprises: A cross-
country analysis with a new date set. World Bank Policy Research - Working Paper
Series.
Ardjouman, D. & Asma, B. 2015. Marketing Management Strategies Affecting
Performance of Small and Medium Enterprises (SMEs) in Cote d’Ivoire. International
Journal of Business and Social Science, 6(4): 141-150.
Aren, A.U. & Sibindi, A.B. 2014. Cash Flow Management Practices: An Empirical
Study of Small Businesses Operating in The South African Retail Sector. Risk
governance & control: financial markets & institutions, 4(2): 87-100.
Arens, W.F., Weigold, M.F. & Arens, C. 2011. Contemporary advertising and
integrated marketing communications. (13th ed.). New York: McGraw Hill.
Armstrong, G., Adam, S., Denize, S. & Kotler, P. 2015. Principles of Marketing. (6th
ed). Pearson.
207
Armstrong, G.M. & Kotler, P. 2013. Marketing: An introduction. (11th ed.) Pearson
Education Ltd.
Arsalan, M.G., Naveed, U.R.K. & Muhammad, A.M. 2011. ‘Marketing practices of
textile business and firm’s performance: A case of Pakistan’. Euro Economical, 2(28):
99-107.
Asamoah, S.E. 2014. Customer based brand equity (CBBE) and the competitive
performance of SMEs in Ghana. Journal of Small Business and Enterprise
Development, 21(1): 117-131.
Aswathappa, K. 2010. International Business. (4th ed.) Tata McGraw-Hill Education.
Awan, A.G. & Hashmi, S. 2014. Marketing Practices of Small & Medium Size
Enterprises: A Case Study of SME’s in Multan District. European Journal of Business
and Innovation Research, 2(6): 9-20.
Ayandibu, A.O. & Houghton, J. 2017. The role of Small and Medium Scale Enterprise
in local economic development (LED). Journal of Business and Retail Management
Research (JBRMR), 11(2): 133-139.
Babatunde, B.O. & Adebisi, A.O. 2012. Strategic Environmental Scanning and
Organization Performance in a Competitive Business Environment. Economic Insights
– Trends and Challenges, 64(1): 24-34.
Bachman, R. & Schutt, R.K. 2013. The Practice of Research in Criminology and
Criminal Justice. (5th ed.) SAGE.
Banerjee, S. & Dasgupta, P. 2009. Branding in Small and Medium Enterprises: A
Conceptual Model to Manage Branding Initiatives. Conference Paper.
BANKSETA Brochure. 2015.
Bartholomew, D., Knotts, M. & Moustaki, I. 2011. Latent variable models and factor
analysis: A unified approach. (3rd ed.) West Sussex, UK: John Wiley & Sons.
Beamish, K. 2012. CIM Coursebook 07/08 Marketing Planning.
Beckett, S. 2012. Business Planning. Journal of business continuity & emergency
planning, 26(6): 82-88.
208
Beesley, C. 2012. How to price your small business’ products and services. (Online)
Available on: http://www.sba.gov/community/blogs/how-price-your-small-
business%E2%80%99-products-and-services. [Accessed 21 September 2016].
Belch, G. & Belch, M. 2007. Advertising and promotion, an integrated marketing
communications perspective. (7th ed.) Boston: McGraw-Hill.
Belch, G.E. & Belch, M. A. 2012. Advertising and promotion: an integrated marketing
communication perspective. (9th ed.) New York: McGraw Hill.
Belk, R., Fischer, E. & Kozinets, R.V. 2011. Qualitative consumer and marketing
research. Canada: York University.
Bellamy, L.C. 2009. Strategy formulation in SMEs: indications from a longitudinal
study. International Journal of Entrepreneurship and Small Business, 8 (4): 534-549.
Berchicci, L. 2009. Innovating for Sustainability: Green Entrepreneurship in Personal
Mobility, London: Routledge, eBook Collection (EBSCOhost), EBSCOhost. [Accessed
28 November 2017]
Berisha, G. & Pula, J.S. 2015. Defining Small and Medium Enterprises: a critical
review. Academic Journal of Business, Administration, Law and Social Sciences, 1(1):
17-28.
Berndt, A. & Tait, M. 2012. Relationship Marketing and Customer Relationship
Management. (2nd ed.) Claremont: Juta.
Berry, T. 2010. Product and Brand Failures: A Marketing Perspective. Available online
Bezuidenhout, C.A. 2011. South African Perspective on fundamental criminology.
Heinemann: Cape Town.
Bisseker, C. 2014. SMEs: stop the failure rate. Small & medium businesses.
[Accessed 8 March 2016]. http://www.financialmail.co.za/features/2014/05/15/smes-
stop-the-failure-rate.
Black, S. 2011. The Practice of Public Relations. (4th ed.) Routledge.
Blombäck, A. & Craig, J. 2014. “Marketing from a Family Business Perspective.” In the
SAGE Handbook of Family Business. London: Sage.
209
Blombäck, A. & Ramírez-Pasillas, M. 2012. “Exploring the Logics of Corporate Brand
Identity Formation.” Corporate Communications: An International Journal, 17(1): 7-28.
Blumberg, B., Cooper, D.R. & Schindler, P.S. 2008. Business research methods.
Maidenhead: McGraw-Hill.
Boeije, H. 2010. Analysis in qualitative research. Thousand Oaks: California.
Bola, A. & Richard, M. 2012. An analysis of entrepreneurial and business skills and
Training Needs in SMEs in the Plastic Manufacturing Industry in the Eastern Cape
Province, South Africa. International Review of Social Sciences and Humanities, 3(2),
236-247.
Boris, U. & Reggie, N. 2012. Business sustainability: empirical evidence on operational
skills in SMEs in South Africa. Journal of Small Business and Enterprise Development,
19(1): 146-163.
Borza, S.I. & Borza, I.C. 2014. A Broad Analysis of Marketing Strategies for their
Incorporation as Activities in a User Centred Process. Procedia Economics and
Finance, 16: 239-250.
Boshoff, C. 2014. Services Marketing. (2nd ed.) Juta and Company.
Boswell, S. & Cannon, S. 2017. Introduction to Nursing Research. Incorporating
Evidence-Based Practice. (4th ed.) Jones & Bartlett Learning.
Botrić, V. & Božić, L. 2017. Access to Finance: Innovative Firms’ Perceptions in
PostTransition EU Members. EaM: Ekonomie a Management, 20(1): 129-143.
Bouazza, A.B., Ardjouman, D. & Abada, O. 2015. Establishing the Factors Affecting
the Growth of Small and Medium-sized Enterprises in Algeria. American International
Journal of Social Science, 4(2): 101-115.
Bourn, J. 2014. Ten ways Email marketing can help your business grow. [Online]
Available at http://www.bourncreative.com/10-ways-email-marketing-can-help-
business/ [Accessed on 10 January 2020].
Brace, I. 2013. Questionnaire Design: How to Plan, Structure and Write Survey
Material for effective market research. (3rd ed). Kogan Page Limited.
210
Brassington, F. & Pettit, S. 2013. Essentials of Marketing. (3rd ed.) Pearson.
Brink, A. & Cant, M.C. 2009. Problems experienced by small businesses in South
Africa.
Brooksbank, D., Thompson, P. & Williams, R. 2008. Entrepreneurial attitudes,
intentions and activities – a comparison of urban and rural areas in Wales.
International Journal of Entrepreneurship and Small Business, 6(3): 421-436.
Bruhn, M., Schoenmueller, V. & Schafer, D.B. 2012. “Are social media replacing
traditional media in terms of brand equity creation?”, Management Research Review,
35(9): 770-790.
Bryan, A. & Bell, E. 2011. Business Research Methods. (3rd ed.) London: Oxford
University Press.
Bryman, A. & Bell, E. 2015. Business research methods. (4th ed.) United Kingdom:
Oxford University Press.
Bryman, A. 2012. Social Research Methods. (4th ed.) Oxford University Press.
Buil, I., de Chernatony, L. & Martinez, T. 2013. Examining the role of advertising and
sales promotions in brand equity creation. Journal of Business Research, 66: 115-122.
Bullock, D. & Deragon, J. 2009. How do you sell Social Media? [Online] Social Media
Directions: Social Media Directions Available at: http://www.free-
ebooks.net/ebook/How-To-Sell-Social-Media/pdf?dl&preview [Accessed 12 April
2019].
Bureau for Economic Research. 2016. The Small, Medium and Micro Enterprise
Sector of South Africa. Research Note. No 1.
Burns, A.C. & Bush, R.F. 2010. Marketing Research. (6th ed.) Pearson Education, Inc.:
Upper Saddle River, NJ.
Burns, A.C. & Bush, R.F. 2014. Marketing research. (7th ed.) Boston: Pearson.
Burns, P. 2010. ‘Entrepreneurship Small Business Start-ups, Growth and Maturity.’
UK: Palgrave Macmillan.
211
Calcagnini, G. & Favaretto, I. 2011. The Economics of Small Businesses: An
International Perspective. Physica-Verlag. A springer Company.
Calitz, A.P. & Cullen, M. 2012. The Use of Social Media in Business School Marketing.
International Business Conference (IBC).
Cameron, R. 2011. Mixed Methods Research: The Five Ps Framework. The Electronic
Journal of Business Research Methods, 9(2):96-108.
Camilleri, M.A. 2018. Market Segmentation, Targeting and Positioning. In Travel
Marketing, Tourism Economics and the Airline Product. Springer, Cham, Switzerland.
Cant, M.C. & Wiid, J.A. 2013. Establishing the Challenges Affecting South African
SMEs. International Business & Economics Research Journal, 12(6): 707-716.
Cant, M.C, Wiid, J.A & Hung, Y.T. 2013. The Importance of Branding for South African
SMEs: An Exploratory Study. Corporate Ownership & Control, 11(1-8), 735-744
Cant, M.C. & van Heerden, C.H. 2010. Marketing management: A South African
perspective. Cape Town: Juta.
Cant, M.C. 2010. Marketing: An introduction. Cape Town: Juta.
Cant, M.C. 2012. Challenges Faced by SME’s In South Africa: Are Marketing Skills
Needed? International Business & Economics Research Journal, 11(10): 1107-1116.
Cant, M.C. 2012. Small Business Attitudes Towards Ethical Issues: Survival or
Ethically Correct? International Business & Economics Research Journal, 11(12):
1347-1358
Cant, M.C. Wiid, J.A & Kallier, S.M. 2013. Small Business Owners’ Perceptions of
Moral Behaviour and Employee Theft in the Small Business Sector of Nigeria. Gender
& Behaviour, 11(2): 5775-5787.
Cant, M.C. & Van Heerden C.H. 2013. Marketing Management: A South African
Perspective. Claremont, Juta & Company Ltd.
Cant, M.C., Erdis, C. & Sephapo, C.M. 2014. Business Survival: The Constraints
Experienced by South African SMEs in the Financial Sector. International Journal of
Academic Research in Business and Social Sciences, 4(10): 565-579.
212
Cant, M.C., Kallier, S.M. & Wiid, J.A. 2016. SMEs and product mix decisions: fact or
fiction. Problems and Perspectives in Management, 14(3-3): 608-616.
Cant, M.C., Wiid, J.A. & Kallier, M.S. 2015. Product Strategy: Factors That Influence
Product Strategy Decisions of SMEs In South Africa. The Journal of Applied Business
Research, 31(2): 621-630.
Carter, S. & Jones-Evans, D. 2012. Enterprise and Small Business: Principles,
Practice and Policy. (3rd ed.) Pearson.
Cattell, R. B. 1966. The SCREE test for the number of factors. Multivariate Behavioral
Research, 1: 245-276.
Chaffey, D., & Ellis-Chadwick, F. 2012. Digital Marketing: Strategy, Implementation
and Practice. (5th ed.) Pearson Education Limited.
Chang, S.I., Wu, H.C. & Cho, C.M. 2011. The development of a digital divide
assessment mechanism for SMEs: A perspective from the Taiwan manufacturing
industry. Journal of Global Information Technology Management, 14(1):6-34.
Chang, W. & Taylor, S.A. 2016. The Effectiveness of Customer Participation in New
Product Development: A Meta-Analysis. Journal of Marketing, 80: 47-64.
Chazireni, B. 2017. An investigation into corporate social responsibility on sustainable
growth of wholesale and retail SMEs: a case study of eThekwini municipal region.
Thesis. Durban University of Technology. Unpublished.
Chimucheka, T. 2012. Usefulness of business plans to small, micro and medium
enterprises in East London, South Africa. African Journal of Business Management,
6(14): 4957-4963.
Chimucheka, T. 2013. Overview and Performance of the SMMEs sector in South
Africa. Mediterranean Journal of Social Sciences, 4(14): 783-795.
Chingwaru, T. 2014. Impact of Trade and Economic Liberalisation Policy Reforms on
the operations of selected Small to Medium Enterprises (SMEs) in Zimbabwe; a
comparative study with South Africa’s experiences. Dissertation. Unpublished.
213
Christensen, L.B., Johnson, R.B. & Turner, L.A. 2011. Research Methods, Design and
Analysis. (11th ed.) Boston: Pearson Education.
Chukwuma, A.I., Ezenyilimba, E. & Agbara, V.N. O. 2018. Effect of Product Packaging
on the Sales Volume of Small and Medium Scale Bakery Firms in South East Nigeria.
International Journal of Academic Research in Business and Social Sciences, 8(6):
988–1001.
Churchill, G.A., Brown, T.J. & Suter, T.A. 2010. Basic Marketing Research. (7th ed).
Boston, MA: Cengage Learning.
Chuwiruch, N, Jhundra-Indra, P. & Boonlua, S. 2012. Marketing Innovation Strategy
and Marketing Performance: A Conceptual Framework Proceedings of the Academy
of Marketing Studies, 19(2): 82-93.
Ciubotariu M, S. 2013. The role of small and medium enterprises in the modern
economy and the importance of IFRS application for SMEs, ‟ The USV Annals of
Economics and Public Administration, 13(17): 201-210.
Coakes, S.J. 2013. SPSS: analysis without anguish: version 20 for Windows.
Queensland: John Wiley.
Collis, J. & Hussey, R. 2009. Business Research: a practical guide for undergraduate
& postgraduate students. New York: Palgrave Macmillan.
Contessi, F. & De Nicola, S. 2012. What do we know about the relationship between
access to finance and international trade? Working Paper 2012-054B, Federal
Reserve Bank of St. Louis, St. Louis, MO.
Cooksey, R. & McDonald, G. 2011. Surviving and thriving in postgraduate research,
Prahran, VIC, Tilde University Press.
Cooper, D.R. & Schindler, P.S. 2008. Business Research Methods. (10th ed.) Boston:
McGraw-Hill.
Cooper, R.D. & Schindler, P.S. 2011. Business Research Methods. (11th ed.) McGraw-
Hill. Education: Asia.
214
Costin, Y. 2011. In pursuit of growth: An insight into the experience of female
entrepreneurs. International Journal of Gender and Entrepreneurship, 4(2): 108-127.
Cravens, D.W. & Piercy, N.F. 2013. Strategic Marketing. (10th ed.) McGraw-Hill.
Creswell, J.W. & Plano-Clark V.L. 2007. Designing and Conducting Mixed methods
Research. (2nd ed.) Thousand Oakes, CA, Sage Publications.
Creswell, J.W. 2009. Research design: Qualitative and Mixed Methods Approaches.
London: SAGE.
Creswell, J.W. 2014. Research Design: Qualitative, Quantitative, and Mixed Methods
Approaches. (4th ed.) Los Angeles, California: Sage Publications.
Crook, T.R., Todd, S.Y., Combs, J.G., Woehr, D.J. & Ketchen, D. J. 2011. Does human
capital matter? A meta- analysis of the relationship between human capital and firm
performance. Journal of Applied Psychology, 96: 443-456.
Crosby, R.A., DiClemente, R.J. & Salazar, L.F. 2006. Research Methods in Health
Promotion. Jossey-Bass.
Cruz-Cunha, M.M. & Varajao, J. 2011. Innovations in SMEs and Conducting E-
Business: Technologies, Trends and Solutions. IGI Global.
Czarniewski, S. 2014. Communicating Customer Value Based on Modern
Technologies. Central European Business Review, 3(2): 36-43.
Dahlen, M., Lange, F. & Smith, T. 2010. Marketing Communications: A Brand
Narrative Approach. John Wiley & Sons Ltd.
Dann, S. & Dann, S. 2011. E-marketing. Palgrave Macmillan.
Dantzker, M. & Hunter, R.D. 2012. Research Methods for Criminology and Criminal
Justice. (3rd ed.) Jones & Bartlett Learning.
David C.M., Neeraj, A., Derek, K., John W., Michael, R., Ruba, B., Julia, C. & Julio, B.
2013. ‘Lessons on Technology and Growth from Small-Business Leaders’, The Boston
Consulting Group, UK. Available online:
https://www.bcsgperspectives.com/content/articles/technology_software_globalizatio
215
n_ahead_curve_lessons_technology_growth_small_business_leaders/ [Accessed
on 09/06/2015]
De Mooij, M. 2010. Global marketing and advertising: Understanding cultural
paradoxes. (3rd ed.) United States: Sage Publications, Inc.
Debeila, S.O. 2018. A Determination of Challenges and Opportunities Faced by Small,
Medium and Micro Enterprises (SMMEs) In Fetakgomo Local Municipality,
Sekhukhune In Limpopo Province. Mini-Dissertation. University of Limpopo.
Unpublished.
Deiss, R. & Henneberry, R. 2016. Digital Marketing for Dummies. John Wiley & Sons.
Deloitte. 2015. The Deloitte Consumer Review. Made-to-order: The rise of mass
personalisation. Available online. http://www.deloitte.com/view/consumerreview.
[Accessed 26 February 2019]
Demkin, J.A. 2008. The Architect's Handbook of Professional Practice. (14th ed.) John
Wiley & Sons, Inc.
Denscombe, M. 2014. The Good Research Guide: For Small-Scale Social Research
Projects. (5th ed.) McGraw-Hill Education.
Dewi, F. 2016. Manager Characteristics, HR Renewal, Marketing Strategies,
Partnership Motivation, Work Orientation, Work Standardization, on SMES Business
Resilience in the Competition: A SMES Study in Jakarta Indonesia. International
Journal of Management & Development, 3(2): 32-48.
Dietrich, T., Kubacki, K. & Rundle-Thiele, S. 2017. Segmentation in Social Marketing:
Process, Methods and Application. Springer.
Dixon, J.C., Singleton, R.A. & Straits, B.C. 2016. The Process of Social Research.
Oxford University Press. New York.
Dolnicar, S., Grun, B. & Leisch, F. 2018. Market Segmentation Analysis:
Understanding It, Doing It, and Making It Useful. Springer.
Dominick, J. 2013. The Dynamics of Mass Communication. New York: McGraw-Hill.
216
Douglas, J., Douglas, A., Muturi, D. & Ochieng, J. 2017. An Exploratory Study of
Critical Success Factors for SMEs in Kenya. Conference: International Conference on
Excellence in Services At: Verona, Italy.
Dutot, V. & Bergeron, F. 2016. From strategic orientation to social media orientation:
Improving SMEs’ performance on social media. Journal of Small Business Enterprise
Development. 23: 1165–1190.
Dzisi S. & Ofosu, D. 2014. Marketing Strategies and the Performance of SMEs in
Ghana. European Journal of Business and Management. 6(5): 102-111.
Ebitu, E.T. 2016. Marketing Strategies and the Performance of Small and Medium
Enterprises in Akwa Ibom State, Nigeria. British Journal of Marketing Studies, 4(5):
51-62.
Ebitu, E.T., Ufot, J.A. & Olom, P.A. 2015. Marketing Problems and the Performance
of Selected Small and Medium Enterprises (SMEs) in Southern Senatorial District of
Cross River State, Nigeria. American International Journal of Contemporary
Research, 5(5): 70-76.
Eccles, R.G. 2012. Is sustainability now the key to corporate success?
http://www.theguardian.com/sustainable-business/sustainability-key-corporate-
success. [accessed: 25 July 2017.]
Egan, J. 2011. Relationship Marketing: Exploring Relational Strategies in Marketing.
New York: Prentice Hall.
Eisto, T., Holtta, V., Mahlamaki, K., Kollanus, J. & Nieminen, M. 2010. Early Supplier
Involvement in New Product Development: A Casting-Network Collaboration Model.
International Conference on Service Science, Management and Engineering; Penang,
Malaysia: 548-559
El-Maraghy H.A., Schum, G., El-Maraghy W.H. & Piller, F.T. 2013. Product variety
management. CIRP Annals - Manufacturing Technology.
Entrepreneur magazine, Eileen Figure Sandlin. 2014. Start Your Own Consulting
Business: Your Step-By-Step Guide to Success. (4th ed.) Entrepreneur Media.
217
Esposito, A. 2013. Insights about integrated marketing communication in small and
medium-sized Italian enterprises. Business Systems Review, 2(1): 80-98.
Fain, J.A. 2017. Reading, Understanding, and Applying Nursing Research. (5th ed.)
F.A. Davis Company.
Familmaleki M., Aghighi, A. & Hamidi, K. 2015. Analyzing the Influence of Sales
Promotion on Customer Purchasing Behavior. International Journal of Economics &
Management Sciences, 4(4): 243.
Fantazy, K.A. & Salem, M. 2016."The value of strategy and flexibility in new product
development", Journal of Enterprise Information Management, 29(4): 525-548.
Farrington, S. & Venter, E. 2018. The Influence of Selected Marketing and Branding
Practices on the Financial Performance of Family SMEs. Southern African Business
Review. 22: 1-33.
Fassnacht, M. & El-Husseini, S. 2013. EDLP versus Hi-Lo pricing strategies in retailing
– a state of the art article. Journal of Business Economics. 83(3): 259-289.
Fatoki, O. & Chindoga, L. 2011. An investigation into the obstacles to youth
entrepreneurship in South Africa. International Business Research, 4(2): 161-163.
Fatoki, O. & Garwe, D. 2010. Obstacles to the growth of new SMEs in South Africa:
A principal component analysis approach. African Journal of Business Management,
4(5):729–738.
Fatoki, O. & Odeyemi, A. 2011. Which new small and medium enterprises in South
Africa have access to bank credit? International Journal of Business and Management,
5(10):128-136.
Fatoki, O. 2014. The Perception of New Small Business by Trade Creditors in South
Africa. Mediterranean Journal of Social Sciences, 5(16): 27-32.
Felicia, O.J., George., O., Owoyemi, O. & Adegboye, M. 2013. Effects of Socio-
Cultural Realities on the Nigerian Small and Medium Sized Enterprises (SMEs): Case
of Small and Medium Sized Enterprises in Lagos State. International Journal of
Business and Management. 9(1): 90-100.
218
Ferreira, M. 2011. ‘SME growth sector: A taxonomy combining life-cycle and resource-
based theories.’ The Service Industries Journal, 31(2): 251- 271.
Ferrell, O.C. & Hartline, M. 2008. Marketing Strategy. (4th ed.) Thompson Learning.
Ferrell, O.C. & Hartline, M.D. 2014. Marketing Strategy: Text and Cases. (6th ed.)
South-Western Cengage Learning.
Ferrell, O.C., Niininen, O. & Lukas, B.A. 2015. Marketing Principles. (2nd ed.) Cengage
Learning.
Field, A. 2000. Discovering Statistics using SPSS for Windows. London – Thousand
Oaks – New Delhi: Sage publications.
Fischer, H., Nebe, K. & Klompmaker, F. 2011. A Holistic Model for Integrating Usability
Engineering and Software Engineering Enriched with Marketing Activities. Berlin
Heidelberg: Springer-Verlag.
Flick, U. 2015. Introducing Research Methodology: A Beginner's Guide to Doing a
Research Project. (2nd ed.) SAGE.
Flores, M.E. & Yapuchura, S.A. 2012. Marketing holístico en la industria hotelera en
puno-Perú. Comuni@ccion: Revista de Investigación en Comunicacióny Desarrollo,
3(1): 5-16.
Forman, H. & Hunt, J.M. 2013."The effect of decision context on perceived risk in
pricing strategies: how managers view uncontrollable environmental forces", Journal
of Product & Brand Management, 22(10): 79-86.
Franco, M., Santos, M.D.F., Ramalho, I. & Nunes, C. 2014. An exploratory study of
entrepreneurial marketing in SMEs: The role of the founder-entrepreneur’. Journal of
Small Business and Enterprise Development, 21(2): 266-283.
Freathy, P. & O'Connell, F. 2012. Spending time, spending money: passenger
segmentation in an international airport. The International Review of Retail,
Distribution and Consumer Research, 22(4): 397-416.
Gabrielli, V. & Balboni, B. 2010. SME Practice towards Integrated Marketing
Communications. Marketing Intelligence & Planning, 28(3): 275-290.
219
Galloway, L. 2007. “Can broadband access rescue the rural economy?”, Journal of
Small Business and Enterprise Development, 14(4): 641-653.
Garikai, B.W. 2011. Exportation Challenges by Small and Medium Enterprises and
Possible Exportation Strategies. Retrieved from http://www.articlebase.
com/business-4056101.html
Gavrea, C., Ilies, L. & Stegerean, R. 2011. Determinants of Organizational
Performance: The Case of Romania. Management & Marketing Challenges for the
Knowledge Society, 6(2): 285-300.
Gaweseb, C.G. 2015. Marketing Communication Methods Used by Namibian Clothing
and Textile SMEs – A Case Study of SMEs Operating from Katutura and Khomasdal
Incubation Centers. Dissertation. Unisa. Unpublished.
Gbolagade A, Adesola M.A. & Oyewale I.O. 2013. Impact of Marketing Strategy on
Business Performance A Study of Selected Small and Medium Enterprises (SMEs) In
Oluyole Local Government, Ibadan, Nigeria. Journal of Business Management. 11(4):
59-66.
GEM. 2014. The crossroads - a goldmine or a time bomb? Cape Town: Global
Entrepreneurship Monitor.
Genchev, E. & Todorova, G. 2017. Sales Promotion Activities – Effective Tool of
Marketing Communication Mix. Trakia Journal of Sciences, 15(1): 181-185.
Gerber, K. 2009. FCS Marketing Communication L3. (2nd ed.) Pearson Education.
Ghouri, A.M., Khan, N.R., Malik, A.M. & Razzaq, A. 2011. ‘Marketing practices and
their effects on firm’s performance: findings from small and medium sized catering and
restaurants in Karachi’. International Journal of Business and Management, 6(5): 251-
259.
Gibson, P. 2011. The World of Customer Service. (3rd ed.) Cengage Learning.
Gilligan, C. & Hird, M. 2013. International Marketing: Strategy and Management.
Routledge.
220
Gitau, J. 2012. Effects of Advertising on the Small and Medium Enterprises in Kenya:
A case study on East African Packaging Industries. Thesis. Laurea University of
Applied Sciences. Unpublished.
Global Entrepreneurship Monitor (GEM). 2014. Retrieved November 2015, from GEM:
http://www.gemconsortium.org.
Gomes, L.F.A.M., Moshkovich, H. & Torres, D. 2010. Marketing decisions in small
businesses: how verbal decision analysis can help. International journal of
management decision making, 11(1): 19-36.
Gomez, M.C.O. & Perez, W.G. 2018. Communication as a Marketing Strategy: Cross-
cultural Analysis of Young People from Mexico and Colombia Based on Demographic
Segmentation. Mediterranean Journal of Social Sciences. 9(3): 173-183.
Gopaul, M. & Bothma, N. 2015. E-Marketing in The South African Context, Cape
Town, South Africa: Juta and Company, eBook Collection (EBSCOhost), EBSCOhost.
[Accessed 28 November 2017].
Gordon, B. & Wilson, O. 2015. Computer-Mediated Marketing Strategies: Social media
and online Brand Communities. IGI Global.
Gouliamos, K., Theocharous, A. & Newman, B.I. 2013. Political Marketing Strategic
Campaign Culture. Routledge.
Graziano, A. & Raulin, M. 2013. Research Methods: a process of inquiry. (8th ed.) New
Jersey: Pearson.
Ha, Y. & Lennon, S.J. 2011. Consumer responses to online atmosphere: The
moderating role of atmospheric responsiveness. Journal of Global Fashion Marketing,
2(2): 86-94.
Habib, A., Hossain, S. & Oma T. 2015. Impact of Advertisement on Consumer Choice:
A Case of SME and Consumers. Singaporean Journal of Business Economics, and
Management Studies, 4(5): 1-15.
Hadiyati, E. 2015. Marketing and Government Policy on MSMEs in Indonesian: A
Theoretical Framework and Empirical Study. International Journal of Business and
Management; 10(2): 128-141.
221
Haili, M.N. 2014. A study of the impact of social media on consumers. International
Journal of Marketing Research. 56: 387-404.
Hair, J.F., Bush, R.P. & Ortinau, D.J. 2006. Marketing research within a changing
environment. (3rd ed.) New York: McGraw-Hill/Irwin.
Halton Business. 2011. Why Should You Conduct a Business Feasibility Study?
Online available. https://haltonsbec.wordpress.com/2011/10/31/why-should-you-
conduct-a-business-feasibility-study/. [Accessed 08 August 2017]
Harelimana, J.B. 2017. Role of Access to Finance for the Performance of Small and
Medium Enterprises in Muhoza Sector, Rwanda. Business and Economics Journal,
8(1): 1-5.
Hartley, R.D. 2011. 'Mixed Methods Research', in Snapshots of research: readings in
criminology and criminal justice. SAGE Publications, Inc., Thousand Oaks, CA.
Hasan, M. 2011. Marketing Activities of Small and Medium Businesses in Bangladesh.
6: 124-138.
Hassan, M.U., Qureshi S.U., Sharif, S. & Mukhtar, A. 2013. Impact of Marketing
Strategy Creativity on Organizational Performance via Marketing Strategy
Implementation Effectiveness: Empirical Evidence from Pakistani Organizations.
Middle-East Journal of Scientific Research, 16(2): 264-273.
Hatten, T.S. 2012. Principles of Small Business Management. (5th ed.) USA, South-
Western Cengage Learning.
Hatten, T.S. 2016. Small Business Management: Entrepreneurship and Beyond. (6th
ed.) Cengage Learning.
Havaldar, K.K. 2010. Business Marketing: Text & Cases. (3rd ed.) Tata McGraw-Hill
Education.
Heini M.T. & Heikki, K. 2015. "The usage of digital marketing channels in SMEs",
Journal of Small Business and Enterprise Development, 22(4): 633-651.
Herrington, M., Kew, J. & Kew, P. 2010. Global Entrepreneurship Monitor (GEM): 2009
South African report-With a difference. Tracking Entrepreneurship in South Africa: A
222
GEM Perspective. Cape Town: University of Cape Town Graduate School of
Business.
Hiduke, G.P. & Ryan, J.D. 2014. Small Business: An Entrepreneur's Business Plan.
(9th ed.) Cengage Learning.
Hill, A.V. 2010. The Encyclopaedia of Operations Management - 2010 Edition: A field
manual and encyclopaedic glossary of operations management terms and concepts.
Clamshell Beach Press.
Hisrich, R.D, Peters, M.P. & Shepherd, A. 2010. Entrepreneurship. (8th ed.) New York:
McGraw-Hill.
Hollensen, S. 2010. Global Marketing. London: Pearson education limited.
Horn, R. 2012. Researching and writing dissertations: a complete guide for business
and management students. (2nd ed.) London: Chartered Institute of Personnel and
Development.
Hove, P. 2012. The impact of Technological Marketing on Porter’s Competitive forces
model and SMEs’ performance. Dissertation. Unpublished.
Hsiao, Y.C. & Chen, C.J. 2013. Branding vs contract manufacturing: capability,
strategy, and performance. Journal of Business and Industrial Marketing, 28(4): 317-
334.
Hughes, G. & Fill, C. 2006. Marketing Communications 2006-2007. The Chartered
Institute of Marketing.
Hughes, P. & Morgan, R. 2007. A resource-advantage perspective of product-market
strategy performance and strategic capital in high technology firms. Industrial
Marketing Management, 36(4): 503-517.
Human Resource Development Council of South Africa. 2013. Review of the current
skills development system and recommendations towards the best model for
delivering skills in the country. HRDC SSR-TTT Review of the Skills System in South
Africa.
223
Hussain, I., Farooq, Z. & Akhtar, W. 2012. ‘SMEs development and failure avoidance
in developing countries through public private partnership’, African Journal of Business
Management, 96(4):1581-1589.
Hussain, M. A., Elyas, T. & Nasseef, O. A. 2013. Research Paradigms: A Slippery
Slope for Fresh Researchers. Life Science Journal, 10(4): 2374-2381.
Ibrahim, N., Shiratuddin, M.F. & Wong, K.W. 2015. Comparing the Influence of Non-
Persuasive and Persuasive Visual on a Website and Their Impact on Users
Behavioural Intention. Journal of Telecommunication, Electronic and Computer
Engineering, 8(8): 149-154.
ILDP. 2014. Informal Small Medium and Micro Enterprises (SMME) Retailers in South
Africa.
Illmer, S.J. 2011. Success through excellence! Illmer Investment Performance
Consulting AG.
Ingenbleek, P.T.M., Meulenberg, M.T.G. & van Trijp, H.C.M. 2015. Buyer social
responsibility: A general concept and its implications for marketing management.
Journal of Marketing Management. 31(13-14): 1428-1448.
International Labour Organization. 2016. An assessment of Administrative Barriers
and Regulatory Costs for SMEs in South Africa. The Cost of Red Tape.
International Monetary Fund. 2013. Bangladesh: Poverty Reduction Strategy Paper.
Staff Country Reports.
Islam, A. 2014. Economic Growth and Crime against Small and Medium Sized
Enterprises in Developing Economies. Policy Research Working Paper 6768: The
World Bank Development Economics Global Indicators Group.
IT Web. 2011. Importance of SME sector – or why ARC exists. [Online] Available from:
http://www.itweb.co.za/index.php?option=com_content&view=article&id=45967
[Accessed: 17 August 2016].
224
Ivankova, N.V., Creswell, J.W. & Plano Clark, V.L. 2016. Foundations and approaches
to mixed methods research. In: K. Maree First steps in research. (2nd ed.) Pretoria:
Van Schaik Publishers.
Jain, M.K. & Gandhi, S.K. 2016. Defining Indian SMEs: A Critical Analysis.
International Journal of Arts, Humanities and Management Studies, 2(6): 12-25.
Jamalzadeh, M., Behravan, N. & Masoudi, R. 2012. An Empirical Study of Email-
Based Advertisement and its Influence on Consumers’ Attitude. International Review
of Management and Marketing, 2(3): 130-138.
Jantsch, J. 2011. Let’s talk Social Media for Small Business, Microsoft live small
business, Version Two. Online. Available: htm:
www.ducttapemarketing.com/socialmediaforbusiness.pdf.
January, P.C. 2013. The Evaluation of the Entrepreneurial Seed Fund programme: the
case of the Cape Winelands District Municipality. Dissertation. UNISA. Unpublished.
Jarvinen, J., Tollinen, A., Karjaluoto, H. & Jayawardhena, C. 2012. “Digital and social
media marketing usage in B2B industrial sector”, Marketing Management Journal,
22(2): 102-117.
Javier, S., Pedrosa, I., Lozano, L.M., Eduardo, G., Marcelino, C. & Muniz, J. 2018.
Using reversed items in Likert scales: A questionable practice. Psicothema, 30(2):
149-158.
Jerman, D. & Zavrsnik, B. 2012. The model of marketing communications
effectiveness: Empirical evidence from Slovenian business-to-business practice.
Journal of Business Economics and Management, 13(4): 63-81.
Jha, S.A. 2014. Social Research Methods. McGraw Hill.
Johnson, B. & Christensen, L. 2012. Educational research– Quantitative, qualitative
and mixed approach. (4th ed.) Thousand Oaks: Sage Publications.
Johnson, G., Whittington, R. & Scholes, K. 2012. Fundamentals of Strategy. Pearson
Education, Harlow, UK.
225
Jovanov-Marjanova, T. & Conevska B. 2011. Comparative Analysis of Factors from
Marketing and Legal Perspective and Policies That Affect SMEs in Macedonia and
EU, Conference Proceedings form the First International Conference - Researching
Economic Development and Entrepreneurship in Transitional Economies, Faculty of
Economics, University of Banja Luka, Banja Luka, Bosnia and Herzegovina, October
27-29.
Kahn, K.B. 2013. The PDMA Handbook on New Product Development. (3rd ed.) John
Wiley & Sons.
Kahraman, C., Kerre, E.E. & Bozbura, F.T. 2012. Uncertainty Modeling in Knowledge
Engineering and Decision Making - Proceedings of the 10th International Flins
Conference. World Scientific Publishing.
Kalane, L. 2015. Reasons for Failure of SMEs in The Free State. Dissertation.
University of Free State. Unpublished.
Kalanwa, S.C. 2014. Entrepreneur's Guide on Managing Small Business Profitably.
Bookbaby.
Kallier, S.M. 2017. The focus on marketing communication efforts of SMEs.
Management & Marketing. Challenges for the Knowledge Society, 12(1): 140-154.
Kamunge, M.S., Njeru, A. & Tirimba, O.I. 2014. Factors affecting the performance of
small and macro enterprises in Limuru town market of Kiambu County. International
Journal of Scientific and Research Publications, 4(12): 1-20.
Kanibira, H., Saydanb, R. & Nartc, S. 2014. Determining the Antecedents of Marketing
Competencies of SMEs for International Market Performance, 10th International
Strategic Management Conference. Procedia - Social and Behavioral Sciences, 150:
12-23.
Kanyongo, G.Y. 2005. "Determining the Correct Number of Components to Extract
from A Principal Components Analysis: A Monte Carlo Study of The Accuracy of The
Scree Plot," Journal of Modern Applied Statistical Methods, 4(1): 65-74.
Kapferer, J.N. 2012. The new strategic brand management: Advanced insights &
strategic thinking. (5th ed.) London: Kogan Page.
226
Kapoor, A. & Kulshrestha, C. 2010. Marketing Research. Excel Books: New Delhi.
Karadeniz, M. 2009. Product Positioning Strategy in Marketing Management. Journal
of Naval Science and Engineering, 5(2): 98-110.
Karanja, T., Muturi, P., Mukabi, M., Kabata, D., Wahome, S. & Kayogo, M. 2013. Small
Business Management (Entrepreneurship). International Journal of Business and
Social Science, 4(1): 113-142.
Karimi, S. & Naghibi, H.S. 2015. Social Media Marketing (SMM) strategies for Small
to Medium Enterprises (SMEs). International Journal of Information, Business and
Management, 7(4): 84-95.
Karthikeyan, N. & Balamurugan, T. 2012. Mobile Marketing: Examining the impact of
Interest, Individual attention, Problem faced and consumer’s attitude on intention to
purchase. Interdisciplinary Journal of Contemporary Research in Business Institute of
Interdisciplinary Business Research, 3(10): 809-821.
Karthikeyan, R. & Dharmaraj, A. 2015. Impact of Marketing Strategies on Pump
Industry with Reference to Coimbatore District. International Journal of Research in
Social Sciences, 5(2): 219-224.
Katua, N.T. 2014. The Role of SMEs in Employment Creation and Economic Growth
in Selected Countries. International Journal of Education and Research, 2(12): 461-
472.
Keh, H.T., Nguyen, T.T.M. & Ping, H. 2007. The effects of entrepreneurial orientation
and marketing information on the performance of SMEs. Journal of Business
Venturing, 22(4): 592-611.
Keizer, J.A., Dijkstra, L. & Halman, J.I.M. 2002. Explaining innovative efforts of SMEs.
An exploratory survey among SMEs in the mechanical and electrical engineering
sector in The Netherlands. Technovation 22.
Kent, R. 2007. Marketing Research: Approaches, Methods and Applications in
Europe. (1st ed.) London: Thomson Learning.
227
Keyton, J. 2010. Communication research asking questions, finding answers. (3rd ed.)
Boston: McGraw-Hill.
Kihanya, K. 2013. Effects of Integrated Marketing Communication on Business
Performance in The Insurance Industry A Case Study of The Kenya Orient Insurance
Limited. Dissertation. United States International University. Unpublished.
Kihimbo, B.W., Ayako, B.A. & Omoka, K.W. 2012. Collateral requirements for
financing of small and medium enterprises (SMEs) in Kakamega municipality in
Kenya. International Journal of current Research, 4(6): 21-26.
Kimani, E. 2014. Marketing Strategies and Performance of Kenya Revenue Authority.
Unpublished Project. University of Nairobi.
Kimou A.J.C. 2015. Crime, self-protection and business growth in Cote d‘Ivoire.
Modern Economy, 6(10): 1101-1114.
Kirkman, A. 2010. The Role of Wine Tourism in The Marketing of Wineries in The
Stellenbosch Wine Route of South Africa. Dissertation. UNISA. Unpublished.
Kiseleva, O.V. & Pinkovetskaia, I.S. 2016. Analysis on Investment of Small and
Medium Entrepreneurship. International Journal of Economics and Financial Issues,
6(8 Special Issue): 315-320.
Kivunja, C. & Kuyini, A.B. 2017. Understanding and Applying Research Paradigms in
Educational Contexts. International Journal of Higher Education, 6(5): 26-41.
Klenke, K. 2016. Qualitative Research in the Study of Leadership. (2nd ed.) Emerald
Group.
Koekemoer, L. 2014. Marketing communication, an integrated approach. Ltd. Cape
Town: Juta and Company Ltd.
Kolabi, A., Hosseini, H., Mehrabi, R. & Salamzedeh, A. 2011. Developing
entrepreneurial marketing mix: Case study of Entrepreneurial Food Enteprises in Iran.
Journal of Knowledge Management, Economics and Information technology, 1(5): 1-
17.
228
Kongolo, M. 2010. Job creation versus job shedding and the role of SMEs in economic
development, African Journal of Business management, 4(11): 2288-2295.
Koski, H. & Kretschmer, T. 2010. “New product development and firm value in mobile
handset production”, Information Economics and Policy: IEP, 22(1): 42-50.
Kotler, P. & Armstrong, G.M. 2011. Principles of Marketing. Cape Town. Pearson
Education.
Kotler, P. & Keller, K.L. 2014. Marketing management. (14th ed.) Upper Saddle River,
NJ: Pearson Prentice Hall.
Kotler, P., Bowen J.T. & Makens, J.C. 2010. Marketing for hospitality and tourism. (5th
ed.) Upper Saddle River, NJ: Prentice Hall.
Kotler, P., Keller, L., Brady, M., Goodman, M. & Hansen, T. 2009. Marketing
management. London: Pearson.
Krause, W., Schutte, C. & du Preez, N. 2012. Open Innovation in South African Small
and Medium-Sized Enterprises. CIE42 Proceedings, 16-18 July 2012, Cape Town,
South Africa © 2012 CIE & SAIIE.
Kumar, R. 2011. Research methodology: a step by step guide for beginners. (3rd ed.)
Sage Publications.
Ladzani, W. & Netswera, G. 2009. Support for Rural Small Businesses in Limpopo.
Development Southern Africa, 26(2): 225-239.
Lamb, C.W., Hair, J.F. & McDaniel, C. 2009. Essentials of Marketing. (6th ed.)
Cengage Learning
Lamb, C.W., Hair, J.F. & McDaniel, C. 2011. Marketing: Student edition. South-
Western
Lamb, C.W., Hair, J.F. & McDaniel, C. 2012. Essentials of Marketing. (7th ed.)
Cengage Learning
Lamb, C.W., Hair, J.F. & McDaniel, C. 2017. Principles of Marketing. Cengage
Learning.
229
Lamb, C.W., Hair, J.F., McDaniel, C., Kapoor, H., Klaise, H. & Appleby, R. 2010.
Marketing. Canadian Edition. Nelson Education
Larsen, N. 2010. Market Segmentation - A framework for determining the right target
customers. Thesis. Unpublished.
Lather, P. 1986. Research as praxis. Harvard Educational Review, 56(3): 257-277.
Laura, M.O. & James, A.B. 2014. Quantitative Research for the Qualitative
Researcher. SAGE publications.
Leboea, S.T. 2017. The Factors Influencing SME Failure in South Africa. Dissertation.
University of Cape Town. Unpublished.
LEDA. 2013/14. Annual report. Available at: www.lieda.co.za [accessed 28 September
2016].
Leedy, P.D. & Ormrod, J.E. 2013. Practical Research Planning and Design. (9th ed.)
Boston: Pearson.
Leedy, P.D. & Ormrod, J.E. 2014. Practical Research Planning and Design. (10th ed.)
Harlow, UK: Pearson.
Lehmann, D. 2006. Evaluating Measurement Properties of Collage Research:
Development of brand representations. Druck and Bindung.
Lekhanya, L.M. 2010. The Use of Marketing Strategies by Small, Medium and Micro
Enterprises in Rural KwaZulu-Natal. PhD Thesis. Durban University of Technology.
Unpublished.
Lekhanya, L.M. 2015. The Role of Integrated Marketing Communications in
Enhancement of SMEs Growth in South Africa. Journal of Economics and Behavioral
Studies, 7(2): 139-144.
Lekhanya, L.M. 2015. Key internal factors affecting the small, medium and micro
enterprises (SMMEs) marketing strategies in rural South Africa. Problems and
Perspectives in Management, 13(2): 410-417.
230
Lekhanya, L.M. 2015. The Significance of Emerging Technologies in Promoting
Internationalization of Rural SMEs in South Africa. Mediterranean Journal of Social
Sciences. 5(20): 2717-2725.
Leonidou, C, N., Katsikeas, C.S. & Morgan, N.A. 2013. “‘Greening’ the Marketing Mix:
Do Firms Do It and Does It Pay Off,” Journal of the Academy of Marketing Science,
41(2): 151-70.
Levinson, J.C. & Levinson, J. 2011. The Best of Guerrilla Marketing: Guerrilla
Marketing Remix. Entrepreneur Press.
Li, J.J. & Zhou, K.Z. 2010. How foreign firms achieve competitive advantage in the
Chinese emerging economy: Managerial ties and market orientation. Journal of
Business Research, 63(8): 856-862.
Lior, G. 2012. Handbook of Survey Methodology for the Social Sciences. New York:
City University of New York.
Liu, Q., Karahanna, E. & Watson, R.T. 2011. “Unveiling user-generated content:
designing websites to best present customer reviews”, Business Horizons, 54(3): 231-
240.
Liu, W., Li, J., & Chang, X. 2014. A Multi-Agent Model for Strategies of New Product
Development. Economic Computation & Economic Cybernetics Studies & Research,
48(1): 1-15.
Loch, C.H. & Kavadias, S. 2008. Handbook of New Product Development
Management. Elsevier Ltd.
Love, J. & Roper, S. 2013. SME Innovation, Exporting and Growth. Enterprise
Research Centre, White Paper No. 5.
Lucca, C. & Lee, S.H. 2016. Entrepreneurial Marketing for SMEs. New York: Palgrave
Macmillan.
Maboa, R.S. 2011. A Situational Analysis of the SMMEs in the Maruleng Municipality
in the Limpopo Province. Dissertation. University of Limpopo. Unpublished.
231
Mabuza, P.V. 2016. The potential role of public-private partnerships in the South
African economy: An innovative conceptual public-private partnerships model for small
and medium enterprise development. PhD Thesis. University of South Africa.
Unpublished.
Mack, L. 2010. The Philosophical Underpinnings of Educational Research.
Polyglossia, 19: 5-11.
Madani, A.E. 2018. SME Securitization in SME Policy: Comparative Analysis of SME
Definitions. International Journal of Academic Research in Business and Social
Sciences, (8): 103-114.
Mafuya, Z.B. 2013. Factors deterring business expansion in South Africa. Dissertation.
UKZN. Unpublished.
Magesa, R., Shimba, C. & Magombola, D. 2013. Investigating impediments towards
access to financial services by women entrepreneurs: A Case of Arumeru District.
Developing Country Studies: 3(11): 105-115.
Mahembe, E. 2011. Literature review on small and medium enterprises’ access to
finance. Pretoria: National Credit Regulator.
Maher, L. 2014. Building a culture for innovation: A leadership challenge. World
Hospitals and Health Services, 50(1): 4-6.
Makhitha, K.M. & Bresler, N. 2011. The perceived marketing benefits of the 2010 FIFA
World Cup for craft enterprises, African Journal for Physical, Health Education,
Recreation and Dance, pp. 232-252.
Makhitha, K.M. 2013. Buyer behaviour of craft retailers in South Africa. PhD Thesis.
University of Pretoria. Unpublished.
Makhitha, K.M. 2016. Marketing Strategies of Small Craft Producers in South Africa:
Practices and Challenges. The Journal of Applied Business Research, 32(3): 663-679.
Makhitha, K.M. 2019. Marketing strategies for closing the market access gap
experienced by small craft producers in South Africa. Journal of Business and Retail
Management Research (JBRMR), 13(3): 147-159.
232
Makhubela, V.F. 2019. The impact of Marketing Communication Strategies on the
performance of Small Independent Retailers in Soweto, South Africa. Dissertation.
UNISA. Unpublished.
Malasi, J.M. 2012. Influence of Product Attributes on Mobile Phone preference among
university students: A Case of Undergraduate students. International Journal of
Academic Research in Economics and Management Sciences, 1(6): 10-16.
Malefane, S.R. 2013. Small Medium, and Micro Enterprise and local economic-base
restructuring – a South African local government perspective. Journal of Public
Administration, 48(4): 671-690.
Malhotra, N.K. 2010. Marketing research: an applied orientation. (6th ed.) Upper
Saddle River, NJ: Pearson.
Maloka, C.M. 2013. The Contribution of Small, Medium and Micro Enterprises towards
Local Economic Development in Mankweng Township, Limpopo Province.
Dissertation, University of Limpopo. Unpublished.
Mangold, W.G. & Faulds, D.J. 2009. Social media: New hybrid element of the
proportion mix. Business Horizon, 52: 357-365.
Marais, H., de Klerk, N. & Bevan-Dye, A.L. 2014. Perceived Effectiveness of Sales
Promotion Techniques amongst South African Generation Y Students. Mediterranean
Journal of Social Sciences, 5(21): 51-60.
Marjanova, T.J. & Stojanovaski, M. 2012. Marketing Knowledge and Strategy for
SMEs: Can They Live Without It? Thematic Collection of papers of international
significance: "Reengineering and entrepreneurship under the contemporary
conditions of enterprise business. pp. 131-143.
Martin, G. & Staines, H. 2008. Managerial competencies in small firm. Journal of
Management Development, 13(7): 23-34.
Martins, J.H. 2012. Market segmentation of the consumer market in South Africa.
International Retail and Marketing Review, 8(1):61-74.
Masocha, R. 2019. Social Sustainability Practices on Small Businesses in Developing
Economies: A Case of South Africa. Sustainability.
233
Mayer, T., Melitz, M.J. & Ottaviano, G.I.P. 2014. Market Size, Competition, and the
Product Mix of Exporters. American Economic Review, 104(2): 495–536.
Mbedzi, K.P. 2011. The Role of Government Agencies in Promoting SMMEs in
Limpopo: A Critical Assessment. Research report.
Mbonyane, B.L. & Ladzani, W. 2011. Factors that hinder the growth of small
businesses in South African townships. European Business Review. 23(6): 550-560.
Mbonyane, B.L. 2009. An Exploration of Factors that Lead to Failure of Small
Businesses in the Kagiso Township. Dissertation, UNISA. Unpublished.
Mbugua, J.K., Mbugua, S.N., Wangoi, M., Ogada, J.O. & Kariuki, J.N. 2013. Factors
affecting the growth of micro and small enterprises: A case of tailoring and
dressmaking enterprises in Eldoret. International Journal of Business and Social
Sciences, 4(5): 285-293.
McDaniel, C. Jr. & Gates, R. 2010. Marketing Research with SPSS. (8th ed.) Asia:
John Wiley and Sons (Pty) Ltd.
McGregor, S.L.T. & Murnane, J.A. 2010. Paradigm, methodology and method:
Intellectual integrity in consumer scholarship. International Journal of Consumer
Studies, 34(4): 419-427.
McGuinness, D. & Hutchinson, K. 2013. Utilising product knowledge: competitive
advantage for specialist independent groceries retailers. International Journal of Retail
and Distribution Management, 41(6): 461-476.
McKenzie, S. 2013. Vital statistics - E-Book: An introduction to health science
statistics.
McMillan, J.H. & Schumacher, S. 2010. Research in Education: evidence-based
enquiry. (7th ed.) New Jersey: Pearson.
Mensah, M.S.B. 2012. Access to manufacturing of small business sector in Ghana.
International Journal of Business and Management. 7(12): 36-47.
234
Meyer, D.F. & Venter, A. 2013. Challenges and solutions for Local Economic
Development (LED) municipal institutional arrangements. The case of the Northern
Free State. Administratio Publica 21(4): 91-113.
Mezher, T., El-Saouda, R., Nasrallah, W.F. & Ajam, M. 2008. Entrepreneurship in
Lebanon: a model for successes and failures. International Journal of Arab Culture
Management and Sustainable Development, 1(1): 34.
Minister Lindiwe Zulu. 2016. Small Business Development Dept. Budget Vote 2016/17
Mitchell, R, Hutchinson, K. & Bishop, S. 2012. Interpretation of the retail brand: an
SME perspective. International Journal of Retail & Distribution Management, 40(2):
157-175.
Moderandi, Inc. 2013. The Strategic Marketing Process: How to Structure Your
Marketing Activities to Achieve Better Results. (2nd ed.)
Mohammad, A.H., Wang, A. & Sunayya, B. 2012. Investigating on Tourists
satisfaction: An empirical study on East Lake. European journal of business and
management, 4(7): 273-282.
Mohammad, R.J. & Neda, S. 2012. "The effect of electronic word of mouth on brand
image and purchase intention: An empirical study in the automobile industry in Iran",
Marketing Intelligence & Planning, 30(4): 460-476.
Mohutsiwa, M. 2012. Strategic Entrepreneurship and Performance of Small and
Medium Enterprises in South Africa. Research Report. WITS. Unpublished.
Molly, T. 2013. “Definition of Performance Measurement”, Demand Media. Available
online: http://smallbusiness.chron.com/definition-performance-measurement-
45759.html. [Accessed 26 July 2016]
Moloi, R. 2013. The sustainability of construction small-medium enterprises (SMEs) in
South Africa. MSc dissertation. University of Witwatersrand, Johannesburg, South
Africa. Unpublished.
Morgan, J.P. 2012. The Small and Medium Enterprise (SME) Sector —Catalyst for
Growth in South Africa. JPMorgan Chase Foundation.
235
Morgan, N.A. 2012. Marketing and business performance. Journal of the Academy of
Marketing Science, 40:102–119.
Motta, V. 2017. The impact of crime on the performance of Small and Medium-Sized
Enterprises: Evidence from the service and hospitality sectors in Latin America.
Tourism Economics, 23(5): 1-18.
Mourougan, S. & Sethuraman, K. 2017. Hypothesis Development and Testing. Journal
of Business and Management, 19(5): 34-40.
Mouton, J. 2011. The practice of social research. Cape Town: Oxford University Press
Msoza, S.K. 2015. Assessing Customer Service in The Malawian Public Postal
Service. Dissertation. Durban University of technology. Unpublished.
Muchandigona, A. 2014. Exploring Factors that Affect Growth Development of Small
and Medium Enterprises in Polokwane Local Municipality. Dissertation. Mancosa.
Unpublished.
Muchilwa, D.M., Otieno, O.C., Oginda, M. & Oima, D. 2014. The Impact of Public
Relations Principles in the Strategic Management of the Police Force in Kenya.
Universal Journal of Management, 2(3): 116-126.
Mudavanhu V., Bindu, S., Muchabaiwa, L. & Lloyd, C. 2011. Determinants of Small
and Medium Enterprises Failure in Zimbabwe: A case study of Bindura. International
Journal of Economic Research, 2(5):82-89.
Muday, S. 2013. A research model to improve understanding of the extent of usage of
enterprise resource planning systems in a university. MTech, Durban University of
Technology. Unpublished.
Muhammed, H.H., Mohd, N.M.S. & Halim, B.M.L. 2012. Relationship between
Entrepreneurial Orientation, Firm Resources, SME Branding and Firm’s Performance:
Is Innovation the Missing Link? American Journal of Industrial and Business
Management, 2: 153-159.
Mullins, J.W. & Walker, O.C. 2013. Marketing Management. A Strategic Decision-
Making Approach. (8th ed.) McGraw-Hill.
236
Munzhedzi, P.H. 2015. South African local economic development: issues, challenges
and opportunities. Conference proceeding of the South African Association of Public
Administration and Management Limpopo Chapter, The Park Hotel, Mokopane,
October 2014.
Muske, G. 2011. Small business myths and realities. Available online:
http://www.ag.ndsu.edu/ccv/documents/publication.
Mustapha, U.M. 2010.The Role of Product Design, Manufacturing Systems and
Environmental Uncertainty in Nigeria Manufacturing Organizations. Engineering
Doctorate (D- Eng). Available: www.usq.edu.au [Accessed 10 October 2016].
Nair, H.V. 2016. Digital marketing: a phenomenon that rules the modern Word.
Reflections Journal of Management (RJOM), 6: 80-86.
National Credit Regulator. 2011. Literature Review on Small and Medium Enterprises’
Access to Credit and Support in South Africa. South Africa.
Needle, D. 2010. Business in Context: An Introduction to Business and Its
Environment. Cengage Learning.
Neneh N.B. & van Zyl, J.H. 2012. Achieving optimal business performance through
business practices: evidence from SMMEs in selected areas in South Africa.
Neuman, W.L. 2011. Social research methods: qualitative and quantitative
approaches. (7th ed.) Boston, Massachussettes: Allyn & Bacon.
Nieuwenhuis, J. 2016a. Qualitative research designs and data-gathering techniques.
In: K. Maree First steps in research. (2nd ed.) Pretoria: Van Schaik Publishers
Nikolić, I., Dhamo, Z. H., Schulte, P., Mihajlović, I. & Kume, V. 2015. An analysis of
factors affecting failure of SMEs. In proceedings of the 11th International May
Conference on Strategic Management-IMKSM. Bor, Serbia. pp. 160-180.
Njue, F.M. 2015. A Comparative Analysis of Upper and Lower Quartile Academic
Achievers’ Study Habits in Secondary Schools in Embu County, Kenya. Dissertation.
UNISA. Unpublished.
237
Nkonde S.D. 2012. Information Asymmetry and Obstacles on SMMEs growth in the
Rural Areas of uThungulu District Municipality of KwaZulu-Natal. Dissertation
University of Zululand. Unpublished.
Nkwinika, M.K.K. & Munzhedzi, P.H. 2016. The Role of Small Medium Enterprises in
the Implementation of Local Economic Development in South Africa. SAAPAM
Limpopo Chapter 5th Annual Conference Proceedings.
Norman, C. & Mornay, R.L. 2012. Impact of Level of Education and Experience on
Profitability of Small Grocery Shops in South Africa. International Journal of Business
Management, 3(1): 462-470.
Nwankwo, S. & Gbadamosi, A. 2011. Entrepreneurship marketing: principles and
practice of SME marketing. Routledge.
Oboreh, J.S., Ogechukwu, A.D. & Francis, U.G. 2011. Relationship marketing as an
effective strategy by Igbo managed SMEs in Nigeria. Journal of Arts, Science &
Commerce, 2(2): 229-255.
Odoom, R. 2016. “Brand-building efforts in high- and low-performing small- and
medium-sized enterprises (SMEs)”, Journal of Small Business and Enterprise
Development, 23(4): 1229-1246.
Odoom, R., Narteh, B. & Boateng, R. 2017. "Branding in small- and medium-sized
enterprises (SMEs): Current issues and research avenues", Qualitative Market
Research: An International Journal, 20(1): 68-89.
Odunlami, I.B. & Emmanuel, A.T. 2014. Effect of Promotion on Product Awareness (A
Case Study of a Reputable Organization in the Brewery Sub-Sector of the
Manufacturing Industry). International Journal of Education and Research, 2(9): 451-
472.
OECD/EU/EBRD/ETF/SEECEL. 2016. SME Policy Index: Western Balkens and
Turkey 2016: Assessing the Implementation of the Small Business Act for Europe,
SME Policy Index, OECD Publishing, Paris.
238
Ogbadu, E.E. 2013. Appraisal of the Practical Application of Marketing Research by
SMEs in Nigeria. International Journal of Academic Research in Business and Social
Sciences, 3(2): 27-41.
Ogundele, O.J.K., Akingbade, W.A., Saka, R.O., Elegunde, A.F. & Aliu, A.A. 2013.
Marketing Practice of Small and Medium Enterprises (SMEs): Perspective from a
Developing Country. Mediterranean Journal of Social Sciences, 4(3): 243-258.
Oji, O.N., Iwu, C.G. & Haydam, N. 2017. The use of social media marketing strategies
by SMMEs in the hospitality sector in Cape Metropole, South Africa. African Journal
of Hospitality, Tourism and Leisure, 6(1): 1-16.
Oke, A., Burke, G. & Myers, A. 2007. "Innovation types and performance in growing
UK SMEs", International Journal of Operations & Production Management, 27(7): 735-
753.
Olumoko, T.A., Abass, O.A. & Dansu, S.F. 2012. The role of Personal selling in
enhancing client satisfaction in Nigerian insurance market. Journal of emerging Trends
in Economics and Management Sciences, 3(2): 147-152.
Omar, C.M. & Anas, T. 2014. The Marketing of Small and Medium Enterprise (SME)
Products Based on Food Processing. European Journal of Business and Social
Sciences, 3(5): 76-87.
Osei, A., Yunfei, S., Appienti, W.A. & Forkuoh, S.K. 2016. Product Innovation and
SMEs Performance in the Manufacturing Sector of Ghana. British Journal of
Economics, Management & Trade, 15(3): 1-14.
Ouwersloot, H. & Duncan, T. 2008. Integrated marketing communications. London:
McGraw-Hill.
Owomoyela, S.K., Oyeniyi, K.O. & Ola, O.S. 2013. Investigating the impact of
marketing mix elements on consumer loyalty: An empirical study on Nigerian
Breweries Plc. Interdisciplinary Journal of Contemporary Research in Business, 4(11):
485-496.
239
Pangemanan, S.A. & Walukov, I.M. 2018. Marketing strategy analysis for small and
medium-scale business enterprises (SMEs) for Home Industry Furniture in Leilem, the
Regency of Minahasa. Journal of Physics: Conference Series 953, 1-13.
Parrott, G., Azam, R.M. & Holliman, D. 2010. "An analysis of marketing programmes
adopted by regional small and medium‐sized enterprises", Journal of Small Business
and Enterprise Development, 17(2): 184-203.
Patterson, K. & Winston, B. 2017. Leading an African Renaissance: Opportunities and
Challenges. Palgrave Macmillan.
Paul, A. 2012. Role of information communication technology in the growth and
development of small and medium scale enterprises in Ghana – case study of some
selected small and medium scale enterprises in the Tema Metropolis. Dissertation.
Kwame Nkrumah University of Science and Technology. Unpublished.
Paull, R.E. & Duarte, O. 2010. Tropical Fruits, Volume 1. CABI.
Pawan, K. & Pawan, K. 2013. Marketing Strategies of Small-Scale Industries: A
Review. International Journal on Arts, Management and Humanities, 2(2): 35-38.
Pencak, S. 2012. The importance of branding. [Online] Available from:
http://www.mymagneticblog.com/the-importance-of-branding/ [Accessed: 20 May
2017].
Petro, M., Annastazia, M. & Robert, M.G. 2014. The Effects of Socio-Cultural Factors
on the Performance of Women Small and Medium Enterprises in Tanzania. Journal of
Economics and Sustainable Development, 5(21): 51-62.
Polyorat, K. 2014. Integrated marketing communication for SME’s organic fertilizer:
the case study of Men-ngern.
Pousttchi, K. & Wiedemann, D.G. 2010. Handbook of Research on Mobile Marketing
Management. Business Science Reference. New York.
Pride, W.M. & Ferrell, O.C. 2010. Marketing. 2010 edition. Cengage Learning.
Pride, W.M. & Ferrell, O.C. 2017. Foundations of Marketing. (7th ed.) Cengage
Learning.
240
Pride, W.M., Hughes, R.J. & Kapoor, J.R. 2010. Introduction to Business. (10th ed.)
Australia: South Western Cengage Learning.
Pride, W.M., Hughes, R.J. & Kapoor, J.R. 2013. Foundations of Business. Cengage
Learning.
Pyeman, J., Edura, W., Rashid, W., Hanif, A., Jamal, S., Nasis, A., Mohamad, S. &
Tan, P.L. 2014. Proceedings of the 1st AAGBS International Conference on Business
Management. Springer.
Quinlan, C. 2011. Business Research Methods. United Kingdom: South-Western
Cengage Learning.
Racela, O.C. 2015. "Viable strategy configurations and new product development
capability and performance", Asia Pacific Journal of Marketing and Logistics, 27(2):
249-266.
Radipere, N.S. 2012. An analysis of local and immigrant entrepreneurship in the South
African small enterprise sector. Unpublished Doctoral thesis. Pretoria: UNISA.
Unpublished.
Radipere, S. & Dhliwayo, S. 2014. The role of gender and education on small business
performance in the South African small enterprise sector. Mediterranean Journal of
Social Sciences, 5(9): 104-110.
Radipere, S. 2014a. The effects of culture as a start-up factor on business
performance. Problems and Perspectives in Management, 12(4): 141-154.
Radipere, S. 2014b. The effects of entrepreneurial orientation on business
performance. Mediterranean Journal of Social Sciences, 5(16): 141-152.
Ramasobana, M. 2017. Marketing Communication and the Performance of Small and
Medium Enterprises in Polokwane Local Municipality. The 2nd Annual International
Conference on Public Administration and Development Alternatives. 26 - 28 July 2017,
Tlotlo Hotel, Gaborone, Botswana.
Rambo, C.M. 2013. Time required to break-even for small and medium enterprises:
The Evidence from Kenya. The International Journal of Marketing Research and
Management, 6(1): 81-94.
241
Ramees, R.M. & Safeena, P.K. 2016. Customer Needs and Customer Satisfaction.
Training Manual on Theeranaipunya - Equipping Fisherwomen Youth for Future.
Ramsden, K. 2019. The effects of psychological capital and job satisfaction on work
engagement of support staff at a holding’s establishment (Meridian Holdings).
Dissertation. University of Stellenbosch. Unpublished.
Ramukumba, T. 2014. Overcoming SMEs challenges through Critical Success
Factors: A case of SMEs in the western Cape Province, South Africa. Economic and
Business Review, 16(1): 19-38.
Rana, S., Negi, G.P. & Kapoor, K. 2016. A Study over Importance of Data Cleansing
in Data Warehouse. International Journal of Advanced Research in Computer Science
and Software Engineering. 6(4): 151-157.
Rankhumise, E.M. & Rugimbana, R.O. 2010. Micro enterprise owner perspectives on
performance: Insights from selected municipalities in Mpumalanga Province, South
Africa. Africa Journal of Business Management, 4(16): 3500-3507.
Ray, N. 2015. Emerging Innovative Marketing Strategies in the Tourism Industry. IGI
Global.
Razak, R.A. 2012. “Entrepreneurial orientation without stress as a ‘Tonic’ in
magnifying the Malaysian SMEs productivity: a theoretical perspective”, International
Journal of Academic Research in Business and Social Sciences, 2(4): 163-180.
Reece, M. & Blanchard, K. 2010. Real-Time Marketing for Business Growth: How to
Use Social Media, Measure Marketing, and Create a Culture of Execution. Kawasaki.
Reic, I. 2017. Events Marketing Management: A Consumer Perspective. Routledge.
Reijonen, H., Laukkanen, T., Komppula, R. & Tuominen, S. 2012. Are growing SMEs
more market‐oriented and brand‐oriented? Journal of Small Business Management,
50(4): 699-716.
Republic of South Africa National Credit Regulator. 2011. Literature review on small
and medium enterprises’ access to credit and support in South Africa. Midrand:
National Credit Regulator.
242
Resnick, S.M., Cheng, R., Simpson, M. & Lourenco, F. 2016. Marketing in SMEs: a
“4Ps” Self-branding model. International journal of Entrepreneurial Behaviour and
Research, 22(1): 155-174.
Rietveld, T. & Van Hout, R. 1993. Statistical Techniques for the Study of Language
and Language Behaviour. Berlin – New York: Mouton de Gruyter.
Ringim, K.J. 2012. Effect of the business process reengineering factors on information
and technology capabilities on organizational performance. PhD Thesis. University of
Utara, Malaysia. Unpublished.
Rios, V.R. & Campo, E.P. 2013. Business Research Methods: Theory and Practice.
ESIC Editorial.
Rishika, R., Kumar, A., Janakiraman, R. & Bezawada, R. 2013. “The effect of
customers’ social media participation on customer visit frequency and profitability: an
empirical investigation”, Information Systems Research, 24(1): 108-127.
Ritchie, J. & Lewis, J. 2012. Qualitative Research Practice: A Guide for Social Science
Students and Researchers. Los Angeles: Sage.
Robert, K.Y. 2013. Case Study Research: Design and Methods. (5th ed.) Sage
Publications.
Rosenthal, J.A. 2011. Statistics and Data Interpretation for Social Work. New York:
Springer Publishing Company, LLC.
Rubera, G. & Cornelia, D. 2013. “Technology Versus Design Innovation’s Effects on
Sales and Tobin’s Q: The Moderating Role of Branding Strategy,” Journal of Product
Innovation Management, 30(3): 448-64.
Rubin, A. & Babbie, E. 2009. Essential Research Methods for Social Work. (2nd ed.)
Cengage Learning.
Rubin, A. & Babbie, E.R. 2017. Empowerment Series: Research Methods for Social
Work. (9th ed.) Cengage Learning.
243
Rufai, I.A. 2014. The impact of communication technologies on the performance of
SMEs in a developing economy: Nigeria as a case study. The Electronic Journal of
Information Systems in Developing Countries. 65(7): 1-22.
Ruhdelius, H.K. 2011. The Core Marketing. McGraw-Hill Irwin. New York.
Rungani, E.C. & Potgieter, M. 2018. ‘The impact of financial support on the success
of small, medium and micro enterprises in the Eastern Cape province’, Acta
Commercii 18(1): a591.
Ruzzier, M.K., Ruzzier, M. & Hisrich, R.D. 2013. Marketing for Entrepreneurs and
SMEs: A Global Perspective. Edward Elgar Publishing.
Ryan, E. 2012. Business Partners Launches new index to measure SME confidence
levels. Pretoria News: Business Report, 20 July. Pretoria: Independent News.
SAICA. 2015. SMEs insight report. South Africa.
Saleem, S. 2010. Business Environment. (2nd ed.) Pearson.
Salkind, N.J. 2009. Exploring research. (7th ed.) Essex: Pearson/ Prentice Hall.
Salkind, N.J. 2012. Exploring research. (8th ed.) Pearson.
Sarango-Lalangui, P., Álvarez-García, J. & Río-Rama, M.D.C.D. 2018. Sustainable
Practices in Small and Medium-Sized Enterprises in Ecuador. Sustainability, MDPI,
10(6): 1-15.
Saremi, H. & Zadeh, S.M.M. 2014. Management of Distribution Channels. Indian
Journal of Scientific Research, 5(3): 452-456.
Sarma, M., Septiani, S., Dewi, F.R. & Siregar, E.H. 2013. The Impact of
Entrepreneurial Marketing and Business Development on Business Sustainability:
Small and Household Footwear Industries in Indonesia. International Journal of
Marketing Studies. 5(4): 110-122.
Saunders, M. & Lewis, P. 2012. Doing Research in Business & Management. (1st ed.)
Harlow, England: Pearson.
244
Saunders, M., Lewis, P. & Thornhill, A. 2009. Research methods for business
students. (5th ed.) Cape Town: Prentice Hall.
Saunders, M., Lewis, P. & Thornhill, A. 2012. Research methods for business
students. (6th ed.) England: Pearson Education Limited.
Sawicki, A. 2016. Digital Marketing. World Scientific News. 48: 82-88.
SBP. 2011. Growing Small Firms, Growing Employment.
SBP. 2012. Current State of legislation in South Africa: A country overregulated and
under governed? An SBP occasional paper.
SBP. 2013. Developing a new path for SMEs in South Africa; Reassessing for growth.
Issue paper 1.
SBP. 2014. Examining the challenges facing small businesses in South Africa. Issue
Paper 1.
Schlegelmilch, B.B. 2016. Global Marketing Strategy: An Executive Digest. Springer.
Schmid, S. & Kotulla, T. 2011. “50 years of research on international standardization
and adaptation— From a systematic literature analysis to a theoretical framework”,
International Business Review, 20: 491-507.
Scotland, J. 2012. Exploring the philosophical underpinnings of research: Relating
ontology and epistemology to the methodology and methods of the scientific,
interpretive, and critical research paradigms. English Language Teaching, 5(9): 9-16.
Seda, Y. 2015. Activities of Strategic Marketing Planning in SMEs. International
research Journal of Social Sciences, 5(1): 853-867.
SEDA. 2012. Analysis of the Needs, State and Performance of Small and Medium
Businesses in the Agriculture, Manufacturing, ICT and Tourism Sectors in South
Africa. Final Report.
SEDA. 2016. The Small, Medium and Micro Enterprise Sector of South Africa.
Research Note, 2016 No 1.
245
SEDA. 2017. Business development and support for small enterprises. Interview with
Koenie Slabbert, the Provincial Manager of Seda Limpopo.
Seeletse, S.M. 2012. Common causes of small businesses failure in the townships of
West Rand district municipality in the Gauteng Province of South Africa. African
Journal of Business Management, 6(44): 10994-11002.
Segetlija, Z., Maseric, J. & Dujak, D. 2011. Importance of Distribution Channels -
Marketing Channels - For National Economy.
Sekaran, U. & Bougie, R. 2010. Research Methods for Business: A Skills Building
Approach. (5th ed.) Chichester: John Wiley.
Sekaran, U. & Bougie, R. 2013. Research Methods for Business. A Skill Building
Approach. (6th ed.) Wiley, New York.
Senthur, B.S., Sowmyan, G. & Sakthi, V. 2013. The Product Promotion and Consumer
Retention Gap in Online Shopping. 4th International Conference on Electronics
Computer Technology. Page 158-161.
Shane, S. 2011. Small Business’s Problem with Government Regulation. Small
Business Trends. Online available [accessed: 21 July 2017].
https://smallbiztrends.com/2011/01/small-business’s-problem-with-government-
regulation.html.
Shank, M.D. & Lyberger, M.R. 2015. Sports Marketing: A Strategic Perspective. (5th
ed.) Routledge.
Sharma, P. & Gounder, N. 2012. ‘Obstacles to Bank financing of micro and small
enterprises: Empirical evidence from the pacific with some policy implications’, Asia-
Pacific Development Journal, 9(2): 49-75.
Sharmilee, S. & Muhammad, H. 2016. Factors affecting the performance of small and
medium enterprises in KwaZulu-Natal, South Africa. Problems and Perspectives in
Management, 14(2-2): 277-288.
Sheetal, C., Sangeeta, S. & Kumar, R. 2012. Marketing Strategies of Small and
Medium Enterprises: A Sample Survey. International Journal of Management
Sciences, 01(2): 60-71.
246
Shenoy, D. 2008. Measuring effectiveness and value of email advertisements in
relationship-oriented email messages. Massachusetts Institute of Technology, 63-70.
Shinozaki, S. 2012. A new regime of SME finance in emerging Asia: Empowering
growth-oriented SMEs to build resilient national economies. ADB Working Paper
Series on Regional Economic Integration. No. 104.
Shukla, P. 2008. Essentials of Marketing Research. Paurav Shukla & Ventus
Publishing ApS.
Shukla, P. 2010. Essentials of Marketing Research: Part II. Measurement,
Questionnaires, Analysis & Reporting. Paurav Shukla & Ventus Publishing.
Sibanda, K., Hove-Sibanda, P. & Shava, H. 2018. ‘The impact of SME access to
finance and performance on exporting behaviour at firm level: A case of furniture
manufacturing SMEs in Zimbabwe’. Acta Commercii, 18(1): 1-13.
Sibanda, M.M. 2013. Small Medium and Micro-Enterprises in Local Economic
Development: A South African Local Government Perspective: Journal of Public
Administration, 48(8): 656-670.
Siddiqui, M.S. 2015. Regulating telemarketing. The Financial Express, 22(330): 720-
739.
Silverman, D. 2010. Doing Qualitative Research. (3rd ed.) Sage.
Simpson, M., Padmore, J., Taylor, N. & Frecknall-Hughes, J. 2016. Marketing in small
and medium sized enterprises. International Journal of Entrepreneurial Behaviour &
Research, 12(6): 361-38.
Simrie, M., Herrington, M., Kew, J. & Turton, N. 2012. Global Entrepreneurship Monitor
South Africa. Cape Town: University of Cape Town.
Sindakis, S. 2015. The Entrepreneurial Rise in Southeast Asia: The Quadruple Helix
Influence on Technological Innovation. Springer.
Singh, S.K. & Gupta, S. 2014. Entrepreneurship with Practical Class XII. Revised
edition. SBPD Publications.
Singh, T.J. & Sahu, S.K. 2017. Research Methodology: Latest Edition.
247
Smit, Y. & Watkins, J.A. 2012. A literature review of small and medium enterprises
(SME) risk management practices in South Africa. African Journal of Business
Management, 6(21): 6324-6330.
Soke, V.B. 2014. The application of internet marketing by small, medium and micro
enterprises (SMEs) in Soweto. Dissertation. UNISA. Unpublished.
Solomon, M.R., Marshall, G.W. & Stuart, E.W. 2011. Marketing: Real People, Real
Choices. Prentice Hall, New Jersey.
South African Government. 2012. South African government Online. Retrieved from.
www.info.gov.za [Accessed 14 July 2012]
Southiseng, N. & Walsh, J. 2010. Competition and Management issues of SME
entrepreneurs in Laos: Evidence from empirical studies in Vientiane Municipality,
Savannakhet and Luang Prabang. Asian Journal of Business Management, 2(3): 57-
72.
Spence, M. & Essoussi, L.H. 2010. SME brand building and management: an
exploratory study. European Journal of Marketing, 44(7/8): 1037-1054.
Spenner, P. & Freeman, K. 2012. “To keep your customers, keep it simple”, Harvard
Business Review, 90(5): 108-114.
Sreejesh, S. Mohapatra, S. & Anusree, M.R. 2014. Business Research Methods: An
Applied Orientation. Springler.
Stam, W., Arzlanian, S. & Elfring, T. 2014. Social capital of entrepreneurs and small
firm performance: A meta-analysis of contextual and methodological moderators,
Journal of Business Venturing, 29(1): 151-173.
Statistics South Africa 2015. Quarter 2. Quarterly Labour Force Survey, Pretoria,
viewed n.d., from Http://Www.Statssa.Gov.Za/Default.Asp.
Statistics South Africa. 2016. Retrieved from: http://www.statssa.gov.za/?p=1034.
Retrieved: 07 June 2017.
Stein, F., Rice, F.S. & Cutler, S.K. 2013. Clinical Research in Occupational Therapy.
(5th ed.) Delmar, Cengage Learning.
248
Stokes, D. & Chen, H. 2009. Small business and the environment: Turning over a new
leaf? Business Strategy Environment, 19(5): 273-288.
Struwig, F.W. & Stead, G.B. 2013. Research: Planning, Designing and Reporting.
Pearson Education South Africa (Pty) Ltd.
Sturdy, G. 2013. Customer relationship management through business intelligence.
Dissertation. Tilburg University.
Subramanian, K.R. 2017. Marketing and Promotion of a Single Product in Different
Regions. International Journal of Engineering and Management Research. Vol 7, (4).
Sulistya, G.A. & Darwanto, D. 2016. ‘Transaction cost of micro and small enterprises
financing’. Economic Journal of Emerging Markets, 8(2): 171-186.
Svendsen, M.F., Haugland, S.A., Grønhaug, K. & Hammervoll, T. 2011. Marketing
strategy and customer involvement in product development. European Journal of
Marketing, 45(4): 513-530.
Szopa, P. & Pekala, W. 2012. Distribution Channels and Their Roles in The Enterprise.
Polish Journal of Management Studies, 6: 143-150.
Tabachnick, B.G. & Fidell, L.S. 2007. Using multivariate statistics. (5th ed.) Boston,
MA: Allyn & Bacon.
Tajvidi, M. & Karami, A. 2015. Product Development Strategy: Innovation Capacity
and Entrepreneurial Firm Performance in High-Tech SMEs. Palgrave MacMillan.
Talmy, S. 2010. Qualitative Interviews in Applied Linguistics: From Research
Instrument to Social Practice. Annual Review of Applied Linguistics, 30:128-148.
Tanner, J.F. & Raymond, M.A. 2012. Marketing Principles. (v.2.0).
Taper, K.S. 2016. The Use of Cronbach’s Alpha When Developing and Reporting
Research Instruments in Science Education.
Tapera, J. & Gororo, R. 2013. An Analysis of The Factors Affecting Formulation and
Implementation of Marketing Strategies in The Insurance Industry. Research Journal
of Social Science & Management, 3(8): 201-219.
249
Tavakol, M. & Dennick, R. 2011. Making sense of Cronbach’s alpha: International
Journal of Medical Education, 2: 53-55.
Taylor, P.C. & Medina, M.N.D. 2013. Educational research paradigms: From
positivism to multi-paradigmatic. Journal for Meaning Centered Education,1(1): 881-
889.
Tennis, J.T. 2008. "Epistemology, Theory, and Methodology in Knowledge
Organization: Toward a Classification, Metatheory, and Research Framework."
(2008).
Terkan, R. 2014. Importance of Creative Advertising and Marketing According to
University Students’ Perspective. international journal of Management and Marketing,
4(3): 239-246.
Terziovski, M. 2010. Innovation Practice and Its Performance Implications in Small
and Medium Enterprises (SMEs) In the Manufacturing Sector: A Resource-Based
View. Strategic Management Journal, 31: 892-902.
The Department of Trade and Industry (DTI). 2012. White Paper on National Strategy
for the Development and Promotion of Small Business in South Africa. Pretoria,
Government Publications.
The Department of Trade and Industry. South Africa. 2013. The DTI Agencies. Small
Enterprise development Agency (SEDA).
Themba, Y. 2012. Small is the way to go. Sunday Times: Review, 1 July: 5:
Johannesburg: Avusa.
Timm, S. 2011. How South Africa can Boost Support to Small Businesses: Lessons
from Brazil and India. Trade and Industrial Policy Strategies (TIPS).
Timm, S. 2011. Take a leaf out of Brazil’s Book: back small businesses. Business Day,
January. 31:9. Johannesburg: Avusa.
Timm, S. 2012. How the state and private sector can partner to boost support to SMEs
Lesson from Chile and Malaysia. A report for the South African Department of Trade
and Industry (the DTI) and TIPS.
250
Tlhomola, S.J., Rankhumise, E.M. & Van Niekerk, B.J. 2010. Perceptions of Small,
Medium, Micro Enterprise Entrepreneur regarding Factors Contributing to Failure: A
Case of Tshwane Metropolitan Municipality. Tshwane University of Technology.
Tock, J.M. & Baharun, R. 2013. Introduction to SMEs in Malaysia: Growth and
potential and branding strategy. World Journal of Social Sciences, 3(6): 189-203.
Todorova, G. 2015. Marketing Communication Mix. Trakia Journal of Sciences, 13(1):
368-374.
Trade & Industry Policy Strategies. 2017. The State of Small Business in South Africa.
The real economy bulletins. Available online.
Trade-Up Capital Fund & Nextrade Group, LLC. 2015. State of SME Finance in the
United States in 2015. Report.
Trehan, M. & Trehan, R. 2010. Advertising and Sales Management. New Delhi: V.K
Enterprises.
Trivedi, J.Y. 2013. A Study on Marketing Strategies of Small and Medium sized
Enterprises. Research Journal of Management Sciences. Vol. 2(8), 20-22.
Tsikirayi, C.M.R., Muchenje, B. & Katsidzira, Z. 2013. Impact of integrated marketing
communications mix (IMCM) in small to medium enterprises (SMEs) in Zimbabwe as
a marketing tool. Research in Business and Economics Journal, 7(10): 1-12.
Turton, N. & Herrington, M. 2012. Global Entrepreneurship Monitor 2012 South Africa.
Cape Town: University of Cape Town.
U.S International Trade Commission. 2010. Small and Medium-Sized Enterprises:
Overview of Participation in U.S. Exports. United States International Trade
Commission Investigation No. 332-508. USITC Publication 4125.
Valadez, R.M. 2011. The value proposition of small businesses: economic engines for
job creation. Journal of Management and Marketing Research, 9: 1-11.
Valassis, K. & De Rosen, Y. 2013. Adaptation/Standardization of SMEs’ Marketing Mix
Elements across borders. Dissertation. Halmstad University. Unpublished.
251
Van Fleet, D., Van Fleet, E. & Seperich, G.J. 2014. Agribusiness. Principles of
Management. Delmar Cengage Learning.
Van Heerden, C.H. & Drotsky, A. 2011. Personal selling. (2nd ed.) Claremont: Juta.
Van Scheers, L. & Makhitha, K.M. 2016. Are Small and Medium Enterprises (SMEs)
planning for Strategic Marketing in South Africa? Foundations of Management, 8: 243-
250.
Van Scheers, L. 2011. SMEs’ marketing skills challenges in South Africa. African
Journal of Business Management, 5(13): 5048-5056.
Van Scheers, L. 2012. Marketing related challenges of small and medium enterprises
(SMEs) in developing African countries: The South African challenge.
Van Swinderen, A.M. 2015. Market Research for SME finance. Growth Cap. Project
Technical Note.
Veal, A.J. 2011. Research Methods for Leisure and Tourism: A practical guide.
Sydney: Pearson education.
Veliu, L. & Manxhari, M. 2017. The Impact of Managerial Competencies on Business
Performance: SME’s In Kosovo. Vadyba Journal of Management. 1(30): 59-65.
Vemic, M.B. 2017. Optimal Management Strategies in Small and Medium Enterprises.
IGI Global.
Venkatesh, J. & Kumari, R.L. 2015. Role of marketing strategies in the context of
MSME sector. International journal of research in finance and marketing. 5(8): 1-6.
Venter, R., Urban, B. & Rwingema H. 2011. Entrepreneurship: Theory in Practice.
Cape Town: Oxford University Press.
Vilnius, U. & Vitautas, D. 2008. Importance of marketing activities in a company: the
management perspective.
Vlad, D.V, Pintea, F.R. & Garbo, V.I. 2015. Analysis of marketing strategies
implemented of Advertising environment: “vitrina advertising” CLUJ-NAPOCA.
Quality-Access to Success, Vol. 16, S2.
252
Voortman, C. & Makhitha, K.M. 2014. The alignment of product strategy to supply
chain practices of craft businesses in Gauteng Province, South Africa. Journal of
Transport and Supply Chain Management 8(1): 126-137.
Voronkova O.V., Kurochkina A.A., Firova I.P. & Bikezina, T.V. 2017. Implementation
of an Information Management System for Industrial Enterprise Resource Planning.
Espacios, 38(49): 23-35.
Walliman, N. 2011. Research Methods: the basics. Routledge, USA.
Walt, K. 2013. Major Content Marketing Solutions and Problems. www.forbes.com.
Wang, W.P., Pauleen, D.J. & Zhang, T. 2016. ‘How social media applications affect
B2B communication and improve business performance in SMEs’. Industrial
Marketing Management, 54: 4-14.
Wanigasekara, W.M.S.K. & Surangi, H.K.N.S. 2011. Impact of level of education and
business experience on business success among small retail owner managers in Sri
Lanka, University of kelaniya. Paper to be presented at 2nd International Conference
on Business and Information (ICBI) 20 October 2011.
Ward. 2018. SME Definition (Small to Medium
Enterprise). https://www.thebalancesmb.com/sme-small-to-medium-enterprise-
definition-2947962. [Accessed on 18 Mar 2019].
Watson, L. & Netswera, G. 2009. Support for Rural Small Businesses in Limpopo
Province, South Africa. Development Southern Africa, 225-239.
Wegner, T. 2012. Applied business statistics, Method and excel-based applications.
(3rd ed.) Juta.
Weinstein, A. 2019. Superior Customer Value: Finding and Keeping Customers in the
Now Economy. (4th ed.) Routledge.
Welman, C., Kruger, S.J. & Mitchell, B.C. 2013. Research methodology. (3rd ed.) Cape
Town: Oxford University Press.
253
Wielicki, T. & Arendt, L. 2010. A knowledge-driven shift in perception of ICT
implementation barriers: comparative study of US and European SMEs. Journal of
Information Science, 36(2):162-174.
Wiid, J.A. & Diggines, C.N. 2013. Marketing research. Cape Town: Juta.
Wilson, A. 2012. Marketing Research: An integrated approach. (3rd ed.) Essex:
Pearson Education.
Wind J. & Mahajan V. 2002. Digital marketing, Symphonya. Emerging Issues in
Management (symphonya.unimib.it), 1: 43-54.
World Bank & International Finance Corporation. 2012. Doing Business in a more
transparent world: Economy Profile-South Africa. Washington, DC: The International
Bank for Reconstruction and Development.
Xaba, G.M. 2012. The Operational Experiences of Small Business Owners in Kwa-
Thema Township. Dissertation. Tshwane University of Technology. Unpublished.
Yahya, A.Z., Fatt, C.K., Othman, A.S., Rahman, I.A. & Moen, J. 2011. Management
skills and entrepreneurial success of small and medium enterprises (SMEs) in the
services sector. African Journal of Business Management, 5(26): 10410-10418.
Yan, L. & Musika, C. 2018. The Social Media and SMEs Business Growth. How can
SMEs Incorporate Social Media? Linnaeus University. Sweden. Available online:
http://www.diva-portal.org/smash/get/diva2:1210927/FULLTEXT01.pdf. [Accessed 22
November 2019]
Yan, S. & Chew, D.A.S. 2011. An investigation of marketing strategy, business
environment and performance of construction SMEs in China. African Journal of
Business Management, 5(6): 2396-2405.
Yasmin, A., Tasneem, S. & Fatema, K. 2015. Effectiveness of Digital Marketing in the
Challenging Age: An Empirical Study. International Journal of Management Science
and Business Administration, 1(5): 69-80.
Yayar, R. & Karaca, O.E. 2017. Economic Literacy Levels of Public Officers in Turkey.
Pakistan Journal of Commerce and Social Sciences, 11(1): 49-65.
254
Yeshin, T. 2012. Integrated Marketing Communications. Butterworth-Heinemann.
Yin, R.K. 2016. Qualitative Research from Start to Finish. (2nd ed.) The Guilford Press.
New York London.
Yong, A.G. & Pearce, S. 2013. A Beginner’s Guide to Factor Analysis: Focusing on
Exploratory Factor Analysis. Tutorials in Quantitative Methods for Psychology, 9(2):
79-94.
Yoshino, N. & Taghizadeh-Hesary F. 2016. Major Challenges Facing Small and
Mediumsized Enterprises in Asia and Solutions for Mitigating Them. ADBI Working
Paper 564. Tokyo: Asian Development Bank Institute. Available:
http://www.adb.org/publications/majorchallenges-facing-small-and-medium-sized-
enterprises-asia-and-solutions/
Zachary, M.A., McKenny, A., Short, J.C. & Payne, T. 2011. Family Business and
Market Orientation: Construct Validation and Comparative Analysis. Family Business
Review, 24(3): 233-251.
Zafar, A. & Mustafa, S. 2017. SMEs and its Role in Economic and Socio-Economic
Development of Pakistan. International Journal of Academic Research in Accounting,
Finance and Management Sciences. 7(4): 195-205.
Zammito, J.H. 2004. A nice derangement of epistemes: Post-positivism in the study of
science from Quine to Latour. Chicago. IL: The University of Chicago Press.
Zeleke, W. 2013. Analysis of Factors that Affect the Long-Term Survival of Small
Businesses in Pretoria, South Africa. Journal of Data Analysis and Information
Processing, 1: 67-84.
Zellweger, T.M., Kellermanns, K.W., Eddleston, K.A. & Memili, E. 2012. Building a
Family Firm Image: How Family Firms Capitalize on Their Family Ties. Journal of
Family Business Strategy, 3(1): 239-250.
Zeriti, A., Robson, M.J., Spyropoulou, S. & Leonidou, C.N. 2014. Sustainable Export
Marketing Strategy Fit and Performance. Journal of International Marketing, 22(4): 44-
66.
255
Zhou, D. 2015. Critical success factors towards SMEs sustainability in Johannesburg
Municipality. Dissertation. University of Pretoria. Unpublished.
Zikmund, W.G. & Babin, B.J. 2010. Exploring Marketing Research. International
Edition. (10th ed.) South-Western.
Zikmund, W.G. & Babin, B.J. 2015. Exploring Marketing Research. (11th ed.) Cengage
Learning.
Zikmund, W.G., Babin, B.J., Carr, J.C. & Griffin, M. 2012. Business Research
Methods. (9th ed.) Cengage Learning.
Zikode, S. 2012. Concentrated ownership hampering SME development. 7th
November 2012. http://www.engineeringnews.co.za/article/concentrated-ownership-
hampering-sme-development-2012-11-07/rep_id:4136. Accessed: 18/03/2016.
Zuluaga, P. 2008. Conquer the Top 6 Small Business Marketing Challenges. (Internet
2018).
Zuma, J.Z. 2015. South Africa: State of the Nation Address.
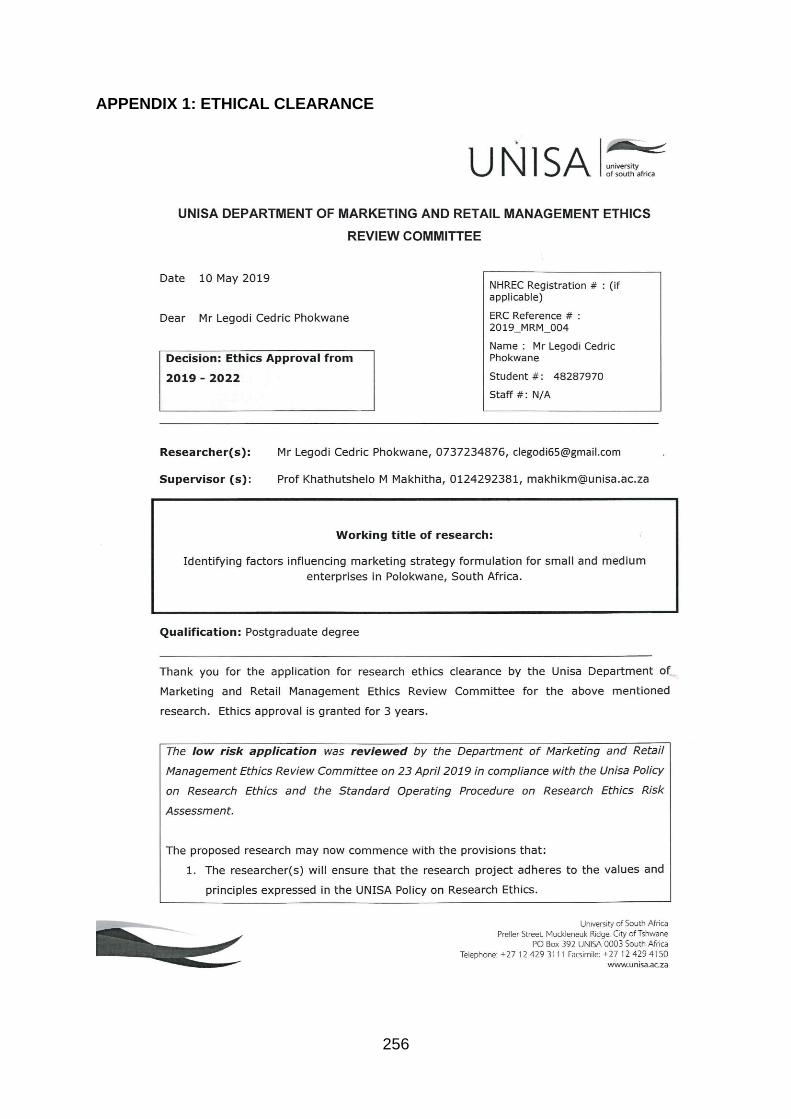
256
APPENDIX 1: ETHICAL CLEARANCE
257
258
APPENDIX 2: LANGUAGE EDITING LETTER
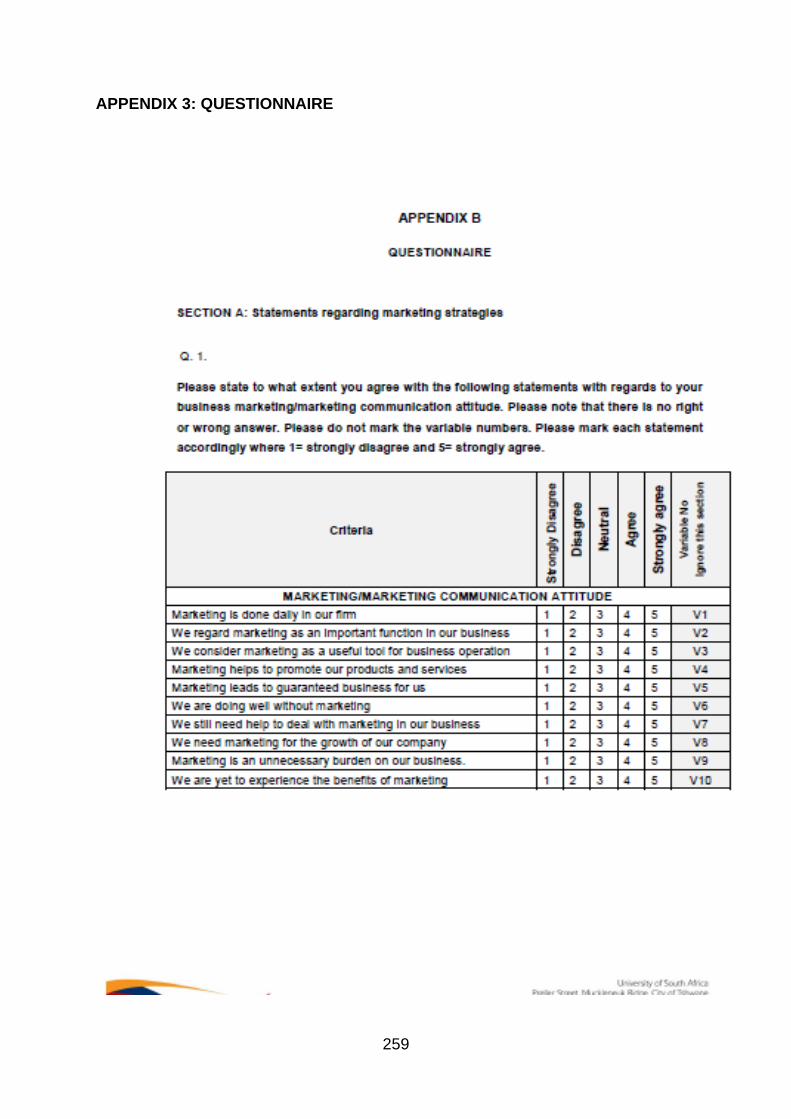
259
APPENDIX 3: QUESTIONNAIRE
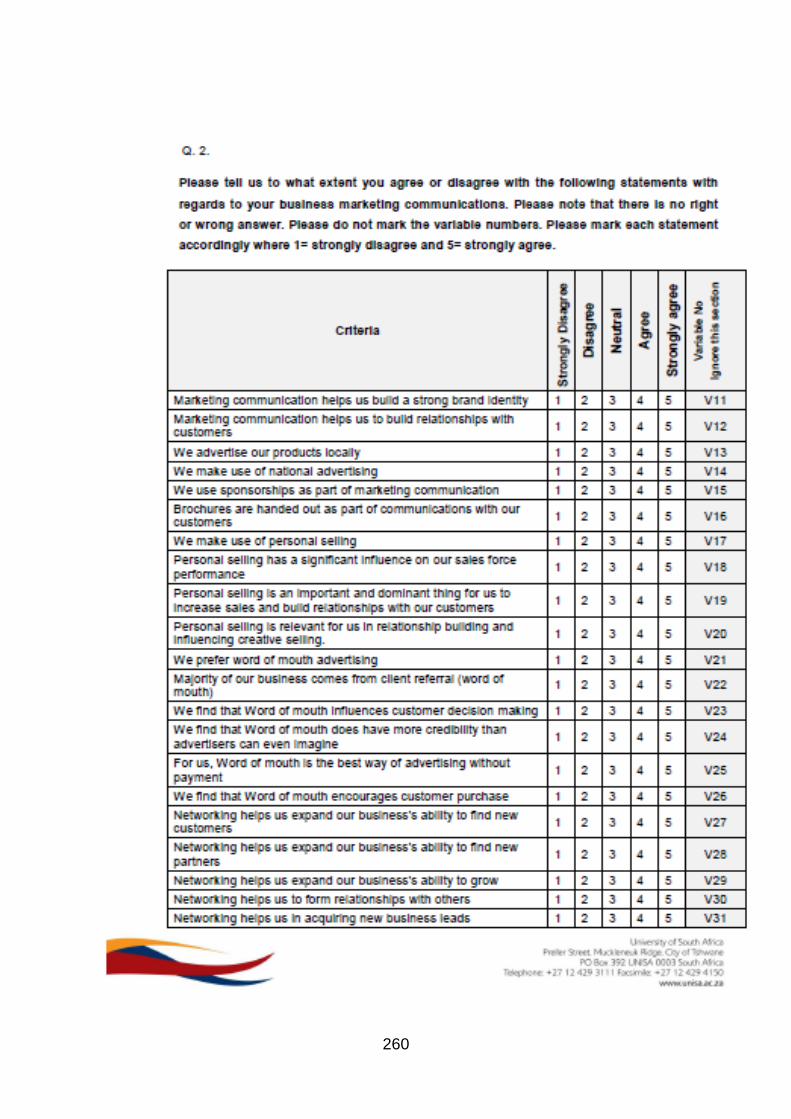
260
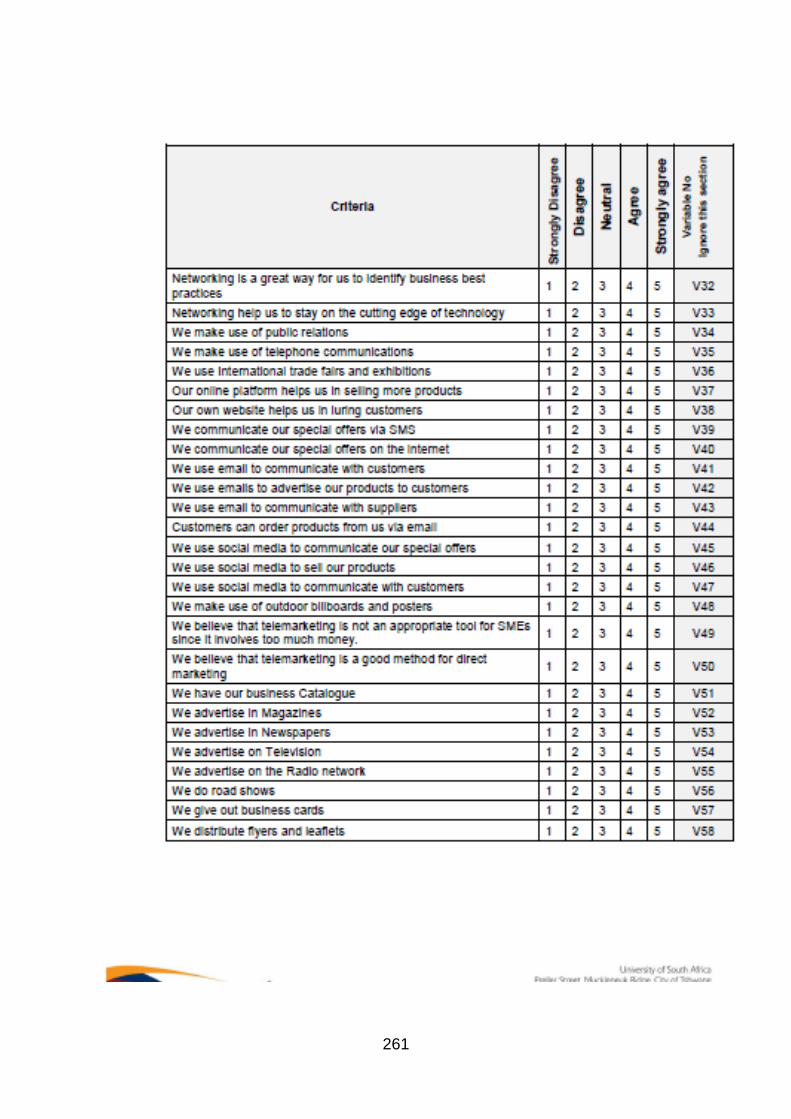
261
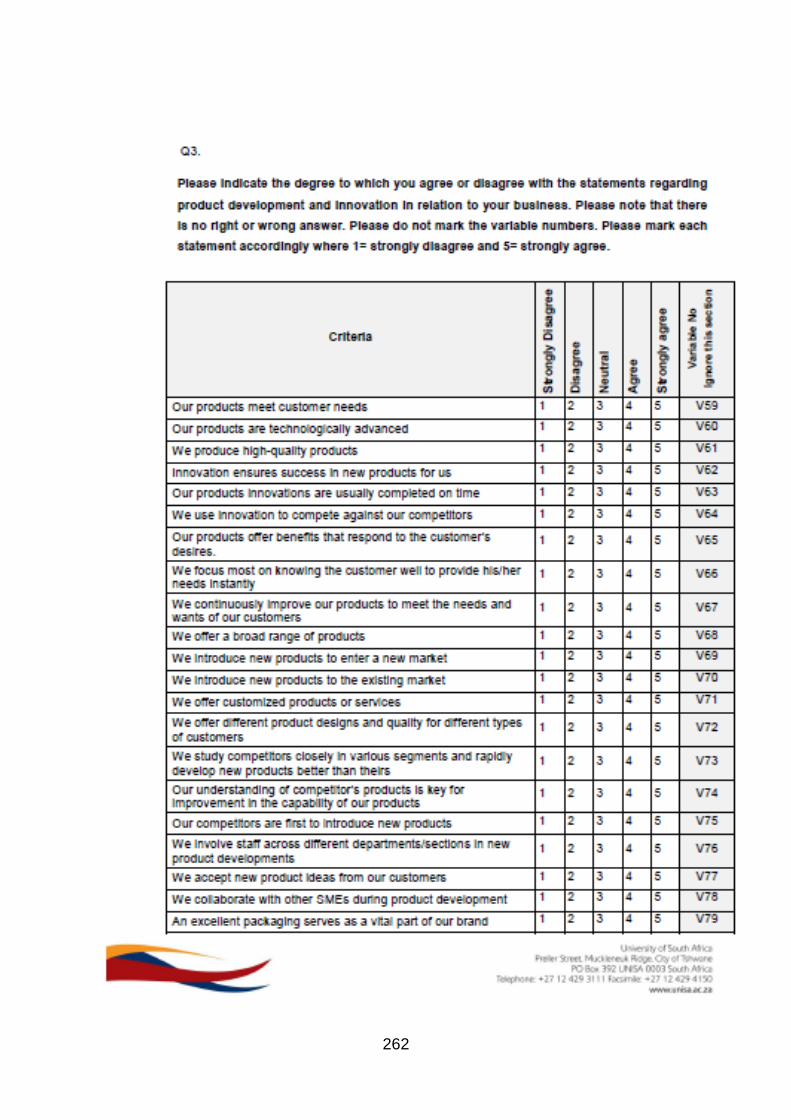
262
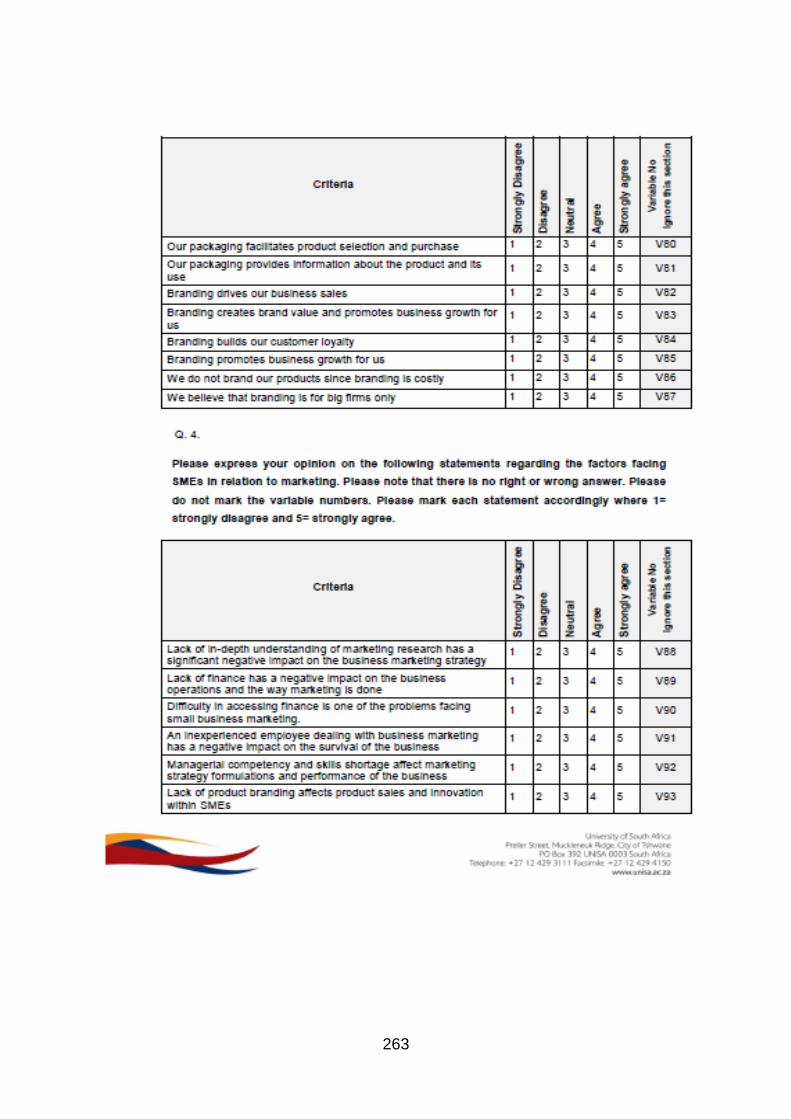
263
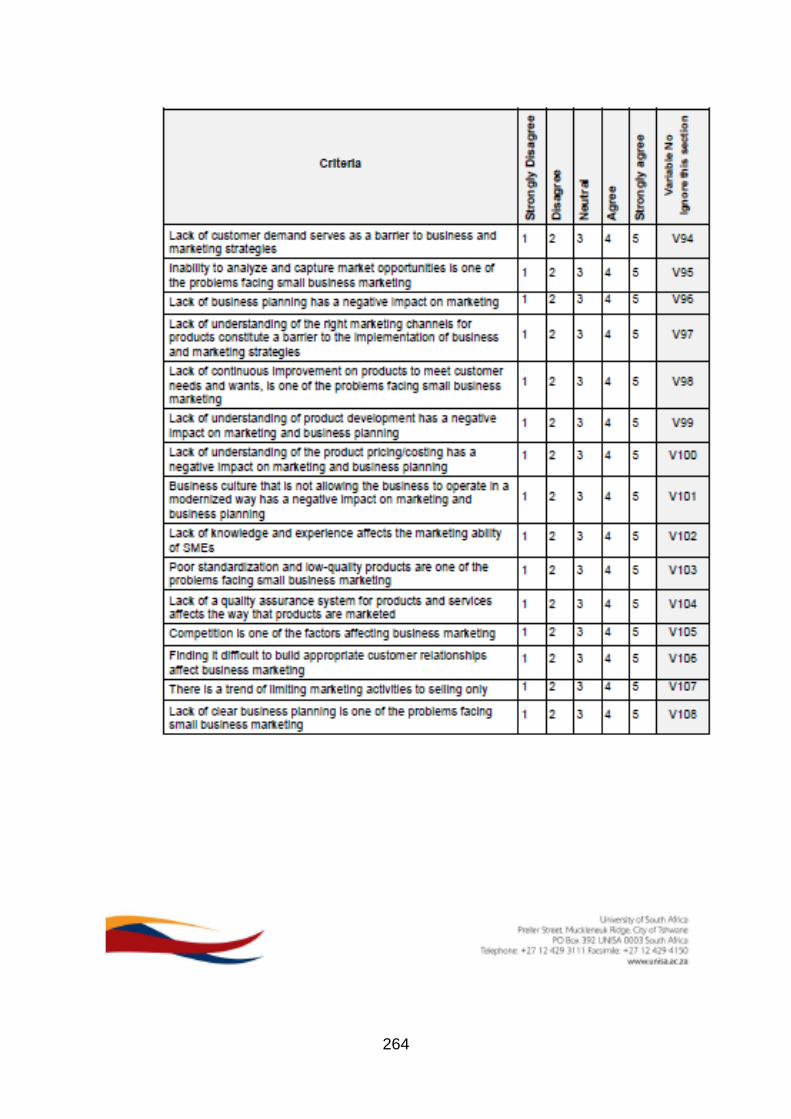
264
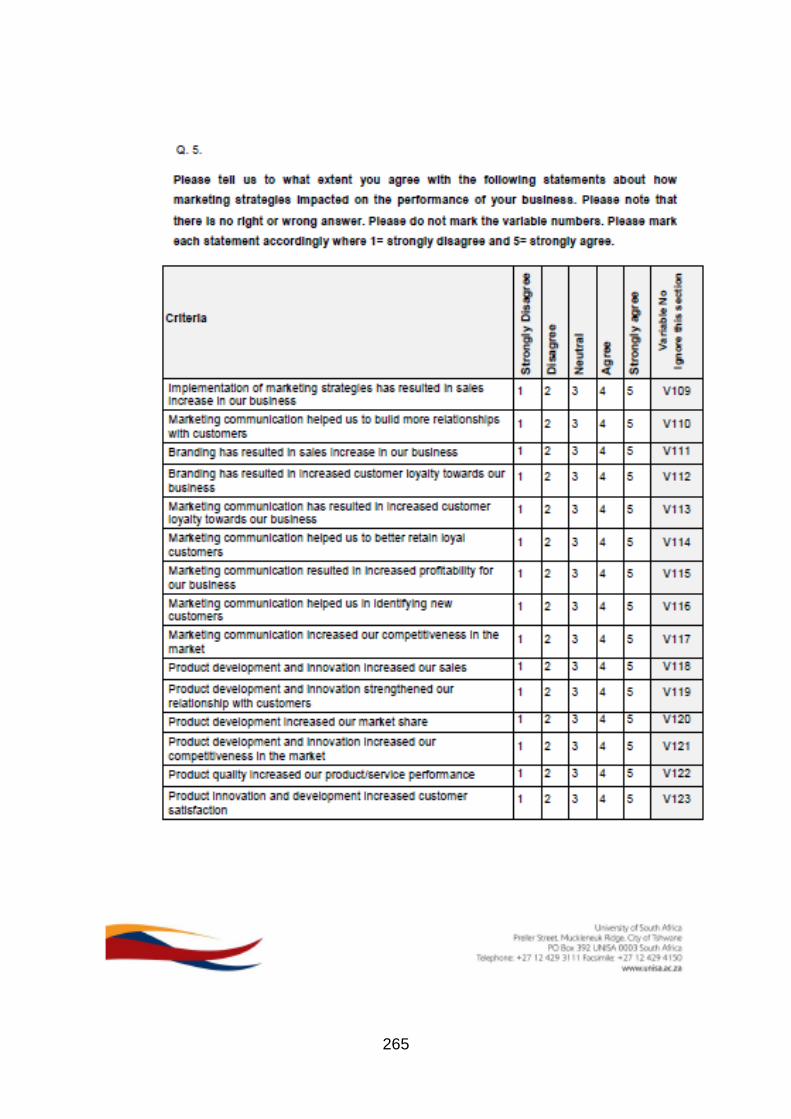
265
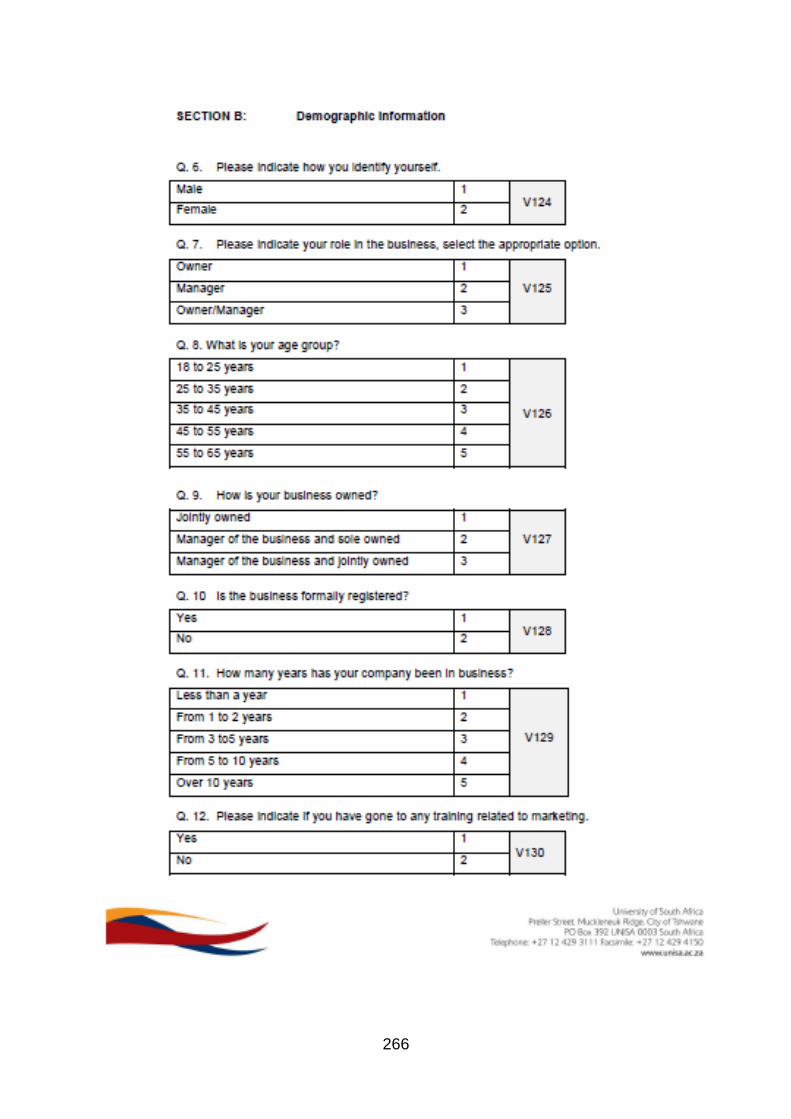
266
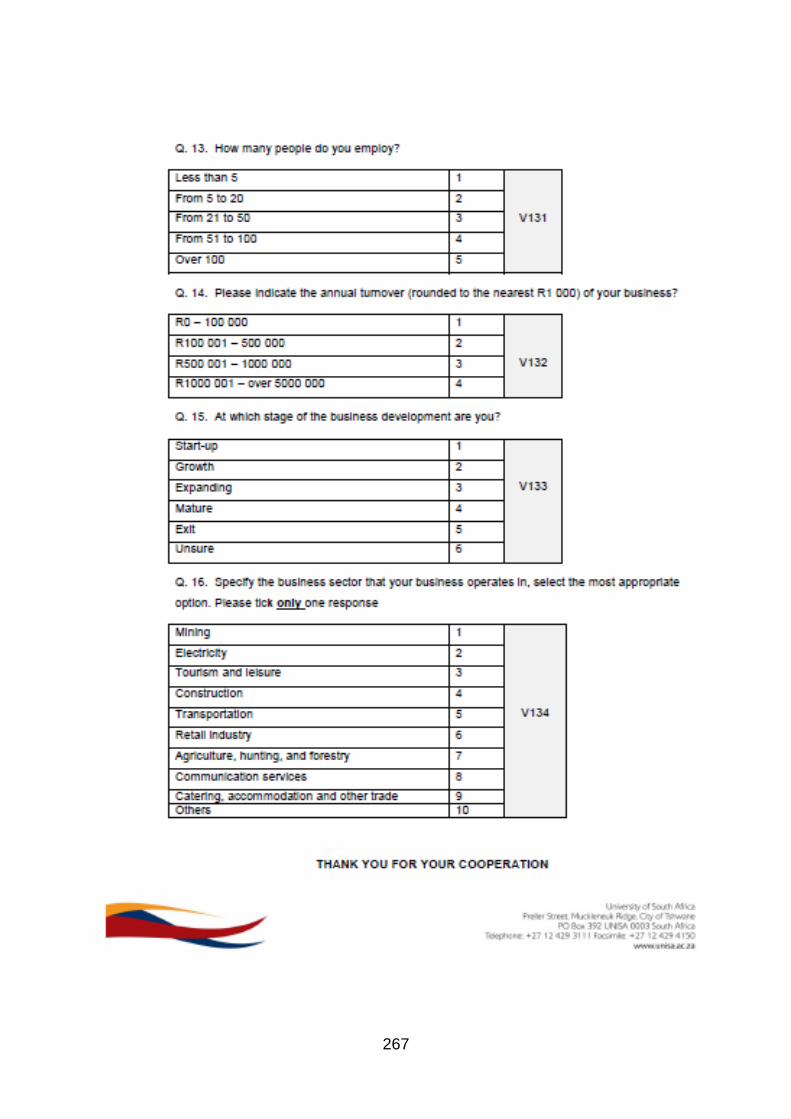
267
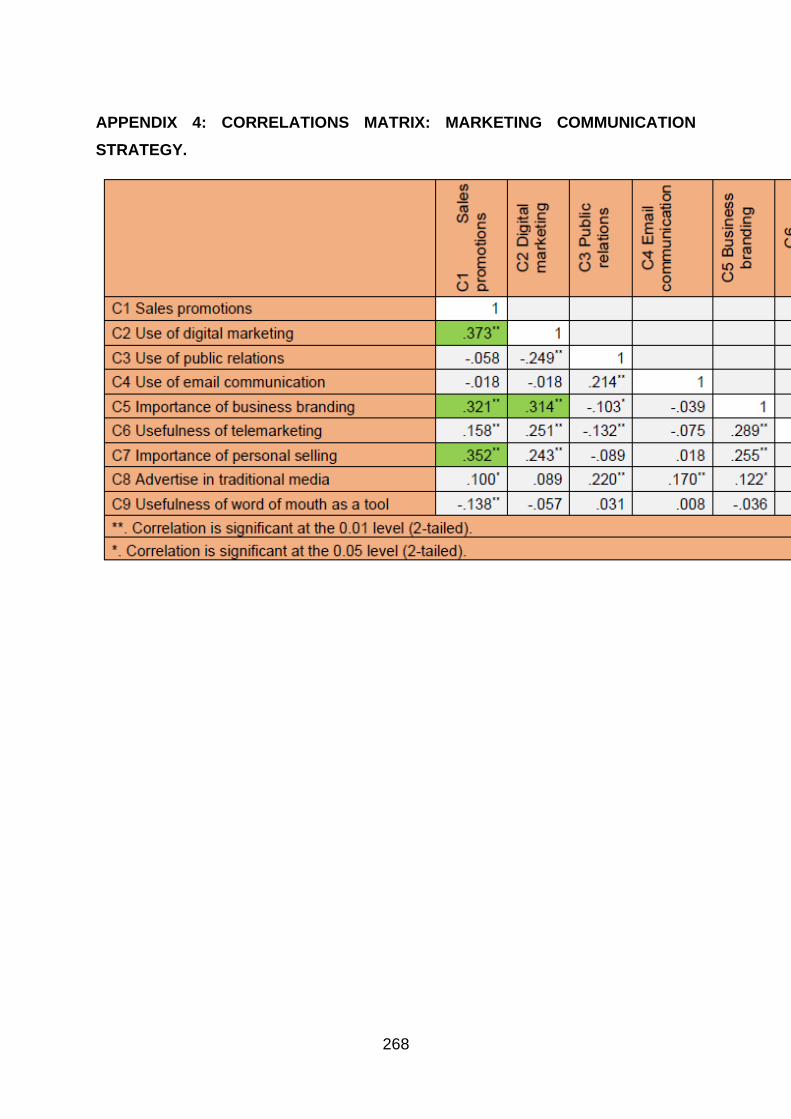
268
APPENDIX 4: CORRELATIONS MATRIX: MARKETING COMMUNICATION
STRATEGY.
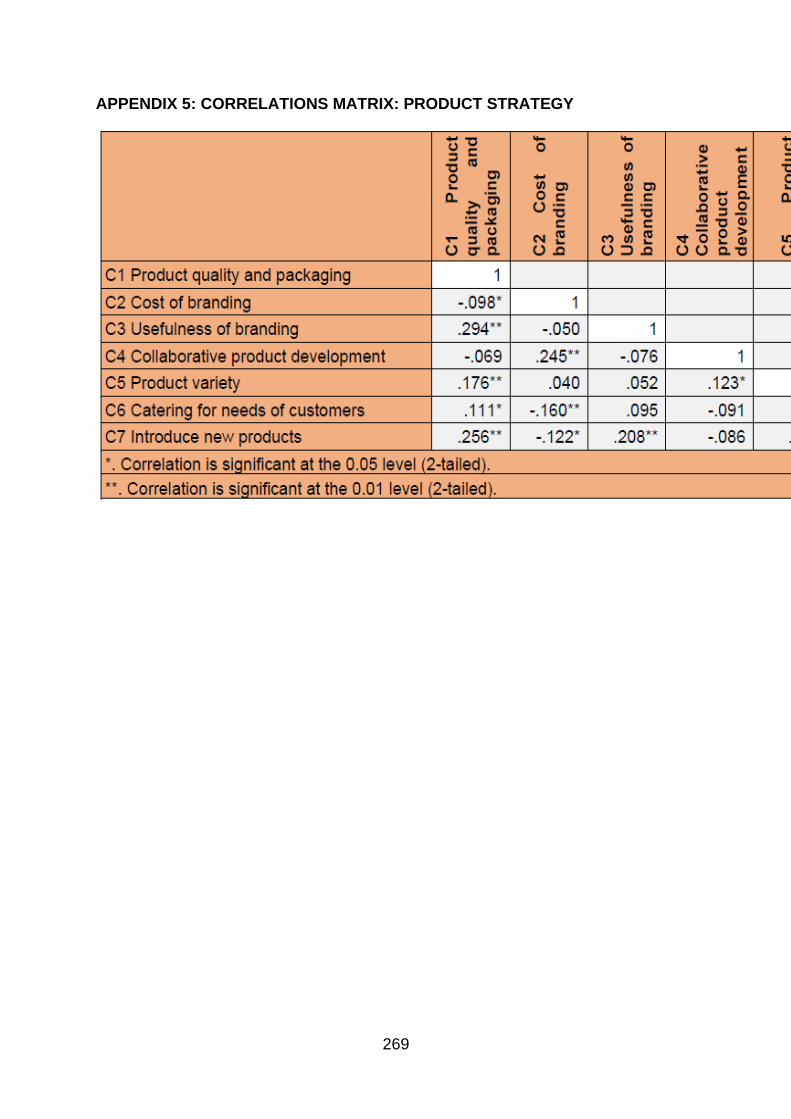
269
APPENDIX 5: CORRELATIONS MATRIX: PRODUCT STRATEGY