Embed Size (px)
Citation preview
Vol.9(5), pp. 84-96, May 2017
DOI: 10.5897/JAERD2016.0845
Articles Number: DE623AF63872
ISSN 2141-2170
Copyright ©2017
Author(s) retain the copyright of this article
http://www.academicjournals.org/JAERD
Journal of Agricultural Extension and Rural Development
Full Length Research Paper
Factors influencing agritourism adoption by small farmers in North Carolina
Anthony Yeboah*, John Owens, Jarvetta Bynum and Ralph Okafor
Department of Agribusiness, Applied Economics and Agriscience Education, North Carolina A&T State University, 145 Carver Hall, Greensboro, NC 27411, USA.
Received 14 November, 2016; Accepted 3 April, 2017
The study estimates a logit model to identify factors influencing adoption of agritourism by small farmers in North Carolina using a survey. All variables included in the model were dummies and of these having at least a college education has the greatest impact on participating in agritourism, followed by race, public access to the farm for recreation, farms with more than 50 acres of land deemed unsuitable for crop production, and the total amount of land owned. Other factors such as farms near cities, willingness to pay for farm management advice, and before-tax household income also significantly influenced the adoption of this enterprise. Key words: Agritourism, public access for recreation, farm location, logit model, odds ratios, operator characteristics.
INTRODUCTION Agritourism has received a lot of attention in recent years both among researchers and also state policy makers. According to the U.S. Travel Association, travel and tourism is a $947 billion industry in the United States that has directly generated more than 8.1 million jobs. Travel and tourism generates $147.9 billion in tax revenue for federal, state, and local governments, with the restaurant industry accounting for the majority of economic activity. An increasing popular and growing opportunity for agricultural producers is agritourism (Agricultural Marketing Resource Center, 2016). Research has been conducted to identify farm and farm operator characteristics that are
associated with the adoption of agritourism, a term which has been used to describe activities ranging from U-pick activities, field rides, cultural or historic exhibits, festivals, paid or customized hunting tours to wildlife observations and holiday-related activities. Bagi and Reeder (2012) hypothesized that if successful, such activities might be beneficial to the agricultural economy and have positive environmental and health-related objectives. They further observed and noted that among those who might benefit, most are low-income, undereducated, and older farmers, as well as small family farms. The purpose of this paper is to determine the extent to which some of these findings
*Corresponding author. E-mail: [email protected].
Author(s) agree that this article remain permanently open access under the terms of the Creative Commons
Attribution License 4.0 International License
are applicable to small farmers in North Carolina.
Although many do not realize it, agritourism has a long history in the United States. Holland and Wolfe (2000) provide a historical narrative of agritourism in the United States. Agritainment (agritourism and entertainment farming enterprises) dates back to the 1800s, when families would visit their relatives in the country to escape from the city's summer heat. The advent of the automobile in the 1920s and the stresses of the Great Depression of the 1930s and 40‟s generated renewed interest in rural/farm recreation. These demands for rural recreation continued through the 1970s into the 1990s as manifest by the popularity of horseback riding, farm petting zoos, farm vacations, bed and breakfasts, and commercial farm tours during those decades (Holland and Wolfe, 2000).
Agritourism has been defined and labeled in various ways in the literature. Philips et al. (2010) provide a typology of definitions of Agritourism. The term agritourism has often been used interchangeably with agrotourism, farm tourism, farm-based tourism, and rural tourism (McGehee and Kim, 2004; Clarke, 1999; Ilbery and Bowler, 1998; Roberts and Hall, 2001; Barbieri and Mshenga, 2008). Agritourism may be defined as "rural enterprises which incorporate both a working farm environment and a commercial tourism component" (Weaver and Fennel, 1997; McGehee et al., 2007). Barbieri and Mshenga (2008) referred to agritourism as "any practice developed on a working farm with the purpose of attracting visitors."
Examples of agritourism may include farm stays, bed and breakfasts, pick-your-own produce, agricultural festivals, and farm tours for children, or hay rides (Clarke, 1999; McGehee et al., 2007). Farm/ranch recreation refers to activities conducted on private agricultural lands, which might include fee-hunting and fishing, overnight stays, educational activities, etc. This category of tourism is a subset of a larger industry known as agritourism. Agritourism in turn is a subset of a larger industry called rural tourism that includes resorts, off-site farmers' markets, non-profit agricultural tours, and other leisure and hospitality businesses that attract visitors to the countryside. Rural Tourism differs from agritourism in two ways. First, rural tourism enterprises do not necessarily occur on a farm or ranch, or at an agricultural plant, and secondly, they do not generate supplemental income for the agricultural enterprise. Agritourism and nature-tourism enterprises might include outdoor recreation (fishing, hunting, wildlife study, horseback riding), educational experiences (cannery tours, cooking classes, or wine tasting), entertainment (harvest festivals or barn dances), hospitality services (farm stays, guided tours or outfitter services) and on-farm direct sales (u-pick operations or roadside stands).
Farm enterprise diversification has become a strategy for small farms to remain viable especially in the face of
Yeboah et al. 85 high risks facing modern day farming. McGehee et al. (2007) have identified agritourism as a form of enterprise diversification. Ilbery and Bowler (1998) describe seven pathways to agricultural diversification, of which on-farm recreational activities are one survival strategy for farm businesses. Incorporating agritourism as an alternative enterprise has the potential to contribute to agricultural sustainability, broaden farmers' economic base, provide educational opportunities to tourists, and engender a strong communal cohesion (Ilbery and Bowler, 1998). Beus (2008) describes agritourism as a possible strategy for many U.S. farmers to expand their incomes and stay in business. This practice, referred to as the "cultivation of tourists on the farm in addition to crops" is already well established in countries like Switzerland, Italy, New Zealand and other European countries.
As pressure increases on farmers to diversify their enterprises in order to remain competitive, agritourism has emerged as one viable alternative. In an exploratory study of agritourism development in Nova Scotia, Colton and Bissix (2005) identified a number of issues and challenges. Chief among the issues and challenges identified by stakeholders as critical to the development of successful agritourism include marketing, product development, government support, education and training, and partnership and communication. There was consensus among stakeholders that farmers going into agritourism need to be able to define the product that they are offering consumers and be able to communicate this to the potential visitors. Also, fostering linkages with other farmers, business community, educational and governmental agencies, as well as, researchers can significantly impact the success of agritourism ventures.
However, successful operation of agritourism depends on certain factors both within and beyond the control of the farmer. Industrialization and globalization provide opportunities as well as challenges and threats to the survival of small farms in this ever-changing agricultural landscape. While agritourism may provide a way to diversify small farms, there are challenges to successful operation of an agritourism farm. Barbieri and Mshenga (2008) investigated the role of owner and firm characteristics on the performance of agritourism farms. They found out that the length of time in operation, number of employees, and farm acreage tended to have a positive impact on agritourism performance as measured by annual gross sales. In other words, larger farms tend to be more successful as agritourism sites. Their hypothesis is that larger farms, as measured by larger acreages and large number of employees, are able to offer a great variety of tourism products and services that ultimately attract more tourists. Other characteristics such as location of the farm, whether it is a working farm, whether the operator has a business or marketing plan, source of start-up capital and the farmer's educational level did not appear to have a significant relationship with
86 J. Agric. Ext. Rural Dev. the success of agritourism.
In a more recent study, Bagi and Reeder (2012) conducted a national survey to investigate the factors affecting U.S. farmers' participation in agritourism. Their results revealed a slew of factors that either promote or hinder the successful operation of an agritourism business. Among the factors that have positive impact are: public access to the farm; proximity to central cities; farms in Rocky Mountains and southern plains, and farms enrolled in conservation programs. Other characteristics that impinge upon farmers' decision to participate in agritourism include age, educational level of the farmer, number of acres of farm, whether the farmer pays for advice, and whether the farm is organized as a partnership or corporation. The data showed that nationally over 84 million acres (representing 10% of farm land) is engaged in agritourism, employing 17 million full-time-equivalent days of family labor. Figures from the Agricultural Resource Management Survey (USDA-ERS, 2007) showed that the gross income from agritourism operations was in excess of $16,000 per annum, while national total income from agritourism activities was $554 million in 2007. An additional $258 million was generated from direct sale of farm produce to tourists.
Most of the above cited studies focused on established large farms that are already practicing agritourism. Those that dealt with issues and challenges focused exclusively on existing agritourism operations as opposed to new entrants. There are no studies identifying the challenges that prevent farmers, especially small and socially-disadvantaged ones from adopting or incorporating agritourism into their farms. A number of relevant questions remain unanswered: For example, what factors constrain the likelihood that small farmers will adopt agritourism on their farms? Are those practicing agritourism doing better economically than those that do not? The present research seeks to provide answers to some of these and other questions that have not been tackled in the literature, particularly as they relate to agritourism development among small and socially-disadvantaged farmers in North Carolina. However, the question of whether agritourism does enhance farm profitability is not addressed. As noted by Schilling et al. (2014) “parsing out the effects of agritourism on farm income is challenging for several reasons.” Reasons cited included the lack of consistent definition for “agritourism”; variation in reasons for farmers to develop agritourism enterprises and the strong likelihood of self-selection. While these studies provided a broad overview of the current state of agritourism in North Carolina and elsewhere, they do not provide any demographic information about the farm operators that may be useful for other operators, specifically Small and Socially Disadvantaged Farmers (SSDFs), to use in planning their own agritourism operation. In addition to other objectives, this research helps bridge this gap by analyzing the
opportunities for agritourism enhancement among SSDFs and the factors that may influence the decision to add this enterprise to their farm operations. It is hoped that the findings of this research will help provide the foundation for proposing recommendations for addressing the needs of small and socially-disadvantaged farmers in North Carolina who are either involved with agritourism or have interest in adding this enterprise to their farm operations.
Research among small farmers in North Carolina indicates that profit maximization was not a priority reason for farming and farmers cite a "love of farming" and "desire to keep the family farm in the family" as the primary reason for farming (Yeboah et al., 2009). Given recent economic conditions, small farms that do not operate efficiently can exacerbate loss of farm ownership especially for socially disadvantaged farmers. The concept of “family farm” is changing dramatically and small farmers increasingly see themselves as entrepreneurs. Many farms, especially those in eastern North Carolina, will have to continue to change in size and structure to remain viable in the 21
st Century
agricultural environment. Farmers must focus much of their energies on diversification as a means to stay competitive and agritourism can provide the diversification and additional income to make the small farm profitable. Empirical analysis Data The data for the analysis were obtained as part of a study sponsored by the Evans-Allen Research Program at North Carolina A&T State University. The overall goal of the project was to study small farm agritourism as a tool for community development in North Carolina. The data were collected using a survey administered in the fall of 2014. A total of 895 questionnaires providing detailed information on farm businesses and their operators were sent out yielding a valid response rate of 23.92%. The questionnaire solicited responses to categorical questions resulting in qualitative responses. These were then converted to quantitative factors through the creation of dummy variables. Theoretical model According to Bagi and Reeder (2012), a farmer‟s decision to participate in agritourism can be compared to the choice between new and traditional technology (activity) and that choice models in consumer theory provide guidance for such decision models (Fernandez-Comejo, 1996). As in previous studies of this kind, the maximum utility a farmer expects to derive from net income from agritourism operation forms the basis in his decision to
engage in this enterprise. Following Goodwin et al. (2003) as well as Bagi and Reeder (2012), the utility maximization equation is provided as Max , 1,.....,
ii iE U f i nX
(1)
where iU is the th
i farmer‟s expected or perceived
utility from adoption or non-adoption and f . is a
function of 1,.......
i i ikx xX which is a (1 × k) vector of
observable characteristics or factors specific to the th
i
farmer, his farm, and his farm business. The random term
i represents errors in farmers‟ perceptions and
measurement of expected utility; unobserved characteristics attributes, and preferences; and instrumental variables (Ben-Akiva and Lerman, 1985; Fernandez-Cornejo, 1996).
Let 1i
y if the th
i farmer engages in agritourism and
0i
y if the th
i farmer does not. The probability of a
given farmer participating or not participating in any new activity or technology is bounded by zero and one. As such a limited dependent variable model such as logit or probit can be used as the framework for the model. Again according to Bagi and Reeder (2012), if the random error
variable i is independently and identically distributed
with a Weibull density function, (similar to the normal density function but with greater kurtosis - thicker tails), then a logit structure is an appropriate choice model (McFadden, 1974, 1981; Maddala, 1983). Following
Amemiya (1981), the probability of the th
i farmer
adopting a new activity or enterprise is given by
1 1/ 1 expi i ii
P given fyP X X (2)
whereiP is the probability of adoption given the
explanatory variable iX
In the absence of knowledge about the exact functional
form of iX beforehand, we assume a linear form
i if X X where β is a vector of (1 × k)
coefficients. For ease of estimation and interpretation of these coefficients, the logarithm of the ratio of probability of adoption to non-adoption is obtained.
ln / 1i i iP P X
(3)
Yeboah et al. 87 where
iX (the stochastic part of the model) is given
by
1 20 1 2ln / 1 .....
i i i i kikx x xP P
(4)
This transformation is necessitated by the nonlinear relationship between β and
iP
Equation 4 forms the basis for the empirical model used in estimating the effects of the various factors on the probability of adoption of agritourism by small farmers in North Carolina. The data on farm, farm operators, farm products and services, farmer‟s agritourism operation, and farmer‟s perspective of agritourism industry as a whole were all obtained through the administering of a survey questionnaire in 2014. EMPIRICAL MODEL
The factors that influence farmer‟s adoption of agritourism have been well studied and according to Bagi and Reeder (2012) are very often grouped into four broad categories: (i) characteristics of the farm‟s land and operation; (ii) the farm household‟s wealth or net worth; (iii) characteristics of the farm operator and (iv) location of the farm.
The specific characteristics of these broad categories do vary in their importance in terms of how they influence agritourism. As outlined by Bagi and Reeder (2012), important farm characteristics include farm size (Evans and Ilbery, 1992; Bernardo et al., 2004; Sonnino, 2004), number of acres owned (McGehee and Kim, 2004), a farm‟s aesthetics (Hilchey, 1993) a farm‟s attractive characteristics (Rilla, 1999, 2011) and the farm household‟s wealth or net worth (Sonnino 2004). Specific factors of operator‟s characteristics include age and education (Barbieri and Mshenga, 2008), degree of social skill (Hilchey, 1993), how outgoing the operator‟s personality is (Rilla, 1999), and the ability to take advantage of a profitable opportunity (Carter, 1998). Factors related to farm‟s location include the distance of farm from urban centers (Hilchey, 1993; Che, 2007; Che et al., 2005; Veeck et al., 2006; Bernardo et al., 2004), the farm‟s distance from urban agritourists (OECD, 2009), and regional geographic characteristics such as a region‟s particular form of natural and farm assets, climate, infrastructure, tastes and preferences, cultural values, socioeconomic conditions, and policy considerations (Che, 2007; Sonnino, 2004). Carter (1998), Nickerson et al. (2001) and Mace (2005) cite a variety of operator and farm characteristics that influence a decision to adopt innovative activity such as agritourism.
The characteristics in the present study are in line with those used in similar studies and are grouped into two broad classes: farm and land characteristics and farm operator characteristics and all the variables used to measure the different characteristics are expressed in categories. Previous studies have established the effects of these factors on the adoption of agritourism (Bagi and Reeder, 2012). However, in the present study, most of the variables are categorized, and the coefficients are obtained by placing restrictions on the model for the corresponding explanatory variables. Consequently, each coefficient measures the effect of a category on agritourism adoption relative to a referenced category of the variable. This approach is expected to capture variation in these variables.
The included farm characteristics are (i) farm organization or
88 J. Agric. Ext. Rural Dev. ownership and the corresponding categories are individual
ownership1X non-incorporated family farm
2X partnership,
incorporated family farm and other forms of ownership3;X (ii)
total acreage owned with four categories: less than 10 acres4X ,
10 to 49 acres5X , 50 to 499 acres
6X and >499 acres7X ;
(iii) total acreage deemed unsuitable for cropping also with three
categories: less than 10 acres8X , 10 to 49 acres
9X , 50 or
more acres10X ; (iv) whether or not the farm raises forest
products for commercial sale: Yes = 1, No = 0,11X ; (v) whether or
not the farm provides public access for recreational use: Yes = 1,
No = 0,12X ; (vi) distance of farm from a central city in the county:
<5 miles13X , 5 to 29 miles
14X , >29 miles15X and (vii)
distance of farm from a city of at least 10,000 people: <5miles
16X , 5 to 29 miles 17X , >29 miles
18X .
The farm operator‟s characteristics included in the model are: (i)
the gender of farm‟s principal operator: Male = 1, Female = 019X
; (ii) age of farm‟s principal operator: 24 years or less20X , 25 to
54 years21X , >54 years
22X ; (iii) educational background of
farm operator: < high school23X , high school
24X , some
college25X , college and above
26X ; (iv) whether or not the
operator will pay for advice concerning farm operation: Yes = 1, No
= 027X ; (v) whether or not the farm operator has access to the
internet: Yes = 1, No = 028X ; (vi) Household income before
taxes: <$10,00029X , $10,000 – $99,000
30X , >$99,00031X ;
and (vii) the race of farm‟s principal operator: White = 1, else = 0
32X
As with the adoption of other forms of innovative activity, the ownership structure is expected to influence the decision-making process. Farms that are individually owned and those that are non-incorporated family farms are expected to adopt new innovations such as agritourism much easier than farms under other forms of ownership structures especially incorporated and partnerships. This hypothesis is contrary to what other studies found. For example, Carter (1998) found that diversified farms were more likely to be organized as partnerships and to have more complex forms of ownership than undiversified farms. Thus, a corporate or partnership farm organization could have a positive relationship with participation in agritourism. However, given that the study group is comprised of small and socially disadvantaged farmers, individual ownership and non-incorporated family farms are expected to have a more positive impact on agritourism participation than corporate or partnership farm organization. Adoption decision is expected to be far less complicated than otherwise. The likelihood of agritourism adoption, just like any innovative activity, should increase with land ownership. As the amount of land owned increases as opposed to being leased the farmer‟s ability to bear risk, make decisions and undertake long-
term investments should also increase. Farms with high proportion of land that is unsuitable for traditional cropping are more likely to engage in agritourism since these marginal lands can be sources of additional income from agritourism activities. In addition, public access including walking and biking trails, access for hunting, fishing and other forms of recreational activities provide the opportunity to expose these people to agritourism activities hence should increase their adoption. Bagi and Reeder (2012) have indicated that the presence and sale of forest products such as woodland, which in turns supports wildlife, tends to increase a farmer‟s participation in agritourism activity. This hypothesis is maintained in the present study. The wealth of a household has been used as a measure of its ability to take risk and hence borrow money for innovative activities. This variable is included in the model as household income before taxes and is expected to have a positive effect on farmer‟s participation in agritourism activity.
Variables included in the model that are related to the farm operator‟s characteristics include age, education, access to the internet, gender, race and use of paid farm management advice. Access to internet enhances the farmer‟s ability to receive and manage a variety of information related to the agricultural enterprise such as prices and weather. It also serves as a viable source of marketing a potential agritourism activity. The a priori effect of age on agritourism adoption has been hypothesized to be ambiguous. Older farmers are perceived to have the needed experience and knowledge to handle such a change while younger farmers may have the advantage of health, optimism and openness to new ideas in addition to a longer planning horizon. Education, specifically formal education, training and experience has been hypothesized to increase a person‟s ability to search for relevant information and to interpret, comprehend, critically analyze, modify, and adapt that information for practical economic decision-making (Schultz, 1975; Becker, 1993). It is therefore theorized that these qualities will enhance a farmer‟s ability to adopt new technology or activity such as agritourism. Additionally, the availability and a farmer‟s willingness to use professional advice is also expected to enhance farmers‟ participation in a new activity. It is further argued that greater education, training, and professional advice could also lead some farmers to opt out of agritourism because of unfavorable cost and benefits situations (Bagi and Reeder, 2012). A study by Carter (1998) found that producers who were involved in diversifying their farms (including those who added recreational activities) were more likely to have received some agricultural and managerial training than producers who did not diversify. Also, the OECD study (2009) of farm diversification cited research showing that education increased a farmer‟s likelihood to engage in value-added production, a similar diversification activity. These arguments point to possible ambiguity in the effect of education on agritourism adoption. This ambiguity is expected to be amplified by the categorized nature of the education variable in the present study.
Several studies indicate that males and females adopt new technologies at different rates and that gender has a significant effect on farmers‟ engagement in new activities. A number of studies that focus on the gender of the head of household suggest that male-headed households are more likely to adopt new technologies compared to female-headed households (Doss and Morris, 2001; Kumar, 1994). Doss (2001) found that women are adopting improved varieties at a lower rate than men in Africa. Other studies (Overfield and Fleming, 2001; Asiedu-Darko, 2014) found no significant relationship between gender and adoption of technologies. Age, on the other hand showed strong negative association with adoption of agricultural technology with older farmers more likely to stick to use of traditional farming methods, whereas younger farmers prefer use of modern methods of farming (Asiedu-Darko, 2014). Age was found to positively influence adoption of sorghum in Burkina Faso (Adesina and Baidu-Forson,
Yeboah et al. 89
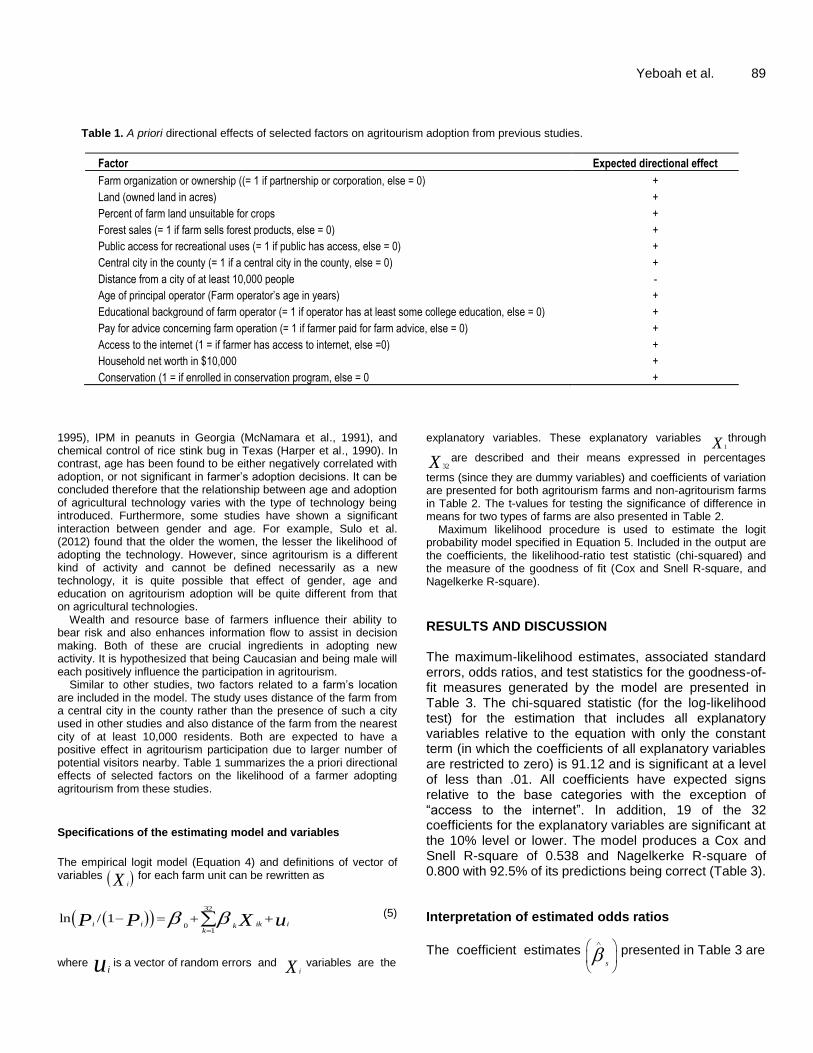
Table 1. A priori directional effects of selected factors on agritourism adoption from previous studies.
Factor Expected directional effect
Farm organization or ownership ((= 1 if partnership or corporation, else = 0) +
Land (owned land in acres) +
Percent of farm land unsuitable for crops +
Forest sales (= 1 if farm sells forest products, else = 0) +
Public access for recreational uses (= 1 if public has access, else = 0) +
Central city in the county (= 1 if a central city in the county, else = 0) +
Distance from a city of at least 10,000 people -
Age of principal operator (Farm operator’s age in years) +
Educational background of farm operator (= 1 if operator has at least some college education, else = 0) +
Pay for advice concerning farm operation (= 1 if farmer paid for farm advice, else = 0) +
Access to the internet (1 = if farmer has access to internet, else =0) +
Household net worth in $10,000 +
Conservation (1 = if enrolled in conservation program, else = 0 +
1995), IPM in peanuts in Georgia (McNamara et al., 1991), and chemical control of rice stink bug in Texas (Harper et al., 1990). In contrast, age has been found to be either negatively correlated with adoption, or not significant in farmer‟s adoption decisions. It can be concluded therefore that the relationship between age and adoption of agricultural technology varies with the type of technology being introduced. Furthermore, some studies have shown a significant interaction between gender and age. For example, Sulo et al. (2012) found that the older the women, the lesser the likelihood of adopting the technology. However, since agritourism is a different kind of activity and cannot be defined necessarily as a new technology, it is quite possible that effect of gender, age and education on agritourism adoption will be quite different from that on agricultural technologies.
Wealth and resource base of farmers influence their ability to bear risk and also enhances information flow to assist in decision making. Both of these are crucial ingredients in adopting new activity. It is hypothesized that being Caucasian and being male will each positively influence the participation in agritourism.
Similar to other studies, two factors related to a farm‟s location are included in the model. The study uses distance of the farm from a central city in the county rather than the presence of such a city used in other studies and also distance of the farm from the nearest city of at least 10,000 residents. Both are expected to have a positive effect in agritourism participation due to larger number of potential visitors nearby. Table 1 summarizes the a priori directional effects of selected factors on the likelihood of a farmer adopting agritourism from these studies.
Specifications of the estimating model and variables
The empirical logit model (Equation 4) and definitions of vector of variables iX for each farm unit can be rewritten as
32
01
ln / 1i i ik ik
kuP P X
(5)
where iu is a vector of random errors and
iX variables are the
explanatory variables. These explanatory variables 1X through
32X are described and their means expressed in percentages
terms (since they are dummy variables) and coefficients of variation are presented for both agritourism farms and non-agritourism farms in Table 2. The t-values for testing the significance of difference in means for two types of farms are also presented in Table 2.
Maximum likelihood procedure is used to estimate the logit probability model specified in Equation 5. Included in the output are the coefficients, the likelihood-ratio test statistic (chi-squared) and the measure of the goodness of fit (Cox and Snell R-square, and Nagelkerke R-square).
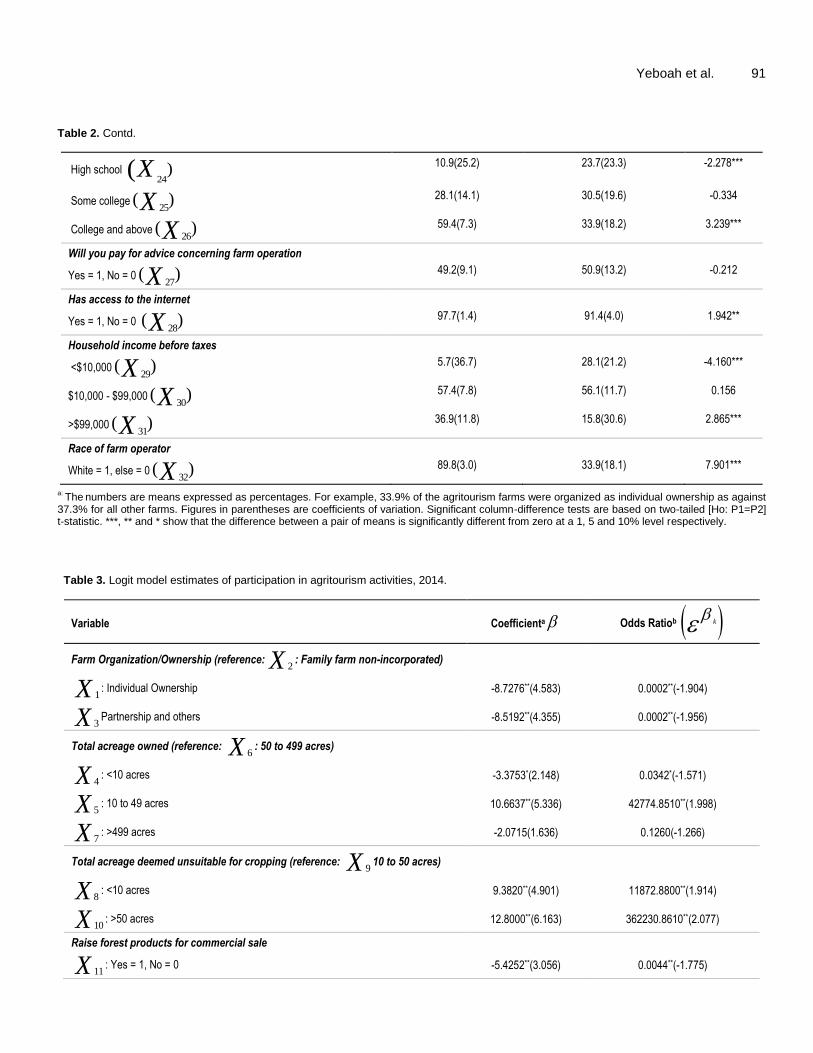
RESULTS AND DISCUSSION The maximum-likelihood estimates, associated standard errors, odds ratios, and test statistics for the goodness-of-fit measures generated by the model are presented in Table 3. The chi-squared statistic (for the log-likelihood test) for the estimation that includes all explanatory variables relative to the equation with only the constant term (in which the coefficients of all explanatory variables are restricted to zero) is 91.12 and is significant at a level of less than .01. All coefficients have expected signs relative to the base categories with the exception of “access to the internet”. In addition, 19 of the 32 coefficients for the explanatory variables are significant at the 10% level or lower. The model produces a Cox and Snell R-square of 0.538 and Nagelkerke R-square of 0.800 with 92.5% of its predictions being correct (Table 3). Interpretation of estimated odds ratios
The coefficient estimates s
presented in Table 3 are
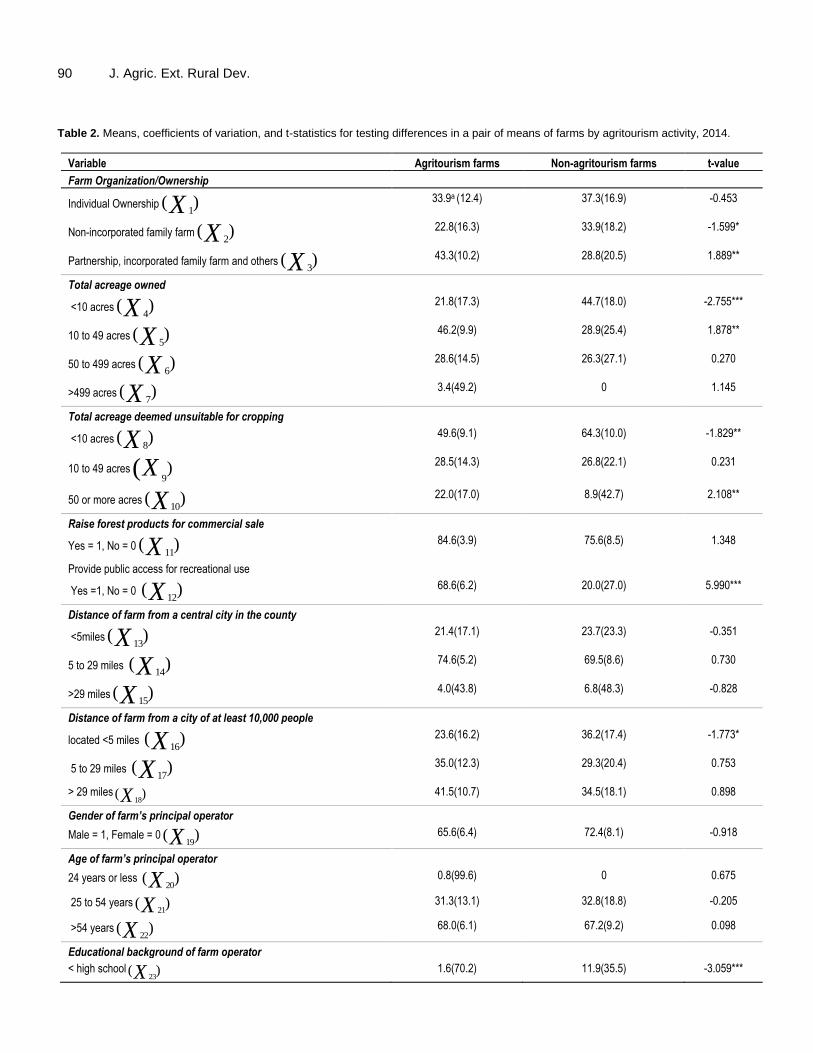
90 J. Agric. Ext. Rural Dev. Table 2. Means, coefficients of variation, and t-statistics for testing differences in a pair of means of farms by agritourism activity, 2014.
Variable Agritourism farms Non-agritourism farms t-value
Farm Organization/Ownership
Individual Ownership1
( )X 33.9a (12.4) 37.3(16.9) -0.453
Non-incorporated family farm2
( )X 22.8(16.3) 33.9(18.2) -1.599*
Partnership, incorporated family farm and others3
( )X 43.3(10.2) 28.8(20.5) 1.889**
Total acreage owned
<10 acres4
( )X 21.8(17.3) 44.7(18.0) -2.755***
10 to 49 acres5
( )X 46.2(9.9) 28.9(25.4) 1.878**
50 to 499 acres6
( )X 28.6(14.5) 26.3(27.1) 0.270
>499 acres7
( )X 3.4(49.2) 0 1.145
Total acreage deemed unsuitable for cropping
<10 acres8
( )X 49.6(9.1) 64.3(10.0) -1.829**
10 to 49 acres9)(X
28.5(14.3) 26.8(22.1) 0.231
50 or more acres10
( )X 22.0(17.0) 8.9(42.7) 2.108**
Raise forest products for commercial sale
Yes = 1, No = 011
( )X 84.6(3.9) 75.6(8.5) 1.348
Provide public access for recreational use
Yes =1, No = 0 12
( )X 68.6(6.2) 20.0(27.0) 5.990***
Distance of farm from a central city in the county
<5miles13
( )X 21.4(17.1) 23.7(23.3) -0.351
5 to 29 miles 14
( )X 74.6(5.2) 69.5(8.6) 0.730
>29 miles15
( )X 4.0(43.8) 6.8(48.3) -0.828
Distance of farm from a city of at least 10,000 people
located <5 miles 16
( )X 23.6(16.2) 36.2(17.4) -1.773*
5 to 29 miles 17
( )X 35.0(12.3) 29.3(20.4) 0.753
> 29 miles18
( )X 41.5(10.7) 34.5(18.1) 0.898
Gender of farm’s principal operator
Male = 1, Female = 019
( )X 65.6(6.4) 72.4(8.1) -0.918
Age of farm’s principal operator
24 years or less 20
( )X 0.8(99.6) 0 0.675
25 to 54 years21
( )X 31.3(13.1) 32.8(18.8) -0.205
>54 years22
( )X 68.0(6.1) 67.2(9.2) 0.098
Educational background of farm operator
< high school23
( )X 1.6(70.2) 11.9(35.5) -3.059***
Yeboah et al. 91 Table 2. Contd.
High school 24)(X
10.9(25.2) 23.7(23.3) -2.278***
Some college25
( )X 28.1(14.1) 30.5(19.6) -0.334
College and above26
( )X 59.4(7.3) 33.9(18.2) 3.239***
Will you pay for advice concerning farm operation
Yes = 1, No = 027
( )X 49.2(9.1) 50.9(13.2) -0.212
Has access to the internet
Yes = 1, No = 0 28
( )X 97.7(1.4) 91.4(4.0) 1.942**
Household income before taxes
<$10,00029
( )X 5.7(36.7) 28.1(21.2) -4.160***
$10,000 - $99,00030
( )X 57.4(7.8) 56.1(11.7) 0.156
>$99,00031
( )X 36.9(11.8) 15.8(30.6) 2.865***
Race of farm operator
White = 1, else = 032
( )X 89.8(3.0) 33.9(18.1) 7.901***
a:
The numbers are means expressed as percentages. For example, 33.9% of the agritourism farms were organized as individual ownership as against
37.3% for all other farms. Figures in parentheses are coefficients of variation. Significant column-difference tests are based on two-tailed [Ho: P1=P2] t-statistic. ***, ** and * show that the difference between a pair of means is significantly different from zero at a 1, 5 and 10% level respectively.
Table 3. Logit model estimates of participation in agritourism activities, 2014.
Variable Coefficienta Odds Ratiob k
Farm Organization/Ownership (reference:2X : Family farm non-incorporated)
1X : Individual Ownership -8.7276**(4.583) 0.0002**(-1.904)
3X Partnership and others -8.5192**(4.355) 0.0002**(-1.956)
Total acreage owned (reference: 6X : 50 to 499 acres)
4X : <10 acres -3.3753*(2.148) 0.0342*(-1.571)
5X : 10 to 49 acres 10.6637**(5.336) 42774.8510**(1.998)
7X : >499 acres -2.0715(1.636) 0.1260(-1.266)
Total acreage deemed unsuitable for cropping (reference: 9X 10 to 50 acres)
8X : <10 acres 9.3820**(4.901) 11872.8800**(1.914)
10X : >50 acres 12.8000**(6.163) 362230.8610**(2.077)
Raise forest products for commercial sale
11X : Yes = 1, No = 0 -5.4252**(3.056) 0.0044**(-1.775)
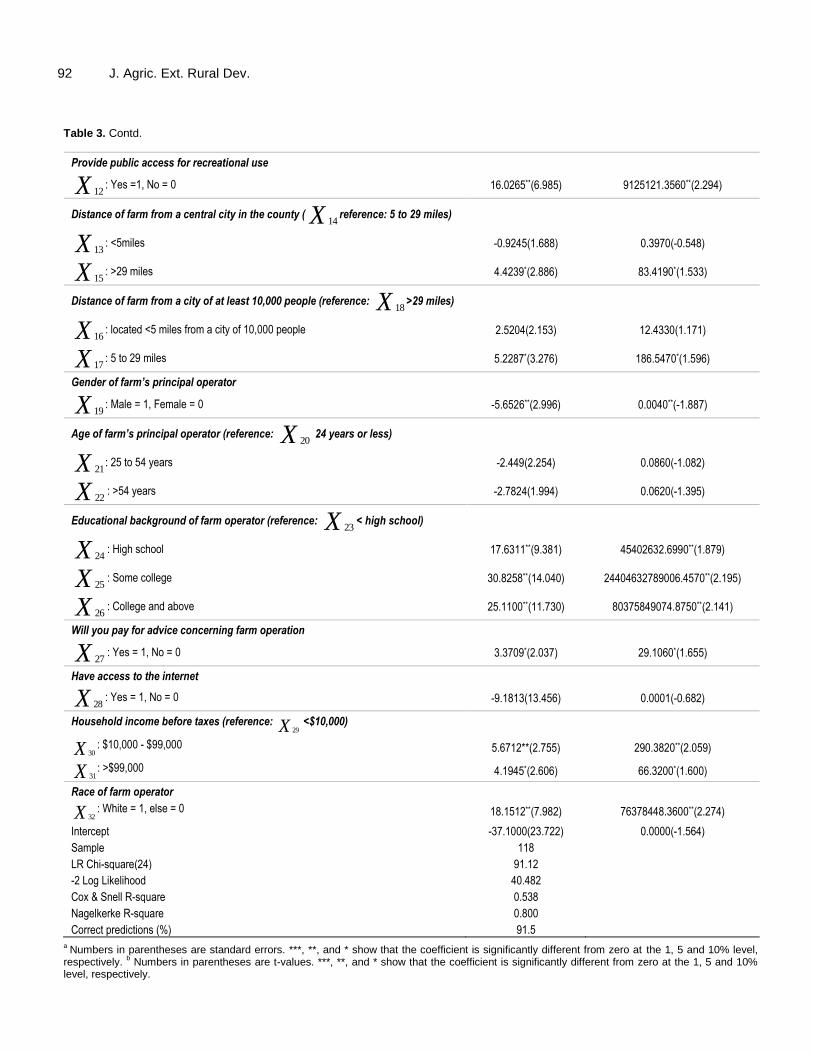
92 J. Agric. Ext. Rural Dev. Table 3. Contd.
Provide public access for recreational use
12X : Yes =1, No = 0 16.0265**(6.985) 9125121.3560**(2.294)
Distance of farm from a central city in the county (14X reference: 5 to 29 miles)
13X : <5miles -0.9245(1.688) 0.3970(-0.548)
15X : >29 miles 4.4239*(2.886) 83.4190*(1.533)
Distance of farm from a city of at least 10,000 people (reference: 18X >29 miles)
16X : located <5 miles from a city of 10,000 people 2.5204(2.153) 12.4330(1.171)
17X : 5 to 29 miles 5.2287*(3.276) 186.5470*(1.596)
Gender of farm’s principal operator
19X : Male = 1, Female = 0 -5.6526**(2.996) 0.0040**(-1.887)
Age of farm’s principal operator (reference: 20X 24 years or less)
21X : 25 to 54 years -2.449(2.254) 0.0860(-1.082)
22X : >54 years -2.7824(1.994) 0.0620(-1.395)
Educational background of farm operator (reference: 23X < high school)
24X : High school 17.6311**(9.381) 45402632.6990**(1.879)
25X : Some college 30.8258**(14.040) 24404632789006.4570**(2.195)
26X : College and above 25.1100**(11.730) 80375849074.8750**(2.141)
Will you pay for advice concerning farm operation
27X : Yes = 1, No = 0 3.3709*(2.037) 29.1060*(1.655)
Have access to the internet
28X : Yes = 1, No = 0 -9.1813(13.456) 0.0001(-0.682)
Household income before taxes (reference: 29X <$10,000)
30X : $10,000 - $99,000 5.6712**(2.755) 290.3820**(2.059)
31X : >$99,000 4.1945*(2.606) 66.3200*(1.600)
Race of farm operator
32X : White = 1, else = 0 18.1512**(7.982) 76378448.3600**(2.274)
Intercept -37.1000(23.722) 0.0000(-1.564)
Sample 118
LR Chi-square(24) 91.12
-2 Log Likelihood 40.482
Cox & Snell R-square 0.538
Nagelkerke R-square 0.800
Correct predictions (%) 91.5 a
Numbers in parentheses are standard errors. ***, **, and * show that the coefficient is significantly different from zero at the 1, 5 and 10% level, respectively.
b Numbers in parentheses are t-values. ***, **, and * show that the coefficient is significantly different from zero at the 1, 5 and 10%
level, respectively.
Yeboah et al. 93
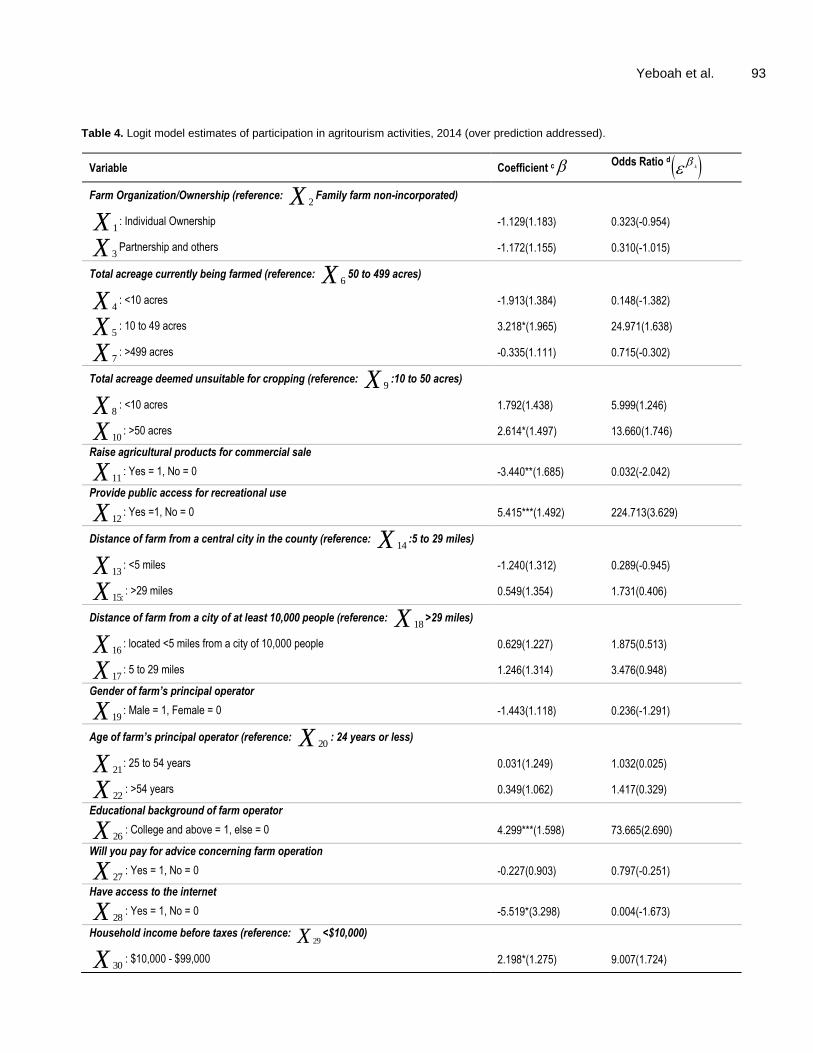
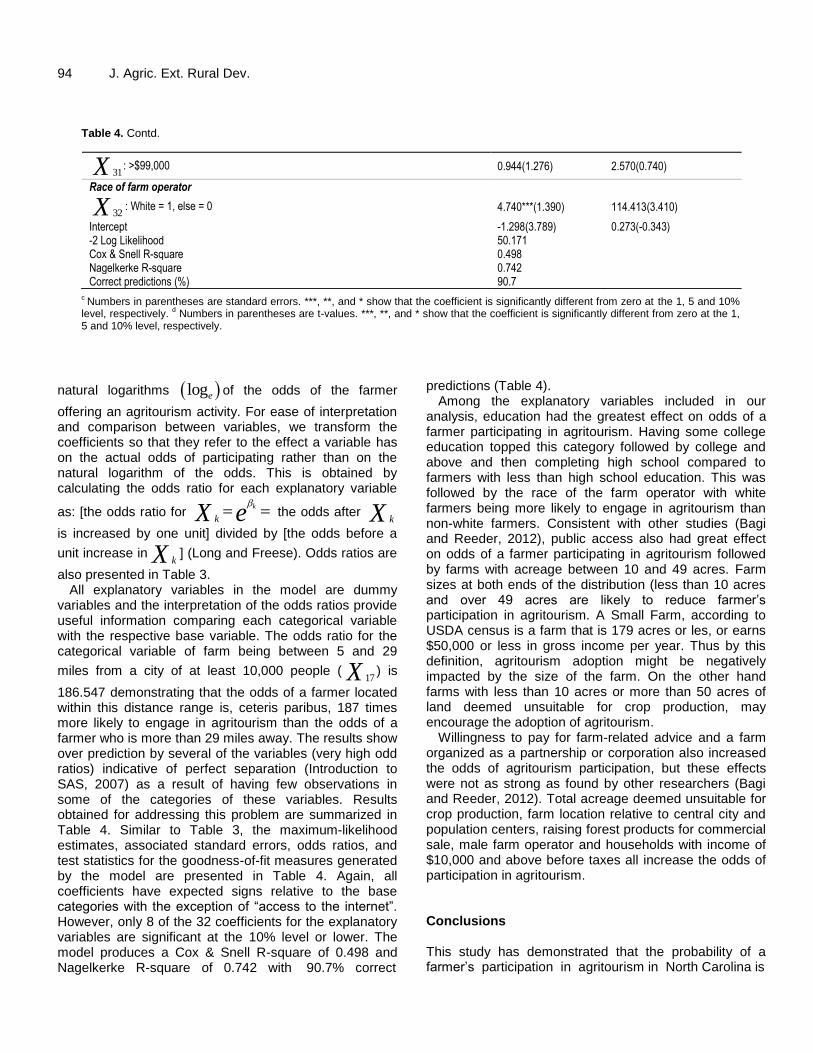
Table 4. Logit model estimates of participation in agritourism activities, 2014 (over prediction addressed).
Variable Coefficient c Odds Ratio d k
Farm Organization/Ownership (reference: 2X Family farm non-incorporated)
1X : Individual Ownership -1.129(1.183) 0.323(-0.954)
3X Partnership and others -1.172(1.155) 0.310(-1.015)
Total acreage currently being farmed (reference: 6X 50 to 499 acres)
4X : <10 acres -1.913(1.384) 0.148(-1.382)
5X : 10 to 49 acres 3.218*(1.965) 24.971(1.638)
7X : >499 acres -0.335(1.111) 0.715(-0.302)
Total acreage deemed unsuitable for cropping (reference: 9X :10 to 50 acres)
8X : <10 acres 1.792(1.438) 5.999(1.246)
10X : >50 acres 2.614*(1.497) 13.660(1.746)
Raise agricultural products for commercial sale
11X : Yes = 1, No = 0 -3.440**(1.685) 0.032(-2.042)
Provide public access for recreational use
12X : Yes =1, No = 0 5.415***(1.492) 224.713(3.629)
Distance of farm from a central city in the county (reference: 14X :5 to 29 miles)
13X : <5 miles -1.240(1.312) 0.289(-0.945)
15:X : >29 miles 0.549(1.354) 1.731(0.406)
Distance of farm from a city of at least 10,000 people (reference: 18X >29 miles)
16X : located <5 miles from a city of 10,000 people 0.629(1.227) 1.875(0.513)
17X : 5 to 29 miles 1.246(1.314) 3.476(0.948)
Gender of farm’s principal operator
19X : Male = 1, Female = 0 -1.443(1.118) 0.236(-1.291)
Age of farm’s principal operator (reference: 20X : 24 years or less)
21X : 25 to 54 years 0.031(1.249) 1.032(0.025)
22X : >54 years 0.349(1.062) 1.417(0.329)
Educational background of farm operator
26X : College and above = 1, else = 0 4.299***(1.598) 73.665(2.690)
Will you pay for advice concerning farm operation
27X : Yes = 1, No = 0 -0.227(0.903) 0.797(-0.251)
Have access to the internet
28X : Yes = 1, No = 0 -5.519*(3.298) 0.004(-1.673)
Household income before taxes (reference: 29X <$10,000)
30X : $10,000 - $99,000 2.198*(1.275) 9.007(1.724)
94 J. Agric. Ext. Rural Dev.
Table 4. Contd.
31X : >$99,000 0.944(1.276) 2.570(0.740)
Race of farm operator
32X : White = 1, else = 0 4.740***(1.390) 114.413(3.410)
Intercept -1.298(3.789) 0.273(-0.343) -2 Log Likelihood 50.171 Cox & Snell R-square 0.498 Nagelkerke R-square 0.742 Correct predictions (%) 90.7
c Numbers in parentheses are standard errors. ***, **, and * show that the coefficient is significantly different from zero at the 1, 5 and 10%
level, respectively. d Numbers in parentheses are t-values. ***, **, and * show that the coefficient is significantly different from zero at the 1,
5 and 10% level, respectively.
natural logarithms loge of the odds of the farmer
offering an agritourism activity. For ease of interpretation and comparison between variables, we transform the coefficients so that they refer to the effect a variable has on the actual odds of participating rather than on the natural logarithm of the odds. This is obtained by calculating the odds ratio for each explanatory variable
as: [the odds ratio for k
k eX
the odds after kX
is increased by one unit] divided by [the odds before a
unit increase inkX ] (Long and Freese). Odds ratios are
also presented in Table 3. All explanatory variables in the model are dummy
variables and the interpretation of the odds ratios provide useful information comparing each categorical variable with the respective base variable. The odds ratio for the categorical variable of farm being between 5 and 29
miles from a city of at least 10,000 people (17X ) is
186.547 demonstrating that the odds of a farmer located within this distance range is, ceteris paribus, 187 times more likely to engage in agritourism than the odds of a farmer who is more than 29 miles away. The results show over prediction by several of the variables (very high odd ratios) indicative of perfect separation (Introduction to SAS, 2007) as a result of having few observations in some of the categories of these variables. Results obtained for addressing this problem are summarized in Table 4. Similar to Table 3, the maximum-likelihood estimates, associated standard errors, odds ratios, and test statistics for the goodness-of-fit measures generated by the model are presented in Table 4. Again, all coefficients have expected signs relative to the base categories with the exception of “access to the internet”. However, only 8 of the 32 coefficients for the explanatory variables are significant at the 10% level or lower. The model produces a Cox & Snell R-square of 0.498 and Nagelkerke R-square of 0.742 with 90.7% correct
predictions (Table 4). Among the explanatory variables included in our
analysis, education had the greatest effect on odds of a farmer participating in agritourism. Having some college education topped this category followed by college and above and then completing high school compared to farmers with less than high school education. This was followed by the race of the farm operator with white farmers being more likely to engage in agritourism than non-white farmers. Consistent with other studies (Bagi and Reeder, 2012), public access also had great effect on odds of a farmer participating in agritourism followed by farms with acreage between 10 and 49 acres. Farm sizes at both ends of the distribution (less than 10 acres and over 49 acres are likely to reduce farmer‟s participation in agritourism. A Small Farm, according to USDA census is a farm that is 179 acres or les, or earns $50,000 or less in gross income per year. Thus by this definition, agritourism adoption might be negatively impacted by the size of the farm. On the other hand farms with less than 10 acres or more than 50 acres of land deemed unsuitable for crop production, may encourage the adoption of agritourism.
Willingness to pay for farm-related advice and a farm organized as a partnership or corporation also increased the odds of agritourism participation, but these effects were not as strong as found by other researchers (Bagi and Reeder, 2012). Total acreage deemed unsuitable for crop production, farm location relative to central city and population centers, raising forest products for commercial sale, male farm operator and households with income of $10,000 and above before taxes all increase the odds of participation in agritourism. Conclusions This study has demonstrated that the probability of a farmer‟s participation in agritourism in North Carolina is
significantly affected by a number of variables related to farm characteristics, the farm operator and the location of the farm vis-à-vis relative distances from urban centers. These variables with significant categories compared to the reference category include amount of land owned, the amount of land deemed unsuitable for crop production and public access for recreational uses to some part of the farm. Similarly, farm operator characteristics with significant odds ratios categories include education, gender, household income before taxes, raising forest products for commercial sales, use of farm management advice and the farm‟s organization. In terms of farm location, proximity to central city in the county and population centers do not have categories with strong odd ratios compared to the reference categories.
To a large extent these results are consistent with results from other studies and provide useful information for County Extension experts and others at the state and local level in their efforts to promote agritourism. Similar to those of Bagi and Reeder (2012), these findings are particularly useful for individuals who design policies or programs such as education and training, technical assistance, and advertising and promotion and who aim to target minorities and other socially disadvantaged individuals. Findings about farm location, gender, education level and race and income levels can all be useful in assessing the potential for success program design. For example, limited education, a common characteristic of low-income farmers can point to difficulties for such farmers establishing agritourism and staying in business. However, this can be offset, somewhat, by a willingness to solicit management advice from County Extension agents or other experts. Thus, the complementarity between these two factors may make it possible for a limited-resource, undereducated farmer to overcome and succeed in this activity with proper advice. CONFLICT OF INTERESTS The authors have not declared any conflict of interests. ACKNOWLEDGEMENTS The research in this paper was funded through the National Institute for Food and Agriculture of the United States Department of Agriculture, Project No. NCX-278-5-14-531-1, in the Agricultural Research Program, North Carolina A&T State University. REFERENCES Adesina A, Baidu-Forson J (1995). Farmers Perceptions and Adoption
Of New Agricultural Technology: Evidence from Analysis in Burkina Faso and Guinea, West Africa. Agric. Econ. 13(1):1-9.
Yeboah et al. 95 Agricultural Marketing Resource Center (2016). From
www.agmrc.org/commodities-products/agritourism/agritourism-profile/ (Accessed on April 11, 2017).
Amemiya T (1981). Quantitative Response Models: A Survey. J. Econ. Literature 19(4):1483-1536.
Asiedu-Darko E (2014). Effects of Gender, Education and Age on The Adoption of Agricultural Technologies in Ashanti, Northern and Eastern Regions of Ghana. J. Appl. Sci. Res. 2(1):112-118.
Bagi F, Reeder R (2012). Factors Affecting Farmer Participation in Agritourism. Agric. Resour. Econ. Rev. 4(1/2):189-199.
Barbieri C, Mshenga M (2008). The Role of the Firm and Owner Characteristics on the Performance of Agritourism Farms. Sociol. Ruralis 2(48):166-183.
Becker GS (1993). Human Capital: A Theoretical and Empirical Analysis with Special Reference to Education. University of Chicago Press. (3).
Ben-Akiva M, Lerman S (1985). Discrete Choice Analysis: Theory and Application to Travel Demand. Massachusetts Institute of Technology Series in Transportation Studies. Cambridge, MA: MIT Press.
Bernardo D, Valentine L, Leatherman J (2004). Agritourism: If We Build It, Will They Come? Paper presented at Risk and Profit Conference, Manhattan, Kansas. Available at http://www.uvm.edu/tourismresearch/agtour/publications/Kansas.
Beus CE (2008). Agritourism: Cultivating Tourists on the Farm. Washington State University Extension.
Carter S (1998). Portfolio Entrepreneurship in the Farm Sector: Indigenous Growth in Rural Areas? Entrepreneurship Regional Dev. 10(11):17-32.
Che D (2007). Agritourism and Its Potential Contribution to the Agricultural Economy. CAB Reviews: Perspectives in Agriculture, Veterinary Science. Nutr. Nat. Resour. 2(63):1-7.
Che D, Veeck A, Veeck G (2005). Sustaining Production and Strengthening the Agritourism Product: Linkages among Michigan Agritourism Destinations. Agric. Human Values. 22(2):225-234.
Clarke S (1999). Business Strategy and the Environment. Special Issue: Greening of Industry Network Special Conference Issue (8)5:296-310.
Colton JW, Bissix, G (2005). Developing Agritourism in Nova Scotia: Issues and challenges. J. Sustain. Agric. 27(1):91-112.
Doss CR (2001). Designing Agricultural Technology for African Women Farmers: Lessons from 25 Years of Experience. World Dev. 29(12):2075-2092.
Doss CR, Morris ML (2001). How Does Gender Affect the Adoption of Agricultural Innovations? The Case of Improved Maize Technology in Ghana. Agric. Econ. 25:27-39.
Evans NJ, Ilbery BW (1992). Farm-based Accommodation and the Restructuring of Agriculture: Evidence from Three English Counties. J. Rural Stud. 8(1):85-96.
Fernandez-Cornejo J (1996). The Microeconomic Impact of IPM Adoption: Theory and Application. Agric. Resour. Econ. Rev. 25(2):149-160.
Goodwin B, Magne-ortalo F, Mishra A (2003). What‟s Wrong with Our Modes of Agricultural Land Values? Am. J. Agric. Econ. 85(3):744-752.
Harper JK, Rister ME, Mjelde JW, Dress BM, Way MO (1990). Factors The Adoption of Insect Management Technology. Am. J. Agric. Influencing Econ. 72(4):997-1005.
Hilchey D (1993). Leisure Trends Create Opportunities for Farmers. AgFocus: A Publication of Cornell Cooperative Extension (10).
Holland R, Wolfe K (2000). Considering an Agritainment Enterprise in Tennessee? Knoxville, TN: The University of Tennessee Agricultural Extension Service.
Ilbery W, Bowler I (1998). From Agricultural Productivism to Post-productivism. Longman. 28.
Introduction to SAS (2007). UCLA: Statistical Consulting Group. www.http://stats.idre.ucla.edu/sas/modules/sas-learning-module introduction-to-the-features-of-sas/ (Accessed on April 11, 2017).
Kumar SK (1994). Adoption of Hybrid Maize in Zambia: Effects on Gender Roles, Food Consumption and Nutrition. Research Report 100. International Food Policy Research Institute. Washington, DC.
96 J. Agric. Ext. Rural Dev. Mace D (2005). Factors Motivating Agritourism Entrepreneurs. Paper
presented at Risk and Profit Conference, Manhattan, Kansas. Available at http://www.agmanager/info/events/risk_profi t/2005/Mace.pdf.
Maddala GS (1983). Limited-Dependent and Qualitative Variables in Econometrics. Econometric Society Monograph No. 3. Cambridge, MA: Cambridge University Press.
McFadden D (1974). Conditional Logit Analysis of Qualitative Choice Behavior. In P Zarembka, ed., Frontiers in Econometrics. New York, NY: Academic Press.
McFadden D (1981). Econometric Models of Probabilistic Choice. In CF Manski, D McFadden eds., Structural Analysis of Discrete Data with Econometric Applications. Cambridge, MA: The MIT Press.
McGehee N, Kim K (2004). Motivation for Agri-Tourism Entrepreneurship. J. Travel Res. (43)2:161-170.
McGehee NG, Kim K, Jennings GR (2007). Gender and motivation for agri-tourism entrepreneurship. Tourism Manag. 28(1):280-289.
McNamara KT, Wetzstein ME, Douce GK (1991). Factors Affecting Peanut Producer Adoption of Integrated Pest Management. Rev. Agric. Econ. 13(16):129-139.
Nickerson NP, Black RJ, McCool SF (2001). Agritourism: Motivations behind Farm/Ranch Business Diversification. J. Travel Res. 40(1):19-26.
OECD (Organization for Economic and Community Development) (2009). The Role of Agriculture and Farm Household Diversification in the Rural Economy: Evidence and Initial Policy Implications. Trade and Agriculture Directorate Committee for Agriculture, Working Party on Agricultural Policies and Markets. Available at http://www.oecd.org/dataoecd/28/45/42714138.pdf.
Overfield D, Fleming E (2001). A Note on the Influence of Gender Relations on the Technical Efficiency of Smallholder Coffee Production in Papua New Guinea. J. Agric. Econ. pp. 153-156.
Philips S, Hunter C, Blackstock K (2010). A Typology for Defining Agritourism. Tour. Manage. 31(6):754-758.
Rilla EL (1999). Unique Niches: Agritourism in Britain and New England.
Davis, CA: University of California Small Farm Program. Available at http:/sfp.ucdavis.edu/agritourism/printer.html
Rilla EL (2011). Tourism and Agricultural Viability: Case Studies from the United States and England. In R.M.Torres and J.H. Momsen, eds., Tourism and Agriculture: New Geographies of Consumption, Production, and Rural Restructuring. New York, NY: Rutledge.
Roberts L, Hall D (2001). Rural Tourism and Recreation: Principles to Practice. Business & Economics. J. Emerg. Trends Econ. Manage. Sci. 3(4):312-317.
Schilling BJ, Attavanich W, Jin Y (2014). Does Agritourism Enhance Farm Profitability? J. Agric. Resour. Econ. 39(1):69-87.
Schultz TW (1975). The value of the ability to deal with disequilibria. J. Econ. Literature 13(3):827-846.
Sonnino R (2004). For a „Piece of Bread‟? Interpreting Sustainable Development through Agritourism in Southern Tuscany. Sociol. Ruralis 44(3):285-300.
Sulo T, Koech P, Chumo C, Chepng‟eno W (2012). Socioeconomic Factors Affecting the Adoption of Improved Agricultural Technologies among Women in Marakwet County Kenya.
USDA-ERS (2007). United States Department of Agriculture, Economic Research Service and National Agricultural Statistics Service. Agricultural Resource Management Survey.
Weaver D, Fennel D (1997). Vacation Farms and Ecotourism in Saskatchewan, Canada. J. Rural Stud. 4(13):467-475.
Veeck G, Che D, Veeck A (2006). America‟s Changing Farmscape: A Study of Agricultural Tourism in Michigan. Professional Geogr. 58(3):235-248.
Yeboah A, Owens J, Bynum J, Boisson D (2009). Case Studies of Successful Small Scale Farming in North Carolina. Available at AgEcon Search: http://ageconsearch.umn.edu/handle/46752