Embed Size (px)
Citation preview
Factors in the Undergraduate Experience that Influence Young Alumni Giving
Deborah A. Day
Dissertation submitted to the Faculty of Virginia Tech in partial fulfillment of the requirements
for the degree of
Doctor of Philosophy
In
Higher Education
Joan B. Hirt, Co-chair
Gabriel R. Serna, Co-chair
Nancy E. Bodenhorn
Steven M. Culver
March 22, 2018
Blacksburg, Virginia
Keywords: (alumni giving, undergraduate academic experiences, undergraduate social
experiences)
Copyright 2018, Deborah A. Day

Factors in the Undergraduate Experience that Influence Young Alumni Giving
Deborah A. Day
ABSTRACT
Public funding of higher education has declined substantially in recent years (Alexander,
2000; Esposito, 2010; Mortenson, 2012; NACUBO, 2011; Redd, 2014; Serna & Harris, 2014),
while operating costs and demand have increased (Desrochers & Kirshstein, 2012; Mortenson,
2012; Mumper & Freeman, 2011; NCSES, 2014; Serna & Harris, 2014; St. John & Parsons,
2004), forcing institutions to look for alternative sources of revenue (NCSL, 2010). One such
alternative source of revenue is alumni giving (Monks, 2003; Archibald & Feldman, 2012; CAE,
2014).
Research has shown that the factors that influence alumni financial giving include
demographic characteristics (Hoyt, 2004; Monks, 2003), academic experiences (Monks, 2003;
Pumerantz, 2005), social experiences (Monks, 2005; Thomas & Smart, 2005; Volkwein, 1989),
and alumni participation variables (Gaier, 2005; Gallo & Hubschman, 2003).
Although there is ample evidence to support the importance of alumni giving, researchers
have not examined the factors that influence young alumni giving. This study sought to
determine if demographic characteristics, academic experiences and social experiences explain
the variance in alumni giving to their alma mater within five years of graduating. I conducted a
case study at a single institution and used Volkwein’s (1989) model of giving coupled with data
from the 2011 National Survey of Student Engagement (NSSE) that captured alumni’s
demographic characteristics and measured their academic and social experiences while in
college. I merged NSSE with data about giving that I retrieved from the Development Office at
the selected institution.
The variables included five Demographic items, fourteen Academic Experience items
with numerous sub-items, and twelve Social Experience items with numerous sub-items.
Exploratory factor analysis revealed five academic factors and four social factors. The results of
a multiple regression analysis revealed that only one factor, Class Assignments, explained the
variance in young alumni giving, but it may have been spurious. It would appear that
demographic characteristics and academic and social factors determined from NSSE are not
particularly useful in explaining giving by young alumni. Indeed, only 14.5% of participants
actually made a donation within five years of graduating. Clearly more research is needed to
expand upon the literature about alumni giving.

Factors in the Undergraduate Experience that Influence Young Alumni Giving
Deborah A. Day
General Audience Abstract
Public funding of higher education has declined substantially in recent years (Alexander,
2000; Esposito, 2010; Mortenson, 2012; NACUBO, 2011; Redd, 2014; Serna & Harris, 2014),
while operating costs and demand have increased (Desrochers & Kirshstein, 2012; Mortenson,
2012; Mumper & Freeman, 2011; NCSES, 2014; Serna & Harris, 2014; St. John & Parsons,
2004), forcing institutions to look for alternative sources of revenue (NCSL, 2010). One such
alternative source of revenue is alumni giving (Monks, 2003; Archibald & Feldman, 2012; CAE,
2014).
This study sought to determine if demographic characteristics, and academic and social
experiences while in college, explain the differences in alumni giving to their alma mater within
five years of graduating. Using a single institution and Volkwein’s (1989) model of giving,
coupled with data from the 2011 National Survey of Student Engagement (NSSE) and
institutional giving data, it would appear that demographic characteristics and academic and
social factors determined from NSSE are not particularly useful in explaining giving by young
alumni.

iv
ACKNOWLEDGEMENTS
Twenty years. It took 20 years to finally complete my dissertation. I am not sure what
really got in the way, marriages, children, cancer, and April 16, 2007, to name a few. To my
original chair, Don Creamer, who started me down this path, and warned me of the perils of
marriage and motherhood in completing a dissertation, and who will be as surprised as anyone
that I did it! I owe a debt of gratitude to many people, a couple of which have been encouraging
and supportive in more ways than they will ever know. The tough love of my chair, Joan Hirt,
who made it clear that this was my last chance. She would see me through, even after her
retirement, if I made good progress, and even after “encouraging” me to start all over with a new
framework. Her Dissertation Boot Camp was the most significant and valuable experience of
my academic career. Her support and direction is the reason I finished! Thank you Joan!
Penny Burge was the impetus for my return to academia, even appealing to Joan on my behalf
to re-enroll to finish my PhD. Her encouraging and challenging words were the reason I pushed
forward. I couldn’t be more grateful to my committee. Gabriel Serna, my co-chair, has
provided invaluable assistance to this process. I so appreciate his willingness to guide me
through the data analysis process, always encouraging and helpful in providing the resources to
learn as well as a reassuring outlook on the process. Steve Culver, who continually said, “Yes”
he would be on my committee and who always made time to meet with me and provide
guidance, access, and encouragement. His expertise in assessment, and specifically NSSE, was
invaluable. Nancy Bodenhorn, who so kindly stepped in at the end as a committee member and
who brought insight and a useful perspective to my study. I also want to acknowledge Joshua
Cohen and Mary Norris who were not on my committee, but provided excellent tutelage in
SPSS and data analysis. Their support after years away from statistics was invaluable.
I would also like to acknowledge several colleagues and friends. Thank you to Tom
Tillar for allowing me to earn a Master’s degree at the Northern Virginia Center, and to continue
my doctoral work when I moved to Blacksburg in the mid-90’s. Tom was also supportive and
encouraging as I took a semester to pursue my degree full-time, while working only part time.
Since the moment Matt Winston arrived in Blacksburg and found out I was pursuing my
doctorate, he was incredibly supportive. He truly encouraged me to get it done. He gladly

v
allowed time each week for writing and constantly asked about my progress. He was a true
champion of my success. I also appreciated the opportunity from the senior leadership of
Advancement who allowed me to continue to pursue this degree during and after our transition
to a new organizational model. Thanks to Cathy Lally who gently asked about my progress
along the way and Ginny Ritenour and Kelly McCann who protected my time and had my
back when the pressure was on. Thanks also to Natalie Kelly, Jacqueline Nottingham, and
Mary Grace Theodore, who were always there for me, to listen, to encourage, and to have a
glass of wine! Thanks too to Megan Franklin, one of my biggest cheerleaders, and one of the
few who really understood what needed to be done. Finally, a shout out to John Graham, who
not so gently asked about my progress—who always encouraged me to finish, and promised he
would come to Blacksburg for graduation.
I would be remiss if I didn’t thank my family, including my parents, Wayne Day and
Linda Thomas, and my in-laws, Jody and Joe Brown, for their support and savvy judgement on
how to navigate their interest in my progress. This often was in the form of silence to me with a
subtle inquiry to my husband. To our kids, Tanley Brown, who joined our family in grade
school and who I sometimes thought would finish a PhD before me (even though she has yet to
begin), and Walker and Brad Shelton, who have experienced my doctoral work for their entire
lives. Thank you for not making fun of me, at least about this! Lastly, I give a huge shout out to
my husband, J.S. Brown, who never gave up on me, who also learned how to strategically
inquire about my progress, who encouraged me along the way, who always wanted to know what
I needed, who celebrated the milestones along the way, but best of all, who gave me the space
and time I needed to finally complete my dissertation.

vi
TABLE OF CONTENTS
ABSTRACT………………………………………………………………………………………ii
GENERAL AUDIENCE ABSTRACT…………………………………..………………………iii
ACKNOWLEDGEMENTS…………………………………...………………………………….iv
TABLE OF CONTENTS……………………………………………….…………………..……vi
LIST OF TABLES…………………………………………………………………………...…viii
LIST OF FIGURES…………………………………………………………………..…….…….ix
LIST OF APPENDICES…………...……………………………………………………………..x
CHAPTER ONE: Introduction…………………………………………………………………...1
Statement of the Problem………………………………………………………………….7
Purpose of the Study….……………………………………………………………….…..8
Research Questions………………………………………………………………………..8
Significance of the Study……………………………………………………………….....9
Delimitations……………………………………………………………………………..10
Organization of the Study………………………………………………………………..10
CHAPTER TWO: Literature Review…………………………………………………………...12
Charitable Giving in General…………………………………………………………….12
Demographic Factors…………………………………………………………….12
Motivation to Give……………………………………………………………….14
Capacity to Give…………………………………………………………………16
Alumni Financial Giving………………………………………………………………...16
Demographic Variables………………………………………………………….16
Academic Experiences…………………………………………………………...18
Social Experiences……………………………………………………………….20
Alumni Participation……………………………………………………………..22
CHAPTER THREE: Methodology……………………………………………………………...26
Sample Selection…………………………………………………………………………27

vii
Instrumentation…………………………………………………………………………..29
Validity and Reliability…………………………………………………………………..40
Data Collection…………………………………………………………………………..43
Data Analysis Procedures……………………………………………………………..…43
CHAPTER FOUR: Results of Study……………………………………………………..……..61
Sample……………………………………………………………………….……….…..61
Results of Data Analysis……………………………………………………………..…..61
CHAPTER FIVE: Discussion and Implications………………………………………………...67
Discussion………………………………………………………………………………..67
Limitations…………………………………………………………………………….....70
Relationships of the Findings to Prior Research…………………………………………72
Implications for Future Practice, Research and Policy…………………………………..76
Conclusion……………………………………………………………………………….81
REFERENCES…………………………………………………………………………………..82
APPENDICES…………………………………………………………………………………..90

viii
LIST OF TABLES
1 Demographic Variable Items from 2011 NSSE…………………………………………...31
2 Academic Experiences Items from 2011 NSSE ……….………………………………….34
3 Social Experiences Items from 2011 NSSE….……………………………………………41
4 Summary of Exploratory Factor Analysis Results for Academic Experiences..............….47
5 Summary of Exploratory Factor Analysis Results for Social Experiences...……………...56
6 Items Associated with Academic and Social Factors..……………………………………58
7 Demographic Characteristics of the Sample..............................…………………………..62
8 Summary of Multiple Regression Analysis for Demographic, Academic and Social
Variables Predicting Young Alumni Giving…………..…………………………………..66

ix
LIST OF FIGURES
1 Volkwein Model of Alumni Giving …..……………………………………………6
2 Scree Plot for Academic Experiences…..……………………………....................46
3 Scree Plot for Social Experiences…..………………………………......................55

x
LIST OF APPENDICES
Appendix A: IRB Approval Letter…………………………………………………………….90
Appendix B: Permission to Use Figure 1……………………………………………………..92

1
Chapter One
Introduction
There is a financial crisis in higher education (Alexander, 2000; Davis, 2013; Desrochers
& Kirshstein 2012; Esposito, 2010; Kena et al., 2014; Mortenson, 2012; Mumper & Freeman,
2011; Redd, 2014; Serna & Harris, 2014; St. John & Parsons, 2004). The state and local share of
funding provided to institutions of higher education peaked in 1975 and constituted 60.3% of
institutional funding. By 2010 that number was reduced by nearly half, to 34.1% (Mortenson,
2012). The recession that devastated state budgets in the first decade of the 21st century caused
many states to dramatically decrease state support to public institutions of higher education.
Between 2007-08 and 2009-10 only 12 states increased financial support to postsecondary
education (Esposito, 2010).
In FY 2010 state appropriations for public 4-year colleges and universities declined
between 9% and 13% from the previous year, leaving state support at its lowest level since 2000
(Davis, 2013; Desrochers & Kirshstein 2012). State and local appropriations have fallen at all
types of institutions, but research and master’s institutions were hit particularly hard: a 24%
decline between 2006-2009 resulting in the first time that net tuition revenue exceeded funding
from state appropriations at those institutions. State funding is particularly challenging because
states, by law, are required to balance their budgets (Alexander, 2000; Serna & Harris, 2014).
As public financial resources dwindle, states struggle to appropriate limited funds to their
agencies (Alexander, 2000).
At the same time funding from public sources has declined, costs to operate institutions
of higher education and demand for their services have increased (Mumper & Freeman, 2011; St.
John & Parsons, 2004; Serna & Harris, 2014). Tension exists between institutions’ need to
increase tuition costs and state governments, responding to constituent concerns, striving to limit
those increases. There is evidence that lower tuition increases are realized when regulated by the
state (Kim & Ko, 2015). Between 2006 and 2009 total operating costs at U.S. postsecondary
institutions increased 20% from $219.1 billion to $262.8 billion (National Association of College
and University Business Officers [NACUBO], 2012). In 2000, public funds for higher education
exceeded tuition revenues from students by $3,000 - $5,000 per student, but by 2010 that figure
fell to approximately $500 per student (Desrochers & Kirshstein, 2012). Indeed, appropriations
to higher education today remain lower (in constant dollars) than in most years since FY 1980

2
(National Conference of State Legislatures Blue Ribbon Commission on Higher Education
[NCSL], 2010).
During a similar period of time, (1990 to 2012), undergraduate enrollment in degree-
granting postsecondary institutions rose from 12 million students to 17.7 million students, an
increase of 48%. This trend is expected to continue as the number of students is projected to
increase to 20.2 million by 2023 (Kena et al., 2014). At public institutions during the same
period of time, the number of undergraduate students rose from 9.7 million to 13.5 million, an
increase of 39% (Kena et al., 2014).
This convergence of shrinking state support, increased operational costs, and growing
demand has resulted in the need to generate new sources of revenue for the higher education
sector (NCSL, 2010). Several new revenue streams have emerged in recent years. To start,
many institutional leaders have felt compelled to increase tuition. However, the public outcry
against the high price of attending college and the increasing amount of student debt is driving
governments and governing boards to limit tuition increases (St. John & Parsons, 2004).
Consequently, academic leaders from institutions of higher education are progressively
relying on alternative sources of revenue to finance their operating and capital budgets. These
other sources of income may be public, including government sponsored research and
development (R&D) funds. R&D contributions to higher education include support from
agencies such as the Departments of Defense and Health and Human Services, NASA, the
National Science Foundation (NSF), and USDA. R & D in the United States reached the $1
billion mark in 1963 and by 2016 was $72 billion (Britt, 2016; NSF, 2017).
Federal government officials understand the importance of continued investment in basic
and applied research and development (Shapiro, 2013). R & D support, especially in times of
decreased state spending on higher education and growing global competition in high technology
industries, is not likely to decrease. Federal officials recognize the significance of R & D
funding to building and sustaining an outstanding system of higher education that prepares future
scientists and engineers. They also understand the importance of economic growth in the United
States and how higher education can play a significant role in not only educating citizens, and
creating and marketing innovations, but also in the nation’s affluence, continuing employment,
security, and enhanced quality of life (National Science Board [NSB], 2012).

3
Although federal support is crucial, it is insufficient to fully fund the postsecondary
enterprise. Increasingly, alternative sources of revenue for higher education originate in the
private sector and include foundation grants, corporate donations, endowment income, and
alumni contributions (Archibald & Feldman, 2012; Monks, 2003).
Educational foundations typically provide support in the form of grants. Thousands of
foundations support a broad array of issues including social justice, health, education, art,
humanities, access and affordability. Some of these organizations fund work in the social
sciences, like the Koch Foundation (free societies), Posse Foundation (leadership) and The Ford
Foundation (social justice). Others support greater access and affordability to higher education
and sustaining a career; these include the Lumina Foundation and The Bill and Melinda Gates
Foundation. There are many others that support specific initiatives in the arts or humanities,
such as The National Art Education Foundation that supports issues surrounding art education
(Bill and Melinda Gates Foundation, 2017; Charles Koch Foundation, 2017; Ford Foundation,
2016; Jenkins, 2017; National Art Education Foundation, 2017; The Posse Foundation, 2014).
Overall, foundations provided an estimated $12.5 billion in support to postsecondary
education in 2016, up from $4.2 billion in 1997 (Council for Aid to Education [CAE], 2017).
Even during economic crises, foundation grants have remained fairly stable, evidence of their
continuing commitment to issues of interest to higher education (Lawrence & Marino, 2003).
Still other giving to higher education comes from corporations. These funds include cash and in-
kind gifts generated through corporate giving programs as well as grants and gifts made by
corporate foundations (McConnell, 2015). Corporate giving has expanded over the decades to
include employee volunteerism and employee matching programs (van Fleet, 2010). In general,
corporate giving is influenced by the profits earned as well as a corporation’s giving philosophy.
Giving philosophy can vary from taking advantage of tax incentives and boosting profits through
advertising sponsorships to the more altruistic sentiment of being good corporate citizens (van
Fleet, 2010).
Corporate giving to higher education has increased dramatically since the mid-1960s,
from about $5 million in 1967 to the all-time high of $17.61 billion in 2005 (van Fleet, 2010).
Corporate giving trends are impacted by the economic climate as was seen during the 1970s and
the more recent 2008 recession (van Fleet, 2010). Although corporate giving to higher education

4
has not returned to its 2005 high, it still represents 16.1% or $56.6 billion of private support to
the higher education sector (CAE, 2017).
Overall, postsecondary institutions received a record-breaking $41 billion from charitable
contributions in 2016 according to the annual Voluntary Support of Education (VSE) report
(2016). In addition to the $6.6 billion (16.1%) donated by corporations, that $41 billion included
contributions of $12.5 billion (30%) by foundations. Religious and other organizations
contributed $4.5 billion (11%) (CAE 2017). This is especially relevant as the economy recovers
from the recent economic downturn and indicates that donors are committed to private support of
education (CAE, 2017).
One other constituency was significant in terms of support for higher education:
individuals. The VSE (2016) report revealed that 24.2% ($9.9 billion) of the $41 billion was
donated by alumni while non-alumni contributions represented 18.3% ($7.5 billion) of that total
(CAE 2017). These forms of philanthropic giving support programs and can build an
institution’s endowment funds.
Philanthropic support might be considered an outcome of the collegiate experience.
There are several models describing student outcomes of college, including Astin’s Theory of
Student Involvement (1984), Tinto’s (1993) Theory of Student Departure, and Pascarella &
Terrenzini’s (1991) college impact models. Astin (1984) suggests undergraduate student
development is dependent upon the amount of physical and psychological effort put forth by
students in their academic and non-academic endeavors. Tinto’s (1993) theory focuses on
student retention as an indicator of students’ college experience and includes variables such as
their integration into the institution, the quality of their interaction with faculty and the college’s
commitment to them (Tinto, 1987). Pascarella and Terrenzini (1991), suggest that other
outcomes of college include psychosocial changes in areas such as self-understanding and
relationships, as well as changes in attitudes and values. Moral development and readiness to be
productive members of the workforce and society reflect other outcomes of college (Graham &
Gisi, 2000).
Student outcomes like effort, integration to campus, and psychosocial changes are elusive
and difficult to assess. Giving to one’s alma mater, however, is an outcome of the collegiate
experience that might be easier to measure. There are several models in the literature that reveal
reasons for alumni giving; all seem to focus on individual motivation and behavior. Alumni

5
giving to their alma mater is influenced by their willingness to give, their involvement in the
university, their perceptions of the economic environment, the perceived need of the institution,
whether they received a scholarship, and their capacity to give (Hoyt 2004). That is, alumni
must be motivated to give and willing to invest money and/or time in their alma mater.
Another study espouses that student and alumni experiences, including giving, are
significantly related to the perceptions they have about the quality of their educational
experience (Gallo & Hubschman, 2003). Factors that determine the quality of their educational
experience include demographic background, the impact of educational programs and
experiences, involvement in activities and organizations while in college, and employment
history and experiences (Gallo & Hubschman, 2003).
Most relevant to my study is the Volkwein (1989) model of alumni giving. Much of his
research suggests that the amount and frequency of alumni giving are functions of both capacity
and motivation to give (Volkwein, et al., 1989). Factors that influence motivation to give
include personality and values while factors that determine capacity to give include
socioeconomic background and achievements. Other factors that influence capacity and
motivation include demographic background and prior academic and social experiences
(Volkwein, et al., 1989).
The Volkwein Model of Alumni Giving (1989) considers capacity to give to be
dependent upon occupational status, wealth, number of dependents, highest degree earned, and
educational progress. Motivation to give is influenced by such factors as multiple degrees from
the college, proximity to and communication from the college, aspirations and career values, and
alumni involvement with the institution. Other factors that influence motivation to give include
satisfaction with occupation and income, professional and civic service and the perceived need of
institutional support.
As shown in Figure 1, there are many factors that influence both capacity to give and
motivation to give. These factors can be broken down into two types, demographic background
and college experiences and outcomes. Demographic background takes into account
socioeconomic status, age, graduation year, gender, race/ethnicity, intergenerational attendance,
and whether the student entered as a freshman or transfer student. The college experience and
outcomes are also influenced by whether they entered as a freshman or transfer student in

6
addition to their GPA, major, extracurricular activities, academic experiences, relationships with
faculty and peers and their personal and intellectual growth (Volkwein, 2010).
Figure 1
Figure 1: Volkwein Model of Alumni Giving (Volkwein, 1989)
Positive student experiences translate into positive perceptions by alumni and increase the
likelihood that alumni will give to the university (Gallo & Hubschman, 2003).
There are several instruments that are used to measure college student outcomes. The
National Survey of Student Engagement (NSSE) gathers information from college graduates
about several of the Volkwein factors, including demographics, participation in academic and
social activities, and relationships with faculty and peers (Redd, 2014). My study used NSSE
items as proxies for the outcomes associated with Volkwein’s (1989) theory. I supplemented the
NSSE dataset with information from institutional records related to alumni giving.

7
Statement of the Problem
In summary, a perfect storm has engulfed the higher education enterprise in recent years.
Public funding has declined precipitously (Alexander, 2000; Esposito, 2010; Mortenson, 2012;
NACUBO, 2011; Redd, 2014; Serna & Harris, 2014). At the same time, operating costs in the
postsecondary sector have increased (Desrochers & Kirshstein, 2012; Mumper & Freeman,
2011; Mortenson, 2012; St. John & Parsons, 2004). Further compounding the problem, demand
for higher education continues to climb (Mumper & Freeman, 2011; NCSES, 2014; Serna &
Harris, 2014).
In response, postsecondary institutions have looked to increase funds from four
alternative sources (NCSL, 2010). These include R & D (NCSES, 2014; Shapiro, 2013; NSB,
2012), foundations (CAE, 2014; Lawrence & Marino, 2003; McConnell, 2012), corporations
(McConnell, 2012; van Fleet, 2010; CAE, 2014), and individual giving by alumni (Monks, 2003;
Archibald & Feldman, 2012; CAE, 2014).
Alumni giving can be considered an outcome of the collegiate experience. There are
several models for measuring this outcome (Astin, 1984; Graham & Gisi, 2000; Pascarella &
Terenzini, 1991; Tinto, 1993) that include individual motivation, behavior, educational
experiences, and capacity to give (Hoyt, 2004; Gallo & Hubschman, 2003; Volkwein, et al.,
1989). Most relevant to my study is the Volkwein Model of Alumni Giving (1989) that suggests
that the factors that influence giving include demographic factors, academic experiences, and
social experiences. The National Survey of Student Engagement (NSSE, 2011) gathers
information from college graduates about their personal (demographic) characteristics, as well as
their participation in academic and social programs and activities (NSSE, 2011).
Institutions of higher education depend on alumni giving as an important resource for
success. Financial giving is an easily recognized and measureable form of alumni support
(Johnson & Eckel, 1997; Gaier, 2005). There is ample evidence in the literature about the
motivation factors and capacity factors that influence alumni giving to their alma mater
(Volkwein, et al., 1989). The current study seeks to expand the existing literature by examining
the degree to which Demographics, Academic Experiences and Social Experiences influence
alumni financial giving.

8
Purpose of the Study
The purpose of this study was to examine factors that influence alumni financial giving to
their alma mater within five years of graduation. The conceptual framework I chose for this
study was a modified version of Volkwein’s Model of Alumni Giving (1989). Specifically, I
looked at the degree to which Demographic characteristics, Academic Experiences, and Social
Experiences explained the variance in alumni giving.
Demographic Variables (DV) were defined as sex, international status, racial or ethnic
identification, grades, and parents’ level of education. Academic Experiences (AE) were defined
as the extent of involvement in the curricular experience (e.g., faculty interaction inside and
outside of class, the quality of relationships with faculty and staff, preparation for class,
participation in academic activities and satisfaction with the educational experience). Social
Experiences (SE) were defined as extracurricular activities (e.g., interaction with others,
participation in student organizations, community events, and service).
The sample included alumni from a research extensive university in the mid-Atlantic
region of the United States. Data for the study came from two sources at the selected university.
Specifically, I used National Survey of Student Engagement (NSSE) data gathered from alumni
who graduated in 2011 and provided by the Office of Assessment and Evaluation. Using
specific selection variables, I narrowed the sample to 559 participants. I supplemented the
institutional dataset with information about the five-year giving history of those 559 alumni that I
derived from the Development Office.
Research Questions
This study was designed to answer four research questions:
1. To what extent do demographic factors explain the variance in alumni giving within five
years of graduation?
2. To what extent do academic experiences explain the variance in alumni giving within
five years of graduation?
3. To what extent do social experiences explain the variance in alumni giving within five
years of graduation?
4. To what extent do demographic factors and academic and social experiences explain the
variance in alumni giving within five years of graduation?

9
Significance of the Study
This study was significant for several campus constituencies including senior level
development professionals, vice presidents for student affairs, academic leaders, and first year
experience program developers. The results of this study provided senior level development
professionals with data about what types of social experiences influence alumni to give to their
alma mater within five years of graduating. Development professionals might use the results to
collaborate with student affairs professionals to design social programs at the undergraduate
level in hopes of cultivating future donors.
Additionally, the results of this study provided vice presidents for student affairs with
data to support what types of social experiences lead to giving. Vice presidents for student
affairs may use this information to educate their staff to promote programs that lead to giving.
Academic leaders might benefit from the results as well. The findings identified the
academic experiences that were associated with giving. Deans and Provosts might use the data
to examine the academic services (e.g., faculty contact with students, service learning
opportunities) at their own campuses in an effort to promote giving.
Lastly, developers of first year experience initiatives might use the data to determine
what types of programs lead to positive academic and social experiences during the freshman
year and subsequently might lead to giving by alumni. They may use this information to guide
curricular development and the types of experiences introduced during a student’s first year in
college.
The present study also had significance for future research. For example, my data came
from alumni of a single research extensive university. A future study might examine what
factors predict alumni financial giving at other types of institutions (e.g., liberal arts colleges,
community colleges). Such a study would expand on the information available about the
prediction of giving based on institutional type.
Second, my study was based on quantitative data. A future study might look at giving
through a qualitative study involving interviews and focus groups in order to gain a deeper
understanding of what undergraduate experiences lead to giving by alumni.
Lastly, this study determined what academic and social experiences influence giving.
Another study could examine what other factors, such as major or profession might explain
variability in alumni financial giving.

10
My study was also significant for future policy. The results provided faculty and
administrators with information about the academic experiences associated with alumni giving.
They might use the results when shaping policies about criteria for new or revised curricular
offerings.
In addition, the results provided student affairs professionals with information about the
types of social experiences that influence alumni financial giving. Student affairs leaders might
incorporate the data when designing criteria for future programs and services.
Finally, the results of this study provided senior leadership in university development
with information about the types of programs or experiences that influence alumni giving.
Senior leaders in the development office might use the results when creating criteria for new
outreach initiatives.
Delimitations
As with all research, the present study had some initial delimitations. The first dealt with
the sample. All of the participants in this study attended the same institution. It is possible that
alumni at this institution differed in some important way from alumni at other research extensive
institutions. If so, this might have influenced the results in some unforeseen manner.
Another potential delimitation was the use of existing data. The NSSE dataset contains
information from college and university students about their participation in select campus
programs and activities using a pre-determined set of variables. The study was limited to the
variables in the data set.
A third delimitation related to the fact that all participants were volunteers. It is possible
that those who volunteered to complete the 2011 NSSE instrument had either a very positive or
very negative experience at the institution that prompted them to participate in the study. If so,
this might have skewed the data.
Despite these delimitations, this was a worthwhile study. It filled a gap in the literature
related to how different student characteristics and academic and social experiences influenced
alumni giving. Cultivating alumni donors is increasingly important to university leaders and this
study offered some initial insight into how this revenue stream might be promoted.
Organization of the Study
This study is organized around five chapters. The first chapter introduced the topic of the
study, the purpose statement, the research questions and significance of the study. The second

11
chapter reviews the literature relevant to the study. Chapter Three presents the methodology of
the study, including how the sample was selected and the procedures used to collect and analyze
the data. The fourth chapter describes the results of the study while the final chapter discusses
those results and their implications for future practice and research.

12
Chapter Two
Literature Review
There were two bodies of literature that were relevant to this study. The first included
studies on charitable giving in general. Three subsets of studies were revealed in the literature:
demographic variables, motivational factors, and capacity factors. The second body of literature
examined alumni giving to higher education. These works revealed four subsets of studies:
demographic variables, academic experiences, social experiences and alumni participation and
satisfaction. This chapter is organized around these two sections and their respective sub-
sections.
Charitable Giving in General
Philanthropy is generally defined as charitable giving with the intent to improve the
quality of life, wellbeing, and culture of humankind, usually in support of moral or social reform
(Hall, 2006; Vesterlund, 2006). More than $390 billion in charitable contributions were made in
2016 in the United States (Giving USA, 2017). The largest percentage of charitable
contributions went to religious organizations (32%), followed by human services and grant
making foundations (22%), education (15%), and health organizations (8%). There are many
studies that examine why people make charitable contributions.
Demographic Factors
Demographic characteristics are associated with giving. To start, there is research on
gender and charitable donations. The preponderance of evidence suggests that women give more
often and more generously to charities than men (Bekkers, 2010; Hall, 2010; Mesch 2012;
O’Malley, 1992; Shelley & Polonsky, 2002). Giving more may be a reflection of women’s
helping nature, whereas men tend to rely on pragmatic reasons when giving (Shelley &
Polonsky, 2002). Women tend to be more generous perhaps because of their empathetic nature
and traditional role as caregiver (Mesch, 2012). They are more likely to seek advice on their
investments (Wasley, 2009). In addition, women live longer than men and may even inherit
twice, once from their parents and again from their spouse (Lodge, 2014). Although most recent
research indicates that women give more, one older study found that men give 16% more than
women (O’Malley, 1992).
Age also plays a role as giving tends to change over time. As people age, they tend to
give more often (Shelley & Polonsky, 2002) and it is generally older people who tend to give

13
(O’Malley, 1992; Shelley & Polonsky, 2002). This may be due to the fact that age is associated
with increased wealth. For many, having lived a long and prosperous life leads to a desire to
provide for future generations (O’Malley, 1992). Again, however, the results are mixed. Most
studies revealed older people tend to give more, but one study found that millennial and
Generation X women who are single and unaffiliated with a religion give more than twice as
much as older, similarly unreligious men (Lindsay, 2014).
There are several socioeconomic variables that affect giving. The level of education one
achieves plays a role (Bekkers, 2010; O’Malley, 1992) as does social class (Shelley & Polonsky,
2002), and income (Bekkers, 2010; Melchiori, 1988; Szady, 1988). The aforementioned
variables may be the result of one’s upbringing and other social influences and expectations
(Bekkers, 2010; O’Malley, 1992; Shelley & Polonsky, 2002). Another socioeconomic variable
that may affect giving is where one lives. People who live in urban areas are more likely to give
(Bekkers, 2010; Shelley & Polonsky, 2002). Those who live in more urban areas may be
exposed to more causes (Shelley & Polonsky, 2002) and citywide problems and issues
(O’Malley, 1992). Urban dwellers may also reflect greater income and be more aware of needs
(O’Malley, 1992).
Finally, there are several socio-demographic factors that influence giving. These include
religious affiliation (Bekkers, 2010; Campbell, 2013; Hoyt, 2004; O’Malley, 1992; Gose, 2012;
Wood & Houghland, 1990; Wuthnow, 2004), political activity (Brady, Verba & Schlozman,
1995; O’Malley, 1992), and volunteerism (Bekkers, 2010; O’Malley, 1992). Those who give the
most live in more religious regions of the country where tithing to churches is the norm (Gose,
2012). The most religious people tend to be the most generous (Campbell, 2013; Daniels, 2013).
This may be the result of the social networks that form within religious institutions and influence
people to give more (Campbell, 2013; Wuthnow, 2004). Lastly, being raised in a religious home
may influence giving to the church over the lifetime (Wuthnow, 2004). However, there is some
evidence that the intensity of one’s religion may not be as strong an influence on giving as
previously thought (Lindsay, 2014).
Although political activity may be the result of a general interest in politics, the literature
indicates that other factors may be more influential. These include the time to participate, the
money to do so and the civic skills one has (Brady, Verba & Schlozman, 1995). Time to
participate includes working on a campaign, serving on local boards, writing local officials, and

14
related activities (Brady, Verba & Schlozman, 1995). Monetary contributions are simply related
to the amount of money available and are often influenced by education and SES (Brady, Verba
& Schlozman, 1995). Finally, civic involvement is often linked to the level of education
achieved and related activities including classes in government and the ability to form and
articulate opinions. Those who are involved in their communities may also be more likely to
give as they would be exposed to the needs and usages of charitable donations (O’Malley, 1992).
Motivation to Give
Several motivations for giving repeatedly surface in the literature and can be organized
into four groups: personal interests, economic interests, social interests, and relational interests.
Personal interests are influenced by one’s allegiance to or empathy for an organization (Bekkers,
2010; Mann, 2007). The amount of interaction a donor has may influence the perceived quality,
value and satisfaction with the organization, and lead to giving (Mann, 2007). Empathy is
another trait that may influence giving; specifically, those who give are generally concerned for
the welfare of others, either through the ability to see the world from another’s viewpoint or to
relate emotionally to others’ circumstances (Bekkers, 2010).
Some people give with an expectation of reciprocity or are influenced by reinforcement;
that is, the direct benefit or tangibles they receive in exchange for their charitable contribution
(Bekkers, 2010; Hoyt, 2004; Mann, 2007; Shelley & Polonsky, 2002). For example, in a church
setting, members may give regularly and in return receive the benefit of spiritual well-being and
the support of a community (Mann, 2007), or material incentives, such as their name in the press
or on a donor wall, or special seating or recognition at an event (Bekkers, 2010). The rate of
interaction between individuals or friends also increases the likelihood of giving. The more
often the interaction occurs, the more likely one is to give (Bekkers, 2010).
Other personal issues that influence giving are one’s willingness or propensity to give
(Bekkers, 2010; Mann, 2007) and a predisposition towards giving (O’Malley, 1992). Those who
regularly attend artistic programs, for example, might not only be motivated to give to a
particular program, but also may learn to appreciate other types of artistic programs, resulting in
further giving (O’Malley, 1992). One study revealed the willingness to give is influenced by
both the type of support being solicited and the person being asked (Bekkers, 2007).
Educational and family experiences may also influence propensity to give, as does participation

15
in community activities (O’Malley, 1992). Finally, a psychological factor that is influential is
simply feeling good about oneself, described as a “warm glow” (Bekkers, 2010).
Economic interests influence some donors depending on their income, the level of
expected contribution, and the benefit the gift will support (Bekkers, 2010; Mann, 2007;
Vesterlund, 2006). A donor may be more likely to give based on the impact the gift will have on
others (Mann, 2007; Vesterlund, 2006). Those who do contribute are sometimes seen as
performing a deliberate, self-serving act where the donor receives a tax deduction or personal
recognition (Shelley & Polonsky, 2002; Vesterlund, 2006). For example, Milton Freidman
suggests “the only justification for philanthropy is tax avoidance” (Shelley & Polonsky, 2002 p.
22).
There are social reasons associated with charitable giving. Altruism is seen as one
motivation. It involves a sense of social obligation to better society by providing goods and
services (Bruggink & Siddique, 1995; Mann, 2007; Shelley & Polonsky, 2002; Vesterlund,
2006). An awareness of need (Mann, 2007; O’Malley, 1992; Shelley & Polonsky, 2002) and
knowledge of how the money will be used (O’Malley, 1992) with an emphasis on effectiveness
and efficiency of the organization all influence giving (Bekkers, 2010; Shelley & Polonsky,
2002).
Some people give because they are motivated by others’ behavior (modeling), social
pressure or approval, prestige, or a fear of a damaged reputation by not giving (Bekkers, 2010;
Hatfield, Walster & Piliavin, 1978; Hoyt, 2004; Mann, 2007; Shelley & Polonsky, 2002;
Vesterlund, 2006). Others are more influenced by reinforcement such as a social reward or
desire for status and relationships with people in positions to approve or disapprove (Bekkers,
2010; Hoyt, 2004; Mann, 2007). The higher the social reward for giving (or the higher the social
risk for not giving), the greater the likelihood of giving (Bekkers, 2010).
Lastly, relational interests can influence the motivation to give. This includes both
personal and organizational relationships. Personal influences that can affect giving include
existing relationships and the agreeableness of the person who asks for a donation (Bekkers,
2010), the modeling that exists (Hoyt, 2004), and the donor’s previous giving (Bekkers, 2010;
Shelley & Polonsky, 2002). From an organizational relational standpoint, influencers include the
mission of the organization (O’Malley, 1992) and how the donor connects or identifies with the

16
organization (Bitner & Hubbard, 1994; Mann, 2007). Evidence suggests that a high level of
connectedness or belongingness with an organization influences giving (Mann, 2007).
Capacity to Give
Finally, another variable consistently revealed in research is the capacity of an individual
or household to give (Baade & Sundberg, 1996; Bekkers, 2010; Clotfelter, 2003; Monks, 2003;
O’Malley, 1992; Thomas & Smart, 2005). Capacity to give is generally defined as income, but
also includes assets and other financial commitments (Volkwein, 2010), or availability of
resources (Weerts & Ronca, 2007). These financial assets could be considered achievement
variables (Volkwein, 2010).
Other, more personal factors that may influence capacity include marital or cohabitation
status (O’Malley, 1992) and number of dependents or family size (O’Malley, 1992; Volkwein,
2010; Weerts & Ronca, 2007). The ages of children and the schooling of children and
grandchildren may also influence capacity to give. For example, school may become more
costly as children age, or families may choose to send them to private schools (Weerts & Ronca,
2007). Other personal factors that determine capacity include occupational status and highest
degree earned (Baade & Sundberg, 1993; Bekkers, 2010; Monks, 2003; O’Malley, 1992;
Thomas & Smart, 2005; Volkwein, 2010).
Alumni Financial Giving
There is also ample research on alumni giving to higher education. Institutions of higher
education depend on alumni giving as an important resource for their success (Gaier, 2005). The
body of literature on alumni giving to higher education reveals four subsets of studies:
demographic variables, academic experiences, social experiences and alumni participation and
satisfaction.
Demographic Variables
A number of demographic variables that have been correlated with alumni giving have
held up over time, including age, (Baade & Sundberg, 1993; Bruggink & Siddiqui, 1995; Gaier,
2005; Hoyt, 2004; Mosser, 1993; Taylor & Martin, 1993, 1995; Thomas & Smart, 2005), gender
(Taylor & Martin, 1993), race (Miller & Casebeer, 1990; Monks, 2003), family status (Monks,
2003; Mosser, 1993; Taylor & Martin, 1993; Thomas & Smart, 2005; Young & Fischer, 1996),
education (Hoyt, 2004; Monks, 2003; Mosser, 1993; Steeper, 2009; Taylor & Martin, 1995),
SES (Baade & Sundberg, 1993; Hoyt, 2004; Monks, 2003; Mosser, 1993; Steeper, 2009; Taylor

17
& Martin, 1993 & 1995; Young & Fischer, 1996), and location (McDermon & Shirley, 2009;
Mosser, 1993; Taylor & Martin, 1993).
Age, or years since graduation, has a significant relationship to alumni giving in two
ways (Baade & Sundberg, 1993; Bruggink & Siddiqui, 1995; Gaier, 2005; Hoyt, 2004; Mosser,
1993; Taylor & Martin, 1993, 1995; Thomas & Smart, 2005). First, once alumni start giving,
they are more likely to continue giving (Hoyt, 2004; Lindahl & Winship, 1992; McDermond &
Shirley, 2009; Mosser, 1993; Okunade & Justice, 1991). Secondly, as age increases, alumni are
more likely to give and to give larger amounts (Hoyt, 2004; McDearmond & Shirley, 2009;
Thomas & Smart, 2005). This may be the result of having received more solicitations and/or
more opportunities to give as well as having had more time to achieve higher income levels and
more savings (Baade & Sundberg, 1993; Gaier, 2005; Thomas & Smart, 2005). Much has been
written about giving as alumni age, but very little has been written about giving by young
alumni, those within five years of graduation.
Early studies in the 1970s and 1980s revealed that men gave more to higher education
than women (Taylor & Martin, 1993). More recently, however, researchers have found gender
to have very little or no discriminating power between donors and non-donors (Hoyt, 2004;
Monks, 2003; Mosser, 1993; Taylor & Martin, 1993). One study revealed that earlier reporting
may have been skewed because of the traditional tendency to include only the male name in
university giving records if a married couple were both alumni of the institution (Mosser, 1993).
Race and ethnicity are other factors that may influence alumni giving (Miller & Casebeer,
1990; Monks, 2003). One study found that Blacks, Hispanics, and multi-racial/ethnic groups
give 39%, 23% and 27% less to their undergraduate alma maters than whites, respectively
(Miller & Casebeer, 1990; Monks, 2003). Likewise, nationality makes a difference. U.S. citizens
are over twice as likely to give as non-U.S. citizens (Monks, 2003).
There are several factors that relate giving to family status including marital status
(Monks, 2003; Mosser, 1993), number and age of children (Monks, 2003; Taylor & Martin,
1993) and familial ties to their alma mater (Mosser, 1993, Thomas & Smart, 2005; Young &
Fischer, 1996). To start, the research on marital status is inconclusive. In some studies, married
couples give 18% more than their single counterparts (Monks, 2003), while other results indicate
single alumni give more (Bruggink & Siddique, 1995) and still others reveal there is not much
difference (Mosser, 1993). Other factors that influence more or less giving include whether the

18
spouse is also an alumnus of the same institution (Thomas & Smart, 2005; Young & Fischer,
1996) and whether parents or children are legacies, that is family members who have attended
the same institution (Mosser, 1993; Steeper, 2009). Lifetime total donations can be influenced
when the spouse is also an alumnus (Young & Fisher, 1996).
Several factors relating to education also impact alumni giving, including academic major
(Hoyt, 2004; Monks, 2003; Taylor & Martin, 1993 & 1995). Majors in higher paying
occupations and occupations requiring higher levels of education lead to higher household
income and alumni who are more likely to give (Hoyt, 2004; Steeper, 2009). Taken a step
further, subsequent enrollment in graduate school, whether at the same institution or not, has a
positive impact on financial giving (Monks, 2003; Mosser, 1993; Taylor & Martin, 1993).
There is evidence that those with higher SES have a tendency to give more. Specifically,
one’s financial profile, including both individual and/or family income may influence giving to
one’s alma mater (Hoyt, 2004; Monks, 2003; Mosser, 1993; Steeper, 2009; Taylor & Martin,
1993 & 1995; Young & Fischer, 1996). Additionally, one’s parental income is a predictor of
alumni giving (Baade & Sundberg, 1993).
One final demographic variable associated with giving is location, or proximity to the
institution. Those who live closer to an institution are more likely to give as they more readily
see the need for or the potential benefit of their gift to the institution (McDearmond & Shirley;
2009; Mosser, 1993; Taylor and Martin, 1993).
Academic Experiences
Student involvement on campus leads to a positive college experience that influences
satisfaction and in turn may lead to alumni giving (Astin, 1984; Gaier, 2005; Gallo &
Hubschman, 2003; Hoyt, 2004; Miller and Casebeer, 1990; Monks, 2003, Pumerantz, 2005;
Tinto, 1993). The single most significant influence on alumni giving is individuals’ satisfaction
with their undergraduate experience (McDearmond & Shirley; 2009; Monks, 2003; Mosser,
1993; Spaeth & Greely, 1970, Thomas, 2005). Positive experiences increase the probability of
giving just as negative experiences decrease the probability of giving (Pumerantz, 2005). Many
studies focus on identifying experiences that influence alumni giving. These studies fall into two
categories: academic experiences and social experiences.
There are at least five types of academic experiences that are associated with alumni
giving. The first is relationships. Faculty interactions are highly correlated to a positive

19
academic experience that, in turn, influences giving behavior (Hartman & Schmidt, 1995;
Monks, 2003; Mosser, 1993; Pumerantz, 2005). Other relationships deemed as important
include interactions with major advisor, staff members, or administrators (Monks, 2003; Mosser,
1993; Outcalt, & Skewes-Cox, 2002; Spaeth & Greely, 1970; Steeper, 2009).
Academic programs that emphasize quality academic work also predict the likelihood of
giving to an institution (Gaier, 2005). Additionally, successful academic integration is an
important determinant of academic success (Volkwein, 1989; Melchiori, 1986; Szady, 1988).
Academic experiences shape satisfaction (Gaier, 2005; Miller & Casebeer, 1990; Spaeth &
Greely, 1970) and can include coursework (Gaier, 2005; Mosser, 1993), quality of instruction,
courses, and programs (Gallo & Hubschman, 2003; Graham & Gisi, 2000; Hoyt, 2004), and
class size (Graham & Gisi, 2000). In addition, greater involvement in academic groups such as
departmental clubs and activities can also influence satisfaction that leads to alumni giving
(Mosser, 1993; Taylor & Martin, 1993 & 1995; Thomas & Smart, 2005).
There is high positive correlation between academic achievement and satisfaction leading
to giving (Baade & Sundberg, 1993; Miller & Casebeer, 1990). Academic achievement can
include high GPA (Hoyt, 2004; Miller & Casebeer, 1990), academic honors (Monks, 2003) and
student learning (Hoyt, 2004; Mosser, 1993). Other factors related to increased alumni
satisfaction, and, in turn, giving, include academic advising, ease of registration, personal
counseling, and other student services (Graham & Gisi, 2000).
Additional factors that influence academic satisfaction and alumni giving can be
categorized as enriching educational experiences. These include participation in a professor’s
research (Baade & Sundberg, 1993; Pumerantz, (2005), independent research projects
(O’Malley, 1992), internships (Monks, 2003; Outcalt & Skewes-Cox, 2002) and year-long study
abroad programs (Young & Fischer, 1996). One study indicated that students who participate in
independent research projects give 26% more than those who do not (O’Malley, 1992).
However, individuals involved in independent study make significantly lower average donations
(Monks, 2003).
Finally, students’ financial aid status and the amount of their student loans may influence
giving to their alma mater (McDearmond & Shirley, 2009; Monks, 2003). Recipients of
financial aid of $1,000 or more are more likely to make donations to their alma mater (Monks,
2003) as they may have a desire to give back so other students have a similar opportunity (Hoyt,

20
2004). However, receipt of a need-based loan lowers the probability of giving (Clotfelter, 2003)
by 13% whereas receipt of a need-based grant increased the likelihood to 12%. The influence of
financial aid and subsequent debt on alumni giving is a fairly recent phenomenon, emerging over
the last 25 years (McDearmond & Shirley, 2009; Monks, 2003).
One study reveals contradictory results when it comes to involvement. In this case,
creating opportunities for students to interact with alumni is a significant predictor of the student
experience and subsequent alumni giving. These opportunities could include alumni speakers
and panels, or meetings with alumni individually or in groups (Pumerantz, 2005).
Social Experiences
In addition to academic experiences, social experiences at colleges and universities
impact the quality of students’ education, shape satisfaction with the university, and may lead to
giving (Baade & Sundberg, 1993; Melchiori, 1988; Mosser; 1993; Spaeth & Greely, 1970;
Szady, 1988; Thomas & Smart, 2005; Volkwein, 1989). Some research looks at what
distinguishes givers from non-givers. Select extracurricular activities are correlated with alumni
giving (Baade & Sundberg, 1993; Monks, 2005; Mosser, 1993). Participation in these activities
may strengthen ties with the institution that subsequently lead to giving (Baade & Sundberg,
1993). For instance, active participation in student government is associated with giving (Baade
& Sundberg, 1993; Monks, 2005; O’Malley, 1992; Thomas & Smart, 2005). Former student
government association (SGA) representatives give 43% more than those who do not participate
(O’Malley, 1992). Involvement with SGA strengthens ties with an institution (Baade &
Sundberg, 1993). It would seem involvement in more competitive groups (i.e., SGA, Student
Alumni Associates, and Program Council) and being the recipient of a campus-wide honor such
as homecoming court leads to satisfaction (Thomas & Smart, 2005), and, in turn, giving.
As an individual extracurricular activity, involvement in fraternities and sororities are
predictors of alumni giving (Bruggink & Siddiqui, 1995; Miller & Casebeer, 1990; Monks, 2005;
Taylor & Martin, 1993; Thomas & Smart, 2005; Young & Fischer, 1996). However, there is
other evidence that found no significant difference in alumni giving for those who participated in
social fraternities and sororities (Gaier, 2005). However, Gaier (2005) reported that alumni
participation was 78% more likely for those in fraternities and sororities and suggested the need
for further research on giving

21
Other significant variables that influence alumni giving include volunteer work and
amount of time watching TV (Young & Fischer, 1996), participation in performing arts/music,
religious groups, or residence hall life (Monks, 2005), and participation in intercollegiate
athletics (Monks, 2005; O’Malley, 1992). In the latter case, athletes were identified as giving
48% more than non-athletes (O’Malley, 1992).
Greater involvement in social, campus leadership, and academic groups is linked to a
likelihood that students will contribute financially as alumni. The number of leadership
opportunities students engage in increases the likelihood they will make lifetime donations
(Outcalt & Skewes-Cox, 2012). Additionally, the more activities students participate in, the
more likely they are to give (Hoyt, 2004; Steeper, 2009; Thomas & Smart, 2005).
Perhaps students who are involved on campus have more time and opportunities to build
relationships that create feelings of connection to the institution (Thomas & Smart, 2005).
Student leaders may be more likely to give back because they have more positive feelings and
fonder memories (Thomas & Smart, 2005). Participation in even one formal student activity
significantly increases the likelihood that alumni will give to the institution and become involved
in the institution (Gaier, 2005). A different study posits that participation in academic groups,
athletic activities, and performance and spiritual events has no significant relationship to alumni
giving, but joining more competitive groups (Student Government, Student Alumni, University
Program Council) does (Thomas & Smart, 2005). Although the relationship between
undergraduate participation and alumni involvement is prevalent in much of the literature, there
is some evidence that non-donors participate more in extracurricular activities (Miller &
Casebeer, 1990) and some support for no correlation at all between giving and extracurricular
activities (Taylor & Martin, 1995).
Relationships are also important when it comes to donations. Alumni are more likely to
give based on the quality of relationships they had while they were students (Mosser, 1993;
Outcalt & Skewes-Cox, 2002; Pumerantz, 2005; Young & Fischer, 1996). Relationships with
other students are likely to influence sociability and involvement as alumni, and therefore giving
(Young & Fischer, 1996). The sense of community can be a driving factor in alumni giving
(Outcalt & Skewes-Cos, 20012). Lastly, involving students in the educational process by having
them embrace the shared educational vision of the institution may lead to giving. This could be

22
accomplished through involving students in the development of the vision, communicating it to
students or creating opportunities to live the vision every day (Baade & Sunderg, 1993).
Alumni Participation
There is a great deal in the literature to support the positive relationship between
undergraduate experiences and alumni involvement with their college or university (Bruggink &
Siddiqui, 1995; Gaier, 2005; Hoyt, 2004; Taylor & Martin, 1993; Young & Fischer 1996).
Alumni participation and giving increase significantly based on the degree of satisfaction with
the undergraduate academic experience (Baade & Sundberg, 1993; Hoyt, 2003; Gaier, 2005;
Gallo & Hubschman, 2003; Mosser, 1993). The literature reveals numerous factors that
influence alumni satisfaction with and involvement in the university (Hartman & Schmidt, 1995;
Hoyt, 2004).
For one, a person’s experience during college may create a special sense of obligation
that results in giving (Hoyt, 2004; Mann, 2007). This sense of obligation is further enhanced by
feelings of allegiance and empathy towards the college (Bruggink & Siddiqui, 1995; Mann,
2007). Giving to help other students may be a purely altruistic motive (Hoyt, 2004), perhaps an
effort to repay an institution for one’s education (Leslie & Ramey, 1988). Alternatively, some
alumni give simply for recognition (Bruggink & Siddiqui, 1995; Mann, 2007) or to improve their
own reputation (reciprocity) (Bruggink & Siddiqui, 1995).
Research indicates that emotional attachment also prompts alumni to contribute
financially to their alma mater (Baade & Sundberg, 1993; Brittingham & Pezzullo, 1989; Gaier,
2005; Gallo & Hubschman, 2003; Spaeth & Greely, 1970; Thomas & Smart, 2005). Attachment
can emerge from a nostalgic feeling born out of traditions (Gaier, 2005; Leslie & Ramey, 1986)
and manifest itself as pride (Baade & Sundberg, 1993; Pumerantz, 2005; Seymour, 1988). A
college’s philosophy of serving as a surrogate family may lead to pride and loyalty (Pumerantz,
2005). Loyalty is another form of emotional attachment alumni have toward their alma mater
(Brittingham & Pezzulo, 1990; Mann, 2007; O’Malley, 1992; Gallo & Hubschman, 2003), that
sometimes manifests itself through the perception of how the university experience shaped their
preparation for life after college and the professional world (Gallo & Hubschman, 2003; Mosser,
1993).
Another factor repeated in the literature leading to alumni giving is a perceived need for
financial support (Hoyt, 2004; Steeper, 2009; Thomas & Smart, 2005). Conversely, the single

23
greatest deterrent to giving is the perception that the university does not need financial support as
much as other organizations (Thomas & Smart, 2005). Alumni with high levels of satisfaction
and who were more involved on campus as undergraduates are more likely to perceive a need for
donations and therefore donate (Hoyt, 2003).
Alumni perceptions are determined by their experiences (Baade & Sundberg, 1993). The
number of alumni or university activities alumni participate in contributes to their attitude about
the institution and their attitude toward the value of their education; both are significant
predictors of giving (Bruggink & Siddiqui, 1995; Gaier (2005); Gallo & Hubschman, 2003;
2005; Hoyt, 2004; Mosser, 1993; Young & Fischer 1996). Alumni involvement could be as
simple as reading alumni publications (Taylor & Martin, 1993) or participating in an off-campus
event (Steeper, 2009).
The quality of relationships is another variable associated with giving (Baade &
Sundberg, 1993; Brittingham & Pezzulo, 1989; Pumerantz, 2005; Spaeth & Greely, 1970;
Steeper, 2009). These can include relationships between students and faculty, as well as
relationships with alumni and faculty. Another form of relationship is with the institution.
Institutions of higher quality make a greater impact on students and therefore create stronger
bonds and a greater willingness to contribute (Baade & Sundberg, 1993). One last type of
relationship is of legacies (Steeper, 2009). They tend to be more satisfied with their relationships
with the university and therefore may be more likely to give (Clotfelter, 2003; O’Malley, 1992).
Feelings about the current state of the institution influence giving. Such feelings include
a concern for the future wellbeing of the university (Gallo & Hubschman, 2003), an interest in
improving the brand value and reputation of the institution (Mann, 2007) and prestige (Leslie &
Ramey, 1988) such as published rankings that lead to the institution being held in high public
regard (Baade & Sundberg, 1993; Leslie & Ramey, 1988). Another indicator of the current state
of the university is the mission and vision of the university and the support for a clear vision and
communicating that vision effectively (Pumerantz, 2005). Students who are most compatible
with the character and mission of the campus from the beginning are more generous (Baade &
Sundberg, 1993).
The final area of influence on alumni giving includes a willingness to give (Hoyt, 2004),
past giving, and donor status. Past giving is highly correlated with continued giving (Hoyt,
2004; Lindahl & Winship, 1992; McDearmond & Shirley, 2009; Mosser, 1993; Okunade &

24
Justice, 1991). Just as the giving status of a donor may lead to additional solicitations by mail or
email, more conversations and visits with institutional fund raisers may influence the likelihood
they will continue to give (Hoyt, 2004; Mosser, 1993).
Much of the literature addresses alumni giving over time. Although there is limited
research on young alumni giving, what work has been done focuses on alumni under 35 years
old or those 10 to 15 years post-graduation (McDearmond & Shirley, 2009; Monks, 2003).
In summary, two types of giving have been explored in the literature. They are charitable
giving in general and alumni financial giving. Three sets of variables influence charitable giving
in general. Demographic factors include gender (Shelley & Polonsky, 2002), age (Shelley &
Polonsky, 2002), socioeconomic status (Bekkers, 2010; O’Malley, 1992), social class (Shelley &
Polonsky, 2002), income (Bekkers, 2010; Melchiori, 1988; Szady, 1988), and urban dwellers
(Bekkers, 2010). Motivation, the second variable that influences giving includes one’s
willingness or propensity to give (Bekkers, 2010; Mann, 2007), a predisposition towards giving
(O’Malley, 1992), educational and family experiences (O’Malley, 1992), and simply feeling
good about oneself (Bekkers, 2010). Capacity to give is influenced by individual or household
income (Bekkers, 2010; Monks, 2003; Thomas & Smart, 2005) and assets and other financial
commitments (Volkwein, 2010; Weerts & Ronca, 2007). Other, more personal factors include
marital or cohabitation status (O’Malley, 1992) and number of dependents or family size
(O’Malley, 1992; Volkwein, 2010; Weerts & Ronca, 2007), ages of children and the schooling of
children and grandchildren (Weerts & Ronca, 2007), and occupational status and highest degree
earned (Bekkers, 2010; Thomas & Smart, 2005; Volkwein, 2010).
Four sets of variables influence alumni financial giving. Demographic variables include
age (Gaier, 2005; Thomas & Smart, 2005), gender (Hoyt, 2004; Monks, 2003), marital status
(Monks, 2003; Mosser, 1993), familial ties to their alma mater (Mosser, 1993; Thomas & Smart,
2005), education (Hoyt, 2004; Steeper, 2009), SES (Hoyt, 2004; Steeper, 2009), and proximity to
the institution (McDearmond & Shirley). Academic experiences, the second variable, include
relationships (Monks, 2003; Pumerantz, 2005), academic programs (Gaier, 2005; Melchiori,
1988; Szady, 1988), academic experiences (Gaier, 2005; Volkwein, 1989), enriching educational
experiences (Pumerantz, 2005), and students’ financial aid status (McDearmond & Shirley,
2009; Monks, 2003). The third variable, social experiences (Thomas & Smart, 2005; Volkwein,
1989) include extracurricular activities (Monks, 2005; Thomas & Smart, 2005), and quality of

25
relationships (Pumerantz, 2005). The final variable, alumni participation includes degree of
satisfaction with the undergraduate academic experience (Gaier, 2005; Mann, 2007), which
creates a variety of positive emotions toward the institution (Pumerantz, 2005; Thomas & Smart,
2005). In addition, perceived need for financial support (Steeper, 2009; Thomas & Smart, 2005),
experiences and involvement with the university (Gaier, 2005; Gallo & Hubschman, 2003),
quality of relationships (Baade & Sundberg, 1993; Pumerantz, 2005), institutional reputation
(Mann, 2007; Pumerantz, 2005), and past giving (Hoyt, 2004; McDearmond & Shirley, 2009) all
influence alumni giving.
There is an abundance of evidence about the demographic characteristics (Hoyt, 2004;
Monks, 2003), academic experiences (Monks, 2003; Pumerantz, 2005), social experiences
(Monks, 2005; Thomas & Smart, 2005; Volkwein, 1989), and alumni participation variables
(Gaier, 2005; Gallo & Hubschman, 2003) that influence giving among alumni in general. It is
also evident that once an alumnus makes a donation to the institution, that person is more likely
to continue to make donations (Hoyt, 2004; McDearmond & Shirley, 2009). Absent in the
literature is research about what prompts recent alumni (within five years of graduation) to give.
My study was designed to address that gap in the literature.

26
Chapter Three
Methodology
The purpose of this study was to examine factors that influence alumni financial giving to
their alma mater within five years of graduation. The conceptual framework I chose for this
study was a modified version of Volkwein’s Model of Alumni Giving (1989). Specifically, I
looked at the degree to which Demographic characteristics, Academic Experiences, and Social
Experiences explained the variance in alumni giving.
Demographic Variables (DV) were defined as sex, international status, racial or ethnic
identification, grades, and parents’ level of education. Academic Experiences (AE) were defined
as the extent of involvement in the curricular experience (e.g., faculty interaction inside and
outside of class, the quality of relationships with faculty and staff, preparation for class,
participation in academic activities and satisfaction with the educational experience). Social
Experiences (SE) were defined as extracurricular activities (e.g., interaction with others,
participation in student organizations, community events, and service).
The sample included alumni from a research extensive university in the mid-Atlantic
region of the United States. Data for the study came from two sources at the selected university.
Specifically, I used National Survey of Student Engagement (NSSE) data gathered from alumni
who graduated in 2011 and provided by the Office of Assessment and Evaluation. Using
specific selection variables, I narrowed the sample to 559 participants. I supplemented the
institutional dataset with information about the five-year giving history of those 559 alumni that I
derived from the Development Office.
This study was designed to answer the following questions:
1. To what extent do demographic factors explain the variance in alumni giving within
five years of graduation?
2. To what extent do academic experiences explain the variance in alumni giving within
five years of graduation?
3. To what extent do social experiences explain the variance in alumni giving within
five years of graduation?
4. To what extent do demographic factors and academic and social experiences explain
the variance in alumni giving within five years of graduation?

27
This chapter describes the methodology used in this study. It begins by describing the
sample selection, instrumentation, and the validity and reliability of the data. I also present the
data collection and analysis procedures.
Sample Selection
This study entailed the use of National Survey of Student Engagement (NSSE) data and
data on alumni giving. The nature of the dataset needed to conduct the study was such that a
case study of a single institution was appropriate. The institution was a public, doctoral research
extensive university with an enrollment of approximately 30,000 students and an alumni
population of approximately 250,000.
The sample consisted of alumni who met six criteria. All participants needed to have
completed the NSSE, to be 20-23 years of age when completing the NSSE, to be classified as a
senior, to have begun their academic career at said institution, to have been a full-time student,
and to have included their student ID number on the NSSE.
First, participants had to have completed the National Survey of Student Engagement
(NSSE) in 2011. Since data for the study came from the NSSE, only those who completed that
instrument were included in the study. There were 2,048 total individuals from the selected
institution who completed the 2011 NSSE survey.
Second, the intent of the study was to examine traditional aged (20-23 years old)
students. Non-traditional aged students may have had different types of experiences than
traditional aged students. In addition, upon graduation, the responsibilities of non-traditional
students might differ from more traditional aged students in terms of their familial and financial
obligations. NSSE asked students to select their birth year, which they recoded to an age
category. The response options reported by NSSE were 1 = 19 or younger, 2 = 20-23, 3 = 24-29,
4 = 30-39, 5 = 40-55, and 6 = Over 55. Only those who responded that they were within the age
range of 20-23 were selected for the study, leaving 775 total respondents. The 2011 NSSE
survey was administered to both first year and senior students. By selecting only those who were
20-23 at the time they completed the survey, I essentially eliminated most of the first year
respondents and dramatically decreased the number of participants remaining in my potential
sample
I did, however, want to confirm that I only selected seniors. This would ensure that
respondents had been out of college for five years at the time of the study. The university only

28
administers the NSSE periodically and the 2011 iteration was the most recent iteration of the
survey that also would allow for respondents to be five years post-graduation. The
corresponding item in the survey asked about their current college classification, with response
options of 1 = Freshman/first year, 2 = Sophomore, 3 = Junior, 4 = Senior, and 5 = Unclassified.
I chose only those respondents who identified themselves as seniors. This left 680 total
respondents in the sample.
Fourth, the intent of the study was to focus on students who had attended only one
institution of higher learning. Students who attended more than one institution may have had an
interest in supporting both of their alma maters and may not have had the same types of
experiences if they transferred from another institution. One item inquired about whether
respondents started their academic career at the current institution with response options 1 =
Started here, and 2 = Started elsewhere. I chose only those respondents who chose started at the
study institution. That reduced the sample to 588 respondents.
Fifth, the participants needed to be full time students. Students who attended part time
may have had different types of experiences and obligations than those who attended full time.
The corresponding item on the instrument elicited information about the current academic term
enrollment with response options of 1 = Less than full-time, and 2 = Full-time. I assumed those
who were enrolled full-time when they completed the NSSE had been enrolled full-time
throughout their collegiate experience so I chose only those who reported they attended full-time
which left 566 respondents in the sample.
Lastly, student IDs needed to be included in the NSSE data so that I could retrieve giving
information from the Development Office at the selected institution. The simplest way to
retrieve data on alumni giving is by student ID number. This number remains intact throughout
the transition from student to alumni status, while other data, such as address, email, and phone
number may change. Once I confirmed that ID numbers were included, there were a total of 566
alumni in the sample at this stage of the process.
Data from the 2011 NSSE survey provided a reasonable potential sample size. It enabled
me to eliminate cases that could not be used because participants did not meet all of the selection
criteria or did not respond to all relevant items on the NSSE and still have a sufficient sample
size to conduct the analysis.

29
Instrumentation
Data for the study primarily came from the NSSE. The NSSE is a unit of the Center for
Postsecondary Research (CPR) at Indiana University. The CPR administers several national
surveys each year. The NSSE elicits information from college and university students about
their participation in campus programs and activities (NSSE Website, 2016). It was
administered to freshmen and seniors at the selected institution in 2006, 2008, 2011, 2014, and
2017. The NSSE is a copyrighted instrument and therefore is not appended in this study. Details
about the NSSE are available at http://nsse.indiana.edu.
For purposes of this study, I used the 2011 survey results. The 2011 NSSE was a
standardized survey made up of two sections that included 29 items with numerous sub-items.
The first section of the instrument consisted of 14 items related to academic and extracurricular
experiences during the school year. The second section of the instrument was made up of 15
demographic items.
I assigned all items into one of four groups: Demographic Variables (DV), Academic
Experiences, (AE), Social Experiences (SE), and a miscellaneous category. The assignment of
these items supported the conceptual framework for the study. That framework indicates that
capacity and motivation to give are influenced by demographic background and prior academic
and social experiences (Volkwein, et al., 1989). I started by looking at the demographic
characteristics that were relevant to my study. I identified five DVs that included sex,
international status, racial or ethnic identification, grades, and highest level of education for
mother and father (which I used as a proxy for socioeconomic status [SES]).
Item 16 asked for the sex of participants with the corresponding response options 1 =
Male and 2 = Female. Item 17 inquired about international status and the response options were
1 = No and 2 =Yes. Item 18 elicited data on racial or ethnic identity. The corresponding
response options were 1) American Indian or other Native American, 2) Asian or Asian
American, 3) Black or African American, 4) White (non-Hispanic), 5) Mexican or Mexican
American, 6) Puerto Rican, 7) Other Hispanic or Latino, 8) Multiracial, 9) other, and 10) I prefer
not to respond. Item 26 inquired about grades at the institution and had the following response
options: 1 = C- or lower, 2 = C, 3 = C+, 4 = B-, 5 = B, 6 = B+, 7 = A-, 8 = A. Item 28 was
broken into two sub-items (for mother and father) and inquired about their highest level of
education. Response options for both were 1 = Did not finish high school, 2 = Graduated from

30
high school, 3 = Attended college but did not complete degree, 4 = Completed an associate’s
degree, 5 = Completed a bachelor’s degree, 6 = Completed a master’s degree, 7 = Completed a
doctoral degree. Table 1 reports the Demographic variables I used in the study, including the
item, the response options, and, if necessary, how responses were recoded.
Next, I identified 14 NSSE items with numerous sub-items that served as Academic
Experiences (AE) for my study. These items focused on interactions with faculty and staff,
academic work, exams, academic activities and experiences, support services, and skills learned.
The first AE item included 20 sub-items that asked respondents how often they engaged in select
student academic experiences at their institution (e.g. interaction with professors, interaction with
classmates, and assignments). The response options included (1) never, (2) sometimes, (3) often,
and (4) very often.
The second AE item included five sub-items that examined mental activities associated
with coursework. Respondents were asked about the extent to which they engaged in activities
like memorizing, analyzing, or making judgments. The response options included (1) very little,
(2) some, (3) quite a bit, and (4) very much.
The third AE item included four sub-items that examined how many books were read and
papers were written by respondents in their most recent academic year. The response options
were 1 = none, 2 = 1-4, 3 = 5-10, 4 = 11-20, and 5 = more than 20.
The fourth AE item consisted of two sub-items that examined the number of hours spent
on homework problem sets. The response options were 1 = none, 2 = 1-2, 3 = 3-4, 4 = 5-6, 5 =
more than 6.
The fifth AE item looked at the extent to which exams challenged respondents to do their
best work. The response option was a Likert-type scale that ranged from 1 = very little to 7 =
very much.
The sixth AE item examined how often a participant had done one of three activities
listed in the sub-items that related to personal learning and understanding. Response options
were 1) never, 2) sometimes, 3) often, and 4) very often for all sub-items.
Item seven elicited information about Academic activities participants had done or
planned to do before graduation. There were seven sub-items relevant to AE such as study
abroad, internships, and other enriching academic experiences. The response options for all
eight sub-items were 1) have not decided, 2) do not plan to do, 3) plan to do, and 4) done.
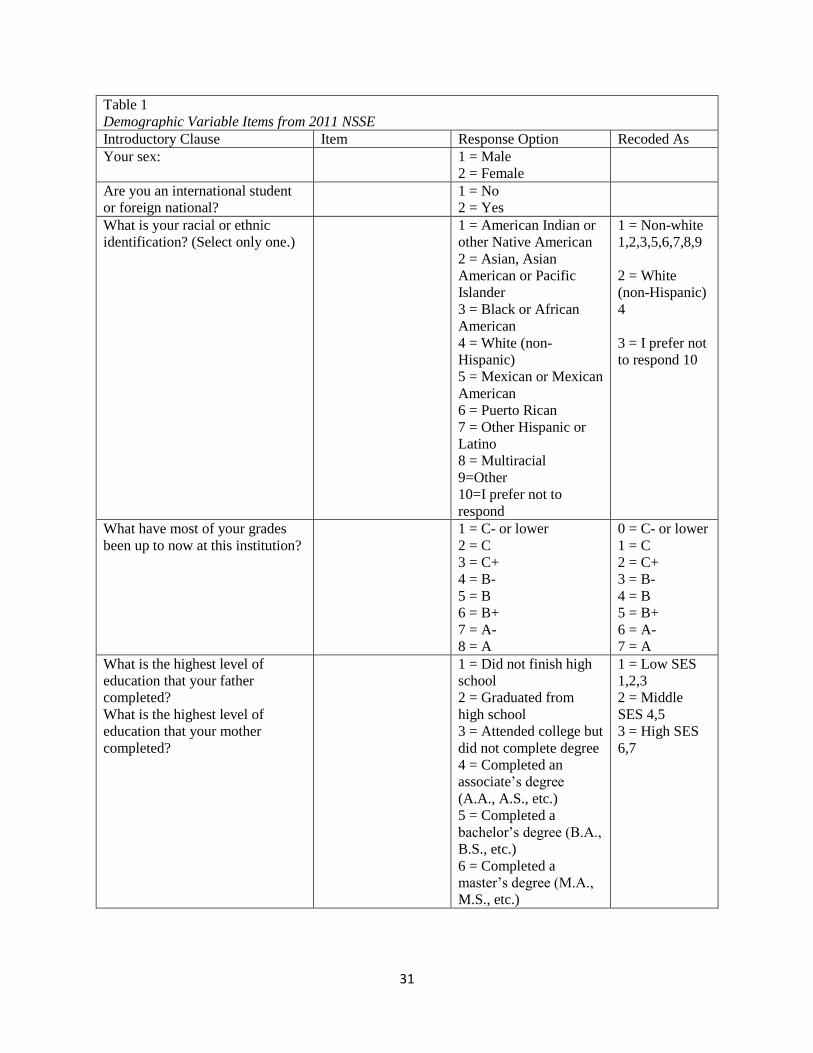
31
Table 1
Demographic Variable Items from 2011 NSSE
Introductory Clause Item Response Option Recoded As
Your sex: 1 = Male
2 = Female
Are you an international student
or foreign national?
1 = No
2 = Yes
What is your racial or ethnic
identification? (Select only one.)
1 = American Indian or
other Native American
2 = Asian, Asian
American or Pacific
Islander
3 = Black or African
American
4 = White (non-
Hispanic)
5 = Mexican or Mexican
American
6 = Puerto Rican
7 = Other Hispanic or
Latino
8 = Multiracial
9=Other
10=I prefer not to
respond
1 = Non-white
1,2,3,5,6,7,8,9
2 = White
(non-Hispanic)
4
3 = I prefer not
to respond 10
What have most of your grades
been up to now at this institution?
1 = C- or lower
2 = C
3 = C+
4 = B-
5 = B
6 = B+
7 = A-
8 = A
0 = C- or lower
1 = C
2 = C+
3 = B-
4 = B
5 = B+
6 = A-
7 = A
What is the highest level of
education that your father
completed?
What is the highest level of
education that your mother
completed?
1 = Did not finish high
school
2 = Graduated from
high school
3 = Attended college but
did not complete degree
4 = Completed an
associate’s degree
(A.A., A.S., etc.)
5 = Completed a
bachelor’s degree (B.A.,
B.S., etc.)
6 = Completed a
master’s degree (M.A.,
M.S., etc.)
1 = Low SES
1,2,3
2 = Middle
SES 4,5
3 = High SES
6,7

32
7 = Completed a
doctoral degree (Ph.D.,
J.D., M.D., etc.)

33
The eighth AE item focused on two sub-items related to relationships. The first sub-item
asked about relationships with faculty and response options ranged from 1 = unavailable,
unhelpful, unsympathetic to 7 = available, helpful, sympathetic. Response options to the sub-
item about relationships with administrative personnel ranged from 1 = unhelpful, inconsiderate,
rigid to 7 = helpful, considerate, flexible.
The ninth item associated with AE examined the number of hours spent during the week
on various activities. For instance, one sub-item asked about preparing for class or rehearsing.
Response options for all of these sub-items were 1 = 0, 2 = 1-5, 3 = 6-10, 4 = 11-15, 5 = 16-20, 6
= 21-25, 7 = 26-30, and 8 = more than 30 hours.
The tenth AE item examined the extent to which respondents’ institution emphasized
academic work. One sub-item inquired about the time needed to succeed academically. Two
other sub-items asked about academic support. Response options were 1) very little, 2) some, 3)
quite a bit, and 4) very much.
The eleventh item focused on contributions the college experience made to knowledge,
skills and personal development. Thirteen sub-items focused on gaining specific academic skills.
Response options were 1) very little, 2) some, 3) quite a bit, and 4) very much.
The twelfth item was about the quality of academic advising. The response options were
1) poor, 2) fair, 3) good, and 4) excellent. The final two items each asked a single question and I
categorized both as AE and SE. Item thirteen asked respondents to rate their entire educational
experience as: 1) poor, 2) fair, 3) good, and 4) excellent. Item 14 asked if respondents could do
it all over again, would they attend the same institution. The response options were 1) definitely
no, 2) probably no, 3) probably yes, and 4) definitely yes.
Table 2 lists all the items and sub-items I designated as Academic Experiences along with
necessary recoding of responses. It should be noted that in some instances, select sub-items were
worded in such a way that reverse scoring was necessary. Those items, and the way there were
recoded, are shaded on the Table.
There were 12 items with numerous sub-items that I chose to represent Social
Experiences (SE). These items focused on social interactions, reading for pleasure, cultural and
community service activities, co-curricular activities, as well as support services and skills
learned.

34
Table 2
Academic Experiences Items from 2011 NSSE
Introductory Clause Item Response Option Recoded As
In your experience at your
institution during the current school
year, about how often have you
done each of the following?
A) Asked questions in
class or contributed to
class discussions
B) Made a class
presentation
C) Prepared two or more
drafts of a paper or
assignment before turning
it in
D) Worked on a paper or
project that required
integrating ideas or
information from various
sources
E) Included diverse
perspectives (different
races, religions, genders,
political beliefs, etc.) in
class discussions or
writing assignments
F) Come to class without
completing readings or
assignments
G) Worked with other
students on projects during
class
H) Worked with
classmates outside of class
to prepare class
assignments
I) Put together ideas or
concepts from different
courses when completing
assignments or during
class discussions
J) Tutored or taught other
students (paid or
voluntary)
K) Participated in a
community-based project
(e.g., service learning) as
part of a regular course
L) Used an electronic
medium (listserve, chat
group, Internet, instant
messaging, etc.) to discuss
or complete an assignment
1 = Never
2 = Sometimes
3 = Often
4 = Very Often
1 = Very Often
2 = Often
3 = Sometimes
4 = Never

35
M) Used e-mail to
communicate with an
instructor
N) Discussed grades or
assignments with an
instructor
O) Talked about career
plans with a faculty
member or advisor
P) Discussed ideas from
your readings or classes
with faculty members
outside of class
Q) Received prompt
written or oral feedback
from faculty on your
academic performance
R) Worked harder than
you thought you could to
meet an instructor's
standards or expectations
S) Worked with faculty
members on activities
other than coursework
(committees, orientation,
student life activities, etc.)
T) Discussed ideas from
your readings or classes
with others outside of class
(students, family members,
co-workers, etc.)
During the current school year,
how much has your coursework
emphasized the following mental
activities?
A) Memorizing facts,
ideas, or methods from
your courses and readings
so you can repeat them in
pretty much the same form
B)Analyzing the basic
elements of an idea,
experience, or theory, such
as examining a particular
case or situation in depth
and considering its
components
C) Synthesizing and
organizing ideas,
information, or
experiences into new,
more complex
interpretations and
relationships
1 = Very little
2 = Some
3 = Quite a bit
4 = Very much
1 = Very little
2 = Some
3 = Quite a bit
4 = Very much
1 = Very much
2 = Quite a bit
3 = Some
4 = Very little

36
D) Making judgments
about the value of
information, arguments, or
methods, such as
examining how others
gathered and interpreted
data and assessing the
soundness of their
conclusions
E)Applying theories or
concepts to practical
problems or in new
situations
During the current school year,
about how much reading and
writing have you done?
A) Number of assigned
textbooks, books, or book-
length packs of course
readings
C) Number of written
papers or reports of 20
pages or more
D) Number of written
papers or reports between
5 and 19 pages
E) Number of written
papers or reports of fewer
than 5 pages
1 = None
2 = 1-4
3 = 5-10
4 = 11-20
5 = More than
20
1 = More than
20
2 = 11-20
3 = 5-10
4 = 1-4
5 = None
In a typical week, how many
homework problem sets do you
complete?
A) Number of problem
sets that take you more
than an hour to complete
B) Number of problem
sets that take you less than
an hour to complete
1 = None
2 = 1-2
3 = 3-4
4 = 5-6
5 = More than 6
1 = More than 6
2 = 5-6
3 = 3-4
4 = 1-2
5 = None
Select the circle that best represents
the extent to which your
examinations during the current
school year have challenged you to
do your best work.
1 = Very little
2 = 2
3 = 3
4 = 4
5 = 5
6 = 6
7 = Very much
1 = Very little
1, 2, 3,
2 = Average 4
3 = Very much
5,6,7
During the current school year,
about how often have you done
each of the following?
D) Examined the strengths
and weaknesses of your
own views on a topic or
issue
E) Tried to better
understand someone else's
views by imagining how
1 = Never
2 = Sometimes
3 = Often
4 = Very often

37
an issue looks from his or
her perspective
F) Learned something that
changed the way you
understand an issue or
concept
Which of the following have you
done or do you plan to do before
you graduate from your institution?
A) Practicum, internship,
field experience, co-op
experience, or clinical
assignment
C) Participate in a learning
community or some other
formal program where
groups of students take
two or more classes
together
D) Work on a research
project with a faculty
member outside of course
or program requirements
E) Foreign language
coursework
F) Study abroad
G) Independent study or
self-designed major
H) Culminating senior
experience (capstone
course, senior project or
thesis, comprehensive
exam, etc.)
1 = Have not
decided
2 = Do not plan
to do
3 = Plan to do
4 = Done
1 = Do not plan
to do
2 = Have not
decided
Select the circle that best represents
the quality of your relationships
with people at your institution.
B) Relationships with
faculty members
C) Relationships with
administrative personnel
and offices
1 = Unavailable,
Unhelpful,
Unsympathetic
7 = Available,
Helpful,
Sympathetic
1 = Unhelpful,
Inconsiderate,
Rigid
7 = Helpful,
Considerate,
Flexible
About how many hours do you
spend in a typical 7-day week
doing each of the following?
A) Preparing for class
(studying, reading, writing,
doing homework or lab
work, analyzing data,
rehearsing, and other
academic activities)
1 = 0
2 = 1-5
3 = 6-10
4 = 11-15
5 = 16-20
6 = 21-25
7 = 26-30

38
8 = More than
30 hours
To what extent does your
institution emphasize each of the
following?
A) Spending significant
amounts of time studying
and on academic work
B) Providing the support
you need to help you
succeed academically
G) Using computers in
academic work
1 = Very little
2 = Some
3 = Quite a bit
4 = Very much
To what extent has your experience
at this institution contributed to
your knowledge, skills, and
personal development in the
following areas?
A) Acquiring a broad
general education
B) Acquiring job or work-
related knowledge and
skills
C) Writing clearly and
effectively
D) Speaking clearly and
effectively
E) Thinking critically and
analytically
F) Analyzing quantitative
problems
G) Using computing and
information technology
H) Working effectively
with others
J) Learning effectively on
your own
K) Understanding yourself
L) Understanding people
of other racial and ethnic
backgrounds
M) Solving complex real-
world problems
N) Developing a personal
code of values and ethics
1 = Very little
2 = Some
3 = Quite a bit
4 = Very much
Overall, how would you evaluate
the quality of academic advising
you have received at your
institution?
1 = Poor
2 = Fair
3 = Good
4 = Excellent
How would you evaluate your
entire educational experience at
this institution?
1 = Poor
2 = Fair
3 = Good
4 = Excellent
If you could start over again, would
you go to the same institution you
are now attending?
1 = Definitely no
2 = Probably no
3 = Probably yes

39
4 = Definitely
yes

40
The first SE item asked respondents how often they engaged in select student experiences
at their institution. Two of the sub-items related to SE and elicited information about whether
respondents had serious conversations with students from a different racial background or that
were different from themselves. The response options included (1) never, (2) sometimes, (3)
often, and (4) very often.
The second SE item contained one sub-item. It asked how many books respondents read
on their own in the most recent academic year. The response options were 1 = none, 2 = 1-4, 3 =
5-10, 4 = 11-20, and 5 = more than 20.
The third item associated with SE examined how often a student had engaged in different
activities listed in the sub-items. Three sub-items included participating in cultural, physical
fitness and spiritual activities. Response options were 1) never, 2) sometimes, 3) often, and 4)
very often for all sub-items.
The fourth item elicited information about social activities students had done or planned
to do before graduation. One sub-item, volunteer work, was included as a SE. The response
options were 1) have not decided, 2) do not plan to do, 3) plan to do, and 4) done.
The fifth item focused on relationships with other students. The Likert-type response
options ranged from 1 = unfriendly, unsupportive, sense of alienation to 7 = friendly, supportive,
sense of belonging.
The sixth item examined the number of hours spent during the week on various activities.
Two sub-items included in SE were social activities and relaxing. Response options were 1 = 0,
2 = 1-5, 3 = 6-10, 4 = 11-15, 5 = 16-20, 6 = 21-25, 7 = 26-30, and 8 = more than 30 hours.
The seventh item examined the extent to which respondents’ institution emphasized a
variety of support services. I categorized as SE four sub-items that focused on support and
activities. Response options were 1) very little, 2) some, 3) quite a bit, and 4) very much.
The eighth item focused on contributions the college experience made to knowledge,
skills and personal development. Two sub-items were categorized as SE and assessed
contributions to community and spirituality. Response options to all sub-items were 1) very
little, 2) some, 3) quite a bit, and 4) very much.
As noted previously, two items each asked a single question and were categorized as both
AE and SE. The ninth asked respondents to rate their entire educational experience as: 1) poor,
2) fair, 3) good, and 4) excellent. The tenth item asked if respondents could do it all over again,
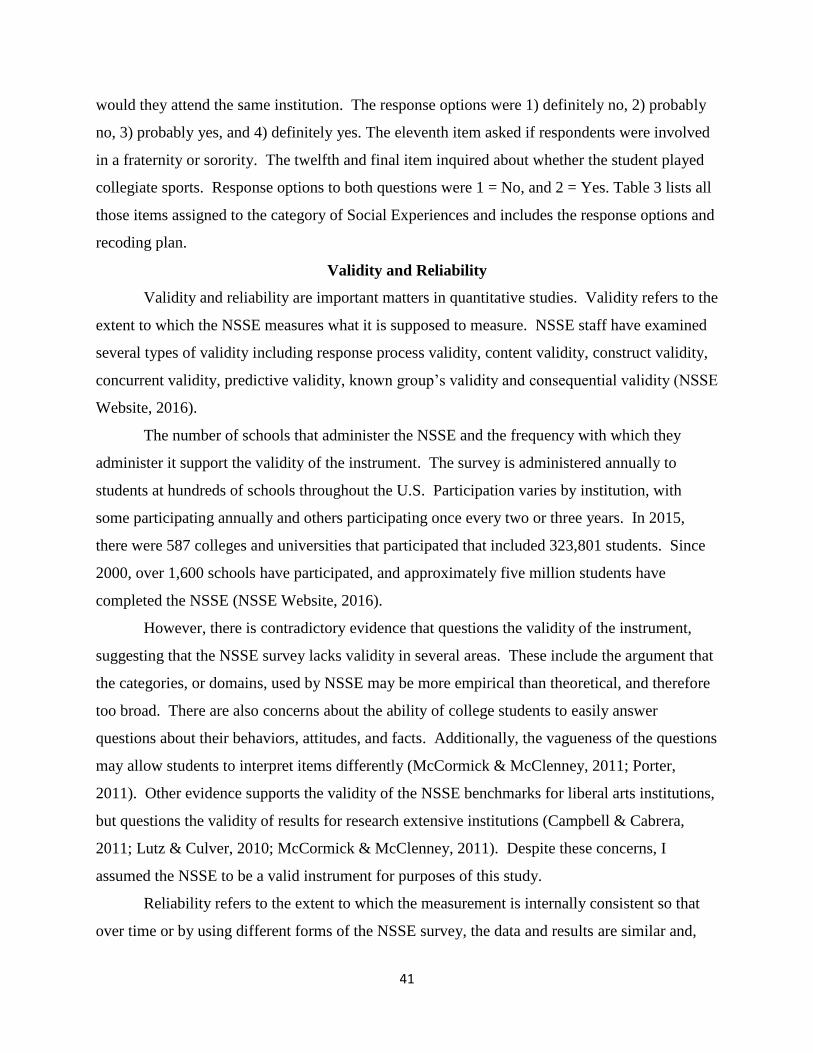
41
would they attend the same institution. The response options were 1) definitely no, 2) probably
no, 3) probably yes, and 4) definitely yes. The eleventh item asked if respondents were involved
in a fraternity or sorority. The twelfth and final item inquired about whether the student played
collegiate sports. Response options to both questions were 1 = No, and 2 = Yes. Table 3 lists all
those items assigned to the category of Social Experiences and includes the response options and
recoding plan.
Validity and Reliability
Validity and reliability are important matters in quantitative studies. Validity refers to the
extent to which the NSSE measures what it is supposed to measure. NSSE staff have examined
several types of validity including response process validity, content validity, construct validity,
concurrent validity, predictive validity, known group’s validity and consequential validity (NSSE
Website, 2016).
The number of schools that administer the NSSE and the frequency with which they
administer it support the validity of the instrument. The survey is administered annually to
students at hundreds of schools throughout the U.S. Participation varies by institution, with
some participating annually and others participating once every two or three years. In 2015,
there were 587 colleges and universities that participated that included 323,801 students. Since
2000, over 1,600 schools have participated, and approximately five million students have
completed the NSSE (NSSE Website, 2016).
However, there is contradictory evidence that questions the validity of the instrument,
suggesting that the NSSE survey lacks validity in several areas. These include the argument that
the categories, or domains, used by NSSE may be more empirical than theoretical, and therefore
too broad. There are also concerns about the ability of college students to easily answer
questions about their behaviors, attitudes, and facts. Additionally, the vagueness of the questions
may allow students to interpret items differently (McCormick & McClenney, 2011; Porter,
2011). Other evidence supports the validity of the NSSE benchmarks for liberal arts institutions,
but questions the validity of results for research extensive institutions (Campbell & Cabrera,
2011; Lutz & Culver, 2010; McCormick & McClenney, 2011). Despite these concerns, I
assumed the NSSE to be a valid instrument for purposes of this study.
Reliability refers to the extent to which the measurement is internally consistent so that
over time or by using different forms of the NSSE survey, the data and results are similar and,

42
Table 3
Social Experiences Items from 2011 NSSE
Introductory Clause Item Response
Option
Recoded
As
In your experience at your institution
during the current school year, about how
often have you done each of the
following?
U) Had Serious conversations
with students of a different race
or ethnicity than your own
V) Had Serious conversations
with students who are very
different from you in terms of
their religious beliefs, political
opinions, or personal values
1 = Never
2 = Sometimes
3 = Often
4 = Very Often
During the current school year, about how
much reading and writing have you done?
B) Number of books read on
your own (not assigned) for
personal enjoyment or academic
enrichment
1 = None
2 = 1-4
3 = 5-10
4 = 11-20
5 = More than
20
During the current school year, about how
often have you done each of the
following?
A) Attended an art exhibit, play,
dance, music, theater, or other
performance
B) Exercised or participated in
physical fitness activities
C) Participated in activities to
enhance your spirituality
(worship, meditation, prayer,
etc.)
1 = Never
2 = Sometimes
3 = Often
4 = Very often
Which of the following have you done or
do you plan to do before you graduate
from your institution?
B) Community service or
volunteer work
1 = Have not
decided
2 = Do not plan
to do
3 = Plan to do
4 = Done
1 = Do not
plan to do
2 = Have
not decided
Select the circle that best represents the
quality of your relationships with people
at your institution.
A) Relationships with other
students
1 = Unfriendly,
Unsupportive,
Sense of
alienation
7 = Friendly,
Supportive,
Sense of
belonging

43
About how many hours do you spend in a
typical 7-day week doing each of the
following?
D) Participating in co-curricular
activities (organizations,
campus publications, student
government, fraternity or
sorority, intercollegiate or
intramural sports, etc.)
E) Relaxing and socializing
(watching TV, partying, etc.)
1 = 0
2 = 1-5
3 = 6-10
4 = 11-15
5 = 16-20
6 = 21-25
7 = 26-30
8 = More than 30
hours
To what extent does your institution
emphasize each of the following?
C) Encouraging contact among
students from different
economic, social, and racial or
ethnic backgrounds
D) Helping you cope with your
non-academic responsibilities
(work, family, etc.)
E) Providing the support you
need to thrive socially
F) Attending campus events and
activities (special speakers,
cultural performances, athletic
events, etc.)
1 = Very little
2 = Some
3 = Quite a bit
4 = Very much
To what extent has your experience at this
institution contributed to your knowledge,
skills, and personal development in the
following areas?
O) Contributing to the welfare
of your community
P) Developing a deepened sense
of spirituality
1 = Very little
2 = Some
3 = Quite a bit
4 = Very much
How would you evaluate your entire
educational experience at this institution?
1 = Poor
2 = Fair
3 = Good
4 = Excellent
If you could start over again, would you
go to the same institution you are now
attending?
1 = Definitely
no
2 = Probably no
3 = Probably
yes
4 = Definitely
yes
Are you a member of a social fraternity or
sorority?
1 = No
2 = Yes
Are you a student-athlete on a team
sponsored by your institution’s athletics
department?
1 = No
2 = Yes

44
therefore, generalizable to populations (NSSE Website, 2016). Reliability also refers to the
consistency or stability of measurement. The reliability evidence assesses the extent to which
items within a scale are internally consistent or homogenous and the extent to which results are
similar across periods of time or different forms of the instrument. Use of a reliable instrument
or scale implies that data and results can be reproduced. NSSE administrators have tested for
several types of reliability including internal consistency, temporal stability, and equivalence
(NSSE Website, 2016). The consistency for the majority of questions and answers has remained
stable since 2000, indicating that the instrument is reliable.
Data Collection
To start the data collection process, I obtained approval from the Institutional Review
Board (IRB) for Research Involving Human Subjects at the institution of study. The approval
letter appears in Appendix A.
Then, I collected the 2011 NSSE dataset from the target institution. The Office of
Assessment and Evaluation manages this dataset. I requested and received from staff in that
office the complete 2011 NSSE dataset. This included responses from the 2,048 students who
completed the instrument that year.
The next step in the data collection process involved getting approval from staff in the
Development Office on campus to share their data. I was required to sign a Non-Disclosure
Agreement to keep the study institution from being named publicly and to ensure that
confidential information would not be shared with anyone. Once I had completed the sample
selection process, I sent the dataset to the Development staff. I asked for the five-year giving
history for each respondent in the data set, by year and cumulatively for the five-year period.
Since the data set was from 2011, I asked for 2011-2015 giving records. Student IDs were
included in the data set sent to the Development Office but removed by Development staff
before the data set was returned to me. At the end of this process, I had a dataset that included
2011 NSSE responses from 566 eligible participants along with the giving history of those
participants.
Data Analysis Procedure
Secondary analysis was used in this study, meaning the analysis was conducted on
previously collected data. My goal was to answer new questions using data that already existed.
The data analysis for the current study was performed in a series of steps. First, I cleaned the

45
data. I then eliminated those items from the dataset that I categorized as miscellaneous. Since I
already used the selection variable “began at the study institution,” I eliminated one variable with
5 sub-items related to other types of schools the participants might have attended since
graduating high school. Similarly, I eliminated items about veteran status and veteran pay, as
well as the item about taking all classes on line. I also eliminated questions around disabilities,
major, and athletic team because of the number of missing cases. Lastly, I eliminated “hours
working” and “distance living from campus.” Next, I deleted all missing responses coded as
NULL, and left those cells blank. I then removed seven participants (from my sample of 566)
whose data were missing more than 10 responses but left in those participants with 10 or fewer
missing responses. This left 559 eligible participants in my final sample. Since there were
missing responses in some cases, this resulted in different sample sizes for different items in my
analysis.
The second step in the data analysis procedure involved recoding the data and creating
proxies, as necessary. For Demographic Variables (DV) (see Table 1), I collapsed eight racial or
ethnic identification items, and recoded as 1 = nonwhite, 2 = white and 3 = I prefer not to
respond. Then I recoded eight grade identification items with response options of 1 to 8 to 0 to
7.
Next, I created a proxy for SES. Item number 27 asked respondents for highest level of
education completed by a) their father, and b) their mother. Response options were, 1) did not
finish high school, 2) graduated from high school, 3) attended college, but did not complete
degree, 4) completed an associate’s degree, 5) completed a bachelor’s degree, 6) completed a
master’s degree, and 7) completed a doctoral degree. I created a composite score for each
respondent by adding the responses for father’s and mother’s level of education. For example, if
a participant’s mother completed a bachelor’s degree (5) and father completed an associate’s
degree (4), the composite score for that participant was 9. Therefore, the possible scores for SES
ranged from 2-14. I assigned composite scores to groups, based on common sense. Low SES
included those respondents who had scores of 2-6 (neither parent completed college); middle
SES scores ranged from 7-10 (at least one parent completed college); and high SES ranged from
11-14 (at least one parent completed a masters or doctoral degree).
Within the Academic Experience, items (AE) (see Table 2) I reverse coded six variables
by inverting the response options to align with other questions in the instrument where the

46
positive response was a higher number. For example, one item asked, “In your experience at
your institution during the current school year, about how often have you done each of the
following? One sub-item asked how often the respondent had “Come to class without
completing readings or assignments,” I recoded the response options 1 = Never, 2 = Sometimes,
3 = Often and 4 = Very Often to 1 = Very Often, 2 = Often, 3 = Sometimes, and 4 = Never so
that the preferred response corresponded with a higher score. Another item asked, “During the
current school year, how much has your coursework emphasized the following mental
activities?” Two sub items regarding “memorizing facts” and “analyzing the basic elements of
an idea” were recoded from 1 = Very Little, 2 = Some, 3 = Quite a bit, and 4 = Very much to 1 =
Very much, 2 = Quite a bit, 3 = Some, and 4 = Very little. Another Item asked, “During the
current school year, about how much reading and writing have you done.” Two of the sub items
were recoded from 1 = None, 2 = 1-4, 3 = 5-10, 4 = 11-20, and 5 = More than 20 to 1 = More
than 20, 2 = 11-20, 3 = 5-10, 4 = 1-4, and 5 = None. In a similar question, “In a typical week,
how many homework problem sets do you complete?” a sub-item asked about the “Number of
problem sets that take you less than an hour to complete.” I recoded responses to 1 = More than
6, 2 = 5-6, 3 = 3-4, 4 = 1-2 and 5 = None. The next question, “Select the circle that best
represents the extent to which your examinations during the current year have challenged you to
do your best work” were recoded to 1, 2, 3 = Very little, 4 = Average, and 5, 6, 7 = Very much.
Lastly, in AE items, when asked whether respondents have done or plan to do before they
graduate, I reversed responses 1 = Have not decided and 2 = Do not plan to do.
There was one SE item that needed to be recoded. When asked about activities
respondents had done or planned to do, the response options were 1 = Have not decided, 2 = Do
not plan to do, 3 = Plan to do, and 4 = Done. I reversed responses 1 and 2 since “Do not plan to
do”: was a less desirable response than “Have not decided” (see Table 3).
The third step in the analysis process involved exploratory factor analysis. First, I
conducted an exploratory factor analysis on academic and social variables to identify those items
and sub-items that seemed to form a factor that measured something. I took several steps with
each set of variables to identify factors to use in my study. To start, I ran a Varimax Rotated
Factor Matrix to determine the correlation of items. I sought an alpha of .5 or higher. In cases
where I did not achieve the .5 threshold, I eliminated items from the factor until the alpha score
achieved that level as long as there were at least three items that comprised that factor, and none

47
of the items in the factor loaded on other factors at a level higher than .3. I also analyzed the
Kaiser-Meyer-Olkin measure of sampling adequacy, which determines the appropriateness of the
factor analysis. A measure of 0.5-1.0 is adequate for the items to proceed through the factor
analysis. In addition, I ran a Scree Plot for each set of variables to further understand the data.
For Academic Experiences there was correlation between 26 of 64 items. The Kaiser-
Meyer-Olkin result (.883) fell within the appropriate range to move forward with the analysis.
From the Varimax Rotation (see Table 4) analysis and Scree Plot (see Figure 2), five factors
emerged: Personal Gains, Faculty Interactions, Cognitive Activities, Examine Views and Class
Assignments.
For Social Experiences there was correlation between 11 of 20 items. This Kaiser-
Meyer-Olkin result (.754) also fell within the appropriate range to move forward. From this
Figure 2. Scree Plot for Academic Experiences

48
Table 4
Summary of Exploratory Factor Analysis Results for Academic Experiences (N= 559) Item Personal Gains Faculty
Interactions
Cognitive
Activities
Examine Views Class
Assignments
Asked questions
in class or
contributed to
class discussions
.078 .404 .155 .079 .164
Made a class
presentation .145 .221 .081 .007 .087
Prepared two or
more drafts of a
paper or
assignment
before turning it
in
.177 .236 .123 .021 .110
Worked on a
paper or project
that required
integrating ideas
or information
from various
sources
.114 .283 .262 .129 .258
Included diverse
perspectives
(different races,
religions,
genders, political
beliefs, etc.) in
class discussions
or writing
assignments
.221 .305 .106 .169 .300
Come to class
without
completing
readings or
assignments
-.068 -.084 -.051 .162 -.043
Worked with
other students on
projects during
class
.180 .097 .109 .174 .033
Worked with
classmates
outside of class
to prepare class
assignments
.138 .006 .079 -.068 .014
Put together
ideas or concepts
from different
courses when
.169 .286 .331 .163 .134

49
completing
assignments or
during class
discussions
Tutored or
taught other
students (paid or
voluntary)
.020 .174 .098 .082 .046
Participated in a
community-
based project
(e.g., service
learning) as part
of a regular
course
.136 .111 .043 .100 .138
Used an
electronic
medium (listsev,
chat group,
Internet, instant
messaging, etc.)
to discuss or
complete an
assignment
.099 .156 .175 .102 .077
Used e-mail to
communicate
with an
instructor
.100 .312 .104 .058 .092
Discussed grades
or assignments
with an
instructor
.173 .509 .113 .020 .019
Talked about
career plans with
a faculty
member or
advisor
.169 .695 .064 .092 .018
Discussed ideas
from your
readings or
classes with
faculty members
outside of class
.058 .624 .161 .161 .032
Received prompt
written or oral
feedback from
faculty on your
academic
performance
.264 .310 .226 .105 .076

50
Worked harder
than you thought
you could to
meet an
instructor's
standards or
expectations
.171 .209 .123 .063 .037
Worked with
faculty members
on activities
other than
coursework
(committees,
orientation,
student life
activities, etc.)
.151 .504 .043 .100 .052
Discussed ideas
from your
readings or
classes with
others outside of
class (students,
family members,
co-workers, etc.)
.102 .398 .083 .359 -.025
Memorizing
facts, ideas, or
methods from
your courses and
readings so you
can repeat them
in pretty much
the same form
.019 .029 -.030 .019 .077
Analyzing the
basic elements
of an idea,
experience, or
theory, such as
examining a
particular case or
situation in
depth and
considering its
components
.203 .109 .608 .013 .080
Synthesizing and
organizing ideas,
information, or
experiences into
new, more
complex
.232 .197 .741 .076 .089

51
interpretations
and relationships
Making
judgments about
the value of
information,
arguments, or
methods, such as
examining how
others gathered
and interpreted
data and
assessing the
soundness of
their conclusions
.231 .100 .577 .181 .079
Applying
theories or
concepts to
practical
problems or in
new situations
.399 .156 .475 .011 .074
Number of
assigned
textbooks,
books, or book-
length packs of
course readings
.027 .159 .059 .087 .531
Number of
written papers or
reports of 20
pages or more
.027 -.052 .133 .006 .363
Number of
written papers or
reports between
5 and 19 pages
.045 .000 .089 .055 .719
Number of
written papers or
reports of fewer
than 5 pages
.118 .022 .031 .031 .682
Number of
problem sets that
take you more
than an hour to
complete
-.045 -.046 -.008 .027 -.013
Number of
problem sets that
take you less
than an hour to
complete
.053 .050 .012 .103 .109

52
Select the circle
that best
represents the
extent to which
your
examinations
during the
current school
year have
challenged you
to do your best
work.
.289 .048 .076 -.091 .011
Examined the
strengths and
weaknesses of
your own views
on a topic or
issue
.031 .147 .040 .784 .124
Tried to better
understand
someone else's
views by
imagining how
an issue looks
from his or her
perspective
.101 .118 .095 .765 .049
Learned
something that
changed the way
you understand
an issue or
concept
.182 .189 .113 .573 .071
Practicum,
internship, field
experience, co-
op experience, or
clinical
assignment
-.013 .072 -.012 -.083 -.022
Participate in a
learning
community or
some other
formal program
where groups of
students take
two or more
classes together
.005 .212 .007 .052 .024
Work on a
research project
with a faculty
-.018 .194 .049 .023 .123

53
member outside
of course or
program
requirements
Foreign
language
coursework
.006 .126 .018 -.003 .023
Study abroad
.049 .020 -.058 .076 .026
Independent
study or self-
designed major
.029 .289 .045 .141 -.053
Culminating
senior
experience
(capstone
course, senior
project or thesis,
comprehensive
exam, etc.)
.051 .008 .039 .067 -.041
Relationships
with faculty
members
.429 .299 .114 .064 .037
Relationships
with
administrative
personnel and
offices
.422 .112 .060 -.024 .020
Preparing for
class (studying,
reading, writing,
doing homework
or lab work,
analyzing data,
rehearsing, and
other academic
activities)
-.043 .046 .071 .038 .014
Spending
significant
amounts of time
studying and on
academic work
.237 .021 .137 .002 -.084
Providing the
support you need
to help you
succeed
academically
.506 .096 .052 -.068 .048
Using computers
in academic
work
.172 .083 .012 .091 .052

54
Acquiring a
broad general
education
.535 .035 .095 .104 .081
Acquiring job or
work-related
knowledge and
skills
.639 .069 .119 .005 -.021
Writing clearly
and effectively .631 .088 .109 .020 .220
Speaking clearly
and effectively .688 .132 .115 -.012 .108
Thinking
critically and
analytically
.657 .053 .288 .098 .080
Analyzing
quantitative
problems
.482 -.130 .170 .023 -.008
Using computing
and information
technology
.446 -.065 .189 .090 -.164
Working
effectively with
others
.670 .101 .045 .022 .043
Learning
effectively on
your own
.546 .069 .146 .078 .043
Understanding
yourself .652 .061 -.007 .161 -.016
Understanding
people of other
racial and ethnic
backgrounds
.674 .124 .042 .214 .037
Solving complex
real-world
problems
.702 .103 .172 .091 -.007
Developing a
personal code of
values and ethics
.720 .168 .081 .133 .029
Overall, how
would you
evaluate the
quality of
academic
advising you
have received at
your institution?
.422 .077 .032 -.133 .030
How would you
evaluate your
entire
.642 .014 .123 -.075 .072

55
educational
experience at
this institution?
If you could start
over again,
would you go to
the same
institution you
are now
attending?
.458 -.005 .083 -.039 -.050
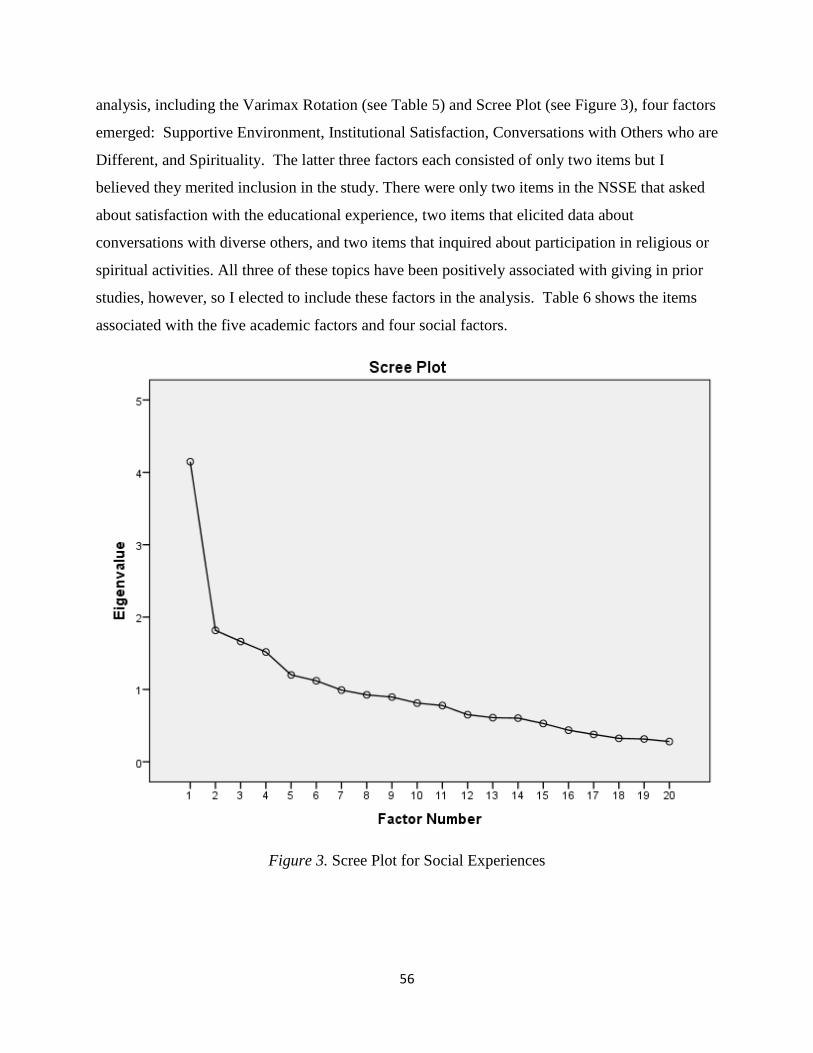
56
analysis, including the Varimax Rotation (see Table 5) and Scree Plot (see Figure 3), four factors
emerged: Supportive Environment, Institutional Satisfaction, Conversations with Others who are
Different, and Spirituality. The latter three factors each consisted of only two items but I
believed they merited inclusion in the study. There were only two items in the NSSE that asked
about satisfaction with the educational experience, two items that elicited data about
conversations with diverse others, and two items that inquired about participation in religious or
spiritual activities. All three of these topics have been positively associated with giving in prior
studies, however, so I elected to include these factors in the analysis. Table 6 shows the items
associated with the five academic factors and four social factors.
Figure 3. Scree Plot for Social Experiences

57
Table 5
Summary of Exploratory Factor Analysis Results for Social Experiences (N= 559) Supportive
Environment
Institutional
Satisfaction
Conversations with Others
who are Different
Spirituality
Had Serious conversations
with students of a different
race or ethnicity than your
own
.067 .039 .875 -.029
Had Serious conversations
with students who are very
different from you in terms
of their religious beliefs,
political opinions, or
personal values
.071 .060 .782 -.018
Number of books read on
your own (not assigned) for
personal enjoyment or
academic enrichment
.009 -.025 .140 .114
Attended an art exhibit, play,
dance, music, theater, or
other performance
.168 -.007 .237 .025
Exercised or participated in
physical fitness activities
.072 .155 .025 .082
Participated in activities to
enhance your spirituality
(worship, meditation, prayer,
etc.)
.016 .040 -.012 .756
Community service or
volunteer work
.009 .066 .061 .090
Relationships with other
students
.179 .484 .075 .014
Participating in co-curricular
activities (organizations,
campus publications, student
government, fraternity or
sorority, intercollegiate or
intramural sports, etc.)
.102 .046 .083 .057
Relaxing and socializing
(watching TV, partying, etc.)
.044 .061 .012 -.135
Encouraging contact among
students from different
economic, social, and racial
or ethnic backgrounds
.616 .193 .160 .096
Helping you cope with your
non-academic
responsibilities (work,
family, etc.)
.787 .117 .061 .047
Providing the support you
need to thrive socially
.757 .178 .004 .087

58
Attending campus events
and activities (special
speakers, cultural
performances, athletic
events, etc.)
.594 .266 .026 -.014
Contributing to the welfare
of your community
.518 .291 .075 .157
Developing a deepened
sense of spirituality
.326 .116 .020 .669
How would you evaluate
your entire educational
experience at this
institution?
.302 .738 -.001 .004
If you could start over again,
would you go to the same
institution you are now
attending?
.203 .695 -.017 .049
Are you a member of a
social fraternity or sorority?
-.048 .027 -.040 -.200
Are you a student-athlete on
a team sponsored by your
institution’s athletics
department?
.038 -.009 -.010 .024

59
Table 6
Items Associated with Academic and Social Factors
Type Factor Items
Academic
Experience
Variables
Personal Gains
Providing the support you need to help you succeed
academically
Acquiring a broad general education
Acquiring job or work-related knowledge and skills
Writing clearly and effectively
Speaking clearly and effectively
Thinking critically and analytically
Working effectively with others
Learning effectively on your own
Understanding yourself
Understanding people of other racial and ethnic
backgrounds
Solving complex real-world problems
Developing a personal code of values and ethics
How would you evaluate your entire educational
experience at this institution?
Faculty
Interactions
Discussed grades or assignments with an instructor
Talked about career plans with a faculty member or advisor
Discussed ideas from your readings or classes with faculty
members outside of class
Worked with faculty members on activities other than
coursework (committees, orientation, student life activities,
etc.)
Cognitive Activities
Analyzing the basic elements of an idea, experience, or
theory, such as examining a particular case or situation in
depth and considering its components
Synthesizing and organizing ideas, information, or
experiences into new, more complex interpretations and
relationships
Making judgments about the value of information,
arguments, or methods, such as examining how others
gathered and interpreted data and assessing the soundness
of their conclusions
Examine Views
Examined the strengths and weaknesses of your own views
on a topic or issue
Tried to better understand someone else's views by
imagining how an issue looks from his or her perspective

60
Learned something that changed the way you understand
an issue or concept
Class Assignments
Number of assigned textbooks, books, or book-length
packs of course readings
Number of written papers or reports between 5 and 19
pages
Number of written papers or reports of fewer than 5 pages
Social Experience
Variables
Supportive
Environment
Encouraging contact among students from different
economic, social, and racial or ethnic backgrounds
Helping you cope with your non-academic responsibilities
(work, family, etc.)
Providing the support you need to thrive socially
Attending campus events and activities (special speakers,
cultural performances, athletic events, etc.)
Contributing to the welfare of your community
Institutional
Satisfaction
How would you evaluate your entire educational
experience at this institution?
If you could start over again, would you go to the same
institution you are now attending?
Conversations with
Others who are
Different
Had Serious conversations with students of a different race
or ethnicity than your own
Had Serious conversations with students who are very
different from you in terms of their religious beliefs,
political opinions, or personal values
Spirituality
Participated in activities to enhance your spirituality
(worship, meditation, prayer, etc.)
Developing a deepened sense of spirituality

61
Next, using the five-year giving data provided by staff in the Development office, I
created a mean dollar amount of contributions made by each participant. Finally, I analyzed the
data to address the research questions in the study. I conducted a multiple regression to
determine if variance in the dependent variable, dollar amount given, was the result of any of
the independent variables: demographic characteristics, academic experiences or social
experiences during college. I ran a regression model that included demographic variables and
academic experiences and social experiences.
In conclusion, the current study was designed to examine whether undergraduate student
involvement influences alumni financial giving to their alma mater. Demographic Variables,
Academic Experiences, and Social Experiences were examined to determine if they could predict
variance in alumni financial giving. The methodology used in this chapter provided the
necessary data to answer the research questions posed in the study.

62
Chapter Four
Results of Study
This chapter is designed to report the results of the study. First the sample is described.
Next, I present the results of the data analysis to determine if young alumni giving is influenced
by demographic characteristics and/or academic and/or social experiences. The analysis enabled
me to address the four research questions posed in the study.
Sample
The data for this study were derived from an institutional data set of responses to the
2011 NSSE survey. The original sample of 2,048 was reduced by selecting only those
respondents who were between the age of 20-23, were seniors, had only attended one institution,
and who attended as a full-time student. After further eliminating cases with 10 or more missing
responses, the final sample consisted of 559 participants.
The sample consisted of more females (52%) than males (48%). The enrollment numbers
at the institution were females 43% and males 57%, so women were overrepresented in the
sample. The participants were almost exclusively American (98.5%) and mostly white (85%).
Most of the respondents had grades of B- or better (89%) with a much smaller number reporting
a C+ or lower (11%). The vast majority (87.75%) were from medium or high SES backgrounds
(as measured by parents’ educational levels). A small number of students (16%) were members
of a fraternity or sorority, and even fewer were athletes (3%). A description of the sample is
included in Table 7. The table also indicates only a limited number of participants made a
donation to their alma mater within five years of graduating (14%); most (86%) did not.
Results of Data Analysis
Before I ran the regression analysis I took two other steps. First, I prepared the data on
demographic characteristics. I created dummy variables for sex, international status, race or
ethnic identification, grades and SES. Both sex and international status had two response options
and used the following dummy variables: dsex was 0=male and 1=female and dinternat was
0=American and 1=non-American. Race or ethnicity and SES were both recoded (as described
in Chapter Three) and then dummy coded. For race or ethnicity I coded: dnonwhite where
0=white or no response and 1=nonwhite and dnoracereported where 0=white or nonwhite and
1=no response. For SES I coded: dmedses where 0=low or high SES and 1=middle SES and
dlowses where 0=medium or high SES and 1=low SES. Grades were recoded from 1 to 8

63
Table 7 Demographic Characteristics of the Sample (N=559)
Characteristic N %
Giving
Givers 81 14.49
Non-Givers 478 85.51
Sex
Male 269 48.12
Female 290 51.88
International Student
American 549 98.21
International 8 1.43
Racial or Ethnic Identity
White 477 85.33
Non-White 82 14.67
Grades
A 111 19.86
B 110 19.68
B+ 137 24.51
B- 116 20.75
C+ 46 8.23
C 13 2.33
C- or Lower 1 0.18
SES
High SES 230 41.14
Medium SES 257 45.97
Low SES 68 12.16
Fraternity/Sorority Member
Member 90 16.10
Non-Member 468 83.72
Student Athlete
Athlete 15 2.68

64
response options to 0 to 7 and remained a continuous variable.
Second, I created composite scores for each factor. I assumed equal weighting among
items in creating those composite scores. The composite consisted of the mean of the sum of
scores for items in each factor. For example, one academic factor, Faculty Interactions, was
made up of four items: Discussed grades or assignments with an instructor; Talked about career
plans with a faculty member or advisor; Discussed ideas from your readings or classes with
faculty members outside of class; and Worked with faculty members on activities other than
coursework (committees, orientation, student life activities, etc.). If a participant responded to
those items with ratings of 3, 4, 2, 3, the mean score of items would be 3 (3 +4+2+3=12, 12
divided by 4 =3). I created a composite score for five Academic factors (Personal Gains, Faculty
Interactions, Cognitive Activities, Examine Views, Class Assignments) and four Social factors
(Supportive Environment, Institutional Satisfaction, Conversations with Others who are
Different, Spirituality).
Next I ran a regression analysis. I started by conducting regression analysis for the
dependent variable giving and the independent variables for demographic characteristics that
included sex, international student, racial or ethnic identification, grades and father’s and
mother’s education (SES). The formula looked like:
Givingi = β0 + β1 * dsex + β2 * dinternat + β3 * dnonwhite + β4 * dnoracereported +
Β5 * recodedgrades + β6 * dmedses + β7 * dlowses
Then, I expanded the formula by adding independent variables for Academic factors:
β 8 * com_apersonalgains_mean + β9 * com_afacultyinteraction_mean + β10 *
com_acognact_mean + β11 * com_aexamineviews_mean + β12 *
com_aclassassignment_mean
Finally, I added independent variables for Social factors to the formula:
β13 * com_ssuppenviron_mean + β14 * com_sinstsatisf_mean + β15 *
com_sdifference_mean + β16 * com_spirit_mean + Ei

65
I ran the regression analysis which revealed interesting results. The first research
question in the study sought to determine to what degree demographic factors explain the
variance in alumni giving within five years of graduation. The analysis revealed that none of the
five demographic variables were significant at the .05 level. Significance ranged from .324 to
.991.
The second research question focused on the extent that academic experiences explain the
variance in alumni giving within five years of graduating. One of the five academic factors,
Personal Gains, included 13 items and I wanted to be sure those items could not be further
collapsed into more than a single factor. Therefore, after conducting the initial exploratory factor
analysis using a Varimax rotation, I conducted the exploratory factor analysis again to see if I
could reduce the number of items in that factor, but the results indicated that all 13 items should
remain in that factor. One of the five academic factors, Class Assignments, was significant at
.028. The items in this factor asked about the number of assigned books, and number of written
papers between 5 and 19 pages and fewer than 5 pages. (see Table 6). The results of the other
four factors were not significant at the .05 level.
The third research question sought to determine if social experiences explain the variance
in alumni giving within five years of graduating. Three of the four social factors consisted of
only two items: Institutional Satisfaction, Conversations with Others who are Different, and
Spirituality. In each of these factors, there were only two items in the NSSE that asked about
these topics. Additionally, all three were cited in prior literature as associated with giving.
Hence, I included them in the regression analysis. Even so, none of the four factors identified
were significant at the .05 level.
The final research question examined the degree to which demographic, academic and
social factors collectively explained the variance in giving. The analysis revealed that these
variables accounted for a non-significant degree (2.9%) of variance (R2 = 0.29). It is important
to note that this model explains only about 3% of variance in giving. Obviously, more research
is needed to explore what influences young alumni to contribute to their alma mater. The results
of the analysis are reported in Table 8.
In summary, it would appear that demographic characteristics and academic and social
factors determined from NSSE are not particularly useful in explaining the giving by young
alumni.
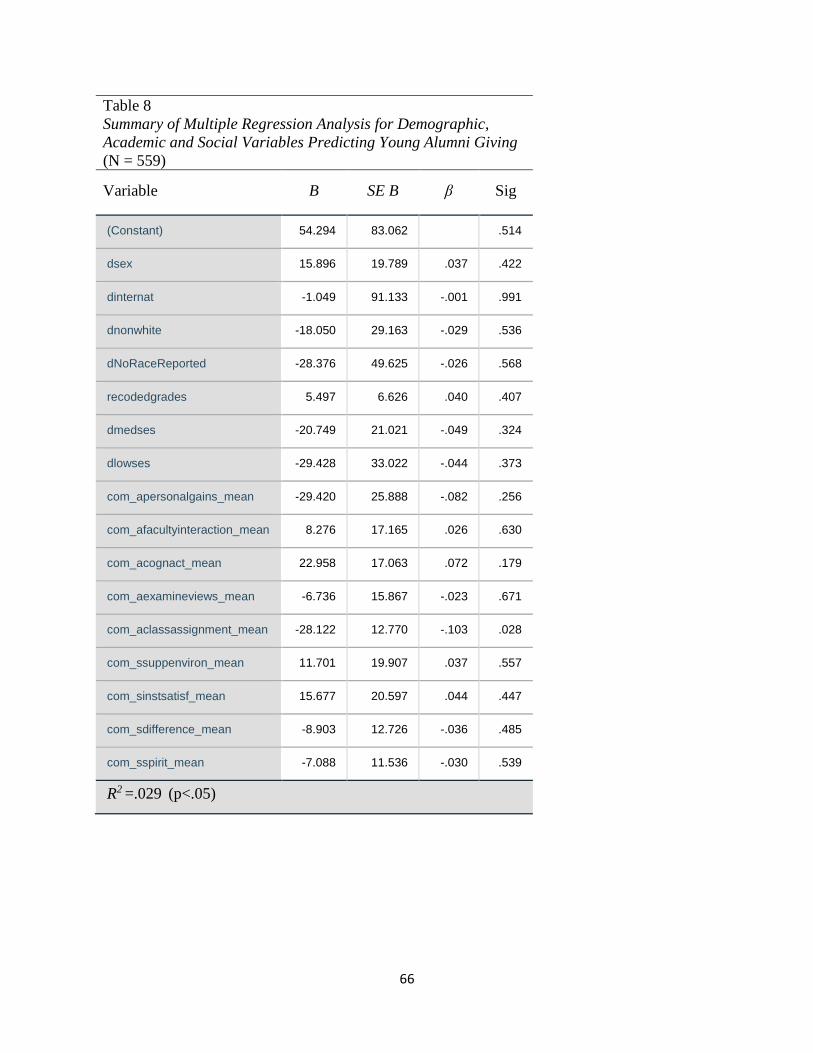
66
Table 8
Summary of Multiple Regression Analysis for Demographic,
Academic and Social Variables Predicting Young Alumni Giving
(N = 559)
Variable B SE B β Sig
(Constant) 54.294 83.062 .514
dsex 15.896 19.789 .037 .422
dinternat -1.049 91.133 -.001 .991
dnonwhite -18.050 29.163 -.029 .536
dNoRaceReported -28.376 49.625 -.026 .568
recodedgrades 5.497 6.626 .040 .407
dmedses -20.749 21.021 -.049 .324
dlowses -29.428 33.022 -.044 .373
com_apersonalgains_mean -29.420 25.888 -.082 .256
com_afacultyinteraction_mean 8.276 17.165 .026 .630
com_acognact_mean 22.958 17.063 .072 .179
com_aexamineviews_mean -6.736 15.867 -.023 .671
com_aclassassignment_mean -28.122 12.770 -.103 .028
com_ssuppenviron_mean 11.701 19.907 .037 .557
com_sinstsatisf_mean 15.677 20.597 .044 .447
com_sdifference_mean -8.903 12.726 -.036 .485
com_sspirit_mean -7.088 11.536 -.030 .539
R2 =.029 (p<.05)

67
Chapter Five
Discussion and Implications
This chapter consists of a discussion of the findings from the study. First, I review the
results of the study and answer the four research questions presented in the study. Next, I
discuss limitations to the study and describe how the findings confirm and contradict prior
research. I then describe how the results might be used in future practice, future research and
future policy. Finally, I offer my conclusion.
Discussion
This study was designed to answer four research questions. The first asked to what
extent demographic factors explain the variance in alumni giving within five years of graduation.
The next two questions focused on academic experiences and social experiences. The final
question sought to examine to what extent demographic, academic, and social factors explain the
variance in alumni giving within five years of graduation. I narrowed the results of an
institutional data set from a 2011 NSSE survey, yielding 559 participants who were of traditional
age, seniors, had attended only one institution and were full time students.
There were three key findings in this study. The first was related to what extent
demographic and social factors explain the variance in alumni giving; neither was associated
with giving. In terms of demographic characteristics, neither gender, race, citizenship status,
grades, nor SES were significant in the regression analysis. This is interesting because prior
studies have revealed that some of these characteristics do influence alumni giving (Beckers,
2010; Gaier, 2005; Hoyt, 2004; Miller & Casebeer, 1990). I discuss this in greater detail later in
this chapter. For now, suffice it to say, that more research is needed to explore whether, and to
what degree, different demographic characteristics are related to charitable giving.
I identified four social factors among the NSSE items and none were significant in the
regression model. There are a couple possible explanations for this finding. First, there were not
a lot of items in the NSSE instrument related to social experiences. There were 12 items that
included 16 sub-items in those four social experience factors. Participants were therefore limited
to the number and type of social experiences they could rate. Perhaps if more social experience
items were included in the instrument (e.g., participation in clubs and organizations, student
government, residence life), a richer array of social factors might have emerged. That might

68
have led to a relationship between social involvement on campus and subsequent donations to
the institution.
Second, the items that formed the social factors had response options that focused on
frequency rather than quality. Response options for the items assigned to the social category
were never, sometimes, often and very often. Respondents, therefore, could only rate how
frequently they engaged in a particular social activity. It would have been interesting to know,
for example, whether participants would rate their involvement in clubs and organizations as
exceptionally important to their undergraduate experience, or if such involvement was not
particularly impactful. Perhaps if response options elicited data about the quality of social
experiences, different results might have been achieved.
The second key finding was that only one of five academic factors proved to be
significant in explaining the variance in alumni giving and that finding seems somewhat spurious
for two reasons. First, there were 14 items that included 59 sub-items in the five academic
factors. Class Assignments was the only factor in the study that proved significant in the
regression model. The items that comprised this factor were the only items where the response
options ranged from 1 to 5, rather than 1 to 4. Perhaps if I had calculated the weighted sum of
the items to create factor scores (the weighting for each item being its loading on the factor) the
results might have been different.
Likewise, it is important to look at the three items that comprised the Class Assignments
factor: the number of assigned books, assigned papers of 5-19 pages, and assigned papers of
fewer than 5 pages. The response options for number of assigned books were none, 1-4, 5-10,
11-20 and more than 20. The mean score of this item was 2.99, indicating that most participants
were assigned 5-10 books per year. These items were tied to the participants’ perception of their
academic experience. Essentially, then, this finding suggests that less rigorous academic
assignments are more associated with giving. This is certainly counterintuitive and does not lead
to particularly useful implications. For example, development officers would be hard pressed to
suggest to faculty that they dumb down their class assignments in order to promote financial
contributions to the institution.
However, the study institution is a large public research university with a comprehensive
curriculum that emphasizes different learning styles. It is possible that the students who
responded were in less research-focused majors, or more experiential-based learning programs

69
where writing papers was not emphasized. It is also possible that large classes, typical at many
major research institutions, rendered it impractical, if not impossible, for professors to grade so
many lengthy papers in a semester. Clearly, more research is needed to explore both the
academic experiences that are associated with giving as well as the role that class assignments
play in alumni decisions to give to their alma mater.
The third, and most important, key finding is that young alumni for the most part do not
give, particularly within five years of graduation. The total number of participants in the survey
who gave was 81 (14.5%) of the 559 respondents. Individual giving over five years ranged from
$5 to $21,000 with most giving $1,000 or less over five years. Only seven alumni gave over
$1,500. One donor gave $21,000. This is obviously an outlier as the next closest giving total
was $7,200. Total giving for all participants was $58,477. There were 47 males and 34 females
who gave. Gender and giving are discussed in a later section.
There could be several explanations for the finding that young alumni do not donate to
their alma mater soon after they graduate. The first revolves simply around cash flow. Alumni
may have a lot of student loan debt, they may be in graduate school, may not yet have a job, or
they may be in an entry-level position that does not allow them the luxury of supporting
charitable donations. In addition, they may be purchasing a new car, new house, or paying
higher rent than they have been used to. Any of these factors would deter them from giving to
their institution.
Second, it could be that there is no culture of philanthropy for students and young alumni
at their institution. There can be no expectation of giving if there are no educational programs
for students that introduce them to the importance of giving, or that showcase how giving
impacts their education. Alumni who do not have an appreciation of the role that donations play
in the daily life of the institution are arguably less likely to give.
Yet another possibility is that young alumni simply are not asked to give. My findings
suggest that young alumni do not make donations, so the institution may not be allocating
resources towards that endeavor. Perhaps an assumption that alumni only give as they age
discourages staff in the Development Office from focusing on recent alumni. It is equally
possible that limited numbers of Development staff can only focus their attention on older
alumni. Likewise, Development staff may not be optimizing their opportunities with new alumni

70
by mentioning the importance of giving at chapter events, reunions, sporting events, or other
places where alumni gather. All these eventualities would lead to limited giving by graduates.
Additionally, there may not be an easy mechanism for former students to give. Young
alumni are likely to use new technologies and would prefer to make donations from a mobile
device, or through an app or existing electronic banking relationship. The institution may be
using older, more traditional means to raise money, such as mail, email and phone solicitations,
or even personal visits.
Finally, even though there is an abundance of research revealing that once alumni begin
to give, they continue to give (Hoyt, 2004; McDearmond & Shirley, 2009, Mosser, 1993),
institutions of higher education could unintentionally delay when giving starts. This study
reveals that of 81 contributors, 49 made a single donation, while 31 made at least two donations
within the five-year period. Only three graduates made a contribution in each of the five years
and in 20 other cases (25%), once they started giving, they continued to give. There is also
evidence that perhaps there was an orchestrated effort in 2013 to promote giving because not
only did the most people give in that year, many of them gave $25 suggesting that something (or
someone) was encouraging them to give a minimum of $25.
Overall, while interesting, my findings do not disclose what types of undergraduate
characteristics or experiences lead to giving by alumni. This area of inquiry needs to be
expanded to better understand what encourages or discourages them from making charitable
contributions to higher education.
Limitations
These key findings should be considered in light of several limitations to the study that
merit attention. The first involves the low response rate to the survey. The survey was sent to
over 11,000 freshmen and seniors, but only 2,048 students responded (19%). Participants also
had to be seniors. Seven-hundred and fifty-six seniors responded, 36% of those who were
invited to respond. This participation rate was higher than 19%. Additionally, all participation
was voluntary. It is possible that those seniors who volunteered to participate had had a
particularly positive or exceptionally negative undergraduate experience at the institution. If so,
the data may not reflect a true representation of the student experience, hence limiting the
generalizability of the results.

71
The second limitation related to the nature of the data in the study. I only used
quantitative data yielded by the NSSE. If I had supplemented the quantitative data with more
qualitative data, I may have been able to provide a richer, more in depth perspective to the
findings. For example, had I conducted some interviews, I may have been able to gain richer
explanations about the types of student activities the participants were involved in, and the types
of experiences they had that contributed to their satisfaction or involvement, and subsequent
giving (or decision not to give). Additionally, I may have been able to better understand their
relationships with faculty, administrators and other students, and how those relationships
influenced their undergraduate experience.
There were several limitations associated with the instrument. Some were related to the
self-reported nature of the data. First, it is difficult to account for the participants’ mindset when
they responded to the survey. They could have taken the survey on a day when a particular
academic or social experience could have affected their responses in a positive or negative way.
Second, if a participant was feeling particularly satisfied or dissatisfied with their entire
academic or social experience at the time they completed the NSSE, this could have influenced
their responses in some unforeseen manner.
There were also limitations associated with using the NSSE as secondary data, rather than
data collected specifically for this study. To start, since only items in the existing instrument
could be included in the study, I used a modified version of Volkwein’s (1989) theoretical
framework and assigned items only to demographic, academic and social categories. This
framework included other variables that I was unable to include in the study (e.g., perceived
effectiveness, intergenerational attendance). Likewise, I had to calculate SES based on the only
information available in the survey, mother’s and father’s education. Other factors that might
have painted a more complete picture of SES (e.g., family income, parental occupations) were
not available in the NSSE. Finally, another researcher might have categorized the items
differently so the assignment of variables to groups might have influenced the results. For
example, having serious conversations with students of a different race or ethnicity than your
own may be categorized as a social experience by one researcher, whereas I categorized it as an
academic experience.
Another limitation involved the analysis. Research has shown that exploratory factor
analysis is sometimes a poor choice when designing a study and can produce misleading results

72
if chosen erroneously. Careful consideration should be given to other design methods when
designing a study, as there are reasons to choose one over another. Similar techniques can
provide different results, specifically when considering exploratory analysis and principal
component analysis (Fabrigar, et al. 1999; Suhr, 2009).
The final limitation was the restricted number of participants who made donations to the
institution within five years of graduating. There were only 81 participants out of 559 (14.5%)
who made a donation. Using 10 years of giving history might have resulted in more donors for
the study. This might have provided a more positive correlation of academic and social factors,
and therefore may have helped explain the variance in alumni giving.
Despite these limitations, the results offer some interesting insights. It is important to
examine how they relate to prior studies on this topic.
Relationships of the Findings to Prior Research
The results of this study are interesting in that they both contradict and confirm prior
research about giving by recent alumni. Consider the topic of demographic characteristics and
giving. Prior research has revealed that one demographic factor in particular, sex, influences
giving: males give more than females (O’Malley, 1992; Taylor and Martin, 1993). In some
sense, my study supported this finding in that 58% of the people who gave were men. However,
sex was not significant in the regression analysis in my study so I cannot say that men are
significantly more likely to give to their alma maters than women are. Likewise, prior studies
have suggested that women give more often than men (Bekkers, 2010; Hall, 2010; Mesch, 2012;
Lodge 2014). I did not explore frequency of giving so cannot explain that. My finding that
gender was not significant does confirm Hoyt’s (2004) study in which sex did not make a
difference in terms of alumni giving.
A second demographic factor in the study was religion, indicated in the literature as
socio-demographic, but in my study as the social factor, spirituality. My study supports prior
research that indicated religion does not have an influence on giving (Lindsay, 2014). I found no
significant relationship between religion and giving, consistent with what others have found in
the past (Bekkers, 2010; Campbell, 2013; Daniels, 2013; Gose, 2012).
Other demographic factors in my study that have been used in prior research include race
and ethnicity. The literature reveals that race and ethnicity are other factors that may influence
giving. In particular, Blacks, Hispanics and multi-race/ethnic groups give significantly less than

73
whites (Miller & Casebeer, 1990, Monks, 2003). My study reveals that 18.5% of participants
who identified themselves as non-white gave, but I did not examine whether there were
differences in the amount given and race was not significant in the regression. Consequently, my
results contradict those of prior scholars.
Indeed, most of the demographic findings in the study contradict prior investigations.
For example, prior scholars have found that people give as they get older (Shelley & Polonsky,
2002; Gaier, 2005; Hoyt, 2004). While I did not look at age as a specific variable, I did look at
giving history over five years and there was nothing to suggest that more alumni gave in year
five than in year one. It is important to note, however, that whether or not age is significantly
associated with giving, the literature is clear that once alumni start giving, they likely will
continue to give (Hoyt, 2004; McDearmond & Shirley, 2009). This same pattern was evident in
my data.
Other demographic variables found in the past to influence giving include SES. I used
the only proxy for SES, mother’s and father’s education, available in the NSSE. Many other
studies define SES differently than I did and include social class (Shelley & Polonsky, 2002),
income (Bekkers, 2010; Melchiori, 1988), upbringing and other social influences (Bekkers,
2010; Shelley & Polonsky, 2002), and parental income (Hoyt, 2004; Steeper, 2009). Although
my results did not reveal a significant relationship between SES and giving, it could be that
parental education was insufficient to calculate SES.
The second element I examined in my study related to social experiences. My findings
were consistent with some prior researchers who found social experiences to have no influence
on giving (Miller & Casebeer, 1990; Taylor & Martin, 1995). Those social experiences included
participation in fraternities and sororities (Gaier, 2005) as well as involvement in athletic,
performance, and spiritual groups (Thomas & Smart, 2005).
On the other hand, my findings contradict much of the prior literature on social
experiences and giving. Indeed, prior studies overwhelmingly supported the notion that
undergraduate experiences shape satisfaction and lead to giving (Baade & Sundberg, 1993;
Thomas & Smart, 2005; Volkwein, 1989). A variety of co-curricular activities were found to
influence satisfaction (Baade & Sundberg, 1993; Monks, 2005) including participation in
fraternities and sororities (Bruggink & Siddiqui, 1995, Monks, 2005; Young & Fischer, 1996),
performing and religious groups (Monks, 2005), and athletics (Monks, 2005; O’Malley, 1992).

74
Finally, relationships have been found to influence giving (Outcalt & Skewes-Cox, 2012;
Pumerantz, 2005). I did not find that any of those factors were associated with giving so the
evidence on the relationship between social experiences and giving remains equivocal.
The final element I examined in my study was Academic experience. Specifically, my
findings support some of the literature that quality academic work (Gaier, 2005; Gallo &
Hubschman, 2003; Hoyt 2004) influences giving. In my study, the Class Assignments factor
was significant. Other variables in the literature that support this notion that academic work is
related to giving include coursework (Gaier, 2005; Mosser, 1993), and quality of instruction,
courses, and programs (Gallo & Hubschman, 2003; Graham & Gisi, 2000; Hoyt, 2004). Another
variable that relates to class assignments and satisfaction is student learning (Hoyt, 2004; Miller
& Casebeer, 1990), in that the quantity of written papers and books assigned impact the level of
quality academic work and in turn may influence giving. One last item, academic group
participation, was found to have no significant relationship to alumni giving in a prior study
(Thomas & Smart, 2005). My results found that less rigorous class assignments were
significantly associated with giving by young alumni. The spurious nature of this finding,
however, must be considered when comparing prior research to my results.
Indeed, most of the findings in my study contradict the prior literature around Academic
experiences. There has been a great deal of support for the notion that student involvement in
academics leads to satisfaction which may lead to giving (Astin, 1984; Gaier, 2005; Pumerantz,
2005; Tinto, 1993). In addition, the single most significant influence on alumni giving is
satisfaction with the undergraduate experience (McDearmond & Shirley, 2009; Monks, 2003;
Thomas, 2005). This satisfaction is realized through relationships, specifically with faculty
(Monks, 2003; Pumerantz, 2005) and advisors and administrative staff (Monks, 2003; Steeper,
2009). There is additional literature that revealed that the quality of relationships alumni had as
students has a significant influence on alumni giving (Pumerantz, 2005; Steeper, 2009). I found
none of these factors to be associated with giving in this study.
In other studies, other academic factors were found to influence student satisfaction,
hence giving. These included academic integration (Volkwein, 1989), departmental clubs
(Mosser, 1993; Thomas & Smart, 2005), academic achievement and satisfaction (Monks, 2003;
Hoyt, 2004), and enriching educational experiences (Pumerantz, 2005; Monks, 2003, Outcalt &
Skewes-Cox, 2002). However, none of these items were found to influence giving in my study.

75
The final finding of my study is that young alumni do not give. Once again, this seems to
contradict previous literature. Giving is determined by an individual’s motivation to give around
four types of interests (Bekkers, 2010; Mann, 2007). The first is personal interests such as
allegiance or empathy toward the institution (Bekkers, 2010; Mann, 2007), and willingness to
give (Beckers, 2010; Mann, 2007). It is clear in the literature that students’ allegiance to an
institution can manifest itself as pride and loyalty, both of which can influence giving. The
second, economic interests, include income (SES) and the benefit of the gift (Bekkers, 2010;
Mann, 2007; Vesterlund, 2006). Social interests include awareness of need (Mann, 2007; Shelly
& Polonsky, 2002); knowledge of how the money will be used (O’Malley 1992), the
effectiveness (and efficiency) of the organization (Bekkers, 2010; Shelley & Polonsky, 2002),
and social pressure or modeling (Bekkers, 2010: Vesterlund, 2006). Lastly there are relational
interests, both personal and organizational (Bekkers, 2010; Mann, 2007) that influence giving.
Although the factors in my study did not mirror these interests exactly, several were closely
related. For example, one of my factors was Institutional Satisfaction and included items about
overall satisfaction with the educational experience. I did not find that this, or any of the other
motivational factors in my study were associated with giving.
Capacity also influences giving and is defined in the literature as income (Bekkers, 2010,
Thomas & Smart, 2005; Volkwein, 2010) and the availability of resources (Weerts & Ronca,
2007). My study did not inquire about income, and therefore I cannot draw any conclusions
about the relationship between income and giving.
Additional support in the literature on alumni giving relates to age, not as a demographic
per se, but in that once alumni start giving, they continue to give, regardless of age (Hoyt, 2004;
MeDearmond & Shirley, 2009). Additionally, as alumni age, they are likely to give more (Hoyt,
2004, McDeamond & Shirley, 2009, Thomas & Smart, 2005). Finally, past giving highly
correlates to continued giving (Hoyt, 2004; McDearmond & Shirley, 2009; Mosser, 1993).
Although there is not an abundance of literature, what is clear is that once alumni start giving,
they continue to give (Hoyt, 2004; McDearmond & Shirley, 2009), regardless of age. The
results of my study seem to confirm this concept in that 25% of respondents continued to give
annually, once they started to give.
One last finding in the literature is around alumni participation. There is a positive
relationship between undergraduate experience, satisfaction and alumni involvement (giving)

76
(Gaier, 2005; Gallo & Hubschman, 2003; Hoyt, 2004). That involvement can be expressed as
obligation, or allegiance and empathy. Obligation is framed in terms of satisfaction with the
undergraduate experience (Hoyt, 2004; Mann, 2007) and can manifest itself as emotional
attachment (Gaier, 2005; Gallo & Hubschman, 2003;Thomas & Smart, 2005), pride (Baade &
Sundberg, 1993; Pumerantz, 2005), and loyalty (Mann, 2007; Galo & Hubshman, 2003). There
were only two questions in my study that addressed this. One asked about how respondents
would evaluate their entire educational experience, and the other asked if they would choose the
same institution if they started all over again. Both of these questions could be related to
obligation or emotional attachment but this factor was not significant in the regression analysis
so my results contradict these previous studies.
Implications for Future Practice, Research and Policy
Despite the degree to which my study contradicted prior literature, the findings have
implications for future practice, research, and policy. Several groups in higher education may
benefit from the findings including faculty, and enrollment, development, alumni and student
affairs professionals. Interestingly, even though demographics were not associated with giving
in my study, the literature is rich with evidence that demographics do influence giving. Campus
leaders may want to track factors other than gender, race and SES as they relate to giving.
Certainly, most institutions track giving by these variables. However, it also might behoove
them to conduct research on other demographic characteristics of current donors (e.g., time to
degree, GPA). This might help them target donors with specific demographic characteristics and
design programs to promote giving by those factors.
Faculty could be helpful to future giving by bringing alumni who work in a related
profession into the classroom to talk about the importance of giving back. By coordinating with
alumni and development professionals to strategically identify successful alumni, faculty could
expose students to alumni who engaged in a variety of undergraduate experiences. Alumni could
talk about how they benefited from their classroom experiences, and meaningful faculty
relationships they had as students. More importantly, alumni could talk about how the
generosity of others benefitted them personally as a student, and then lead into a conversation
about why they give back today. This could be the beginning of a process to educate students
about the importance of philanthropy while they are still at the institution, rather than waiting
until they have graduated and/or are older.

77
Similarly, student affairs professionals could create programs that feature successful
alumni and provide opportunities for them to interact with students. For example, professionals
could work with a specific college, say Business, and reward alumni for their success in the
corporate world by inviting them to come to campus and share their experiences with current
Business students. The alumni might talk about giving money to the university, or their
involvement with the university in other ways (e.g., sponsoring internships, serving on advisory
boards). Alumni would be offered many opportunities to interact with students during meetings,
presentations, workshops, or in living and learning communities as a special guest lecturer, or
alumnus/a-in-residence for a week.
To promote career exploration, alumni and students could be paired for a mentoring or
shadowing experience that allows students to learn about how they can give back to the
university both in terms of money and in other ways. For example, opportunities for interaction
between alumni and students could be staged when alumni come back to campus to participate in
career fairs. Many college fairs are managed by staff in colleges and departments and many
companies send representatives who are alumni to campuses to recruit. Faculty and development
staff could sponsor receptions, interviews, internship and co-op experiences to encourage
interaction between alumni and students.
Development professionals are another group that could promote giving among recent
alumni. Development professionals could create programs that educate students about the need
for philanthropic support. They might focus their efforts on encouraging students to give to
programs of personal interest (e.g., the clubs and organizations they belong to, favorite faculty
member). They could inform students about the scholarships, professorships, research
equipment, and buildings that are supported by private giving. Other opportunities to educate
students about philanthropy could be through institutional affiliation shared by all students, like
class gifts. Competitions and or campaigns to promote a class gift that might be announced at a
shared event like commencement could provide a mechanism to educate students about the
importance of philanthropy while they are still undergraduates. If students start to give while
still undergraduates, prior research would suggest that they might continue to give as alumni.
Alumni professionals might create a student organization to focus on engagement and
fundraising activities. Organizational goals could include educating students about the history
and traditions of the university, educating them about how philanthropy benefits the institution,

78
and helping them create a plan to educate more students. This could be accomplished through
programs like speakers, opportunities to engage with alumni professionals, and events that bring
undergraduates into the campus alumni center. Educational campaigns could be designed
through the creation of literature, multimedia presentations, and promotional giveaways.
One last implication for practice is for Development professionals to create a program,
perhaps through social media channels, to get students/recent alumni in the habit of repetitive
giving. The literature strongly indicates that once alumni start giving, they continue to give
(Hoyt, 2004; McDearmond & Shirley, 2009, Mosser, 1993). It would behoove Development
professionals to not only educate students and young alumni about giving, but to also make it
easy for them to give. Today’s undergraduates rely on their phones and other devises to stay
informed and retrieve information. Development officers should explore apps and other forms of
social media through which alumni can easily transfer money and/or sign up for monthly or
annual monetary transfers to the institution.
Although there are implications for practice that emerged from my results, it is clear that
more research is needed on the topic of giving among recent alumni. To start, my study used
NSSE data and only one of my independent variables explained the variance in young alumni
giving (and that one was inexplicable). Another study might use a different instrument with
questions that better align with the Volkwein (1989) theoretical framework.
Adding qualitative research methods to supplement elements of the NSSE also might
provide richer data on social and academic achievement and satisfaction. Qualitative research
could allow for a deeper understanding of a variety of items. For example, the only factor in my
study that had any significance to giving was Class Assignments. One interpretation of this
finding is that faculty should assign less rigorous reading and writing to students to influence
giving. A qualitative approach would allow for a more in-depth explanation of why this is so,
and include an examination of the type of classes, other types of assignments in classes, the
impact of classes on learning, or the grade received in a particular class.
A qualitative study might also provide evidence to support significance of other academic
and social factors, such as quality of students’ relationships with peers, faculty and
administrators, and involvement in extra-curricular activities. For example, very few types of
social experiences were measured by the NSSE. However, the literature indicates both specific
types of organizational involvement and the number of organizations students participate in
79
influence satisfaction that can lead to giving. Types of organizations include residence hall
groups, student government, program boards and student alumni groups, many of which students
must compete to join. A qualitative study could explore the type of organizations students are
involved in, specific organizational experiences, and number of organizations a student is
involved in and connect that to propensity to donate to the institution.
Another future study might include more institutions. My study involved only one
institution because retrieving data about giving is institution-specific. Adding more institutions
might lead to findings that are more significant. Similarly, increasing the parameters for young
alumni giving from 5 to 10 years could yield more than 81 donors and perhaps lead to more
significant findings.
I also examined only specific demographic characteristics. Other scholars could focus on
different demographic factors such academic major or post-graduate activities (e.g., job, graduate
school). Expanding on the demographic factors might lead to insights into what factors are
associated with financial giving by recent alumni.
I had no way of gathering information about whether respondents in my study received
any financial aid. It would be interesting to look at the impact of financial aid, both loans and
grants, on giving. A great deal has been written in the literature about capacity to give. Clearly
student loan debt could have an effect on capacity. However, there is also evidence in the
literature that students’ experience, specifically their loyalty toward the institution, is
influenced by the support they received from the university. There clearly is a need for more
research to better understand the connection between support, satisfaction, and giving.
Finally, further research is needed to help development professionals create strategies to
engage those who are already engaged with their alma mater. More specifically, strategies that
garner additional support from those who already give are imperative to promote the future
success of higher education (Drezner, 2011).
As stated previously, this study found very little significance between undergraduate
student experiences and alumni giving. Hence, it is difficult to identify policy implications from
the results. However, previous research indicates that with dwindling state support,
philanthropic support of higher education is of even greater importance. In that vein, university
leaders could create a policy to provide incentives for faculty support of university fundraising
initiatives. This might be considered university service for purposes of promotion and tenure.
80
Garnering financial support for a department, research, or scholarships could be of great value to
the university. Likewise, perhaps policy could be implemented by governance groups to create
salary incentives for faculty and staff who assist in successful fundraising for the university.
Other implications for policy fall into the category of educating students. My study did
not find significance between student experience and giving, but the literature strongly supports
the idea that once alumni give, they continue to give. It would behoove universities, therefore, to
step up efforts to educate students about the importance of giving. There are several scenarios
that could influence future policy. The first is to create a policy that all senior seminar classes
must devote at least one class period to exploring how private support is used at the university,
the importance of private giving, and easy steps to do so. The content for this class could be
created by development professionals and include information through a multimedia presentation
and handouts such as updated data on current giving, current projects, future projects, and how to
give. It could be that Development or Alumni professionals are tasked with delivering this
information to senior seminar classes.
Another potential policy revolves around the idea of university administrators and faculty
creating courses or a minor in the field of development/advancement. This could include classes
on the history of giving in the United States, history of giving to higher education, giving
theories, and current trends and data. In addition, classes in communications, public relations
and design could provide students with the skills to create messaging and media assets. Classes
could focus on the principles of fundraising, event planning, engagement and, budgeting.
Finally, the literature also supports the notion of relationships as a factor in influencing a
students’ satisfaction with their undergraduate experience. In planning for a new class or minor,
administrators and faculty could include an experiential component to provide internships, and
mentoring and practicum experiences in Alumni Relations, Development, and/or Advancement.
Such efforts would be consistent with the literature in that enriching academic experiences lead
to students’ satisfaction.
Another potential policy could be the establishment of a university-wide Giving Week.
This could include educational programs and events to learn about giving, such as a day of
giving, a day to thank donors, a day to share the impact of giving on the university, and/or
opportunities to meet donors. A program of this kind could include personnel from
Development, Alumni Relations, colleges, departments and student groups. To make it fun there

81
could be challenges, such as colleges matching donations for a particular program, or contests
between colleges, departments, classes, or student organizations.
Finally, policy makers might create an official student organization. This would be
connected to an institutional office (as opposed to simply gathering a group of students who
apply to be a student organization), in support of the Development office. Students could be
educated on the importance of fundraising and then trained to help with events and fundraising
initiatives. This would be just one more opportunity to educate students, before they graduate
and might lead to giving by many more young alumni.
Conclusion
In conclusion, public institutions of higher education are suffering from dwindling state
support at the same time they are experiencing increased operational costs coupled with an
increased demand for their services. This reduction in state support has led institutions to seek
alternative sources of financial support. These include support from federal agencies,
foundations, and corporations. Although campus leaders can increase their efforts to secure such
funds, they do not have very much control over whether they are successful.
Alumni giving is one alternative revenue stream that institutional leaders can control, to a
larger extent. There is abundant evidence that once alumni start to make financial contributions
to their alma mater, they are more likely to continue to give over time. Clearly, it would
behoove institutional leaders to examine giving among their recent alumni and to allocate time
and resources to promoting giving among this group if they expect to maximize the potential
revenues they might raise from their graduates.

82
References
Alexander, F. King (2000). The Changing Face of Accountability: Monitoring and Assessing
Institutional Performance in Higher Education. The Journal of Higher Education, Vol.
71, No. 4, pp.411-431. Columbus, OH: Ohio State University Press.
Archibald, R. B., & Feldman, D. H. (2012). The anatomy of college tuition. The
American Council on Education. http://www.acenet.edu/news-room/Pages/The-Anatomy-
of-College-Tuition.aspx. Google Scholar
Astin, A.W. (1984). Student Involvement: A Developmental theory for Higher Education.
Journal of College Student Personnel, 40, 297-216.
Baade, R. A., & Sundberg, J. O. (1993). Identifying the factors that stimulate alumni giving. The
Chronicle of Higher Education, 40(6), B1-B2.
Bekkers, R. (2010). Who gives what and when? A scenario study of intentions to give time and
money. Social Science Research, 39(3), 369-381. Quotes from Debra J. Mesch,
Women’s Philanthropy Institute.
Bill and Melinda Gates Foundation: Who We Are. (2017). Retrieved February 17, 2017, from
http://www.gatesfoundation.org/Who-We-Are.
Bitner, M. J., & Hubbert, A. R. (1994). Encounter satisfaction versus overall satisfaction versus
quality. Service quality: New directions in theory and practice, 34, 72-94.
Brady, H. E., Verba, S., and Schlozman, K.L. (1995). Beyond SES: A Resource Model of
Political Participation. American Political Science Review, 89, pp 271-294.
doi:10.2307/2082425.
Britt, R. (Ed.). (2016, November). National Science Foundation - Where Discoveries Begin.
Retrieved February 15, 2017, from https://www.nsf.gov/statistics/srvyherd/
Brittingham, B. E. and Pezzullo, T. R. (1990). The Campus green: Fund raising in higher
education. School of Education and Human Development, the George Washington
University, Washington, DC.
Bruggink, T. H., & Siddiqui, K. (1995). An econometric model of alumni giving: A case study
for a liberal arts college. The American Economist, 39(2), 53-60.
Campbell, D. (2013). It’s Social Ties-not religion-that makes the faithful give to charity, Time.
www.ideas.time.com.
Campbell, C. M., & Cabrera, A. F. (2011). How Sound is NSSE?: Investigating the

83
Psychometric Properties of NSSE at a Public, Research-Extensive Institution. The
Review of Higher Education, 35(1), 77-103. Retrieved January 15, 2018, from Project
MUSE database.
Charles Koch Foundation: Why and How We Give. (2017). Retrieved February 17, 2017, from
https://www.charleskochfoundation.org/
Clotfelter, C. T. (2003). Alumni giving to elite private colleges and universities. Economics of
Education review, 22(2), 109-120.
Council for Aid to Education (CAE) (2014). Voluntary Financial Support of Higher Education:
1990 To 2015 [By Type Of Donor And Institution, Selected School Years] ProQuest
Statistical Abstract of the U.S. 2017 Online Edition. Retrieved from http://statabs.
proquest.com.ezproxy.lib.vt.edu/sa/docview.html?table-no=304&acc-no=C7095-1.4
&year= 2017&z=E7408505D183818588EB312254493D3407F6626E.
Council for Aid to Education (2017). Colleges and Universities Raise $41 Billion in 2016.
http://cae.org/images/uploads/pdf/VSE-2016-Press-Release.pdf. Website, February 5,
2018
Daniels, A., (2013). Religious Americans give more, new study finds, Chronicle of
Philanthropy, November 25, 2013.
Davis, N. P. (2013, January 9). College Spending in a Turbulent Decade. Retrieved February 13,
2017, from http://www.nacubo.org/Research/Research_News/College_Spending_
in_a_Turbulent_Decade.html.
Desrochers, D. M., & Kirshstein, R. J. (2012). College Spending in a Turbulent Decade:
Findings From the Delta Cost Project (Publication No. 3146_11/12). Washington, DC:
American Institute for Research (AIR).
Drezner, Noah (2011). Philanthropy and Fundraising in American Higher Education, Volume
37, Number 2, ASHE higher Education Report. Wiley Periodicals, Hoboken, NJ.
Esposito, Gregory (2010). Looking for a Way Out, New Directions for Higher
Education, n 151, p. 39-48. John Wiley & Sons, Inc., Hoboken, NJ. Retrieved
from EbscoHost.
Ford Foundation: Mission. (2016, June 13). Retrieved February 17, 2017, from
http://www.fordfoundation.org/about-us/mission.
Gaier, S. (2005). Alumni Satisfaction with Their Undergraduate Academic Experience and the

84
Impact on Alumni Giving and Participation. International Journal of Educational
Advancement, 5(4), 279-288. Retrieved from EBSCOhost.
Gallo, P. J. & Hubschman, B. (2003). The Relationships between Alumni Participation and
Motivation on Financial Giving 26 pp. (ED477447). Retrieved from EBSCOhost.
Giving USA, 2017. See the numbers – Giving USA 2017. The Annual Report on Philanthropy
for the Year 2016. https://givingusa.org/giving-usa-2017-total-charitable-donations-rise-
to-new-high-of-390-05-billion/.
Gose, B. (2012). Wealthiest don’t rate high on giving measure. Chronicle of Philanthropy.
Washington, D.C. Retrieved from www.philanthropy.com.
Graham, S. W., Gisi, S. L. (2000). The Effects of Instructional Climate and Student Affairs
Services on College Outcomes and Satisfaction. Journal of College Student
Development. Vol 41, No. 3, pp 279-291.
Hall, H. (2010). Most women give more than men, new study finds, Chronicle of Philanthropy.
Retrieved from Philanthropy.com.
Hall, P. D. (2006). A historical overview of philanthropy, Voluntary associations, and nonprofit
organizations in the united States, 1600-2000. The nonprofit sector: A research
handbook, 2 32-65.
Hartman, D. E., & Schmidt, S. L. (1995). Understanding student/alumni satisfaction from a
consumer's perspective: The effects of institutional performance and program outcomes.
Research in Higher Education, 36(2), 197-217.
Hatfield, E., Walster, G. W., & Piliavin, J. A. (1978). Equity theory and helping relationships.
Altruism, sympathy, and helping: Psychological and sociological principles, 115-139.
Hoyt, J. E. (2004). Understanding Alumni Giving: Theory and Predictors of Donor Status.
Online Submission, Paper presented at the Annual Forum of the Association for
Institutional Research (AIR) (44th, Boston, MA, May 28-Jun 2, 2004). 34 pp.
(ED490996). Retrieved from EBSCOhost.
Jenkins, M. (Ed.). (2017). About | Lumina Foundation. Retrieved February 17, 2017, from
https://www.luminafoundation.org/about
Johnson, J. W., & Eckel, P. D. (1997). Preparing seniors for roles as active alumni. The senior
year experience: Facilitating integration, reflection, closure, and transition, 227-42.
Kena, G., Aud, S., Johnson, F., Wang, X., Zhang, J., Rathbun, A., Wilkinson-Flicker, S., and

85
Kristapovich, P. (2014). The Condition of Education 2014 (NCES 2014-083). U.S.
Department of Education, National Center for Education Statistics. Washington, DC.
Retrieved 2/15/2017 from http://nces.ed.gov/pubsearch.
Kim, M. M., & Ko, J. (2015). The Impacts of State Control Policies on College Tuition
Increase, Educational Policy, Vol 29, Issue 5 pp.815-838.
doi.org/10.1177/0895904813518100
Lawrence, S., & Marino, L. (2003). Update on funding for higher and graduate educational
institutions. New York: The Foundation Center.
Leslie, L. L., & Ramey, G. (1988). Donor behavior and voluntary support for higher education
institutions. The Journal of Higher Education, 115-132.
Lindahl, W. E., & Winship, C. (1992). Predictive models for annual fundraising and major gift
fundraising. Nonprofit Management and Leadership, 3(1), 43-64.
Lindsay, D. (2014). New Study finds unexpected source of giving: Young women, Chronicle of
Philanthropy. Retrieved from www.philanthropy.com.
Lodge, M. (2014). Dispelling myths about women and charitable giving, Fortune Magazine,
October 20, 2014. Retrieved from www.fortune.com.
Lutz, M. E. & Culver, S., (2010). The National Survey of Student Engagement: A university-
level analysis. Tertiary Education and Management, 16(1), 35-44.
Mann, T. (2007). College Fund Raising Using Theoretical Perspectives to Understand Donor
Motives. International Journal of Education Advancement, v7 n1 p35-45.
McConnell, J. S. (2015, November 30). Corporate Giving: Trends, Motivations, and
Strategies. Retrieved February 17, 2017, from http://www.bwf.com/published-by-
bwf/corporate-giving-trends-motivations-and-strategies/
McCormick, A. C., & McLenney, K. (2012). Will These Trees Ever Bear Fruit?: A Response to
the Special Issue on Student Engagement. The Review of Higher Education, 35(2), 307-
333. Retrieved January 16, 2018, from Project MUSE database.
McDearmon, J. T., & Shirley, K. (2009). Characteristics and institutional factors related to young
alumni donors and non-donors. International Journal of Educational Advancement, 9(2),
83-95.
Melchiori, G. S. (1988). Alumni research: Methods and applications. New Directions for
Institutional Research. Number 60. San Francisco: Jossey-Bass Publishers.

86
Mesch, D. (2012). Women Give 2012, new research about women and giving. Women’s
Philanthropic Institute, The Center on Philanthropy, Indiana University, Indianapolis, IN.
Miller, M. T., and Casebeer, A. L. (1990). Donor Characteristics of College of
Education Alumni: Examining Undergraduate Involvement. Carbondale,
Illinois: Southern Illinois University (ERIC ED323836).
Monks, J. (2003). Patterns of giving to one’s alma mater among young graduates
from selective institutions. Economics of Education Review, 22(2), 121.
doi:10.1016/S0272-7757(02)00036-5
Mortenson, T. G. (2012, January). State Funding: A Race to the Bottom. The Presidency, 15(1).
Retrieved February 13, 2017, from http://www.acenet.edu/the-presidency/ Pages/Winter-
2012.aspx.
Mosser, J. W. (1993). Predicting Alumni/ae Gift Giving Behavior: A Structural
Equation Model Approach. (Doctoral Dissertation, University of Michigan).
(ERIC ED355883).
Mumper, M. and Freeman, M.L. (2011). The Continuing Paradox of Public College Tuition
Inflation. The States and Public Higher Education Policy: Affordability, Access, and
Accountability, second edition. Baltimore, Maryland: The Johns Hopkins University
Press.
National Art Education Foundation: About (2017). Retrieved February 17, 2017, from
https://www.arteducators.org/about.
National Association of College and University Business Officers (NACUBO), 2012. Donations
to U.S. colleges and universities increased 8.2 percent in 2011. Retrieved from
http://www.nacubo.org/ esearch/Research_News/Donations_to_US_ Colleges_
and_Universities_ Increased _82_in_2011.html.
National Conference of State Legislatures (NCSL) (2010). Blue Ribbon Commission on
Higher Education. State Funding for Higher Education FY 2009 and FY 2010.
National Science Board. 2012. Diminishing Funding and Rising Expectations: Trends and
Challenges for Public Research Universities, A Companion to Science and Engineering
Indicators 2012, Arlington, VA: National Science Foundation (NSB-12-45).
National Science Foundation, 2016. National Center for Science and Engineering Statistics,
Higher Education Research and Development Survey, FY 2016. Retrieved from

87
https://ncsesdata.nsf.gov/herd/2016/html/HERD2016_DST_05.html website, February 5,
2017.
National Survey of Student Engagement (NSSE) Website (2016). http://nsse.iub.edu/
National Survey of Student Engagement (NSSE) (2011). Fostering student engagement
Campuswide annual results 2011. Bloomington, IN: Indiana University Center for
Postsecondary Research.
Okunade, A., & Justice, S. (1991). Micropanel estimates of the life-cycle hypothesis with respect
to alumni donations. In 1990 Proceedings of the Business and Economic Statistics
Section of the American Statistical Association (pp. 298-305).
O’Malley, M.P. (1992), Another look at charitable giving: The importance of non-economic
determinants of philanthropy. Massachusetts Institute of Technology. Dissertation.
Outcalt, C. L., & Skewes-Cox, T. E. (2002). Involvement, interaction, and satisfaction: The
human environment at HBCUs. The Review of Higher Education, 25(3), 331-347.
Pascarella, E. T., & Terenzeni, P. T. (1991). How college affects Students: Findings and insights
from twenty years of research. San Francisco: Jossey-Bass.
Porter, S. R., (2011). Do Collee Student Surveys Have Any Validity? The Review of Higher
Education, 35(1), 45076. Retrieved January 15, 2018, from Project MUSE database.
The Posse Foundation. (2014). Retrieved February 17, 2017, from
http://www.possefoundation.org/
Pumerantz, R. K. (2005). Alumni-in-Training: A Public Roadmap for Success.
International Journal of Educational Advancement, 5(4), 289-300. Retrieved
from EBSCOhost.
Redd, K. (2014, March 18). 2013 endowment study final report released. Retrieved
February 17, 2017, from http://www.nacubo.org/Research/Research_News/2013_
Endowment_Study_Final_Report_Released.htm .
Serna, G. R. & Harris, G. (2014). Higher Education Expenditures and State Balanced Budget
Requirements: Is There a Relationship? Journal of Education Finance 39(3), 175-202.
University of Illinois Press. Retrieved January 15, 2018, from Project MUSE database.
Seymour, H. J. (1988). Designs for Fund-Raising. Pennsylvania: Fund-Raising Institute.
Shapiro, S., (2013). Federal R&D: Analyzing the Shift From Basic and Applied Research
Toward Development. Retrieved from: https://economics.stanford.edu/sites/default/files/

88
publications/samshapirohonorsthesis-may2013.pdf.
Shelley, L., & Jay Polonsky, M. (2002). Do charitable causes need to segment their current
donor base on demographic factors?: An Australian examination. International Journal
of Nonprofit and Voluntary Sector Marketing, 7(1), 19-29.
Spaeth G. (1970). Recent Alumni and Higher Education. op.cit. SMR Research Corp. 2006.
The Demographics of American Charitable Donors. Hackettstown, NJ.
WWW.SMRRESEARCH.COM
St. John, E. P. and Parsons, M. D. (2004). Public Funding of Higher Education. Baltimore,
MD: Daniel C. Press, 263.
Steeper, D. W. (2009). The Effects of Selected Undergraduate Student Involvement and Alumni
Characteristics on Alumni Gift-Giving Behavior at the University of Virginia. ProQuest
LLC. 789 East Eisenhower Parkway, PO Box 1346, Ann Arbor, MI 48106.
Szady, S. M. (1988), Alumni data analysis. New Directions for Institutional Research, 1988: 39–
50. doi:10.1002/ir.37019886006.
Taylor, A. L. & Martin, J. C., Jr. (1993). Predicting Alumni Giving at a Public Research
University. Paper presented at the Annual Form of the Association for Institutional
Research (33rd, Chicago, IL, May 16-19, 1993).
Taylor, A. L., & Martin, J. C. (1995). Characteristics of Alumni Donors and Non Donors at a
Research I, Public University. Research in Higher Education, 36(3), 283-302.
Thomas, J. A., & Smart, J. (2005). The Relationship between Personal and Social
Growth and Involvement in College and Subsequent Alumni Giving. Online
Submission, Retrieved from EBSCOhost.
Tinto, V. (1987). Leaving college: Rethinking the causes and cures of student attrition (1st Ed.).
Chicago: University of Chicago Press.
Tinto, V. (1993). Leaving college: Rethinking the causes and cures of student attrition (2nd
edition). Chicago, IL: University of Chicago Press.
van Fleet, J. W. (2010). Corporate giving to education during economic downturns: General
trends and the difficulty of prediction. International Journal of Educational
Advancement, 9(4), 234-250.
Vesterlund, L. (2006). Why do people give. The nonprofit sector: A research handbook, 2, 168-
190.

89
Volkwein, F. J. (2010). Assessing Alumni Outcomes. New Directions for Institutional
Research. Wiley Interscience (www.interscience.wiley.com). DOI: 10.1002/ir.335.
Volkwein, F. J., Webster-Saft, L, Xu, W., & Agrotes, M. H. (May, 1989). A model of
alumni gift-giving behavior. Association for Institutional Research 1989 annual
forum paper. Baltimore, MD.
Wasley, P. (2009). Women take the lead in couples’ charitable giving decisions, The Chronicle
of Philanthropy. Retrieved from www.philanthropy.com.
Weerts, D. J., & Ronca, J. M. (2009). Using classification trees to predict alumni
giving for higher education. Education Economics, 17(1), 95-122.
Wood, J. R., & Houghland Jr, H. R. (1990). The role of religion in philanthropy. Faith and
Philanthropy in America. San Francisco: Jossey-Bass.
Wuthnow, R. (2004). Faith & Giving: From Christian Charity to Spiritual Practice. The Center
On Philanthropy at Indiana University-Purdue University. Indianapolis, IN.
Young, P. & Fischer, N. M. (1996). Identifying Undergraduate and Post-College Characteristics
that May Affect Alumni Giving. AIR 1996 Annual Forum Paper. Retrieved from
EBSCOhost.

90
Appendix A: Institutional Review Board Approval Letter
Research Compliance Institutional Review Board 300 Turner Street NW Blacksburg, Virginia 24061 540/231-4606 Fax 540/231-0959 email [email protected] website http://www.irb.vt.edu
MEMORANDUM DATE: August 25, 2017 TO: Debbie Day, Joan B Hirt, Gabriel Ramon Serna, Joshua M Cohen FROM: Virginia Tech Institutional Review Board (FWA00000572, expires January 29, 2021) PROTOCOL TITLE: Student Involvement Factors that Influence Young Alumni Giving IRB NUMBER: 16-722 Effective August 25, 2017, the Virginia Tech Institution Review Board (IRB) Chair, David M Moore, approved the Continuing Review request for the above-mentioned research protocol. This approval provides permission to begin the human subject activities outlined in the IRB-approved protocol and supporting documents. Plans to deviate from the approved protocol and/or supporting documents must be submitted to the IRB as an amendment request and approved by the IRB prior to the implementation of any changes,regardless of how minor, except where necessary to eliminate apparent immediate hazards to the subjects. Report within 5 business days to the IRB any injuries or other unanticipated or adverse events involving risks or harms to human research subjects or others. All investigators (listed above) are required to comply with the researcher requirements outlined at: http://www.irb.vt.edu/pages/responsibilities.htm (Please review responsibilities before the commencement of your research.) PROTOCOL INFORMATION: Approved As: Expedited, under 45 CFR 46.110 category(ies) 5 Protocol Approval Date: August 24, 2017 Protocol Expiration Date: August 23, 2018 Continuing Review Due Date*: August 9, 2018 *Date a Continuing Review application is due to the IRB office if human subject activities covered under this protocol, including data analysis, are to continue beyond the Protocol Expiration Date. FEDERALLY FUNDED RESEARCH REQUIREMENTS: Per federal regulations, 45 CFR 46.103(f), the IRB is required to compare all federally funded grant proposals/work statements to the IRB protocol(s) which cover the human research activities included in the proposal / work statement before funds are released. Note that this requirement does not apply to Exempt and Interim IRB protocols, or grants for which VT is not the primary awardee.

91
The table on the following page indicates whether grant proposals are related to this IRB protocol, and which of the listed proposals, if any, have been compared to this IRB protocol, if required. IRB Number 16-722 page 2 of 2 Virginia Tech Institutional Review Board
Date* OSP Number Sponsor Grant Comparison Conducted? * Date this proposal number was compared, assessed as not requiring comparison, or comparison information was revised. If this IRB protocol is to cover any other grant proposals, please contact the IRB office ([email protected]) immediately. Institutional Review Board 300 Turner Street NW Blacksburg, Virginia 24061 540/231-4606 Fax 540/231-0959 email [email protected] website http://www.irb.vt.edu

92
Appendix B: Permission to Use Figure 1
Wed 3/21/2018 10:40 PM
James F Volkwein <[email protected]>
To: Day, Debbie <[email protected]>
Hi Debbie-
I am writing to give you permission cite my work and to use my
model of alumni gift giving in your research. Please let me
know if you need more than this simple email, and share with
me your research summary or draft of any publication that
results from your work. I look forward to looking it up on the
public access link.
All the best,
DrV
--
****************************************************
J. Fredericks Volkwein
Emeritus Professor of Higher Educ.
1564 Long Ridge Road
Stamford, CT. E-MAIL: [email protected]
06903 VOICE: 203-276-0886
("`-''-/").____..--''"`-._
`9_ 9 ) `-. ( ). `- .__.`)
(_Y_.)'- ._ ) `. ;````-..- '
_.`--'.. _../ /---'_.' ,' PENNSTATE
((!.--'' ((!.--" ((!.-' Home of the
Nittany Lions
http://www.ed.psu.edu/cshe/
********************************************

![Factors that Influence Undergraduate University Desertion … · 2018. 12. 31. · University desertion is multifactorial [9]. It comprises academic, personal, social, institutional](https://img.pdfslide.us/doc/110x75/60381cfafdb38b78086b7bdd/factors-that-influence-undergraduate-university-desertion-2018-12-31-university.jpg)