Embed Size (px)
Citation preview
8/8/2019 Factors Impacting Consumers
http://slidepdf.com/reader/full/factors-impacting-consumers 1/52
“FACTORS IMPACTING CONSUMERS’
PREFERENCES OF POST- PAID AND PRE-PAID
CONNECTIONS” –A COMPARATIVE STUDY OF
DIBRUGARH UNIVERSITY
A project submitted to
THE CENTRE FOR MANAGEMENT STUDIES,
DIBRUGARH UNIVERSITY
in partial fulfillment of the Degree of Masters of Business Administration (FT)under the Semester System for Paper No.BM- 303 ‘Project Study’
PROJECT GUIDE:
Mr. Pratim Barua
Faculty Member
Centre for Management Studies,
Dibrugarh University
SUBMITTED BY:
Chandan Das
Roll No. 07
MBA 3rd Semester
CMSDU

8/8/2019 Factors Impacting Consumers
http://slidepdf.com/reader/full/factors-impacting-consumers 2/52
C E R T I F I C A T E
This to certify that the project report entitled FACTORS IMPACTING CONSUMERS’ PREFERENCES OF POST-PAID AND PRE-PAID CONNECTIONS-A COMPARATIVE STUDY OF DIBRUGARH UNIVERSITY submitted by Mr. Chandan Das have been prepared under my supervision and guidance. The report is based on a work done during the period of
April-May, 2010. It was done in partial fulfillment of the Master of Business Administration(MBA) Degree of Dibrugarh University under semester system for Paper No.303-Project Study.
It is further certified that the said project has not been carried out anywhere else and it has not been
submitted to any other University or Institution for similar purposes.
(Mr. Pratim Barua)
Date:

8/8/2019 Factors Impacting Consumers
http://slidepdf.com/reader/full/factors-impacting-consumers 3/52
Preface
In a professional course like MBA, we are basically trained & equipped with strongknowledge of how business operates & what are the times tested methods of running asuccessful business. The programme is design to provide both portfolio of strong functional
skills and ability to apply, adopt and integrate those skills in different settings. But no courseof study is fully completed unless there is first hard practical knowledge of the business and
professional way of working.
Therefore, to reinforce this strong theoretical base, the students of Centre for Management Studies, Dibrugarh University, are assigned certain project in Project Study andto get acquainted with the practical business world.
I have been assigned to work on “FACTORS IMPACTING CONSUMERS’ PREFERENCES OF POST-PAID AND PRE-PAID CONNECTIONS-A COMPARATIVE STUDY OF DIBRUGARH UNIVERSITY ”. The main objective of doing this study is to findout the factors impacting consumers’ preferences of post-paid and pre-paid connections and
comparison between the preference of the people on post-paid and pre-paid connections.
ACKNOWLEDGEMENT

8/8/2019 Factors Impacting Consumers
http://slidepdf.com/reader/full/factors-impacting-consumers 4/52
It was a great pleasure and a unique experience to work on this project. On its
completion I would like to express my sincere thanks and gratitude to those who have
extended their valuable time, co-operation and guidance during the course of the study.
My sincere thanks Mr. Pratim Barua for guiding me as my project guide and other faculty
members of CMS DU for helping me in preparing my report.
I thank my friends for offering their support and helping me during the course of my project
study
I also thank my respondents for giving their time in filling my questionnaire through which
the survey was made.
Chandan Das
Roll No: 07
MBA 3rd Semester
CMSDU
Executive Summary
8/8/2019 Factors Impacting Consumers
http://slidepdf.com/reader/full/factors-impacting-consumers 5/52
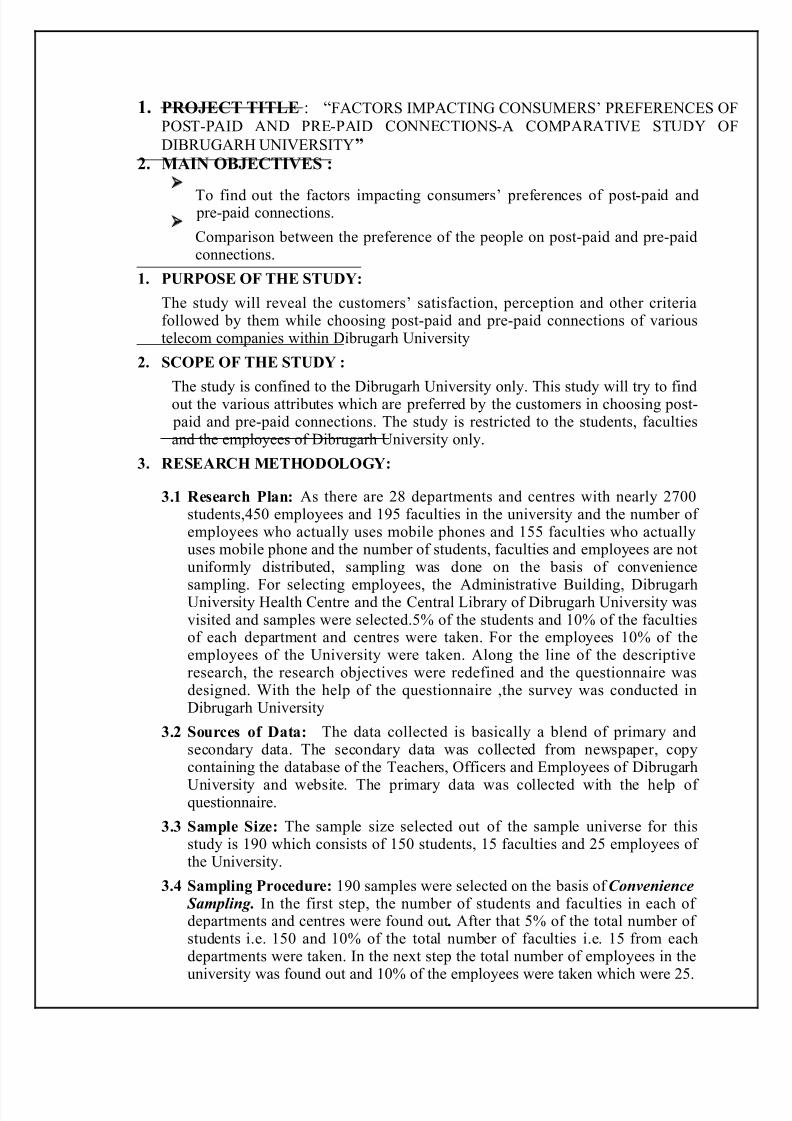
1. PROJECT TITLE : “FACTORS IMPACTING CONSUMERS’ PREFERENCES OFPOST-PAID AND PRE-PAID CONNECTIONS-A COMPARATIVE STUDY OF
DIBRUGARH UNIVERSITY”2. MAIN OBJECTIVES :
➢ To find out the factors impacting consumers’ preferences of post-paid and pre-paid connections.
➢ Comparison between the preference of the people on post-paid and pre-paidconnections.
1. PURPOSE OF THE STUDY:
The study will reveal the customers’ satisfaction, perception and other criteriafollowed by them while choosing post-paid and pre-paid connections of varioustelecom companies within Dibrugarh University
2. SCOPE OF THE STUDY :
The study is confined to the Dibrugarh University only. This study will try to findout the various attributes which are preferred by the customers in choosing post- paid and pre-paid connections. The study is restricted to the students, facultiesand the employees of Dibrugarh University only.
3. RESEARCH METHODOLOGY :
3.1 Research Plan: As there are 28 departments and centres with nearly 2700students,450 employees and 195 faculties in the university and the number of employees who actually uses mobile phones and 155 faculties who actuallyuses mobile phone and the number of students, faculties and employees are notuniformly distributed, sampling was done on the basis of convenience
sampling. For selecting employees, the Administrative Building, DibrugarhUniversity Health Centre and the Central Library of Dibrugarh University wasvisited and samples were selected.5% of the students and 10% of the facultiesof each department and centres were taken. For the employees 10% of theemployees of the University were taken. Along the line of the descriptiveresearch, the research objectives were redefined and the questionnaire wasdesigned. With the help of the questionnaire ,the survey was conducted inDibrugarh University
3.2 Sources of Data: The data collected is basically a blend of primary andsecondary data. The secondary data was collected from newspaper, copycontaining the database of the Teachers, Officers and Employees of Dibrugarh
University and website. The primary data was collected with the help of questionnaire.
3.3 Sample Size: The sample size selected out of the sample universe for thisstudy is 190 which consists of 150 students, 15 faculties and 25 employees of the University.
3.4 Sampling Procedure: 190 samples were selected on the basis of Convenience Sampling . In the first step, the number of students and faculties in each of departments and centres were found out. After that 5% of the total number of students i.e. 150 and 10% of the total number of faculties i.e. 15 from eachdepartments were taken. In the next step the total number of employees in theuniversity was found out and 10% of the employees were taken which were 25.

8/8/2019 Factors Impacting Consumers
http://slidepdf.com/reader/full/factors-impacting-consumers 6/52
4. MAJOR FINDINGS
From the study it has been found out that
4.1 Pre-paid connection is dominant among the students.
4.2 Employees and faculties prefer to use post-paid connection.
4.3 Income is a major factor while choosing a connection.
4.4 Pre-paid connection is regarded as the most economical.
5. LIMITATIONS OF THE STUDY
5.1 The study was confined to only to the students, faculties and employees of Dibrugarh University. So the findings may not be generalized in a broader
perspective.
5.2 Some of the respondents did not read the questionnaire carefully.
5.3 Some of the questionnaires were lost by the respondents during the survey.5.4 It was very difficult to make the respondents realize the sincerity of the tests.
Contents
List of figures and tables
1. Chapter 1
1.1 Introduction
8/8/2019 Factors Impacting Consumers
http://slidepdf.com/reader/full/factors-impacting-consumers 7/52
1.2 History Of Telecommunication
1.3 Growth in Telecom Sector
1.4 Future Outlook of Telecom Sector
1.5 Indian telecom services
1.6 Opportunities of Telecom sector In India
1.7 Major Players in Assam
2. Chapter 2
2.1 About Prepaid services
2.2 About Post-paid services
3. Chapter 3 Research Methodology
4. Chapter 4 Analysis of the data and interpretation
5. Chapter 5
Limitation
6. Chapter 6
Conclusion
Annexure
Bibliography
8/8/2019 Factors Impacting Consumers
http://slidepdf.com/reader/full/factors-impacting-consumers 8/52
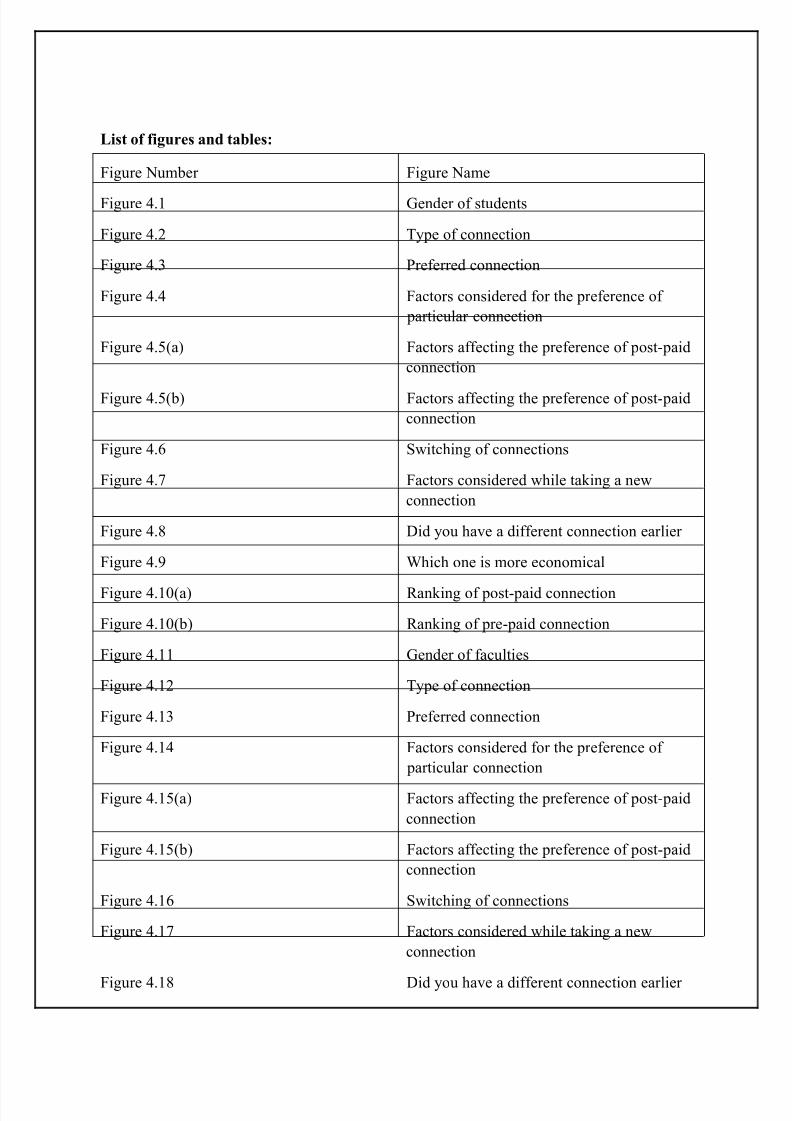
List of figures and tables:
Figure Number Figure Name
Figure 4.1 Gender of students
Figure 4.2 Type of connection
Figure 4.3 Preferred connection
Figure 4.4 Factors considered for the preference of
particular connection
Figure 4.5(a) Factors affecting the preference of post-paid
connection
Figure 4.5(b) Factors affecting the preference of post-paid
connection
Figure 4.6 Switching of connections
Figure 4.7 Factors considered while taking a new
connection
Figure 4.8 Did you have a different connection earlier
Figure 4.9 Which one is more economical
Figure 4.10(a) Ranking of post-paid connection
Figure 4.10(b) Ranking of pre-paid connection
Figure 4.11 Gender of faculties
Figure 4.12 Type of connection
Figure 4.13 Preferred connection
Figure 4.14 Factors considered for the preference of
particular connection
Figure 4.15(a) Factors affecting the preference of post-paid
connection
Figure 4.15(b) Factors affecting the preference of post-paid
connection
Figure 4.16 Switching of connections
Figure 4.17 Factors considered while taking a new
connection
Figure 4.18 Did you have a different connection earlier
8/8/2019 Factors Impacting Consumers
http://slidepdf.com/reader/full/factors-impacting-consumers 9/52
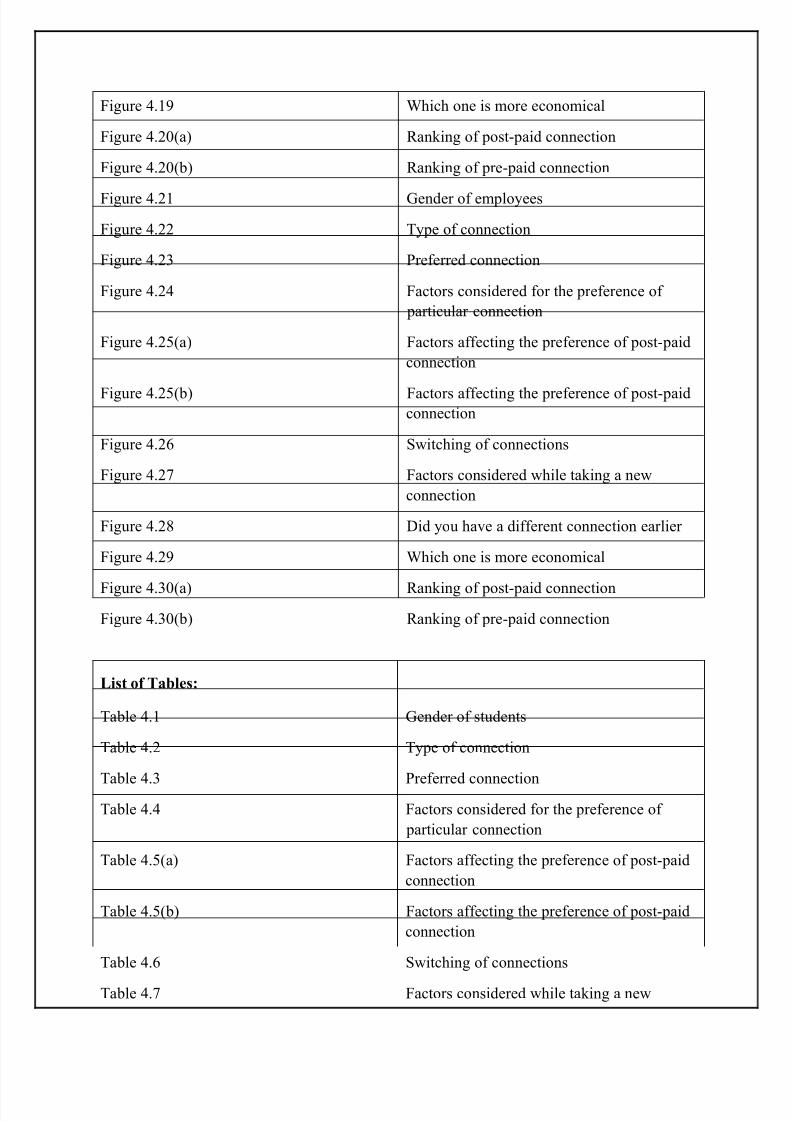
Figure 4.19 Which one is more economical
Figure 4.20(a) Ranking of post-paid connection
Figure 4.20(b) Ranking of pre-paid connection
Figure 4.21 Gender of employees
Figure 4.22 Type of connection
Figure 4.23 Preferred connection
Figure 4.24 Factors considered for the preference of
particular connection
Figure 4.25(a) Factors affecting the preference of post-paid
connection
Figure 4.25(b) Factors affecting the preference of post-paidconnection
Figure 4.26 Switching of connections
Figure 4.27 Factors considered while taking a new
connection
Figure 4.28 Did you have a different connection earlier
Figure 4.29 Which one is more economical
Figure 4.30(a) Ranking of post-paid connection
Figure 4.30(b) Ranking of pre-paid connection
List of Tables:
Table 4.1 Gender of students
Table 4.2 Type of connection
Table 4.3 Preferred connectionTable 4.4 Factors considered for the preference of
particular connection
Table 4.5(a) Factors affecting the preference of post-paid
connection
Table 4.5(b) Factors affecting the preference of post-paid
connection
Table 4.6 Switching of connections
Table 4.7 Factors considered while taking a new
8/8/2019 Factors Impacting Consumers
http://slidepdf.com/reader/full/factors-impacting-consumers 10/52
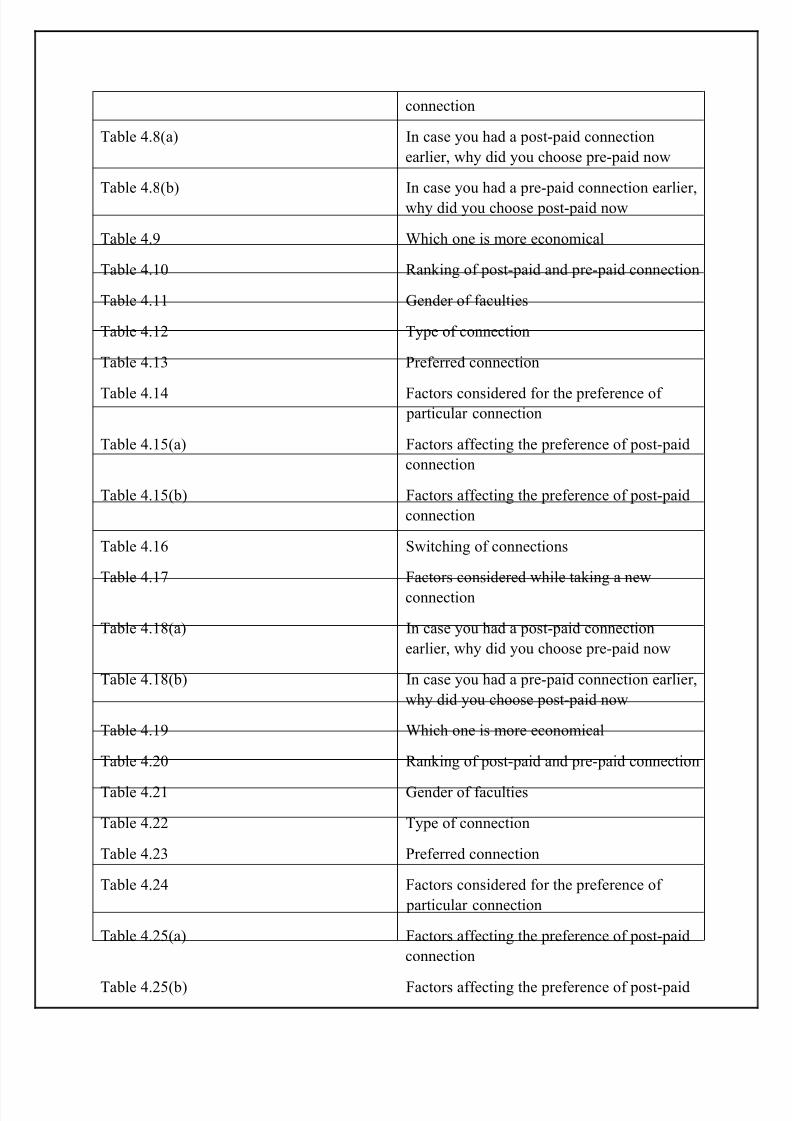
connection
Table 4.8(a) In case you had a post-paid connection
earlier, why did you choose pre-paid now
Table 4.8(b) In case you had a pre-paid connection earlier,
why did you choose post-paid now
Table 4.9 Which one is more economical
Table 4.10 Ranking of post-paid and pre-paid connection
Table 4.11 Gender of faculties
Table 4.12 Type of connection
Table 4.13 Preferred connection
Table 4.14 Factors considered for the preference of particular connection
Table 4.15(a) Factors affecting the preference of post-paid
connection
Table 4.15(b) Factors affecting the preference of post-paid
connection
Table 4.16 Switching of connections
Table 4.17 Factors considered while taking a new
connection
Table 4.18(a) In case you had a post-paid connection
earlier, why did you choose pre-paid now
Table 4.18(b) In case you had a pre-paid connection earlier,
why did you choose post-paid now
Table 4.19 Which one is more economical
Table 4.20 Ranking of post-paid and pre-paid connection
Table 4.21 Gender of faculties
Table 4.22 Type of connection
Table 4.23 Preferred connection
Table 4.24 Factors considered for the preference of
particular connection
Table 4.25(a) Factors affecting the preference of post-paid
connection
Table 4.25(b) Factors affecting the preference of post-paid

8/8/2019 Factors Impacting Consumers
http://slidepdf.com/reader/full/factors-impacting-consumers 11/52
connection
Table 4.26 Switching of connections
Table 4.27 Factors considered while taking a new
connection
Table 4.28(a) In case you had a post-paid connection
earlier, why did you choose pre-paid now
Table 4.28(b) In case you had a pre-paid connection earlier,
why did you choose post-paid now
Table 4.29 Which one is more economical
Table 4.30 Ranking of post-paid and pre-paid connection
8/8/2019 Factors Impacting Consumers
http://slidepdf.com/reader/full/factors-impacting-consumers 12/52
1. Chapter 1
1.1 Introduction1.2 History of Telecommunication
1.3 Growth in Telecom Sector
1.4 Future Outlook of Telecom Sector
1.5 Indian telecom services
1.6 Opportunities of Telecom sector In India1.7 Major Players in Assam
8/8/2019 Factors Impacting Consumers
http://slidepdf.com/reader/full/factors-impacting-consumers 13/52
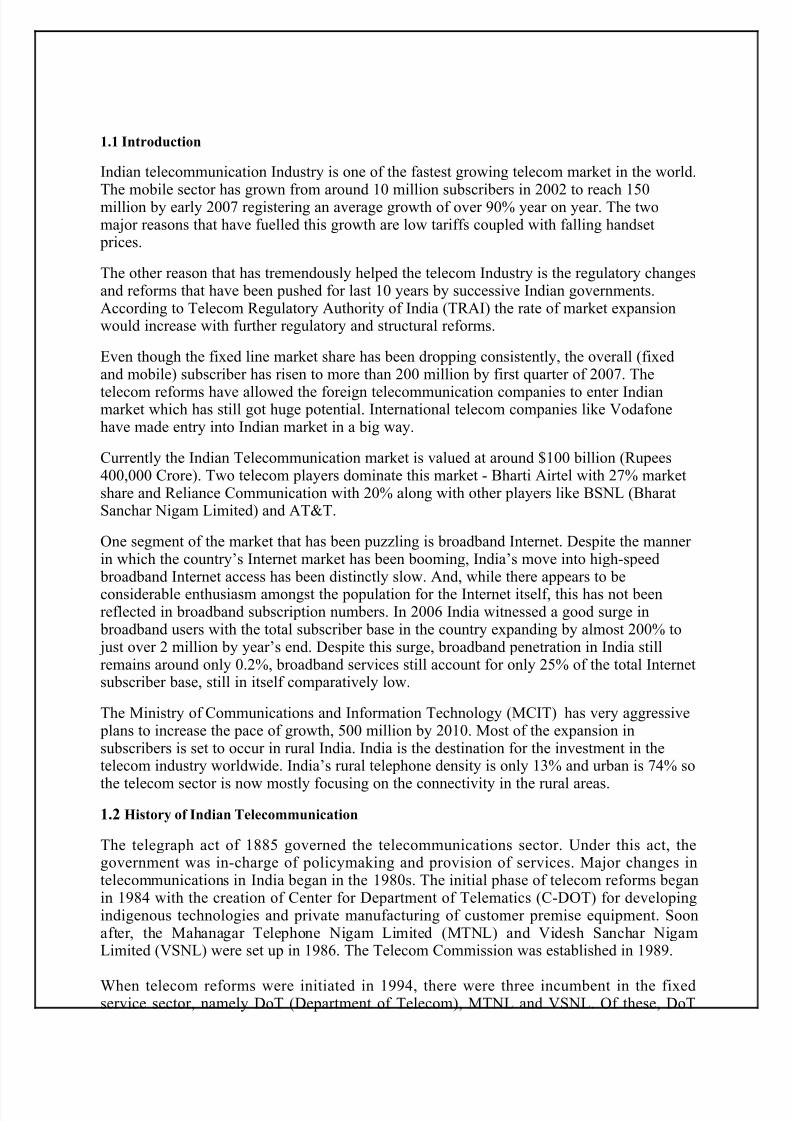
1.1 Introduction
Indian telecommunication Industry is one of the fastest growing telecom market in the world.
The mobile sector has grown from around 10 million subscribers in 2002 to reach 150million by early 2007 registering an average growth of over 90% year on year. The twomajor reasons that have fuelled this growth are low tariffs coupled with falling handset
prices.
The other reason that has tremendously helped the telecom Industry is the regulatory changesand reforms that have been pushed for last 10 years by successive Indian governments.According to Telecom Regulatory Authority of India (TRAI) the rate of market expansionwould increase with further regulatory and structural reforms.
Even though the fixed line market share has been dropping consistently, the overall (fixedand mobile) subscriber has risen to more than 200 million by first quarter of 2007. The
telecom reforms have allowed the foreign telecommunication companies to enter Indianmarket which has still got huge potential. International telecom companies like Vodafonehave made entry into Indian market in a big way.
Currently the Indian Telecommunication market is valued at around $100 billion (Rupees400,000 Crore). Two telecom players dominate this market - Bharti Airtel with 27% marketshare and Reliance Communication with 20% along with other players like BSNL (BharatSanchar Nigam Limited) and AT&T.
One segment of the market that has been puzzling is broadband Internet. Despite the manner in which the country’s Internet market has been booming, India’s move into high-speed
broadband Internet access has been distinctly slow. And, while there appears to be
considerable enthusiasm amongst the population for the Internet itself, this has not beenreflected in broadband subscription numbers. In 2006 India witnessed a good surge in
broadband users with the total subscriber base in the country expanding by almost 200% to just over 2 million by year’s end. Despite this surge, broadband penetration in India stillremains around only 0.2%, broadband services still account for only 25% of the total Internetsubscriber base, still in itself comparatively low.
The Ministry of Communications and Information Technology (MCIT) has very aggressive plans to increase the pace of growth, 500 million by 2010. Most of the expansion insubscribers is set to occur in rural India. India is the destination for the investment in thetelecom industry worldwide. India’s rural telephone density is only 13% and urban is 74% so
the telecom sector is now mostly focusing on the connectivity in the rural areas.
1.2 History of Indian Telecommunication
The telegraph act of 1885 governed the telecommunications sector. Under this act, thegovernment was in-charge of policymaking and provision of services. Major changes intelecommunications in India began in the 1980s. The initial phase of telecom reforms beganin 1984 with the creation of Center for Department of Telematics (C-DOT) for developingindigenous technologies and private manufacturing of customer premise equipment. Soonafter, the Mahanagar Telephone Nigam Limited (MTNL) and Videsh Sanchar NigamLimited (VSNL) were set up in 1986. The Telecom Commission was established in 1989.
When telecom reforms were initiated in 1994, there were three incumbent in the fixedservice sector, namely DoT (Department of Telecom), MTNL and VSNL. Of these, DoT
8/8/2019 Factors Impacting Consumers
http://slidepdf.com/reader/full/factors-impacting-consumers 14/52
operated in all parts of the country except Delhi and Mumbai. MTNL operated in Delhi andMumbai and VSNL provided international telephony.
Given its all-India presence and policy-making powers, the DoT enjoyed a monopoly in thetelecom sector prior to the major telecom reforms. However, subsequent to the second phase
of reforms in 1999, which included restructuring the DoT to ensure a level playing fieldamong private operators and the incumbent, the service-providing sector of DoT was split upand called Department of Telecom Services (DTS). DTS was later corporatized and renamedBharat Sanchar Nigam Limited (BSNL). This meant separation of the incumbent service
provider from the policy-maker. Broadly, DoT is now responsible for policy-making,licensing and promotion of private investments in both telecom equipment and manufactureand provision of telecom services. BSNL, a corporate body, is responsible for the provisionof services.
A crucial aspect of the institutional reform of the Indian telecom sector was setting up of anindependent regulatory body in 1997 – the Telecom Regulatory Authority of India (TRAI),
to assure investors that the sector would be regulated in a balanced and fair manner. TRAIhas been vested with powers to ensure its independence from the government. Thegovernment has retained the licensing function with itself. The main issue with respect tolicensing has not been whether it should be with the regulator but that the terms andconditions of licensing should involve consultations with TRAI to ensure transparency in the
bidding process Some of the main functions of TRAI include fixing tariffs for telecomservices, dispute-settlement between service providers, protecting consumers throughmonitoring of service quality and ensuring compliance to license conditions, setting servicetargets and pricing policy for all operators and service providers.
Further changes in the regulatory system took place with the TRAI Act of 2000 that aimed atrestoring functional clarity and improving regulatory quality. TRAI can frame regulationsand can levy fees and charges for telecom services as deemed necessary. The regulatory
body also has a separate fund (called the TRAI General Fund) to facilitate its functioning. Tofairly adjudicate any dispute between licensor and licensee, between service provider,
between service provider and a group of consumers, a separate disputes settlement body wasset up called Telecom Disputes Settlement and Appellate Tribunal (TDSAT).
Actually, telecommunications is not a new concept. It began in the mid-1800s with thetelegraph, whereby sounds were translated manually into words, then the telephone,developed in 1876, transmitted voices, and then the teletypewriter, developed in the early1900s, was able to transmit the written word.
Since the 1960s, telecommunications development has been rapid and wide reaching.Deregulation and new technology have created increased competition and widened the rangeof network services available throughout the world. This increase in telecommunicationcapabilities allows businesses to benefit from the information revolution in numerous ways,such as streamlining their inventories, increasing productivity, and identifying new markets.In the following sections, the technology of modern telecommunications will be discussed
Progress of reforms
8/8/2019 Factors Impacting Consumers
http://slidepdf.com/reader/full/factors-impacting-consumers 15/52
a. Private Participation in Telecom - For the provision of basic services, the entire countrywas divided into 21 telecom circles, excluding Delhi and Mumbai. With telecom marketsopened to competition, DoT and MTNL were joined by private operators but not in all partsof the country. By mid-2001, all six of the private operators in the basic segment had startedoperating After a recent licensing exercise in 2002, there exists competition in most service
areas. However, the market is still dominated by the incumbent. In December 2002, the private sector provided approximately 10 million telephones in fixed, WLL (Wireless LocalLoop) and cellular lines compared to 0.88 million cellular lines in March 1998 (DoT AnnualReport, 2002). 72 per cent of the total private investment in telecom has been in cellular mobile services followed by 22 per cent in basic services. After the recent changes, the stageis now set for greater competition in most service areas for cellular mobile Over the time,the rise in coverage of cellular mobile will imply increased competition even for the basicservice market because of competition among basic and cellular mobile services.
b. Tele density and Village Public Phones (VPTs) - India's rapid population increasecoupled with its progress in telecom provision has landed India's telephone network in the
sixth position in the world and second in Asia (ITU). Tele density has risen to 4.9 phones per 100 persons in India compared to the average 7.3 mainlines per 100 people around the world.Although, the coverage is still much higher in urban areas - 13.7 in urban areas comparedto1.4 in rural areas, the government has made efforts to connect villages through village
public telephones (VPT) and Direct Exchange Lines (DEL)
c. Foreign Participation – India has opened its telecom sector to foreign investors up to 100 percent holding in manufacturing of telecom equipment, internet services, and infrastructure providers (e-mail and voice mail), 74 percent in radio-paging services, internet (internationalgateways) and 49 percent in national long distance, basic telephone, cellular mobile, andother value added services (FICCI, 2003). Since 1991, foreign direct investment (FDI) in thetelecom sector is second only to power and oil - 858 FDI proposals were received during1991-2002 totaling Rs.56, 279 crore. (DoT Annual Report, 2002). Until now, most of theFDI has come in the cellular mobile sector partly due to the fact that there have been morecellular mobile operators than fixed service operators. For instance, during the period 1991-2001, about 44 percent of the FDI was in cellular mobile and about 8 percent in basic servicesegment.
d. Tariff-setting - An essential ingredient of the transition from a protected market tocompetition is the alignment of tariffs to cost-recovery prices. Traditionally, DoT tariffscross-subsidized the costs of access (as reflected by rentals) with domestic and internationallong distance usage charges. Therefore, re-balancing of tariffs - reducing tariffs that areabove costs and increasing those below costs - was an essential pre-condition to promotingcompetition among different service providers and efficiency in general.
TRAI issued its first directive regarding tariff-setting by re-balancing tariffs and to lead in anera of competitive service provision. Subsequently, it conducted periodic reviews and madechanges in the tariff levels, if necessary. Re-balancing led to a reduction in cross-subsidization in the fixed service sector.
e. Service Quality - One of the main reasons for encouraging private participation in the provision of infrastructure rests on its ability to provide superior quality of service. In India,as in many developing countries, low tele density resulted in great emphasis being laid onrapid expansion often at the cost of quality of service. One of the benefits expected from the
private sector's entry into telecom is an improvement in the quality of service to internationalstandards. Private operators are expected to provide consumers value for their money.
8/8/2019 Factors Impacting Consumers
http://slidepdf.com/reader/full/factors-impacting-consumers 16/52
Telephone faults per 100 main lines came down to 10.32 and 19.14 in Mumbai and Delhirespectively in 2002-03 compared to 11.72 and 26.6 in 1997-98 .Quality of service wasidentified as an important reform agenda and TRAI has devised QOS (Quality of Service)norms that are applicable across the board to all operators .
Pre reform period and Telecommunication in India
Before 1990's Telecommunication services in India were complete government Monopoly -the Department of Telecommunication (DoT). Government also retained the rights for manufacturing of Telecommunication equipments. MTNL and VSNL were created in theyear 1986.Early 1990's saw initial attempts to attract private investment.
A notable revolution has occurred in the telecom sector. In the pre reforms era, this wasentirely in the hands of the central government and due to lack of competition, the callcharges were quite high. Further, due to lack of funds with the government, the governmentcould never meet the demand for telephones. In fact, a person seeking a telephone
connection had to wait for years before he could get a telephone connection. The servicerendered by the government monopoly was also very poor. Wrong billing, telephones lyingdead for many days continuously due to slackness on the part of the telecom staff to attend tocomplaints, cross connections due to faulty ill maintained telephone lines, obsoleteinstruments and machinery in the telephone department were the order of the day in the prereforms era.
Today, there are many players in the telecom sector. The ultimate beneficiary has been theconsumer. Prices of services in this sector have fallen drastically.
Telephone connections are today affordable to everyone and are also easily available. Goneare the days, when one had to wait for years to get a telephone connection. The number of telephone connections which was only 2.15 million (fixed lines) in 1981 increased to 5.07million (fixed lines) in 1991. In the year 2003, there were 54.62 million telephoneconnections of which 41.33 million are fixed line telephone connections, 12.69 million arecellular mobiles and the remaining 0.60 million are WLL telephones1. Wireless in LocalLoop (WLL) telephones and cellular mobile telephones were unknown in India a few yearsago. Cell phones charges have come down so much that today one can see even a commonman going around with a cell phone in his hand. The private companies are giving variousincentives to attract customers, a situation which is entirely opposite to the conditions
prevailing in the pre reforms era when one had to wait for years to get a telephoneconnection.
Liberalization and reforms in Telecom sector since early 1990's till date are briefed below:
1991-92:
1. On 24th July 1991, Government announced the New Economic Policy.2. Telecom Manufacturing Equipment license was delicensed in 1991.3. Automatic foreign collaboration was permitted with 51 per cent equity by the collaborator.
1992-93:
Value added services were opened for private and foreign players on franchise or license
basis. These included cellular mobile phones, radio paging, electronic mail, voice mail, dataservices using VSAT's, and video conferencing.
8/8/2019 Factors Impacting Consumers
http://slidepdf.com/reader/full/factors-impacting-consumers 17/52
1994-95:
1. The Government announced a National Telecom Policy 1994 in September 1994. Itopened basic telecom services to private participation including foreign investments.
2. Foreign equity participation up to 49 per cent was allowed in basic telecom services, radio paging and cellular mobile. For value added services the foreign equity cap was fixed at 51 per cent.3. Eight cellular licenses for four metros were finalized.
1996-97:
1. TRAI was set up as an autonomous body to separate the regulatory functions from policyformulations and operational functions.2. Coverage of the term "infrastructure" expanded to include telecom to enable the sector toavail of fiscal incentives such as tax holiday and concessional duties.
3. An agreement between Department of Telecommunication (DoT) and financial institutionsto facilitate funding of cellular and basic telecom projects.4. Internet Policy was finalized.
1998-99:
FDI up to 49 per cent of total equity, subject to license, permitted in companies providingGlobal Mobile Personal Communication (GMPC) by satellite services.
1999-00:
1. National Telecom Policy 1999 was announced which allowed multiple fixed Servicesoperators and opened long distance services to private operators.2. TRAI was reconstituted. A clear distinction was made between the recommendatory andregulatory functions of the Authority.3. DOT/MTNL was permitted to start cellular mobile telephone service.4. To separate service providing functions from policy and licensing functions, Departmentof Telecom Services was set up.5. A package for migration from fixed license fee to revenue sharing offered to existingcellular and basic service providers.6. First phase of re-balancing of tariff structure started. STD and ISD charges were reduced
by 23 per cent on an average.7. Voice and data segment was opened to full competition and foreign ownership increasedto 100 per cent from 49 per cent previously.
2000-01:
1. TRAI Act was amended. The Amendment clarified and strengthened the recommendatory power of TRAI, especially with respect to the need and timing of introduction of newservices provider, and in terms of licenses to a services provider.
2. Department of Telecom Services and Department of Telecom operations corporatized bycreating Bharat Sanchar Nigam Limited.
8/8/2019 Factors Impacting Consumers
http://slidepdf.com/reader/full/factors-impacting-consumers 18/52
3. Domestic long distance services opened up without any restriction on the number of operators.4. Second phase of tariff rationalization started with further reductions in the long distanceSTD rates by an average of 13 per cent for different distance slabs and ISD rates by 17 per cent.
5. Internet Service Providers were given approval for setting up of International Gatewaysfor Internet using satellite as a medium in March 2000.6. In August 2000, private players were allowed to set up international gateways via thesubmarine cable route.7. The termination of monopoly of VSNL in International Long Distance services wasantedated to March 31, 2002 from March 31, 2004.
2001-02:
1. Communication Convergence Bill, 2001 was introduced in August 2001.2. Competition was introduced in all services segments. TRAI recommended opening up of
market to full competition and introduction of new services in the telecom sector. Thelicensing terms and conditions for Cellular Mobile were simplified to encourage entry for operators in areas without effective competition.3. Usage of Voice over Internet Protocol permitted for international telephony service.4. The five-year tax holiday and 30 per cent deduction for the next five years available to thetelecommunication sector till 31st March 2000 was reintroduced for the units commencingtheir operations on or before 31st March 2003. These concessions were also extended tointernet services providers and broadband networks.5. License conditions for Global Mobile Personal Communications by Satellite finalized in
November 2001.6. National Long Distance Service was opened up for unrestricted entry with theannouncement of guidelines for licensing NLD operators.7. The basic services were also opened up for competition. 33 Basic Service licenses (31
private and one each to MTNL and BSNL) were issued up to 31stDecember 2001.8. Four cellular operators, one each in four metros and thirteen were permitted with 17 freshlicenses issued to private companies in September/October 2001. The cell phone providerswere given freedom to provide, within their area of operation, all types of mobile servicesequipment, including circuit and/or package switches that meet the relevant InternationalTelecommunication Union (ITU)/ Telecom Engineering Centre (TEC) standards.9. Wireless in Local Loop (WLL) was introduced for providing telephone connection inurban, semi-urban and rural areas.10. Disinvestment of PSU's in the telecom sector was also undertaken during the year. InFebruary 2002, the disinvestment of VSNL was completed by bringing down the governmentequity to 26 per cent and the management of the company was transferred to Tata Group, astrategic partner.12. Government allowed CDMA technology to enter the Indian market.13. Reliance, MTNL and Tata were issued licenses to provide the CDMA based services inthe country.14. TRAI recommended deregulating regulatory intervention in cellular tariffs, which meantthat operators need no longer have prior approval of the regulator for implementing tariff
plans except under certain conditions.
2002-03
8/8/2019 Factors Impacting Consumers
http://slidepdf.com/reader/full/factors-impacting-consumers 19/52
1. International long distance business opened for unrestricted entry.2. Telephony on internet permitted in April 2002.
3. TRAI finalized the System of Accounting Separation (SAS) providing detailedaccounting and financial system to be maintained by telecom service providers.
2003-04
1. Unified Access Service Licenses regime for basic and cellular services was introduced inOctober 2003. This regime enabled services providers to offer fixed and mobile servicesunder one license.2. Interconnection Usage Charge regime was introduced with the view of providingtermination charge for cellular services3. The Telecommunication Interconnection Usage Charges Regulation 2003 was introducedon 29th October 2003 which covered arrangements among service providers for payment of
Interconnection Usage Charges for Telecommunication Services and covered Basic Servicethat includes WLL (M) services, Cellular Mobile Services, and Long Distance Services(STD/ISD) throughout the territory of India.4. The Universal Service Obligation fund was introduced as a mechanism for transparentcross subsidization of universal access in telecom sector. The fund was to be collectedthrough a 5 per cent levy on the adjusted gross revenue of all telecom operators.5. Broadcasting notified as Telecommunication services under Section 2(i)(k) of TRAI Act.
2004-05:
1. Budget 2004-05 proposed to lift the ceiling from the existing 49 per cent to 74 per cent asan incentive to the cellular operators to fall in line with the new unified licensing norm.2. Broadband Policy announced on 14th October 2004. In this policy, broadband had beendefined as an "always-on" data connection supporting interactive services including internetaccess with minimum download speed of 256 kbps per subscriber.3. The Telecommunications (Broadcasting and Cable Services) Interconnection Regulation2004 was introduced on 10th December 2004.6. BSNL and MTNL launched broadband services on 14th January 2005.7. TRAI announced the reduction of Access Deficit Charge (ADC) by 41 per cent on ISDcalls and by 61 per cent on STD calls which were applicable from 1st February 2005.
2005-2006
1. Budget 2005-2006 cleared a hike in FDI ceiling to 74 per cent from the earlier limit of 49 per cent. 100 per cent FDI was permitted in the area of telecom equipment manufacturingand provision of IT enabled services.2. Annual license fee for National Long Distance (NLD) as well as International LongDistance (ILD) licenses reduced to 6 per cent of Adjusted Gross Revenue (AGR) with effectfrom 1st January 2006.3. BSNL and MTNL launched the 'One-India Plan' with effect from 1st March 2006 whichenable the customers of BSNL and MTNL to call from one end of India to other at the cost
of Rs. 1 per minute, any time of the day to phone.
8/8/2019 Factors Impacting Consumers
http://slidepdf.com/reader/full/factors-impacting-consumers 20/52
4. TRAI fixed Ceiling Tariff for International Bandwidth, Ceiling Tariff for higher capacitiesreduced by about 70 per cent and for lower capacity by 35 per cent.5. Regulation on Quality of Service of Basic and Cellular Mobile Telephone Services 2005introduced on 1st July 2005.6. BSNL announced 33 per cent reduction in call charges for all the countries for
international calls.7. Quality of Service (Code of Practice for Metering and Billing Accuracy) Regulation 2006introduced on 21st March 2006.
2007-20012
FDI in Telecom sector has increased in recent years with value of 81.62 billion with share of 10% in total inflow during January 2000 to June 2005. This is mainly in telecom services andnot in telecom manufacturing sector. Therefore, it is essential to enhance the prospect for inflow of increased funds. But till date export of telecom equipment remains minimal. Mostof the state-of-the-art telecom equipments including mobile phones are imported from
abroad. There is thus immense potential for indigenous manufacturing in India. Certainmeasures like financial packages, formation of a telecom export promotion council, creationof integrated facilities for telecom equipment through SEZ and encouraging overseasvendors to set up facilities in India, are required for making India a hub for telecomequipment manufacturing and attract FDI. The telecom sector has shown robust growthduring the past few years. It has also undergone a substantial change in terms of mobileversus fixed phones and public versus private participation.
1.3 Growth in Telecom Sector
Indian telecom sector has undergone a major process of transformation through significant policy reforms. With 359 million telephone subscribers today, India now boasts of havingthe second largest telecom network in the world after China. The country is adding some 8.5million to 10 million new mobile subscribers to the network every month to also emerge asone of the fastest growing telecom markets in the world. The telecom industry also saw anestimated $8.5 billion in investment flow in during 2006-07 alone, of which $550 millionwas in the form of foreign direct investment. All major telecom handsets manufacturers havetheir presence in India, so do the leading global service companies and infrastructure majors.The next phase of growth will be in the country's vast rural areas –that would bring moredevelopment. Also, with a tele-density of just 8 percent in rural India, as opposed to 50
percent in urban centers, the hinterland offers good scope for expansion.
The Telecom sector in India has witnessed unparalleled growth by global standards. In alittle over a decade of wireless telephony, India has moved from a subscriber base of zero to
becoming the second-largest market in the world after China. It can be hoped that the progressive policies would facilitate growth and evolution of this sector by providingimpetus to free flow of investment, ideas and technology. The progress in the sector has beensomething to be proud of and it is often viewed as ample testimony to the India growth story.Several developments in the industry are afoot, which will be crucial to defining the state of this industry in times to come. Additional 2G spectrum has been recently allotted, allowingthe entry of several new players — wherein a majority of them are also acquiring strategicinternational partners, commencing the globalization of Indian Telecom. The rollout of 3G,
which could potentially transform the bouquet of services extended to consumers fromvanilla voice and basic data to rich entertainment and far more, is poised for a take-off with
8/8/2019 Factors Impacting Consumers
http://slidepdf.com/reader/full/factors-impacting-consumers 21/52
the impending auction of the 3G spectrum. Broadband — conventional as well as wireless — is poised for a major dive. In the wake of such developments, a concerted effort must bemade between the industry and the Government (as the prime mover and regulator on
policies in Telecom) on ensuring that policies, regulations and laws are formulated in amanner that creates systematic growth and harnesses the full potential of this industry for the
Indian consumer.Confederation of Indian Industry CII, in collaboration with Ernst & Young, has put together the report “India 2012: Telecom Growth Continues”, which brings out the current status of the industry with a brief perspective on how that growth has been achieved, and sets thecontext for the landscape in 2012. It focuses on current issues and the envisaged futureconcerns and potential points of debate, which would need to be jointly addressed by theindustry and the Government in order to enable this industry to continue on its already-impressive growth trajectory, and become the cynosure of the Telecom world.
1.4 Future Outlook of Telecom Market in India
Telecom penetration in India at around 27 per cent is still very low. With the increase in thenumber of operators in the markets and better population coverage, the sector is likely togrow at a rapid pace in the future. The wireless subscriber base in India is expected to reacharound 470 million by March 2010. Wireless and data segments are likely to be the growthdrivers for the industry in the medium term. Broadband penetration in India is negligible ataround 1 per cent only. The segment has huge growth potential and is likely to be nextgrowth driver for the sector. There are many global players who are looking to enter theIndian market. In such a scenario, it is unlikely to see a slowdown in investments.
1.5 Indian Telecom Services
Indian Telecom Services are divided into three parts:
• Basic services• Mobile Services and• Internet Services
Basic Services: Basic services include fixed wire line and wireless in local loop(WLL-fixed). In 2006–07, basic services subscribers exceeded 50 million. Fixed wireline services hold a major market share of 83 percent in basic services.BSNL andMTNL are market leaders in this segment.Although the government-owned BSNLdominates the segment in terms of subscriber base and market share, private players
have registered a notable growth.
Mobile Services: Mobile services have led to a spectacular growth in the Indiantelecom industry. Currently, 12 players are active in this segment. The total number of wireless subscribers escalated to 185.13 million at the end of June 2007, with amonthly addition of more than 6 million wireless subscribers. Despite the decreasingARPU, the minutes of usage is on a rise, which provides impetus to the mobileservices growth in India.
Internet Services: The emergence of private players and new technologies has provided a strong impetus to the growth of Internet and broadband services. Thequality and penetration of these services have undergone changes, with significant
improvement in the telecom infrastructure. The Internet subscriber base registered aCAGR of 60 percent for the period 1997–98 to 2006–07. BSNL and MTNL caters to
8/8/2019 Factors Impacting Consumers
http://slidepdf.com/reader/full/factors-impacting-consumers 22/52
more than two-thirds of Internet subscribers in India. India had 2.52 million broadband connections at the end of June 2007. Private players are catching up fastdue to increased penetration of Internet and broadband services in India. The telecommarket will experience high penetration of Internet services with the support fromgovernment policies and introduction of novel technologies in India.
1.6 Opportunities of Telecom Sector in India
According to the report presented by taking into account the statement of Indian Ministry of Communications and Information Technology, the telecom opportunities in India has beengrowing by 20 to 40 percent every year since past 3 years. The telecom services in Indiahave been recognized as a world-class tool for the socio-economic development in India.India is known to rank fourth in the telecom industry in Asia after China, Japan, and SouthKorea and the telecom network in India is known to stand in the eighth position across theglobe and second among the emerging economies.
The tele-density has grown leaps and bounds in the past few years from 2.3 percent in 1999to 4.8 percent in 2002. The world average percentage for the telecom industry as against theIndian average is 7.5 times while the Asian average against the same was 4.5 times. Thecurrent market range of the telecommunication industry in India has been estimated to USD8 billion and this is expected to undergo an accretion by the end of 2012.
The growth witnessed by the telecom market in India has increased the number of opportunities for the industry and this has been fueled by the growing mobile sector, whichhas attained the consumer level of 10 million by the end of December 2002 that was almost100 percent in the year. This outstanding growth in the mobile sector explains the advent of digital cellular technology and reduced tariffs as a consequence of competitive pressures.The growth in the cellular subscribers has surpassed the benchmark of subscriber base. Thetelecom market has increased dramatically with the advent of Wireless in Local LoopTechnology.
Telecommunication Sector Opportunities in India assures a transparent, safe, and securedambiance for the telecom market. Around 300 million population of highly consumablemiddle-class status that is advantageous for the industry surrounds the telecom sector inIndia. This is because, in some of the Indian that possess land line telephones can besubstituted by mobile phones
that is very unlike the developed countries. Therefore, it adds up to the growth in mobile
sector in Indian telecom industry.
Few more Telecommunication Sector Opportunities in India include introduction of Internettelephony services, privatization of VSNL, and introduction of a number of internationallong distance services sector. The opportunities in the Indian telecom sector is increasing at amassive pace with the introduction of newer and innovative schemes in various sectors andat present the telecom sector in India is claimed to be one of the major contributors in India'sflourishing economy.
1.7 Major players in Assam
Overall there are seven major players in Assam which are as follows:-
BSNL
8/8/2019 Factors Impacting Consumers
http://slidepdf.com/reader/full/factors-impacting-consumers 23/52
Assam Telecom Circle BSNL is the largest Telecom Operator in Assam providingcomprehensive range of telecom services in the state: Landline phone, WLL Mobile, GSMMobile, Internet, Broadband, I-Net, IN Services, Telegraph/Telex, Carrier service, MPLS-VPN etc. BSNL Assam Circle is the only service provider, making focused efforts and
planned initiatives to bridge the Rural-Urban Digital Divide ICT sector. BSNL has declared
year 2007 as The Year of North East emphasizing focused development thrust on the NE thatincludes redundancy in OFC media, 90% umbrella coverage on WLL, extension of GSMMobile coverage to villages having population greater than 1000 and Broadband connectionsin all DHQs and important towns. BSNL crosses 1 Million customer base in Assam. AssamCircle has a subscriber’s base as follows (as on 30/06/2007)
Airtel
Airtel's journey to leadership, which started from one circle, single city mobile service inDelhi culminates in Assam – a land with a rich legacy of culture & civilization. Airtel todayconnects India from the Indus to the Indian Ocean and from Sabarmati to the Brahmaputra
on a network of more than 10,000 base stations with cumulative investments of more thanRs. 16,000 crores. In the Assam and North East circles, Bharti has deployed a state-of-the-artER network covering key towns and highways, managed by Ericsson - world leaders intelecom infrastructure. In addition to world-class customer care, seamless coverage andunmatched value proposition, Airtel will also offer its customers innovative value addedservices like Airtel Live, Hello Tunes. This is in keeping with Airtel’s endeavour to offer
best in class mobile services to all its customers across the country.
Aircel
Aircel began its outward expansion in 2005 and met with unprecedented success in theEastern frontier circles. It emerged a market leader in Assam and in the North Eastern
provinces within 18 months of operations. Till today, the company gained a foothold in 17circles including Chennai, Tamil Nadu, Assam, North East, Orissa, Bihar, Jammu &Kashmir, Himachal Pradesh, West Bengal, Kolkata, Kerala, Andhra Pradesh, Karnataka,Delhi, UP(West), UP(East) and Mumbai. Aircel has been expanding its business in different
places of Assam continuously. But without any security ring. For its mobile networks theAircel established ultra-modern mobile towers in different areas of Sivasagar District. TheAircel Company has not been with provide 24hour security to these towers, which consist of different electronic materials, Generator set etc. There is no adequate security to protect itstowers. There is no security personal in the sector one number tower of Nazira, which issituated in front of the Nazira HS & MP School. Deforestation causes concern.
Reliance
Reliance Telecom Limited will expand its service to upper Assam, Aizwal and Imphal, fromits existing set-up in Guwahati and Shillong. According to RTL officials, the company is
putting up additional 10-12 base stations in Guwahati to increase penetration and improveservices. The company is also working on revised call rates to face competition from BSNLand Airtel. Reliance Telecom currently has around 50 base stations in Guwahati. The servicehas a customer base of around 1.10 lakh in Assam, mostly in Guwahati. Besides, it hasaround 28,000 customers in NE circle. The aim is to get 2 lakh users by end of this fiscal
year. Reliance Telecom has been adding 6,000 customers every month in the region from1,500-2,000 earlier. The official said sales rose following re-launch of pre-paid services in
8/8/2019 Factors Impacting Consumers
http://slidepdf.com/reader/full/factors-impacting-consumers 24/52
Assam and NE circles from December 2004. Incidentally, the prepaid service was banned inthe region in early 2003 on security grounds. “Relaunch of the prepaid service has reallymade the difference. Reliance is the only telecom company that is providing mobile servicesover both- CDMA and GSM networks.With an optical fiber network of 80,000 kms, the company aims at providing best services to
its customers. It also has 15,000 Base Transceiver Stations across the country providingreliable wireless network.
Tata Indicom
Tata Teleservices Limited, India’s fastest growing telecom service provider, has launched itsmuch awaited telecom operation in the Assam circle, under its brand Tata Indicom. Thecompany has introduced an exciting range of products which include Prepaid and Postpaidmobile services, Photon-High Speed Internet Access, Fixed Wireless Telephony under the
brand name Walky Talky and a host of value added services. To increase its nationalfootprint TTSL has invested over Rs 100 crore, in Assam circle establishing a pan India
network with 20 circles. During the current stage of launch, Tata Tele Services Ltd will provide seamless coverage in 31 towns of Assam and will shortly be launching services inthe North East region. On the occasion of launching services in Assam, Tata- Indicomintroduced North East Corridor Starter Pack just for Rs. 199/-. Subscribers in the region cannow make STD calls across Assam for just 50 paisa per minute.Tata Indicom is committed to providing best-in-industry product & service and host of valueadded benefits. With unmatched coverage and voice clarity, Tata Indicom provide itscustomers a unique experience of latest technology at an affordable cost. Tata Indicom
products & services will be available at exclusive Tata Indicom Showrooms and severalretail selling points (RSP’s) across the state. Tata Teleservices has already installed over 134cell sites in the first phase of its network roll out itself.
Vodafone
British telecom firm Vodafone launch its brand and services in India in October 2008.For the purpose of promotion they offered low-cost handsets for the mass and international servicessuch as Vodafone Passport, Vodafone Simply and Vodafone live. The telecom player offeredhandsets at Rs 666 at the lower end. This will fit in with the company’s plans to capture themass market. Vodafone Simply — which is a basic no-frills mobile phone used to makevoice calls — ill attract the rural mass looking for a wireless version of the plain vanillalandline phone. Vodafone Passport enables customers going abroad to talk at domestic rates.They pay a one-off connection fee and then shell out standard Indian rates. The companymay introduce a very competitive price plan for Indian customers.Globally, Vodafone offers aggressive strategies such as Vodafone-Stop-the-Clock price plan,where customers can talk for up to one hour on evenings and weekends and only pay for thefirst 3 minutes. Vodafone is also toying with the idea of launching customized handsets . Theexclusive handsets will be designed to meet the needs of Vodafone’s customers in terms of
price, specification and user experience. It can be fully integrated with the company’s liveservices. This will help drive the use of services and increase the average revenue per user.The company is also building brand awareness in six new circles — Orissa, Bihar, Assam,the Northeast, Himachal Pradesh and Jammu &Kashmir — where it holds unified access
service license through its wholly owned subsidiary, Vodafone Essar Spacetel. VodafoneEssar offers mobile services in 16 of the 23 telecom circles. However, Vodafone Essar

8/8/2019 Factors Impacting Consumers
http://slidepdf.com/reader/full/factors-impacting-consumers 25/52
Spacetel is yet to receive its share of GSM spectrum from the department of telecom for thesix circles to roll out 2G services.
Vodafone’s acquisition of a controlling stake in Hutch Essar in February this year brought in$801 million (Rs 3,285 crore) as foreign direct investment, making the world’s largest
mobile company the top investor up to May this year.
Idea
Aditya Birla Group-owned Idea Cellular launched its GSM mobile service on November 24,2009 at Guwahati in Assam. With this, the company is in near completion of its pan-Indianetwork rollout with presence in 21 telecom circles in India.
The company has lined up a total investment of Rs 200 crore in the current year and total of Rs 300 crore in the first 3 years.
Idea’s mobile service will be available in 13 districts of Assam - Barpeta , Bongaigaon,Cachar, Dibrugarh, Jorhat, Kamrup, Karbi Anglong, Kokrajhar, Nagaon, Sibsagar, Sonitpur and Tinsukia – at the initial stage.
Chapter 2
2.1 About Prepaid services2.2 About Post-paid services
8/8/2019 Factors Impacting Consumers
http://slidepdf.com/reader/full/factors-impacting-consumers 26/52
2.1 About Prepaid services
For an infrequent user or for the one who wants to manage their wireless spending, prepaid cell phone plans can be ideal for them. With pre-paid plans, one can buy minutes ahead of time andreplenish them as needed, instead of signing up for long-term contracts. Already widely used inEurope, prepaid wireless plans have become the fastest-growing segment of the wireless market inthe US. More companies offer more attractive and competitively priced prepaid calling plans.
Possibly the best thing about prepaid cell-phone plans is what it doesn't have. There are no contractsto sign, no monthly bills, no long-term commitments, no credit checks, no age limit and no hiddenfees. These features are what make prepaid wireless plans so attractive. Prepaid cell phone can stopone or ones family members from wasting money. With prepaid cell phone plans, a customer isgoing to pay as he goes along. So one knows how much he is spending.
Similar to a prepaid long distance calling card, one can buy the phone, activate it, and then pay to putminutes or "units" on his account. As he uses the phone, minutes are subtracted from his account.When he run low on minutes, he can pay to add more minutes. If the phone is bought for emergenciesonly, then the prepaid cellular phone may save more money in the long run. There won’t be anycontract and the customers don't have to pay a monthly package fee for having the service. Thecustomers can buy the airtime as they need it (with some exceptions). And they do not have to pay adeposit for service. Prepaid is also a way of learning about your usage patterns before committing toa long-term monthly billing wireless contract.
2.1.1 Advantages of prepaid services:
• No contract to sign, no long-term commitment• No monthly monthly bill to worry about.• Better cost control. You know exactly how much you will spend.• No hidden fees.• No credit checks needed. Perfect for the credit challenged; since monthly billed plans require
credit approval.• Great if your usage varies from month to month.• No security deposits. Some monthly plans may require a deposit.• Topping up your account is easy and you can do it in many ways, at any time, by going on-
line, by phone, bank machine or with a prepaid card.
2.1.2 Disadvantages of prepaid services:
• You pay more per minute.• If you don't use the phone for an extended period of time, you lose the money in your
account.• You can't accept collect calls or third-party billed calls.• Outgoing and sometimes both incoming and outgoing calls are barred when the balance is
zero.
2.1.3 Prepaid cell phones are ideal for:
• people who don't want to be locked into a year-long contract• first time cellular buyers who don't know how many monthly minutes they should sign up
for.• people who don't want to go over their budget• people with damaged or no credit history
8/8/2019 Factors Impacting Consumers
http://slidepdf.com/reader/full/factors-impacting-consumers 27/52
• occasional users• people who want to buy their children a phone for emergency use
for teens and people who talk a lot on the phone.
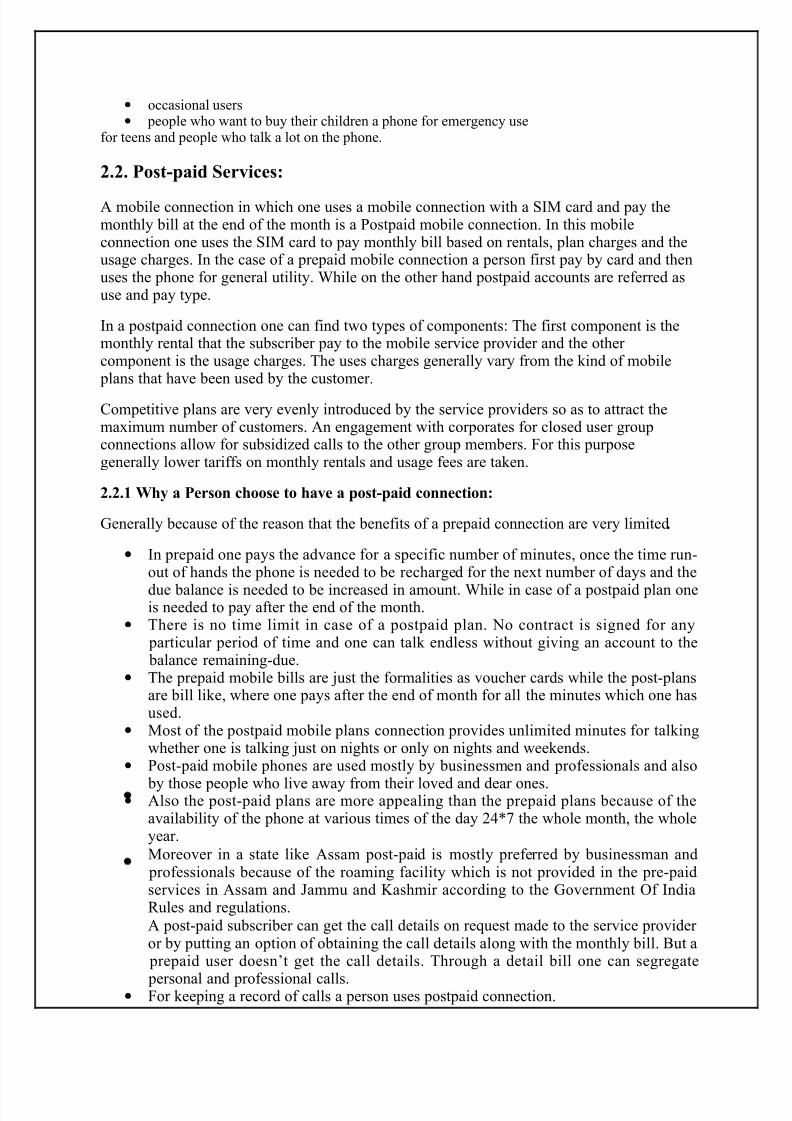
2.2. Post-paid Services:
A mobile connection in which one uses a mobile connection with a SIM card and pay themonthly bill at the end of the month is a Postpaid mobile connection. In this mobileconnection one uses the SIM card to pay monthly bill based on rentals, plan charges and theusage charges. In the case of a prepaid mobile connection a person first pay by card and thenuses the phone for general utility. While on the other hand postpaid accounts are referred asuse and pay type.
In a postpaid connection one can find two types of components: The first component is themonthly rental that the subscriber pay to the mobile service provider and the other component is the usage charges. The uses charges generally vary from the kind of mobile
plans that have been used by the customer.
Competitive plans are very evenly introduced by the service providers so as to attract themaximum number of customers. An engagement with corporates for closed user groupconnections allow for subsidized calls to the other group members. For this purposegenerally lower tariffs on monthly rentals and usage fees are taken.
2.2.1 Why a Person choose to have a post-paid connection:
Generally because of the reason that the benefits of a prepaid connection are very limited .
• In prepaid one pays the advance for a specific number of minutes, once the time run-out of hands the phone is needed to be recharged for the next number of days and the
due balance is needed to be increased in amount. While in case of a postpaid plan oneis needed to pay after the end of the month.
• There is no time limit in case of a postpaid plan. No contract is signed for any particular period of time and one can talk endless without giving an account to the balance remaining-due.
• The prepaid mobile bills are just the formalities as voucher cards while the post-plansare bill like, where one pays after the end of month for all the minutes which one hasused.
• Most of the postpaid mobile plans connection provides unlimited minutes for talkingwhether one is talking just on nights or only on nights and weekends.
• Post-paid mobile phones are used mostly by businessmen and professionals and also
by those people who live away from their loved and dear ones.• Also the post-paid plans are more appealing than the prepaid plans because of the
availability of the phone at various times of the day 24*7 the whole month, the wholeyear.
• Moreover in a state like Assam post-paid is mostly preferred by businessman and professionals because of the roaming facility which is not provided in the pre-paidservices in Assam and Jammu and Kashmir according to the Government Of IndiaRules and regulations.
• A post-paid subscriber can get the call details on request made to the service provider or by putting an option of obtaining the call details along with the monthly bill. But a
prepaid user doesn’t get the call details. Through a detail bill one can segregate
personal and professional calls.• For keeping a record of calls a person uses postpaid connection.

8/8/2019 Factors Impacting Consumers
http://slidepdf.com/reader/full/factors-impacting-consumers 28/52
• Sometimes due to problems in network it becomes to recharge or to fill the top up.These kinds of problems are regular and customers are usually harassed by such kindof problems because of which they prefer using postpaid connection where there is nosuch problem.
• In postpaid connection, a consumer on non-payment of bills gets a specific time
period to pay his bills which last for about fifteen days and only after passage of that period first the outgoing calls are barred and then incoming calls are barred. But in prepaid connection the calls are barred as soon as the balance gets exhausted.
• Facilities like call conferencing are provided in postpaid connection which isconsidered to be very essential for professionals nowadays.
In postpaid connection there’s no tension of closing or changing plans. The plan never closesfor the existing customers.
Chapter 3
Research Methodology
8/8/2019 Factors Impacting Consumers
http://slidepdf.com/reader/full/factors-impacting-consumers 29/52
3. Research MethodologyIt is seen that mobile phones have become a necessity for every person. The mobile phonesubscriber may use either a post-paid or a pre-paid connection. It is seen that pre-paidconnection is more dominant than post-paid connection among the people. The choice of aconnection is affected by many factors. People generally tends to choose a connection on the
basis of these factors such as income, various plans, various schemes, network coverage, GPRS,roaming, etc.
3.1 Choice of Research Design
The study is basically a descriptive research.
3.2 Research Plan
Initially an extensive on field survey was undertaken to gain insights into the general natureof the research problems and objectives, the possible decisions alternatives and the relevantvariables that need to be considered while designing the questionnaires. Along the lines of the descriptive research, the research objectives were redefined and the questionnaire wasdesigned. With the help of the questionnaire, a survey was conducted in the DibrugarhUniversity.
3.3 Sources of data
Both primary and secondary data were used for this study. The secondary data is collectedfrom Newspapers, Magazines, copy containing the database of officers, employees andfaculties and various websites. Primary data was collected from the respondents. From therespondents data was collected with the help of questionnaire.
3.4 Data collection methods
The Primary data was collected with the help of Questionnaire.
3.5 Sample Size
The sample size for this survey is 190 which is collected from the students, employees and
faculties of Dibrugarh University.
3.6 Sampling procedure
190 samples were selected on the basis of Convenience sampling.
3.7 Sampling plan
Population: The population consists of the students, faculties and employees of DibrugarhUniversity.
Elements: The pre-paid and post-paid customers of Dibrugarh University which includes the
students, faculties and employees of Dibrugarh University.

8/8/2019 Factors Impacting Consumers
http://slidepdf.com/reader/full/factors-impacting-consumers 30/52
3.8 Questionnaire for the study
The customers were personally met. The Questionnaire was prepared keeping in mind the
objectives of the study.
3.9 Analysis of data
The data was analysed with the help of pie-charts, bar-diagrams.

8/8/2019 Factors Impacting Consumers
http://slidepdf.com/reader/full/factors-impacting-consumers 31/52
Chapter 4
Analysis and Interpretations4.0 Analysis of students
4.1 Analysis of the faculties
4.2 Analysis of employees
8/8/2019 Factors Impacting Consumers
http://slidepdf.com/reader/full/factors-impacting-consumers 32/52
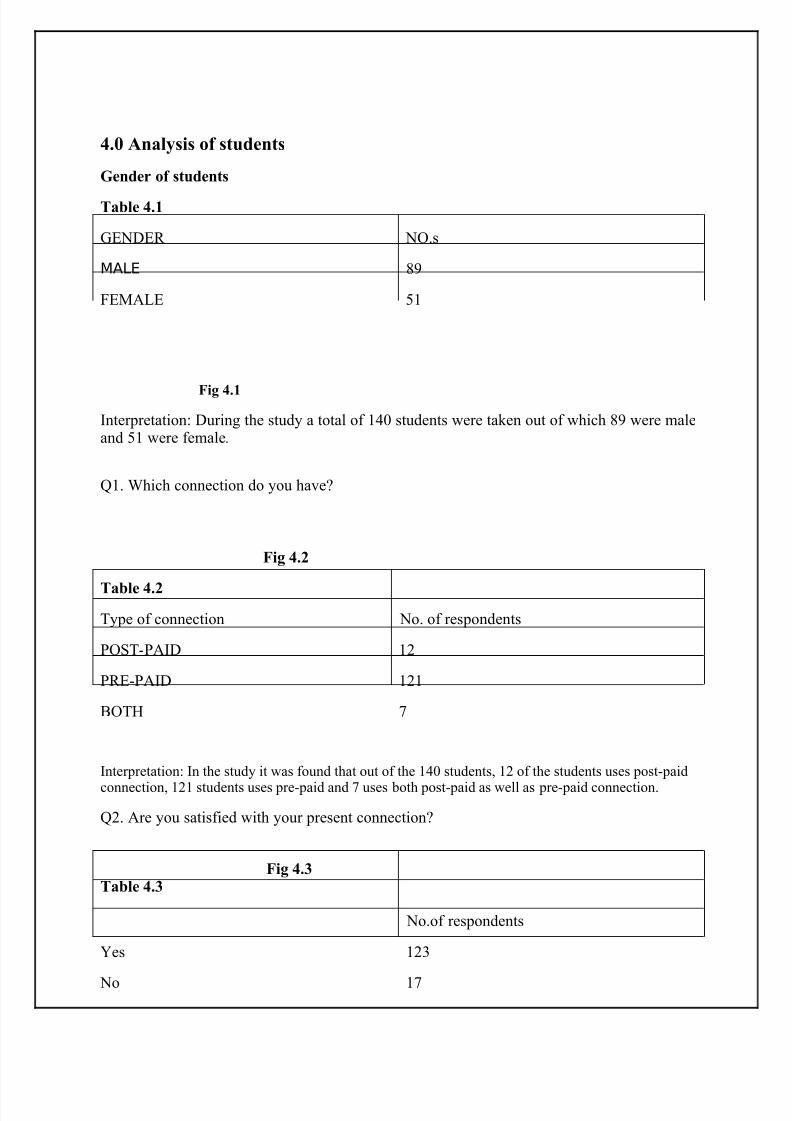
4.0 Analysis of students
Gender of students
Table 4.1
GENDER NO.s
MALE 89
FEMALE 51
Fig 4.1
Interpretation: During the study a total of 140 students were taken out of which 89 were maleand 51 were female.
Q1. Which connection do you have?
Fig 4.2
Table 4.2
Type of connection No. of respondents
POST-PAID 12
PRE-PAID 121
BOTH 7
Interpretation: In the study it was found that out of the 140 students, 12 of the students uses post-paid
connection, 121 students uses pre-paid and 7 uses both post-paid as well as pre-paid connection.
Q2. Are you satisfied with your present connection?
Fig 4.3Table 4.3
No.of respondents
Yes 123
No 17
8/8/2019 Factors Impacting Consumers
http://slidepdf.com/reader/full/factors-impacting-consumers 33/52
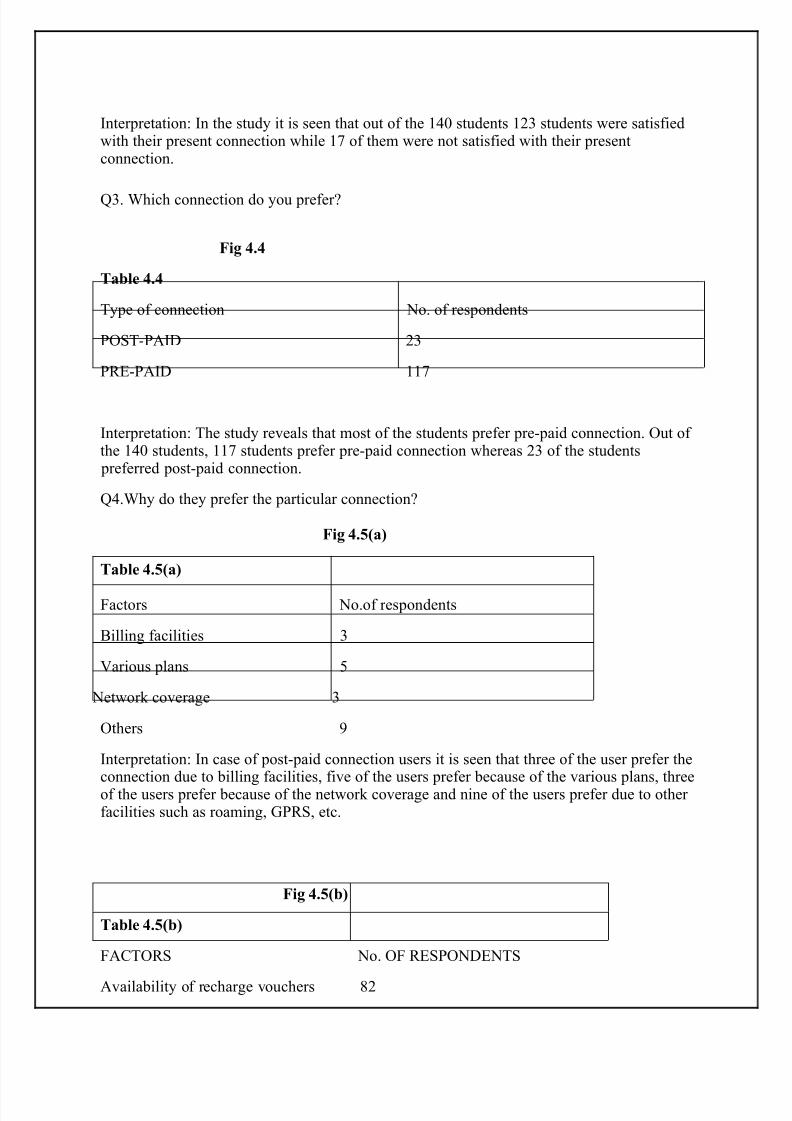
Interpretation: In the study it is seen that out of the 140 students 123 students were satisfiedwith their present connection while 17 of them were not satisfied with their presentconnection.
Q3. Which connection do you prefer?
Fig 4.4
Table 4.4
Type of connection No. of respondents
POST-PAID 23
PRE-PAID 117
Interpretation: The study reveals that most of the students prefer pre-paid connection. Out of the 140 students, 117 students prefer pre-paid connection whereas 23 of the students
preferred post-paid connection.
Q4.Why do they prefer the particular connection?
Fig 4.5(a)
Table 4.5(a)
Factors No.of respondents
Billing facilities 3
Various plans 5
Network coverage 3
Others 9
Interpretation: In case of post-paid connection users it is seen that three of the user prefer theconnection due to billing facilities, five of the users prefer because of the various plans, threeof the users prefer because of the network coverage and nine of the users prefer due to other facilities such as roaming, GPRS, etc.
Fig 4.5(b)
Table 4.5(b)
FACTORS No. OF RESPONDENTS
Availability of recharge vouchers 82
8/8/2019 Factors Impacting Consumers
http://slidepdf.com/reader/full/factors-impacting-consumers 34/52
Various schemes 93
Easy assess to connection 42
Others 16
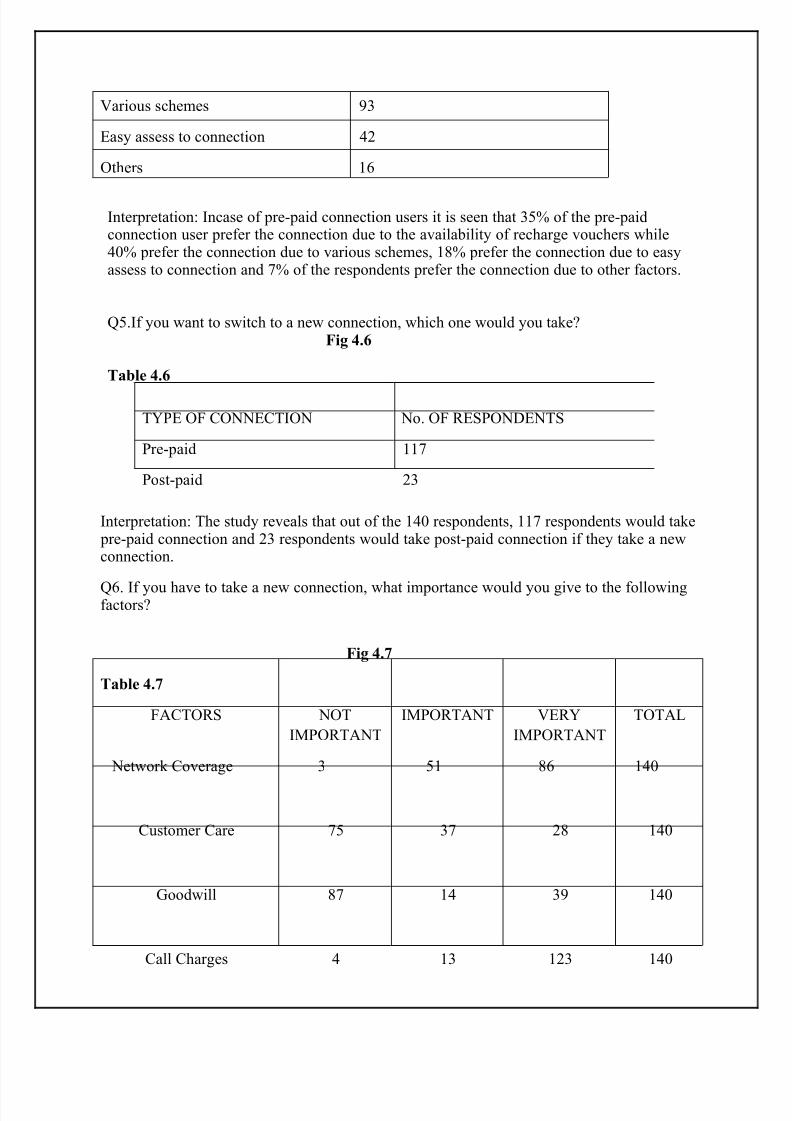
Interpretation: Incase of pre-paid connection users it is seen that 35% of the pre-paidconnection user prefer the connection due to the availability of recharge vouchers while40% prefer the connection due to various schemes, 18% prefer the connection due to easyassess to connection and 7% of the respondents prefer the connection due to other factors.
Q5.If you want to switch to a new connection, which one would you take? Fig 4.6
Table 4.6
Interpretation: The study reveals that out of the 140 respondents, 117 respondents would take pre-paid connection and 23 respondents would take post-paid connection if they take a newconnection.
Q6. If you have to take a new connection, what importance would you give to the followingfactors?
Fig 4.7
Table 4.7
FACTORS NOT
IMPORTANT
IMPORTANT VERY
IMPORTANT
TOTAL
Network Coverage 3 51 86 140
Customer Care 75 37 28 140
Goodwill 87 14 39 140
Call Charges 4 13 123 140
TYPE OF CONNECTION No. OF RESPONDENTS
Pre-paid 117
Post-paid 23
8/8/2019 Factors Impacting Consumers
http://slidepdf.com/reader/full/factors-impacting-consumers 35/52
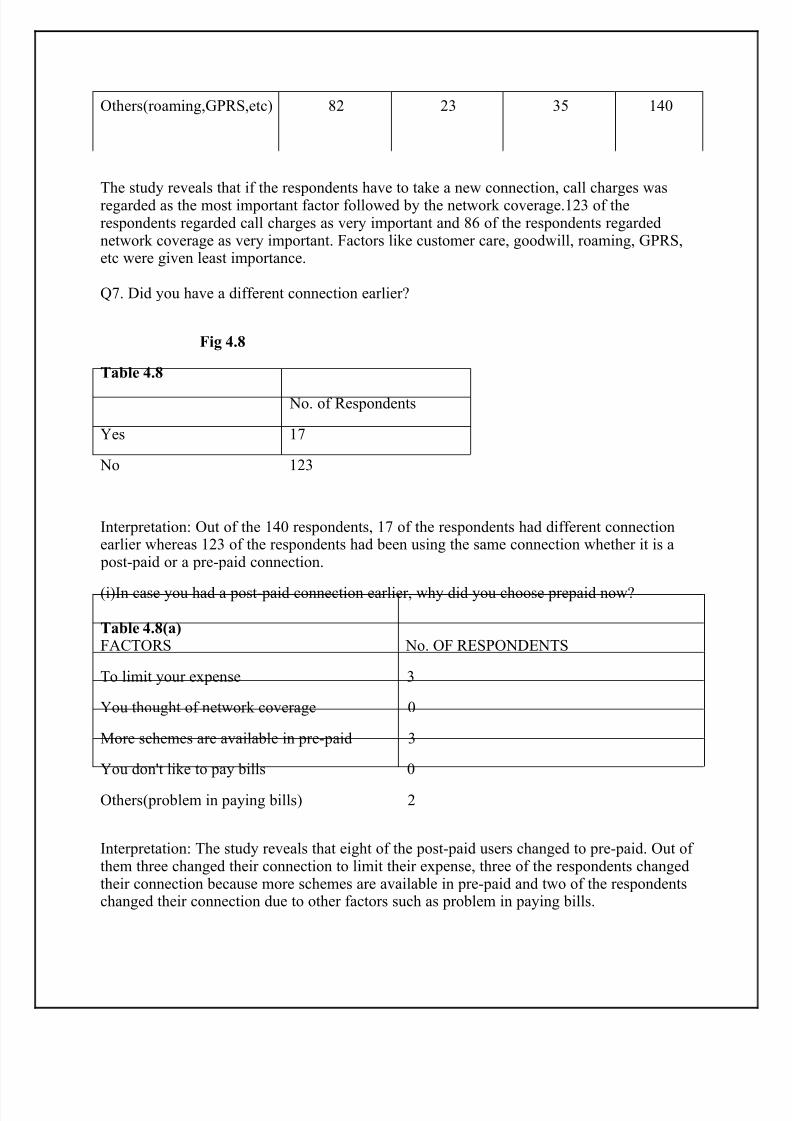
Others(roaming,GPRS,etc) 82 23 35 140
The study reveals that if the respondents have to take a new connection, call charges wasregarded as the most important factor followed by the network coverage.123 of therespondents regarded call charges as very important and 86 of the respondents regardednetwork coverage as very important. Factors like customer care, goodwill, roaming, GPRS,etc were given least importance.
Q7. Did you have a different connection earlier?
Fig 4.8
Table 4.8
No. of Respondents
Yes 17
No 123
Interpretation: Out of the 140 respondents, 17 of the respondents had different connectionearlier whereas 123 of the respondents had been using the same connection whether it is a
post-paid or a pre-paid connection.
(i)In case you had a post-paid connection earlier, why did you choose prepaid now?
Table 4.8(a)FACTORS No. OF RESPONDENTS
To limit your expense 3
You thought of network coverage 0
More schemes are available in pre-paid 3
You don't like to pay bills 0
Others(problem in paying bills) 2
Interpretation: The study reveals that eight of the post-paid users changed to pre-paid. Out of them three changed their connection to limit their expense, three of the respondents changedtheir connection because more schemes are available in pre-paid and two of the respondentschanged their connection due to other factors such as problem in paying bills.
8/8/2019 Factors Impacting Consumers
http://slidepdf.com/reader/full/factors-impacting-consumers 36/52
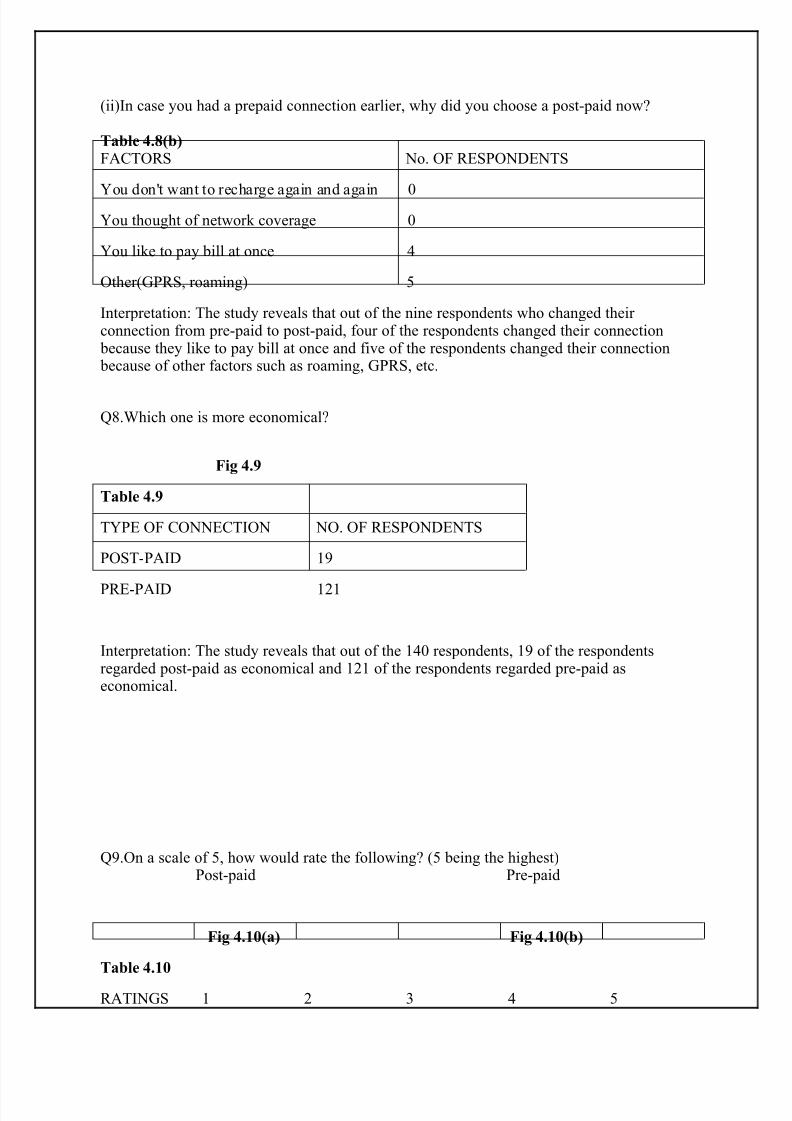
(ii)In case you had a prepaid connection earlier, why did you choose a post-paid now?
Table 4.8(b)FACTORS No. OF RESPONDENTS
You don't want to recharge again and again 0You thought of network coverage 0
You like to pay bill at once 4
Other(GPRS, roaming) 5
Interpretation: The study reveals that out of the nine respondents who changed their connection from pre-paid to post-paid, four of the respondents changed their connection
because they like to pay bill at once and five of the respondents changed their connection because of other factors such as roaming, GPRS, etc.
Q8.Which one is more economical?
Fig 4.9
Table 4.9
TYPE OF CONNECTION NO. OF RESPONDENTS
POST-PAID 19
PRE-PAID 121
Interpretation: The study reveals that out of the 140 respondents, 19 of the respondentsregarded post-paid as economical and 121 of the respondents regarded pre-paid aseconomical.
Q9.On a scale of 5, how would rate the following? (5 being the highest)Post-paid Pre-paid
Fig 4.10(a) Fig 4.10(b)
Table 4.10
RATINGS 1 2 3 4 5
8/8/2019 Factors Impacting Consumers
http://slidepdf.com/reader/full/factors-impacting-consumers 37/52
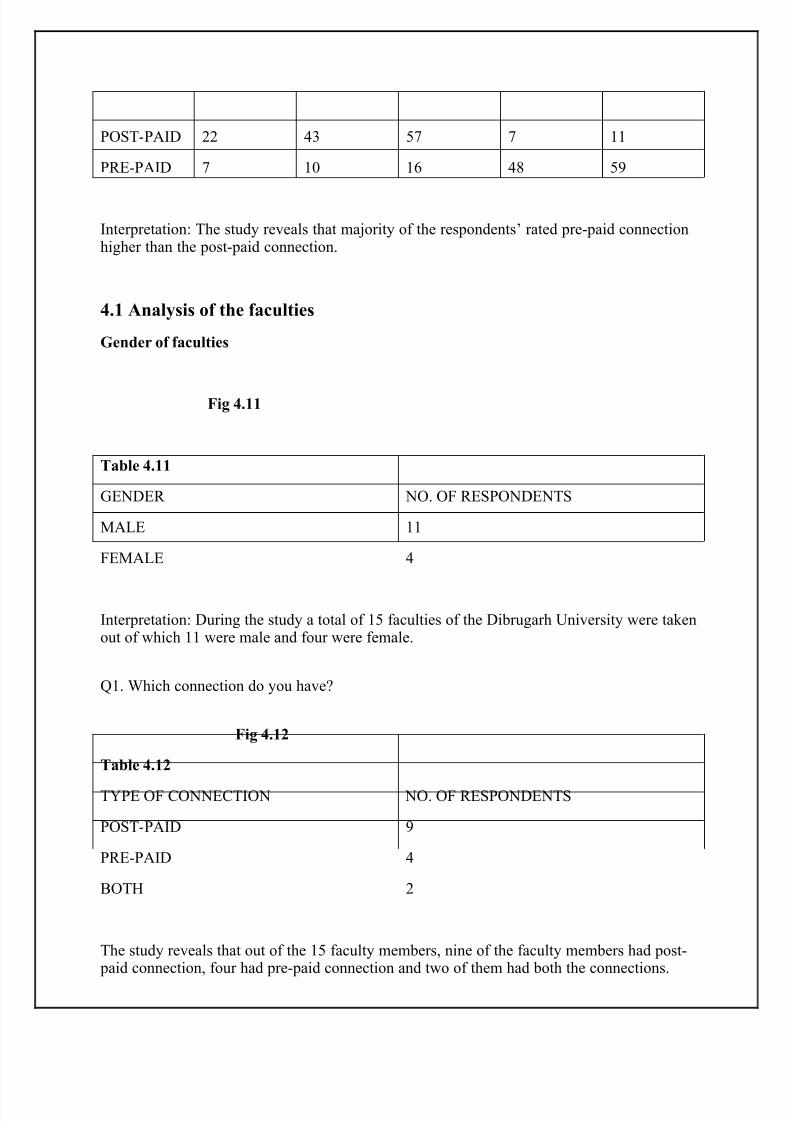
POST-PAID 22 43 57 7 11
PRE-PAID 7 10 16 48 59
Interpretation: The study reveals that majority of the respondents’ rated pre-paid connectionhigher than the post-paid connection.
4.1 Analysis of the faculties
Gender of faculties
Fig 4.11
Table 4.11
GENDER NO. OF RESPONDENTS
MALE 11
FEMALE 4
Interpretation: During the study a total of 15 faculties of the Dibrugarh University were takenout of which 11 were male and four were female.
Q1. Which connection do you have?
Fig 4.12
Table 4.12
TYPE OF CONNECTION NO. OF RESPONDENTS
POST-PAID 9
PRE-PAID 4
BOTH 2
The study reveals that out of the 15 faculty members, nine of the faculty members had post- paid connection, four had pre-paid connection and two of them had both the connections.
8/8/2019 Factors Impacting Consumers
http://slidepdf.com/reader/full/factors-impacting-consumers 38/52
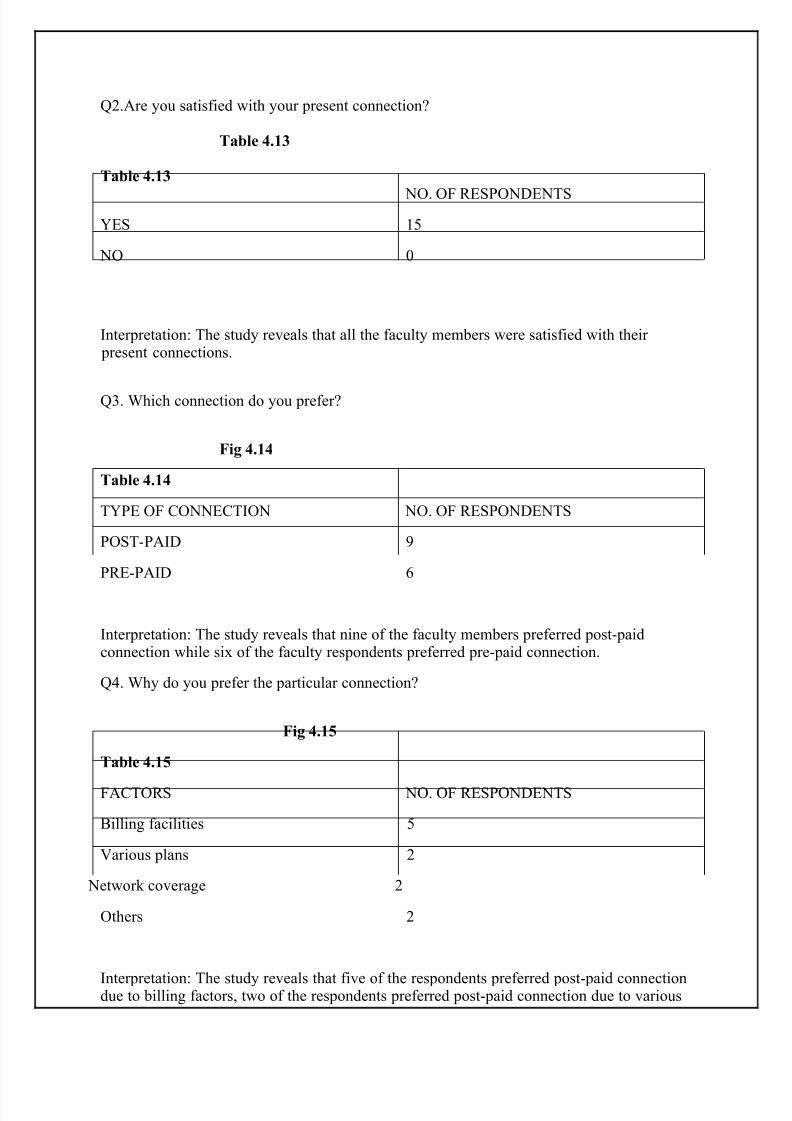
Q2.Are you satisfied with your present connection?
Table 4.13
Table 4.13
NO. OF RESPONDENTS
YES 15
NO 0
Interpretation: The study reveals that all the faculty members were satisfied with their present connections.
Q3. Which connection do you prefer?
Fig 4.14
Table 4.14
TYPE OF CONNECTION NO. OF RESPONDENTS
POST-PAID 9
PRE-PAID 6
Interpretation: The study reveals that nine of the faculty members preferred post-paidconnection while six of the faculty respondents preferred pre-paid connection.
Q4. Why do you prefer the particular connection?
Fig 4.15
Table 4.15
FACTORS NO. OF RESPONDENTS
Billing facilities 5
Various plans 2
Network coverage 2
Others 2
Interpretation: The study reveals that five of the respondents preferred post-paid connectiondue to billing factors, two of the respondents preferred post-paid connection due to various
8/8/2019 Factors Impacting Consumers
http://slidepdf.com/reader/full/factors-impacting-consumers 39/52
plans available, two of the respondents preferred the post-paid connection due to network coverage and two of the respondents preferred the connection due to other factors .
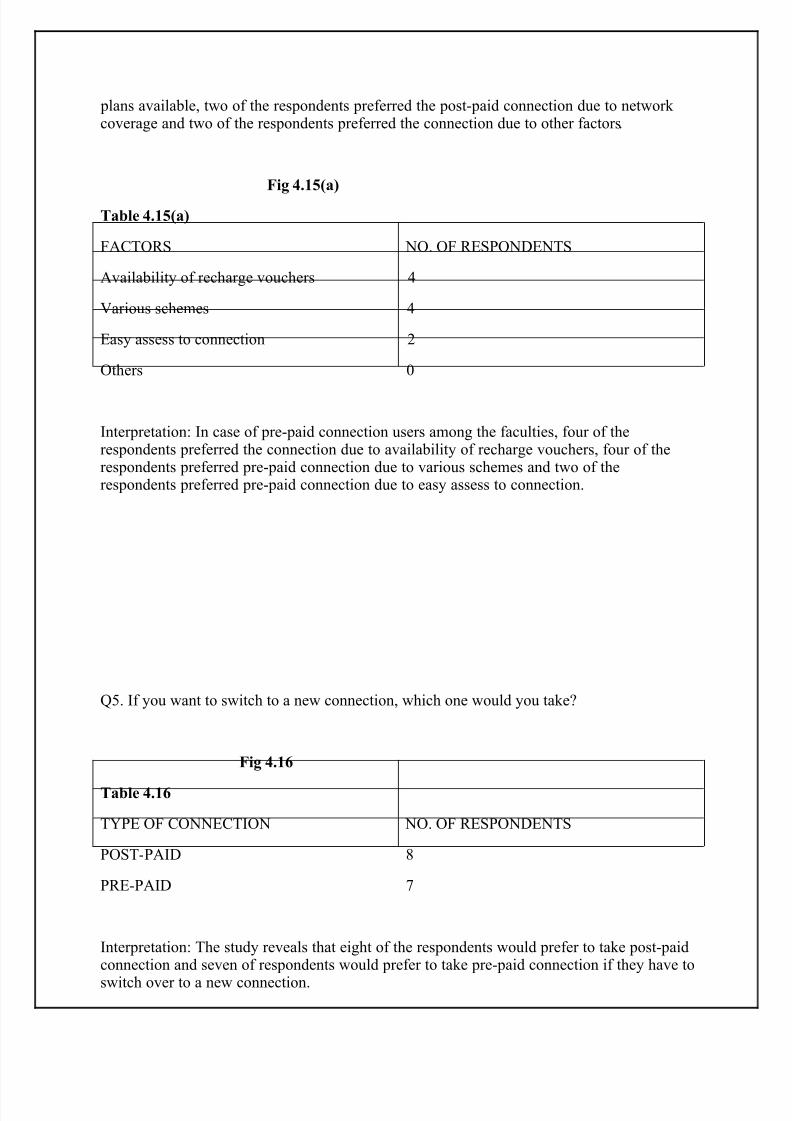
Fig 4.15(a)
Table 4.15(a)
FACTORS NO. OF RESPONDENTS
Availability of recharge vouchers 4
Various schemes 4
Easy assess to connection 2
Others 0
Interpretation: In case of pre-paid connection users among the faculties, four of therespondents preferred the connection due to availability of recharge vouchers, four of therespondents preferred pre-paid connection due to various schemes and two of therespondents preferred pre-paid connection due to easy assess to connection.
Q5. If you want to switch to a new connection, which one would you take?
Fig 4.16
Table 4.16
TYPE OF CONNECTION NO. OF RESPONDENTS
POST-PAID 8
PRE-PAID 7
Interpretation: The study reveals that eight of the respondents would prefer to take post-paidconnection and seven of respondents would prefer to take pre-paid connection if they have to
switch over to a new connection.
8/8/2019 Factors Impacting Consumers
http://slidepdf.com/reader/full/factors-impacting-consumers 40/52
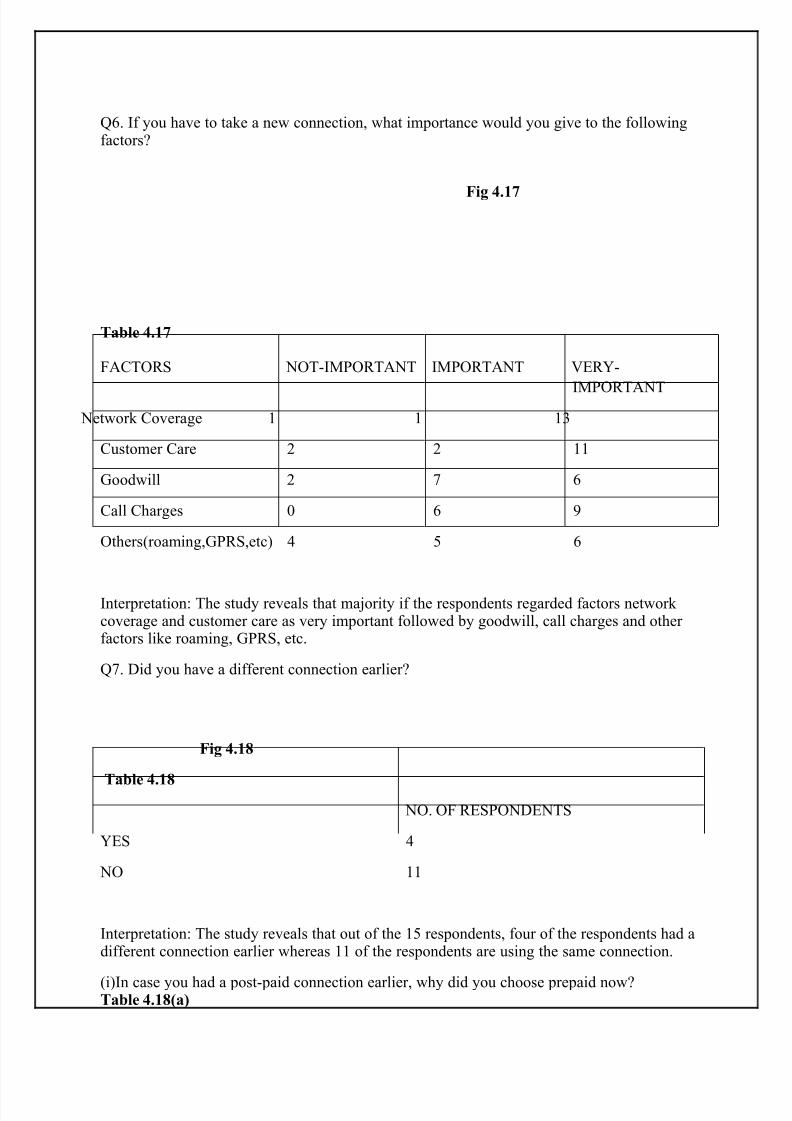
Q6. If you have to take a new connection, what importance would you give to the followingfactors?
Fig 4.17
Table 4.17 FACTORS NOT-IMPORTANT IMPORTANT VERY-
IMPORTANT
Network Coverage 1 1 13
Customer Care 2 2 11
Goodwill 2 7 6
Call Charges 0 6 9
Others(roaming,GPRS,etc) 4 5 6
Interpretation: The study reveals that majority if the respondents regarded factors network coverage and customer care as very important followed by goodwill, call charges and other factors like roaming, GPRS, etc.
Q7. Did you have a different connection earlier?
Fig 4.18
Table 4.18
NO. OF RESPONDENTS
YES 4
NO 11
Interpretation: The study reveals that out of the 15 respondents, four of the respondents had adifferent connection earlier whereas 11 of the respondents are using the same connection.
(i)In case you had a post-paid connection earlier, why did you choose prepaid now?Table 4.18(a)
8/8/2019 Factors Impacting Consumers
http://slidepdf.com/reader/full/factors-impacting-consumers 41/52
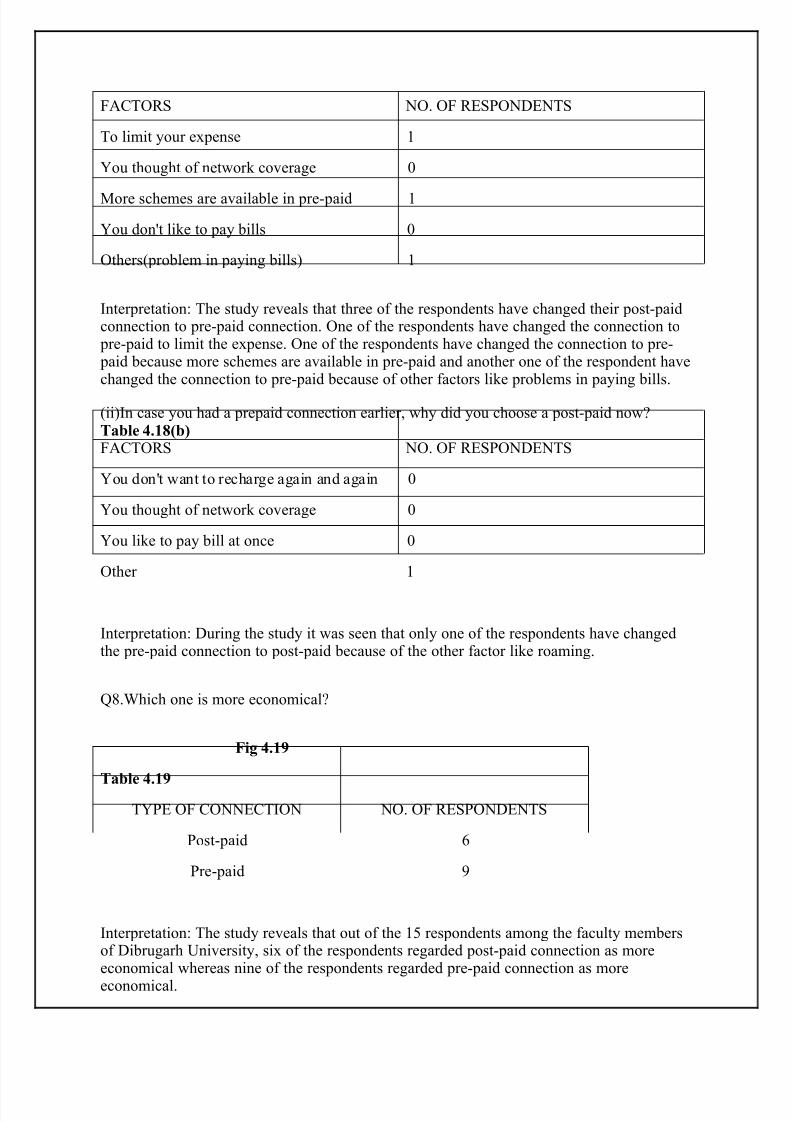
FACTORS NO. OF RESPONDENTS
To limit your expense 1
You thought of network coverage 0
More schemes are available in pre-paid 1
You don't like to pay bills 0
Others(problem in paying bills) 1
Interpretation: The study reveals that three of the respondents have changed their post-paidconnection to pre-paid connection. One of the respondents have changed the connection to
pre-paid to limit the expense. One of the respondents have changed the connection to pre- paid because more schemes are available in pre-paid and another one of the respondent havechanged the connection to pre-paid because of other factors like problems in paying bills.
(ii)In case you had a prepaid connection earlier, why did you choose a post-paid now?Table 4.18(b)FACTORS NO. OF RESPONDENTS
You don't want to recharge again and again 0
You thought of network coverage 0
You like to pay bill at once 0
Other 1
Interpretation: During the study it was seen that only one of the respondents have changedthe pre-paid connection to post-paid because of the other factor like roaming.
Q8.Which one is more economical?
Fig 4.19
Table 4.19TYPE OF CONNECTION NO. OF RESPONDENTS
Post-paid 6
Pre-paid 9
Interpretation: The study reveals that out of the 15 respondents among the faculty membersof Dibrugarh University, six of the respondents regarded post-paid connection as moreeconomical whereas nine of the respondents regarded pre-paid connection as more
economical.
8/8/2019 Factors Impacting Consumers
http://slidepdf.com/reader/full/factors-impacting-consumers 42/52
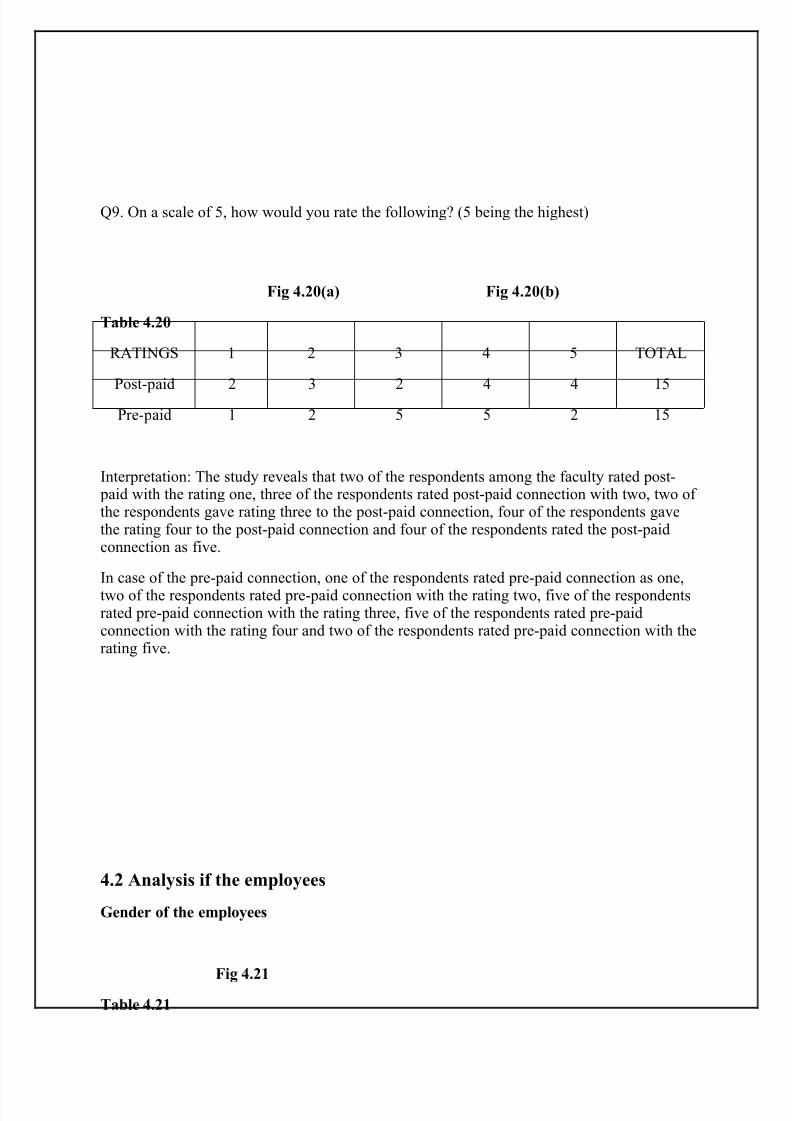
Q9. On a scale of 5, how would you rate the following? (5 being the highest)
Fig 4.20(a) Fig 4.20(b)
Table 4.20
RATINGS 1 2 3 4 5 TOTAL
Post-paid 2 3 2 4 4 15
Pre-paid 1 2 5 5 2 15
Interpretation: The study reveals that two of the respondents among the faculty rated post- paid with the rating one, three of the respondents rated post-paid connection with two, two of the respondents gave rating three to the post-paid connection, four of the respondents gavethe rating four to the post-paid connection and four of the respondents rated the post-paidconnection as five.
In case of the pre-paid connection, one of the respondents rated pre-paid connection as one,two of the respondents rated pre-paid connection with the rating two, five of the respondentsrated pre-paid connection with the rating three, five of the respondents rated pre-paidconnection with the rating four and two of the respondents rated pre-paid connection with therating five.
4.2 Analysis if the employees
Gender of the employees
Fig 4.21
Table 4.21
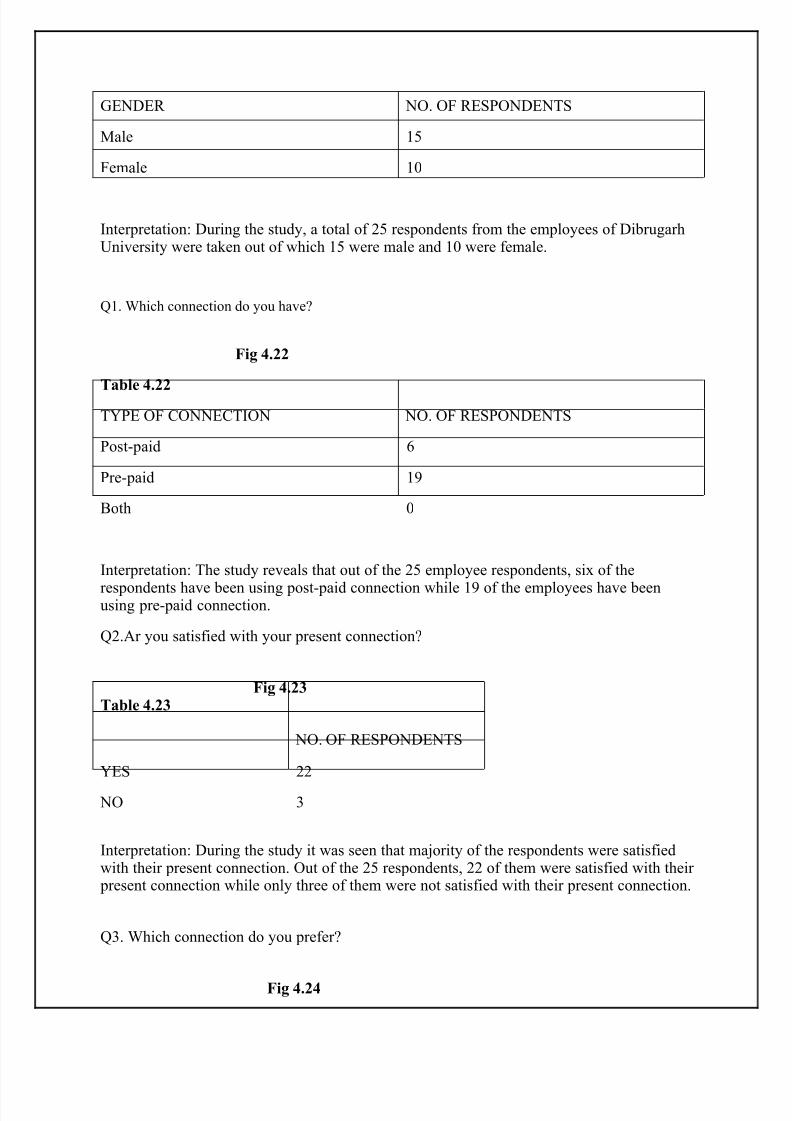
8/8/2019 Factors Impacting Consumers
http://slidepdf.com/reader/full/factors-impacting-consumers 43/52
GENDER NO. OF RESPONDENTS
Male 15
Female 10
Interpretation: During the study, a total of 25 respondents from the employees of DibrugarhUniversity were taken out of which 15 were male and 10 were female.
Q1. Which connection do you have?
Fig 4.22
Table 4.22TYPE OF CONNECTION NO. OF RESPONDENTS
Post-paid 6
Pre-paid 19
Both 0
Interpretation: The study reveals that out of the 25 employee respondents, six of the
respondents have been using post-paid connection while 19 of the employees have beenusing pre-paid connection.
Q2.Ar you satisfied with your present connection?
Fig 4.23Table 4.23
NO. OF RESPONDENTS
YES 22
NO 3
Interpretation: During the study it was seen that majority of the respondents were satisfiedwith their present connection. Out of the 25 respondents, 22 of them were satisfied with their
present connection while only three of them were not satisfied with their present connection.
Q3. Which connection do you prefer?
Fig 4.24
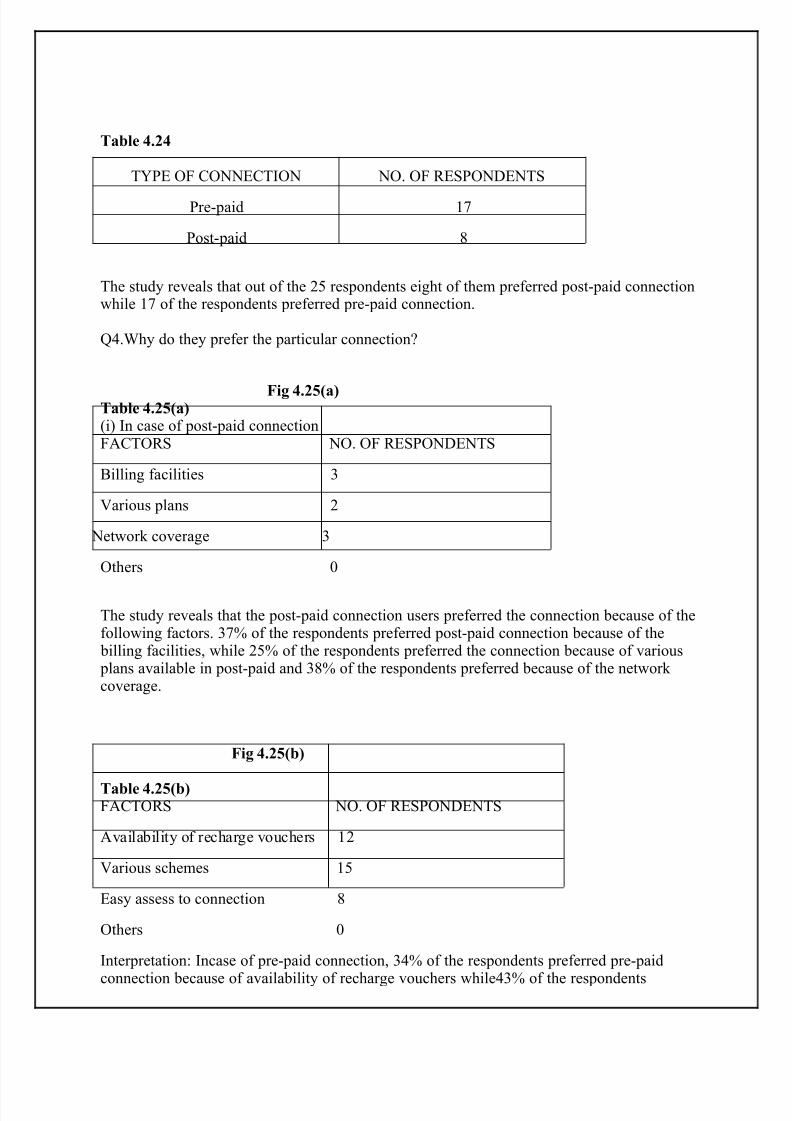
8/8/2019 Factors Impacting Consumers
http://slidepdf.com/reader/full/factors-impacting-consumers 44/52
Table 4.24
TYPE OF CONNECTION NO. OF RESPONDENTS
Pre-paid 17
Post-paid 8
The study reveals that out of the 25 respondents eight of them preferred post-paid connectionwhile 17 of the respondents preferred pre-paid connection.
Q4.Why do they prefer the particular connection?
Fig 4.25(a)Table 4.25(a)(i) In case of post-paid connectionFACTORS NO. OF RESPONDENTS
Billing facilities 3
Various plans 2
Network coverage 3
Others 0
The study reveals that the post-paid connection users preferred the connection because of thefollowing factors. 37% of the respondents preferred post-paid connection because of the
billing facilities, while 25% of the respondents preferred the connection because of various plans available in post-paid and 38% of the respondents preferred because of the network coverage.
Fig 4.25(b)
Table 4.25(b)FACTORS NO. OF RESPONDENTS
Availability of recharge vouchers 12
Various schemes 15
Easy assess to connection 8
Others 0
Interpretation: Incase of pre-paid connection, 34% of the respondents preferred pre-paid
connection because of availability of recharge vouchers while43% of the respondents
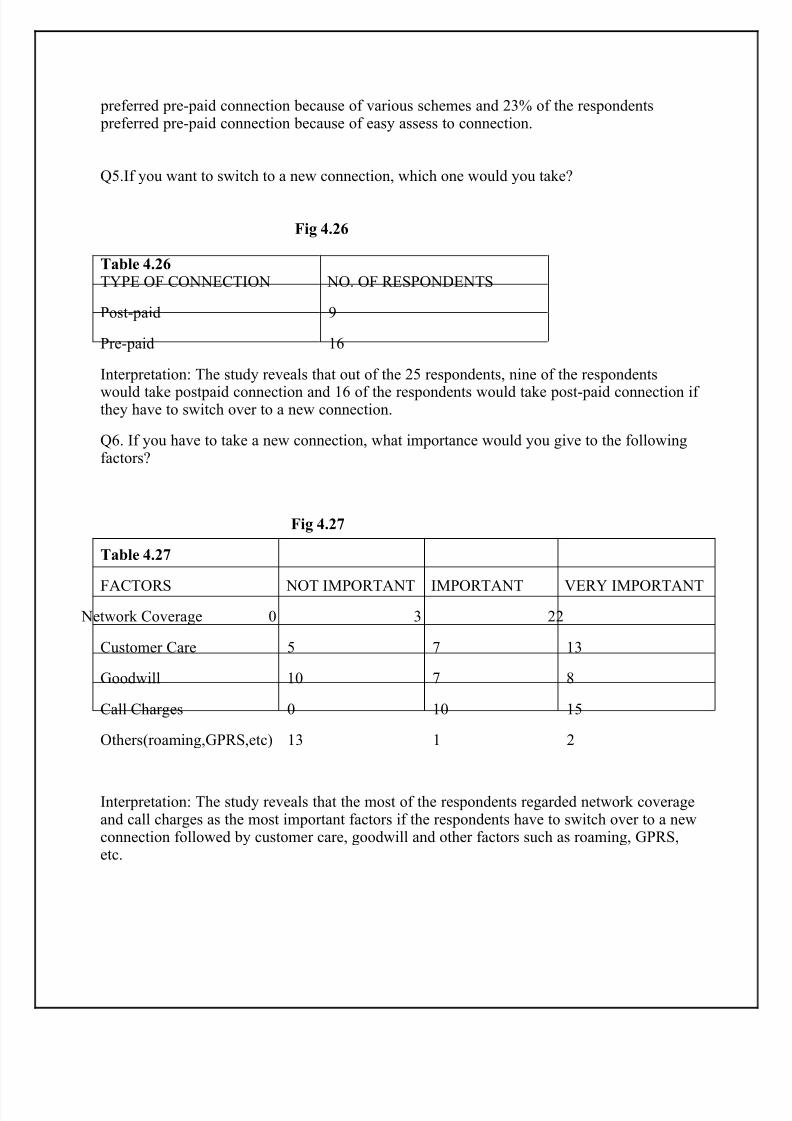
8/8/2019 Factors Impacting Consumers
http://slidepdf.com/reader/full/factors-impacting-consumers 45/52
preferred pre-paid connection because of various schemes and 23% of the respondents preferred pre-paid connection because of easy assess to connection.
Q5.If you want to switch to a new connection, which one would you take?
Fig 4.26
Table 4.26TYPE OF CONNECTION NO. OF RESPONDENTS
Post-paid 9
Pre-paid 16
Interpretation: The study reveals that out of the 25 respondents, nine of the respondents
would take postpaid connection and 16 of the respondents would take post-paid connection if they have to switch over to a new connection.
Q6. If you have to take a new connection, what importance would you give to the followingfactors?
Fig 4.27
Table 4.27
FACTORS NOT IMPORTANT IMPORTANT VERY IMPORTANT
Network Coverage 0 3 22
Customer Care 5 7 13
Goodwill 10 7 8
Call Charges 0 10 15
Others(roaming,GPRS,etc) 13 1 2
Interpretation: The study reveals that the most of the respondents regarded network coverageand call charges as the most important factors if the respondents have to switch over to a newconnection followed by customer care, goodwill and other factors such as roaming, GPRS,etc.
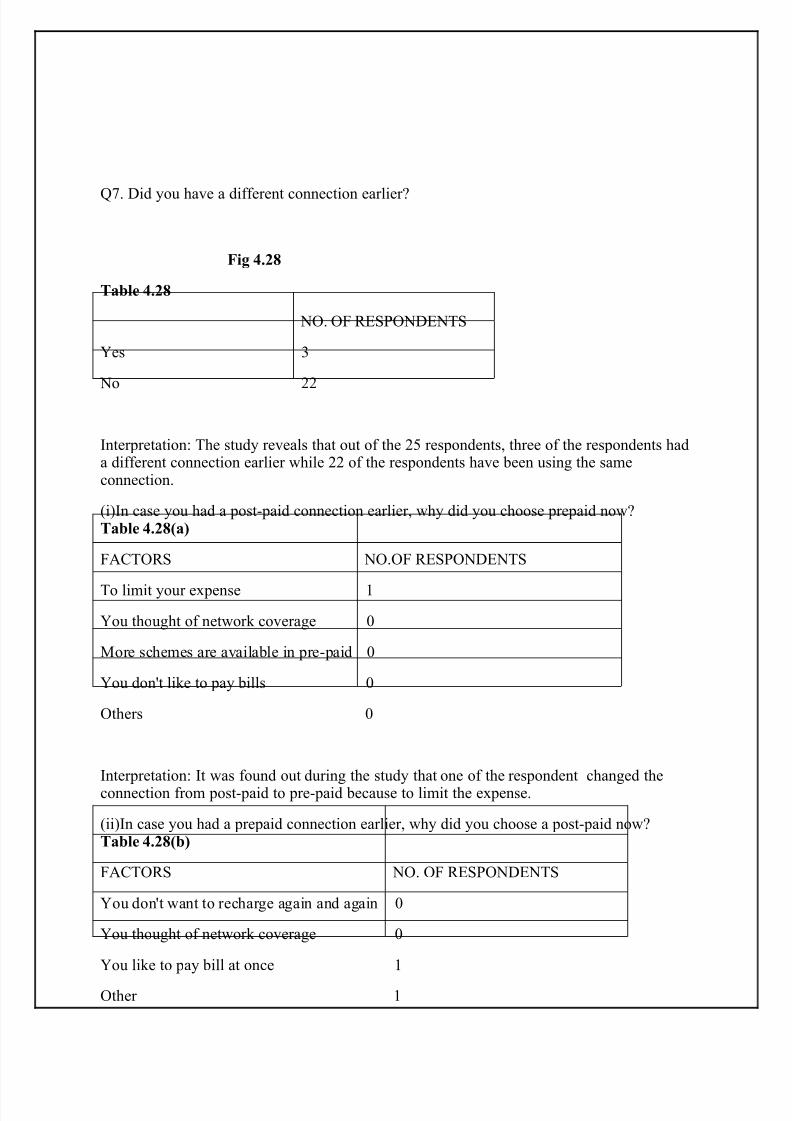
8/8/2019 Factors Impacting Consumers
http://slidepdf.com/reader/full/factors-impacting-consumers 46/52
Q7. Did you have a different connection earlier?
Fig 4.28
Table 4.28
NO. OF RESPONDENTS
Yes 3
No 22
Interpretation: The study reveals that out of the 25 respondents, three of the respondents hada different connection earlier while 22 of the respondents have been using the sameconnection.
(i)In case you had a post-paid connection earlier, why did you choose prepaid now?Table 4.28(a)
FACTORS NO.OF RESPONDENTS
To limit your expense 1
You thought of network coverage 0
More schemes are available in pre-paid 0
You don't like to pay bills 0
Others 0
Interpretation: It was found out during the study that one of the respondent changed theconnection from post-paid to pre-paid because to limit the expense.
(ii)In case you had a prepaid connection earlier, why did you choose a post-paid now?Table 4.28(b)
FACTORS NO. OF RESPONDENTS
You don't want to recharge again and again 0
You thought of network coverage 0
You like to pay bill at once 1
Other 1
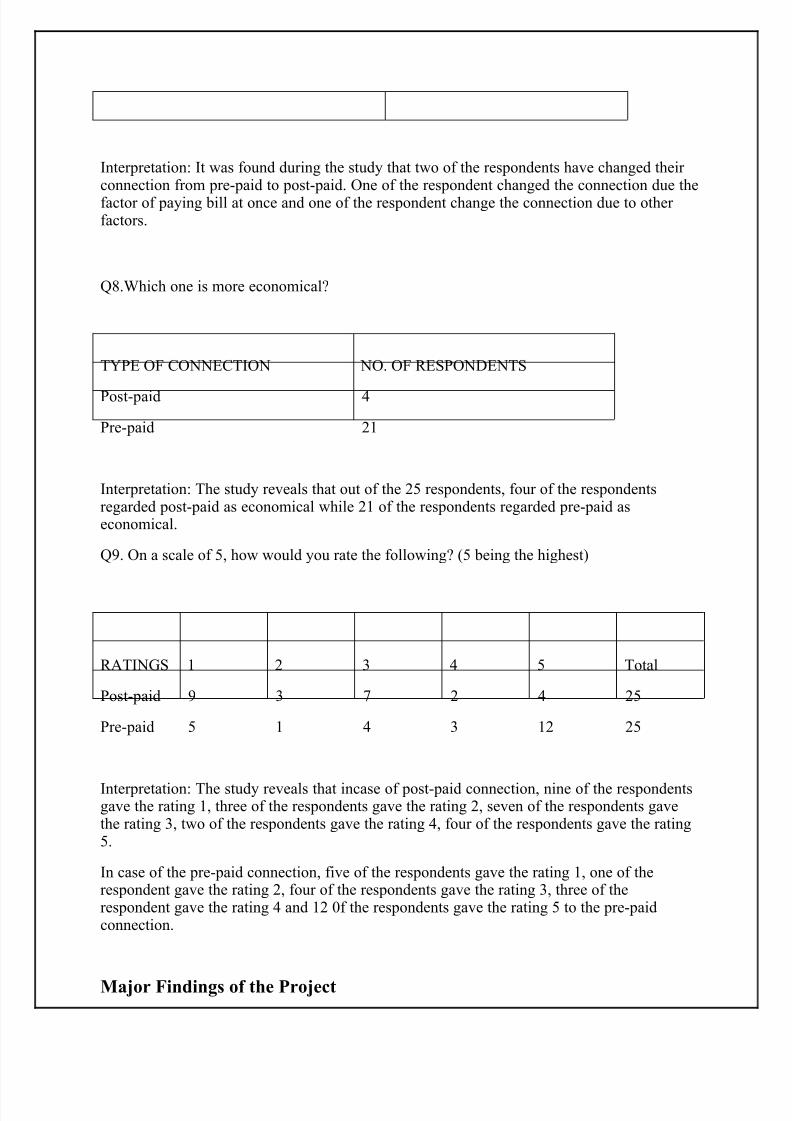
8/8/2019 Factors Impacting Consumers
http://slidepdf.com/reader/full/factors-impacting-consumers 47/52
Interpretation: It was found during the study that two of the respondents have changed their connection from pre-paid to post-paid. One of the respondent changed the connection due thefactor of paying bill at once and one of the respondent change the connection due to other factors.
Q8.Which one is more economical?
TYPE OF CONNECTION NO. OF RESPONDENTS
Post-paid 4
Pre-paid 21
Interpretation: The study reveals that out of the 25 respondents, four of the respondentsregarded post-paid as economical while 21 of the respondents regarded pre-paid aseconomical.
Q9. On a scale of 5, how would you rate the following? (5 being the highest)
RATINGS 1 2 3 4 5 Total
Post-paid 9 3 7 2 4 25
Pre-paid 5 1 4 3 12 25
Interpretation: The study reveals that incase of post-paid connection, nine of the respondentsgave the rating 1, three of the respondents gave the rating 2, seven of the respondents gavethe rating 3, two of the respondents gave the rating 4, four of the respondents gave the rating5.
In case of the pre-paid connection, five of the respondents gave the rating 1, one of therespondent gave the rating 2, four of the respondents gave the rating 3, three of therespondent gave the rating 4 and 12 0f the respondents gave the rating 5 to the pre-paidconnection.
Major Findings of the Project
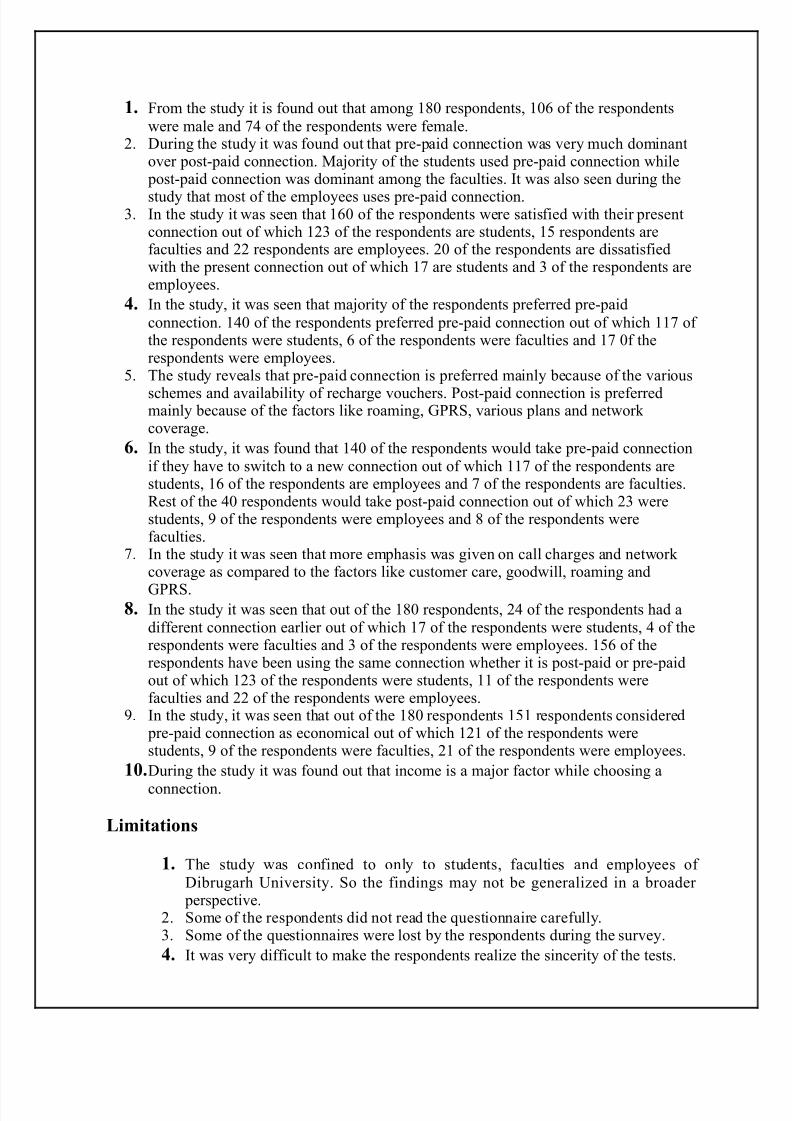
8/8/2019 Factors Impacting Consumers
http://slidepdf.com/reader/full/factors-impacting-consumers 48/52
1. From the study it is found out that among 180 respondents, 106 of the respondentswere male and 74 of the respondents were female.
2. During the study it was found out that pre-paid connection was very much dominantover post-paid connection. Majority of the students used pre-paid connection while
post-paid connection was dominant among the faculties. It was also seen during the
study that most of the employees uses pre-paid connection.3. In the study it was seen that 160 of the respondents were satisfied with their present
connection out of which 123 of the respondents are students, 15 respondents arefaculties and 22 respondents are employees. 20 of the respondents are dissatisfiedwith the present connection out of which 17 are students and 3 of the respondents areemployees.
4. In the study, it was seen that majority of the respondents preferred pre-paidconnection. 140 of the respondents preferred pre-paid connection out of which 117 of the respondents were students, 6 of the respondents were faculties and 17 0f therespondents were employees.
5. The study reveals that pre-paid connection is preferred mainly because of the various
schemes and availability of recharge vouchers. Post-paid connection is preferredmainly because of the factors like roaming, GPRS, various plans and network coverage.
6. In the study, it was found that 140 of the respondents would take pre-paid connectionif they have to switch to a new connection out of which 117 of the respondents arestudents, 16 of the respondents are employees and 7 of the respondents are faculties.Rest of the 40 respondents would take post-paid connection out of which 23 werestudents, 9 of the respondents were employees and 8 of the respondents werefaculties.
7. In the study it was seen that more emphasis was given on call charges and network coverage as compared to the factors like customer care, goodwill, roaming and
GPRS.8. In the study it was seen that out of the 180 respondents, 24 of the respondents had a
different connection earlier out of which 17 of the respondents were students, 4 of therespondents were faculties and 3 of the respondents were employees. 156 of therespondents have been using the same connection whether it is post-paid or pre-paidout of which 123 of the respondents were students, 11 of the respondents werefaculties and 22 of the respondents were employees.
9. In the study, it was seen that out of the 180 respondents 151 respondents considered pre-paid connection as economical out of which 121 of the respondents werestudents, 9 of the respondents were faculties, 21 of the respondents were employees.
10.During the study it was found out that income is a major factor while choosing a
connection.
Limitations
1. The study was confined to only to students, faculties and employees of Dibrugarh University. So the findings may not be generalized in a broader
perspective.2. Some of the respondents did not read the questionnaire carefully.3. Some of the questionnaires were lost by the respondents during the survey.
4. It was very difficult to make the respondents realize the sincerity of the tests.
8/8/2019 Factors Impacting Consumers
http://slidepdf.com/reader/full/factors-impacting-consumers 49/52
Conclusion
It can be concluded from the study that pre-paid connection is the most dominant of the twoconnections. Pre-paid connection is very popular among the students because it is very mucheconomical and the students do not have any source of income. The post-paid connection is
used mostly by the faculties as they are economically well-of. The employees tend to use pre-paid connection as they earn less than the employees.
Annexure
FACTORS IMPACTING CONSUMERS’ PREFERENCES OF
POST-PAID AND PRE-PAID CONNECTIONS- A
COMPARATIVE STUDY OF DIBRUGARH UNIVERSITY
QUESTIONNAIRE
(Confidential & For Research Purpose Only).Please tick(˅) whichever applicable.
General Information:
Name:…………………………………………………………………. Contact No:…………………………….
Gender/Sex: Male Female
Age:……………
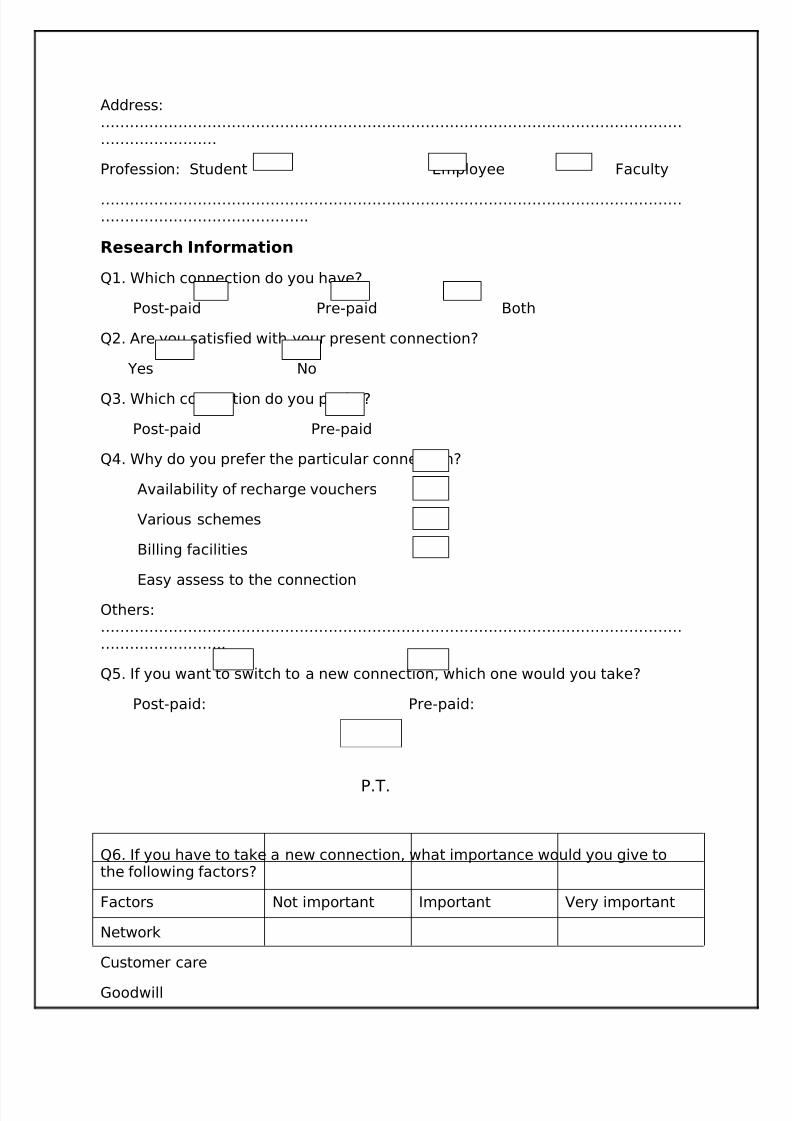
8/8/2019 Factors Impacting Consumers
http://slidepdf.com/reader/full/factors-impacting-consumers 50/52
Address:………………………………………………………………………………………………………………………………
Profession: Student Employee Faculty
……………………………………………………………………………………………………………………………………………….
Research Information
Q1. Which connection do you have?
Post-paid Pre-paid Both
Q2. Are you satisfied with your present connection?
Yes No
Q3. Which connection do you prefer?
Post-paid Pre-paid
Q4. Why do you prefer the particular connection?
Availability of recharge vouchers
Various schemes
Billing facilities
Easy assess to the connection
Others:………………………………………………………………………………………………………………………………..
Q5. If you want to switch to a new connection, which one would you take?
Post-paid: Pre-paid:
Q6. If you have to take a new connection, what importance would you give tothe following factors?
Factors Not important Important Very important
Network
Customer care
Goodwill
P.T.
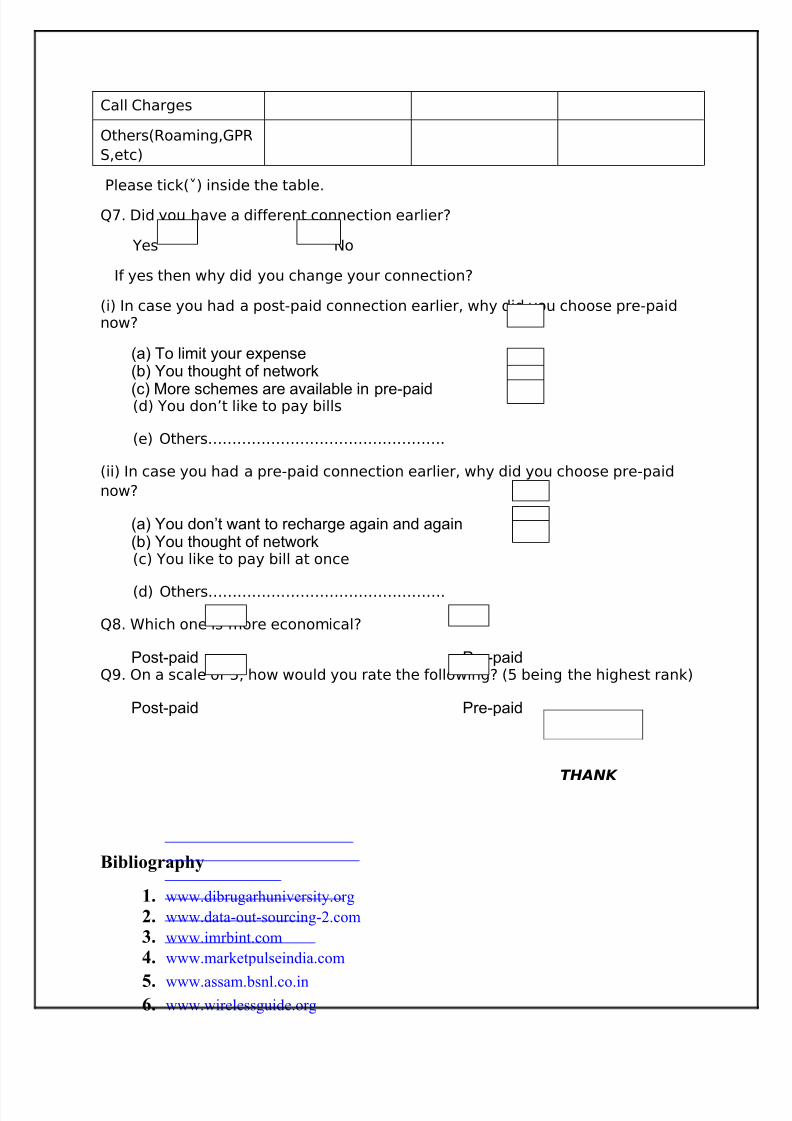
8/8/2019 Factors Impacting Consumers
http://slidepdf.com/reader/full/factors-impacting-consumers 51/52
Call Charges
Others(Roaming,GPR
S,etc)
Please tick(˅) inside the table.
Q7. Did you have a different connection earlier?
Yes No
If yes then why did you change your connection?
(i) In case you had a post-paid connection earlier, why did you choose pre-paidnow?
(a) To limit your expense(b) You thought of network
(c) More schemes are available in pre-paid(d) You don’t like to pay bills
(e) Others………………………………………….
(ii) In case you had a pre-paid connection earlier, why did you choose pre-paid
now?
(a) You don’t want to recharge again and again(b) You thought of network(c) You like to pay bill at once
(d) Others………………………………………….
Q8. Which one is more economical?
Post-paid Pre-paidQ9. On a scale of 5, how would you rate the following? (5 being the highest rank)
Post-paid Pre-paid
Bibliography
1. www.dibrugarhuniversity.org
2. www.data-out-sourcing-2.com
3. www.imrbint.com
4. www.marketpulseindia.com
5. www.assam.bsnl.co.in6. www.wirelessguide.org
THANK

8/8/2019 Factors Impacting Consumers
http://slidepdf.com/reader/full/factors-impacting-consumers 52/52
7. Research Methodology by C.R. Kothari
8. CONSUMER BEHAVIOUR In Indian Context by K.K.Srivastava, Sujata Khandai
9. Dibrugarh University- Database of Teachers, Officers and Employees of the
University [Names, Designations, Residential Address, Phone Nos.]