Embed Size (px)
Citation preview

RESEARCH ARTICLE
Factors determining cognitive, motor and
language scores in low birth weight infants
from North India
Ravi Prakash UpadhyayID1,2*, Sunita Taneja1, Suman Ranjitkar3, Sarmila Mazumder1,
Nita Bhandari1, Tarun Dua4, Laxman Shrestha3, Tor A. Strand5
1 Centre for Health Research and Development, Society for Applied Studies, New Delhi, India, 2 Department
of Global Public Health and Primary Care, University of Bergen, Bergen, Norway, 3 Department of Child
Health, Institute of Medicine, Tribhuvan University, Kathmandu, Nepal, 4 Department of Mental Health and
Substance Abuse, World Health Organization, Geneva, Switzerland, 5 Department of Research, Innlandet
Hospital Trust, Lillehammer, Norway
Abstract
Background
Children born with low birth weight (LBW) tend to have lower neurodevelopmental scores
compared to term normal birth weight children. It is important to determine factors that influ-
ence neurodevelopment in these low birth weight children especially in the first 2–3 years of
life that represents a period of substantial brain development.
Methods
This secondary data analysis was conducted using data from LBW infants enrolled soon
after birth in an individually randomized controlled trial (RCT) and followed up till end of 1st
year. Neurodevelopmental assessment was done at 12 months of corrected age by trained
psychologists using Bayley Scales of Infant and Toddler Development 3rd edition (Bayley-
III). Factors influencing cognitive, motor and language scores were determined using multi-
variable linear regression model.
Results
Linear growth (i.e., length for age z score, LAZ) [cognitive: Standardized β-coefficient =
2.19, 95% CI; 1.29, 3.10; motor: 2.41, 95% CI; 1.59, 3.23; language: 1.37, 95% CI; 0.70,
2.04], stimulation at home [cognitive: 0.21, 95% CI; 0.15, 0.27; motor: 0.12, 95% CI; 0.07,
0.17; language: 0.21, 95% CI; 0.16, 0.25] and number of diarrhoeal episodes [cognitive:
-2.87, 95% CI; -4.34, -1.39; motor: -2.62, 95% CI; -3.93, -1.29; language: -2.25, 95% CI;
-3.32, -1.17] influenced the composite scores in all three domains i.e., cognitive, language
and motor. While increase in LAZ score and stimulation led to increase in composite scores;
an increase in number of diarrhoeal episodes was associated with decrease in scores.
Weight for height z scores (WHZ) were associated with motor and language but not with
cognitive scores. Additionally, a negative association of birth order with cognitive and lan-
guage scores was noted.
PLOS ONE
PLOS ONE | https://doi.org/10.1371/journal.pone.0251387 May 12, 2021 1 / 13
a1111111111
a1111111111
a1111111111
a1111111111
a1111111111
OPEN ACCESS
Citation: Upadhyay RP, Taneja S, Ranjitkar S,
Mazumder S, Bhandari N, Dua T, et al. (2021)
Factors determining cognitive, motor and language
scores in low birth weight infants from North India.
PLoS ONE 16(5): e0251387. https://doi.org/
10.1371/journal.pone.0251387
Editor: Kannan Navaneetham, University of
Botswana, BOTSWANA
Received: October 28, 2020
Accepted: April 22, 2021
Published: May 12, 2021
Peer Review History: PLOS recognizes the
benefits of transparency in the peer review
process; therefore, we enable the publication of
all of the content of peer review and author
responses alongside final, published articles. The
editorial history of this article is available here:
https://doi.org/10.1371/journal.pone.0251387
Copyright: © 2021 Upadhyay et al. This is an open
access article distributed under the terms of the
Creative Commons Attribution License, which
permits unrestricted use, distribution, and
reproduction in any medium, provided the original
author and source are credited.
Data Availability Statement: All relevant data are
available from figshare (https://figshare.com/s/
c932d11ff5101e2268bf).

Conclusions
The findings indicate the possible importance of promoting nutrition and preventing diar-
rhoea as well as ensuring optimal stimulation and nurturance at home for enhancing child
development in LBW infants.
Introduction
It is estimated that around 250 million (43%) children under the age of 5 years in low- and
middle-income countries in 2010 did not reach their full developmental potential [1]. The
largest numbers are from Sub-Saharan Africa followed by South Asia [1]. Infants and children
with low birth weight (LBW) i.e. with birth weight�2500 g have been identified to be particu-
larly at a higher risk of neurodevelopmental impairment. Data from available studies suggest
that infants and children born with LBW have a higher risk of lower performance in cognitive,
motor and language domains; sub-optimal academic performance and significant behavioural
problems and developmental delay compared to term healthy counterparts [2–6].
Globally, 20 million LBW babies are born each year, more than 90% of them represent
from developing countries [7]. South Asia alone accounts for around one-fifth of all LBW
babies globally [7,8]. It is important to identify factors that influence neurodevelopment in
these low birth weight individuals especially in the first 2–3 years of life as this is the period
when substantial brain development occurs [9,10]. Such an understanding will not only help
putting together interventions that could accelerate development but also intervene early for
factors that may negatively influence development. Evidence from published studies done in
low-middle-income settings points towards certain biological factors that pose a risk for poor
neurodevelopment in children. These risk factors include prematurity, low birth weight, poor
nutrition, inadequate linear growth reflected as stunting, early childhood illnesses such as diar-
rhoea, poor socio-economic status and low maternal education [11–16]. Responsive stimula-
tion during the first years of life has also been shown to be crucial for later cognitive
development of children [17]. There are, however, limited studies that study the risk factors in
low birth weight infants. It is important to examine whether the risk factors for poor neurode-
velopment vary among normal healthy children and those born with low birth weight. With
this background, the primary objective of the current analysis was to determine the risk and
protective factors for cognitive, language and motor performance in low birth weight infants
from rural Haryana, India.
Materials and methods
Study design, setting and participants
This secondary data analysis used data from an individually randomized controlled trial
(RCT) aimed to evaluate the effect of community-initiated Kangaroo Mother Care (ciKMC)
on neurodevelopmental outcomes of infants born low birth weight at 12 months of corrected
age [18]. A total of 552 stable late preterm or term infants small for gestational age identified
within 72 hours of birth and weighing between 1500–2250 g were included in the trial (Clini-
calTrials.gov identifier NCT02631343) [18]. The study was conducted in rural and semi urban
population in districts Faridabad and Palwal, Haryana. Details of the study areas and the trial
procedures have been published [18].
PLOS ONE Determinants of neurodevelopment in low birth weight infants
PLOS ONE | https://doi.org/10.1371/journal.pone.0251387 May 12, 2021 2 / 13
Funding: The original study was funded by Grand
Challenges Canada (Grant Number 0725–03) and
the Research Council of Norway (RCN) through its
Centers of Excellence Scheme (project number
223269). This secondary data analysis was
supported by Centre for Intervention Science in
Maternal and Child Health (CISMAC), Norway
(https://www.uib.no/en/cismac). The funding was
recieved by RPU and SR The funders had no role in
study design, data collection and analysis, decision
to publish, or preparation of the manuscript.
Competing interests: The authors have declared
that no competing interests exist.

Participants and data collection
Pregnant women were identified and followed up by study workers through a 3 monthly
household surveillance programme. Babies born at home and also those born in a health facil-
ity were included, if KMC was not initiated in the facility. In case of home delivery, visit by the
team was made at the earliest in order to weigh the baby. In mothers who delivered at a health
facility, study team contacted the mother-infant dyad at home, soon after discharge and
screened the child for enrolment and measured weight, if still inside the 72 hours enrolment
window. Weight of the infant was measured using digital weighing scale (AWS-SR-20; Ameri-
can Weigh Scales, Cumming, GA, USA).
To be eligible for the study, a newborn had to weigh between 1500–2250 g within 72 hours
of delivery. Both singleton and multiple births were eligible. Infants who were unable to feed,
those with breathing problems, those with gross congenital malformations, or who were less
than normally active were referred to hospitals and therefore, not included in the study [18].
Written informed consent in the local language was obtained from caregivers by a study
worker prior to enrolment of participants. The intervention comprised of promotion and sup-
port of skin-to-skin contact and exclusive breastfeeding. Mother-infant dyads allocated to the
intervention group were visited at home by a trained intervention delivery team to explain and
initiate KMC and support its practice. All infants in the intervention and control groups
received Home Based Post Natal Care (HBPNC) visits by government health workers (Accred-
ited Social Health Activists; ASHAs) as implemented through the health system [18].
The sample size for the primary trial was calculated based on the expected difference of 0.25
SD (around 3.75 points) for cognitive, language and motor outcomes between the intervention
group and the control group infants [18]. Considering a power of 80% and assuming a 10%
loss to follow up, a total of 552 infants were enrolled. Ethical clearances were obtained from
the Ethics Review Committee, Society for Applied Studies, New Delhi and WHO Ethics
Review Committee. State approvals were available through a Memorandum of Understanding
signed with the National Health Mission in Haryana.
Outcomes
The neurodevelopmental assessment was done by psychologists using Bayley Scales of Infant and
Toddler Development 3rd edition (Bayley-III). The Bayley-III is a comprehensive assessment tool
of developmental functioning in infants and toddlers aged 1–42 months [19]. The test is adminis-
tered directly with the child, takes 40 to 60 minutes to administer and includes three main sub-
scales: cognitive, language (receptive and expressive) and motor (fine and gross) [19]. The
BSID-III was adapted for use in the study setting. Details of the adaptation have been provided
elsewhere [18]. The psychologists were trained and standardized in administering relevant ques-
tionnaires and scales. Periodic re-training and standardization exercises were conducted.
Exposures and other variables
At enrolment, information was collected on household characteristics (social class, religion,
wealth quintile, type of family), infant and birth characteristics (sex, place of delivery, type of
delivery, gestational age, birth order, parity and timing of initiation of breastfeeding) and mater-
nal and paternal characteristics (age, education and paternal occupation). Gestational age was
assessed either through documented records/available ultrasound reports or through self-
reported date of last menstrual period (LMP). Gathering information on vital status, breastfeed-
ing and morbidity (including any hospitalization) along with anthropometric measurements
(weight and length) was done by an independent trained outcome ascertainment team during
their home visits at child age 1, 3, 6 and 12 months. Caregivers were asked about morbidities in
PLOS ONE Determinants of neurodevelopment in low birth weight infants
PLOS ONE | https://doi.org/10.1371/journal.pone.0251387 May 12, 2021 3 / 13

the previous 2 weeks from the visit. Diarrhoea was operationally defined as three or more loose
stools in a day and pneumonia was defined as presence of difficult and fast breathing.
Data on maternal depressive symptoms was assessed using the Patient Health Question-
naire (PHQ)-9 [20]. The 9 items of PHQ-9 tool are based on the DSM-IV diagnostic criteria
and higher scores reflect presence of depressive symptoms. To measure infant temperament,
infant temperament scale was used as adapted in the MAL-ED study [21]. This 47 item-scale
covered six domains i.e. activity, positive emotionality, negative emotionality, sociability,
attention and soothability where higher scores reflect more difficult temperament. Maternal
sense of competence was assessed using “maternal self-efficacy scale” that consists of 10 ques-
tions with four-point scale responses: higher scores reflecting better maternal self-efficacy [22].
Maternal postnatal attachment scale was used to assess mother-infant bonding. This scale con-
sists of 19 items with higher scores reflecting better bonding [23]. PROCESS (Pediatric Review
of Children’s Environmental Support and Stimulation) questionnaire was used to assess the
intensity of stimulation at home. It consisted of three components: clinical observation, parent
questionnaire and toy list. Higher scores reflect better stimulation and support to infant [24].
Statistical analysis
All analysis was done using STATA version 16.0. The normality of the data was examined
using histogram, skewness and kurtosis coefficient. Mean (SD; standard deviation) or median
(IQR; inter-quartile range) were calculated for continuous variables depending upon the
nature of distribution and proportions for categorical variables. Distribution of baseline char-
acteristics was presented. The composite BSID-III scores for cognitive, motor and language
domains were calculated.
Potential variables for inclusion in the univariate model were determined from previous lit-
erature. Out of these variables, some were selected for inclusion in the final prediction model
based on the method suggested by Hosmer and Lemeshow (Applied logistic regression, Sec-
ond Edition) [25]. For each of the three outcomes i.e., cognitive, language and motor compos-
ite scores, univariable linear regression analysis was done as the initial step. Potential variables
were put in the univariate model and their corresponding p-value was recorded. Two sets of
variables were created- one set containing variable with p-value <0.20 and the other with vari-
able having a p-value�0.20 on univariate linear regression. All those variables for which the
P-value was less than 0.20 were considered for the multivariable regression analysis. Using
stepwise backward method, multivariable regression was done wherein all variables for which
p-value was greater than 0.05 in the model were removed and the regression model was re-
run. This process of model building was continued till the final sets of variables in the multi-
variate model were statistically significant. In the next step, variables that were excluded based
on their p-value of�0.20 on univariable regression or a p-value of�0.05 in multivariable
model were again put in the multivariable regression model one by one. Those that became
statistically significant i.e. p<0.05 were retained in the model. The final multivariate model
consisted of variables that were statistically significant with p-value of<0.05. Generalized
additive model (GAM) plots were generated using R version 3.1.2 (The R Foundation for Sta-
tistical Computing, Vienna, Austria) [26]. Plots were created using mgcv package. The aim of
the GAM plots was to explore nonlinear associations between continuous variables significant
in the multivariate model and the composite cognitive, language and motor scores.
Results
Baseline characteristics of the infants enrolled in the primary trial (N = 552) as well as those
available for neurodevelopmental assessments at 12 months of corrected age (N = 516) have
PLOS ONE Determinants of neurodevelopment in low birth weight infants
PLOS ONE | https://doi.org/10.1371/journal.pone.0251387 May 12, 2021 4 / 13

been presented in Table 1. Majority of the infants included in this analysis were born to Hindu
families (81.9%) and resided in joint families (73.8%). Mean (SD) birth weight (in grams) and
gestational age (in weeks) was 2058.7 (165.3) grams and 35.7 (1.9) respectively. Out of the total
infants enrolled, around three-fifth (59.7%) were females. Majority of the infants were of birth
order three or less (82.0%).
Determinants of cognitive scores
Mean (SD) composite cognitive score in the sample was 102.1 (11.8). Findings of the univari-
able regression has been presented in S1 Table. Findings of the multivariable linear regression
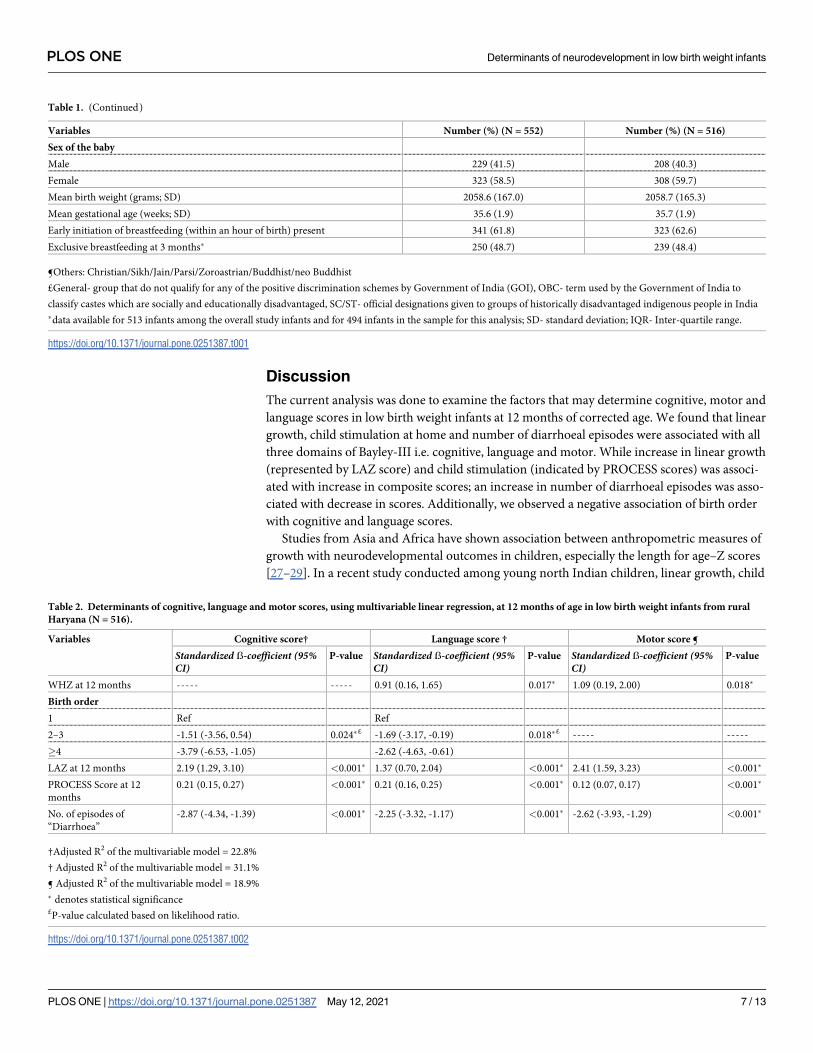
have been presented in Table 2. For each unit increase in length for age z score (LAZ), there
was around 2 unit increase in composite cognitive score (adjusted b = 2.19, 95% CI; 1.29,
3.10). PROCESS score was significantly associated with cognitive score at 12 months of age
(adjusted b = 0.21, 95% CI; 0.15, 0.27). With each episode of diarrhoea, there was around
3-point lower composite cognitive score (adjusted b = -2.87, 95% CI; -4.34, -1.39). Infants with
birth order of�4 had around 4 points lower cognitive score compared to those with birth
order of 1 (adjusted b = -3.79, 95% CI; -6.53, -1.05). When birth order was included as a con-
tinuous variable in the model, there was a significant association with cognitive scores i.e.,
with each unit increase in birth order, the cognitive composite scores reduced by 0.95 unit
(adjusted b = -0.95, 95% CI; -1.57, -0.32). These four significant variables in the multivariable
linear regression model explained around 22.8% of the variation in composite cognitive score.
Fig 1 shows the GAM plots. The plots re-affirm the associations observed on multivariable lin-
ear regression.
Determinants of language scores
Mean (SD) composite language score in the sample was 84.9 (9.1). Findings of the univariable
regression has been presented in S1 Table. In the multivariable regression model, each unit
increase in LAZ score (adjusted b = 1.37, 95% CI; 0.70, 2.04) and weight for height Z score
(WHZ) (adjusted b = 0.91, 95% CI; 0.16, 1.65) were associated with increase composite lan-
guage score (Table 2). With each unit increase of PROCESS score, the composite language
score increases by 0.21 units (95% CI, 0.16, 0.25). Compared to infants with birth order of 1,
those with birth order of 2 to 3 (adjusted b = -1.69, 95% CI; -3.17, -0.19) and�4 (adjusted b =-2.62, 95% CI; -4.63, -0.61) had lower language score (Table 2). When birth order was included
as a continuous variable in the model, there was a significant association with language scores
i.e., with each unit increase in birth order, the composite scores reduced by 0.61 unit (adjusted
b = -0.61, 95% CI; -1.06, -0.15). Each episode of diarrhoea led to a 2.25 unit decrease in com-
posite language scores (95% CI, -3.32, -1.17). These variables explained around one-third i.e.
31.1% of variability in the language scores. Fig 2 shows the GAM plots which re-affirm the
associations observed on multivariable linear regression.
Determinants of motor scores
Mean (SD) composite motor score in the sample was 90.2 (10.4). Findings of the univariable
regression has been presented in S1 Table. In the multivariable regression model, each unit
increase in LAZ score, WHZ score and PROCESS score was associated with an increase in the
composite motor score by 2.41 points (95% CI; 1.59, 3.23), 1.09 points (95% CI; 0.19, 2.00) and
0.12 (95% CI; 0.07, 0.17) respectively (Table 2). Each episode of diarrhoea was associated with
a decrease in the motor score by 2.62 points (95% CI; -3.93, -1.29). Overall, these variables
explained around 19% of the variability in the composite motor scores. Fig 3 shows the GAM
plots which re-affirm the associations observed on multivariable linear regression.
PLOS ONE Determinants of neurodevelopment in low birth weight infants
PLOS ONE | https://doi.org/10.1371/journal.pone.0251387 May 12, 2021 5 / 13

Table 1. Baseline characteristics of the primary trial population and the sample included in this secondary data analysis.
Variables Number (%) (N = 552) Number (%) (N = 516)
HOUSEHOLD CHARACTERISTICS
Quintiles
1 (Least poor) 110 (19.9) 109 (21.1)
2 112 (20.4) 105 (20.3)
3 110 (19.9) 99 (19.2)
4 110 (19.9) 100 (19.4)
5 (Poorest) 110 (19.9) 103 (20.0)
Religion
Hindu 450 (81.5) 423 (81.9)
Muslim 98 (17.8) 89 (17.3)
Others¶ 4 (0.7) 4 (0.8)
Social class£
General 137 (24.8) 133 (25.8)
Other Backward Class (OBC) 181 (32.8) 167 (32.4)
Scheduled Caste/Tribe (SC/ST) 234 (42.4) 216 (41.8)
Type of family
Nuclear 140 (25.4) 135 (26.2)
Joint 412 (74.6) 381 (73.8)
MATERNAL AND PATERNAL CHARACTERISTICS
Mean maternal age (years; SD) 23.0 (3.7) 23.1 (3.8)
Median years of education of mother (IQR) 5 (0–9) 5 (0–9)
Mother’s occupation
Employed outside home 10 (1.8) 9 (1.7)
Home maker 542 (98.2) 507 (98.3)
Mean father’s age (years; SD) 26.4 (4.8) 26.4 (4.7)
Median years of education of father (IQR) 8 (5–12) 8 (5–12)
Father’s occupation
Employed in a government/private firm 225 (40.8) 212 (41.1)
Daily wage earner 126 (22.8) 116 (22.5)
Self-employed (own business/farming) 177 (32.1) 166 (32.1)
Unemployed 24 (4.3) 22 (4.3)
BIRTH RELATED CHARACTERISTICS
Place of delivery
Home 160 (29.0) 148 (28.7)
Government facility 283 (51.3) 266 (51.5)
Private facility 109 (19.7) 102 (19.8)
Type of delivery
Normal 546 (98.9) 511 (99.0)
Caesarean section 6 (1.1) 5 (1.0)
Birth order
1 206 (37.3) 191 (37.0)
2–3 244 (44.2) 232 (45.0)
�4 102 (18.5) 93 (18.0)
Parity
Primiparous 206 (37.3) 191 (37.0)
Multiparous 346 (62.7) 325 (63.0)
INFANT CHARACTERISTICS
(Continued)
PLOS ONE Determinants of neurodevelopment in low birth weight infants
PLOS ONE | https://doi.org/10.1371/journal.pone.0251387 May 12, 2021 6 / 13
Discussion
The current analysis was done to examine the factors that may determine cognitive, motor and
language scores in low birth weight infants at 12 months of corrected age. We found that linear
growth, child stimulation at home and number of diarrhoeal episodes were associated with all
three domains of Bayley-III i.e. cognitive, language and motor. While increase in linear growth
(represented by LAZ score) and child stimulation (indicated by PROCESS scores) was associ-
ated with increase in composite scores; an increase in number of diarrhoeal episodes was asso-
ciated with decrease in scores. Additionally, we observed a negative association of birth order
with cognitive and language scores.
Studies from Asia and Africa have shown association between anthropometric measures of
growth with neurodevelopmental outcomes in children, especially the length for age–Z scores
[27–29]. In a recent study conducted among young north Indian children, linear growth, child
Table 1. (Continued)
Variables Number (%) (N = 552) Number (%) (N = 516)
Sex of the baby
Male 229 (41.5) 208 (40.3)
Female 323 (58.5) 308 (59.7)
Mean birth weight (grams; SD) 2058.6 (167.0) 2058.7 (165.3)
Mean gestational age (weeks; SD) 35.6 (1.9) 35.7 (1.9)
Early initiation of breastfeeding (within an hour of birth) present 341 (61.8) 323 (62.6)
Exclusive breastfeeding at 3 months� 250 (48.7) 239 (48.4)
¶Others: Christian/Sikh/Jain/Parsi/Zoroastrian/Buddhist/neo Buddhist
£General- group that do not qualify for any of the positive discrimination schemes by Government of India (GOI), OBC- term used by the Government of India to
classify castes which are socially and educationally disadvantaged, SC/ST- official designations given to groups of historically disadvantaged indigenous people in India
�data available for 513 infants among the overall study infants and for 494 infants in the sample for this analysis; SD- standard deviation; IQR- Inter-quartile range.
https://doi.org/10.1371/journal.pone.0251387.t001
Table 2. Determinants of cognitive, language and motor scores, using multivariable linear regression, at 12 months of age in low birth weight infants from rural
Haryana (N = 516).
Variables Cognitive score† Language score † Motor score ¶
Standardized ẞ-coefficient (95%CI)
P-value Standardized ẞ-coefficient (95%CI)
P-value Standardized ẞ-coefficient (95%CI)
P-value
WHZ at 12 months ----- ----- 0.91 (0.16, 1.65) 0.017� 1.09 (0.19, 2.00) 0.018�
Birth order
1 Ref Ref
2–3 -1.51 (-3.56, 0.54) 0.024�£ -1.69 (-3.17, -0.19) 0.018�£ ----- -----
�4 -3.79 (-6.53, -1.05) -2.62 (-4.63, -0.61)
LAZ at 12 months 2.19 (1.29, 3.10) <0.001� 1.37 (0.70, 2.04) <0.001� 2.41 (1.59, 3.23) <0.001�
PROCESS Score at 12
months
0.21 (0.15, 0.27) <0.001� 0.21 (0.16, 0.25) <0.001� 0.12 (0.07, 0.17) <0.001�
No. of episodes of
“Diarrhoea”
-2.87 (-4.34, -1.39) <0.001� -2.25 (-3.32, -1.17) <0.001� -2.62 (-3.93, -1.29) <0.001�
†Adjusted R2 of the multivariable model = 22.8%
† Adjusted R2 of the multivariable model = 31.1%
¶ Adjusted R2 of the multivariable model = 18.9%
� denotes statistical significance£P-value calculated based on likelihood ratio.
https://doi.org/10.1371/journal.pone.0251387.t002
PLOS ONE Determinants of neurodevelopment in low birth weight infants
PLOS ONE | https://doi.org/10.1371/journal.pone.0251387 May 12, 2021 7 / 13

stimulation and diarrhoeal episodes were associated with scores obtained on Ages and Stages
Questionnaire- 3rd edition (ASQ-3) [30]. Owing to the overlap in the factors that are responsi-
ble for poor growth and neurodevelopment in early childhood, such as inadequate nutrition;
morbidities and insufficient care and stimulation, linear growth and neurodevelopment seem
to be often closely associated [31]. These adversities lead to deficits in neuronal growth and
connectivity within regions of the brain associated with memory, high order learning and
motor functioning [32,33]. Stunting, reflecting malnutrition, is a commonly used indicator to
identify children with higher risk of developmental deficits [1,34]. We have shown in our anal-
ysis that LAZ is a significant determinant of neurodevelopment and support its use as a proxy
for neurodevelopment during infancy.
We observed that weight for height z scores (WHZ) were associated with motor and lan-
guage outcomes. It could be because children who do not experience acute malnutrition possi-
bly have an enhanced capability to engage with the surrounding environment which is
Fig 1. Association between length for age z-scores (LAZ); PROCESS score and birth order with change in composite cognitive score. The graphs were constructed
using generalized additive models in R, the solid line depicts the association of composite cognitive score and HAZ/PROCESS score/birth order. The Y-axis is centered
on the mean composite cognitive score. The shaded area spans the 95% confidence interval of this association.
https://doi.org/10.1371/journal.pone.0251387.g001
Fig 2. Associations between height for age z-scores (HAZ); weight for height z-scores (WHZ), birth order, PROCESS score and change in composite language
score. The graphs were constructed using generalized additive models in R, the solid line depicts the association of composite language score and HAZ/WHZ/birth
order/PROCESS score. The Y-axis is centered on the mean composite language score. The shaded area spans the 95% confidence interval of this association.
https://doi.org/10.1371/journal.pone.0251387.g002
PLOS ONE Determinants of neurodevelopment in low birth weight infants
PLOS ONE | https://doi.org/10.1371/journal.pone.0251387 May 12, 2021 8 / 13

essential for development [35,36]. Studies have found an association of WAZ with cognitive
outcomes; however, we did not find any significant association [35,37]. Our findings are simi-
lar to a prospective study in Peruvian children that noted no significant association between
weight for length z scores (WLZ) during infancy and intelligence at child age 9 years. [38]. It
may be worth to explore whether there is, in real, any differential effect of acute malnutrition
on brain functioning.
Similar to our findings, previous studies have also documented a significant negative effect
of diarrhoea on neurodevelopmental outcomes [30,38–41]. There are indications that this
could be both through its negative impact on growth and its independent effect on gut envi-
ronment. Intestinal damage as a result of diarrhoea could hamper absorption of critical growth
promoting nutrients, thereby affecting linear growth and in turn cognition [41]. On the other
hand, occurrence of diarrhoea may instigate systemic inflammatory signals and release of
potential neural damaging cytokines [42,43]. Another concept is that of “functional isolation”
wherein a child with diarrhoea may be irritable and therefore receive less quality responsive
care from the caregivers [44]. In concordance with previous studies showing that children
with higher birth order positions are at a disadvantage in terms of cognitive development and
educational attainment, we found a negative association of birth order with cognitive and lan-
guage scores [45–47]. A plausible explanation to justify this association comes from the quan-
tity and quality dilution hypothesis [47]. According to the dilution model, children who are
early in the birth order often get a reasonably larger proportion of the family resources or the
quality of care received is often better than those who are later in the birth order (who probably
have to face more competition). This is considered beneficial for the development of children
born early in the birth order [47].
The findings of our study provide impetus to focus on reduction of stunting during infancy,
possibly through improved nutrition. The findings also lay emphasis on promotion of early
child stimulation interventions and diarrhoea prevention and management during infancy.
The study identifies important factors that influence cognitive, language and motor outcomes
in low birth weight infants during infancy and could serve as indicators to identify those that
need additional care and support.
Fig 3. Associations between height for age z-scores (HAZ); weight for height z-scores (WHZ), PROCESS score and change in composite motor score. The graphs
were constructed using generalized additive models in R, the solid line depicts the association of composite motor score and HAZ/WHZ/PROCESS score. The Y-axis is
centered on the mean composite motor score. The shaded area spans the 95% confidence interval of this association.
https://doi.org/10.1371/journal.pone.0251387.g003
PLOS ONE Determinants of neurodevelopment in low birth weight infants
PLOS ONE | https://doi.org/10.1371/journal.pone.0251387 May 12, 2021 9 / 13

Strengths and limitations
The modest sample size of around 500 infants is one of the main strengths. Trained and stan-
dardized psychologists conducted the Bayley-III assessments and collected data on stimulation
practices at home. The standardized and reliable measurement of anthropometry by trained
study team members is also a strength. Another strength is the robustness of the multivariable
model for the outcomes considered in the analysis, as reflected by the R2 values. One key limi-
tation is that the study subjects for this analysis were largely stable late preterm or term infants
small for gestational age and were only slightly low birth weight. Therefore, the findings may
only be applicable to this specific subset of infants. However, for this subset of LBWs, the find-
ings could be generalizable to other South-east Asian and low-middle-income countries as the
burden of low birth weight, risk factors for poor development and the quality of care provide
to these vulnerable infants is similar in these settings. It should also be noted from Fig 3 that
the association between WHZ and composite motor scores may not be linear. Therefore, it
would have been more appropriate to include WHZ as quadratic or logarithmic or exponential
term or in other transformed form to achieve linearity for regression analysis. However,
because such terms are difficult to interpret and communicate, we chose to include it as linear
term in addition to showing the shape of association in Fig 3.
Conclusions
The findings support promoting nutrition and ensuring optimal stimulation at home for
advancing child development in infants born with low birth weight. Our study also lends sup-
port for diarrhoea disease control as it is an important risk factor for poor neurodevelopment
in these vulnerable infants.
Supporting information
S1 Table. Findings on univariable linear regression for cognitive, language and motor
scores at 12 months of infant age in low birth weight infants from rural Haryana.
(DOC)
Author Contributions
Conceptualization: Ravi Prakash Upadhyay, Sunita Taneja, Suman Ranjitkar, Tor A. Strand.
Data curation: Ravi Prakash Upadhyay, Sunita Taneja.
Formal analysis: Ravi Prakash Upadhyay, Sunita Taneja, Suman Ranjitkar, Tor A. Strand.
Funding acquisition: Ravi Prakash Upadhyay, Suman Ranjitkar.
Investigation: Ravi Prakash Upadhyay, Tor A. Strand.
Methodology: Ravi Prakash Upadhyay, Tor A. Strand.
Project administration: Sunita Taneja, Sarmila Mazumder, Nita Bhandari.
Resources: Sunita Taneja, Sarmila Mazumder, Nita Bhandari.
Supervision: Sarmila Mazumder, Nita Bhandari, Tarun Dua.
Writing – original draft: Ravi Prakash Upadhyay, Tor A. Strand.
Writing – review & editing: Ravi Prakash Upadhyay, Sunita Taneja, Suman Ranjitkar, Sarmila
Mazumder, Nita Bhandari, Tarun Dua, Laxman Shrestha, Tor A. Strand.
PLOS ONE Determinants of neurodevelopment in low birth weight infants
PLOS ONE | https://doi.org/10.1371/journal.pone.0251387 May 12, 2021 10 / 13
References1. Grantham-McGregor S, Cheung YB, Cueto S, Glewwe P, Richter L, Strupp B, et al. Developmental
potential in the first 5 years for children in developing countries. Lancet. 2007; 369(9555):60–70. https://
doi.org/10.1016/S0140-6736(07)60032-4 PMID: 17208643
2. Upadhyay RP, Naik G, Choudhary TS, Chowdhury R, Taneja S, Bhandari N, et al. Cognitive and motor
outcomes in children born low birth weight: a systematic review and meta-analysis of studies from
South Asia. BMC Pediatr. 2019; 19(1):35. https://doi.org/10.1186/s12887-019-1408-8 PMID: 30696415
3. Leijon I, Ingemansson F, Nelson N, Wadsby M, Samuelsson S. Reading deficits in very low birthweight
children are associated with vocabulary and attention issues at the age of seven. Acta Paediatr. 2016;
105(1):60–8. https://doi.org/10.1111/apa.13094 PMID: 26098907
4. Arpi E, Ferrari F. Preterm birth and behaviour problems in infants and preschool-age children: a review
of the recent literature. Dev Med Child Neurol. 2013; 55(9):788–96. https://doi.org/10.1111/dmcn.12142
PMID: 23521214
5. Weindrich D, Jennen-Steinmetz C, Laucht M, Schmidt MH. Late sequelae of low birthweight: mediators
of poor school performance at 11 years. Dev Med Child Neurol. 2003; 45(7):463–9. https://doi.org/10.
1017/s0012162203000860 PMID: 12828400
6. Whitaker AH, Feldman JF, Lorenz JM, Shen S, McNicholas F, Nieto M, et al. Motor and cognitive out-
comes in nondisabled low-birth-weight adolescents: early determinants. Arch Pediatr Adolesc Med.
2006; 160(10):1040–6. https://doi.org/10.1001/archpedi.160.10.1040 PMID: 17018463
7. Blencowe H, Krasevec J, de Onis M, Black RE, An X, Stevens GA, et al. National, regional, and world-
wide estimates of low birthweight in 2015, with trends from 2000: a systematic analysis. Lancet Glob
Health. 2019; 7(7):e849–e860. https://doi.org/10.1016/S2214-109X(18)30565-5 PMID: 31103470
8. Lee AC, Katz J, Blencowe H, Kozuki N, Vogel JP, Adair L, et al. National and regional estimates of term
and preterm babies born small for gestational age in 138 low-income and middle-income countries in
2010. Lancet Glob Health. 2013; 1(1):e26–36. https://doi.org/10.1016/S2214-109X(13)70006-8 PMID:
25103583
9. Fox SE, Levitt P, Nelson CA 3rd. How the timing and quality of early experiences influence the develop-
ment of brain architecture. Child Dev. 2010; 81(1):28–40. https://doi.org/10.1111/j.1467-8624.2009.
01380.x PMID: 20331653
10. Thompson RA, Nelson CA. Developmental science and the media. Early brain development. Am Psy-
chol. 2001; 56(1):5–15. https://doi.org/10.1037/0003-066x.56.1.5 PMID: 11242988
11. Espel EV, Glynn LM, Sandman CA, Davis EP. Longer gestation among children born full term influ-
ences cognitive and motor development. PLoS One. 2014; 9(11):e113758. https://doi.org/10.1371/
journal.pone.0113758 PMID: 25423150
12. Sania A, Sudfeld CR, Danaei G, Fink G, McCoy DC, Zhu Z, et al. Early life risk factors of motor, cogni-
tive and language development: a pooled analysis of studies from low/middle-income countries. BMJ
Open. 2019; 9(10):e026449. https://doi.org/10.1136/bmjopen-2018-026449 PMID: 31585969
13. Woldehanna T, Behrman JR, Araya MW. The effect of early childhood stunting on children’s cognitive
achievements: Evidence from young lives Ethiopia. Ethiop J Health Dev. 2017; 31(2):75–84. PMID:
29249889
14. Georgieff MK, Ramel SE, Cusick SE. Nutritional influences on brain development. Acta Paediatr. 2018;
107(8):1310–1321. https://doi.org/10.1111/apa.14287 PMID: 29468731
15. Lorntz B, Soares AM, Moore SR, Pinkerton R, Gansneder B, Bovbjerg VE, et al. Early childhood diar-
rhea predicts impaired school performance. Pediatr Infect Dis J. 2006; 25(6):513–20. https://doi.org/10.
1097/01.inf.0000219524.64448.90 PMID: 16732149
16. Ribe IG, Svensen E, Lyngmo BA, Mduma E, Hinderaker SG. Determinants of early child development
in rural Tanzania. Child Adolesc Psychiatry Ment Health. 2018; 12:18. https://doi.org/10.1186/s13034-
018-0224-5 PMID: 29568326
17. Yousafzai AK, Obradović J, Rasheed MA, Rizvi A, Portilla XA, Tirado-Strayer N, et al. Effects of respon-
sive stimulation and nutrition interventions on children’s development and growth at age 4 years in a dis-
advantaged population in Pakistan: a longitudinal follow-up of a cluster-randomised factorial
effectiveness trial. Lancet Glob Health. 2016; 4(8):e548–58. https://doi.org/10.1016/S2214-109X(16)
30100-0 PMID: 27342433
18. Taneja S, Sinha B, Upadhyay RP, Mazumder S, Sommerfelt H, Martines J, et al. Community initiated
kangaroo mother care and early child development in low birth weight infants in India-a randomized con-
trolled trial. BMC Pediatr. 2020; 20(1):150. Published 2020 Apr 4. https://doi.org/10.1186/s12887-020-
02046-4 PMID: 32247311
19. Bayley N: Bayley Scales of Infant and Toddler Development: Administration Manual, 3rd edition. In.
United States of America: Psychorp; 2006.
PLOS ONE Determinants of neurodevelopment in low birth weight infants
PLOS ONE | https://doi.org/10.1371/journal.pone.0251387 May 12, 2021 11 / 13

20. Kroenke K, Spitzer RL, Williams JB: The PHQ-9: validity of a brief depression severity measure. J Gen
Intern Med 2001, 16(9):606–613. https://doi.org/10.1046/j.1525-1497.2001.016009606.x PMID:
11556941
21. Murray-Kolb LE, Rasmussen ZA, Scharf RJ, Rasheed MA, Svensen E, Seidman JC, et al. The MAL-ED
cohort study: methods and lessons learned when assessing early child development and caregiving
mediators in infants and young children in 8 low- and middle-income countries. Clin Infect Dis 2014, 59
(Suppl 4):S261–272. 210.1093/cid/ciu1437.
22. Teti DM, Gelfand DM. Behavioral competence among mothers of infants in the first year: the media-
tional role of maternal self-efficacy. Child Dev 1991, 62(5):918–929. https://doi.org/10.1111/j.1467-
8624.1991.tb01580.x PMID: 1756667
23. Condon J, Corkindale C. The assessment of parent-to-infant attachment: Development of a self-report
questionnaire instrument. Journal of Reproductive and Infant Psychology 1998, 16(1):57–76.
24. Casey PH, Barrett K, Bradley RH, Spiker D. Pediatric clinical assessment of mother-child interaction:
concurrent and predictive validity. J Dev Behav Pediatr 1993, 14(5):313–317. PMID: 8254062
25. Hosmer DW, Lemeshow S, Sturdivant RX. Applied logistic regression. New York: Wiley; 2013.
26. Wood SN. Generalized additive models: an introduction with R. 2nd ed. Boca Raton, FL: Chapman
and Hall/CRC, Taylor and Francis Group, 2017.
27. Lee JJ, Kapur K, Rodrigues EG, et al. Anthropometric measures at birth and early childhood are associ-
ated with neurodevelopmental outcomes among Bangladeshi children aged 2-3years. Sci Total Envi-
ron. 2017; 607–608:475–482. https://doi.org/10.1016/j.scitotenv.2017.06.168 PMID: 28704672
28. Ranjitkar S, Hysing M, Kvestad I, Shrestha M, Ulak M, Shilpakar JS, et al. Determinants of Cognitive
Development in the Early Life of Children in Bhaktapur, Nepal. Front Psychol. 2019; 10:2739. Published
2019 Dec 6. https://doi.org/10.3389/fpsyg.2019.02739 PMID: 31920798
29. Haile D, Nigatu D, Gashaw K, Demelash H. Height for age z score and cognitive function are associated
with Academic performance among school children aged 8–11 years old. Arch Public Health. 2016;
74:17. https://doi.org/10.1186/s13690-016-0129-9 PMID: 27141306
30. Kvestad I, Taneja S, Hysing M, Kumar T, Bhandari N, Strand TA. Diarrhea, stimulation and growth pre-
dict neurodevelopment in young North Indian children. PLoS One. 2015; 10(3):e0121743. https://doi.
org/10.1371/journal.pone.0121743 PMID: 25826376
31. Leroy JL, Frongillo EA. Perspective: What Does Stunting Really Mean? A Critical Review of the Evi-
dence. Adv Nutr. 2019; 10:196–204. https://doi.org/10.1093/advances/nmy101 PMID: 30801614
32. Prado EL, Dewey KG. Nutrition and brain development in early life. Nutr Rev. 2014; 72(4):267–284.
https://doi.org/10.1111/nure.12102 PMID: 24684384
33. Xie W, Jensen SKG, Wade M, Kumar S, Westerlund A, Kakon SH, et al. Growth faltering is associated
with altered brain functional connectivity and cognitive outcomes in urban Bangladeshi children
exposed to early adversity. BMC Med. 2019; 17(1):199. https://doi.org/10.1186/s12916-019-1431-5
PMID: 31760950
34. Lu C, Black MM, Richter LM. Risk of poor development in young children in low-income and middle-
income countries: an estimation and analysis at the global, regional, and country level. Lancet Glob
Health. 2016; 4(12):e916–e922.
35. Sudfeld CR, McCoy DC, Fink G, Muhihi A, Bellinger DC, Masanja H, et al. Malnutrition and Its Determi-
nants Are Associated with Suboptimal Cognitive, Communication, and Motor Development in Tanza-
nian Children. J Nutr. 2015; 145(12):2705–2714. https://doi.org/10.3945/jn.115.215996 PMID:
26446481
36. Levitsky DA, Barnes RH. Nutritional and environmental interactions in the behavioral development of
the rat: long-term effects. Science. 1972; 176(4030):68–71. https://doi.org/10.1126/science.176.4030.
68 PMID: 5062235
37. McDonald CM, Manji KP, Kupka R, Bellinger DC, Spiegelman D, Kisenge R, et al. Stunting and wasting
are associated with poorer psychomotor and mental development in HIV-exposed Tanzanian infants. J
Nutr. 2013; 143(2):204–214. https://doi.org/10.3945/jn.112.168682 PMID: 23256148
38. Berkman DS, Lescano AG, Gilman RH, Lopez SL, Black MM. Effects of stunting, diarrhoeal disease,
and parasitic infection during infancy on cognition in late childhood: a follow-up study. Lancet. 2002;
359:564–71. https://doi.org/10.1016/S0140-6736(02)07744-9 PMID: 11867110
39. MAL-ED Network Investigators. Early childhood cognitive development is affected by interactions
among illness, diet, enteropathogens and the home environment: findings from the MAL-ED birth cohort
study. BMJ Glob Health. 2018; 3(4):e000752. https://doi.org/10.1136/bmjgh-2018-000752 PMID:
30058645
PLOS ONE Determinants of neurodevelopment in low birth weight infants
PLOS ONE | https://doi.org/10.1371/journal.pone.0251387 May 12, 2021 12 / 13

40. Pinkerton R, Oria RB, Lima AA, Rogawski ET, Oria MO, Patrick PD, et al. Early Childhood Diarrhea Pre-
dicts Cognitive Delays in Later Childhood Independently of Malnutrition. Am J Trop Med Hyg. 2016; 95
(5):1004–1010. https://doi.org/10.4269/ajtmh.16-0150 PMID: 27601523
41. Petri WA Jr, Miller M, Binder HJ, Levine MM, Dillingham R, Guerrant RL. Enteric infections, diarrhea,
and their impact on function and development. J Clin Invest. 2008; 118(4):1277–1290. https://doi.org/
10.1172/JCI34005 PMID: 18382740
42. Oria RB, Murray-Kolb LE, Scharf RJ, Pendergast LL, Lang DR, Kolling GL, et al. Early-life enteric infec-
tions: relation between chronic systemic inflammation and poor cognition in children. Nutr Rev. 2016;
74(6):374–386. https://doi.org/10.1093/nutrit/nuw008 PMID: 27142301
43. Bhutta ZA, Guerrant RL, Nelson CA 3rd. Neurodevelopment, Nutrition, and Inflammation: The Evolving
Global Child Health Landscape. Pediatrics. 2017; 139(Suppl 1):S12–S22. https://doi.org/10.1542/peds.
2016-2828D PMID: 28562245
44. Lozoff B, Klein NK, Nelson EC, McClish DK, Manuel M, Chacon ME. Behavior of infants with iron-defi-
ciency anemia. Child Dev. 1998; 69(1):24–36. PMID: 9499554
45. Lehmann JK, Nuevo-Chiquero A, Vidal-Fernandez M. The early origins of birth order differences in chil-
dren’s outcomes and parental behavior. Journal of Human Resources 2018; 53(1):123–156.
46. Damian RI, Roberts BW. The associations of birth order with personality and intelligence in a represen-
tative sample of US high school students. J Res Pers. 2015; 58:96–105.
47. Heiland F. Does the birth order affect the cognitive development of a child?, Applied Economics 2009;
41:1799–1818, https://doi.org/10.1080/00036840601083220
PLOS ONE Determinants of neurodevelopment in low birth weight infants
PLOS ONE | https://doi.org/10.1371/journal.pone.0251387 May 12, 2021 13 / 13