Embed Size (px)
Citation preview

FACTORS CONTRIBUTING TO THE PREVALENCE OF PROSTATE CANCER IN RURAL
SASKATCHEWAN: THE SASKATCHEWAN RURAL HEALTH STUDY
A Thesis Submitted to the College of
Graduate Studies and Research
in Partial Fulfillment of the Requirements
for the Degree of Masters of Science
in the Department of Community Health and Epidemiology
University of Saskatchewan
Saskatoon
By
Meenu Rai
Copyright Meenu Rai, October 2013. All rights reserved.

i
PERMISSION TO USE
In presenting this thesis in partial fulfilment of the requirements for a Postgraduate degree
from the University of Saskatchewan, I agree that the Libraries of this University may make it
freely available for inspection. I further agree that permission for copying of this thesis in any
manner, in whole or in part, for scholarly purposes may be granted by the professor or professors
who supervised my thesis work or, in their absence, by the Head of the Department or the Dean
of the College in which my thesis work was done. It is understood that any copying or
publication or use of this thesis or parts thereof for financial gain shall not be allowed without
my written permission. It is also understood that due recognition shall be given to me and to the
University of Saskatchewan in any scholarly use which may be made of any material in my
thesis.
Requests for permission to copy or to make other use of material in this thesis in
whole or part should be addressed to:
Head of the Department of Community Health and Epidemiology
University of Saskatchewan
Saskatoon, Saskatchewan
S7N-5E5

ii
ABSTRACT
Prostate cancer is the most commonly diagnosed cancer in Canadian males, and is the third
most common cause of cancer related deaths with decreasing mortality in men. Previous studies
have suggested that an increased risk of prostate cancer among men may be associated with rural
environment. The etiology of prostate cancer is not precisely known among men in rural
Saskatchewan. We investigated the prevalence of prostate cancer and the putative relationship
between rural exposures (occupational i.e. farming and environmental), personal smoking
history, family history of cancer and prostate cancer. A baseline mail out survey was conducted
in 2010-2011 of 11,982 households located in four geographic regions (South West, South East,
North West, and North East) of Saskatchewan, Canada. Completed questionnaires were obtained
from 4,624 households (8,261 individuals).The questionnaires collected information on
individual (demographic factors, exposure to pesticides including insecticides, herbicides and
fungicides) and contextual (household characteristics such as income, smoking) determinants
from a rural population. In total 2,938 males (114 prostate cancer cases) were included for this
analysis who were older than 45 years. Logistic regression analysis was used to analyze the
relationship between independent variables and prostate cancer. Among prostate cancer cases,
46% of men lived on farms of rural Saskatchewan. The age standardized prevalence of prostate
cancer was 3.32% (3.81% (n=52) and 2.95% (n=61) among farm and non-farm resident men).
Farming job and farming duration did not have a statistically significant association with prostate
cancer. A trend was observed for men who had work place exposure to insecticides and
fungicides collectively and radiation to have an increased risk in comparison to men without
these exposures. Personal smoking history, history of smoking pack years and family history of
cancer modified the relationship between residence and prostate cancer. Age of an individual
(≥ 65 years) was the strongest and most consistent risk factor of prostate cancer. Other factors
such as marital status, household income adequacy, history of cardiovascular disease may also be
associated with prostate cancer. The results may help research professionals by directing the
focus of their research towards rural population examining prostate cancer.

iii
ACKNOWLEDGEMENTS
It would not have been possible to finish this thesis without the kind support and guidance of my
supervisors and committee member. I would like to express my sincere gratitude to my
supervisors, Dr. Punam Pahwa and Dr. Josh Lawson.
I would like to thank Dr. Punam Pahwa for her advice and supervision on statistical part during
the analysis phase. I am deeply grateful to her for her patient and caring nature throughout my
thesis work.
I would like to thank Dr. Josh Lawson for his guidance and suggestions on epidemiological
concepts and logical thinking. His idea of lab group meetings for students to discuss their
research created a wonderful learning experience.
I would like to thank both of them again for patiently correcting my thesis, for all that
encouragement throughout my research and allowing me to seek their assistance anytime of the
day to discuss my concerns. I am grateful to them for making this learning environment a
friendly one.
I would like to thank Dr. Rani Kanthan for her valuable suggestions and feedback on this project.
The comments that I received were truly helpful in building the research stronger and not to
mention the hard questions for preparing me for the defense.
I would also like to acknowledge the Canadian Centre for Health and Safety in Agriculture
(CCHSA), Dr. James Dosman, the principal investigator of the CIHR funded-Saskatchewan
Rural Health Study for providing me with the data used in the thesis.
Last but by no means least; I thank my family for their encouragement and supporting me
spiritually. I would also like to thank my Saskatchewan friend Leije Zheng for her wonderful
friendship and supportive nature that made my journey a happier one to the end of this program.

iv
TABLE OF CONTENTS
Permission to Use………………………………………………………...........….........................i
Abstract………………………....……………………………………….......................................ii
Acknowledgements........................................................................................................................iii
Table of Contents……………………………………………………………............…...............iv
List of Tables………………………………………………………………..................................vi
List of Figures……………………………………………………………..…............….............viii
List of Abbreviations……………………………………………….……………..........................x
CHAPTER 1: INTRODUCTION AND RATIONALE ................................................................. 1
1.1 Introduction ........................................................................................................................... 1 1.2 Rationale ............................................................................................................................... 2
1.3 Objectives ............................................................................................................................. 3 CHAPTER 2: LITERATURE REVIEW ........................................................................................ 4
2.1 Identification of Literature .................................................................................................... 4 2.2 Incidence and Mortality ........................................................................................................ 4
2.2.1 International ................................................................................................................... 4 2.2.2 Canada............................................................................................................................ 7
2.2.3 Saskatchewan ............................................................................................................... 10 2.3 Risk Factors and Etiology ................................................................................................... 12
2.3.1 Age ............................................................................................................................... 12
2.3.2 Race.............................................................................................................................. 13
2.3.3 Family History of Prostate Cancer ............................................................................... 14 2.3.4 Cigarette Smoking ....................................................................................................... 15
2.3.5 Farming Occupation and Pesticide Exposure .............................................................. 16
CHAPTER 3: METHODS ............................................................................................................ 18 3.1 Study Design ....................................................................................................................... 18
3.2 Study Population, Selection and Recruitment .................................................................... 18 3.3 Data Collection ................................................................................................................... 18 3.4 Theoretical Framework ....................................................................................................... 19
3.5 Operational Definitions:...................................................................................................... 20 3.6 Sample Size ......................................................................................................................... 23 3.7 Statistical Analysis .............................................................................................................. 25
CHAPTER 4: RESULTS .............................................................................................................. 28
4.1 Participation and Descriptive Characteristics ..................................................................... 28 4.1.1 Personal and Household Characteristics of Study Participants ................................... 31
4.1.2 Occupational and Environmental Characteristics of Study Participants ..................... 34 4.1.3 Univariate Associations ............................................................................................... 37
4.2 Research Question1: Prevalence ......................................................................................... 38 4.3 Research Question 2 ........................................................................................................... 38
4.3.1 Research Question 2a ................................................................................................... 38
4.3.2 Research Question 2b .................................................................................................. 42 4.3.3 Research question 2c .................................................................................................... 47
4.4 Research Question 3 ........................................................................................................... 51

v
CHAPTER 5: DISCUSSION .................................................................................................... 62 5.1 Summary and Interpretation of Results .............................................................................. 62 5.2 Study Strengths and Limitations ......................................................................................... 66
5.2.1 Study Strengths ............................................................................................................ 66
5.2.2 Study Limitations ......................................................................................................... 67 5.3 Recommendations ............................................................................................................... 68 5.4 Conclusion .......................................................................................................................... 70
REFERENCES ............................................................................................................................. 71
Appendix A: Survey Questionnaire .............................................................................................. 79

vi
LIST OF TABLES
Table 3.1 Residence i.e. farm and non-farm among men with prostate cancer and men without
prostate cancer……………………………....................................................................…...……23
Table 3.2 Post-hoc power analysis based on prostate cancer present (n=113) and prostate cancer
absent (n=2824) for different values of the relative frequency of exposure among controls in the
target population (p0) and relative risk (R)…........... …………………...................................….25
Table 4.1 Descriptive characteristics of study participants stratified by farm and non-farm
residence status..............................................................................................................................29
Table 4.2 Descriptive and univariate analysis of personal and household characteristics of study
participants by presence or absence of prostate cancer …………...........................................….32
Table 4.3 Descriptive and univariate analysis of environmental and farming occupational
characteristics of study participants by presence or absence of prostate cancer......................…35
Table 4.4 Crude and age standardized prostate cancer prevalence (men > 45 years) by farm/non-
farm residence status……………………….........……............................…………....................38
Table 4.5 Multivariate analysis of rural exposure (occupational and environmental) ..........…40
Table 4.6 Multivariate analysis of the personal smoking history and exposure to household
smoke...........................................................................................................................................43
Table 4.7 Stratified analysis of the personal smoking history as the effect modifier in the
relationship between residence and prostate cancer ...................................................................46
Table 4.8 Stratified analysis of the history of smoking pack years as the effect modifier in the
relationship between residence and prostate cancer....................................................................46

vii
Table 4.9 Multivariate analysis of age and family history of cancer ...............................…….48
Table 4.10 Stratified analysis of the family history of cancer as the effect modifier in the
relationship between residence and prostate cancer...................................................................50
Table 4.11 Multivariate analysis of the potential risk factors of prostate cancer….................52
Table 4.12 Stratified analysis of the personal smoking history as the effect modifier in the
relationship between residence and prostate cancer in the final model 1..................................57
Table 4.13 Stratified analysis of the family history of cancer as the effect modifier in the
relationship between residence and prostate cancer in the final model 1...................................58
Table 4.14 Stratified analysis of the history of smoking pack years as the effect modifier in the
relationship between residence and prostate cancer in the final model 2..................................59
Table 4.15 Stratified analysis of the history of smoking pack years as the effect modifier in the
relationship between residence and prostate cancer in the final model 3..................................60
Table 4.16 Stratified analysis of the personal smoking history as the effect modifier in the
relationship between residence and prostate cancer in the final model 4..................................60

viii
LIST OF FIGURES
Figure 2.1 Trends in age standardized incidence rates from prostate cancer per 100,000 in
selected countries. (SOURCE: GLOBOCAN 2008 Cancer Fact Sheet, Accessed 05/10, 2012)
……………................................................................................................................................…..5
Figure 2.2 Trends in age standardized mortality rates from prostate cancer per 100,000 in
selected countries. (SOURCE: GLOBOCAN 2008 Cancer Fact Sheet, Accessed 05/10, 2012)
………............................................................................................................................…….....….6
Figure 2.3 Age standardized incidence rates for prostate cancer in Canada, 1983 to 2012.
(SOURCE: Canadian Cancer Society, Accessed 05/16, 2013) …......……………….......…........7
Figure 2.4 Age standardized mortality rates for prostate cancer in Canada, 1983 to 2012.
(SOURCE: Canadian Cancer Society, Accessed 05/16, 2013) ......………………….....…...........8
Figure 2.5 Estimated percent of new cases of prostate cancer by age group, 2012. (Created using
data from Canadian Cancer Society, Accessed 05/16, 2013) ..........................…….…...........…...9
Figure 2.6 Estimated percent of mortality of prostate cancer by age group, 2012. (Created using
data from Canadian Cancer Society, Accessed 05/16, 2013)........................................................10
Figure 2.7 Incidence rates of prostate cancer per 100,000 cases by geographic, 2012. (Created
using data from Canadian Cancer Society, Accessed 05/16, 2013)..............................................11
Figure 2.8 Mortality rates of prostate cancer per 100,000 cases by geographic, 2012. (Created
using data from Canadian Cancer Society, Accessed 05/16, 2013)..............................................11
Figure 2.9 Prostate cancer incidence by age group, Canada, 2004. (SOURCE: Canadian Urology
Association Journal, Accessed 2012)..........................................................................….....….....13

ix
Figure 3.1 Theoretical framework for study.................................................................................19

x
LIST OF ABBREVIATIONS
SRHS- Saskatchewan Rural Health Study
PSA- Prostate Specific Antigen
DRE- Digital Rectum Exam
HL- Hosmer and Lemeshow
DNA- Deoxyribonucleic Acid
UV- Ultraviolet
US- United States
NPHS- National Population Health Survey
ASR- Age Standardized Rates
OR- Odds Ratio
CI- Confidence Interval
d.f.- degree of freedom
R- Relative Risk
χ2- Chi-Square
α – Level of Significance
- Sample Estimate

CHAPTER 1: INTRODUCTION AND RATIONALE
1.1 Introduction
Prostate cancer starts in the cells of the prostate gland which is a part of the male
reproductive system and can also spread to nearby organs. Prostate cancer usually grows slowly
and can be detected early using a Prostate Specific Antigen (PSA) test and a Digital Rectal Exam
(DRE) (1). Due to widespread use of PSA testing the incidence rates of prostate cancer has
increased since 1980 (2). Cancer is a leading cause of death worldwide, accounting for 7.6
million deaths (around 13% of all deaths) in 2008 (3). Out of all cancer types, the second most
frequently diagnosed cancer among men is prostate cancer (899,000 new cases, 13.6% of the
total) and overall it is the fifth most common cancer (4). As cited by Ellison and Wilkins, in
Canada, the newly diagnosed cancer cases continue to rise (5). Prostate cancer is the most
commonly diagnosed cancer in Canadian males, and is the third most common cause of cancer
related deaths with decreasing mortality in men (2). In Saskatchewan men, it was the most
frequently diagnosed type of cancer in 2012 (6). According to the Canadian Cancer Society, an
estimated 26,500 cases of prostate cancer were diagnosed and 4,000 deaths from prostate cancer
were reported in the year 2012 in Canada. On average, it was estimated that every day, 73
Canadian men were diagnosed with prostate cancer and 11 died of it (2).
In 2000, Grover et al projected that (i) in the 1997 cohort of 5.8 million Canadian men
between 40 and 80 years old (non-cases), prostate cancer would be diagnosed in 12.1% of
Canadian men over their life-time and would be fatal in 3% to 4% cases and (ii) lifetime costs of
care will total $9.76 billion (7). They also estimated a total cost of $286 million to be annually
associated with treating prostate cancer in this cohort in 2022. The burden of the prostate cancer
is also substantial in the province of Saskatchewan. Of all the estimated new cases of various
types of cancers diagnosed in Saskatchewan, prostate cancer has the highest proportion of
estimated new cases (8).
Despite its high morbidity, the etiology of prostate cancer remains obscure. So far, the
risk factors associated with the development of prostate cancer are advancing age, race and a
positive family history of prostate cancer (9-11). Some of the suspected putative risk factors
include diet (12-14), farming occupation (9, 15-18) occupational exposures to pesticides (19-23)
1

wood dust (24-25) grain dust (24-25) and asbestos dust (24-25), personal smoking history (26-
32) and hormones (33-35).
Farming is considered to be the major occupation of rural populations. In an
epidemiologic review conducted by Parent and Siemiatycki, authors suggested that occupation
and its related exposures are important to consider when investigating the potential risk for
cancer (15). So far, some of the literature has indicated an association between farming and its
exposure to pesticides at workplace and prostate cancer (17, 19-23). In an Australian study, a
statistically significant increased risk in prostate cancer mortality was observed among men
living in rural areas compared with urban areas (36). The pathogenesis of prostate cancer reflects
complex interactions between environmental and genetic factors (9). Given the inconsistent
evidence of risk factors (9), more research is needed to identify the potential risk factors of
prostate cancer.
We propose to address the aforementioned gaps by building on and improving knowledge
on prevalence and risk factors of prostate cancer among rural Saskatchewan men. We will
investigate farming, as it is the major occupation of rural populations and will help us identify if
farming occupation and farming related occupational exposures such as pesticides are associated
with prostate cancer. We will accomplish this by using data from the Saskatchewan Rural Health
Study (SRHS) which surveyed rural dwellers from across Saskatchewan in the year 2010-2011.
1.2 Rationale
In the year 2012, in the Saskatchewan male population, prostate cancer was the most
commonly diagnosed cancer and was the second most frequent cause of cancer related mortality
(6). The proportion of rural population of Saskatchewan is 35% (37) which is greater than the
proportion of rural population of Canada (20%) (38). There is a paucity of literature on
epidemiology and patterns of prostate cancer among rural dwelling men of Saskatchewan. It is
important to consider rural exposures as potential risk factors of prostate cancer because of the
large proportion of rural dwellers in Saskatchewan. Saskatchewan has a high proportion of rural
dwellers whose major occupation is farming. Therefore, by implication it could have a potential
link between prostate cancer and exposure to pesticides among rural Saskatchewan men.
Investigating farming occupation and its work related exposures to insecticides, herbicides and
fungicides can provide a key in understanding its association with prostate cancer in this
Saskatchewan rural cohort. The literature calls for more research to investigate the prevalence,
2

incidence and risk factors of this important type of cancer. Also, identifying the risk factors for
prostate cancer will help direct investigation into the underlying etiology of prostate cancer and
help focus future prevention efforts.
1.3 Objectives
Overall Objective: To determine the prevalence and risk factors of prostate cancer among rural
dwelling men older than 45 years living in Saskatchewan.
In order to accomplish the overall objective, I will undertake the following specific research
questions.
Research Question 1:
“What is the prevalence of prostate cancer in rural farm and non-farm dwelling men older than
45 years of Saskatchewan in 2010-2011?”
Research Question 2:
2 (a) “Is there an association between rural exposures (occupational i.e. farming and
environmental), household musty smell and pesticide application and prostate cancer in rural
dwelling men of Saskatchewan?”
2 (b) “Is there an association between personal smoking history, exposure to household smoke
and prostate cancer in rural dwelling men of Saskatchewan?”
2 (c) “Is there an association between age, family history of cancer and prostate cancer in rural
dwelling men of Saskatchewan?”
Research Question 3:
“Is family history of cancer an effect modifier in the relationship between rural exposures
(occupational i.e. farming and environmental) and prostate cancer in rural dwelling men of
Saskatchewan?”
3

CHAPTER 2: LITERATURE REVIEW
2.1 Identification of Literature
The purpose of the current study was to determine the prevalence and risk factors
associated with prostate cancer among rural Saskatchewan men. The following literature review
includes a description of the epidemiology of prostate cancer, mortality and incidence rates
worldwide as well as specific to Canada and Saskatchewan; and its well established and
suspected risk factors. The whole search was conducted using Medline database and Google
scholar. The search included articles from 1991 to 2013 and was completed in the month of July,
2013. Additional literature searches were completed periodically in order to update the article
lists. Search terms or keywords included but were not limited to “prostate cancer”, “risk factors”,
“epidemiology”, “rural”, “pesticides”, “fungicides”, “herbicides”, “insecticides”, “family
history”, “smoking” and “farming”. Combinations of these terms were used to explore the
literature. This literature review was limited to publications in the English language and in
relation to human studies only.
2.2 Incidence and Mortality
2.2.1 International
The international patterns in prostate cancer incidence and mortality rates vary hugely.
According to the GLOBOCAN cancer fact sheet (4), worldwide in the year 2008, it was the
second most common cancer diagnosed among men (899,000 new cases, 13.6% of the total).
Almost 75% (i.e. 644,000) of the registered cases of prostate cancer arise in developed countries
(4). A review conducted by Baade et al (39) confirmed that prostate cancer was prevalent in
more developed nations such as the United States of America (USA) and the Scandinavian
countries. The incidence rates in the USA (approximately 105 per 100,000) were more than
twice those in Australia (approximately 52 per 100,000) and in Europe (Sweden: approximately
55 per 100,000; United Kingdom: approximately 35 per 100,000) (40). In some of the
developing regions for example Caribbean (approximately 70 per 100,000), South America
(approximately 50 per 100,000), Western Africa (approximately 22 per 100,000) and middle
Africa (approximately 18 per 100,000) fairly high incidence rates were reported (4). In South-
Central Asia (4.1 per 100,000), the estimated age-standardized incidence rate was lowest in the
world (4). In 2002, globally the age specific estimated incident rates were 0.2 per 100,000 (15-44
4

years), 10.6 per 100,000 (45-54 years), 72.9 per 100,000 (55-64 years) and 259.6 (65 years and
older) (39). These rates were generally five to nine times greater for men in more developed
countries than for men in less developed countries (39).
Figure 2.1 (4) gives a pictorial view of the trends in the incidence rates for countries with
high and low risk populations. It is apparent that USA had the highest rates followed by
Australia and Canada; and rates were lowest in India.
Fig.2.1 Trends in age standardized incidence rates from prostate cancer per 100,000 in selected
countries
SOURCE: GLOBOCAN 2008 Cancer Fact Sheet, Accessed 05/10, 2012 (4)
In the year 2008, worldwide, prostate cancer was the sixth most common cause of death
(258,000 deaths, 6.1% of the total) (4). The mortality rates did not differ much worldwide and
constitutes almost the same number of deaths in both developed and developing nations (4). The
mortality rates were highest in Sweden (approximately 25 per 100,000) followed by Zimbabwe,
Netherlands and USA (40). In general in the year 2008, mortality rates were high in largely
African-American populations (Caribbean 26.3 per 100,000 and sub-Saharan Africa age-
standardized rates (ASR) 18-19 per 100,000), very low in Asian populations (e.g. ASR 2.5 per
100,000 in Eastern Asia) and intermediate in Europe and Oceania (4). In 2002, worldwide the
5

age specific estimated mortality rates were 0.1 per 100,000 (15-44 years), 1.9 per 100,000 (45-54
years), 11.8 per 100,000 (55-64 years) and 100.4 per 100,000 (65 years and older) (39). As cited
by Baade et al, worldwide in the year 2002, the age specific mortality rates for men (i) aged 45-
54 years in more developed countries were approximately similar to less developed countries
(2.0 per 100,00 versus 1.9 per 100,000); (ii) aged 55-64 years in more developed countries were
almost twice compared to less developed countries (16.9 per 100,000 versus 9.6 per 100,000);
and (iii) aged 65 years and over were almost thrice in more developed countries than less
developed countries (169.9 per 100,000 versus 59.5 per 100,000) (39).
Figure 2.2 (4) gives a pictorial view of the trends in the mortality rates for some countries
with high and low risk populations. It can be observed that Australia had the highest rates
followed by Canada and USA; and mortality rates were lowest in Republic of Korea.
Fig.2.2 Trends in age standardized mortality rates from prostate cancer per 100,000 in selected
countries
SOURCE: GLOBOCAN 2008 Cancer Fact Sheet, Accessed 05/10, 2012 (4)
6

2.2.2 Canada
In 2012, prostate cancer was the most frequently diagnosed cancer in men and was the
third most common cause of cancer related deaths after lung and colorectal cancer (2). In
Canada, for the year 2012, the estimated number of new cases in men was 26,500 and the
estimated number of deaths due to prostate cancer were 4,000 (2). In 2012, the estimated age-
standardized rates for incidence and mortality in Canada were 121 per 100,000 and 19 per
100,000 men, respectively (2). In 2000, Quon et al (41) estimated that in future incidence rates
will increase from 25,355 new cases in 2009 to 35,121 new cases by 2021. Figure 2.3 and figure
2.4 show the trend in incidence and mortality rates from 1983 to 2012 respectively (8).
Fig. 2.3 Age-standardized incidence rates for prostate cancer in Canada, 1983 to 2012.
SOURCE: Canadian Cancer Society, Accessed 05/16, 2013 (8)
7
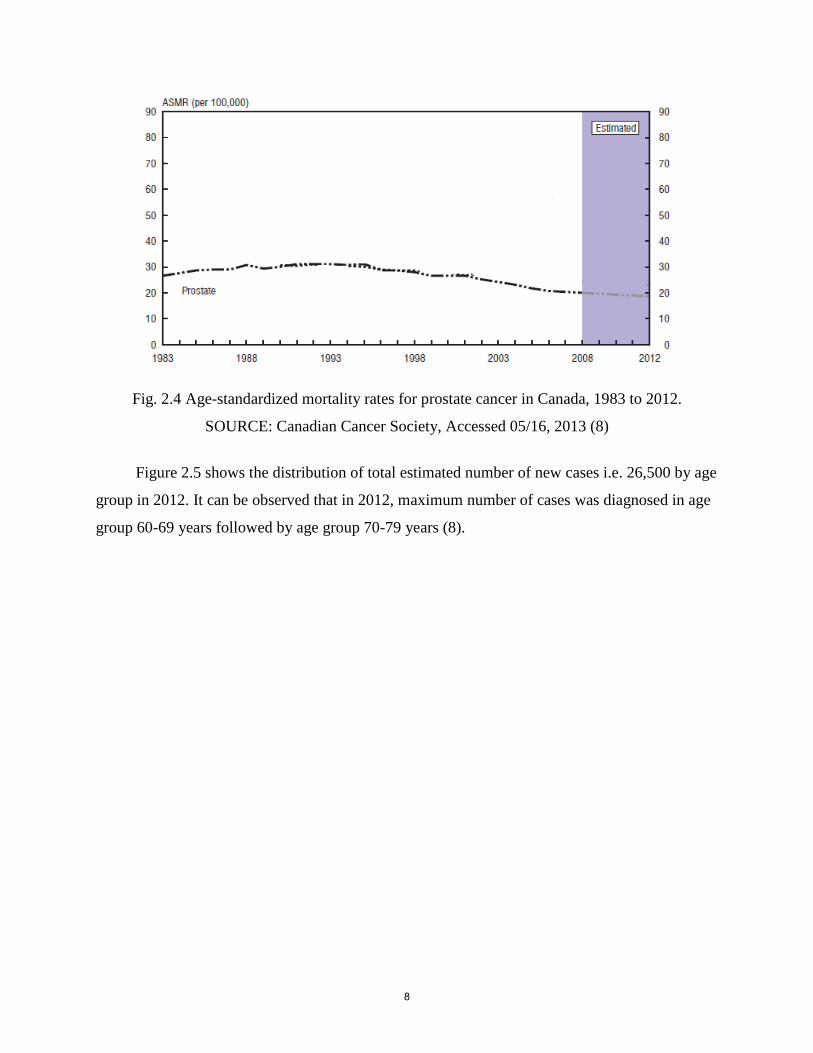
Fig. 2.4 Age-standardized mortality rates for prostate cancer in Canada, 1983 to 2012.
SOURCE: Canadian Cancer Society, Accessed 05/16, 2013 (8)
Figure 2.5 shows the distribution of total estimated number of new cases i.e. 26,500 by age
group in 2012. It can be observed that in 2012, maximum number of cases was diagnosed in age
group 60-69 years followed by age group 70-79 years (8).
8

Estimated percentage of new cases of prostate
cancer by age group, 2012
05
10
15202530
354045
30-39 40-49 50-59 60-69 70-79 80+
Pe
rce
nta
ge
ne
w c
as
es
Fig. 2.5 Estimated percent of new cases of prostate cancer by age group, 2012
Created using data from Canadian Cancer Society, Accessed 05/16, 2013 (8)
Figure 2.6 shows the distribution of total estimated number of mortality i.e. 4,000 by age
group in 2012. It was found that in 2012, maximum number of deaths were diagnosed in age
group 80+ followed by age group 70-79 (8).
9

Estimated percentage of mortality of prostate
cancer by age group, 2012
0
10
20
30
40
50
60
40-49 50-59 60-69 70-79 80+
Perc
en
tag
e m
ort
ali
ty
Fig. 2.6 Estimated percent of mortality of prostate cancer by age group, 2012
Created using data from Canadian Cancer Society, Accessed 05/16, 2013 (8)
2.2.3 Saskatchewan
In 2012, prostate cancer was the most frequently diagnosed cancer in Saskatchewan
population and was the second most common cause of cancer related deaths after lung cancer
(6). According to the Canadian Cancer Society (6), Saskatchewan data suggested that, in the year
2012, an estimated 880 cases were diagnosed with prostate cancer and 210 men were reported to
have died of it (6). In 2012, the estimated age-standardized rates for incidence and mortality in
Saskatchewan were 136 per 100,000 and 29 per 100,000 men, respectively (8). Figure 2.7 and
figure 2.8 show the incidence and mortality rates in the provinces of Canada where
Saskatchewan has the third highest incidence rates and the highest mortality rates among other
provinces (8).
10

Incidence of Prostate Cancer by Geographic Region in 2012
020406080
100120140160180
New
Bru
nsw
ick
Prin
ce E
dwar
dIs
land
Sas
katc
hew
an
Nov
a S
cotia
Ont
ario
New
foun
dlan
dan
d La
brad
or
Alb
erta
Brit
ish
Col
umbi
a
Man
itoba
Que
bec
Ag
e-s
tan
dard
ized
in
cid
en
ce r
ate
s p
er
100,0
00
cases
Fig. 2.7 Incidence rates of prostate cancer per 100,000 cases by geographic region, 2012
Created using data from Canadian Cancer Society, Accessed 05/16, 2013 (8)
Mortality Rates of Prostate Cancer by Geographic Region in 2012
05
101520253035
Sas
katc
hew
an
Prin
ce E
dwar
dIs
land
Man
itoba
New
foun
dlan
dan
d La
brad
or
Alb
erta
Nov
a S
cotia
New
Bru
nsw
ick
Ont
ario
Brit
ish
Col
umbi
a
Que
bec
Ag
e-s
tan
da
rdiz
ed
mo
rta
lity
ra
tes
pe
r
10
0,0
00
ca
se
s
Fig. 2.8 Mortality rates of prostate cancer per 100,000 cases by geographic region, 2012
Created using data from Canadian Cancer Society, Accessed 05/16, 2013 (8)
11

2.3 Risk Factors and Etiology
Prostate cancer appears to be a multi-factorial disease and its etiology remains unclear in
the literature. To date, only three potential risk factors have been well established including age
generally over 65 years, race particularly African-Americans, and family history of prostate
cancer (9, 10, and 42). According to the Canadian Cancer Society, not every adult male having
these risk factors necessarily develops prostate cancer but having these risk factors means it
increases the chance of developing it. (42). It can be said that all three established risk factors are
non-modifiable risk factors. Given that there are very few well established risk factors of prostate
cancer, environmental/farming related exposures requires further investigation (43). The
literature calls for more research on the relationship between farming and cancer to identify
environmental carcinogens and specific high-risk groups. The literature also suggested that both
the environmental and genetic factors may play a role in the development of prostate cancer (9).
2.3.1 Age
Age is known to be a significant risk factor for prostate cancer. As cited by Quinn and
Babb, globally three-quarters of cases occurred in men aged ≥ 65 years (40). Very few people
aged younger than 50 years are diagnosed with prostate cancer (10, 39 and 44). The mean age of
prostate cancer cases is 72-74 years and nearly 85% of cases are diagnosed after 65 years of age
(10). The incidence rates of prostate cancer increases with advancing age (9). In countries like
USA, Australia, Sweden, United Kingdom, Italy, Japan, Hong Kong and China, incidence rates
rose exponentially with advancing age (44). As cited by Fradet et al, in the year 2008 the rate of
prostate cancer diagnoses in Canada was approximately 100 per 100,000 in men aged 50 to 54,
500 per 100,000 men aged 60 to 64 and greater than 700 per 100,00 in men over the age of 80
(45). As seen in figure 2.9, in Canada in the year 2004, it is visible that incidence rates began to
rise in 45-49 age group and sharply continued to increase until 65-69 age group after which the
rates were more or less similar in the following age groups.
12

Fig. 2.9 Prostate cancer incidence by age group, Canada, 2004
SOURCE: Canadian Urology Association Journal, Accessed 2012 (45)
Based on evidence from the scientific literature, prostate cancer is very rare among men
aged < 50 years. However, an American study with large sample size identified some cases of
prostate cancer in these men (46). It consisted of men aged 35-74 years diagnosed with prostate
cancer between 1988 and 2003 and identified 1,673 cases (that included grade- low, intermediate
and high; Stage I or II, III and IV) of prostate cancer in the youngest age group of 35-44 years.
Even though the number was small as compared to the total number (181,099) of men in the age
group 65-74 years, it suggested that the investigators must consider this youngest age group
seriously in the future studies.
2.3.2 Race
The risk of developing prostate cancer is dramatically higher among African-American
men compared to men of any other race (10). This population has the highest incidence rates in
the world, nearly 60 times greater than the men in Shanghai, China where rates are lowest (44).
For the period 2005-2009, race-specific incidence rates in the United States ranged from
236.0 per 100, 000 for African-American, 146.9 per 100,000 for Caucasians, 125.9 per 100,000
for Hispanics, 85.4 per 100,000 for Asian/Pacific Islanders, and 78.4 per 100,000 for
American/Alaskan natives (47).
13

African Americans have approximately twice the mortality than that of Caucasians. It is
yet uncertain whether these differences in mortality can be explained by differences in stage at
diagnosis, socio-economic status or biology of prostate cancer among men from different races.
Perhaps genetic and environmental factors or gene-environment interaction could explain these
biological explanations (48).
Consumption of dietary fat is also under scrutiny as it is higher among African
Americans (49). As cited by Bostwick et al, the rates of prostate cancer shift toward those of the
host country. For instance, Japanese men who consume a low fat diet have low incidence rates
of prostate cancer in their country. However, the incidence and mortality risk increases when
they move to United States (49).
2.3.3 Family History of Prostate Cancer
One of the most consistent and strongest risk factors that have been associated with an
increased risk of prostate cancer is family history of prostate cancer. The risk of early onset of
prostate cancer is considered to be strongly affected by the number of relatives with prostate
cancer and their age at diagnosis (50). Numerous studies have reported familial congregation,
showing men who have first-degree male relatives (father, brother, son) with a positive history of
prostate cancer have 2 to 3 fold elevated risk (9). Epidemiological studies provide an indication
that inherited susceptibility genes cause 5% to 10% of all prostate cancer cases, and 30% to 40%
of early onset disease (50). In a population based case-control study of prostate cancer, cases
and controls were interviewed as to their family history of prostate cancer. The study provided
further evidence of familial congregation and suggested the possibility that part or all of such
clustering could be related to inherited genetic patterns (51).
As cited by Fradet et al, according to the United States National Institutes of Health in
2008, men whose fathers had prostate cancer before age 60 years have a 20% chance of
developing prostate cancer as compared with 8% of men without this history (45). A slightly
greater risk was observed for men whose brothers had prostate cancer than for those whose
fathers had prostate cancer. A population based case-control study was conducted among
Caucasians, African-Americans and Asian-Americans in United States of America and Canada.
The results of this study suggested that in each of the ethnic groups, positive family history was
associated with 2 to 3 fold statistically significant increased risk (52). A study consisted of
14

44,788 twin pairs who were listed in Swedish, Danish and Finnish twin registries found that
these inherited factors made a small contribution to susceptibility to prostate cancer. It also
indicated that environment played the crucial role in causing sporadic cancer (45).
2.3.4 Cigarette Smoking
Smoking is considered to be a risk factor for several cancers. However, the association
between smoking and prostate cancer remains a debatable matter (26-27). As reviewed by
Huncharek et al (27), in a meta-analysis of 24 prospective cohort studies, the authors concluded
that with more than 26,000 prostate cancer cases, a modest 9% to 30% increase in both incident
and mortality specific prostate cancer was associated with smoking. On the contrary, no
association was observed between current or former smoking status and prostate cancer
incidence (28-29).
Data from large epidemiological studies observed that cigarette smoking is related to
prostate cancer mortality (26-27, 29). Moreover, some evidence showed a dose-response
relationship between cigarette smoking and prostate cancer mortality (30). Smokers who smoked
more than 40 cigarettes per day had 51% increased prostate cancer mortality risk (30). In another
prospective cohort study, compared with non-smokers, current smokers had 61% increased risk
of dying from prostate cancer (31).
Another study that examined whether cigarette smoking affected the risk of prostate cancer
was a prospective US cohort study (26). The study population consisted of men aged 50 to 71
years. Prostate cancer cases were classified into one of the three groups namely non-advanced,
advanced and fatal. The results of the study suggested that current smoking and former smoking
had decreased risk of non-advanced prostate cancer. In other words, current and former smokers
may be at decreased risk of being diagnosed with prostate cancer. However, when compared
with non-smokers, current smokers seemed to be associated with an increased risk (Hazard
Ratio: 1.69, 95% CI: 1.25-2.27) of fatal prostate cancer.
Another case-control study investigated the relationship between smoking at the time of
diagnosis and risk of prostate cancer death (32). A population based cohort of prostate cancer
cases aged 40-64 years were included in the study. After adjusting for age, race, education etc,
the study found that compared to the cases who never smoked, cases who smoked at the time of
diagnosis had a 2.66 relative hazard of prostate cancer-specific mortality.
15

2.3.5 Farming Occupation and Pesticide Exposure
One of the probable factors that are under scrutiny in literature includes occupation and
occupational exposures. In the past, some studies have found associations between occupation
and prostate cancer incidence and mortality (17 and 53). Of these, farming has received greater
attention (15 and 18). In 1999, the occupational cancer patterns among males in British
Columbia who died of prostate cancer between 1950 and 1984 were investigated. This included a
review of 216 occupations and 88 industries. One of the findings of this study suggested that
farmers were at higher risk of developing prostate cancer (52). However, a review article
suggested that it cannot be affirmed with certainty that farmers have an increased risk of
developing prostate cancer (15). An elevated risk of prostate cancer among farmers has been
investigated in some studies, however no specific associations with agricultural chemicals
(pesticides) have been found. The results of one study stated that, as compared to unexposed
farmers, farmers who were exposed to pesticides had a two-fold excess risk (19).
Some of the studies that found a positive association between prostate cancer and farming
related exposures such as pesticides are discussed in this paragraph. An Italian study evaluated
the relationship among rural farmers and found that farmers who were exposed to organochlorine
insecticides and acaricides were at a high risk of developing prostate cancer (20). Therefore, it is
possible that such pesticides could contribute to the increased risk and should be further
investigated in a different population (20). A recent population based case-control study (21) in
California investigated the association between environmental pesticide/fungicide exposure and
prostate cancer. California is considered the most productive agricultural state in the United
States of America and each year the use of agricultural pesticides in California exceeds 250
million pounds of active ingredients. The study provided the evidence that in and around homes
in huge agricultural settings, an association between prostate cancer and ambient pesticide
exposure to methyl bromide and organochlorines was observed. The researchers also suggested
that the associations seem precise to compounds (methyl bromide, capton and organochlorines)
with a possible biologic role in prostate carcinogenesis (21). The considerable association
between prostate cancer and farming related exposure (such as DDT, simazine and lindane) was
observed among farmers in British Columbia (22).
16

A review conducted by Mink et al suggested that, of eight cohorts and five case-control
studies none of them were able to illustrate an increase in risk to support a causal relationship
between agricultural pesticide exposure and prostate cancer (23).
In conclusion, based on the scientific literature, farming and its occupational exposures
such as insecticides, herbicides and fungicides might be related to prostate cancer. Therefore in
this study, this important link was examined in rural Saskatchewan population whose major
occupation is farming.
17

CHAPTER 3: METHODS
3.1 Study Design
The Saskatchewan Rural Health Study is a large prospective cohort study of rural dwelling
persons (54). To date, baseline data has been collected using a cross-sectional design. This
baseline data was the basis of my thesis. All men older than 45 years in this rural cohort were
separated into two groups’ namely men who self-reported an earlier diagnosis of prostate cancer
and men without prostate cancer. The group of interest were men with prostate cancer only and
not with any other type of cancer. The comparison group was the remaining men from the same
rural cohort who did not have any type of cancer.
3.2 Study Population, Selection and Recruitment
Rural municipality and small town councils were first approached to describe the study
and request permission to use their population records as a sampling frame. This selected
population was from rural households in the participating rural municipality and small towns. It
included households that were on rural municipality tax lists. Councils of 32 (82%) of 39 rural
municipalities and 15 (94%) of 16 small towns agreed to participate in the study. Using the lists
provided, the SRHS conducted a baseline mail-out survey in 2010 of 11,982 households located
in four geographic regions (Northeast, Northwest, Southeast and Southwest) of Saskatchewan.
Dillman's method for mail surveys (53) was used to increase the response rate of the
participation. In total, surveys were returned from 4,264 households (42%). This included
information on 8,261 adults living in these households. Of these, males greater than 45 years of
age (n=2,938) were included as this is the population considered to be at risk. Out of these, 114
had prostate cancer and remaining 2,824 were disease free.
3.3 Data Collection
The SRHS research team, one community member from a rural municipality, and one
from small town collectively developed the survey questionnaire. The SRHS team also
conducted a pilot study (54) to optimize the administration and content of the baseline
questionnaire. These self-administered mailed questionnaires collected information on individual
factors (demographic factors, family and occupational history etc), contextual factors (household
characteristics etc) and other important covariates (age, marital status etc).
18

3.4 Theoretical Framework
In order to achieve the objective and to answer the research questions, the Population
Health Framework of Health Canada was used. According to this framework, it is suggested that
individual and contextual determinants interact to produce varying levels of risk for health
outcomes (55). The conceptual framework used to understand the influence of some of the
determinants stated above on the health outcome in question is shown in Figure 3.1.
Fig. 3.1 Theoretical Framework for Study
Variables to be examined in this study included outcome (prostate cancer), individual
(family history of cancer, cigarette smoking, and occupational history) and contextual factors,
and covariates.
Individual factors in the context of this study were a) family history of cancer b) personal
cigarette smoking c) occupational history related to farming and d) environmental factors such as
housing.
Contextual factors were exclusive to the rural environment and were examined using
socioeconomic status and outdoor environment conditions obtained from the baseline
questionnaire.
Individual Factors
*Family History of
cancer
*Cigarette Smoking
*Occupational History
(including farming and
farm-related exposures)
*Environmental
exposures (housing)
*Geographic factors
Covariates
*Demographic
*Co-morbidity
Outcome of Interest
*Prostate Cancer
Contextual Factors
*Socioeconomic
*Outdoor Environment
This framework is a diagram courtesy of Dr. Will Pickett of Queen’s University.
19

Covariates (potential confounders) included variables such as age, marital status, water
source and history of cardiovascular disease such as diabetes, heart disease, stroke etc.
Outcome for prostate cancer was determined from the baseline questionnaire.
3.5 Operational definitions:
The variables that were used for the statistical analysis were determined directly from the survey
questionnaire.
Family history of cancer refers to the members of the person’s biological family (father,
mother and siblings) who ever had any type of cancer based on the question B-56 (See
Appendix A).
Personal cigarette smoking status has two categories namely ever smokers and never
smokers. This is a derived variable based on the questions B-36 and B-37 (See Appendix
A).
Smoking pack years includes four categories namely no exposure, < 15 years of
exposure, ≥ 15 and < 25 years of exposure and ≥ 25 years of exposure. It is defined as
the total number of years a person has smoked multiplied by the average cigarettes
smoked per day. This study considers 20 cigarettes per pack for the analysis. Pack years
is a derived variable based on question B-38, B-40 to B-42 (See Appendix A).
Occupational history refers to the list of all full-time jobs at which a person has worked
for at least one year that includes job title, business/industry/service and total number of
years at job. Many participants had more than one job over their lifetime. Study
participants whose one of the listed occupations on survey was either farmers or farm
managers; or farm supervisors and specialized livestock workers; or general farm
workers were categorized as ever having a farming job. Those who did not have any of
these listed occupations were considered as having no farming occupation. Each job title
was categorized into one of the industry and occupation unique to the primary industry
using the North American Industry Classification System (NAICS) - Canada (60) and the
National Occupational Classification for Statistics (NOC-S) 2006 (61). This variable was
based on the question B-57 (See Appendix A).
Occupational rural exposures include exposure to grain dust, wood dust, livestock,
herbicides, fungicides and insecticides etc. If the exposure is considered present,
20

participants are asked “How often (daily, weekly, monthly and occasionally) they are
exposed to these exposures and for how many years?” This variable is based on question
B-58 (See Appendix A).
Duration of farming includes four categories namely no exposure, < 30 years of
exposure, ≥ 30 and < 50 years of exposure and ≥ 50 years of exposure. It was a derived
variable and was calculated to obtain the total number of years in the farming occupation.
For example, if a person had more than one farming occupation during his life, a total of
farming years corresponding to the farming occupations was calculated. Then the
calculated total farming years of each participant was compared with their corresponding
age. According to the labor standards, age 16 was established as the general minimum
age of employment in Saskatchewan (62). However, it was observed that for 316 men,
the difference between age and total farming years was < 16 meaning they would have
started employment under 16 years. Therefore to resolve this problem, data
corresponding to the age and total farming years was cleaned to get the appropriate
number of farming years for a participant. To do this, two new variables namely
difference (calculated difference between a participant’s age and his total farming years)
and new total farming years were created. If the value of the variable difference was < 0
years, then the new total farming years = age-16 years; if the difference was ≥ 0 or < 16
years then the new total farming years = total farming years – (16-difference); and if the
difference was > 16 years then there was no change in the total number of farming years
i.e. = total farming years. This variable was based on question B-57 (See Appendix A).
History of cardiovascular diseases includes heart disease, heart attack, hardening of the
arteries and high blood pressure. It is based on questions B50 (See Appendix A).
Geographic factors include variables such as residence and quadrant. Residence has
three categories namely farm, in town and acreage and quadrant has four categories
(North-West, North-East, South-West, and South-East). The information on quadrant was
based on 2006 census subdivisions showing quadrant. Farm refers to farm residential and
work locations that are involved in the production of agricultural products intended for
sale. For the analyses, the two categories i.e. in town and acreage are combined into one
category i.e. non-farm based on question A-1 (See Appendix A).
21

Household smell has two categories namely yes and no based on question A-14 (See
Appendix A).
Household pesticide application includes two categories namely yes and no based on
question A-16 (See Appendix A).
Household tobacco smoke included three variables namely exposure to cigarettes, cigars
and pipes having two categories each i.e. yes and no based on question A-17 (See
Appendix A).
Highest level of education has 4 categories namely, less than high school, completed
high school, completed university and completed post-secondary education other than
above. This is dichotomized into a variable EDUGRP having two categories namely, ≤
Grade 12 and >Grade 12 based on question B-4 (See Appendix A).
Household income adequacy is categorized in four groups based on household income
levels and number of people in home according to STAT CANADA_NPHS (National
Population Health Survey) definition (58). It is further categorized into low income,
middle income, and high income based on question A-2 and A-20 (See Appendix A).
Marital status has two categories namely married/common law/living together and
widowed/divorced/separated/single, never married based on question B-8 (See Appendix
A).
Age is a continuous variable. It is dichotomized into a new variable having categories
namely ≤ 65 years and > 65 years based on question B-1 (See Appendix A).
Water source has 4 categories namely bottled water, deep well water (more than 100 ft),
shallow well water (less than 100 ft) and other source based on question A-37 (See
Appendix A).
Prostate cancer as an outcome variable “Has a doctor or primary care giver ever said
you have cancer? If yes, specify type of cancer” is determined from survey questionnaire.
It is defined as “self-report of an earlier diagnosis of prostate cancer” based on question
B-50 (See Appendix A).
22

3.6 Sample Size
We obtained a sample size of 2,938 men who were older than 45 years. Of these, there
were 114 men with prostate cancer and 2,824 men without prostate cancer. In order to evaluate
the post-hoc power of the study, following formula (56) for an unequal case control ratio was
used.
Zβ = [ n ( p1 - p0 )2 / ( 1 + 1/c ) p’ q’ ]
1/2 - Zα ………………………… (3.1)
Where,
n = number of cases
c = number of controls per case i.e. 2800/113 = 25
p0 = the relative frequency of exposure among controls in the target population i.e.
1277/2800 = 0.46
R = a hypothesized relative risk associated with exposure that would have sufficient biologic or
public health importance to warrant its detection. Say R= 1.5 and R=2
α = the desired level of significance i.e. α= 0.05. Therefore Z α = 1.96
Power = P( Z ≤ Zβ) , Power is determined using standard normal distribution tables.
Table 3.1: Residence i.e. farm and non-farm among men with prostate cancer and men
without prostate cancer
Prostate
cancer
Present
Prostate
cancer Absent
Total
Farm 52 1277 1329
Non-Farm 61 1523 1584
Total 113 2800 2913
Calculating power using values from above table:
Power calculation at R= 1.5
C= 25, p0 = 0.46
p1 = p0R / [1 + p0 (R-1)] = 0.56
p’= ( p1 + cp0 ) / (1+c) = 0.46
q’= 1 – p’= 0.54
23

After substituting all the above values in formula (i), we get
Zβ = 0.12
Power = P (Z ≤ Zβ) = 55%
The study will have an estimated 55% chance of detecting 1.5 times increase in the risk of
prostate cancer.
Power calculation at R= 2
C= 25, p0 = 0.46
p1 = p0R / [1 + p0 (R-1)] = 0.63
p’= ( p1 + cp0 ) / (1+c) = 0.47
q’= 1 – p’ = 0.53
After substituting all the above values in formula (i), we get
Zβ = 1.60
Power = P (Z ≤ Zβ) = 95%
The study will have an estimated 95% chance of detecting 2 times increase in the risk of prostate
cancer.
Power calculation at R= 1.72
C= 25, p0 = 0.46
p1 = p0R / [1 + p0 (R-1)] = 0.594
p’= ( p1 + cp0 ) / (1+c) = 0.465
q’= 1 – p’ = 0.535
After substituting all the above values in formula (i), we get
Zβ = 0.84
Power = P (Z ≤ Zβ) = 80%
The study will have an estimated 80% chance of detecting 1.72 times increase in the risk of
prostate cancer.
24
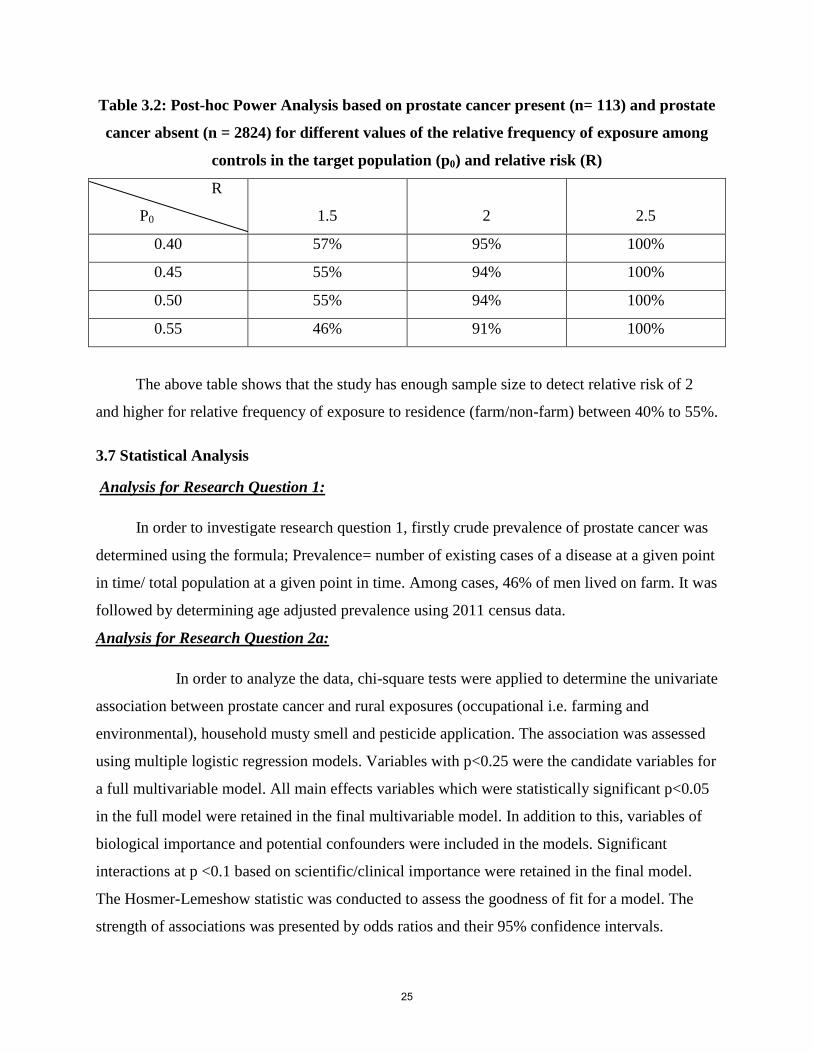
Table 3.2: Post-hoc Power Analysis based on prostate cancer present (n= 113) and prostate
cancer absent (n = 2824) for different values of the relative frequency of exposure among
controls in the target population (p0) and relative risk (R)
R
P0
1.5
2
2.5
0.40 57% 95% 100%
0.45 55% 94% 100%
0.50 55% 94% 100%
0.55 46% 91% 100%
The above table shows that the study has enough sample size to detect relative risk of 2
and higher for relative frequency of exposure to residence (farm/non-farm) between 40% to 55%.
3.7 Statistical Analysis
Analysis for Research Question 1:
In order to investigate research question 1, firstly crude prevalence of prostate cancer was
determined using the formula; Prevalence= number of existing cases of a disease at a given point
in time/ total population at a given point in time. Among cases, 46% of men lived on farm. It was
followed by determining age adjusted prevalence using 2011 census data.
Analysis for Research Question 2a:
In order to analyze the data, chi-square tests were applied to determine the univariate
association between prostate cancer and rural exposures (occupational i.e. farming and
environmental), household musty smell and pesticide application. The association was assessed
using multiple logistic regression models. Variables with p<0.25 were the candidate variables for
a full multivariable model. All main effects variables which were statistically significant p<0.05
in the full model were retained in the final multivariable model. In addition to this, variables of
biological importance and potential confounders were included in the models. Significant
interactions at p <0.1 based on scientific/clinical importance were retained in the final model.
The Hosmer-Lemeshow statistic was conducted to assess the goodness of fit for a model. The
strength of associations was presented by odds ratios and their 95% confidence intervals.
25

Analysis for Research Question 2b:
To analyze research question 2b, firstly chi-square tests were used to determine the
univariate association between personal smoking history, household smoke and prostate cancer.
Then the association was assessed using multiple logistic regression models. Variables with
p<0.25 were the candidate variables for a full multivariable model obtained from research
question 2a. All main effects variables which were statistically significant p<0.05 in the full
model were retained in the final multivariable model. In addition to this, variables of biological
importance and potential confounders were included in the models. Significant interactions at
p <0.1 based on scientific/clinical importance were retained in the final model. The Hosmer-
Lemeshow statistic was conducted to assess the goodness of fit for a model. The strength of
associations was presented by odds ratios and their 95% confidence intervals.
Analysis for Research Question 2c:
To investigate this research question, firstly chi-square tests were used to determine the
univariate association between age, family history of cancer and prostate cancer. Then the
association was assessed using multiple logistic regression models. Variables with p<0.25
became the candidate variables for a full multivariable model obtained from research question
2b. All main effects variables which were statistically significant p<0.05 in the full model were
retained in the final multivariable model. In addition to this, variables of biological importance
and potential confounders were included in the models. Significant interactions at p <0.1 based
on scientific/clinical importance were retained in the final model. The Hosmer-Lemeshow
statistic was conducted to assess the goodness of fit for a model. The strength of associations was
presented by odds ratios and their 95% confidence intervals.
Analysis for Research Question 3:
In order to investigate the above research question, final models obtained from research
question 2a, 2b and 2c were used and assessed interaction (family history and; occupational rural
exposure such as exposure to grain dust, pesticides etc and environmental rural exposure such as
household pesticide application) in this model. Interactions which were statistically significant at
p<0.1 in the full model were retained in the final multivariable model. The association
accounting for statistically significant interactions was presented using stratified analysis. The
26

Hosmer-Lemeshow statistic was conducted to assess the goodness of fit for a model. The
strength of associations was presented by odds ratios and their 95% confidence intervals. The
final model included main effects and significant interactions such as rural exposure to pesticides
and family history of cancer.
27

CHAPTER 4: RESULTS
4.1 Participation and Descriptive Characteristics
The presence (cases) or absence (non-cases) of prostate cancer was determined from the
study questionnaire. In total, surveys were returned from 4,264 households (42%). This included
information on 8,261 adults living in these households. Of these, males greater than 45 years of
age (n=2,938) were included as part of this thesis analysis and this is the population considered
to be at risk. Out of these, 114 were prostate cancer cases and remaining 2,824 were non-cases.
Approximately 30.6% of farm residents were older than 65 years as compared to 40.0% of
non-farm residents (Table 4.1). With regards to family history of cancer (i) a similar proportion
of farm (30.4%) and non-farm residents (30.5%) reported having no family history of cancer (ii)
29.1% of farm residents reported having one cancer in their family as compared to 24.3% of non-
farm residents (iii) 11.9% of farm residents reported having two cancers in their family as
compared to 11.7% of non-farm residents and (iv) 3.2% of farm residents reported having three
or more cancers in their family as compared to 5.1% of non-farm residents. It was observed that
47.4% of farm residents had ever smoked in their lifetime as compared to 63.2% of non-farm
residents. Approximately 93.5% of farm residents ever had a farming occupation as compared to
48.1% of non-farm residents. Farm residents who ever been exposed to a combination of
insecticides and fungicides at their work-place were nearly 57.7% as compared to non-farm
residents i.e. 35.7% (Table 4.1).
28

Table 4.1 Descriptive characteristics of study participants stratified by farm and non-farm
residence status
Variables Farm
N=1329
Non-Farm
N=1584
p-value Overall
N=2938
Age
≤ 65 Years
> 65 Years
922 (69.4)
407 (30.6)
950 (60.0)
634 (40.0)
<0.001
1872 (64.3)
1041 (35.7)
Education
> Grade 12
≤ Grade 12
308 (23.5)
1001 (76.5)
477 (30.5)
1089 (69.5)
<0.001
785 (27.3)
2105 (72.7)
Marital Status
Married, common law
or living together
Widowed, divorced,
separated or
single/never married
1181 (89.1)
145 (10.9)
1358 (86.1)
219 (13.9)
0.02
2539 (87.5)
364 (12.5)
Household Smell
No
Yes
1020 (79.9)
257 (20.1)
1356 (87.9)
187 (12.1)
<0.001
2376 (84.3)
444 (15.7)
Household Pesticide
Application
No
Yes
990 (75.2)
327 (24.8)
1284 (81.9)
284 (18.1)
<0.001
2274 (78.8)
611 (21.2)
Household Income Adequacy
High Income
Middle Income
Low Income
539 (50.0)
345 (32.0)
195 (18.1)
558 (41.2)
485 (35.8)
310 (22.9)
<0.001
1097 (45.1)
830 (34.1)
505 (20.8)
History of Cardiovascular
Disease
No
Yes
773 (58.6)
545 (41.4)
806 (51.4)
763 (48.6)
<0.001
1579 (54.7)
1308 (45.3)
29

Family History of Cancer
No Cancer
One Cancer
Two Cancers
Three or More Cancers
Do Not Know/Missing
404 (30.4)
387 (29.1)
158 (11.9)
43 (3.2)
337 (25.4)
483 (30.5)
385 (24.3)
185 (11.7)
80 (5.1)
451 (28.5)
0.01
887 (30.4)
772 (26.5)
343 (11.8)
123 (4.2)
788 (27.1)
History of Personal Smoking
Never Smoker
Ever Smoker
History of Smoking Pack
Years
No Exposure
< 15 Years
≥ 15 and < 25 Years
≥ 25 Years
696 (52.6)
627 (47.4)
700 (55.2)
271 (21.4)
124 (9.8)
173 (13.6)
580 (36.8)
997 (63.2)
583 (39.0)
340 (22.8)
199 (13.3)
372 (24.9)
<0.001
<0.001
1276 (44.0)
1624 (56.0)
1283 (46.5)
611 (22.1)
321 (11.7)
545 (19.7)
Quadrant
North West
South West
South East
North East
384 (28.9)
222 (16.7)
256 (19.3)
467 (35.1)
478 (30.2)
332 (21.0)
344 (21.7)
428 (27.1)
<0.001
862 (29.6)
554 (19.0)
600 (20.6)
895 (30.7)
Farming Job
Never Farming Job
Ever Farming Job
Farming Duration
No Exposure
< 30 Years
≥30 and < 50 Years
≥ 50 Years
85 (6.5)
1219 (93.5)
91 (7.2)
195 (15.3)
770 (60.5)
216 (17.0)
778 (51.9)
720 (48.1)
789 (53.6)
262 (17.8)
265 (18.0)
156 (10.6)
<0.001
<0.001
863 (30.8)
1939 (69.2)
880 (32.1)
457 (16.7)
1035 (37.7)
372 (13.6)
30

At work, ever been exposed to
Insecticides and Fungicides
Insect No Fung No
Insect Yes Fung No
Insect No Fung Yes
Insect Yes Fung Yes
At work, ever been exposed to
Radiation
No
Yes
284 (21.4)
174 (13.1)
104 (7.8)
766 (57.7)
1221 (91.9)
107 (8.1)
696 (44.4)
248 (15.8)
64 (4.1)
559 (35.7)
1427 (91.1)
140 (8.9)
<0.001
0.40
980 (33.9)
422 (14.6)
168 (5.8)
1325 (45.8)
2648 (91.5)
247 (8.5)
Water Source
Bottled Water
Deep Well Water
Shallow Well Water
Other Source
377 (28.5)
288 (21.8)
469 (35.5)
188 (14.2)
454 (29.3)
409 (26.4)
162 (10.5)
522 (33.7)
<0.001
831 (29.0)
697 (24.3)
631 (22.0)
710 (24.7)
Due to missing observations for some variables, the column total by categories may not equal the column totals
4.1.1 Personal and Household Characteristics of Study Participants
For the sake of ease from now onwards we will define cases as those participants who self-
reported an earlier diagnosed prostate cancer and everyone else as non-cases. Most of the cases
with prostate cancer were older than 65 years of age (77.2%) as compared to non-cases (34.2%).
The mean age of cases and non-cases was 74.4 years (standard deviation: 10.6) and 61.9 years
(standard deviation 10.8) respectively. The proportion of cases having educational attainment
> Grade 12 (15.0%) was less than the non- cases (27.8%). As compared to 12.3% non-cases,
20.2% of cases were either divorced or separated. It was observed that majority of non-cases
(46.0%) had a high household income whereas majority of cases’ household income was either
low (37.5%) or middle (38.6%) (Table 4.2).
31

Table 4.2 Descriptive and Univariate Analysis of Personal and Household Characteristics
of Study Participants by Presence or Absence of Prostate Cancer
Variables Prostate Cancer
Present
(N=114)
Prostate Cancer
Absent
(N=2824)
Unadjusted
OR
(95% CI)
p-value
Age
≤ 65 Years
> 65 Years
26 (22.8)
88 (77.2)
1858 (65.8)
966 (34.2)
1.00
6.51 (4.17, 10.15)
<0.001
Education
> Grade 12
≤ Grade 12
17 (15.0)
96 (85.0)
775 (27.8)
2009 (72.2)
1.00
2.18 (1.29, 3.67)
<0.001
Marital Status
Married, common law or living
together
Widowed, divorced, separated
or single/never married
91(79.8)
23 (20.2)
2467 (87.7)
346 (12.3)
1.00
1.80 (1.12, 2.89)
0.01
Household Smell
No
Yes
87 (79.1)
23 (20.9)
2309 (84.5)
423 (15.5)
1.00
1.44 (0.90, 2.31)
0.13
Household Pesticide Application
No
Yes
87 (78.4)
24 (21.6)
2203 (78.8)
592 (21.2)
1.00
1.03 (0.65, 1.63)
0.91
Household Income Adequacy
High Income
Middle Income
Low Income
21 (23.9)
34 (38.6)
33 (37.5)
1083 (46.0)
799 (33.9)
474 (20.1)
1.00
2.19 (1.26, 3.81)
3.59 (2.06, 6.27)
<0.001
<0.001
History of Cardiovascular Disease
No
Yes
44 (39.3)
68 (60.7)
1547 (55.2)
1253 (44.8)
1.00
1.91 (1.30, 2.81)
<0.001
32
Family History of Cancer
No Cancer
One Cancer
Two Cancers
Three or More Cancers
Do Not Know/Missing
27 (23.7)
33 (28.9)
15 (13.2)
12 (10.5)
27 (23.7)
868 (30.7)
745 (26.4)
334 (11.8)
112 (4.0)
765 (27.1)
1.00
1.42 (0.85, 2.39)
1.44 (0.76, 2.75)
3.44 (1.70, 6.70)
1.13 (0.66, 1.95)
0.18
0.26
<0.001
0.65
Personal Smoking History
Never Smoker
Ever Smoker
History of Smoking Pack Years
No Exposure
< 15 Years
≥ 15 and < 25 Years
≥ 25 Years
44 (38.6)
70 (61.4)
45 (42.9)
26 (24.8)
18 (17.1)
16 (15.2)
1241 (44.1)
1570 (55.9)
1247 (46.5)
590 (22.0)
306 (11.4)
536 (20.0)
1.00
1.26 (0.86, 1.85)
1.00
1.22 (0.75, 2.00)
1.63 (0.93, 2.86)
0.83 (0.46, 1.48)
0.24
0.52
0.43
0.09
Due to missing observations for some variables, the column total by categories may not equal the column totals
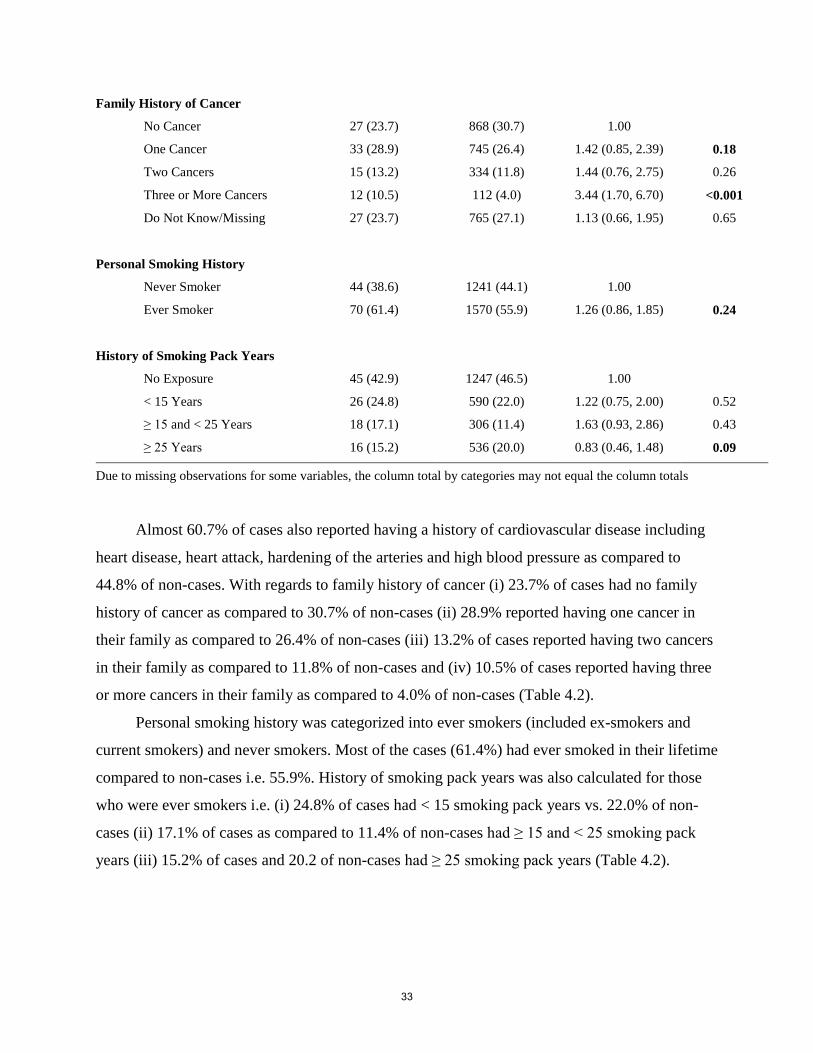
Almost 60.7% of cases also reported having a history of cardiovascular disease including
heart disease, heart attack, hardening of the arteries and high blood pressure as compared to
44.8% of non-cases. With regards to family history of cancer (i) 23.7% of cases had no family
history of cancer as compared to 30.7% of non-cases (ii) 28.9% reported having one cancer in
their family as compared to 26.4% of non-cases (iii) 13.2% of cases reported having two cancers
in their family as compared to 11.8% of non-cases and (iv) 10.5% of cases reported having three
or more cancers in their family as compared to 4.0% of non-cases (Table 4.2).
Personal smoking history was categorized into ever smokers (included ex-smokers and
current smokers) and never smokers. Most of the cases (61.4%) had ever smoked in their lifetime
compared to non-cases i.e. 55.9%. History of smoking pack years was also calculated for those
who were ever smokers i.e. (i) 24.8% of cases had < 15 smoking pack years vs. 22.0% of non-
cases (ii) 17.1% of cases as compared to 11.4% of non-cases had ≥ 15 and < 25 smoking pack
years (iii) 15.2% of cases and 20.2 of non-cases had ≥ 25 smoking pack years (Table 4.2).
33

4.1.2 Occupational and Environmental Characteristics of Study Participants
A higher proportion of men with prostate cancer (82.5%) ever had worked a farming job in
their lifetime. However, this proportion was significantly less among non-cases (68.8%) (Table
4.3). The total number of years in the farming occupation was categorized into four categories:
no exposure (who never had farming as an occupation); < 30 years of farming; ≥ 30 and < 50
years of farming; and ≥ 50 years of farming. Among cases 18.4% had no exposure to farming
compared to 32.5% among non-cases; 17.3% of cases compared to 16.5% of non-cases had
farming years < 30; 29.6% of cases compared to 38.1% of non-cases had farming years ≥ 30 and
< 50 and 34.7% of cases as compared to 12.8% of non-cases had a total of ≥ 50 years of
farming (Table 4.3).
34

Table 4.3 Descriptive and Univariate Analysis of Environmental and Farming
Occupational Characteristics of Study Participants by Presence or Absence of Prostate
Cancer
Variables Prostate Cancer
Present
(N=114)
Prostate Cancer
Absent
(N=2824)
Unadjusted
OR
(95% CI)
p-value
Residence
Non-Farm
Farm
Quadrant
North West
South West
South East
North East
61 (54.0)
52 (46.0)
24 (21.1)
23 (20.2)
25 (21.9)
42 (36.8)
1523 (54.4)
1277 (45.6)
846 (30.0)
534 (18.9)
583 (20.7)
859 (30.4)
1.00
1.02 (0.70, 1.48)
1.00
1.52 (0.85, 2.72)
1.51 (0.85, 2.67)
1.72 (1.03, 2.87)
0.93
0.16
0.15
0.04
Farming Job
Never Farming Job
Ever Farming Job
Farming Duration
No Exposure
< 30 Years
≥30 and < 50 Years
≥ 50 Years
At work, ever been exposed to
Insecticides and Fungicides
Insect No Fung No
Insect Yes Fung No
Insect No Fung Yes
Insect Yes Fung Yes
18 (17.5)
85 (82.5)
18 (18.4)
17 (17.3)
29 (29.6)
34 (34.7)
23 (20.4)
16 (14.2)
5 (4.4)
69 (61.1)
850 (31.2)
1870 (68.8)
867 (32.5)
441 (16.5)
1016 (38.1)
341 (12.8)
969 (34.5)
408 (14.5)
165 (5.9)
1265 (45.1)
1.00
2.15 (1.28, 3.59)
1.00
1.86 (0.95, 3.64)
1.37 (0.76, 2.49)
4.80 (2.68, 8.62)
1.00
1.65 (0.86, 3.16)
1.28 (0.48, 3.40)
2.30 (1.42, 3.71)
<0.001
0.07
0.29
<0.001
0.12
0.63
<0.001
35

At work, ever been exposed to
Radiation
No
Yes
91 (80.5)
22 (19.5)
2580 (91.9)
227 (8.1)
1.00
2.75 (1.69, 4.46)
<0.001
Water Source
Bottled Water
Deep Well Water
Shallow Well Water
Other Source
28 (25.7)
28 (25.7)
14 (12.8)
39 (35.8)
809 (29.1)
675 (24.3)
626 (22.5)
673 (24.2)
1.00
1.20 (0.70, 2.04)
0.65 (0.34, 1.24)
1.67 (1.02, 2.75)
0.51
0.19
0.04
Since there were missing observations for some variables, the column total may not total 114 (prostate cancer
present) and 2824 (prostate cancer absent).
Information on work place exposures such as grain dust, livestock, welding fumes,
insecticides, herbicides, fungicides and radiation was also gathered. Almost 89.4% of cases
compared to 84.7% of non-cases were exposed to grain dust at work, 74.3% of cases as
compared to 63.8% of non-cases were exposed to livestock, 77.0% of cases compared to 69.1%
of non-cases were exposed to welding fumes at work, 84.1% of cases than 70.1% of non-cases
were exposed to herbicides, 65.5% of cases as compared to 50.9% of non-cases were exposed to
fungicides, 75.2 % of cases as compared to 59.6% of non-cases were exposed to insecticides and
19.5% of cases as compared to 8.1% of non-cases were exposed to work place radiation.
It was observed that a similar proportion (46%) of cases and non-cases were residing on a
farm than non-farm. Quadrant wise (i) 21.1% of cases as compared to 30.0% of non-cases were
dwelling in the North West, (ii) 20.2% of cases as compared to 18.9% of non-cases were
dwelling in the South west, (iii) 21.9% of cases as compared to 20.7% of non-cases were
dwelling in the South East and (iv) 36.8% of prostate cancer cases as compared to 30.4% of non-
cases were dwelling in the North East quadrant of southern Saskatchewan (Table 4.3).
The main source of water supply for drinking purposes at home was also assessed with
regards to prostate cancer. A similar proportion of cases (25.7%) had bottled water and deep well
water as their source of drinking water as compared to 29.1% and 24.3% of non-cases. Nearly
12.8% of cases vs. 22.5% of non-cases had shallow well as the source of drinking water and
remaining 35.8% of cases and 24.2% of non-cases had other source of drinking water supply
(Table 4.3).
36

4.1.3 Univariate Associations
Increasing age was observed to be the strongest risk factor of prostate cancer. Men who
were > 65 years of age were 6.51 times more at risk of prostate cancer as compared to men ≤ 65
years. Cases who reported to have been divorced or separated (OR= 1.80), reported having
education level ≤ grade 12 (OR= 2.18) were at an increased risk of prostate cancer. Cases with
low income and middle income households were 3.59 times and 2.19 times were observed to be
at higher risk of prostate cancer respectively as compared to high income households. Cases
having three or more cancers in their family were atleast 3.44 times at risk of prostate cancer as
compared to cases having no cancer in their family. Exposure to household musty smell
increased the risk of prostate cancer by 1.44 times. Men who had a history of cardiovascular
disease were 1.91 times more at risk of as compared to men with no such history (Table 4.2).
It was also observed that men who ever smoked were 1.26 times more at risk of prostate
cancer as compared to men who never smoked in their lifetime. At univariate level, the risk was
observed to increase by 1.22 times and 1.63 times among men who smoked < 15 pack years and
≥ 15 and < 25 pack years respectively as compared to men with no exposure to pack years. The
risk however was observed to be reduced by 0.83 times among men who smoked ≥ 25 pack years
as compared to men with no such exposure (Table 4.2).
Farm residence was observed to have no statistically significant relationship with the
prostate cancer at the univariate level. However, this variable was included in all the multivariate
analyses as it was of prime interest. Quadrant increased the risk of prostate cancer, for example
residents of South-West and South-East were 1.50 times and resident of North-East were 1.70
times at risk compared to North-West residents (Table 4.3).
The trend was for farmers based on occupation to have an increased risk (OR=2.15) of
prostate cancer than non-farmers. Also, the duration of farming job escalated the risk by 1.86
times and 4.80 times among men who had < 30 years and ≥ 50 years of farming duration
respectively. Considering the work-place exposure, men who were exposed to insecticides and
fungicides together were 2.30 times at risk of prostate cancer than who did not have this
exposure. Work-place exposure to radiation was also observed to be associated with the outcome
of interest thus increasing the risk by 2.75 times. Men who had shallow well water as their
source of drinking water were observed to have a reduced risk by 0.65 times than bottled water
(Table 4.3).
37

4.2 Research Question1: Prevalence
“What is the prevalence of prostate cancer in rural farm and non-farm dwelling
men older than 45 years of Saskatchewan in 2010-2011?”
Crude and age standardized prevalence of prostate cancer was calculated. The overall
crude prevalence was 3.88%. The overall age- standardized prostate cancer prevalence was
3.32% and using the two proportions test, it was observed that differences in the age
standardized prevalence of prostate cancer were not statistically significant between farm and
non-farm residence (Table 4.4).
Table 4.4 Crude and Age Standardized Prostate Cancer Prevalence (men > 45 years) by
Farm/Non-farm Residence Status
Prostate Cancer
Present
Crude
Prevalence
Age-Standardized*
Total
Farm
Non-Farm
113/2913
52/1329
61/1584
3.88
3.91
3.85
3.32
3.81
2.95
*Standardized to 2011 Canadian Census Population
4.3 Research Question 2
4.3.1 Research Question 2a
“Is there an association between rural exposures (occupational i.e. farming and
environmental), household musty smell and pesticide application and prostate
cancer in rural dwelling men of Saskatchewan?”
Farming job, farming duration and work-place exposure to insecticides and fungicides; and
radiation were included as the primary variables of interest in this model. Other candidate
variables including age, education, marital status, household income adequacy, household smell,
history of cardiovascular diseases, residence, quadrant and source of water were also considered
in the model building process based on the results in univariate analysis (Table 4.2 and Table
38

4.3). Testing for important interactions and assessment for potential confounders were also
conducted.
A model with all the independent variables stated above was fit together. An issue of
multicollinearity was observed between farming job and farming duration thus giving unstable
values. A decision was made to fit the two models separately; one containing farming job only
and another containing farming years only (Table 4.5).
39
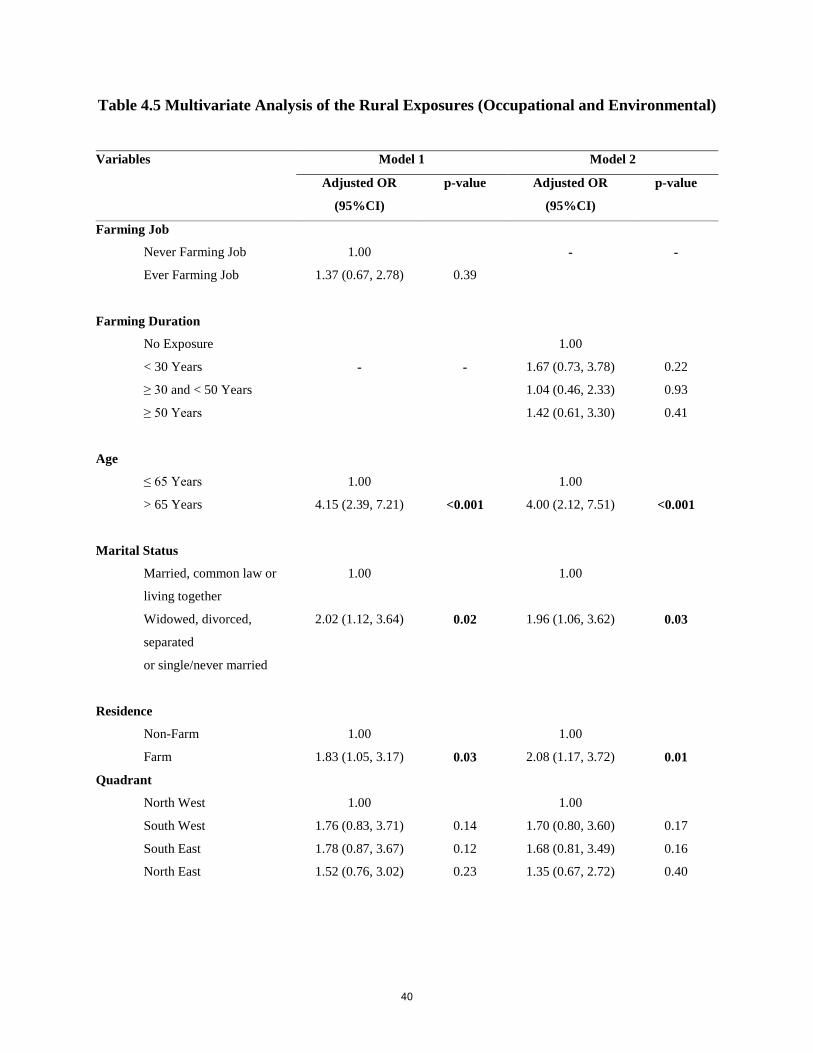
Table 4.5 Multivariate Analysis of the Rural Exposures (Occupational and Environmental)
Variables Model 1 Model 2
Adjusted OR
(95%CI)
p-value Adjusted OR
(95%CI)
p-value
Farming Job
Never Farming Job
Ever Farming Job
1.00
1.37 (0.67, 2.78)
0.39
-
-
Farming Duration
No Exposure
< 30 Years
≥ 30 and < 50 Years
≥ 50 Years
-
-
1.00
1.67 (0.73, 3.78)
1.04 (0.46, 2.33)
1.42 (0.61, 3.30)
0.22
0.93
0.41
Age
≤ 65 Years
> 65 Years
1.00
4.15 (2.39, 7.21)
<0.001
1.00
4.00 (2.12, 7.51)
<0.001
Marital Status
Married, common law or
living together
Widowed, divorced,
separated
or single/never married
1.00
2.02 (1.12, 3.64)
0.02
1.00
1.96 (1.06, 3.62)
0.03
Residence
Non-Farm
Farm
Quadrant
North West
South West
South East
North East
1.00
1.83 (1.05, 3.17)
1.00
1.76 (0.83, 3.71)
1.78 (0.87, 3.67)
1.52 (0.76, 3.02)
0.03
0.14
0.12
0.23
1.00
2.08 (1.17, 3.72)
1.00
1.70 (0.80, 3.60)
1.68 (0.81, 3.49)
1.35 (0.67, 2.72)
0.01
0.17
0.16
0.40
40

Household Income Adequacy
High Income
Middle Income
Low Income
1.00
1.70 (0.93, 3.08)
1.61 (0.83, 3.11)
0.08
0.16
1.00
1.85 (1.00, 3.44)
1.76 (0.89, 3.50)
0.05
0.10
History of Cardiovascular Disease
No
Yes
1.00
1.60 (0.98, 2.63)
0.06
1.00
1.57 (0.95, 2.61)
0.08
At work, ever been exposed to
Insecticides and Fungicides
Insect No Fung No
Insect Yes Fung No
Insect No Fung Yes
Insect Yes Fung Yes
At work, ever been exposed to
Radiation
No
Yes
1.00
1.31 (0.55, 3.15)
1.01 (0.27, 3.74)
2.27 (1.17, 4.39)
1.00
2.04 (1.09, 3.83)
0.54
0.98
0.01
0.03
1.00
1.41 (0.58, 3.43)
1.08 (0.29, 4.03)
2.40 (1.21, 4.76)
1.00
2.13 (1.12, 4.02)
0.45
0.91
0.01
0.02
Water Source
Bottled Water
Deep Well Water
Shallow Well Water
Other Source
1.00
1.08 (0.55, 2.13)
0.53 (0.25, 1.14)
1.46 (0.77, 2.77)
0.81
0.10
0.24
1.00
1.18 (0.59, 2.35)
0.58 (0.27, 1.26)
1.65 (0.85, 3.21)
0.65
0.17
0.14
Farming job and quadrant were examined for interaction. The interaction had a p-value of
< 0.1 in the model. However, it had extremely wide confidence intervals. Therefore a decision
was made to exclude this interaction from the model. Following the model building process
described above we ended up with the following two models.
41

Final model 1:
Log ( /1- ) = 0 + 1 Residence + 2 Age + 3 Marital status + 4 Quadrant + 5 Water
source+ 6 Income adequacy + 7 History of cardiovascular disease + 8 Work-place
exposure to insecticides and fungicides + 9 Work-place exposure to radiation + 10
Farming Job (Table 4.5).
Final model 2:
Log ( /1- ) = 0 + 1 Residence + 2 Age + 3 Marital status + 4 Quadrant + 5 Water
source+ 6 Income adequacy + 7 History of cardiovascular disease + 8 Work-place
exposure to insecticides and fungicides + 9 Work-place exposure to radiation + 10
Farming duration (Table 4.5).
Where p = probability of “self-reported an earlier diagnosis of prostate cancer”
The results indicated that farming job and farming duration were not associated with
prostate cancer. However, work-place exposure to insecticides and fungicides together and
exposure to radiation were associated with prostate cancer (Table 4.5).
4.3.2 Research Question 2b
“Is there an association between personal smoking history, exposure to household
smoke and prostate cancer in rural dwelling men of Saskatchewan?”
The candidate variables of primary interest were personal smoking history and history of
smoking pack years. Other predictors including age, education, marital status, household income
adequacy, history of cardiovascular diseases, residence, quadrant and source of water supply
were also considered for multivariate models given their results at univariate analysis (Table 4.2
and Table 4.3). Testing for important interactions and assessment for potential confounders were
also conducted.
To avoid the multicollinearity between personal smoking history and history of smoking
pack years, two different models were fit (Table 4.6). Model 1 contained personal smoking
42

history and a set of covariates whereas model 2 contained history of smoking pack years with the
same covariates.
Table 4.6 Multivariate Analysis of the Personal Smoking History and Exposure to
Household Smoke
Variables Model 1 Model 2
Adjusted OR
(95%CI)
p-value Adjusted OR
(95%CI)
p-value
Personal Smoking History
Never Smoker
Ever Smoker
*
*
-
-
History of Smoking Pack Years
No Exposure
< 15 Years
≥ 15 and < 25 Years
≥ 25 Years
-
-
*
*
Age
≤ 65 Years
> 65 Years
1.00
4.57 (2.69, 7.77)
<0.001
1.00
4.55 (2.62, 7.91)
<0.001
Marital Status
Married, common law or
living together
Widowed, divorced,
separated
or single/never married
1.00
1.80 (1.03, 3.14)
0.04
1.00
1.77(1.00, 3.18)
0.05
Residence
Non-Farm
Farm
*
*
*
*
43

Quadrant
North West
South West
South East
North East
1.00
1.82 (0.90, 3.69)
1.74 (0.86, 3.52)
1.52 (0.79, 2.92)
0.10
0.12
0.21
1.00
1.82 (0.90, 3.72)
1.63 (0.80, 3.34)
1.35 (0.69, 2.64)
0.10
0.18
0.38
Household Income Adequacy
High Income
Middle Income
Low Income
1.00
1.57 (0.89, 2.81)
1.57(0.84, 2.94)
0.13
0.16
1.00
1.66(0.90, 3.04)
1.72(0.89, 3.32)
0.10
0.11
History of Cardiovascular Disease
No
Yes
1.00
1.49 (0.93, 2.40)
0.10
1.00
1.63 (0.99, 2.67)
0.05
Water Source
Bottled Water
Deep Well Water
Shallow Well Water
Other Source
1.00
1.04 (0.55, 1.96)
0.54 (0.26, 1.13)
1.50 (0.83, 2.73)
0.92
0.10
0.18
1.00
1.30 (0.66, 2.55)
0.65 (0.30, 1.40)
1.67 (0.88, 3.17)
0.44
0.27
0.12
Interactions
Residence*Personal Smoking
History
Residence * Ever Smokers
3.25 (1.28, 8.25)
0.01
-
-
Residence * History of Smoking
Pack Years
Residence *(< 15) Years
Residence *(≥ 15 and < 25)
Years
Residence *(≥ 25) Years
-
-
3.10 (0.94, 10.19)
4.14 (1.05, 16.25)
2.23 (0.57, 8.75)
0.06
0.04
0.25
* Included in the model but as part of interaction
Residence and personal smoking history; and residence and history of smoking pack years
were examined for interaction in model 1 and model 2 respectively. Interaction between farm
44

residence and ever smokers had a p-value of 0.01 in the model. Interaction between farm
residence and (≥ 15 and < 25) smoking pack years had a p-value of 0.04 in model 2. These two
interactions were therefore retained in the final models (Table 4.6). The following models were
fitted:
Final model 1:
Log ( /1- ) = 0 + 1 Residence + 2 Age + 3 Marital status + 4 Quadrant + 5 Water
source+ 6 Income adequacy + 7 History of cardiovascular disease + 8 Personal
smoking history + 9 Farm* Personal smoking history (Table 4.6).
Final model 2:
Log ( /1- ) = 0 + 1 Residence + 2 Age + 3 Marital status + 4 Quadrant + 5 Water
source+ 6 Income adequacy + 7 History of cardiovascular disease + 8 History of
smoking pack years + 9 Farm* History of smoking pack years (Table 4.6).
The results indicated that the relationship between smoking and prostate cancer depends
on whether a person resides on a farm or not. Stratified analysis of this interaction showed that
among ever smokers, farm residents have a significantly increased risk of prostate cancer than
non-farm residents (Table 4.7). Also, among < 15 pack years smokers and ≥ 15 and < 25 pack
years smokers, the risk increased among those residing on a farm than non-farm (Table 4.8).
45

Table 4.7 Stratified analysis of the personal smoking history as the effect modifier in the
relationship between residence and prostate cancer
Variable Unadjusted OR
(95%CI)
p-value Adjusted OR
(95%CI)
p-value
Never Smoker
Non-Farm
Farm
1.00
0.62 (0.34, 1.14)
0.12
1.00
0.79 (0.34, 1.84)
0.59
Ever Smoker
Non-Farm
Farm
1.00
1.48 (0.91, 2.40)
0.11
1.00
3.63 (1.96, 6.73)
<0.001
Table 4.8 Stratified analysis of the history of smoking pack years as the effect modifier in
the relationship between residence and prostate cancer
Variable Unadjusted OR
(95%CI)
p-value Adjusted OR
(95%CI)
p-value
No Pack Years Exposure
Non-Farm
Farm
1.00
0.60 (0.33, 1.09)
0.09
1.00
0.77 (0.33, 1.76)
0.53
< 15 Pack Years
Non-Farm
Farm
1.00
1.27 (0.58, 2.78)
0.55
1.00
3.28 (1.15, 9.34)
0.03
≥ 15 and < 25 Pack Years
Non-Farm
Farm
1.00
1.46 (0.55, 3.88)
0.45
1.00
6.68 (1.53, 29.27)
0.01
≥ 25 Pack Years
Non-Farm
Farm
1.00
0.98 (0.33, 2.86)
0.97
1.00
2.99 (0.81, 10.98)
0.10
46

4.3.3 Research question 2c
“Is there an association between age, family history of cancer and prostate cancer in
rural dwelling men of Saskatchewan?”
Family history of cancer and age of an individual were the variable of primary
interest in multivariate analysis (Table 4.2). Other variables included were education,
marital status, household income adequacy, history of cardiovascular diseases, residence,
quadrant and source of water supply based on univariate results (Table 4.2 and Table 4.3)
and potential confounders and interaction terms.
47

Table 4.9 Multivariate Analysis of Age and Family History of Cancer
Variables Adjusted
Odds Ratio
(95%CI)
p-value
Age
≤ 65 Years
> 65 Years
1.00
4.67 (2.74, 7.96)
<0.001
Marital Status
Married, common law or
living together
Widowed, divorced, separated
or single/never married
1.00
1.76 (1.0, 3.08)
0.05
Residence
Non-Farm
Farm
Quadrant
North West
South West
South East
North East
*
1.00
1.87 (0.92, 3.81)
1.76 (0.86, 3.56)
1.56 (0.81, 3.01)
*
0.08
0.12
0.19
Household Income Adequacy
High Income
Middle Income
Low Income
1.00
1.15 (0.84, 2.71)
1.60 (0.85, 3.01)
0.17
0.14
History of Cardiovascular Disease
No
Yes
1.00
1.52 (0.94, 2.45)
0.09
48
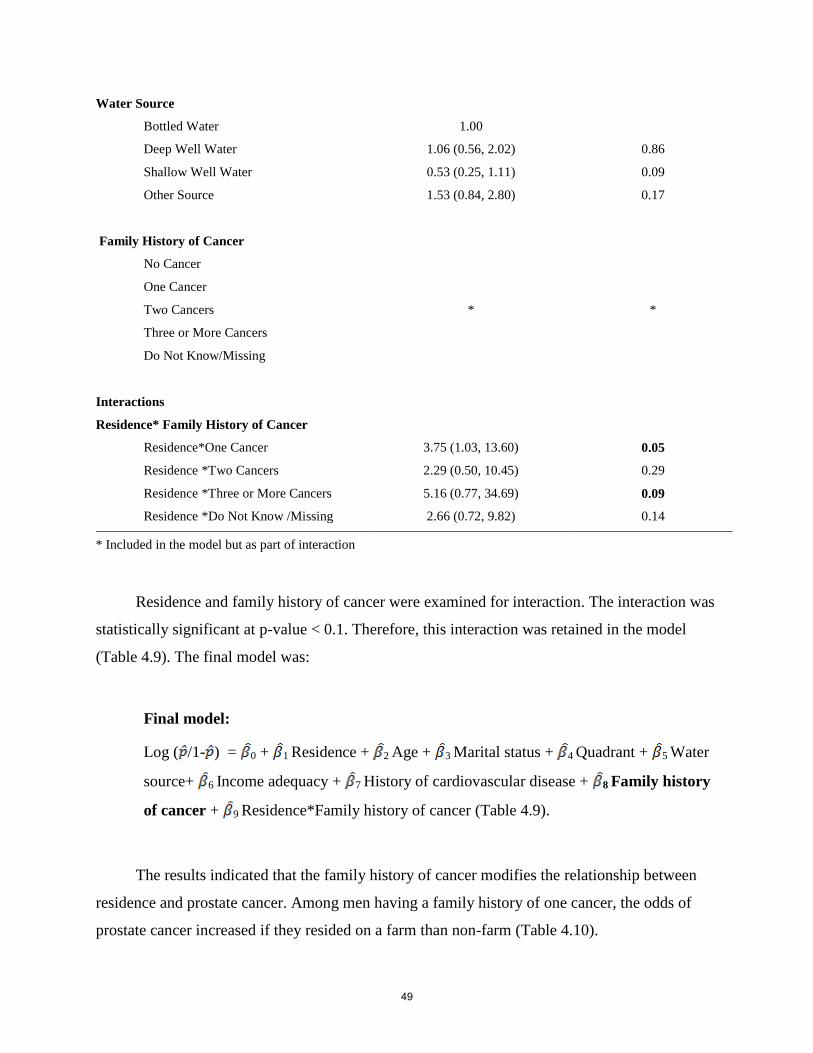
Water Source
Bottled Water
Deep Well Water
Shallow Well Water
Other Source
1.00
1.06 (0.56, 2.02)
0.53 (0.25, 1.11)
1.53 (0.84, 2.80)
0.86
0.09
0.17
Family History of Cancer
No Cancer
One Cancer
Two Cancers
Three or More Cancers
Do Not Know/Missing
Interactions
Residence* Family History of Cancer
Residence*One Cancer
Residence *Two Cancers
Residence *Three or More Cancers
Residence *Do Not Know /Missing
*
3.75 (1.03, 13.60)
2.29 (0.50, 10.45)
5.16 (0.77, 34.69)
2.66 (0.72, 9.82)
*
0.05
0.29
0.09
0.14
* Included in the model but as part of interaction
Residence and family history of cancer were examined for interaction. The interaction was
statistically significant at p-value < 0.1. Therefore, this interaction was retained in the model
(Table 4.9). The final model was:
Final model:
Log ( /1- ) = 0 + 1 Residence + 2 Age + 3 Marital status + 4 Quadrant + 5 Water
source+ 6 Income adequacy + 7 History of cardiovascular disease + 8 Family history
of cancer + 9 Residence*Family history of cancer (Table 4.9).
The results indicated that the family history of cancer modifies the relationship between
residence and prostate cancer. Among men having a family history of one cancer, the odds of
prostate cancer increased if they resided on a farm than non-farm (Table 4.10).
49

Table 4.10 Stratified analysis of the family history of cancer as the effect modifier in the
relationship between residence and prostate cancer
Variables Unadjusted
OR (95%CI)
p-value Adjusted
OR (95%CI)
p-value
No Cancer
Non-Farm
Farm
1.00
0.82 (0.37, 1.78)
0.61
1.00
0.94 (0.35, 2.56)
0.91
One Cancer
Non-Farm
Farm
1.00
1.29 (0.63, 2.64)
0.48
1.00
4.32 (1.59, 11.97)
<0.001
Two Cancers
Non-Farm
Farm
1.00
1.03 (0.36, 2.89)
0.96
1.00
3.59 (0.61, 21.24)
0.16
Three or More Cancers
Non-Farm
Farm
1.00
1.37(0.41, 4.61)
0.61
1.00
2.02 (0.27, 15.22)
0.50
Do Not Know/Missing
Non-Farm
Farm
1.00
0.92 (0.42, 2.00)
0.83
1.00
2.25 (0.82, 6.22)
0.12
50

4.4 Research Question 3
“Is family history of cancer an effect modifier in the relationship between rural
exposures (occupational i.e. farming and environmental) and prostate cancer in
rural dwelling men of Saskatchewan?”
Primary candidate variables that were included in this analysis were farming job, farming
duration, personal smoking history, history of smoking pack years. Again a decision was made to
fit four different models containing possible combinations of these four variables to avoid the
issue of multicolinearity (Table 4.11). Remaining variables that were included in each of these
models were age, marital status, residence, quadrant, household income adequacy, history of
cardiovascular disease, work place exposure, water source and family history of cancer. The
inclusion of candidate variables was based on results from research question 2.
51

Tab
le 4
.11
Mu
ltiv
ari
ate
an
aly
sis
of
the
pote
nti
al
risk
fact
ors
of
pro
sta
te c
an
cer
52

53

54
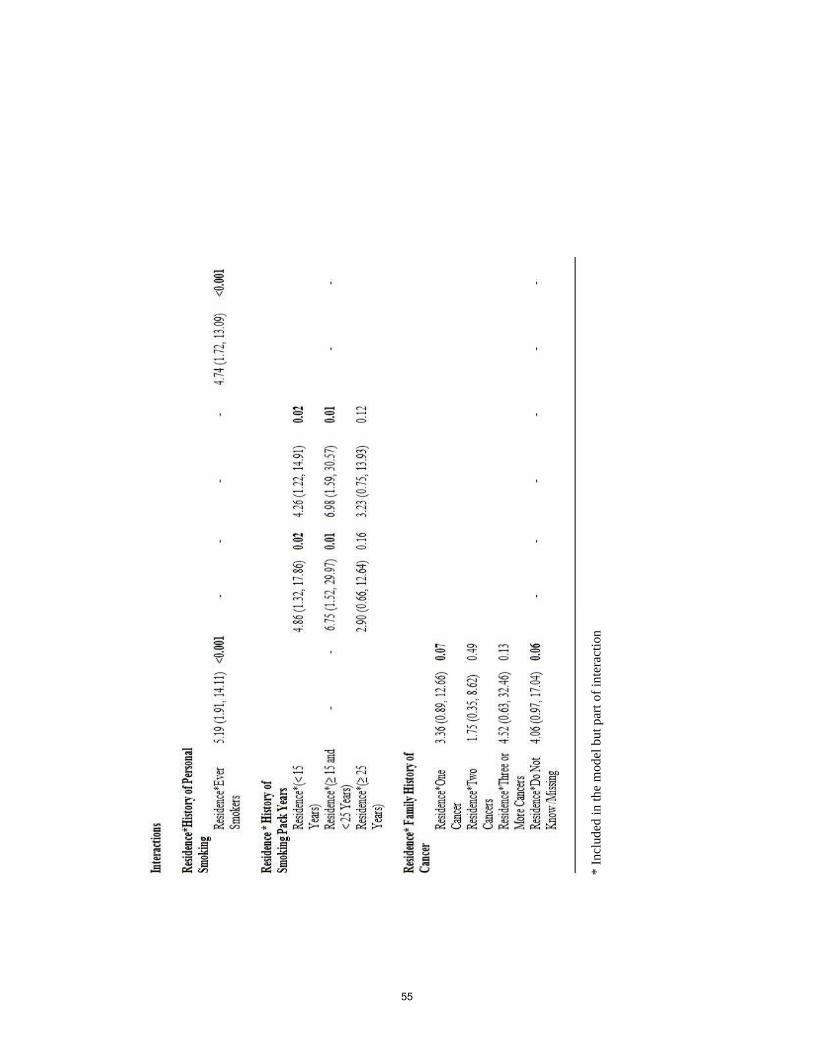
* I
ncl
ud
ed i
n t
he
mod
el b
ut
par
t o
f in
tera
ctio
n
55

In addition to the interactions that were significant and were considered in research
question 2, other interactions specific to research question 3 were examined. Interactions such as
family history of cancer and work place exposure to insecticides and fungicides; family history
of cancer and work place exposure to radiation, family history of cancer and water source, family
history of cancer and personal history of smoking were examined. However, none of these
interactions contributed significantly to the final models. The final models were as follows:
Final model 1:
Log ( /1- ) = 0 + 1 Residence + 2 Age + 3 Marital status + 4 Quadrant + 5 Water
source+ 6 Income adequacy + 7 History of cardiovascular disease + 8 Work place
exposure to insecticides and fungicides + 9 Work-place exposure to radiation + 10
Farming job + 11 Personal smoking history + 12 family history of cancer + 13
Residence*Personal smoking history + 14 Farm*Family history of cancer (Table 4.11).
Final model 2:
Log ( /1- ) = 0 + 1 Residence + 2 Age + 3 Marital status + 4 Quadrant + 5 Water
source+ 6 Income adequacy + 7 History of cardiovascular disease + 8 Work place
exposure to insecticides and fungicides + 9 Work-place exposure to radiation + 10
Farming duration + 11 History of smoking pack years + 12 Family history of cancer
+ 13 Residence*History of smoking pack years (Table 4.11).
Final model 3:
Log ( /1- ) = 0 + 1 Residence + 2 Age + 3 Marital status + 4 Quadrant + 5 Water
source+ 6 Income adequacy + 7 History of cardiovascular disease + 8 Work place
exposure to insecticides and fungicides + 9 Work-place exposure to radiation + 10
Farming job + 11 History of smoking pack years + 12 Family history of cancer +
13 Residence*History of smoking pack years (Table 4.11).
56

Final model 4:
Log ( /1- ) = 0 + 1 Residence + 2 Age + 3 Marital status + 4 Quadrant + 5 Water
source+ 6 Income adequacy + 7 History of cardiovascular disease + 8 Work place
exposure to insecticides and fungicides + 9 Work-place exposure to radiation + 10
Farming duration + 11 Personal smoking history + 12 Family history of cancer + 13
Residence*Personal smoking history (Table 4.11).
The results indicated that farming job and farming duration has no relationship with
prostate cancer (Table 4.11). However, work place exposure to insecticides fungicides and
radiation were significantly associated with prostate cancer and showed a greater risk among
exposed groups. Personal smoking history (Table 4.12 and Table 4.16) and history of smoking
pack years (Table 4.14 and Table 4.15) were the effect modifiers in the relationship of residence
and prostate cancer. Family history of cancer was observed to modify the association between
residence and prostate cancer (Table 4.13).
Table 4.12 Stratified analysis of the personal smoking history as the effect modifier in the
relationship between residence and prostate cancer in the final model 1
Variable Unadjusted OR
(95%CI)
p-value Adjusted OR
(95%CI)
p-value
Never Smoker
Non-Farm
Farm
1.00
0.62 (0.34, 1.14)
0.12
1.00
0.44 (0.17, 1.15)
0.09
Ever Smoker
Non-Farm
Farm
1.00
1.48 (0.91, 2.40)
0.11
1.00
4.04 (1.96, 8.34)
<0.001
57

Table 4.13 Stratified analysis of the family history of cancer as the effect modifier in the
relationship between residence and prostate cancer in the final model 1
Variable Unadjusted
OR (95%CI)
p-value Adjusted
OR (95%CI)
p-value
No Cancer
Non-Farm
Farm
1.00
0.82 (0.37, 1.78)
0.61
1.00
0.84 (0.28, 2.52)
0.75
One Cancer
Non-Farm
Farm
1.00
1.29 (0.63, 2.64)
0.48
1.00
3.41 (1.09, 10.62)
0.03
Two Cancers
Non-Farm
Farm
1.00
1.03 (0.36, 2.89)
0.96
1.00
1.36 (0.19, 9.84)
0.76
Three or More Cancers
Non-Farm
Farm
1.00
1.37(0.41, 4.61)
0.61
1.00
1.67 (0.13, 21.89)
0.69
Do Not Know/Missing
Non-Farm
Farm
1.00
0.92 (0.42, 2.00)
0.83
1.00
4.84 (1.20, 19.55)
0.03
58

Table 4.14 Stratified analysis of the history of smoking pack years as the effect modifier in
the relationship between residence and prostate cancer in the final model 2
Variable Unadjusted OR
(95%CI)
p-value Adjusted OR
(95%CI)
p-value
No Pack Years Exposure
Non-Farm
Farm
1.00
0.60 (0.33, 1.09)
0.09
1.00
0.52 (0.19, 1.42)
0.20
< 15 Pack Years
Non-Farm
Farm
1.00
1.27 (0.58, 2.78)
0.55
1.00
5.60 (1.50, 20.83)
0.01
≥ 15 and < 25 Pack Years
Non-Farm
Farm
1.00
1.46 (0.55, 3.88)
0.45
1.00
29.89 (2.21, 404.40)
0.01
≥ 25 Pack Years
Non-Farm
Farm
1.00
0.98 (0.33, 2.86)
0.97
1.00
4.88 (0.84, 28.17)
0.08
59

Table 4.15 Stratified analysis of the history of smoking pack years as the effect modifier in
the relationship between residence and prostate cancer in the final model 3
Variable Unadjusted OR
(95%CI)
p-value Adjusted OR
(95%CI)
p-value
No Pack Years Exposure
Non-Farm
Farm
1.00
0.60 (0.33, 1.09)
0.09
1.00
0.47 (0.18, 1.21)
0.12
< 15 Pack Years
Non-Farm
Farm
1.00
1.27 (0.58, 2.78)
0.55
1.00
3.64 (1.05, 12.60)
0.04
≥ 15 and < 25 Pack Years
Non-Farm
Farm
1.00
1.46 (0.55, 3.88)
0.45
1.00
15.33 (1.69, 139.34)
0.02
≥ 25 Pack Years
Non-Farm
Farm
1.00
0.98 (0.33, 2.86)
0.97
1.00
4.97 (0.89, 27.58)
0.07
Table 4.16 Stratified analysis of the personal smoking history as the effect modifier in the
relationship between residence and prostate cancer in the final model 4
Variable Unadjusted OR
(95%CI)
p-value Adjusted OR (95%CI) p-value
Never Smoker
Non-Farm
Farm
1.00
0.62 (0.34, 1.14)
0.12
1.00
0.45 (0.16, 1.28)
0.14
Ever Smoker
Non-Farm
Farm
1.00
1.48 (0.91, 2.40)
0.11
1.00
4.36 (2.05, 9.30)
<0.001
60

The Hosmer-Lemeshow (HL) statistic was used to assess the goodness of fit of the model.
The p-value of the HL statistic for (i) model 1 = 0.32 (ii) model 2 = 0.73 (iii) model 3 = 0.41 and
(iv) model 4 = 0.84, indicating that all the models were good fit and were acceptable.
61

CHAPTER 5: DISCUSSION
The Saskatchewan Rural Health Study is a large prospective cohort study. To date,
baseline data has been collected. This baseline data was the basis of this thesis which assessed
the prevalence of prostate cancer (among men older than 45 years) and the risk factors associated
with it. This secondary data analysis used "the Population Health Framework" to answer the
research questions.
5.1 Summary and Interpretation of Results
In total 114 men reported having prostate cancer where as 2,824 men did not have prostate
cancer. The majority of prostate cancer cases were among men older than 65 years of age
compared to non-cases. A similar proportion of cases and non-cases resided on farm. Men with
prostate cancer tended to have low income families as compared to their counterparts.
The overall crude prevalence of prostate cancer was 3.9%. The overall age standardized
prevalence in 2010-2011 was 3.3%. It was observed that the farm dwelling (3.8%) and non-farm
dwelling prevalence (3.0%) of prostate cancer was not statistically different from each other. To
our knowledge in the given literature, none of the Canadian studies attempted to report one year
prevalence of prostate cancer in rural population but focused rather on incidence and mortality.
However, in a report by Ellison and Wilkins, two-year prostate cancer prevalence in the
Canadian population on January 1, 2005 was 236.0 per 100,000 (5). They utilized cancer
registries to obtain diagnosed cases whereas the current study utilized a survey to obtain prostate
cancer cases.
We hypothesized that the farming occupation and farming duration would be associated
with prostate cancer and would show an increased risk among farmers. Based on univariate
analysis, it was observed that men who ever had a farming job were at an increased risk of
prostate cancer. However, when adjusted for other risk factors the association between "ever had
a farming job" and prostate cancer was not statistically significant. Men who had farming
exposure for < 30 years and ≥ 50 years also showed an increased risk as compared to men with
no farming years exposure. However, this relationship was not statistically significant when
adjusted for other risk factors. Thus, our data fails to support our hypothesis. Our findings thus
do not confirm that farming occupation or duration of farming is a risk factor for prostate cancer
in the rural population of Saskatchewan. Our findings were consistent with other studies (63-66)
62

concluding that farming or agricultural occupations were not associated with prostate cancer.
Yet, there remains some inconsistency in the literature where a few studies have reported an
increased risk among farmers (9, 15-18, 53).
Increasing years of farming and prostate cancer did not show any dose response
relationship (17, 67) thus supporting our results. Our results suggested that prostate cancer was
significantly associated with work place exposures such as insecticides and fungicides taken
together; and exposure to radiation. With regards to occupational exposures to pesticides and
radiation our findings were similar to other studies (19-23).
Many factors could possibly provide explanation for these inconsistencies in results. A
review by Gulden and Vogelzang (18) suggested that difference in farming practices among
countries and even regions could change the nature and intensity of exposure. They also
suggested that some studies tended to misclassify cases that previously held farming occupation
as non-farmers. However in the current study, participants who "ever had a farming job" during
their lifetime were considered as farmers. Another possibility is the inclusion of African
Americans in previous studies.
Occupation and lifestyle (including diet) of an individual have been linked (15). This may
contribute to these differences in results. As cited by Parent and Siemiatycki (15), Iowa farmers
had different lifestyles including smoking, alcohol drinking and consumption of calories etc. as
compared to non-farmers. Therefore, researchers suggested considering lifestyle as a
confounding issue to farming occupation to estimate the risk of prostate cancer. In our analyses,
we adjusted for many confounders.
The use of agricultural chemicals is suspected to be carcinogenic in some previous studies
(19-22). Chemical compounds including methyl bromide, organochlorine and cadmium are
suggested to have a biologic role in prostate carcinogenesis (21-22). For instance, cadmium that
is used as an active ingredient in pesticides intervenes with the ability of human body to absorb
zinc whose adequate levels in the body are considered to have a protective effect against prostate
cancer (68). Cadmium has the ability to pass through skin when it is exposed to contaminated
soil and water. Exposure to pesticides is associated with farming occupation. In the current
study, it was surprising to observe that the work place exposure to insecticides and fungicides
had an association with prostate cancer but farming job did not. It may suggest that specific
chemical compounds in insecticides and fungicides may have contributed to the increased risk of
63

prostate cancer. Even though exposure to radiation was observed to be associated with prostate
cancer, it cannot be confirmed as to what specific kinds of radiation these men were exposed to
at their work place that increased the risk of prostate cancer. Outdoor workers such as farmers,
mechanics, gardeners, roofers, construction workers and laborers are exposed to Ultraviolet (UV)
radiations (69). These UV rays coming from the Sun, welding torches and hot metal operations
have enough energy to destroy DNA (deoxyribonucleic acid) cells and to cause cancer (70).
The current study also assessed the relationship between household pesticide application
and prostate cancer. This relationship was not statistically significant at the univariate level thus
it did not progress to the multivariate stage. Also, household musty smell, despite contributing
significantly in the univariate analysis did not contribute significantly to the prediction of
prostate cancer in multivariate analysis when adjusting for others set of variables.
The source of drinking water was observed to be associated with residence and prostate
cancer. It suggests that people residing on farms use wells as their major source of drinking
water. It is well known (71) that on farms when pesticides are applied on fields, it gets absorbed
by ground soil and eventually ends up in ground water making it contaminated for farm residents
who rely on wells for drinking purposes.
In conclusion, our hypothesis that rural exposures (occupational i.e. farming and
environmental) were associated with prostate cancer in rural dwelling men of Saskatchewan was
supported by our results.
It is known that cigarette smoke contains several carcinogens (27). Chemical compounds
such as polycyclic aromatic hydrocarbons, heterocyclic aromatic amines, and nitrosamine
through cigarette smoke could promote carcinogenesis in the prostate (72). Smoking may
influence the hormonal factors in a human body. An increased level of hormones (androsterone
and testosterone) in male smokers was found to increase the risk of prostate cancer (73). Besides,
cigarette smokers have lower insulin-like growth factor (IGF)-I and IGF binding protein-3
(IGFBP-3) serum concentrations that are associated with prostate cancer (74-75). Our study also
investigated the association between household smoke, personal smoking history of an individual
and prostate cancer. Our results indicated that the risk of prostate cancer for farm and non-farm
residents depend on whether they ever smoked or not. In other words it can be said that ever
smokers who resided on a farm were at a higher risk than non-farm residents. Similarly, with
increasing smoking pack years exposure (< 15 pack years and ≥ 15 and < 25 pack years) risk also
64

increased among farm residents, although the risk increased and then decreased with the duration
of pack years indicating a healthy survivor effect. It may suggest that the men who smoked ≥ 25
pack years were much healthier and their genetic constitution made them less susceptible to
prostate cancer or the effects of smoking. They may also have a healthier lifestyle that promotes
healthier levels of hormones thus reducing risk of cancer (76).
We hypothesized that the exposure to personal smoking and pack years would be
associated with prostate cancer. Our data supported this hypothesis and showed an increased risk
among smokers residing on a farm. The current study suggested that personal smoking history
may not be independently associated with prostate cancer. However, it was an effect modifier
meaning increased the risk of prostate cancer for those who lived on farm but not non-farm
dwellers. The results from the current study were similar to other studies (27, 30) indicating an
association between smoking and prostate cancer but were different from some other studies (28,
29). Another study also showed a dose-response relationship between smoking intensity and risk
of prostate cancer (30). Some of the reasons to observe these differences in reported findings
could be the differences in study populations. Firstly, the SRHS study included a population
from Saskatchewan; Canada (developed country) that is known to be a high risk population.
However, one of the studies (28) included Singapore Chinese population known to be a low risk
population. Secondly, the Singapore study was a prospective study that included non-cases at the
baseline and followed them over time whereas the current study was a cross-sectional study and
the participants already had prostate cancer at the time of data collection. Thirdly, the Chinese
cohort included men aged 45-74 years as compared to the current study that included men aged
older than 45 years. Moreover the Chinese cohort appeared to include urban men as well
whereas the current study included a rural population only. Another study was focused on US
veterans aged 31-84. These differences in population characteristics could also result in
difference in study findings (29).
Cancer can be caused by abnormal functioning of the gene (pieces of DNA) that passes
from one generation to another through egg or sperm (77). Other known risk factors of primary
interest for prostate cancer (i.e. age of an individual and family history of cancer) were
investigated. Age showed a consistent and strong association with the outcome confirming that
men who were older than 65 years of age were at an increased risk of prostate cancer. The results
also indicated that family history of cancer was associated with the outcome of interest. Family
65

history of cancer significantly modified the relationship between residence and prostate cancer. It
was observed that among men who had a family history of one cancer, farm residents were at a
higher risk of prostate cancer than non-farm residents. Thus, our results supported the hypothesis
that age of an individual and family history of cancer is associated with prostate cancer in rural
dwelling men of Saskatchewan. The increase in risk of prostate cancer among men with a
positive family history of cancer was also observed in some other studies (78-79). It was
observed that men with a family history of any cancer in first degree male relatives were more
likely to be at increased risk (78). In another study conducted in Shanghai, similar trends of an
increased risk for prostate cancer was observed in men whose first degree relatives had any
cancer (79). An Italian study also observed that in first degree relatives, family history of cancer
at all sites was related to risk of prostate cancer (80). However, some studies were unable to find
such associations (81-82). The inconsistency between studies may result from differences in
study populations and their genetic constitution.
Other variables were also included in the analysis as confounders. Our findings were
consistent with other studies (83-84) investigating similar association and suggested that men
who had a history of cardiovascular disease were more at risk of prostate cancer. Men who were
either divorced or separated were at an increased risk of prostate cancer than married men (85).
5.2 Study Strengths and Limitations
5.2.1 Study Strengths
The current study determined the baseline prevalence and risk factors associated with
prostate cancer among rural dwelling men of Saskatchewan. Quantitative data obtained from the
survey questionnaires with the study participants were analyzed using sound statistical
techniques. The study has strengths that are worth mentioning. Our study was based on the
concept of the population health framework that was used successfully for a similar injury cohort
(86). The SRHS team was successful in collecting data on a large number of participants in a
rural setting using Dillman’s method. Detailed information on individual factors, household
factors and contextual factors including covariates was collected. The SRHS was able to collect
extensive information on lifetime occupational history, a variety of work-place exposures
including pesticides, smoking history and family history of cancer.
66

The study population was from all four quadrants of southern half of rural Saskatchewan
(North-East, South-East, North-West, and South-West) to best cover the possible geographical
areas of Saskatchewan. This reduced the possibility of bias that might have been introduced by
including one quadrant.
The SRHS used an interdisciplinary approach in which researchers from various
disciplines such as nursing, geography, medicine and epidemiology pooled their approaches and
expertise. In collaboration with rural municipality council members and small town council
members, the SRHS team held annual dissemination and planning meetings.
Self-administered mail surveys were used to collect the information from participants. An
adult member of the family was asked to provide all the individual and household details. A pilot
project was conducted to test the recruitment strategies and quality of baseline questionnaire for
the main study.
Our results provided a strong association (odds ratio) between risk factors and prostate
cancer. Exposure to smoking pack years showed a statistically significant dose-response
relationship. All our results were consistent with some but not all studies in given literature, were
plausible based on the current literature thus adding to it.
Apart from the causal explanations, our study attempted to reduce the possibility of
confounding by adjusting for number of other factors in the multivariate analysis. In order to
evaluate the role of chance on results, appropriate statistical tests were performed.
5.2.2 Study Limitations
There are also some limitations of this study. First the study population consisted of
approximately 97% Caucasians; hence despite ethnicity being an established risk factor for
prostate cancer, this link could not be investigated. An advantage of this was that confounding by
ethnic background was minimized.
With respect to external validity of the current study, findings should not be generalized to
an urban population since the population in this study consisted of rural residents. Also one
should keep in mind that the majority of the study population was Caucasians. However, we are
certain that the results can be generalized when compared to other parts of rural Canada where
farming practices and characteristics of the population are more or less similar to Saskatchewan.
67

The current study also could not confirm the pathology of the prostate cancer due to lack of
information.
The response rate of this study was approximately 42%. This can be considered a
moderate response rate. An increased number of participants would increase statistical power
allowing a better investigation of interactions. However, with this sample size, our study was still
able to examine the relationship between various risk factors, prostate cancer and the interactions
between them.
The current study was a cross sectional study and therefore, temporality could not be
established. There is also some concern of recall bias as the study questionnaires included
questions regarding the past exposures. However, because this was a secondary analysis of a
dataset aimed at investigating lung health, participants were not aware of the outcome of interest
we were interested in. Therefore, we assume that there was less chance of differential
misclassification by people inaccurately classifying their past exposure such as exposure to
pesticides, grain dust, wood dust and other occupational exposures.
With regards to work place exposure and outcome assessment, misclassification is likely
non-differential in this study of secondary analysis because participants asked to complete the
questionnaire had no knowledge regarding the outcome of interest i.e. prostate cancer. This type
of bias occurs at random and is known to have small effect on the true relationship of interest and
bias towards the null.
We were also interested in looking at the dose response relationship between prostate
cancer and the duration of years men were exposed to pesticides and radiation at work. Due to
the large missing values this link could not be investigated. However, the current study was able
to investigate such associations for history of personal smoking, smoking pack years and family
history of cancer.
5.3 Recommendations
The observational study design such as a cross-sectional design can only hypothesize the
relationship between a risk factor and outcome and cannot be used to establish causality;
therefore in the future, case-control and longitudinal study designs should be conducted. With a
small population in prostate cancer we were able to find some associations with certain
occupational exposures, family history of cancer and prostate cancer; however, to completely test
68

the results from the current study, a larger study with a large enough sample of prostate cancer
cases is required in future that would enable the researchers to test the hypothesis with adequate
statistical power.
As the majority of the sample population was Caucasian, a possible role of ethnicity could
not be investigated in this study, but given the importance of this risk factor in the literature we
would recommend to examine this association in a Saskatchewan population in future.
The Saskatchewan Rural Health Study was aimed to assess respiratory illnesses among a
rural population. Even though the risk factors that were hypothesized in the beginning of the
current study were available for this study, we would suggest to researchers to collect and
investigate the prostate cancer link exclusively focusing on it. This could be done in the data
collection phase. Another suggestion would be the use of some biological markers in order to
measure the exposure objectively allowing for accurate results.
A trend was observed for men having work place exposure to insecticides, fungicides and
radiation to have an increased risk of prostate cancer. Future studies should obtain detailed
information on types of chemical compounds used in such pesticides and different types of
radiations farmers are exposed to. This may provide a better link as to what chemical compounds
trigger the growth of the prostate cancer.
Personal smoking history acted as an effect modifier between residence and prostate
cancer. Ever smokers who lived on a farm were at an increased of prostate cancer. This indicates
that chemicals found in cigarette may interact with the chemicals present on farm due to
pesticide application. This potential link should be investigated in rural population as well as
general populations.
Health care utilization and its access could have an effect on the early diagnosis of prostate
cancer. Whether the population is rural or urban, they would have varied access to health care,
services and utilization. Population that do not regularly access these services are not availing
their chance of being diagnosed with the prostate cancer at an early stage. This could thus
underestimate the prevalence of prostate cancer. Future researchers should assess the potential
role of access to health care services in their study.
69

5.4 Conclusion
The results of the current study do not support a relationship between farming occupation,
farming duration, household pesticide application, household musty smell and prostate cancer.
However, there was statistically significant association that indicated that men who had work
place exposure to a combination of insecticides and fungicides; and radiation were at an
increased risk of prostate cancer than non-exposed men. Personal smoking history, smoking pack
years and family history of cancer modified the relationship between residence and prostate
cancer. Source of drinking water acted as a confounder between the primary relationship of farm
residence and prostate cancer. Age significantly contributed to the prevalence of prostate cancer.
Our study was able to identify the prevalence of prostate cancer and its potential risk
factors in rural men (older than 45 years) of Saskatchewan. The results may help research
professionals by directing the focus of their research towards rural population examining prostate
cancer.
70

REFERENCES
1. Canadian Cancer Society. What is prostate cancer? 2012; Available at:
http://www.cancer.ca/en/cancer-information/cancer-type/prostate/overview/?region=sk
Accessed 05/16, 2013.
2. Canadian Cancer Society. Prostate cancer statistics. 2012; Available at:
http://www.cancer.ca/en/cancer-information/cancer-type/prostate/statistics/?region=sk.
Accessed 05/16, 2013.
3. World Health Organization. Cancer fact sheet. 2012; Available at:
http://www.who.int/mediacentre/factsheets/fs297/en/. Accessed 05, 2012.
4. GLOBOCAN 2008 CANCER FACT SHEET. Prostate Cancer Incidence and Mortality
Worldwide in 2008. Available at: http://globocan.iarc.fr/factsheets/cancers/prostate.asp.
Accessed 05/10, 2012.
5. Ellison LF, Wilkins K. Canadian trends in cancer prevalence. Health Reports
2012;23(1):7.
6. Canadian Cancer Society. Cancer statistics for men in Saskatchewan. 2012; Available at:
http://www.cancer.ca/en/cancer-information/cancer-101/canadian-cancer-statistics-
publication/?region=sk. Accessed 05/16, 2012.
7. Grover SA, Coupal L, Zowall H, Rajan R, Trachtenberg J, Elhilali M, et al. The
economic burden of prostate cancer in Canada: forecasts from the Montreal Prostate
Cancer Model. Can Med Assoc J 2000;162(7):987-992.
8. Canadian Cancer Society. Canadian cancer statistics 2012. 2012; Available at:
http://www.cancer.ca/~/media/cancer.ca/CW/cancer%20information/cancer%20101/Cana
dian%20cancer%20statistics/Canadian-Cancer-Statistics-2012---English.pdf. Accessed
05/16, 2013.
9. Hsing AW, Chokkalingam AP. Prostate cancer epidemiology. Front Biosci
2006;11(12):1388-1413.
10. Grönberg H. Prostate cancer epidemiology. The Lancet 2003;361(9360):859-864
11. Crawford ED. Epidemiology of prostate cancer. Urology 2003 Dec 22;62(6 Suppl 1):3-
12.
71

12. Alexander DD, Mink PJ, Cushing CA, Sceurman B. A review and meta-analysis of
prospective studies of red and processed meat intake and prostate cancer. Nutrition
Journal 2010;9:50.
13. Kristal AR, Arnold KB, Neuhouser ML, Goodman P, Platz EA, Albanes D, et al. Diet,
supplement use, and prostate cancer risk: results from the prostate cancer prevention trial.
Am J Epidemiol 2010 Sep 1;172(5):566-577.
14. Raimondi S, Mabrouk JB, Shatenstein B, Maisonneuve P, Ghadirian P. Diet and prostate
cancer risk with specific focus on dairy products and dietary calcium: a case-control
study. Prostate 2010 Jul 1;70(10):1054-1065.
15. Parent, M. E., Siemiatycki, J. (2001). Occupation and prostate cancer. Epidemiologic
Review, 23(1) 138-143
16. Sass-Kortsak AM, Purdham JT, Kreiger N, Darlington G, Lightfoot NE. Occupational
risk factors for prostate cancer. Am J Ind Med 2007 Aug;50(8):568-576.
17. Aronson KJ, Siemiatycki J, Dewar R, Gérin M. Occupational risk factors for prostate
cancer: results from a case-control study in Montreal, Quebec, Canada. Am J Epidemiol
1996;143(4):363-373.
18. Van der Gulden J, Vogelzang P. Farmers at risk for prostate cancer. Br J Urol
1996;77(1):6-14.
19. Parent, M. E., Desy, M., Siemiatycki, J. (2009). Does exposure to agricultural chemicals
increase the risk of prostate cancer among farmers? McGill Journal of Medicine, 12(1)
70-77.
20. Settimi L, Masina A, Andrion A, Axelson O. Prostate cancer and exposure to pesticides
in agricultural settings. International journal of cancer 2003;104(4):458-461.
21. Cockburn M, Mills P, Zhang X, Zadnick J, Goldberg D, Ritz B. Prostate cancer and
ambient pesticide exposure in agriculturally intensive areas in California. Am J
Epidemiol 2011;173(11):1280-1288.
22. Band PR, Abanto Z, Bert J, Lang B, Fang R, Gallagher RP, et al. Prostate cancer risk and
exposure to pesticides in British Columbia farmers. Prostate 2011 Feb 1;71(2):168-183.
23. Mink PJ, Adami HO, Trichopoulos D, Britton NL, Mandel JS. Pesticides and prostate
cancer: a review of epidemiologic studies with specific agricultural exposure information.
European Journal of Cancer Prevention 2008 Apr;17(2):97-110.
72

24. Coble J, Hoppin JA, Engel L, Elci OC, Dosemeci M, Lynch CF, et al. Prevalence of
exposure to solvents, metals, grain dust, and other hazards among farmers in the
Agricultural Health Study. J Expo Anal Environ Epidemiol 2002 Nov;12(6):418-426.
25. Fritschi L, Glass DC, Tabrizi JS, Leavy JE, Ambrosini GL. Occupational risk factors for
prostate cancer and benign prostatic hyperplasia: a case-control study in Western
Australia. Occupational & Environmental Medicine 2007 Jan;64(1):60-65.
26. Watters JL, Park Y, Hollenbeck A, Schatzkin A, Albanes D. Cigarette smoking and
prostate cancer in a prospective US cohort study. Cancer Epidemiology, Biomarkers &
Prevention 2009 Sep;18(9):2427-2435.
27. Huncharek M, Haddock KS, Reid R, Kupelnick B. Smoking as a risk factor for prostate
cancer: a meta-analysis of 24 prospective cohort studies. Am J Public Health 2010
Apr;100(4):693-701.
28. Butler LM, Wang R, Wong AS, Koh WP, Yu MC. Cigarette smoking and risk of prostate
cancer among Singapore Chinese. Cancer Causes & Control 2009 Dec;20(10):1967-
1974.
29. Rohrmann S, Genkinger JM, Burke A, Helzlsouer KJ, Comstock GW, Alberg AJ, et al.
Smoking and risk of fatal prostate cancer in a prospective U.S. study. Urology 2007
Apr;69(4):721-725.
30. Hsing AW, McLaughlin JK, Hrubec Z, Blot WJ, Fraumeni Jr JF. Tobacco use and
prostate cancer: 26-year follow-up of US veterans. Am J Epidemiol 1991;133(5):437-
441.
31. Kenfield SA, Stampfer MJ, Chan JM, Giovannucci E. Smoking and prostate cancer
survival and recurrence. JAMA: The Journal of the American Medical Association
2011;305(24):2548.
32. Gong Z, Agalliu I, Lin DW, Stanford JL, Kristal AR. Cigarette smoking and prostate
cancer-specific mortality following diagnosis in middle-aged men. Cancer Causes &
Control 2008 Feb;19(1):25-31.
33. Gann PH, Hennekens CH, Ma J, Longcope C, Stampfer MJ. Prospective study of sex
hormone levels and risk of prostate cancer. J Natl Cancer Inst 1996 Aug 21;88(16):1118-
1126.
73

34. Hsing AW. Hormones and prostate cancer: what's next? Epidemiol Rev 2001;23(1):42-
58.
35. Hsing AW. Hormones and prostate cancer: where do we go from here?. J Natl Cancer
Inst 1996 Aug 21;88(16):1093-1095.
36. Coory MD, Baade PD. Urban-rural differences in prostate cancer mortality, radical
prostatectomy and prostate-specific antigen testing in Australia. Med J Aust
2005;182(3):112-115.
37. Statistics Canada. Population, urban and rural, by province and territory- Saskatchewan,
census of population 1851-2006. 2009; Available at: http://www.statcan.gc.ca/tables-
tableaux/sum-som/l01/cst01/demo62i-eng.htm. Accessed 05/11, 2012.
38. Statistics Canada. Population, urban and rural, by province and territory - Canada, census
of population 1851-2006. 2009; Available at: http://www.statcan.gc.ca/tables-
tableaux/sum-som/l01/cst01/demo62a-eng.htm. Accessed 05/11, 2012.
39. Baade PD, Youlden DR, Krnjacki LJ. International epidemiology of prostate cancer:
geographical distribution and secular trends. Molecular nutrition & food research
2009;53(2):171-184.
40. Quinn M, Babb P. Patterns and trends in prostate cancer incidence, survival, prevalence
and mortality. Part I: international comparisons. BJU Int 2002;90(2):162-173.
41. Quon H, Loblaw A, Nam R. Dramatic increase in prostate cancer cases by 2021. BJU Int
2011.
42. Canadian Cancer Society. Risk factors for prostate cancer. 2012; Available at:
http://www.cancer.ca/en/cancer-information/cancer-type/prostate/risks/?region=sk
Accessed 05/016, 2013.
43. Sass-Kortsak AM, Purdham JT, Kreiger N, Darlington G, Lightfoot NE. Occupational
risk factors for prostate cancer. Am J Ind Med 2007 Aug;50(8):568-576.
44. Hsing AW, Tsao L, Devesa SS. International trends and patterns of prostate cancer
incidence and mortality. International journal of cancer 2000;85(1):60-67.
45. Fradet Y, Klotz L, Trachtenberg J, Zlotta A. The burden of prostate cancer in Canada.
Canadian Urological Association Journal 2009;3(3 Suppl 2):S92.
74

46. Lin DW, Porter M, Montgomery B. Treatment and survival outcomes in young men
diagnosed with prostate cancer: a Population-based Cohort Study. Cancer 2009 Jul
1;115(13):2863-2871.
47. United States National Institute of Health. National Cancer Institute Surveillance
Epidemiology and End Results (SEER) data. 2012; Available at:
http://www.seer.cancer.gov/statfacts/html/prost.html. Accessed 07/13, 2012.
48. Gann PH. Risk factors for prostate cancer. Reviews in urology 2002;4(Suppl 5):S3.
49. Bostwick DG, Burke HB, Djakiew D, Euling S, Ho S, Landolph J, et al. Human prostate
cancer risk factors. Cancer 2004;101(S10):2371-2490.
50. Bratt O. Hereditary prostate cancer: clinical aspects. J Urol 2002;168(3):906-913.
51. Ghadirian P, Howe G, Hislop T, Maisonneuve P. Family history of prostate cancer: a
multi-center case-control study in Canada. International journal of cancer
1997;70(6):679-681.
52. Whittemore AS, Wu AH, Kolonel LN, John EM, Gallagher RP, Howe GR, et al. Family
history and prostate cancer risk in black, white, and Asian men in the United States and
Canada. Am J Epidemiol 1995 Apr 15;141(8):732-740.
53. Buxton JA, Gallagher RP, Le ND, Band PR, Bert JL. Occupational risk factors for
prostate cancer mortality in British Columbia, Canada. Am J Ind Med 1999;35(1):82-86.
54. Pahwa P, Karunanayake CP, Hagel L, Janzen B, Pickett W, Rennie D, et al. The
Saskatchewan rural health study: an application of a population health framework to
understand respiratory health outcomes. BMC research notes 2012;5(1):400.
55. Dillman DA. Mail and internet surveys: the tailored design method. 2nd ed. New York:
Wiley & Sons Inc; 2000.
56. Pahwa P, Karunanayake C, Hagel L, Janzen B, Rennie D, Lawson J, Pickett W, Dosman
JA. Self-Selection Bias in an Epidemiological Study of Respiratory Health of a Rural
Population. Submitted to Journal of Agromidicine 2012; 17(3): pp.1-10.Health Canada.
Strategies for Population Health: Investing in the Health of Canadians. 1994; Available
at: http://www.phac-aspc.gc.ca/ph-sp/pdf/strateg-eng.pdf. Accessed 05/11, 2012.
57. Health Canada. Strategies for Population Health: Investing in the Health of Canadians.
1994; Available at: http://www.phac-aspc.gc.ca/ph-sp/pdf/strateg-eng.pdf. Accessed
05/11, 2012.
75
58. Statistics Canada National Population Health Survey Household Component:
Documentation for the Derived Variables and the Constant LongitudinalVariables..
Available at http://www.statcan.gc.ca/imdb-bmdi/document/3225_D10_T9_V3-eng.pdf.
Accessed 15/11, 2012.
59. Schlesselman JJ, Stolley PD. Case control studies :design, conduct, analysis. New York:
Oxford University Press; 1982.
60. Statistics Canada 2007. Industry Classification Coding System (ICCS) Version 1.4,
(NAICS 2007). Available at http://www.statcan.gc.ca/subjects-sujets/standard-
norme/naics-scian/2007/list-liste-eng.htm [ Accessed on Nov 29, 2010].
61. Statistics Canada. National Occupational Classification - Statistics (NOC-S) 2006. 2011;
Available at: http://www.statcan.gc.ca/subjects-sujets/standard-norme/soc-
cnp/2006/noc2006-cnp2006-menu-eng.htm. Accessed 07/03, 2013.
62. Government of Saskatchewan. Minimum age of employment. Available at:
http://www.lrws.gov.sk.ca/minimum-age-employment. Accessed 07/03, 2013.
63. Ewings P, Bowie C. A case-control study of cancer of the prostate in Somerset and east
Devon. Br J Cancer 1996;74(4):661.
64. Elghany NA, Schumacher MC, Slattery ML, West DW, Lee JS. Occupation, cadmium
exposure, and prostate cancer. Epidemiology 1990;1(2):107-115.
65. Le Marchand L, Kolonel LN, Yoshizawa CN. Lifetime occupational physical activity and
prostate cancer risk. Am J Epidemiol 1991;133(2):103-111.
66. Pearce NE, Sheppard RA, Fraser J. Case-control study of occupation and cancer of the
prostate in New Zealand. J Epidemiol Community Health 1987;41(2):130-132.
67. Meyer TE, Coker AL, Sanderson M, Symanski E. A case–control study of farming and
prostate cancer in African-American and Caucasian men. Occup Environ Med
2007;64(3):155-160.
68. Prostate cancer treatment guide. Prostate cancer risk and occupation. Available at:
http://www.prostate-cancer.com/occupation-prostate-cancer.html. Accessed 09/30, 2013.
69. National Institute for Occupational Safety and Health (NIOSH). Hazards to outdoor
workers. Available at: http://www.cdc.gov/niosh/topics/outdoor/. Accessed 07/12, 2013.
76

70. American Cancer Society. Radiation Exposure and Cancer. Available at:
http://www.cancer.org/cancer/cancercauses/othercarcinogens/medicaltreatments/radiation
-exposure-and-cancer. Accesses 07/12. 2013.
71. Jamieson A, Beaton Denise. OMAFRA Factsheet, Pesticide Contamination of Farm
Water Supplies. Available at: http://www.omafra.gov.on.ca/english/engineer/facts/10-
097.htm. Accessed 07/12, 2013.
72. Hecht SS. Cigarette smoking: cancer risks, carcinogens, and mechanisms. Langenbeck's
Archives of Surgery 2006;391(6):603-613.
73. DAI WS, GUTAI JP, KULLER LH, CAULEY JA. Cigarette smoking and serum sex
hormones in men. Am J Epidemiol 1988;128(4):796-805.
74. Renehan AG, Zwahlen M, Minder C, O'Dwyer ST, Shalet SM, Egger M. Insulin-like
growth factor (IGF)-I, IGF binding protein-3, and cancer risk: systematic review and
meta-regression analysis. The Lancet 2004;363(9418):1346-1353.
75. Roddam AW, Allen NE, Appleby P, Key TJ, Ferrucci L, Carter HB, et al. Insulin-like
growth factors, their binding proteins, and prostate cancer risk: analysis of individual
patient data from 12 prospective studies. Ann Intern Med 2008;149(7):461-471.
76. Collins K. Cancer Risk & Your Genes: Can lifestyle trump inheritance? Available at:
http://www.karencollinsnutrition.com/smartbytes/2013/03/19/cancer-risk-your-genes-
can-lifestyle-trump-inheritance/. Accessed 07/12, 2013.
77. American Cancer Society. Heredity and cancer. 2013; Available at:
http://www.cancer.org/cancer/cancercauses/geneticsandcancer/heredity-and-cancer.
Accessed 07/01, 2013.
78. Sridhar G, Masho SW, Adera T, Ramakrishnan V, Roberts JD. Association between
family history of cancers and risk of prostate cancer. Journal of Men's Health
2010;7(1):45-54.
79. Bai Y, Gao Y, Deng J, Sesterhenn I, Fraumeni J, Hsing A. Risk of prostate cancer and
family history of cancer: a population-based study in China. Prostate cancer and prostatic
diseases 2005;8(1):60-65.
80. Negri E, Pelucchi C, Talamini R, Montella M, Gallus S, Bosetti C, et al. Family history
of cancer and the risk of prostate cancer and benign prostatic hyperplasia. International
Journal of Cancer 2005;114(4):648-652.
77

81. Bratt O, Kristoffersson U, Lundgren R, Olsson H. The risk of malignant tumours in first-
degree relatives of men with early onset prostate cancer: a population-based cohort study.
Eur J Cancer 1997;33(13):2237-2240.
82. Verhage BA, Aben KK, Witjes JA, Straatman H, Schalken JA, Kiemeney LA. Site
specific familial aggregation of prostate cancer. International journal of cancer
2004;109(4):611-617.
83. Thomas J, Gerber L, Bañez LL, Moreira DM, Rittmaster RS, Andriole GL, et al. Prostate
cancer risk in men with baseline history of coronary artery disease: results from the
REDUCE study. Cancer Epidemiology Biomarkers & Prevention 2012;21(4):576-581.
84. Neugut AI, Rosenberg DJ, Ahsan H, Jacobson JS, Wahid N, Hagan M, et al. Association
between coronary heart disease and cancers of the breast, prostate, and colon. Cancer
Epidemiology Biomarkers & Prevention 1998;7(10):869-873.
85. Nilsen TL, Johnsen R, Vatten LJ. Socio-economic and lifestyle factors associated with
the risk of prostate cancer. Br J Cancer 2000;82(7):1358.
86. Pickett W, Day L, Hagel L, Brison RJ, Marlenga B, Pahwa P, et al. The Saskatchewan
farm injury cohort: rationale and methodology. Public Health Rep 2008;123(5):567.
78

Appendix A: Survey Questionnaire
79

4352HB_Health_survey_Q6 1/25/10 2:26 PM Page i
80

4352HB_Health_survey_Q6 1/25/10 2:26 PM Page ii
81

4352HB_Health_survey_Q6 1/25/10 2:26 PM Page 1 SECTION A YOUR HOME
PLEASE ANSWER THE FOLLOWING QUESTIONS ABOUT YOUR PRIMARY FAMILY HOME - THAT IS
THE HOME WHERE YOU LIVE MOST OF THE TIME.
Today’s Date: _____/______/_____
(Day / Month / Year)
DEMOGRAPHICS A-1 Where is your home located? c Farm c In town c Acreage, please specify number of acres _______
A-2 How many people live in your home? _____ Number A-3 Please list all persons who usually live here
including yourself.
Age Sex Family Member
M c F c Yes c No c
M c F c Yes c No c
M c F c Yes c No c
M c F c Yes c No c
M c F c Yes c No c
M c F c Yes c No c
(IF MORE SPACES ARE REQUIRED CONTINUE ON
THE BACK OF THE QUESTIONNAIRE.) A-4 How many bedrooms do you have in your home?
_____ Number A-5 Do you own your home?
c Yes
c No c Don’t know
LIVING ENVIRONMENT A-6 What year was your residence/apartment built
(approximately)?
Year_____________ Don’t know c
A-7 What are the types of fuel sources used to heat
your home? Please check all that apply. Primary Secondary
c Natural Gas c c
c Propane c c
c Electricity c c
c Fuel oil c c
c Coal c c
c Geo-thermal c c
c Solar energy c c
c Wood c c
➥ If yes, do you use: c Fireplace c Free standing wood stove c Fireplace insert c Outdoor wood stove
c Other c c Please specify __________________________
c Don’t Know
A-8 Does your heating system have a filter? c Yes c No
c Don’t Know
A-9 Does your home have air conditioning? c Yes → If yes, please check one: c Central c Room c Both c No
c Don’t Know
A-10 Is a humidifier or vaporizer used in your home? c Yes c No
c Don’t Know A-11 Do you use a dehumidifier in your home?
c Yes
c No c Don’t Know
A-12 On average, how often per month:
do you vacuum carpet? ____ times per month do you mop smooth floors? ____ times per month
do you dry dust clean? _____ times per month do
you wet dust clean? _____ times per month
A-13 During the past 12 months, has there been water
or dampness in your home from broken pipes, leaks, heavy rain, or floods?
c Yes
c No c Don’t Know
Yo
ur
Ho
me
YOUR HOME 1
82

4352HB_Health_survey_Q6 1/25/10 2:26 PM Page 2
Yo
ur H
om
e
A-14 Does your home (including basement) frequently
have a mildew odor or musty smell? c Yes
c No c Don’t Know
A-15 In the past 12 months have you had any of the
following pets living in your home? Please check Yes or No for each type of pet.
c Check here if you do not have any pets in
the house. Yes No Don’t Know Cat c c c Dog c c c Bird c c c Any other pet c c c
If Yes, please specify _______________
A-16 Within the past 12 months, were pesticides
(including herbicides, insecticides, fungicides, rodenticides, fumigants) applied inside your residence (e.g., raid, spider bait, ant bait, rat bait)?
c Yes → If Yes, what pesticide(s)? Please specify_______________________ c No
c Don’t Know
A-17 Do any of the people who live in your house use
any of the following tobacco products in the
home? Please answer Yes or No for each
product. Yes No Don’t Know Cigarettes c c c Cigars c c c Pipes c c c
A-18 If yes to cigarettes, how many persons smoke
cigarettes in your home? _____ number of persons
A-19 If yes to cigarettes, how many cigarettes do
they smoke per day in total? _____ number of cigarettes
A-20 What is your best estimate of the total income, before taxes and deductions, of all household members from all sources in the past 12 months?
c Less than $14,999 c $15,000 to $19,999 c $20,000 to $29,999 c $30,000 to $39,999 c $40,000 to $49,999 c $50,000 to $59,999 c $60,000 to $79,999 c $80,000 or more
A-21 At the end of the month, how much money do
you have left over? (Please check only one)
c Some money c Just enough money c Not enough money
ACCESS TO HEALTH CARE
A-22 Do you and your family members in your household have access to a regular family doctor or nurse practitioner?
c Yes
c No c Don’t Know
A-23 In the past 12 months did you ever experience
any difficulties getting the routine or on-going care you or a family member in your household needed?
c Yes
c No c Don’t Know
A-24 In the past 12 months, have you required a visit
to a medical specialist for a diagnosis or consultation for yourself or a family member in your household?
c Yes c No → If No, go to question A-28. c Don’t Know
A-25 In the past 12 months did you ever experience any
difficulty getting the specialist care you needed for a diagnosis or consultation for yourself or
acfamily member in your household?
c
c
2 YOUR HOME
Don’t Know No Yes
83

4352HB_Health_survey_Q6 1/25/10 2:26 PM Page 3 A-26 In the past 12 months, have you or a family
member in your household required immediate 24 hour health care services for a medical emergency?c
Yes
c No → If No, go to question A-30. c Don’t know
A-27 In the past 12 months, did you ever experience
any difficulties getting immediate 24 hour health care services for a medical emergency for
yourselfc or a family member in your household? Yes
c No
c Don’t know A-28 How far do you travel to receive routine and
ongoing medical care?______ Km A-29 How far do you travel to receive 24 hour
emergency health care services?______ Km A-30 How far do you travel to receive medical or
surgical specialist services?______ Km A-31 On average, how long does it take for an
ambulance to arrive at your home in an emergency? _______minutes c Don’t Know
OUTDOOR ENVIRONMENT A-32 Do you have an indoor (barn) intensive livestock
operation (building) located near your home? c Yes → If Yes, how far?
c Within 1/4 mile c Greater than 1/4 mile c No
c Don’t know
A-33 Do you have an outdoor feedlot or corrals located
near your home? c Yes → If Yes, how far?
c Within 1/4 mile c Greater than 1/4 mile c No
c Don’t know
A-34 Do you have a balestack or bales located near
your home? c Yes → If Yes, how far?
c Within 1/4 mile c Greater than 1/4 mile c No
c Don’t know
A-35 Do you have grain bins located near your home?
c Yes → If Yes, how far? c Within 1/4 mile c Greater than 1/4 mile
c No c Don’t know
A-36 Do you have a sewage pond or manure lagoon located near your home?
c Yes → If Yes, how far? c Within 1/4 mile c Greater than 1/4 mile
c No c Don’t know
A-37 What is the main source of the water supply for
drinking purposes in your home?
c Bottled water c Deep well water (more than 100 ft) c Shallow well water (less than 100 ft) c Spring, river or creek c Dugout, reservoir c Lake c Other source:
Please specify_____________________
PLEASE COMPLETE THIS SECTION IF YOU LIVE ON A FARM.
FARM DEMOGRAPHICS
A-38 From the list below, please check each commodity that is produced for sale on your farm or ranch (Please check all that apply).
c Grain crops c Cattle (beef) c Cattle (dairy) c Pigs c Poultry c Vegetable/Fruit c Other:
Please specify_____________________
A-39 What is the area of land in your operation that
you farmed or ranched last growing season? (Please exclude land rented to others).
Grain crops ___ acres Forage crops ___ acres Pasture ___ acres Summerfallow ___ acres Other ___ acres
A-40 How many of these types of livestock are typically
raised on your farm?
No livestock c Cattle (beef) ____ number Cattle (dairy) ____ number Pigs ____ number Poultry ____ number Other ____ number
THIS CONCLUDES SECTION A. PLEASE
PROCEED TO SECTION B, ADULT 1(GREEN TAB).
Yo
ur
Ho
me
YOUR HOME 3
84

4352HB_Health_survey_Q6 1/25/10 2:26 PM Page 4 A
du
lt 1
SECTION B INDIVIDUAL QUESTIONS WE WOULD LIKE TO KNOW ABOUT EACH ADULT
FAMILY MEMBER (18 YEARS OR OVER) LIVING
IN YOUR HOUSEHOLD. IN THIS BOOKLET, WE
HAVE INCLUDED SPACE FOR 2 ADULTS.
IF YOU HAVE MORE THAN 2 ADULT FAMILY
MEMBERS LIVING IN YOUR HOME, PLEASE
COMPLETE “Section B” IN THE GREEN
BOOKLET FOR EACH ADDITIONAL ADULT.
ADULT 1
NOW, PLEASE ANSWER THE FOLLOWING
QUESTIONS ABOUT ADULT # 1.
B-1 Age as of January 1st
, 2010: __________ B-2 Date of birth: MM______ DD____ YY_______ B-3 Sex: Male c Female c B-4 Highest level of education:
c Less than high school c Completed high school c Completed university c Completed post-secondary education
other than above B-5 What is your ethnic background?
c Caucasian c First Nation c Metis c Other → Please specify: ____________
B-6 What is your height? _____cm. OR ______ft and in.
B-7 What is your weight? _______Kg. OR ______lbs B-8 What is your marital status? (Please check only one)
c Married c Common law/living together c Widowed c Divorced/separated c Single, never married
RESPIRATORY HEALTH
COUGH B-9 Do you usually have a cough?
c Yes c No → If no, go to question B-12.
B-10 Do you usually cough like this on most days for
3 consecutive months or more during the year? c Yes
c No
B-11 For how many years have you had this cough?
_____ years PHLEGM
B-12 Do you usually bring up phlegm from your chest? c Yes
c No → If no, go to question B-15. B-13 Do you bring up phlegm like this on most days for
3 consecutive months or more during the year? c Yes
c No
B-14 For how many years have you had trouble with
phlegm? _____ years
WHEEZE B-15 Does your chest ever sound wheezy or whistling:
Yes No 1. When you have a cold? c c 2. Apart from colds? c c
3. Most days or nights? c c
If YES to 1, 2, OR 3, for how many years has this
been present? ______________number of years B-16 Have you ever had an attack of wheezing that
has made you feel short of breath? c Yes
c No
If YES, have you ever required medicine or treatment for the(se) attack(s)?
c Yes
c No BREATHLESSNESS B-17 Are you troubled by shortness of breath when
hurrying on the level or walking up a slight hill? c Yes
c No
B-18 Do you have to walk slower than people of your
age because of breathlessness? c Yes
c No
B-19 Do you ever have to stop for breath when walking
at your own pace on the level? c Yes
c No
4 ADULT 1
85

4352HB_Health_survey_Q6 1/25/10 2:26 PM Page 5 B-20 Do you ever have to stop for breath after walking
about 100 yards (or after a few minutes) on the level?
c Yes
c No B-21 Are you too breathless to leave the house or
breathless on dressing or undressing? c Yes
c No
ASTHMA B-22 Have you ever had asthma? c
Yes c No → If no, go to question B-26.
B-23 If Yes to B-22:
Do you still have it? c Yes c No Was it confirmed by a doctor? c Yes c No At what age did it start? ____ age in years
If you no longer have it, at what age did it stop? ____ age in years
B-24 If yes to B-22, how many times have you
required services for asthma from the following
places during the past 12 months?
Hospital inpatient: _________ times
Emergency room outpatient: _________ times
Doctor’s office: _________ times B-25 If yes to B-22, which of the following statements
best describes your asthma medication use in the past 12 months:
c Never in the past 12 months c At least once in the past 12 months c At least once per month c At least once per week c Every day
ALLERGIES
B-26 Have you ever had an allergic reaction to any of
the following: (Please check all that apply). 1. House dust c Yes c No 2. Cats c Yes c No 3. Dogs c Yes c No 4. Grasses c Yes c No 5. Pollens c Yes c No 6. Molds c Yes c No 7. Others, c Yes c No
Please specify:_____________________
PHYSICAL ACTIVITY
B-27 Do you exercise? c Yes → If yes, how many times a week?
_____times a week
c No → If no, go to question B-29.
B-28 How long do you usually exercise? c Less than 15 minutes c 15 to 30 minutes c 31 to 60 minutes c More than 60 minutes c Don’t Know
B-29 In a typical week in the past 3 months, how much time did you usually spend on a computer, including playing computer games and using the Internet or World Wide Web? (Please do not include time spent at work or at school) c None c Less than 1 hour
c From 1 to 2 hours
c From 3 to 5 hours
c From 6 to 10 hours
c From 11 to 14 hours
c From 15 to 20 hours
c More than 20 hours B-30 In a typical week in the past 3 months, how
much time did you usually spend watching television or videos?
c None c Less than 1 hour c From 1 to 2 hours c From 3 to 5 hours c From 6 to 10 hours c From 11 to 14 hours c From 15 to 20 hours c More than 20 hours
EARLY LIFE EXPOSURES
B-31 Have you ever lived on a farm?
c Yes
c No c Don’t know
B-32 Did you live on a farm during your first year of
life?
c Yes → If yes, what type of farm? (Check all that apply) c Grain c Livestock
c No c Don’t know
B-33 Did your mother smoke while she was pregnant with you?
c Yes
c No c Don’t know
Ad
ult
1
ADULT 1 5
86
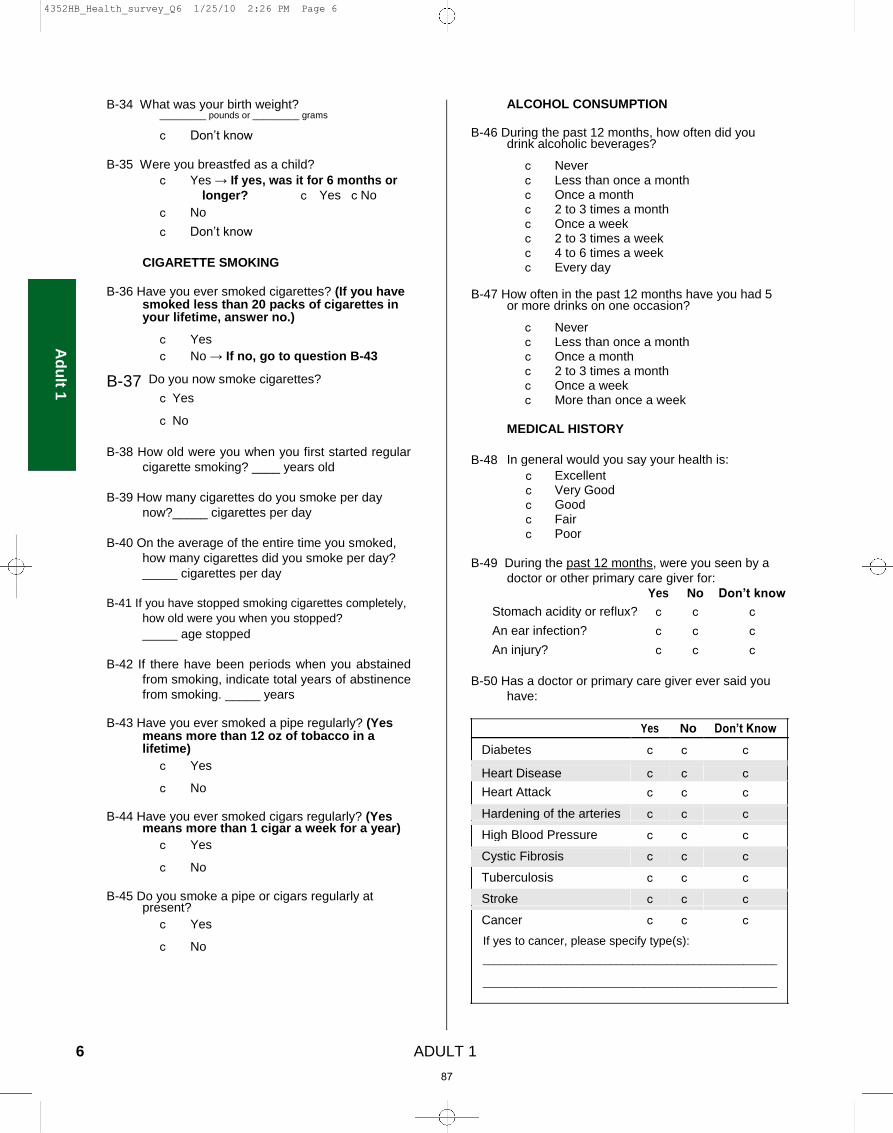
4352HB_Health_survey_Q6 1/25/10 2:26 PM Page 6 A
du
lt 1
B-34 What was your birth weight?
_________ pounds or _________ grams
c Don’t know B-35 Were you breastfed as a child?
c Yes → If yes, was it for 6 months or longer? c Yes c No
c No
c Don’t know
CIGARETTE SMOKING B-36 Have you ever smoked cigarettes? (If you have
smoked less than 20 packs of cigarettes in your lifetime, answer no.)
c Yes c No → If no, go to question B-43
B-37 Do you now smoke cigarettes? c Yes
c No
B-38 How old were you when you first started regular
cigarette smoking? ____ years old B-39 How many cigarettes do you smoke per day
now?_____ cigarettes per day B-40 On the average of the entire time you smoked,
how many cigarettes did you smoke per day? _____ cigarettes per day
B-41 If you have stopped smoking cigarettes completely,
how old were you when you stopped? _____ age stopped
B-42 If there have been periods when you abstained
from smoking, indicate total years of abstinence
from smoking. _____ years B-43 Have you ever smoked a pipe regularly? (Yes
means more than 12 oz of tobacco in a lifetime)
c Yes
c No B-44 Have you ever smoked cigars regularly? (Yes
means more than 1 cigar a week for a year) c Yes
c No
B-45 Do you smoke a pipe or cigars regularly at
present? c Yes
c No
ALCOHOL CONSUMPTION B-46 During the past 12 months, how often did you
drink alcoholic beverages?
c Never c Less than once a month c Once a month c 2 to 3 times a month c Once a week c 2 to 3 times a week c 4 to 6 times a week c Every day
B-47 How often in the past 12 months have you had 5
or more drinks on one occasion?
c Never c Less than once a month c Once a month c 2 to 3 times a month c Once a week c More than once a week
MEDICAL HISTORY
B-48 In general would you say your health is: c Excellent c Very Good c Good c Fair c Poor B-49 During the past 12 months, were you seen by a
doctor or other primary care giver for: Yes No Don’t know
Stomach acidity or reflux? c c c
An ear infection? c c c
An injury? c c c B-50 Has a doctor or primary care giver ever said you
have: Yes No Don’t Know
Diabetes c c c
Heart Disease c c c
Heart Attack c c c
Hardening of the arteries c c c
High Blood Pressure c c c
Cystic Fibrosis c c c
Tuberculosis c c c
Stroke c c c
Cancer c c c
If yes to cancer, please specify type(s):
_____________________________________________________
_____________________________________________________ 6 ADULT 1
87

4352HB_Health_survey_Q6 1/26/10 2:45 PM Page 7 CHEST ILLNESSES
B-51 Has a doctor ever said you had any of the following chest illnesses:
Chest Illness During the Past 12 Months Ever In Your Life
a.
Attack of bronchitis c Yes c No c Yes c No
b.
Pneumonia c Yes c No c Yes c No
c. Hay Fever c Yes c No c Yes c No
d.
Sinus Trouble c Yes c No c Yes c No
e. Chronic Bronchitis c Yes c No c Yes c No
f.
Emphysema c Yes c No c Yes c No
g. COPD (Chronic Obstructive Pulmonary Disease) c Yes c No c Yes c No
h.
Sleep Apnea c Yes c No c Yes c No
i. Other Chest Illness c Yes c No c Yes c No
(Example chest operation)
please specify: ___________________________________________ _____________________________________
B-52 If yes to Chronic Obstructive Pulmonary Disease (COPD) in question B-51g, how many times have you
required services for COPD from the following places during the past 12 months?
Hospital inpatient: _______ times
Emergency room outpatient: _______ times
Doctor’s office: _______ times
REST AND SLEEP
B-53 Do you snore?
c Yes
c No → If no, go to question B-55.
c Don’t know
B-54 If you snore, is your snoring:
c Slightly louder than breathing?
c As loud as talking?
c Louder than talking?
c Very loud - can be heard in adjacent rooms?
B-55 How likely are you to doze off or fall asleep in the situations described below, in contrast to just feeling tired? This
refers to your usual way of life in recent times. Even if you haven’t done some of these things recently, try to work
out how they would have affected you. Please check one response choice for each situation.
RESPONSE CHOICES
SITUATION Would never Slight chance of Moderate chance of High chance of doze dozing dozing dozing
Sitting and reading c c c c
Watching TV c c c c
Sitting inactive in a public place c c c c (e.g., a theatre or a meeting)
As a passenger in a car for an c c c c hour without a break
Lying down to rest in the afternoon c c c c when circumstances permit
Sitting and talking to someone c c c c
Sitting quietly after lunch c c c c without alcohol
In a car, while stopped for a c c c c few minutes in the traffic
Ad
ult
1
ADULT 1 7
88

4352HB_Health_survey_Q6 1/25/10 2:26 PM Page 8 A
du
lt 1
FAMILY HISTORY B-56 Have the following members of your biological family ever had: FATHER MOTHER BROTHER/SISTER
Yes
Don’t Don’t Don’t
No Know Yes No Know Yes No Know
Diabetes c c c c c c c c c
Heart Disease c c c c c c c c c
Heart Attack c c c c c c c c c
Hardening of the arteries c c c c c c c c c
High Blood Pressure c c c c c c c c c
Cystic Fibrosis c c c c c c c c c
Tuberculosis c c c c c c c c c
Stroke c c c c c c c c c
Lung Trouble c c c c c c c c c
(Asthma,Emphysema,
Chronic Bronchitis)
Cancer c c c c c c c c c
If yes to cancer,
please specify type(s): ______________ _____________ ____________
OCCUPATIONAL HISTORY
B-57 Please list all full-time jobs at which you have worked for at least one year, starting with your present or most
recent job. Please state the job title and business as specifically as possible. For example, ‘mixed farming’
instead of ‘farming’. Business, Industry Total number of
Job Title or Service Years at job
e.g. Nurse Health Care 10
e.g. Farmer Mixed Farming 30
8 ADULT 1
89

4352HB_Health_survey_Q6 1/25/10 2:26 PM Page 9 B-58 Have you ever been exposed to any of the following in the work place? How No Yes If Yes, how often? many years?
Grain Dust c c Daily c Weekly c Monthly c Occasionally c
Mine dust (e.g. potash, uranium) c c Daily c Weekly c Monthly c Occasionally c
Specify _______________
Asbestos dust c c Daily c Weekly c Monthly c Occasionally c
Wood dust c c Daily c Weekly c Monthly c Occasionally c
Other dust c c Daily c Weekly c Monthly c Occasionally c
Specify _______________
Livestock c c Daily c Weekly c Monthly c Occasionally c
Smoke from stubble burning c c Daily c Weekly c Monthly c Occasionally c
Diesel fumes c c Daily c Weekly c Monthly c Occasionally c
Welding fumes c c Daily c Weekly c Monthly c Occasionally c
Solvent fumes c c Daily c Weekly c Monthly c Occasionally c
Oil / Gas well fumes c c Daily c Weekly c Monthly c Occasionally c
Herbicides (to kill plants) c c Daily c Weekly c Monthly c Occasionally c
Fungicides (to treat grain) c c Daily c Weekly c Monthly c Occasionally c
Insecticides (to kill insects) c c Daily c Weekly c Monthly c Occasionally c
Molds c c Daily c Weekly c Monthly c Occasionally c
Radiation c c Daily c Weekly c Monthly c Occasionally c
Other, Specify _______________ c c Daily c Weekly c Monthly c Occasionally c
B-59 How often do you (did you) wear a dust mask when exposed to grain dust?
c Always c Most of the time c Sometimes c Never
B-60 We wish to find out more about respiratory health of rural people. Would you be willing to be contacted about having breathing and/or allergy tests at a nearby location?
c Yes
c No c I would like more information
IF THERE IS ONLY ONE ADULT IN YOUR FAMILY, PLEASE SKIP TO THE LAST PAGE.
IF THERE IS ANOTHER ADULT IN YOUR FAMILY, PLEASE CONTINUE ON THE NEXT PAGE.
REMEMBER TO COMPLETE THE CONTACT INFORMATION ON THE LAST PAGE!
(THIS INFORMATION WILL BE REMOVED FROM YOUR QUESTIONNAIRE TO ENSURE CONFIDENTIALITY.)
Ad
ult
1
ADULT 1 9
90

4352HB_Health_survey_Q6 1/25/10 2:26 PM Page 10
Ad
ult 2
SECTION B INDIVIDUAL QUESTIONS
ADULT 2
NOW, PLEASE ANSWER THE FOLLOWING
QUESTIONS ABOUT ADULT # 2.
B-1 Age as of January 1st
, 2010: __________ B-2 Date of birth: MM______ DD____ YY_______ B-3 Sex: Male c Female c B-4 Highest level of education:
c Less than high school c Completed high school c Completed university c Completed post-secondary education
other than above B-5 What is your ethnic background?
c Caucasian c First Nation c Metis c Other → Please specify: ____________
B-6 What is your height? _____cm. OR ______ft and in.
B-7 What is your weight? _______Kg. OR ______lbs B-8 What is your marital status? (Please check only one)
c Married c Common law/living together c Widowed c Divorced/separated c Single, never married
RESPIRATORY HEALTH
COUGH
B-9 Do you usually have a cough? c Yes c No → If no, go to question B-12. B-10 Do you usually cough like this on most days for
3 consecutive months or more during the year? c Yes
c No
B-11 For how many years have you had this cough?
_____ years
PHLEGM
B-12 Do you usually bring up phlegm from your chest? c Yes
c No → If no, go to question B-15. B-13 Do you bring up phlegm like this on most days for
3 consecutive months or more during the year? c Yes
c No
B-14 For how many years have you had trouble with
phlegm? _____ years
WHEEZE B-15 Does your chest ever sound wheezy or whistling:
Yes No 1. When you have a cold? c c 2. Apart from colds? c c
3. Most days or nights? c c
If YES to 1, 2, OR 3, for how many years has this
been present? ______________number of years B-16 Have you ever had an attack of wheezing that
has made you feel short of breath? c Yes
c No
If YES, have you ever required medicine or treatment for the(se) attack(s)?
c Yes
c No BREATHLESSNESS B-17 Are you troubled by shortness of breath when
hurrying on the level or walking up a slight hill? c Yes
c No
B-18 Do you have to walk slower than people of your
age because of breathlessness? c Yes
c No
B-19 Do you ever have to stop for breath when walking
at your own pace on the level? c Yes
c No
10 ADULT 2
91

4352HB_Health_survey_Q6 1/25/10 2:26 PM Page 11 B-20 Do you ever have to stop for breath after walking
about 100 yards (or after a few minutes) on the level?
c Yes
c No B-21 Are you too breathless to leave the house or
breathless on dressing or undressing? c Yes
c No
ASTHMA B-22 Have you ever had asthma? c
Yes c No → If no, go to question B-26.
B-23 If Yes to B-22:
Do you still have it? c Yes c No Was it confirmed by a doctor? c Yes c No At what age did it start? ____ age in years
If you no longer have it, at what age did it stop? ____ age in years
B-24 If yes to B-22, how many times have you
required services for asthma from the following
places during the past 12 months?
Hospital inpatient: _________ times
Emergency room outpatient: _________ times
Doctor’s office: _________ times B-25 If yes to B-22, which of the following statements
best describes your asthma medication use in the past 12 months:
c Never in the past 12 months c At least once in the past 12 months c At least once per month c At least once per week c Every day
ALLERGIES
B-26 Have you ever had an allergic reaction to any of
the following: (Please check all that apply). 1. House dust c Yes c No 2. Cats c Yes c No 3. Dogs c Yes c No 4. Grasses c Yes c No 5. Pollens c Yes c No 6. Molds c Yes c No 7. Others, c Yes c No
Please specify:_____________________
PHYSICAL ACTIVITY
B-27 Do you exercise? c Yes → If yes, how many times a week?
_____times a week
c No → If no, go to question B-29.
B-28 How long do you usually exercise? c Less than 15 minutes c 15 to 30 minutes c 31 to 60 minutes
c More than 60 minutes c Don’t Know
B-29 In a typical week in the past 3 months, how
much time did you usually spend on a computer, including playing computer games and using the Internet or World Wide Web? (Please do not include time spent at work or at school)
c None c Less than 1 hour c From 1 to 2 hours c From 3 to 5 hours c From 6 to 10 hours c From 11 to 14 hours c From 15 to 20 hours c More than 20 hours
B-30 In a typical week in the past 3 months, how
much time did you usually spend watching television or videos?
c None c Less than 1 hour c From 1 to 2 hours c From 3 to 5 hours c From 6 to 10 hours c From 11 to 14 hours c From 15 to 20 hours c More than 20 hours
EARLY LIFE EXPOSURES
B-31 Have you ever lived on a farm?
c Yes
c No c Don’t know
B-32 Did you live on a farm during your first year of
life?
c Yes → If yes, what type of farm? (Check all that apply) c Grain c Livestock
c No c Don’t know
B-33 Did your mother smoke while she was pregnant with you?
c Yes
c No c Don’t know
Ad
ult
2
ADULT 2 11
92

4352HB_Health_survey_Q6 1/25/10 2:26 PM Page 12
Ad
ult 2
B-34 What was your birth weight?
_________ pounds or _________ grams
c Don’t know B-35 Were you breastfed as a child?
c Yes → If yes, was it for 6 months or longer? c Yes c No
c No
c Don’t know
CIGARETTE SMOKING B-36 Have you ever smoked cigarettes? (If you have
smoked less than 20 packs of cigarettes in your lifetime, answer no.)
c Yes c No → If no, go to question B-43
B-37 Do you now smoke cigarettes? c Yes
c No
B-38 How old were you when you first started regular
cigarette smoking? ____ years old B-39 How many cigarettes do you smoke per day
now?_____ cigarettes per day B-40 On the average of the entire time you smoked,
how many cigarettes did you smoke per day? _____ cigarettes per day
B-41 If you have stopped smoking cigarettes completely,
how old were you when you stopped? _____ age stopped
B-42 If there have been periods when you abstained
from smoking, indicate total years of abstinence
from smoking. _____ years B-43 Have you ever smoked a pipe regularly? (Yes
means more than 12 oz of tobacco in a lifetime)
c Yes
c No B-44 Have you ever smoked cigars regularly? (Yes
means more than 1 cigar a week for a year) c Yes
c No
B-45 Do you smoke a pipe or cigars regularly at
present? c Yes
c No
ALCOHOL CONSUMPTION B-46 During the past 12 months, how often did you
drink alcoholic beverages? c Never c Less than once a month c Once a month c 2 to 3 times a month c Once a week c 2 to 3 times a week c 4 to 6 times a week c Every day
B-47 How often in the past 12 months have you had 5 or more drinks on one occasion? c Never c Less than once a month c Once a month c 2 to 3 times a month c Once a week c More than once a week
MEDICAL HISTORY
B-48 In general would you say your health is: c Excellent c Very Good c Good c Fair c Poor B-49 During the past 12 months, were you seen by a
doctor or other primary care giver for: Yes No Don’t know
Stomach acidity or reflux? c c c
An ear infection? c c c
An injury? c c c B-50 Has a doctor or primary care giver ever said you
have: Yes No Don’t Know
Diabetes c c c
Heart Disease c c c
Heart Attack c c c
Hardening of the arteries c c c
High Blood Pressure c c c
Cystic Fibrosis c c c
Tuberculosis c c c
Stroke c c c
Cancer c c c
If yes to cancer, please specify type(s):
_____________________________________________________
_____________________________________________________ 12 ADULT 2
93

4352HB_Health_survey_Q6 1/26/10 2:46 PM Page 13 CHEST ILLNESSES
B-51 Has a doctor ever said you had any of the following chest illnesses:
Chest Illness During the Past 12 Months Ever In Your Life
a. Attack of bronchitis c Yes c No c Yes c No
b. Pneumonia c Yes c No c Yes c No
c. Hay Fever c Yes c No c Yes c No
d. Sinus Trouble c Yes c No c Yes c No
e. Chronic Bronchitis c Yes c No c Yes c No
f. Emphysema c Yes c No c Yes c No
g. COPD (Chronic Obstructive Pulmonary Disease) c Yes c No c Yes c No
h. Sleep Apnea c Yes c No c Yes c No
i. Other Chest Illness c Yes c No c Yes c No (Example chest operation)
please specify: ___________________________________________ _____________________________________
B-52 If yes to Chronic Obstructive Pulmonary Disease (COPD) in question B-51g, how many times have you required services for COPD from the following places during the past 12 months?
Hospital inpatient: _______ times
Emergency room outpatient: _______ times
Doctor’s office: _______ times
REST AND SLEEP
B-53 Do you snore? c Yes
c No → If no, go to question B-55.
c Don’t know
B-54 If you snore, is your snoring: c Slightly louder than breathing? c As loud as talking?
c Louder than talking?
c Very loud - can be heard in adjacent rooms?
B-55 How likely are you to doze off or fall asleep in the situations described below, in contrast to just feeling tired? This
refers to your usual way of life in recent times. Even if you haven’t done some of these things recently, try to work
out how they would have affected you. Please check one response choice for each situation.
RESPONSE CHOICES
SITUATION Would never Slight chance of Moderate chance of High chance of doze dozing dozing dozing
Sitting and reading c c c c
Watching TV c c c c
Sitting inactive in a public place c c c c (e.g., a theatre or a meeting)
As a passenger in a car for an c c c c hour without a break
Lying down to rest in the afternoon c c c c when circumstances permit
Sitting and talking to someone c c c c
Sitting quietly after lunch c c c c without alcohol
In a car, while stopped for a c c c c few minutes in the traffic
Ad
ult
2
ADULT 2 13
94

4352HB_Health_survey_Q6 1/25/10 2:26 PM Page 14
Ad
ult 2
FAMILY HISTORY B-56 Have the following members of your biological family ever had: FATHER MOTHER BROTHER/SISTER
Yes
Don’t Don’t Don’t
No Know Yes No Know Yes No Know
Diabetes c c c c c c c c c
Heart Disease c c c c c c c c c
Heart Attack c c c c c c c c c
Hardening of the arteries c c c c c c c c c
High Blood Pressure c c c c c c c c c
Cystic Fibrosis c c c c c c c c c
Tuberculosis c c c c c c c c c
Stroke c c c c c c c c c
Lung Trouble c c c c c c c c c
(Asthma,Emphysema,
Chronic Bronchitis)
Cancer c c c c c c c c c
If yes to cancer,
please specify type(s): ______________ _____________ ____________
OCCUPATIONAL HISTORY
B-57 Please list all full-time jobs at which you have worked for at least one year, starting with your present or most
recent job. Please state the job title and business as specifically as possible. For example, ‘mixed farming’
instead of ‘farming’. Business, Industry Total number of
Job Title or Service Years at job
e.g. Nurse Health Care 10
e.g. Farmer Mixed Farming 30
14 ADULT 2
95

4352HB_Health_survey_Q6 1/25/10 2:26 PM Page 15 B-58 Have you ever been exposed to any of the following in the work place? How No Yes If Yes, how often? many years?
Grain Dust c c Daily c Weekly c Monthly c Occasionally c
Mine dust (e.g. potash, uranium) c c Daily c Weekly c Monthly c Occasionally c
Specify _______________
Asbestos dust c c Daily c Weekly c Monthly c Occasionally c
Wood dust c c Daily c Weekly c Monthly c Occasionally c
Other dust c c Daily c Weekly c Monthly c Occasionally c
Specify _______________
Livestock c c Daily c Weekly c Monthly c Occasionally c
Smoke from stubble burning c c Daily c Weekly c Monthly c Occasionally c
Diesel fumes c c Daily c Weekly c Monthly c Occasionally c
Welding fumes c c Daily c Weekly c Monthly c Occasionally c
Solvent fumes c c Daily c Weekly c Monthly c Occasionally c
Oil / Gas well fumes c c Daily c Weekly c Monthly c Occasionally c
Herbicides (to kill plants) c c Daily c Weekly c Monthly c Occasionally c
Fungicides (to treat grain) c c Daily c Weekly c Monthly c Occasionally c
Insecticides (to kill insects) c c Daily c Weekly c Monthly c Occasionally c
Molds c c Daily c Weekly c Monthly c Occasionally c
Radiation c c Daily c Weekly c Monthly c Occasionally c
Other, Specify _______________ c c Daily c Weekly c Monthly c Occasionally c
B-59
c Always c Most of the time c Sometimes c Never B-60 We wish to find out more about respiratory health of rural people. Would you be willing to be contacted about
having breathing and/or allergy tests at a nearby location? c Yes c No
c I would like more information
Ad
ult
2
IF THERE ARE MORE THAN TWO ADULT FAMILY MEMBERS LIVING IN YOUR HOUSEHOLD,➨
PLEASE CONTINUE IN THE GREEN BOOKLET.
REMEMBER TO COMPLETE THE CONTACT INFORMATION ON THE LAST PAGE!
(THIS INFORMATION WILL BE REMOVED FROM YOUR QUESTIONNAIRE TO ENSURE CONFIDENTIALITY.)
ADULT 2
How often do you (did you) wear a dust mask when exposed to grain dust?
96

15
97

4352HB_Health_survey_Q6 1/25/10 2:26 PM Page 16
98

4352HB_Health_survey_Q6 1/25/10 2:26 PM Page 17 CONTACT INFORMATION (PLEASE PRINT)
NAME: Age: c Male c Female
(Name of person completing the survey)
Address (number and street and Box Number)
,
Town Postal code
If you live on a farm give the land location of your residence.
Land location (quarter, section, township, meridian)
Telephone Numbers (check most preferred):
Work c
Home c
Cell c
THIS IS THE END OF THE SURVEY.
THANK YOU VERY MUCH FOR YOUR HELP!
99

4352HB_Health_survey_Q6 1/25/10 2:26 PM Page 18
100


![Research Article Prevalence of Anemia and Associated ...most common causes of anemia in pregnant women [ ]. Anemia has a variety of converging contributing factors including nutritional,](https://img.pdfslide.us/doc/110x75/611f772865f43c019547b2dc/research-article-prevalence-of-anemia-and-associated-most-common-causes-of-anemia.jpg)