Embed Size (px)
Citation preview
FACTORS AFFECTING YOUNG DRIVER SAFETY
December 2004
JHR 04-298 Project 03-5
Lisa Aultman-Hall Patrycja Padlo
This research was sponsored by the Joint Highway Research Advisory Council (JHRAC) of the University of Connecticut and the Connecticut Department of Transportation and was carried out at the Connecticut Transportation Institute of the University of Connecticut. The contents of this report reflect the views of the authors who are responsible for the facts and accuracy of the data presented herein. The contents do not necessarily reflect the official views or policies of the University of Connecticut or the Connecticut Department of Transportation. This report does not constitute a standard, specification, or regulation.
i
1. Report No. 2. Government Accession No. 3. Recipient’s Catalog No.
JHR 04-298 N/A N/A
4. Title and Subtitle 5. Report Date
December 2004
6. Performing Organization Code
Factors Affecting Young Driver Safety
N/A 7. Author(s) 8. Performing Organization Report No.
Lisa Aultman-Hall and Patrycja Padlo JHR 04-298
9. Performing Organization Name and Address 10. Work Unit No. (TRAIS)
N/A 11. Contract or Grant No.
University of Connecticut Connecticut Transportation Institute Storrs, CT 06269-5202 N/A
12. Sponsoring Agency Name and Address 13. Type of Report and Period Covered
FINAL
14. Sponsoring Agency Code
Connecticut Department of Transportation 280 West Street Rocky Hill, CT 06067-0207
N/A
15. Supplementary Notes
N/A
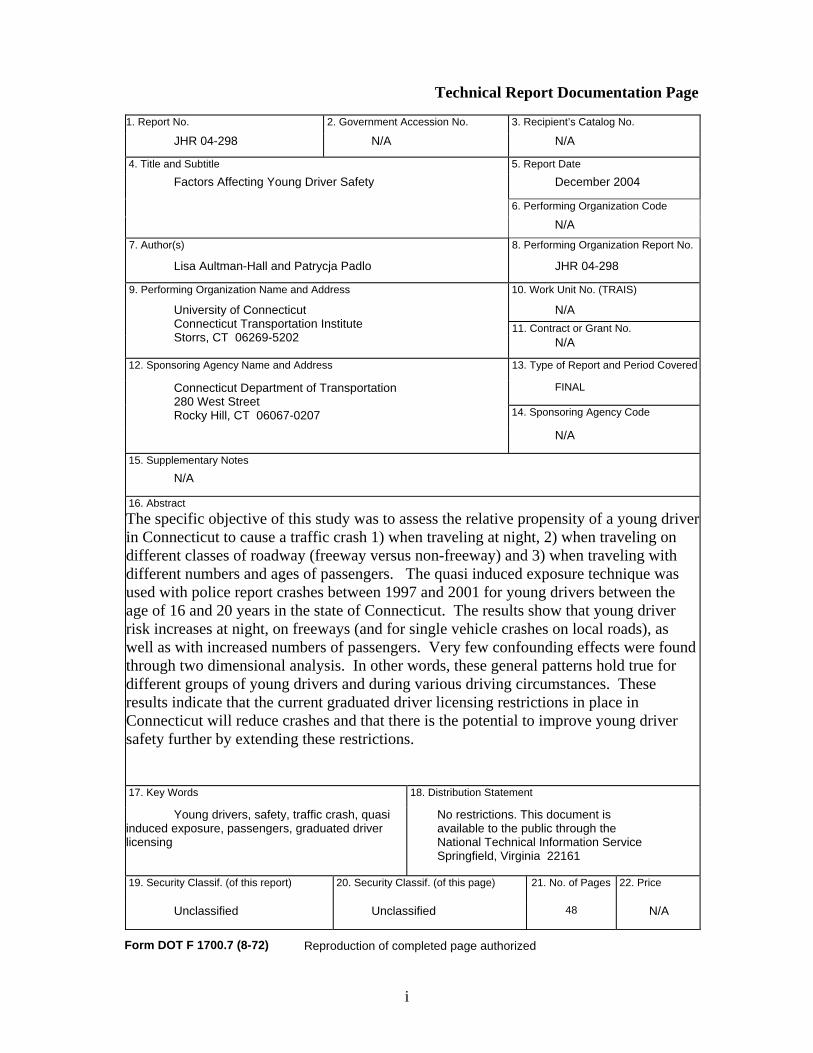
16. Abstract The specific objective of this study was to assess the relative propensity of a young driver in Connecticut to cause a traffic crash 1) when traveling at night, 2) when traveling on different classes of roadway (freeway versus non-freeway) and 3) when traveling with different numbers and ages of passengers. The quasi induced exposure technique was used with police report crashes between 1997 and 2001 for young drivers between the age of 16 and 20 years in the state of Connecticut. The results show that young driver risk increases at night, on freeways (and for single vehicle crashes on local roads), as well as with increased numbers of passengers. Very few confounding effects were found through two dimensional analysis. In other words, these general patterns hold true for different groups of young drivers and during various driving circumstances. These results indicate that the current graduated driver licensing restrictions in place in Connecticut will reduce crashes and that there is the potential to improve young driver safety further by extending these restrictions.
17. Key Words 18. Distribution Statement
Young drivers, safety, traffic crash, quasi induced exposure, passengers, graduated driver licensing
No restrictions. This document is available to the public through the National Technical Information Service Springfield, Virginia 22161
19. Security Classif. (of this report) 20. Security Classif. (of this page) 21. No. of Pages 22. Price
Unclassified Unclassified 48 N/A
Technical Report Documentation Page
Form DOT F 1700.7 (8-72) Reproduction of completed page authorized
ii
iii
TABLE OF CONTENTS
Technical Report Documentation Page .................................................................................i
Modern Metric Conversion Factors .......................................................................................ii
Table of Contents...................................................................................................................iii
List of Tables .........................................................................................................................v
List of Figures ........................................................................................................................vi
Introduction............................................................................................................................1
Background............................................................................................................................2
Young Driver Development.......................................................................................2
Effectiveness of Graduated Driver Licensing Programs ...........................................2
Methodology ..........................................................................................................................3
Database Description ................................................................................................3
Crash Tabulations - Relative Crash Involvement Ratios...........................................4
Statistical Modeling – Logistic Regression................................................................5
Results ....................................................................................................................................6
Database Summary ....................................................................................................6
One Dimensional Analysis .........................................................................................8
Two Dimensional Analysis: Sex................................................................................14
Two Dimensional Analysis: Age ...............................................................................17
Two Dimensional Analysis: Passenger Group ..........................................................17
Two Dimensional Analysis: Route Class and Light Conditions ...............................22
Conclusions and Recommendations ......................................................................................22
Acknowledgments..................................................................................................................23
References .............................................................................................................................23
Appendices
Appendix A: Data Dictionary ................................................................................................26
Appendix B: Logistic Regression Output Statistics for One Dimensional Relative Crash
Involvement Ratios ................................................................................................................31
Appendix C: Two Dimensional Crash Involvement Ratios (Sex).........................................32
Appendix D: Logistic Regression Test of Significance for the Interaction of Two
Variables ................................................................................................................................37
iv
Appendix E: Two Dimensional Crash Involvement Ratios (Age) ........................................38
v
LIST OF TABLES
Table 1: Summary of Crashes by Year ..................................................................................6 Table 2: Age of Drivers in Single and Two Vehicle Crashes................................................7 Table 3: Young Drivers and Fault .........................................................................................7 Table 4: Young Drivers and Passenger Group ......................................................................8 Table 5: Young Drivers and Light Conditions .....................................................................8 Table 6: Young Drivers and Route Class ..............................................................................8

vi
LIST OF FIGURES Figure 1: The Relative Impact of Sex on Crash Causing Propensity ...................................10 Figure 2: The Relative Impact of Young Driver Age on Crash Causing Propensity .....................11 Figure 3: The Relative Impact of Road Class on Crash Causing Propensity ................................12 Figure 4: The Relative Impact of Light Conditions on Crash Causing Propensity.........................13 Figure 5: The Relative Impact of Passenger Group on Crash Causing Propensity.........................15 Figure 6: The Relative Impact of the Total Number of Passengers on Crash Causing Propensity...16 Figure 7: The Relative Impact of the Number of Peer Passengers on Crash Causing Propensity....18
Figure 8: The Relative Impact of the Number of Peer Passengers on Crash Causing Propensity
on Different Route Classes ............................................................................................19 Figure 9: The Relative Impact of the Number of Peer Passengers on Crash Causing
Propensity during Different Light Conditions ...........................................................20 Figure 10: The Relative Impact of Route Class During Different Light Conditions.............21
Aultman-Hall and Padlo Page 1
INTRODUCTION The combined result of immaturity and inexperience for young drivers aged 16 to 20 years is an increase in risk taking behavior and overall greater risk for traffic crashes. Motor vehicle crashes are the leading cause of death for the 15 to 20 year old age group in the United States (NHTSA 1998). Measured in terms of miles traveled, teenage drivers are three times as likely to be in a fatal traffic crash than other drivers (NHTSA 1998). Countermeasures to improve young driver safety have focused on decreasing exposure as well as educational programs that are aimed at ensuring young people and their parents understand the types of risks involved. Beginning in 1997, the State of Connecticut started implementing a graduated licensing program for young drivers in the state. Over the last decade, graduated driver licensing systems have been widely supported by the general public and institutions such as the Insurance Institute for Highway Safety, the American Automobile Association and the National Highway Transportation Safety Administration (NHTSA). NHTSA has provided model laws for establishing graduated driver licensing systems and has promoted the three stage system (NHTSA 1998). In the first stage, the learner’s permit, supervision by a driver over the age of 20 is required at all times and the learner must stay free of all crash and seat belt convictions before advancing to the next stage. There is no tolerance for any alcohol for learning drivers under the age of 21. This stage is recommended to last at least six months, during which time training might also be required. A six month probationary driver license period became required in Connecticut on January 1, 1997. Although exact details vary, all but six states, now have some form of a partial graduated driver license system usually consisting of this learner stage. Among the 35 states which have the second NHTSA-recommended phase, an intermediate licensure stage, the provisions vary greatly. Connecticut now has an intermediate phase, but its restrictions and length are minimal compared to some states. NHTSA recommends that night driving be restricted in this phase usually between the hours of 10PM and 5AM. During these times, the young driver must be with a supervisor 21 years of age or older. There is zero tolerance for violations related to alcohol, seat belts and at-fault crashes. NHTSA further recommends that parents certify a certain number of hours of supervised driving during this phase, and that the speed and types of roads used be limited. Limitations are recommended regarding the number of passengers, particularly teenage passengers that the young driver can carry. After a recommended 12 months in this second stage, the young driver moves into phase three or full licensure. In January 2004, a six month intermediate licensing phase came into effect in Connecticut. Although the Connecticut young driver can always drive alone, during the first three months of this intermediate phase, the young driver can only have one passenger. This passenger may be a parent or guardian, a driving license instructor or one person at least 20 years of age who has held a driving license for four years with no suspensions. Between three and six months after the intermediate license is issued, the young driver may only carry passengers in their immediate family in addition to those listed above. These restrictions represent an incremental movement towards full graduated driver licensing in Connecticut. Few states have all of the components recommended by NHTSA, but the list of possible restrictions which might be added to the intermediate phase was the motivation behind selecting the specific study objections for this project.
Aultman-Hall and Padlo Page 2
The specific objective of this study is to assess the relative propensity of a young driver in Connecticut to cause a traffic crash 1) when traveling at night, 2) when traveling on different classes of roadway (freeway versus non-freeway) and 3) when traveling with different numbers and ages of passengers. Of particular interest is the group of peer passengers as compared to adult or child passengers. Peers have been shown to relate to risk taking behavior, while adults can provide supervision and guidance while driving. Children have been hypothesized to provide a sense of responsibility although this hypothesis has not been tested. The quasi-induced exposure crash analysis technique is used in this analysis in combination with logistic regression models of fault in single and two vehicle crashes where the driver was between the age of 16 and 20 years. Crashes between 1997 and 2001 are used to ensure the entire study period has only one type of graduated licensing system in place. During this time only the first phase, the learner’s stage, was in place in the state. The age group 16 to 20 years was selected to avoid under age drivers and also to minimize the number of alcohol involved crashes which are more common when young drivers reach the age of 21 years. BACKGROUND Young Driver Development There are two different developmental processes affecting the driving safety of teenage drivers: immaturity and inexperience (Eby and Molnar 1999). Immaturity refers to the development of the individuals themselves and how this affects judgment and risk taking. For example, young teenage drivers (and passengers) are more likely to drink alcohol and drive (NHTSA 2000). They are also less likely to wear their seat belts, which increases the likelihood of a fatality given that a crash occurs (NHTSA 1998). Teenagers have a misperception of risk for certain things (Finn and Bragg 1986) that when combined with their “optimism bias” (Dejoy 1989) and their misimpressions of cumulative risk (Doyle 1997) creates unsafe situations while driving. Teenagers are greatly influenced by social factors in their surroundings (Chen et al. 2000) including the effects of passengers in the vehicle. Basch et al. (1989) point out that the courtship behavior of teenagers also contributes to risk taking as drivers. Inexperience, on the other hand, refers to the level of knowledge drivers have regarding the driving tasks and skills needed to operate the motor vehicle. All new drivers have very little knowledge about the numerous tasks and complexities involved with driving (NHTSA 1998). Driving is estimated to involve up to 1500 individual tasks (Evans 1991) many of which must be conducted simultaneously. In terms of cognitive development, teenagers think slower and can think about fewer things simultaneously than an adult (Eby and Molnar 1999). They have difficulty ignoring irrelevant information, as well as dividing their attention between different tasks. They have trouble focusing for sustained periods of time, have less information in long term memory and have poorer reasoning / decision making skills. All of these factors combined with limited driving experience, compromise the rate at which young drivers can gain useful experience to improve their driving skills. Effectiveness of Graduated Driver Licensing Programs In most cases, the effect of the full graduated licensing programs has not yet been completely evaluated. Due to the random nature of crash occurrence, it takes several years to accumulate
Aultman-Hall and Padlo Page 3
enough data to ensure a statistically valid representation of the “after” period. Agent et al. (2001) compared the before graduated licensing period of 1994 –1995 with the after period of 1997-1999 for sixteen year olds in the state of Kentucky. A 32 percent decrease in crash rate was found. Kirk and Stamatiadis (2001) found that although the graduated licensing in Kentucky was effective during the limited licensure phase, it unfortunately did not translate into improved safety for the young drivers once they reached the unrestricted phase. This suggests that the effectiveness of graduated licensing systems is attributable to limiting the teenagers’ exposure to traffic crashes. The earliest implementations of graduated driver licensing in Maryland and California (1979 and 1983) had relatively few restrictions on the young driver. However, even in these cases, 5% reductions in teenage crash rates were found (NHTSA 1998). In 1997, the first year with probationary driving licenses in Connecticut, the fatal/injury crash rate for 16 year old drivers decreased by 22% (Ulmer et al. 2001). The program implemented in Oregon in 1989 was much more restrictive and results reported in 1991 showed a decrease of 16% in crashes for males and, interestingly, no significant difference for females (NHTSA 1998). By comparing one year of crash data before North Carolina implemented a three phase system in 1997, to one year of after data, Foss et al. (2001) found an initial fatal crash reduction rate of 57% for sixteen year old drivers. In Ontario, Canada a relatively comprehensive and restrictive graduated licensing system was implemented in 1994 and it has shown a 27% decrease in crash rates (NHTSA 1998). METHODOLOGY Database Description The raw crash data files for this study were obtained on CD from the Office of Inventory and Data in the Bureau of Policy and Planning at ConnDOT. Three record types were needed from this database: the accident summary record, the traffic unit record and the involved persons record. The format of this datasets requires extensive data revision and reformatting to allow for statistical analysis and cross tabulation of crash types. This data processing was undertaken using Fortran and SAS programming codes. Driver and passenger age was calculated using the crash date and the birthday coded in the police record. The number of passengers was counted in each vehicle by age group. Because fault can be easily assigned in single and two vehicle crashes, only these crash types were extracted and used in this study. Moreover, crashes that involved pedestrians, parked vehicles, commercial vehicles, motorcycles, bicycles, mopeds, scooters or farm equipment as one of the two vehicles were also not used. Vehicles for which the age of the driver could not be calculated were excluded. If a passenger’s birthday was missing resulting in the inability to calculate the passenger’s age, this person was still counted in the passenger totals and used to determine whether the driver was driving alone, however, these observations could not be used in any analysis where the age of the passengers was needed. Data was combined for the years 1997 through 2001. Previous research (Aldridge et al. 1999) had indicated that 3 years was sufficient to generate statistically significant results, but this longer 5 year period improved the extent of disaggregation possible. The resultant database contained the following data fields: fault, driver age, severity, number of vehicles, town, route class (road type), collision type, weather, light conditions, driver sex, drug
Aultman-Hall and Padlo Page 4
involvement, passenger age (note passenger sex is not coded in the original file). Not all these variables were used in this study but leave open the possibility of further research. This information was extracted for vehicles with a driver aged 16-20 years in single and two-vehicle crashes. The two-vehicle crashes were divided into at-fault and not-at-fault. Drivers in all single vehicle crashes were assumed to be at fault. Note that in a two vehicle crash where only one driver was aged 16-20 years, that only that particular vehicle remains in the database for analysis. Some new variables were generated and some variables were categorized into more aggregate groupings to accommodate the statistical analysis in this study. A full listing of variables and variable levels is contained in Appendix A. Once the data was reformatted, the number of crashes under each combination of circumstances was easily cross tabulated using the statistical analysis software Minitab for the at-fault and not-at-fault young drivers. Crash Tabulations - Relative Crash Involvement Ratios Typical crash analysis techniques are limited when information regarding a particular group of drivers under particular circumstances is sought. Previous research using these traditional techniques indicates that overall teenage drivers are more likely to crash than their more experienced adult counterparts. However, without accurate disaggregated travel exposure1 data, traditional methodologies are inadequate for identifying specific risk factors for crash involvement under specific circumstances such as traveling with a certain number of passengers or along a given type of road. In other words, extracting meaningful information from the disaggregation of crashes by different characteristics or circumstances becomes difficult without estimates of the relative travel exposure in those same circumstances. For example, we do not know the number of miles traveled by young drivers in dark versus light driving conditions, even though we know the total number of crashes by light condition. The quasi-induced exposure technique is coming into wider use in traffic safety and was used in this project. The method has been successfully used for disaggregate crash safety analysis for elderly drivers (Stamatiadis and Deacon 1995), road geometric characteristics (Stamatiadis et al. 1999) and young drivers (Aldridge et. al 1999). A relative crash involvement ratio can be formed for both single (RAIR2s) and two-vehicle crashes (RAIRm); the denominator in both is the percentage of not-at-fault drivers in the two-vehicle crashes, while the numerator is the corresponding at-fault drivers. The ratio indicates the relative propensity of a particular driver group, in a particular driving circumstance, to cause a crash. Ratio values greater than 1.0 indicate that the specific subgroup of drivers is more likely to cause a crash under the specific circumstances being considered. In a similar way, a ratio of less than 1.0 indicates that the drivers in the specific subcategory are less prone to be at fault or cause the crash. A hypothetical calculation is shown in Equation 1. In this case, the crash circumstance is driving at night. A total of 20,000 young drivers were not-at-fault in crashes and 10,000 of these
1 Travel exposure is often measured in vehicle miles traveled. In this case, exposure refers to any measure of the relative amount of travel undertaken by young drivers in different circumstances; night versus day driving for example. Exposure metrics are used to normalize crash tallies to develop crash rates. 2 The use of RAIR stems from the original “relative accident involvement ratio” before the term crash was widely preferred.
Aultman-Hall and Padlo Page 5
occurred at night. However, 12,000 of the 15,000 crashes where young drivers were at fault occurred at night. The method derives the relative exposure for different groups from the crash database itself. The RAIR is calculated by taking the ratio of the percentage of at-fault drivers in a specific circumstance to the percentage of not-at-fault drivers from the same circumstance. The assumption is that the distribution of not-at-fault drivers is a representative sample of the relative conditions during which the group drives. The denominator in this case indicates that when the not-at-fault vehicle in a two vehicle crash was driver by a young driver, 50% of the time the young driver was driving at night. This percentage is taken to be a measure of the relative travel exposure. Therefore, in this case, the interpretation would be that young drivers drive about the same amount in light and dark conditions. Given this assumption the RAIR value indicates that the young drivers are 1.6 times as likely to cause a crash at night. Equation 1: Sample RAIR Calculation RAIR = % young drivers at fault that were driving at night % young drivers not-at-fault that were driving at night = 12,000 / 15,000 10,000 / 20,000 = 80% 50% = 1.6 In this study, the crash causing propensity measures (the RAIRs) will be compared for the following one dimensional driving groups of young drivers: males versus females, younger (age 16-17) teenagers and older (age 18-20) teenagers, road type (interstate, US/state route, local road), light conditions (day, dark, dusk/dawn), passenger group (alone, with peers and with adults or children), and the number of passengers. Two dimensional analyses are conducted to determine if the impact of passenger groups, light conditions or route class changes by sex or age group. Similarly, the interactions of passenger group with light conditions and route class are investigated. Statistical Modeling – Logistic Regression Once the total number of at-fault and not-at-fault young drivers in each circumstance has been used to calculate RAIR values, statistical significance must be tested using binary logistic regression. Logistic regression is similar to linear regression, except that the dependent variable (the y variable) is discrete not continuous. In this case, one estimates a model to predict whether or not a given driven was at-fault in a crash (0 or 1) as a function of the independent variable or variables. Binary logistic regression (as opposed to ordinal or nominal logistic regression) is used in this case because the dependent variable can only take on two values. The model has the form shown in Equation 2 and the parameters or model coefficients are estimated using maximum likelihood techniques. The overall quality of the model is measured using the log likelihood function (G parameter), however of particular interest in this case are the z statistics which are used to determine if a particular factor has a statistically significant impact on the probability that the driver is at-fault in the crash. The 0.05 significance level is used in this case and results are presented in the form of the p values (or probability that the null hypothesis is
Aultman-Hall and Padlo Page 6
correct) from the z test. All explanatory factors in this case are categorical. The models can be estimated in any standard statistical analysis package and in this case Minitab was used. Two different types of logistic regression results are presented in this report. In the case of the one dimensional crash involvement ratios, the null hypothesis is that the ratio is equal to one. For the two dimensional crash involvement ratios, the null hypothesis is that the impact of one factor is the same for each category of the second factor. In other words, the interaction of the two factors is insignificant. For example, if one found that young drivers were more likely to cause crashes during dark as opposed to light conditions, it would be reasonable to further investigate whether this pattern held for both young men and women. In this case, the null hypothesis would be that the relative probability of men versus women to cause crashes is constant regardless of light conditions. This does not mean the rate is the same in dark and light conditions, but rather that the ratio of dark to light crash causing propensity is the same for men and women. Equation 2: Binary Logistic Regression Model Form
P(driver is at-fault) = 1 / (1 + e-z) Where z = B0 + B1X1 + B2X2 + … + BnXn
Xi = explanatory factors (one dimensional factors or the interaction of 2 factors) Bi = model coefficients (significance is tested using the z statistics at the 0.05 level)
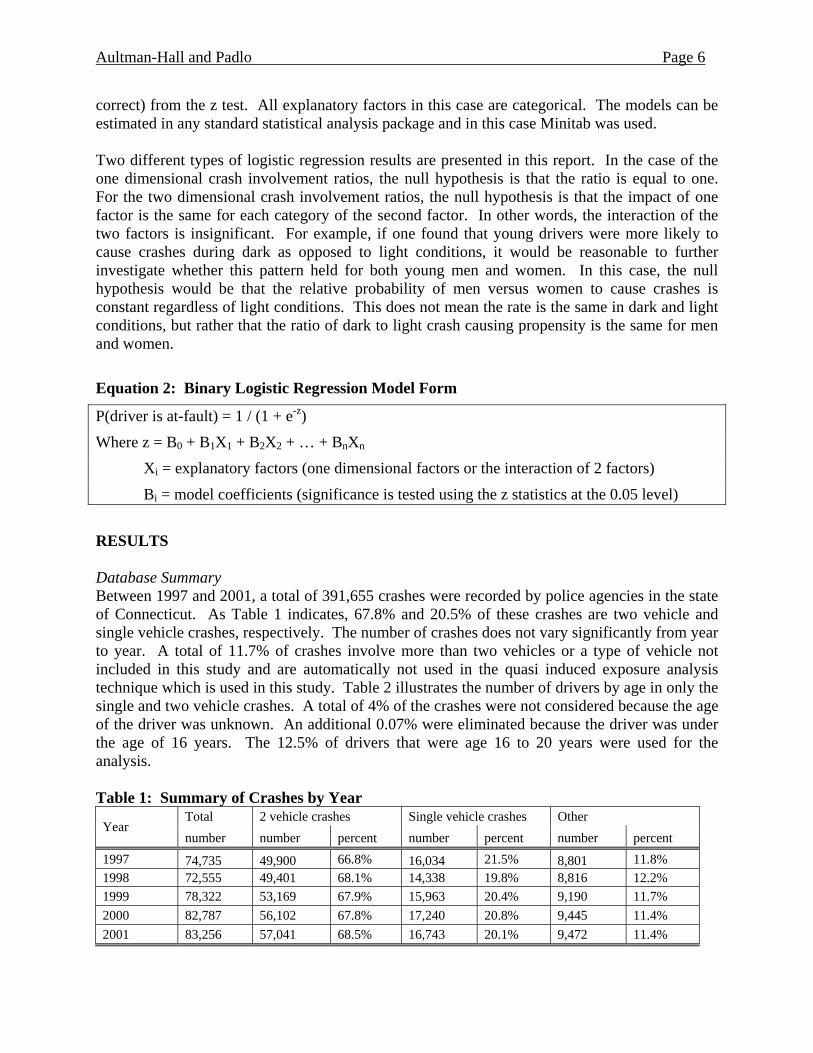
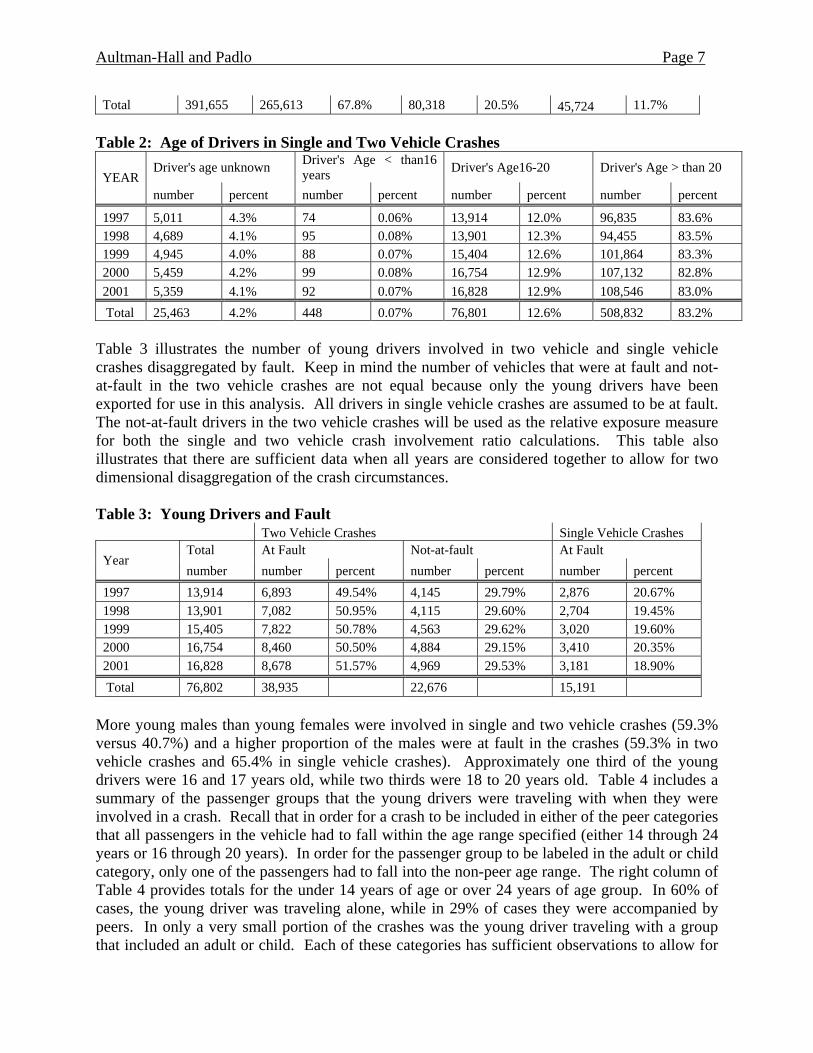
RESULTS Database Summary Between 1997 and 2001, a total of 391,655 crashes were recorded by police agencies in the state of Connecticut. As Table 1 indicates, 67.8% and 20.5% of these crashes are two vehicle and single vehicle crashes, respectively. The number of crashes does not vary significantly from year to year. A total of 11.7% of crashes involve more than two vehicles or a type of vehicle not included in this study and are automatically not used in the quasi induced exposure analysis technique which is used in this study. Table 2 illustrates the number of drivers by age in only the single and two vehicle crashes. A total of 4% of the crashes were not considered because the age of the driver was unknown. An additional 0.07% were eliminated because the driver was under the age of 16 years. The 12.5% of drivers that were age 16 to 20 years were used for the analysis. Table 1: Summary of Crashes by Year
Total 2 vehicle crashes Single vehicle crashes Other Year
number number percent number percent number percent 1997 74,735 49,900 66.8% 16,034 21.5% 8,801 11.8% 1998 72,555 49,401 68.1% 14,338 19.8% 8,816 12.2% 1999 78,322 53,169 67.9% 15,963 20.4% 9,190 11.7% 2000 82,787 56,102 67.8% 17,240 20.8% 9,445 11.4% 2001 83,256 57,041 68.5% 16,743 20.1% 9,472 11.4%
Aultman-Hall and Padlo Page 7
Total 391,655 265,613 67.8% 80,318 20.5% 45,724 11.7% Table 2: Age of Drivers in Single and Two Vehicle Crashes
Driver's age unknown Driver's Age < than16 years Driver's Age16-20 Driver's Age > than 20
YEAR number percent number percent number percent number percent
1997 5,011 4.3% 74 0.06% 13,914 12.0% 96,835 83.6% 1998 4,689 4.1% 95 0.08% 13,901 12.3% 94,455 83.5% 1999 4,945 4.0% 88 0.07% 15,404 12.6% 101,864 83.3% 2000 5,459 4.2% 99 0.08% 16,754 12.9% 107,132 82.8% 2001 5,359 4.1% 92 0.07% 16,828 12.9% 108,546 83.0% Total 25,463 4.2% 448 0.07% 76,801 12.6% 508,832 83.2%
Table 3 illustrates the number of young drivers involved in two vehicle and single vehicle crashes disaggregated by fault. Keep in mind the number of vehicles that were at fault and not-at-fault in the two vehicle crashes are not equal because only the young drivers have been exported for use in this analysis. All drivers in single vehicle crashes are assumed to be at fault. The not-at-fault drivers in the two vehicle crashes will be used as the relative exposure measure for both the single and two vehicle crash involvement ratio calculations. This table also illustrates that there are sufficient data when all years are considered together to allow for two dimensional disaggregation of the crash circumstances. Table 3: Young Drivers and Fault
Two Vehicle Crashes Single Vehicle Crashes Total At Fault Not-at-fault At Fault
Year number number percent number percent number percent
1997 13,914 6,893 49.54% 4,145 29.79% 2,876 20.67% 1998 13,901 7,082 50.95% 4,115 29.60% 2,704 19.45% 1999 15,405 7,822 50.78% 4,563 29.62% 3,020 19.60% 2000 16,754 8,460 50.50% 4,884 29.15% 3,410 20.35% 2001 16,828 8,678 51.57% 4,969 29.53% 3,181 18.90% Total 76,802 38,935 22,676 15,191
More young males than young females were involved in single and two vehicle crashes (59.3% versus 40.7%) and a higher proportion of the males were at fault in the crashes (59.3% in two vehicle crashes and 65.4% in single vehicle crashes). Approximately one third of the young drivers were 16 and 17 years old, while two thirds were 18 to 20 years old. Table 4 includes a summary of the passenger groups that the young drivers were traveling with when they were involved in a crash. Recall that in order for a crash to be included in either of the peer categories that all passengers in the vehicle had to fall within the age range specified (either 14 through 24 years or 16 through 20 years). In order for the passenger group to be labeled in the adult or child category, only one of the passengers had to fall into the non-peer age range. The right column of Table 4 provides totals for the under 14 years of age or over 24 years of age group. In 60% of cases, the young driver was traveling alone, while in 29% of cases they were accompanied by peers. In only a very small portion of the crashes was the young driver traveling with a group that included an adult or child. Each of these categories has sufficient observations to allow for

Aultman-Hall and Padlo Page 8
the relative crash involvement ratio calculations in this study. Table 5 illustrates the light conditions during which the single and two vehicle crashes occurred. Very few of the crashes occurred during the dusk or dawn conditions, which could limit the disaggregation and analysis of the relative crash causing propensity of young drivers during this type of light condition. Table 6 contains a summary of the crash location by route class. The number of crashes on each route type is also sufficient for the disaggregation. Table 4: Young Drivers and Passenger Group
Solo Peer(14-24) Peer (16-20) Adult/Child
number percent number percent number percent number percent
Single Vehicle 9,233 60.8% 4,783 31.5% 3,014 19.8% 993 6.5% Two Vehicle at fault 24,081 61.8% 10,866 27.9% 6,656 17.1% 3,599 9.2% Two Vehicle Not-at-fault 12,897 56.9% 6,900 30.4% 4,382 19.3% 2,622 11.6% TOTAL 46,211 60.2% 22,549 29.4% 14,052 18.3% 7,214 9.4%
Table 5: Young Drivers and Light Conditions
Daylight Dark Dusk/Dawn Number percent number percent number percent
Single Vehicle 6,821 45.1% 7,881 52.1% 421 2.8% Two Vehicle at fault 27,998 72.1% 9,946 25.6% 879 2.3% Two Vehicle Not-at-fault 15,005 66.4% 7,093 31.4% 497 2.2% TOTAL 49,824 65.1% 24,920 32.6% 1,797 2.3% Table 6: Young Drivers and Route Class
Interstate US/State Route Local Road
Number percent number percent number percent
Single Vehicle 3,295 21.7% 7,977 52.5% 3,919 25.8% Two Vehicle at fault 4,118 10.6% 28,375 72.9% 6,442 16.5% Two Vehicle Not-at-fault 2,327 10.3% 16,381 72.2% 3,968 17.5% TOTAL 9,740 12.7% 52,733 68.7% 14,329 18.7% One Dimensional Analysis: In this section of the report, the impact of the following individual variables on the probability that a young driver caused a crash is investigated for both single and two vehicle crashes: sex, age (16/17 years versus 18-20 years), route class (interstate, US/State route, local), light condition (daylight, dark, dusk/dawn), passenger group (solo, peer and adult/children), total number of passengers and number of peer passengers. The results are shown graphically in Figures 1 through 7. Note that the logistic regression in this case is used to test whether the individual relative crash involvement ratios, or bars on the histograms, are statistically different from 1.0.3 This requires an individual model be estimated for each level of each categorical variable (or in other words a separate model is developed for
3 Note that these tests are different from testing whether the relative crash involvement ratios (or bars) are equal to each other.
Aultman-Hall and Padlo Page 9
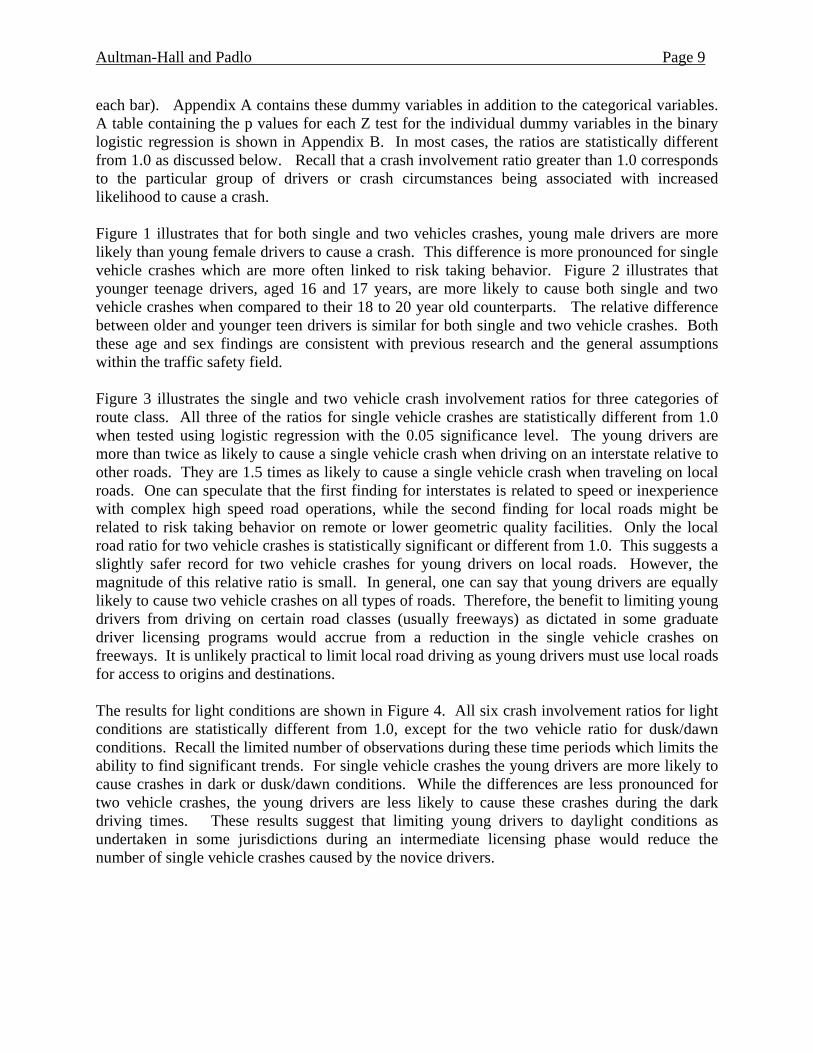
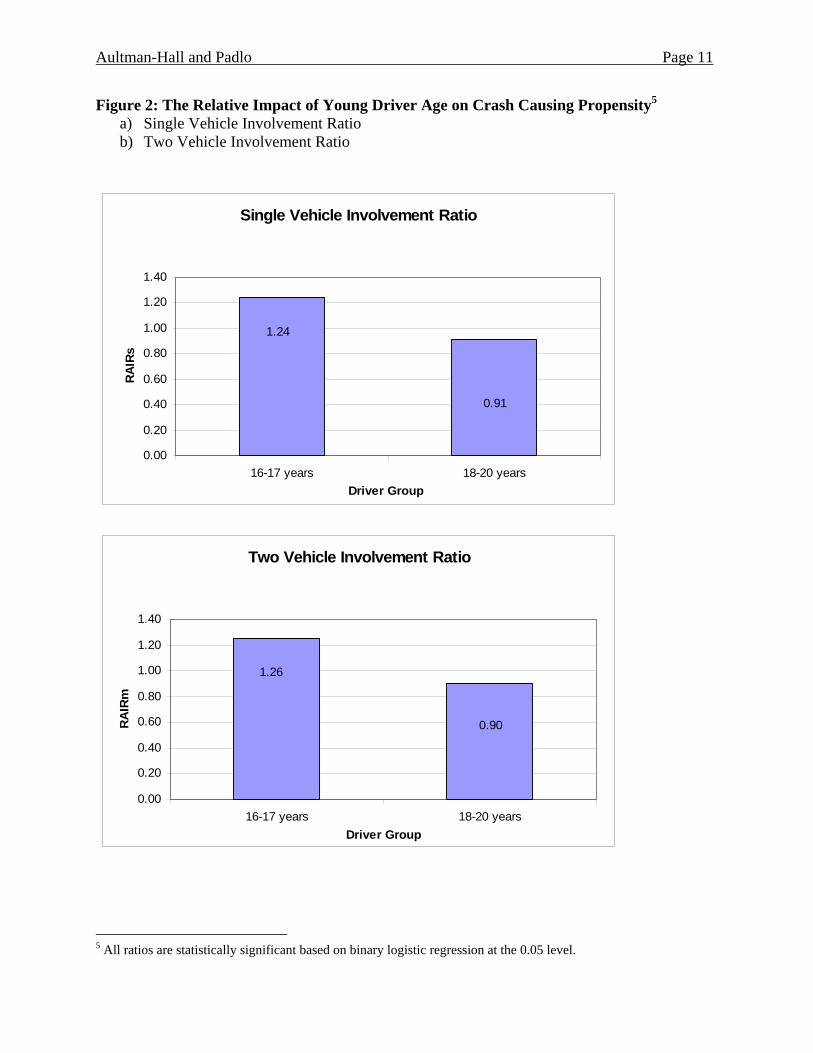
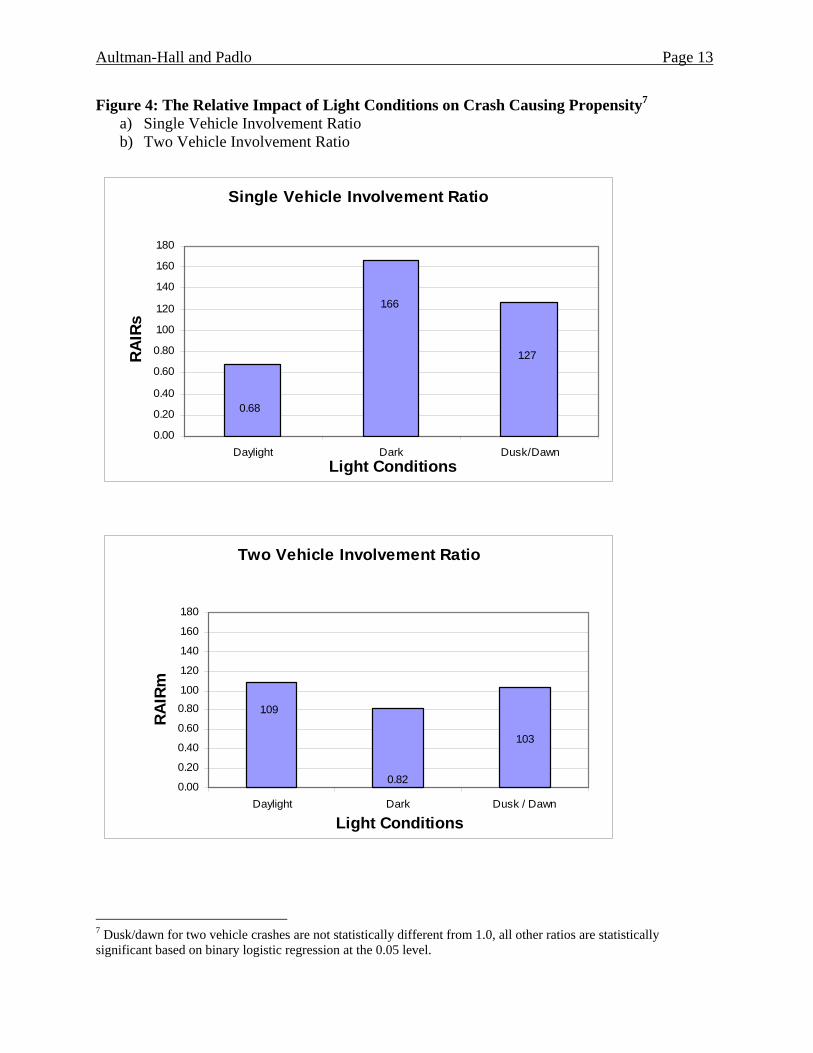
each bar). Appendix A contains these dummy variables in addition to the categorical variables. A table containing the p values for each Z test for the individual dummy variables in the binary logistic regression is shown in Appendix B. In most cases, the ratios are statistically different from 1.0 as discussed below. Recall that a crash involvement ratio greater than 1.0 corresponds to the particular group of drivers or crash circumstances being associated with increased likelihood to cause a crash. Figure 1 illustrates that for both single and two vehicles crashes, young male drivers are more likely than young female drivers to cause a crash. This difference is more pronounced for single vehicle crashes which are more often linked to risk taking behavior. Figure 2 illustrates that younger teenage drivers, aged 16 and 17 years, are more likely to cause both single and two vehicle crashes when compared to their 18 to 20 year old counterparts. The relative difference between older and younger teen drivers is similar for both single and two vehicle crashes. Both these age and sex findings are consistent with previous research and the general assumptions within the traffic safety field. Figure 3 illustrates the single and two vehicle crash involvement ratios for three categories of route class. All three of the ratios for single vehicle crashes are statistically different from 1.0 when tested using logistic regression with the 0.05 significance level. The young drivers are more than twice as likely to cause a single vehicle crash when driving on an interstate relative to other roads. They are 1.5 times as likely to cause a single vehicle crash when traveling on local roads. One can speculate that the first finding for interstates is related to speed or inexperience with complex high speed road operations, while the second finding for local roads might be related to risk taking behavior on remote or lower geometric quality facilities. Only the local road ratio for two vehicle crashes is statistically significant or different from 1.0. This suggests a slightly safer record for two vehicle crashes for young drivers on local roads. However, the magnitude of this relative ratio is small. In general, one can say that young drivers are equally likely to cause two vehicle crashes on all types of roads. Therefore, the benefit to limiting young drivers from driving on certain road classes (usually freeways) as dictated in some graduate driver licensing programs would accrue from a reduction in the single vehicle crashes on freeways. It is unlikely practical to limit local road driving as young drivers must use local roads for access to origins and destinations. The results for light conditions are shown in Figure 4. All six crash involvement ratios for light conditions are statistically different from 1.0, except for the two vehicle ratio for dusk/dawn conditions. Recall the limited number of observations during these time periods which limits the ability to find significant trends. For single vehicle crashes the young drivers are more likely to cause crashes in dark or dusk/dawn conditions. While the differences are less pronounced for two vehicle crashes, the young drivers are less likely to cause these crashes during the dark driving times. These results suggest that limiting young drivers to daylight conditions as undertaken in some jurisdictions during an intermediate licensing phase would reduce the number of single vehicle crashes caused by the novice drivers.

Aultman-Hall and Padlo Page 10
Figure 1: The Relative Impact of Sex on Crash Causing Propensity4 a) Single Vehicle Involvement Ratio b) Two Vehicle Involvement Ratio
Single Vehicle Involvement Ratio
1.18
0.77
0.00
0.20
0.40
0.60
0.80
1.00
1.20
1.40
M ale Female
Gender
RA
IRs
Two Vehicle Involvement Ratio
1.07
0.91
0.00
0.20
0.40
0.60
0.80
1.00
1.20
1.40
M ale Female
Gender
RA
IRm
4 All ratios are statistically significant based on binary logistic regression at the 0.05 level.
Aultman-Hall and Padlo Page 11
Figure 2: The Relative Impact of Young Driver Age on Crash Causing Propensity5 a) Single Vehicle Involvement Ratio b) Two Vehicle Involvement Ratio
Single Vehicle Involvement Ratio
1.24
0.91
0.00
0.20
0.40
0.60
0.80
1.00
1.20
1.40
16-17 years 18-20 yearsDriver Group
RAIR
s
Two Vehicle Involvement Ratio
1.26
0.90
0.00
0.20
0.40
0.60
0.80
1.00
1.20
1.40
16-17 years 18-20 yearsDriver Group
RAIR
m
5 All ratios are statistically significant based on binary logistic regression at the 0.05 level.
Aultman-Hall and Padlo Page 12
Figure 3: The Relative Impact of Road Class on Crash Causing Propensity6 a) Single Vehicle Involvement Ratio b) Two Vehicle Involvement Ratio
Single Vehicle Involvement Ratio
2.11
1.47
0.73
0.00
0.50
1.00
1.50
2.00
2.50
Interstate State/US Route Local Road
Rout e C lass
RA
IRs
Two Vehicle Involvement Ratio
1.031.01 0.95
0.00
0.50
1.00
1.50
2.00
2.50
Interstate State/US Route Local Road
R o ute C lass
RA
IRm
6 State/US route and interstate for two vehicle crashes are not statistically different from 1.0, all other ratios are statistically significant based on binary logistic regression at the 0.05 level.
Aultman-Hall and Padlo Page 13
Figure 4: The Relative Impact of Light Conditions on Crash Causing Propensity7 a) Single Vehicle Involvement Ratio b) Two Vehicle Involvement Ratio
Single Vehicle Involvement Ratio
1.27
1.66
0.68
0.00
0.20
0.40
0.60
0.80
1.00
1.20
1.40
1.60
1.80
Daylight Dark Dusk/DawnLight Conditions
RA
IRs
Two Vehicle Involvement Ratio
1.03
0.82
1.09
0.00
0.20
0.40
0.60
0.80
1.00
1.20
1.40
1.60
1.80
Daylight Dark Dusk / Dawn
Light Conditions
RA
IRm
7 Dusk/dawn for two vehicle crashes are not statistically different from 1.0, all other ratios are statistically significant based on binary logistic regression at the 0.05 level.
Aultman-Hall and Padlo Page 14
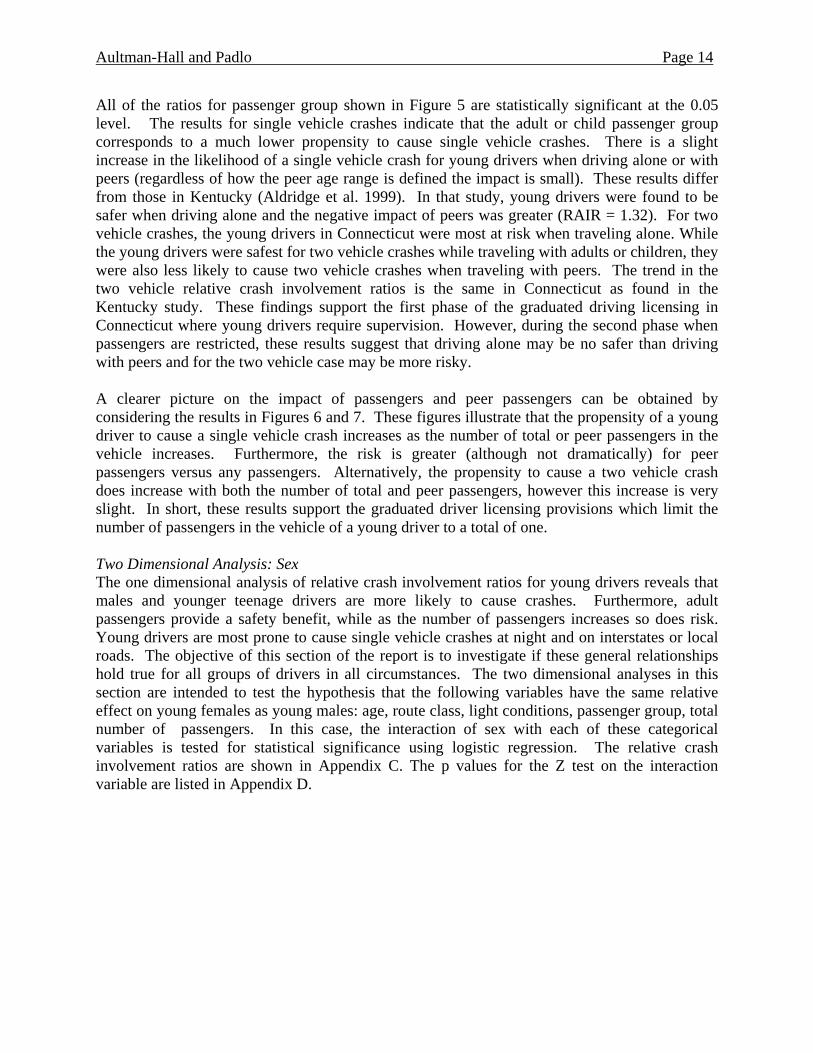
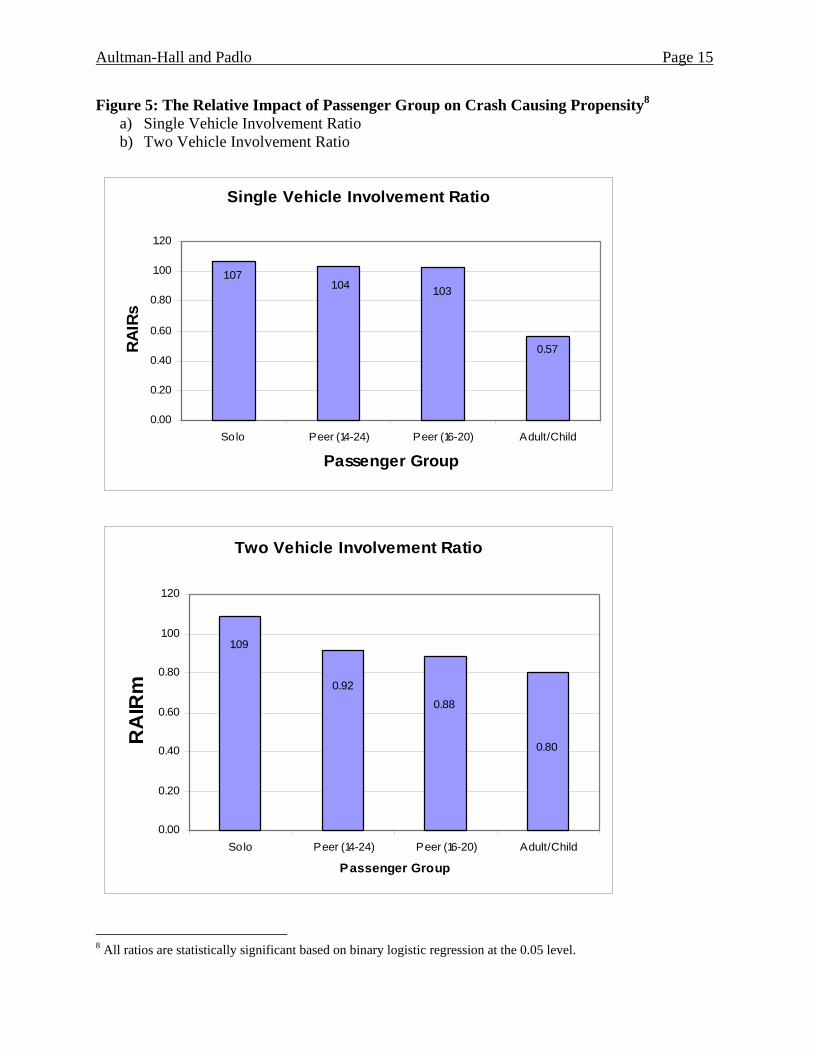
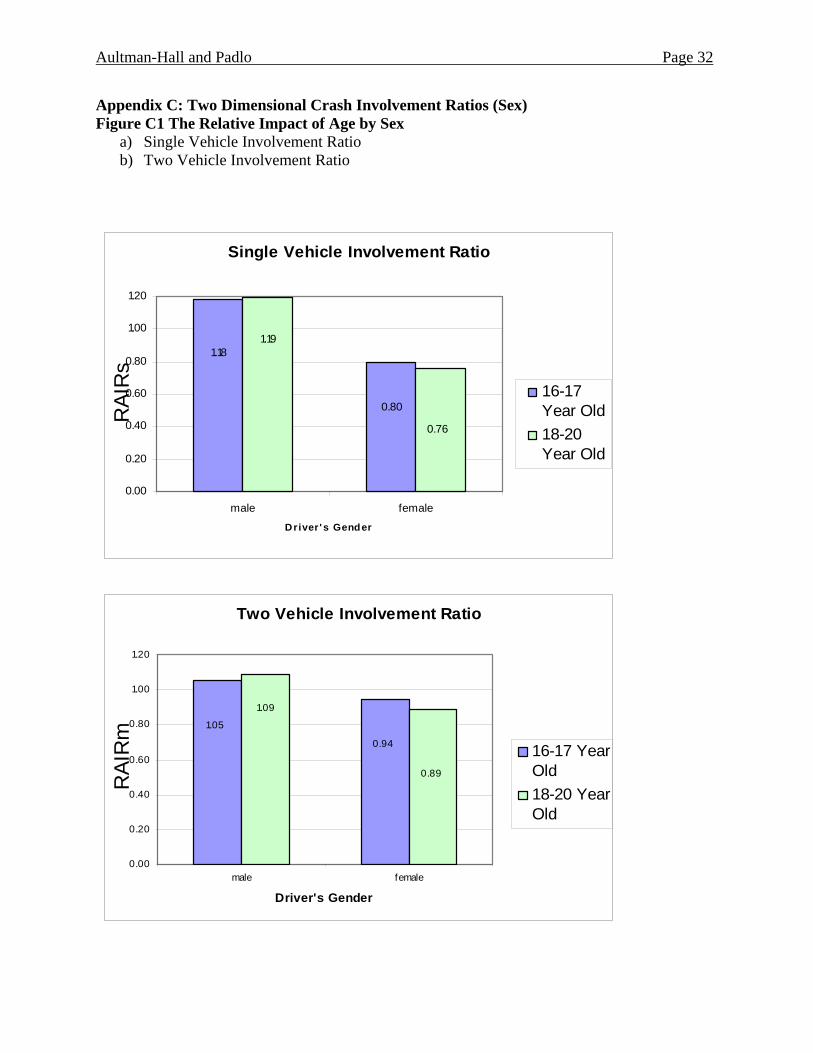
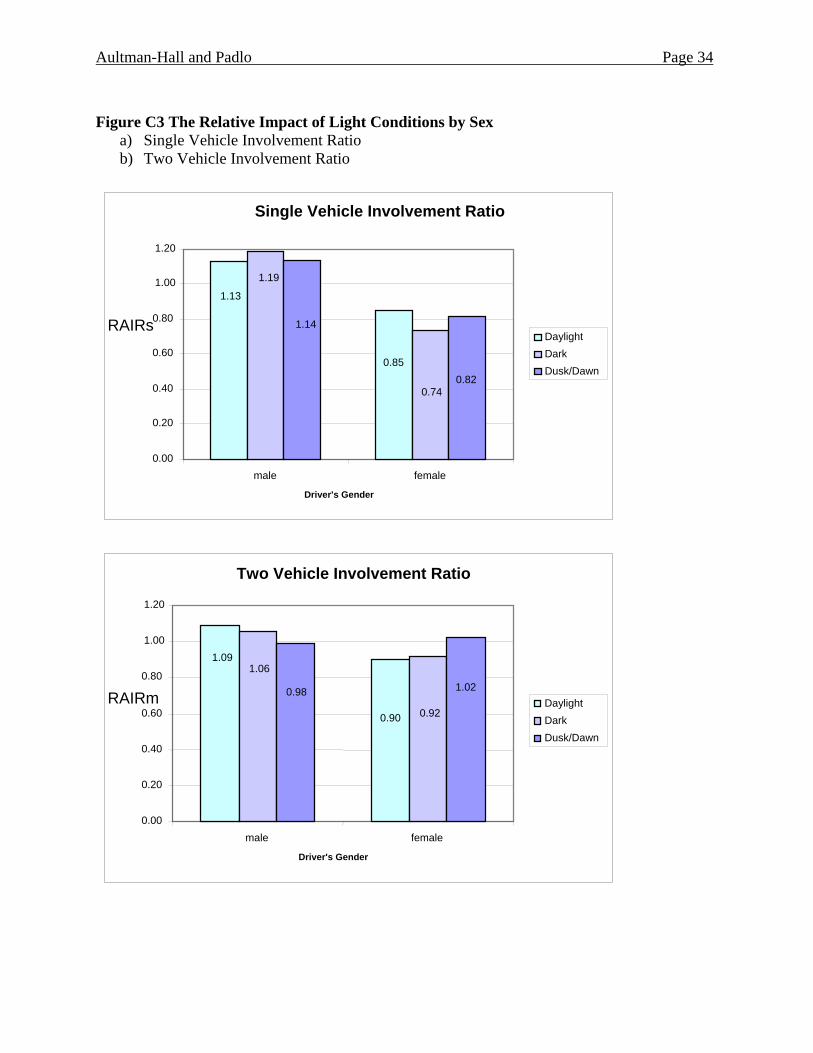
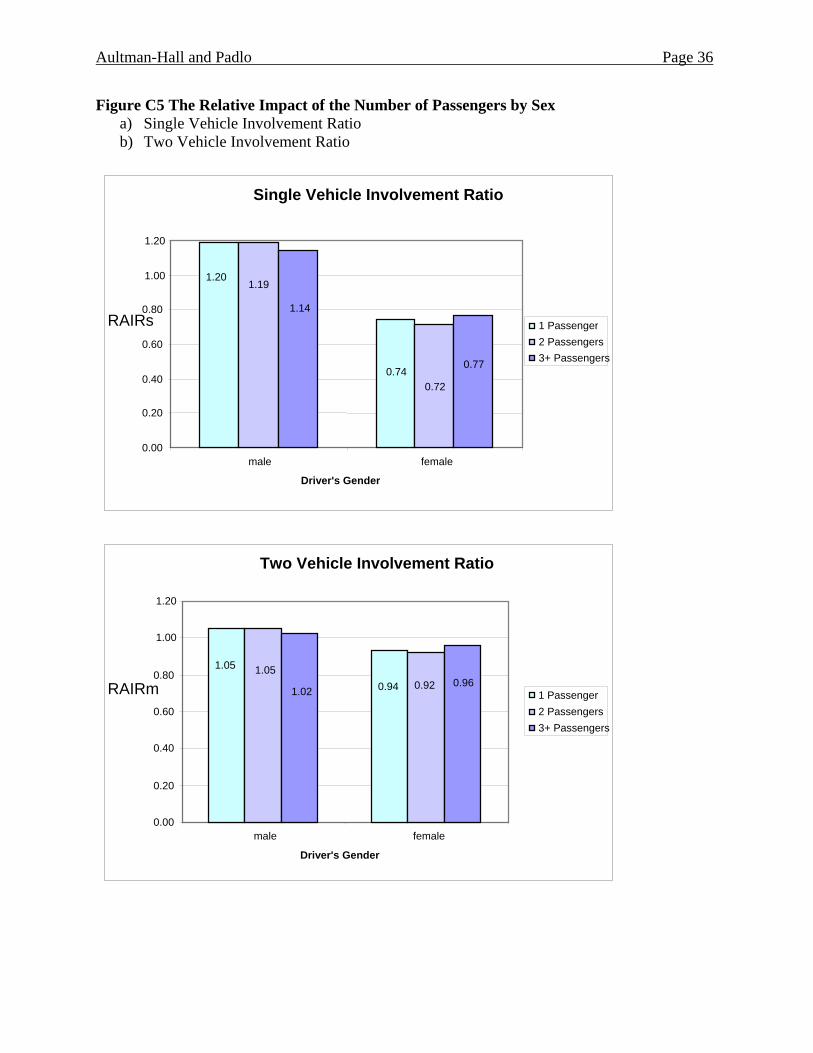
All of the ratios for passenger group shown in Figure 5 are statistically significant at the 0.05 level. The results for single vehicle crashes indicate that the adult or child passenger group corresponds to a much lower propensity to cause single vehicle crashes. There is a slight increase in the likelihood of a single vehicle crash for young drivers when driving alone or with peers (regardless of how the peer age range is defined the impact is small). These results differ from those in Kentucky (Aldridge et al. 1999). In that study, young drivers were found to be safer when driving alone and the negative impact of peers was greater (RAIR = 1.32). For two vehicle crashes, the young drivers in Connecticut were most at risk when traveling alone. While the young drivers were safest for two vehicle crashes while traveling with adults or children, they were also less likely to cause two vehicle crashes when traveling with peers. The trend in the two vehicle relative crash involvement ratios is the same in Connecticut as found in the Kentucky study. These findings support the first phase of the graduated driving licensing in Connecticut where young drivers require supervision. However, during the second phase when passengers are restricted, these results suggest that driving alone may be no safer than driving with peers and for the two vehicle case may be more risky. A clearer picture on the impact of passengers and peer passengers can be obtained by considering the results in Figures 6 and 7. These figures illustrate that the propensity of a young driver to cause a single vehicle crash increases as the number of total or peer passengers in the vehicle increases. Furthermore, the risk is greater (although not dramatically) for peer passengers versus any passengers. Alternatively, the propensity to cause a two vehicle crash does increase with both the number of total and peer passengers, however this increase is very slight. In short, these results support the graduated driver licensing provisions which limit the number of passengers in the vehicle of a young driver to a total of one. Two Dimensional Analysis: Sex The one dimensional analysis of relative crash involvement ratios for young drivers reveals that males and younger teenage drivers are more likely to cause crashes. Furthermore, adult passengers provide a safety benefit, while as the number of passengers increases so does risk. Young drivers are most prone to cause single vehicle crashes at night and on interstates or local roads. The objective of this section of the report is to investigate if these general relationships hold true for all groups of drivers in all circumstances. The two dimensional analyses in this section are intended to test the hypothesis that the following variables have the same relative effect on young females as young males: age, route class, light conditions, passenger group, total number of passengers. In this case, the interaction of sex with each of these categorical variables is tested for statistical significance using logistic regression. The relative crash involvement ratios are shown in Appendix C. The p values for the Z test on the interaction variable are listed in Appendix D.
Aultman-Hall and Padlo Page 15
Figure 5: The Relative Impact of Passenger Group on Crash Causing Propensity8 a) Single Vehicle Involvement Ratio b) Two Vehicle Involvement Ratio
Single Vehicle Involvement Ratio
1.031.041.07
0.57
0.00
0.20
0.40
0.60
0.80
1.00
1.20
Solo Peer (14-24) Peer (16-20) Adult/Child
Passenger Group
RA
IRs
Two Vehicle Involvement Ratio
0.80
0.88
0.92
1.09
0.00
0.20
0.40
0.60
0.80
1.00
1.20
Solo Peer (14-24) Peer (16-20) Adult/Child
Passenger Group
RA
IRm
8 All ratios are statistically significant based on binary logistic regression at the 0.05 level.
Aultman-Hall and Padlo Page 16
Figure 6: The Relative Impact of the Total Number of Passengers on Crash Causing Propensity9
a) Single Vehicle Involvement Ratio b) Two Vehicle Involvement Ratio
Single Vehicle Involvement Ratio
1.09
1.37
0.91
0.00
0.20
0.40
0.60
0.80
1.00
1.20
1.40
1 Passenger 2 Passengers 3+ Passengers
Passenger Count
RAIR
s
Two Vehicle Involvement Ratio
0.97 1.041.09
0.00
0.20
0.40
0.60
0.80
1.00
1.20
1.40
1 Passenger 2 Passengers 3+ Passengers
Passenger Count
RAIR
m
9 The ratio for 2 passengers for two vehicle crashes is not statistically different from 1.0, all other ratios are statistically significant based on binary logistic regression at the 0.05 level.

Aultman-Hall and Padlo Page 17
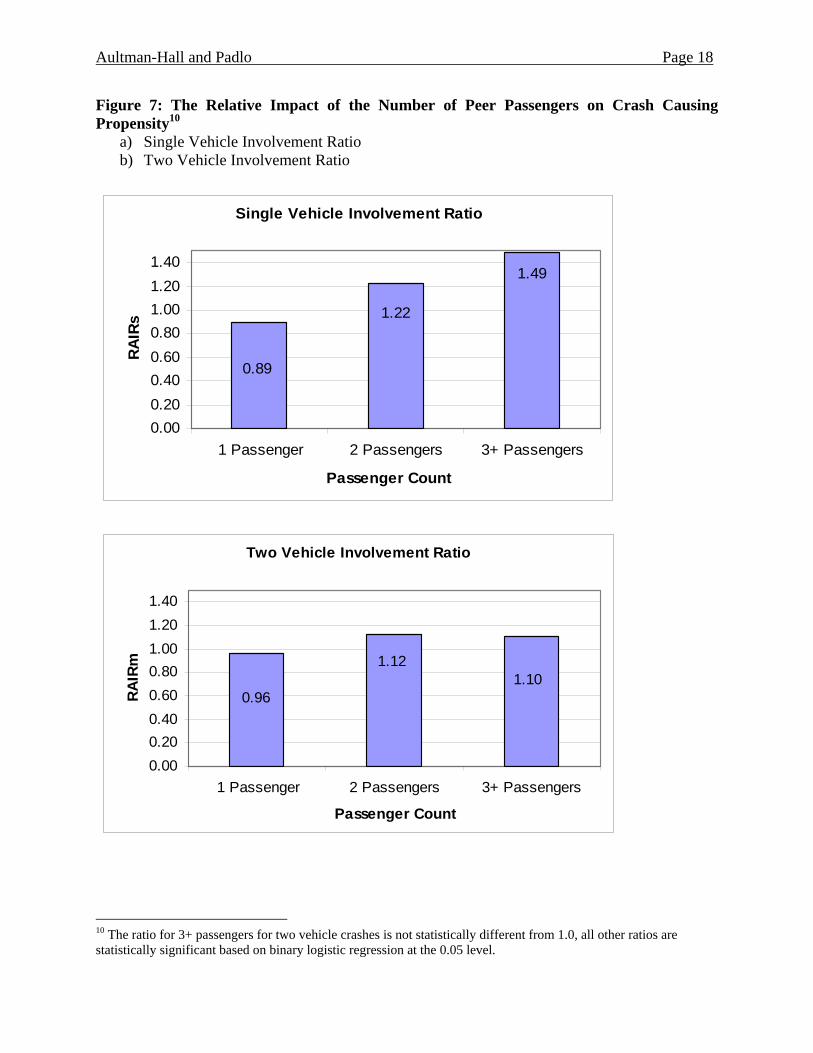
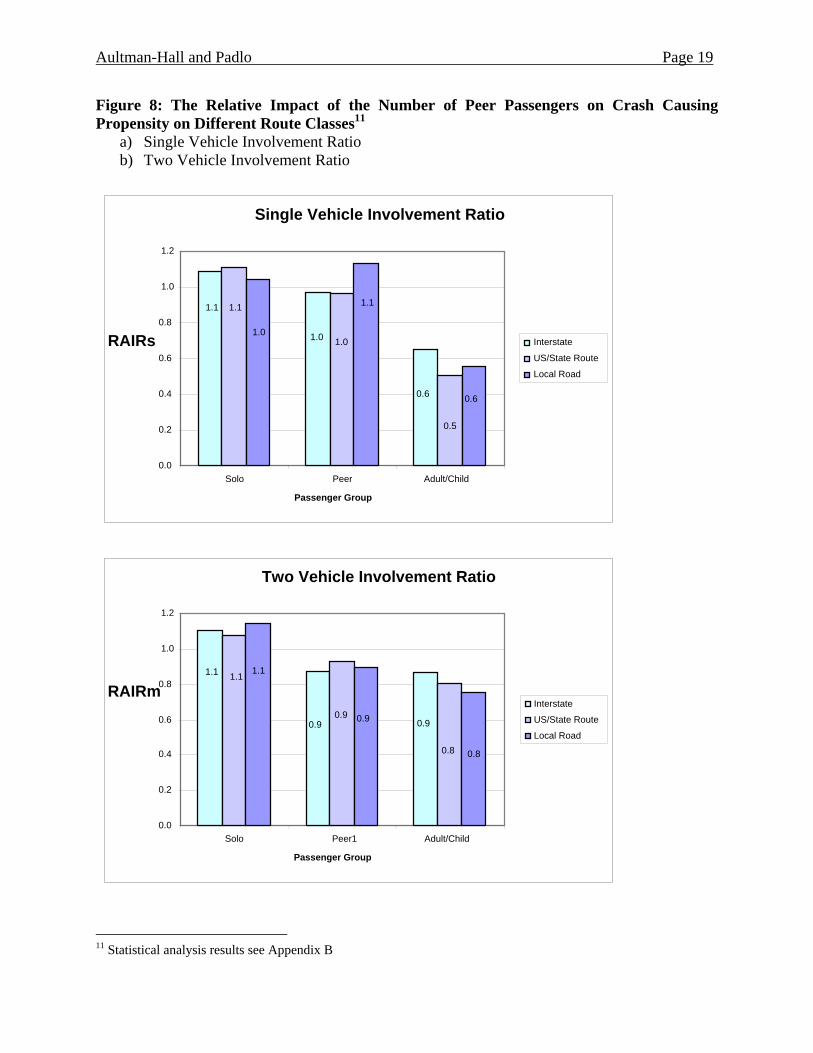
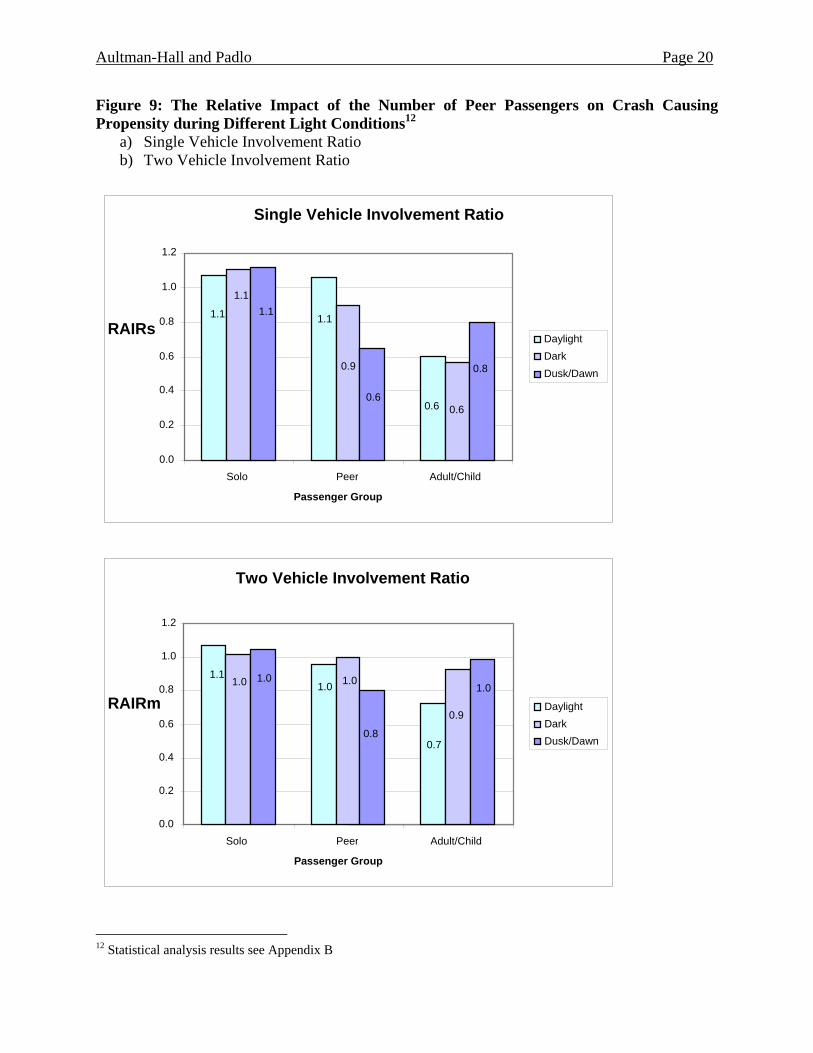
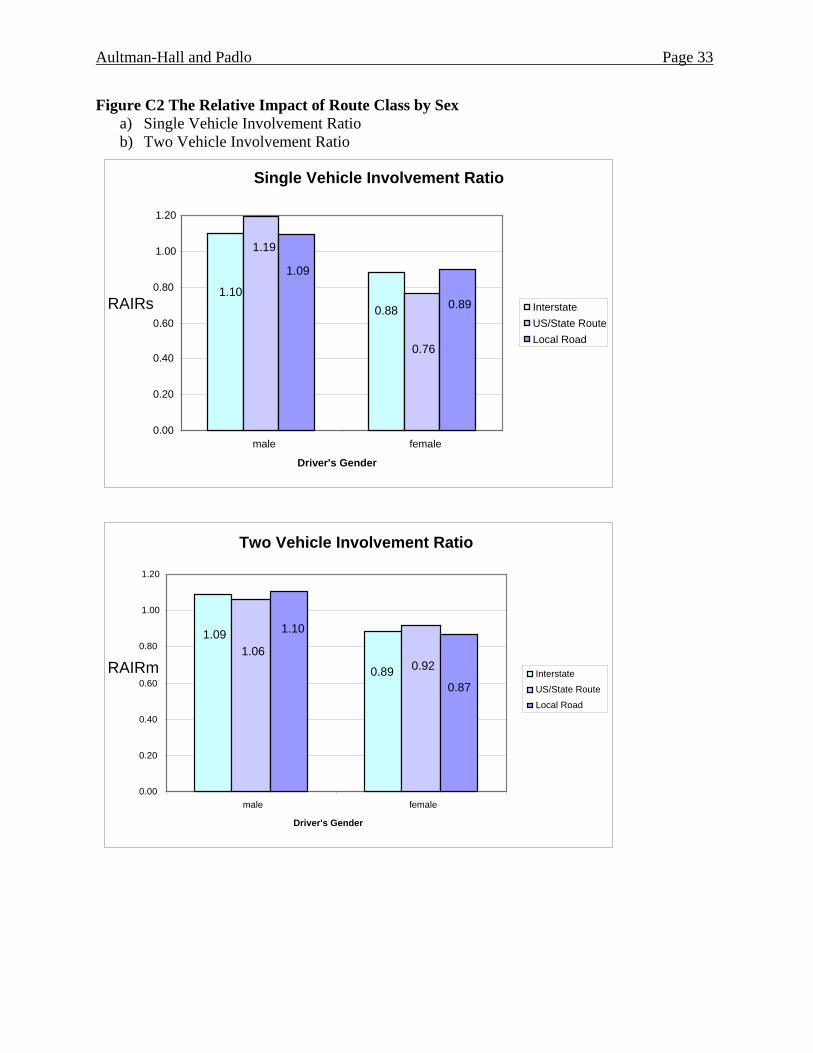
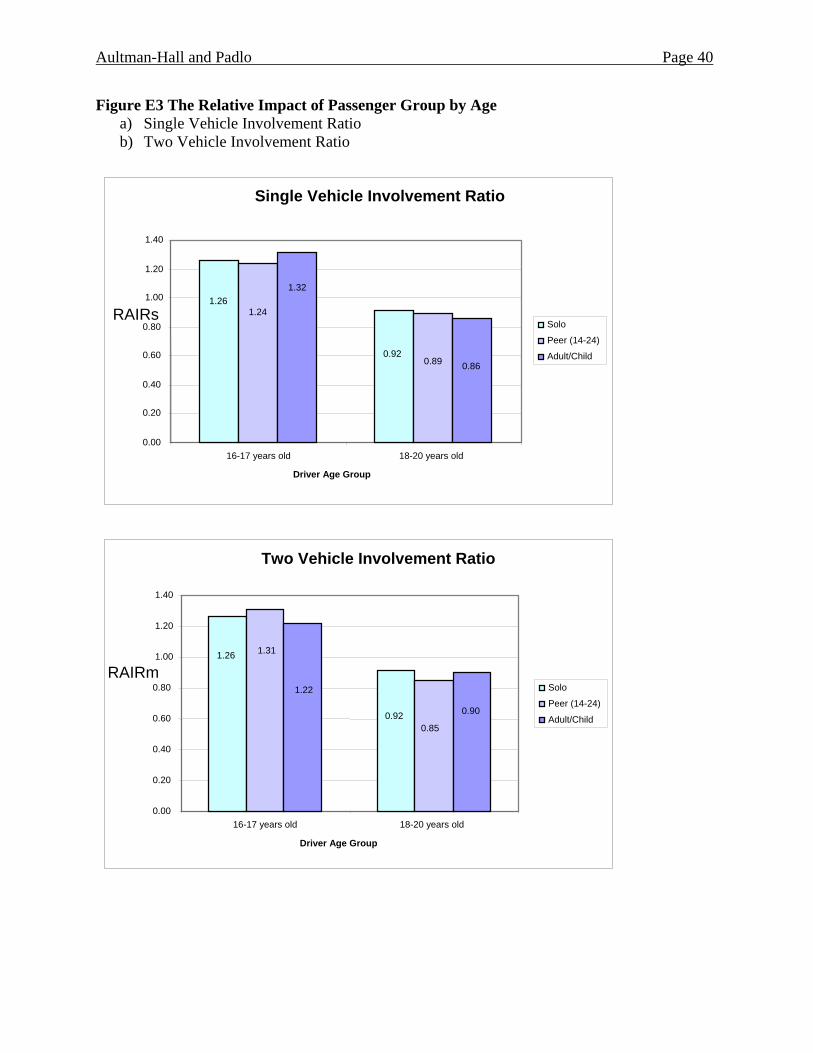
No statistically significant difference was found between the impact of the number of total or peer passengers on young men versus women drivers. The relative crash causing propensity for young males and females was not different for two vehicle crashes for different light conditions or road classes. Furthermore, the relative single vehicle crash involvement ratio for 16 and 17 year old drivers versus 18 to 20 years old drivers is consistent between males and females. In other words, in all the preceding cases the relative crash involvement ratio for males versus females is consistent in all of the circumstances tested here. The differences between younger and older teen drivers in two vehicle crashes was very slight and not considered meaningful. However, two statistically significant differences were found for single vehicle crashes. In dark conditions males are even more at risk that females. Males are also more at risk on US and state routes than their female counterparts. Similarly, females are at relatively more risk on interstates and local roads. These differences are not large. Two Dimensional Analysis: Age The following variables were tested to determine if they have the same relative effect on 16 and 17 year old drivers as they do on 18 to 20 year old drivers: route class, light conditions, passenger group, and total number of passengers. The crash ratio charts are shown in Appendix E, while the statistics from the logistic regression models are shown in Appendix D. In this case, the statistically significant differences were again found for route class and light conditions for both single and two vehicle crashes. The 16 and 17 year old drivers were at a relatively higher risk on local roads for both types of crashes. Furthermore, the results for light conditions indicate that the younger teens are more at risk in the daylight for single vehicle crashes, but more at risk in the dark for two vehicle crashes. Two Dimensional Analysis: Passenger Group The two dimensional analysis for passenger group considered whether route class and light conditions interacted with the relative propensity for the young drivers to cause crashes when traveling with different passenger groups. Again in these results, few dramatic departures from the overall patterns found in the one dimensional crash involvement ratios were found. The results for route class are shown in Figure 8 (statistics are reported in Appendix D). Both the interaction for single and two vehicle crashes are statistically significant but the magnitude of the impact is again small. The only noteworthy difference is for the case of peer passengers on local roads. This combination increases the crash risk for young drivers and supports the assertion above that local road crashes result from risky driving behavior. The results in Figure 9 are only significant for the single vehicle crash case. This result indicates that the young drivers are less likely to cause a crash during the dark when traveling with peers or during the dusk/dawn conditions. The adult or child passenger group also seems to provide less benefit during dusk and dawn conditions. Figure 9 provides further evidence that the relationship between passengers and safety for young drivers is not straightforward. While in some circumstances passengers may provide a benefit, in other cases they provide a hindrance or risk taking motivation.
Aultman-Hall and Padlo Page 18
Figure 7: The Relative Impact of the Number of Peer Passengers on Crash Causing Propensity10
a) Single Vehicle Involvement Ratio b) Two Vehicle Involvement Ratio
Single Vehicle Involvement Ratio
0.89
1.49
1.22
0.000.200.400.600.801.001.201.40
1 Passenger 2 Passengers 3+ Passengers
Passenger Count
RA
IRs
Two Vehicle Involvement Ratio
1.101.12
0.96
0.000.200.400.600.801.001.201.40
1 Passenger 2 Passengers 3+ Passengers
Passenger Count
RAIR
m
10 The ratio for 3+ passengers for two vehicle crashes is not statistically different from 1.0, all other ratios are statistically significant based on binary logistic regression at the 0.05 level.
Aultman-Hall and Padlo Page 19
Figure 8: The Relative Impact of the Number of Peer Passengers on Crash Causing Propensity on Different Route Classes11
a) Single Vehicle Involvement Ratio b) Two Vehicle Involvement Ratio
11 Statistical analysis results see Appendix B
Two Vehicle Involvement Ratio
1.1
0.90.9
1.1
0.8
0.9
1.1
0.8
0.9
0.0
0.2
0.4
0.6
0.8
1.0
1.2
Solo Peer1 Adult/Child
Passenger Group
RAIRm Interstate
US/State Route
Local Road
Single Vehicle Involvement Ratio
1.0
0.6
1.1
1.0
0.5
1.1 1.1
0.6
1.0
0.0
0.2
0.4
0.6
0.8
1.0
1.2
Solo Peer Adult/Child
Passenger Group
RAIRs Interstate
US/State Route
Local Road
Aultman-Hall and Padlo Page 20
Figure 9: The Relative Impact of the Number of Peer Passengers on Crash Causing Propensity during Different Light Conditions12
a) Single Vehicle Involvement Ratio b) Two Vehicle Involvement Ratio
12 Statistical analysis results see Appendix B
Single Vehicle Involvement Ratio
1.1
0.6
1.1
1.1
0.6
0.9
1.1
0.8
0.6
0.0
0.2
0.4
0.6
0.8
1.0
1.2
Solo Peer Adult/Child
Passenger Group
RAIRs Daylight DarkDusk/Dawn
Two Vehicle Involvement Ratio
1.0
0.7
1.1 1.0
0.9
1.0
0.8
1.01.0
0.0
0.2
0.4
0.6
0.8
1.0
1.2
Solo Peer Adult/Child
Passenger Group
RAIRm Daylight DarkDusk/Dawn
Aultman-Hall and Padlo Page 21
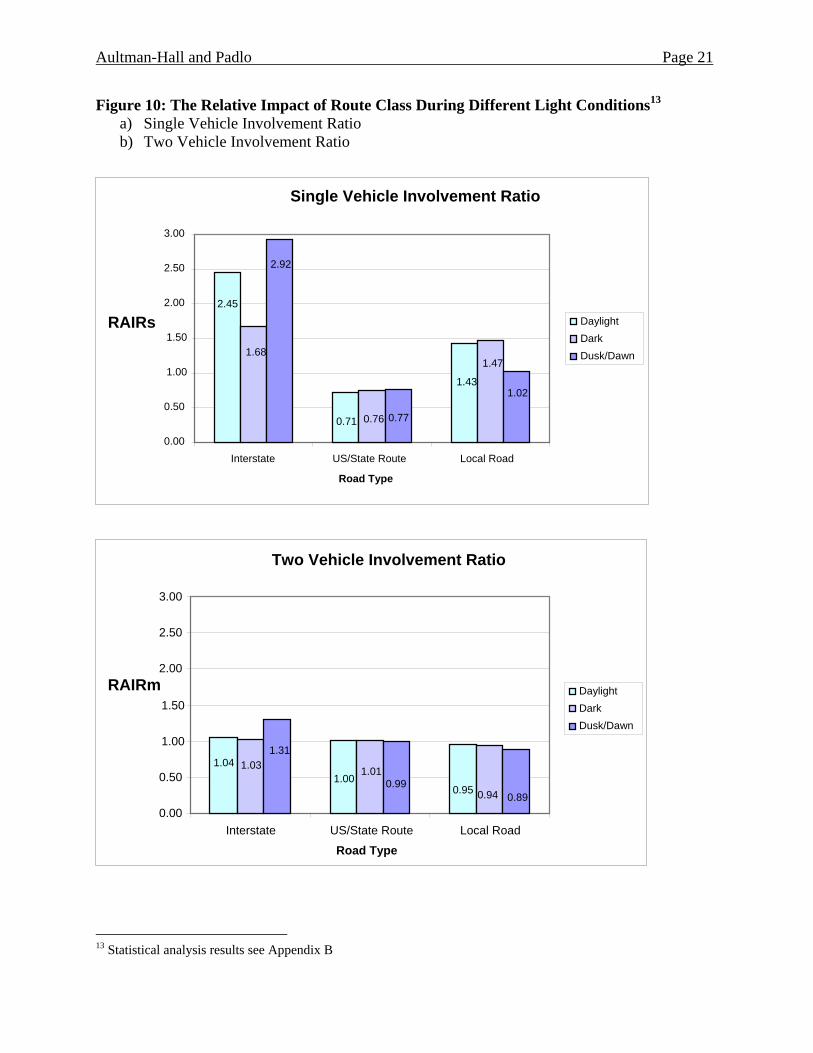
Figure 10: The Relative Impact of Route Class During Different Light Conditions13 a) Single Vehicle Involvement Ratio b) Two Vehicle Involvement Ratio
13 Statistical analysis results see Appendix B
Single Vehicle Involvement Ratio
2.45
1.43
0.71
1.68 1.47
0.76
2.92
1.02
0.77
0.00
0.50
1.00
1.50
2.00
2.50
3.00
Interstate US/State Route Local Road
Road Type
RAIRs Daylight DarkDusk/Dawn
Two Vehicle Involvement Ratio
1.000.95
1.04 1.01
0.94
1.03
0.990.89
1.31
0.00
0.50
1.00
1.50
2.00
2.50
3.00
Interstate US/State Route Local Road
Road Type
RAIRm Daylight Dark Dusk/Dawn
Aultman-Hall and Padlo Page 22
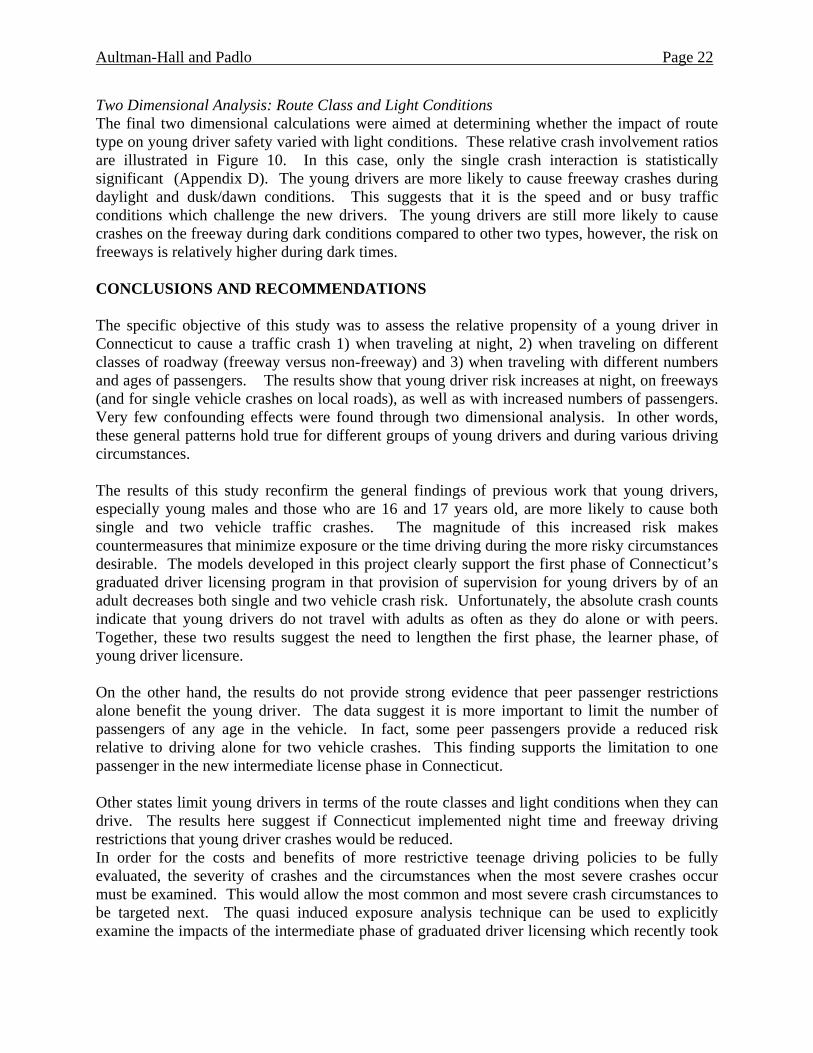
Two Dimensional Analysis: Route Class and Light Conditions The final two dimensional calculations were aimed at determining whether the impact of route type on young driver safety varied with light conditions. These relative crash involvement ratios are illustrated in Figure 10. In this case, only the single crash interaction is statistically significant (Appendix D). The young drivers are more likely to cause freeway crashes during daylight and dusk/dawn conditions. This suggests that it is the speed and or busy traffic conditions which challenge the new drivers. The young drivers are still more likely to cause crashes on the freeway during dark conditions compared to other two types, however, the risk on freeways is relatively higher during dark times. CONCLUSIONS AND RECOMMENDATIONS The specific objective of this study was to assess the relative propensity of a young driver in Connecticut to cause a traffic crash 1) when traveling at night, 2) when traveling on different classes of roadway (freeway versus non-freeway) and 3) when traveling with different numbers and ages of passengers. The results show that young driver risk increases at night, on freeways (and for single vehicle crashes on local roads), as well as with increased numbers of passengers. Very few confounding effects were found through two dimensional analysis. In other words, these general patterns hold true for different groups of young drivers and during various driving circumstances. The results of this study reconfirm the general findings of previous work that young drivers, especially young males and those who are 16 and 17 years old, are more likely to cause both single and two vehicle traffic crashes. The magnitude of this increased risk makes countermeasures that minimize exposure or the time driving during the more risky circumstances desirable. The models developed in this project clearly support the first phase of Connecticut’s graduated driver licensing program in that provision of supervision for young drivers by of an adult decreases both single and two vehicle crash risk. Unfortunately, the absolute crash counts indicate that young drivers do not travel with adults as often as they do alone or with peers. Together, these two results suggest the need to lengthen the first phase, the learner phase, of young driver licensure. On the other hand, the results do not provide strong evidence that peer passenger restrictions alone benefit the young driver. The data suggest it is more important to limit the number of passengers of any age in the vehicle. In fact, some peer passengers provide a reduced risk relative to driving alone for two vehicle crashes. This finding supports the limitation to one passenger in the new intermediate license phase in Connecticut. Other states limit young drivers in terms of the route classes and light conditions when they can drive. The results here suggest if Connecticut implemented night time and freeway driving restrictions that young driver crashes would be reduced. In order for the costs and benefits of more restrictive teenage driving policies to be fully evaluated, the severity of crashes and the circumstances when the most severe crashes occur must be examined. This would allow the most common and most severe crash circumstances to be targeted next. The quasi induced exposure analysis technique can be used to explicitly examine the impacts of the intermediate phase of graduated driver licensing which recently took

Aultman-Hall and Padlo Page 23
effect in Connecticut. The 2004-2006 time frame and crash involvement ratios can be compared to the study period used here. It is recommended that future work directly address the magnitude of the benefits associated with time extensions of the current young driver restrictions (from 6 to 12 months for example).
ACKNOWLEDGMENTS
The authors would like to acknowledge the assistance of the Connecticut Department of Transportation’s Office of Inventory and Data in the Bureau of Policy and Planning for providing the raw data for this analysis. Dr. Nikiforos Stamatiadis, Dr. John Ivan, Zuxuan Deng, Gordon Edington, Jeffrey LaMondia and Jianhe Du assisted in completing this research. REFERENCES CITED Agent, KR; L. Steenbergen, J. G. Pigman, JG; P. S. Kidd, C. McCoy, S. H. Pollack (2001). “Impact of Partial Graduated Driver’s Licensing Program on Teen Motor Vehicle Crashes In Kentucky.” Transportation Research Record 1779. Aldridge, Brain, Meredith Himmler, Lisa Aultman-Hall, and Nikiforos Stamatiadis. (1999) “The Impact of Passengers on Young Driver Safety.” Transportation Research Record 1693, pages 25-30. Basch, CE; DeCicco, IM; and Malfetti, JL. (1989). “A focus group study on decision processes of young drivers: reasons that may support a decision to drink and drive.” Health Education Quarterly 16(3):389-396. Chen L, S Baker, E Braver, and G Li. (2000) “Carrying passengers as a risk factor for crashes fatal to 16- and 17-year old drivers.” Journal of the American Medical Association, 283(12), pp.1578–82. Dejoy D. M. (1989) “The Optimism Bias and Traffic Accident Risk Perception” Accident Analysis and Prevention, 21, pp.333-340. Doyle James K. (1997) “Judging Cumulative Risk”, Journal of Applied Social Psychology, Vol. 27, pp.500-524. Eby, D.W. & Molnar, L.J. (1999). Matching Safety Strategies to Youth Characteristics: A Literature Review of Cognitive Development. Report No. DOT-HS-808-927. Washington, DC: US Department of Transportation. Evans, Leonard. (1991). Traffic Safety and The Driver. New York: Van Nostrand Reinhold. Finn P. and Bragg B. (1986) “Perception of the risk of an accident by younger and older drivers.” Accident Analysis and Prevention, 18, pp.289-298.

Aultman-Hall and Padlo Page 24
Foss, R. D. and J. Feaganes and E. Rodgman (2001). “Initial Effects of Graduated Driver Licensing on 16-year Old Driver Crashes in North Carolina.” Journal of the American Medical Association, 286, pp.1588–1592. Kirk A. and N. Stamatiadis (2001). “Crash Rates and Traffic Maneuvers of Younger Drivers” Transportation Research Record 1779. NHTSA (1998) Saving Teenage Lives: The Case for Graduated Driver Licensing. Washington, D.C.: U.S. Department of Transportation, November. NHTSA (2000) 1998 Youth Fatal Crash and Alcohol Facts Washington, D.C.: U.S. Department of Transportation, March. Stamatiadis, N. and J.A. Deacon, J.A. (1995). “Effects of an aging population on accident propensity.” Accident Analysis and Prevention, 27:4, 443-459. Stamatiadis, Nikiforos, Samantha Jones and Lisa Aultman-Hall. (1999) “Causal Factors for Accidents on Southeast Low-volume Roads” Transportation Research Record 1652, pages 111-117. Ulmer R. G., S. Ferguson, A. Williams, D. Preusser. (2001). “Teenage Crash Reduction Associated with Delayed Licensure in Connecticut.” Journal of Safety Research 32, pp. 31-41.

Aultman-Hall and Padlo Page 25
Appendices
Aultman-Hall and Padlo Page 26
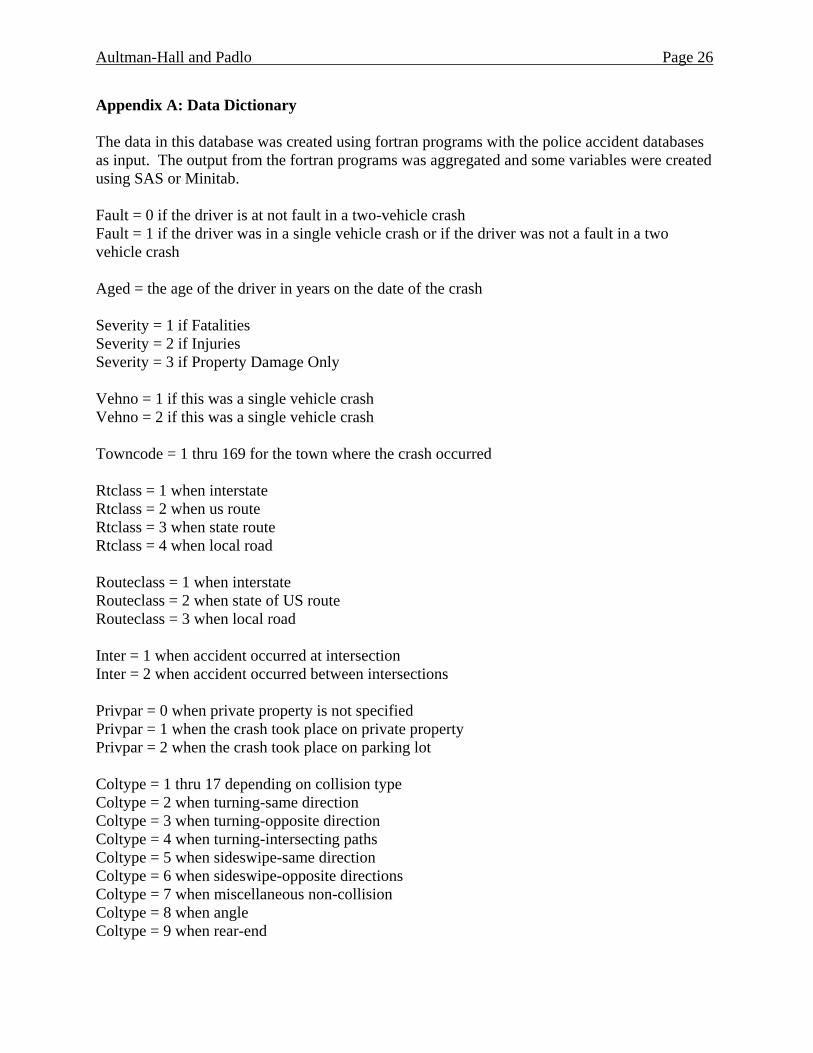
Appendix A: Data Dictionary The data in this database was created using fortran programs with the police accident databases as input. The output from the fortran programs was aggregated and some variables were created using SAS or Minitab. Fault = 0 if the driver is at not fault in a two-vehicle crash Fault = 1 if the driver was in a single vehicle crash or if the driver was not a fault in a two vehicle crash Aged = the age of the driver in years on the date of the crash Severity = 1 if Fatalities Severity = 2 if Injuries Severity = 3 if Property Damage Only Vehno = 1 if this was a single vehicle crash Vehno = 2 if this was a single vehicle crash Towncode = 1 thru 169 for the town where the crash occurred Rtclass = 1 when interstate Rtclass = 2 when us route Rtclass = 3 when state route Rtclass = 4 when local road Routeclass = 1 when interstate Routeclass = 2 when state of US route Routeclass = 3 when local road Inter = 1 when accident occurred at intersection Inter = 2 when accident occurred between intersections Privpar = 0 when private property is not specified Privpar = 1 when the crash took place on private property Privpar = 2 when the crash took place on parking lot Coltype = 1 thru 17 depending on collision type Coltype = 2 when turning-same direction Coltype = 3 when turning-opposite direction Coltype = 4 when turning-intersecting paths Coltype = 5 when sideswipe-same direction Coltype = 6 when sideswipe-opposite directions Coltype = 7 when miscellaneous non-collision Coltype = 8 when angle Coltype = 9 when rear-end
Aultman-Hall and Padlo Page 27
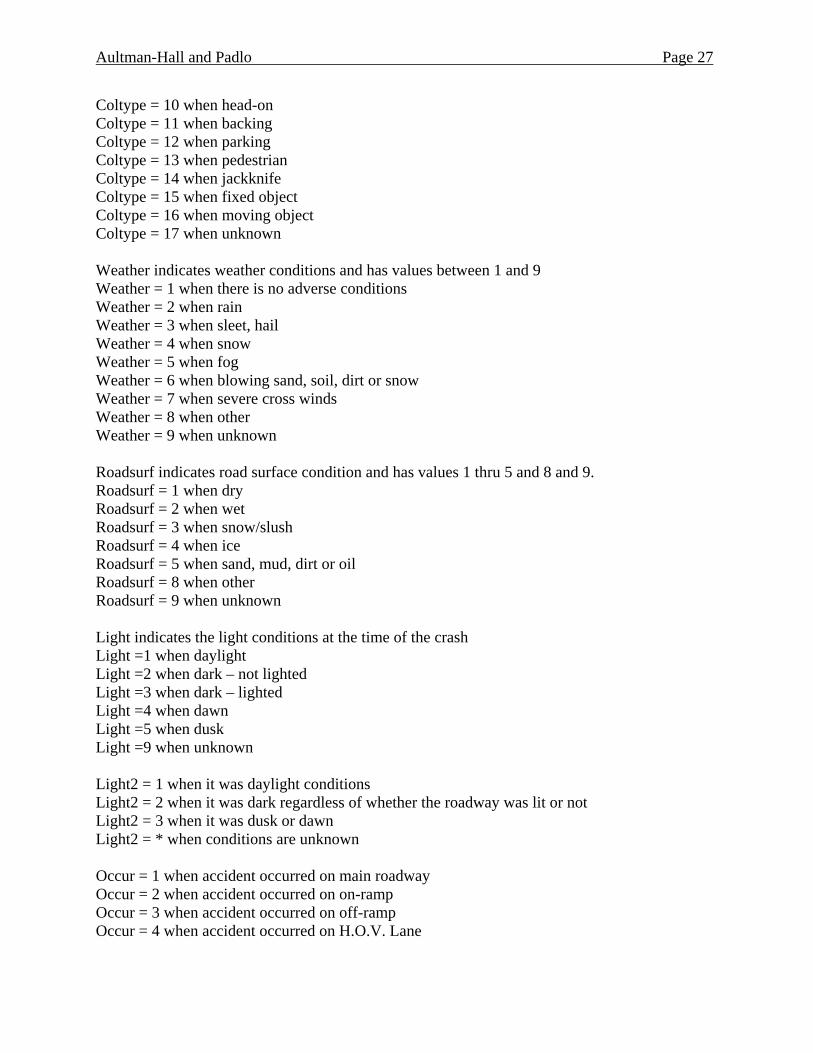
Coltype = 10 when head-on Coltype = 11 when backing Coltype = 12 when parking Coltype = 13 when pedestrian Coltype = 14 when jackknife Coltype = 15 when fixed object Coltype = 16 when moving object Coltype = 17 when unknown Weather indicates weather conditions and has values between 1 and 9 Weather = 1 when there is no adverse conditions Weather = 2 when rain Weather = 3 when sleet, hail Weather = 4 when snow Weather = 5 when fog Weather = 6 when blowing sand, soil, dirt or snow Weather = 7 when severe cross winds Weather = 8 when other Weather = 9 when unknown Roadsurf indicates road surface condition and has values 1 thru 5 and 8 and 9. Roadsurf = 1 when dry Roadsurf = 2 when wet Roadsurf = 3 when snow/slush Roadsurf = 4 when ice Roadsurf = 5 when sand, mud, dirt or oil Roadsurf = 8 when other Roadsurf = 9 when unknown Light indicates the light conditions at the time of the crash Light =1 when daylight Light =2 when dark – not lighted Light =3 when dark – lighted Light =4 when dawn Light =5 when dusk Light =9 when unknown Light2 = 1 when it was daylight conditions Light2 = 2 when it was dark regardless of whether the roadway was lit or not Light2 = 3 when it was dusk or dawn Light2 = * when conditions are unknown Occur = 1 when accident occurred on main roadway Occur = 2 when accident occurred on on-ramp Occur = 3 when accident occurred on off-ramp Occur = 4 when accident occurred on H.O.V. Lane
Aultman-Hall and Padlo Page 28
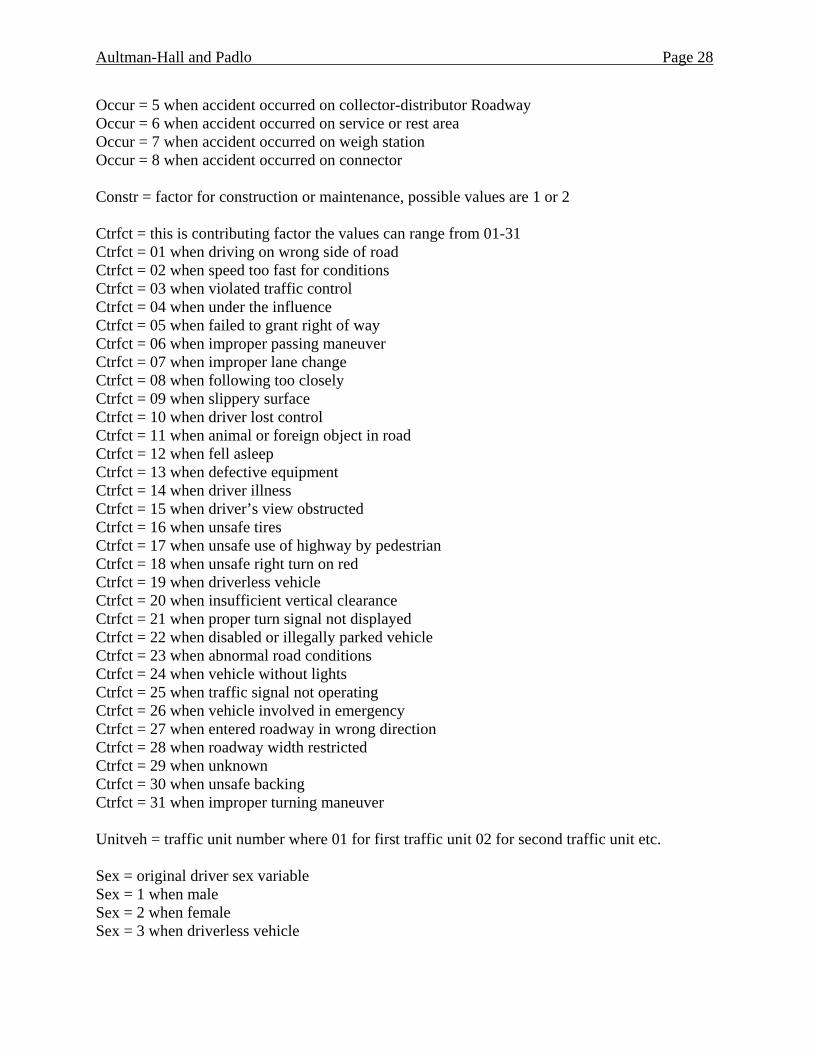
Occur = 5 when accident occurred on collector-distributor Roadway Occur = 6 when accident occurred on service or rest area Occur = 7 when accident occurred on weigh station Occur = 8 when accident occurred on connector Constr = factor for construction or maintenance, possible values are 1 or 2 Ctrfct = this is contributing factor the values can range from 01-31 Ctrfct = 01 when driving on wrong side of road Ctrfct = 02 when speed too fast for conditions Ctrfct = 03 when violated traffic control Ctrfct = 04 when under the influence Ctrfct = 05 when failed to grant right of way Ctrfct = 06 when improper passing maneuver Ctrfct = 07 when improper lane change Ctrfct = 08 when following too closely Ctrfct = 09 when slippery surface Ctrfct = 10 when driver lost control Ctrfct = 11 when animal or foreign object in road Ctrfct = 12 when fell asleep Ctrfct = 13 when defective equipment Ctrfct = 14 when driver illness Ctrfct = 15 when driver’s view obstructed Ctrfct = 16 when unsafe tires Ctrfct = 17 when unsafe use of highway by pedestrian Ctrfct = 18 when unsafe right turn on red Ctrfct = 19 when driverless vehicle Ctrfct = 20 when insufficient vertical clearance Ctrfct = 21 when proper turn signal not displayed Ctrfct = 22 when disabled or illegally parked vehicle Ctrfct = 23 when abnormal road conditions Ctrfct = 24 when vehicle without lights Ctrfct = 25 when traffic signal not operating Ctrfct = 26 when vehicle involved in emergency Ctrfct = 27 when entered roadway in wrong direction Ctrfct = 28 when roadway width restricted Ctrfct = 29 when unknown Ctrfct = 30 when unsafe backing Ctrfct = 31 when improper turning maneuver Unitveh = traffic unit number where 01 for first traffic unit 02 for second traffic unit etc. Sex = original driver sex variable Sex = 1 when male Sex = 2 when female Sex = 3 when driverless vehicle
Aultman-Hall and Padlo Page 29
Sex = 9 when gender unknown Sex2 = 1 for male drivers Sex2 = 2 for male drivers Drug = 0 when no indication or unknown Drug = 1 when had been drinking (blood alcohol <0.10) Drug = 2 when intoxicated (0.10 or more) Drug = 3 when had taken drugs Drug = 4 when had been drinking and had taken drugs Drug = 5 when intoxicated and had taken drugs Defeqp = defective equipment values 1 thru 8 or blank. This is only for qualifying commercial vehicles C14less = the number of passengers age 13 and younger in the vehicle C14_20 = the number of passengers between the age of 14 and 20 years old (inclusive) in the vehicle C16_20 = the number of passengers between the age of 16 and 20 years old (inclusive) in the vehicle C20_25 = the number of passengers between the age of 20 and 24 years old (inclusive) in the vehicle C14_24 = the number of passengers between the age of 20 and 24 years old (inclusive) in the vehicle C25plus = the sum of the number of passengers age 25 and older and the number of passengers with missing age C25pluscorrect = the number of passengers age 25 and older Group = 1 when solo Group = 2 when peer group 1 when passenger age is between the age of 14 and 24 years old (inclusive) in the vehicle. Group = 3 when peer group 2 when passenger age is between the age of 16 and 20 years old (inclusive) in the vehicle. There cannot be passenger of other ages in the vehicle, otherwise the passenger group would be different. Group = 4 when the passenger age is 25 years old and older or 14 years old and younger. Other passenger age groups are allowed. Group = 5 when missing age Group2 = 1 if the driver is alone Group2 = 2 if there were passengers in the age group 14 to 24 but no other passengers of any age Group2 = 3 if there were any passengers in the age group under 14 or over 24– note that teen passengers might also be present Solo = 1 if the driver was alone with no passengers (=0 otherwise) Peer14_24 =1 if there were passengers in the age group 14 to 24 but no other passengers of any age (=0 otherwise)

Aultman-Hall and Padlo Page 30
Peer16_20 =1 if there were passengers in the age group 16 to 20 but no other passengers of any age (=0 otherwise) Adult_child =1 if there were any passengers in the age group under 14 or over 24 (=0 otherwise – note that teen passengers might also be present) Passengercount = total number of passengers of any age (including missing age) Passctcat = the passenger count category where 0, 1, and 2 equates to these number of passengers but 3 equals 3 or more Drivergroup = the young driver age group Drivergroup = 1 for ages 16 and 17 Drivergroup = 2 for ages 18 thru 20 Interstate = 1 if routeclass =1, otherwise 0 State = 1 if routeclass =2, otherwise 0 Local = 1 if routeclass =3, otherwise 0 day =1 if light2 = 1, 0 otherwise dark =1 if light2 = 2, 0 otherwise dusk/dawn =1 if light2 = 3, 0 otherwise pass1 = 1 if passctcat = 1, * if count =0, 0 otherwise pass2 = 1 if passctcat = 2, * if count =0, 0 otherwise pass3 = 1 if passctcat = 3, * if count =0, 0 otherwise teenpass1 = 1 if there is one teen passenger, 0 if there are 2 or more teen passengers (and no other passengers), * otherwise teenpass2 = 1 if there are two teen passengers, 0 if there are 1 or 3 or more teen passengers (and no other passengers), * otherwise teenpass3 = 1 if there are three teen passengers, 0 if there are 1 or 2 teen passengers (and no other passengers), * otherwise
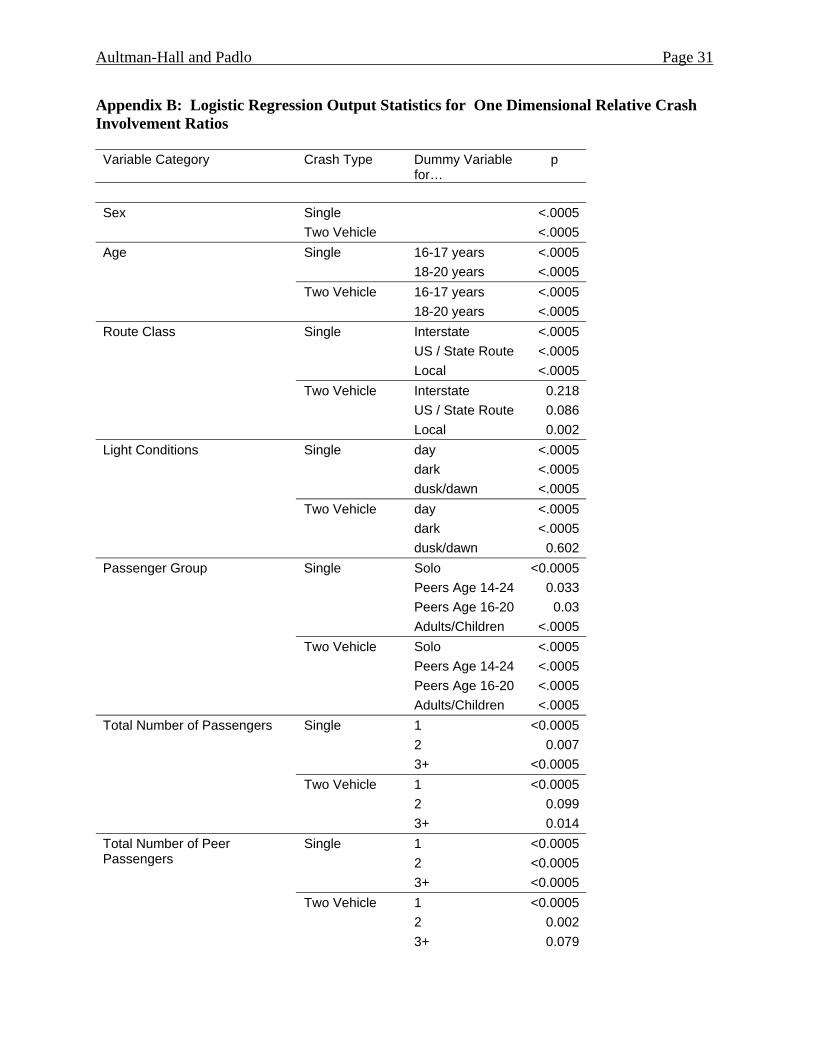
Aultman-Hall and Padlo Page 31
Appendix B: Logistic Regression Output Statistics for One Dimensional Relative Crash Involvement Ratios Variable Category Crash Type Dummy Variable
for… p
Single <.0005 Sex Two Vehicle <.0005
16-17 years <.0005 Single 18-20 years <.0005 16-17 years <.0005
Age
Two Vehicle 18-20 years <.0005 Interstate <.0005 US / State Route <.0005
Single
Local <.0005 Interstate 0.218 US / State Route 0.086
Route Class
Two Vehicle
Local 0.002 day <.0005 dark <.0005
Single
dusk/dawn <.0005 day <.0005 dark <.0005
Light Conditions
Two Vehicle
dusk/dawn 0.602 Solo <0.0005 Peers Age 14-24 0.033 Peers Age 16-20 0.03
Single
Adults/Children <.0005 Solo <.0005 Peers Age 14-24 <.0005 Peers Age 16-20 <.0005
Passenger Group
Two Vehicle
Adults/Children <.0005 1 <0.0005 2 0.007
Single
3+ <0.0005 1 <0.0005 2 0.099
Total Number of Passengers
Two Vehicle
3+ 0.014 1 <0.0005 2 <0.0005
Single
3+ <0.0005 1 <0.0005 2 0.002
Total Number of Peer Passengers
Two Vehicle
3+ 0.079
Aultman-Hall and Padlo Page 32
Appendix C: Two Dimensional Crash Involvement Ratios (Sex) Figure C1 The Relative Impact of Age by Sex
a) Single Vehicle Involvement Ratio b) Two Vehicle Involvement Ratio
Single Vehicle Involvement Ratio
1.18
0.80
0.76
1.19
0.00
0.20
0.40
0.60
0.80
1.00
1.20
male female
Driver's Gender
RAI
Rs
16-17Year Old18-20Year Old
Two Vehicle Involvement Ratio
0.94
1.05
1.09
0.89
0.00
0.20
0.40
0.60
0.80
1.00
1.20
male female
Driver's Gender
RAI
Rm
16-17 YearOld18-20 YearOld
Aultman-Hall and Padlo Page 33
Figure C2 The Relative Impact of Route Class by Sex a) Single Vehicle Involvement Ratio b) Two Vehicle Involvement Ratio
Single Vehicle Involvement Ratio
0.881.10
0.76
1.19
0.89
1.09
0.00
0.20
0.40
0.60
0.80
1.00
1.20
male female
Driver's Gender
RAIRs Interstate US/State Route Local Road
Two Vehicle Involvement Ratio
1.09
0.89
1.06 0.92
1.10
0.87
0.00
0.20
0.40
0.60
0.80
1.00
1.20
male female
Driver's Gender
RAIRm Interstate
US/State Route
Local Road
Aultman-Hall and Padlo Page 34
Figure C3 The Relative Impact of Light Conditions by Sex
a) Single Vehicle Involvement Ratio b) Two Vehicle Involvement Ratio
Single Vehicle Involvement Ratio
1.13
0.85
1.19
0.74
1.14
0.82
0.00
0.20
0.40
0.60
0.80
1.00
1.20
male female
Driver's Gender
RAIRs Daylight DarkDusk/Dawn
Two Vehicle Involvement Ratio
0.90
1.09
0.92
1.06 1.020.98
0.00
0.20
0.40
0.60
0.80
1.00
1.20
male female
Driver's Gender
RAIRm Daylight DarkDusk/Dawn

Aultman-Hall and Padlo Page 35
Figure C4 The Relative Impact of Passenger Group by Sex a) Single Vehicle Involvement Ratio b) Two Vehicle Involvement Ratio
Single Vehicle Involvement Ratio
0.80
1.16
0.74
1.19
0.85
1.16
0.00
0.20
0.40
0.60
0.80
1.00
1.20
male female
Driver's Gender
RAIRs SoloPeer (14-24) Adult/Child
Two Vehicle Involvement Ratio
0.90
1.08
0.93
1.05 0.95
1.05
0.00
0.20
0.40
0.60
0.80
1.00
1.20
male female
Driver's Gender
RAIRm SoloPeer (14-24) Adult/Child
Aultman-Hall and Padlo Page 36
Figure C5 The Relative Impact of the Number of Passengers by Sex a) Single Vehicle Involvement Ratio b) Two Vehicle Involvement Ratio
Single Vehicle Involvement Ratio
0.74
1.20
0.72
1.19
0.77
1.14
0.00
0.20
0.40
0.60
0.80
1.00
1.20
male female
Driver's Gender
RAIRs 1 Passenger 2 Passengers 3+ Passengers
Two Vehicle Involvement Ratio
1.05 0.94
1.05 0.921.02 0.96
0.00
0.20
0.40
0.60
0.80
1.00
1.20
male female
Driver's Gender
RAIRm 1 Passenger 2 Passengers 3+ Passengers
Aultman-Hall and Padlo Page 37
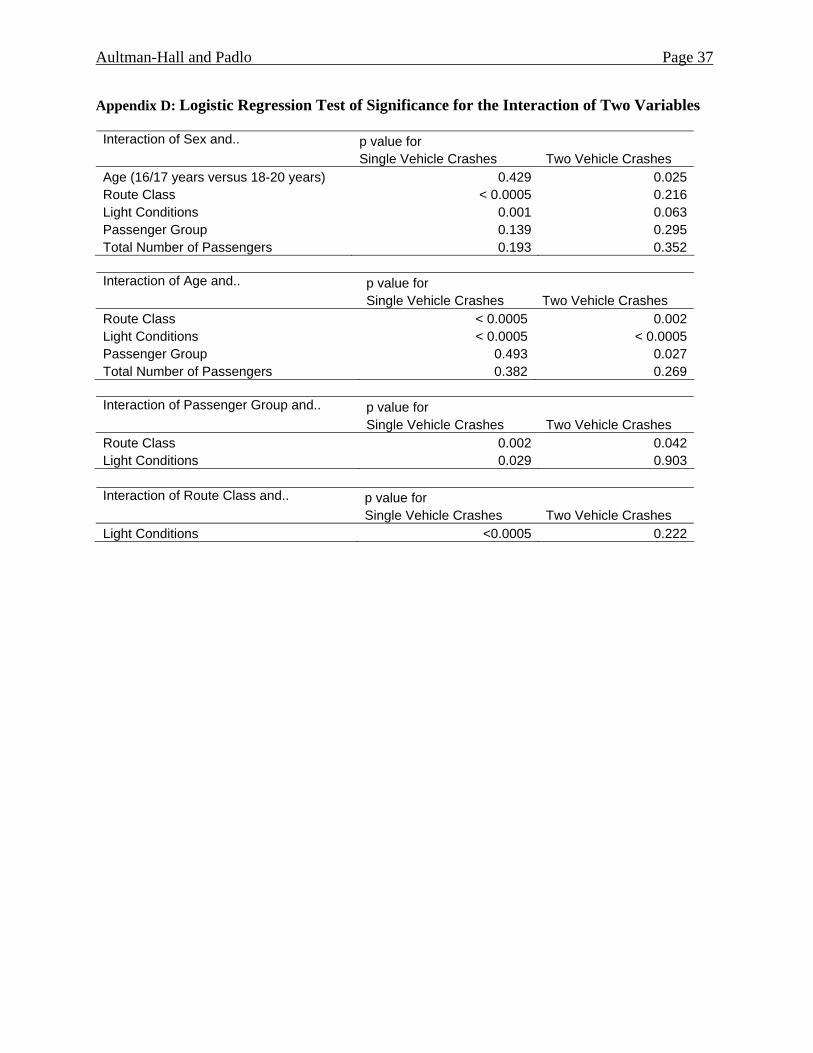
Appendix D: Logistic Regression Test of Significance for the Interaction of Two Variables
p value for Interaction of Sex and.. Single Vehicle Crashes Two Vehicle Crashes
Age (16/17 years versus 18-20 years) 0.429 0.025Route Class < 0.0005 0.216Light Conditions 0.001 0.063Passenger Group 0.139 0.295Total Number of Passengers 0.193 0.352
p value for Interaction of Age and.. Single Vehicle Crashes Two Vehicle Crashes
Route Class < 0.0005 0.002Light Conditions < 0.0005 < 0.0005Passenger Group 0.493 0.027Total Number of Passengers 0.382 0.269
p value for Interaction of Passenger Group and.. Single Vehicle Crashes Two Vehicle Crashes
Route Class 0.002 0.042Light Conditions 0.029 0.903
p value for Interaction of Route Class and.. Single Vehicle Crashes Two Vehicle Crashes
Light Conditions <0.0005 0.222
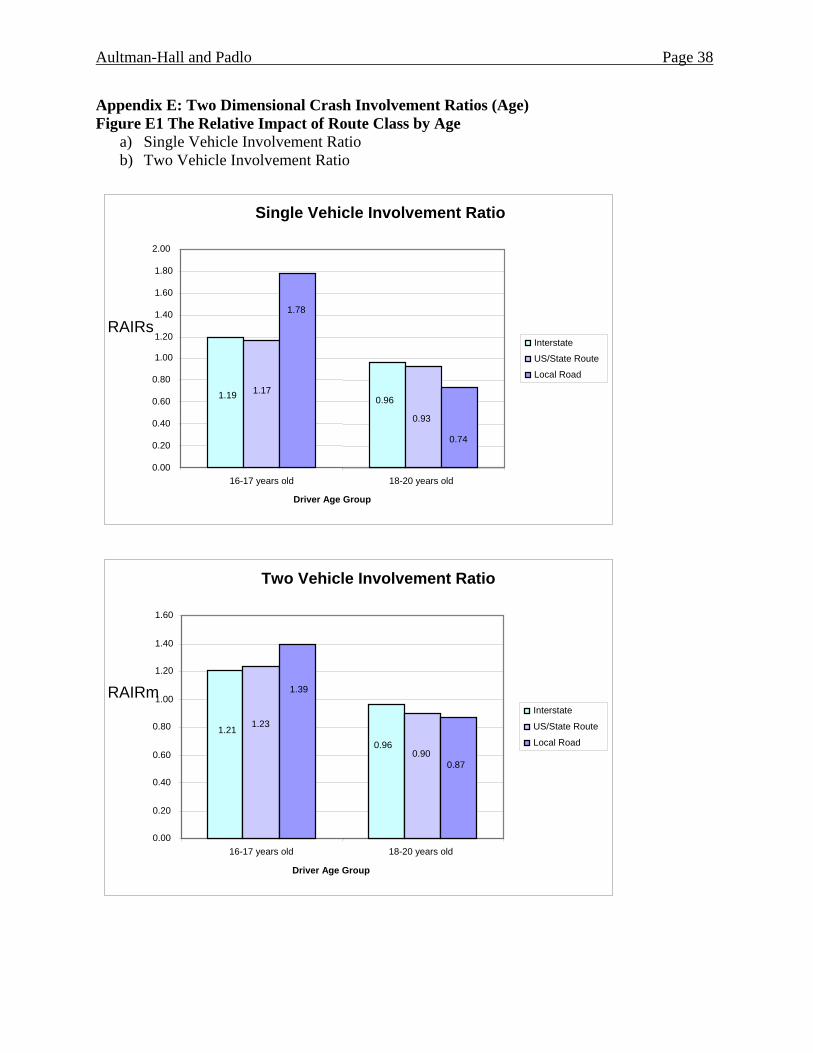
Aultman-Hall and Padlo Page 38
Appendix E: Two Dimensional Crash Involvement Ratios (Age) Figure E1 The Relative Impact of Route Class by Age
a) Single Vehicle Involvement Ratio b) Two Vehicle Involvement Ratio
Single Vehicle Involvement Ratio
0.961.19
0.93
1.17
0.74
1.78
0.00
0.20
0.40
0.60
0.80
1.00
1.20
1.40
1.60
1.80
2.00
16-17 years old 18-20 years old
Driver Age Group
RAIRs Interstate
US/State Route
Local Road
Two Vehicle Involvement Ratio
1.210.96
1.23
0.90
1.39
0.87
0.00
0.20
0.40
0.60
0.80
1.00
1.20
1.40
1.60
16-17 years old 18-20 years old
Driver Age Group
RAIRm Interstate
US/State Route
Local Road

Aultman-Hall and Padlo Page 39
Figure E2 The Relative Impact of Light Conditions by Age a) Single Vehicle Involvement Ratio b) Two Vehicle Involvement Ratio
Single Vehicle Involvement Ratio
1.34
0.86
1.19
0.93
1.15
0.94
0.00
0.20 0.40
0.60
0.80
1.00 1.20
1.40
1.60
16-17 years old 18-20 years old
Driver Age Group
RAIRs Daylight DarkDusk/Dawn
Two Vehicle Involvement Ratio
0.92
1.21
0.86
1.39
0.92
1.20
0.00 0.20 0.40 0.60 0.80 1.00 1.20 1.40 1.60
16-17 years old 18-20 years old
Driver Age Group
RAIRm Daylight DarkDusk/Dawn
Aultman-Hall and Padlo Page 40
Figure E3 The Relative Impact of Passenger Group by Age a) Single Vehicle Involvement Ratio b) Two Vehicle Involvement Ratio
Single Vehicle Involvement Ratio
0.92
1.26
0.89
1.24
0.86
1.32
0.00
0.20
0.40
0.60
0.80
1.00
1.20
1.40
16-17 years old 18-20 years old
Driver Age Group
RAIRs Solo
Peer (14-24)
Adult/Child
Two Vehicle Involvement Ratio
1.26
0.92
1.31
0.85
1.22
0.90
0.00
0.20
0.40
0.60
0.80
1.00
1.20
1.40
16-17 years old 18-20 years old
Driver Age Group
RAIRm Solo
Peer (14-24)
Adult/Child
Aultman-Hall and Padlo Page 41
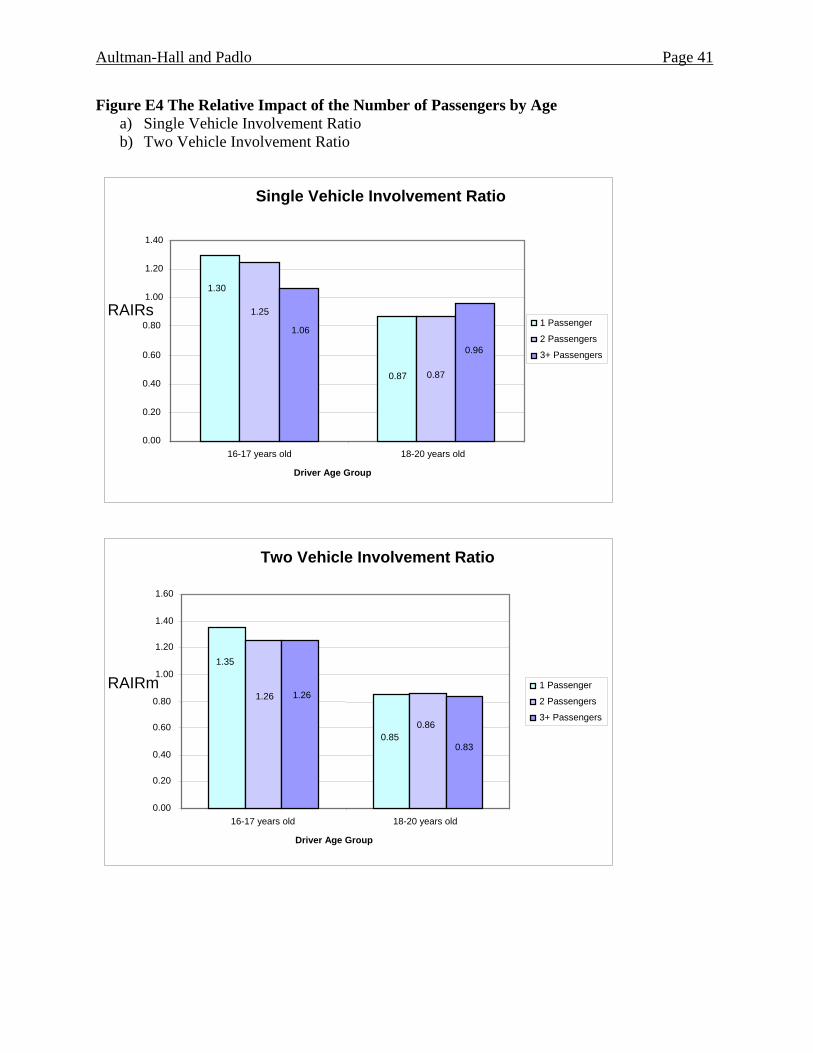
Figure E4 The Relative Impact of the Number of Passengers by Age a) Single Vehicle Involvement Ratio b) Two Vehicle Involvement Ratio
Single Vehicle Involvement Ratio
0.87
1.30
0.87
1.25
0.96
1.06
0.00
0.20
0.40
0.60
0.80
1.00
1.20
1.40
16-17 years old 18-20 years old
Driver Age Group
RAIRs 1 Passenger
2 Passengers
3+ Passengers
Two Vehicle Involvement Ratio
1.35
0.85
1.26
0.86
1.26
0.83
0.00
0.20
0.40
0.60
0.80
1.00
1.20
1.40
1.60
16-17 years old 18-20 years old
Driver Age Group
RAIRm 1 Passenger
2 Passengers
3+ Passengers