Embed Size (px)
Citation preview
Factors Affecting Thyroid Condition
Shafaq L., Nepean High School
Ottawa Carleton District School Board

Thyroid Condition
common among teens as well as adults marked either by underactive or overactive thyroid
gland leads to Hypothyroidism or hyperthyroidism result of improper functioning of thyroid glands
that fails to produce adequate insulin for the body characterized by low metabolism, weight gain or
weight loss, fatigue, stress, muscular and joint pains.

Hypothesis I hypothesized that following factors have an impact on
thyroid condition in human beings: Age and gender Body mass. Health regions Emotional attitude Physical activity level Regular diet Job hours Stress level

Data Analysis
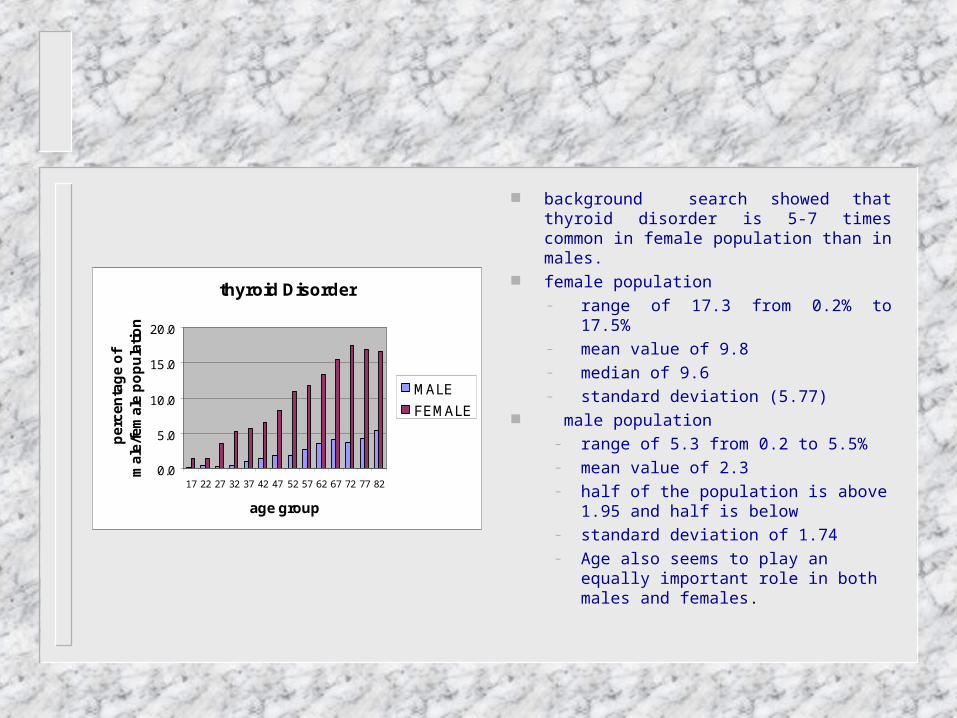
background search showed that thyroid disorder is 5-7 times common in female population than in males.
female population – range of 17.3 from 0.2% to 17.5% – mean value of 9.8 – median of 9.6 – standard deviation (5.77)
male population – range of 5.3 from 0.2 to 5.5% – mean value of 2.3 – half of the population is above 1.95 and
half is below – standard deviation of 1.74 – Age also seems to play an equally
important role in both males and females.
thyroid Disorder
0.0
5.0
10.0
15.0
20.0
17 22 27 32 37 42 47 52 57 62 67 72 77 82
age group
pe
rce
nta
ge
of
ma
le/f
em
ale
po
pu
lati
on
MALE
FEMALE
Age vs Thyroid Disorder
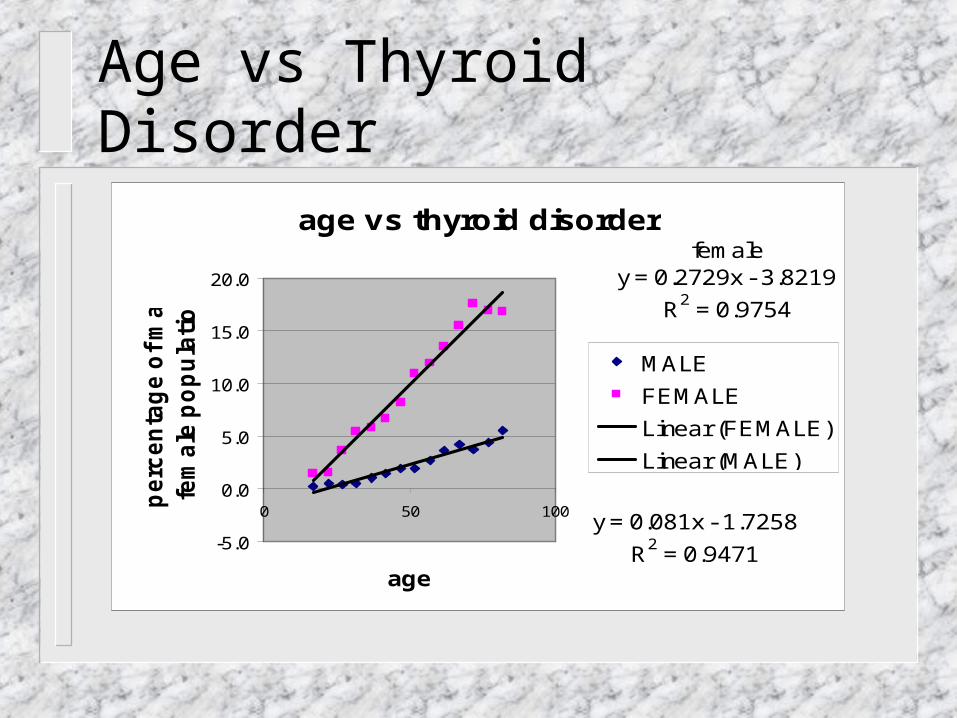
age vs thyroid disorderfemale
y = 0.2729x - 3.8219
R2 = 0.9754
y = 0.081x - 1.7258
R2 = 0.9471-5.0
0.0
5.0
10.0
15.0
20.0
0 50 100
age
pe
rce
nta
ge
of
ma
le
fem
ale
po
pu
lati
on
MALE
FEMALE
Linear (FEMALE)
Linear (MALE)

Age vs Thyroid Disorder
strong positive linear correlation between age and male/female population having thyroid disorder
cases of thyroid disorder increases with age. males and females might have different factors
that affect there thyroid condition age is one such factor that is strongly correlated
with both the male and female population suffering from thyroid disorder
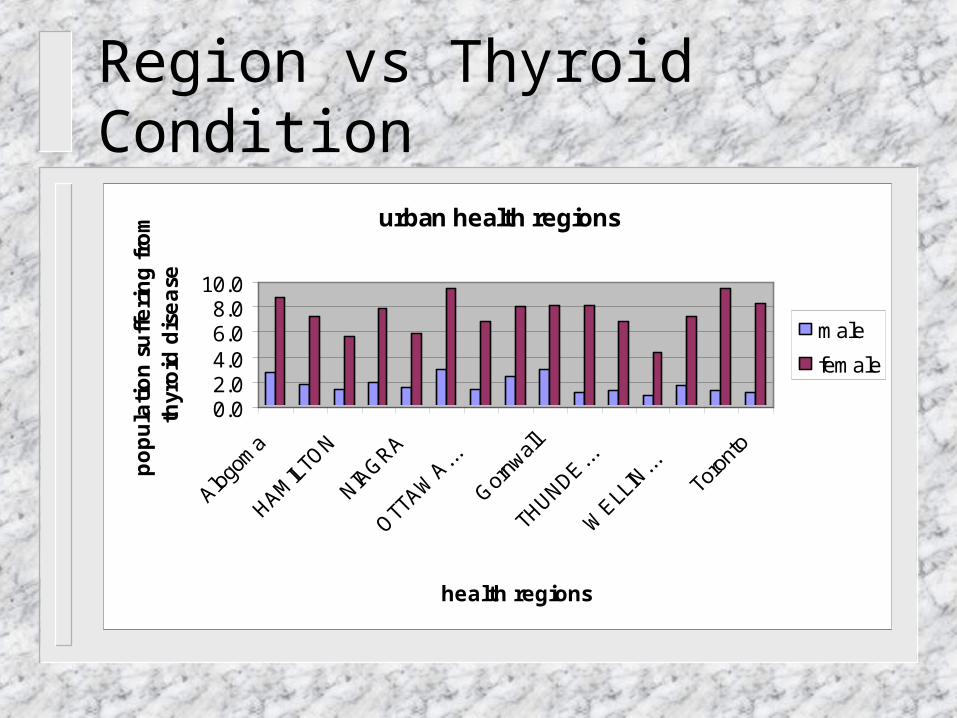
Region vs Thyroid Condition
urban health regions
0.02.04.06.08.0
10.0
Alogom
a
HAMILT
ON
NIAGRA
OTTAW
A...
Gornw
all
THUNDE...
WELL
IN...
Toro
nto
health regions
po
pu
lati
on
su
ffe
rin
g f
rom
th
yro
id d
ise
ase
male
female
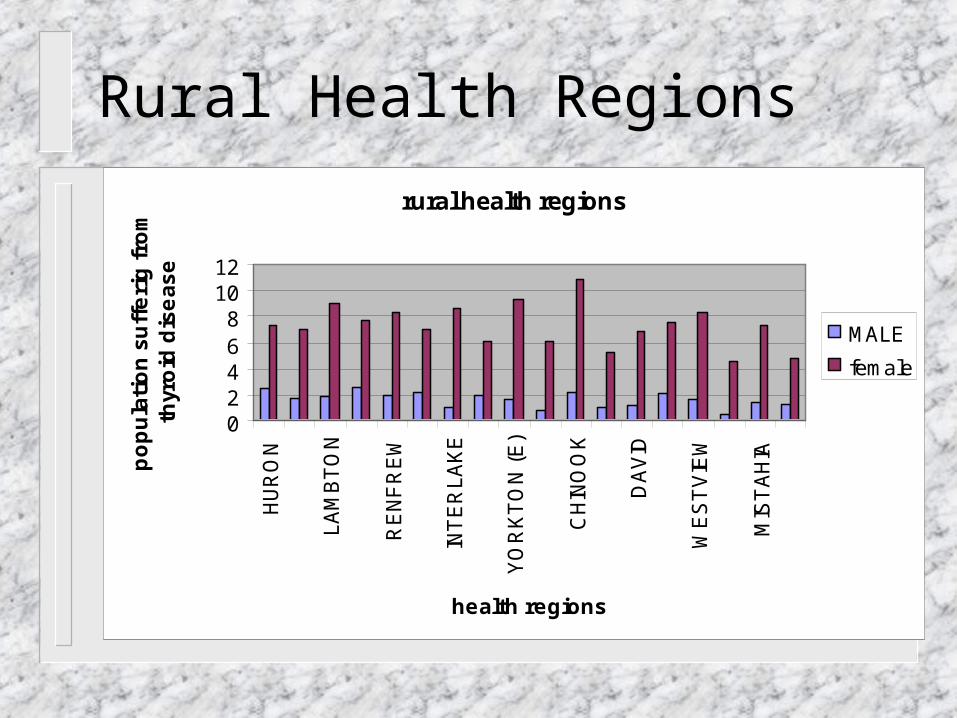
Rural Health Regions
rural health regions
02468
1012
HU
RO
N
LA
MB
TO
N
RE
NF
RE
W
INT
ER
LA
KE
YO
RK
TO
N (
E)
CH
INO
OK
DA
VID
WE
ST
VIE
W
MIS
TA
HIA
health regions
po
pu
lati
on
su
ffe
rig
fro
m
thyr
oid
dis
ea
se
MALE
female

Body Mass Index
BMI vs thyroidy = 0.1421x + 0.6483
R2 = 0.7085
0.0
2.0
4.0
6.0
8.0
10.0
0 10 20 30 40 50
BMI
pe
rce
nta
ge
of
po
pu
lati
on
su
ffe
rin
g f
rom
th
yro
id
yes
Linear (yes)
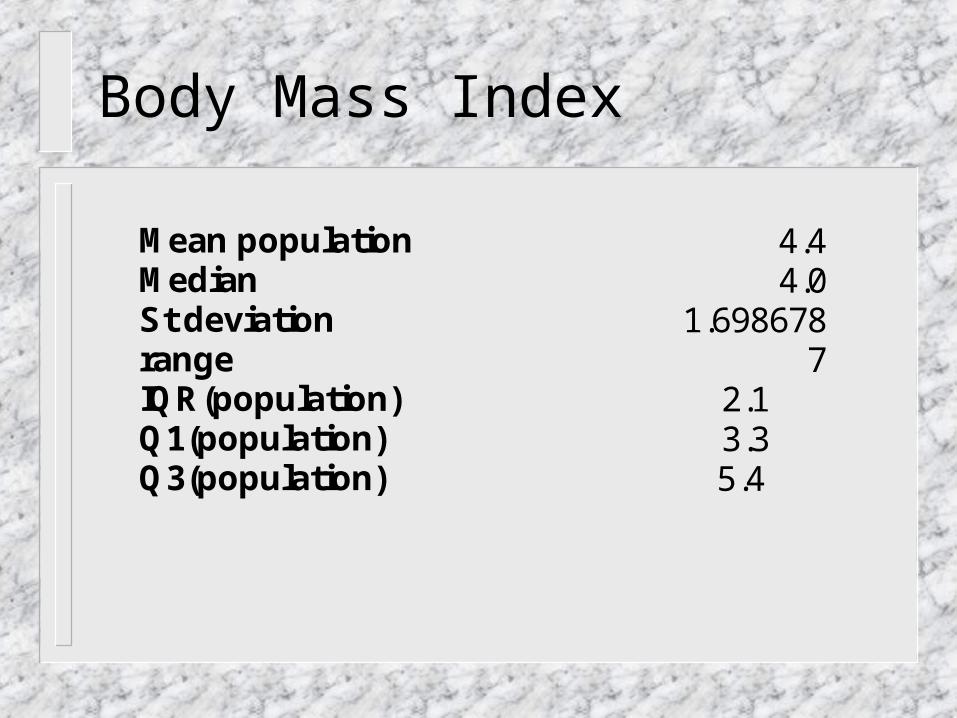
Body Mass Index
Mean population 4.4Median 4.0St deviation 1.698678range 7IQR(population) 2.1Q1(population) 3.3Q3(population) 5.4
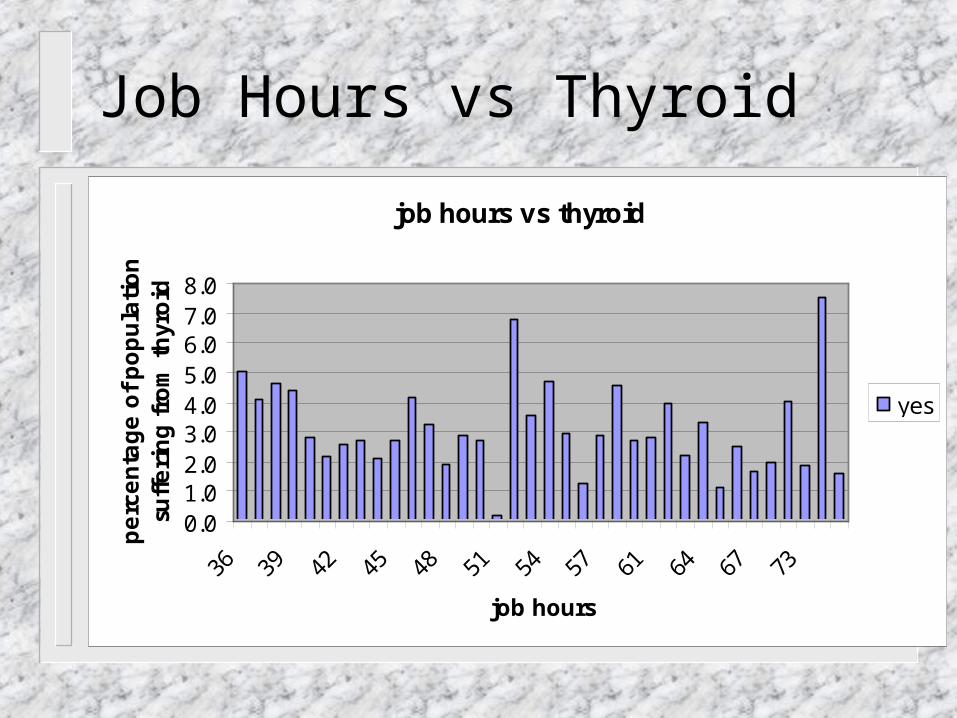
Job Hours vs Thyroid
job hours vs thyroid
0.01.02.03.04.05.06.07.08.0
36 39 42 45 48 51 54 57 61 64 67 73
job hours
pe
rce
nta
ge
of
po
pu
lati
on
su
ffe
rin
g f
rom
th
yro
id
yes

Job Hours vs Thyroid
standard deviation is 1.5 which shows percentage of population suffering from thyroid clusters around the mean in the range of 7.3
The range of job hours is 3.9 with the mean value of 54.2
job hours do not have a strong impact on thyroid condition
increase in the job hours does not reflect an increase in the percentage of population suffering from thyroid disorder
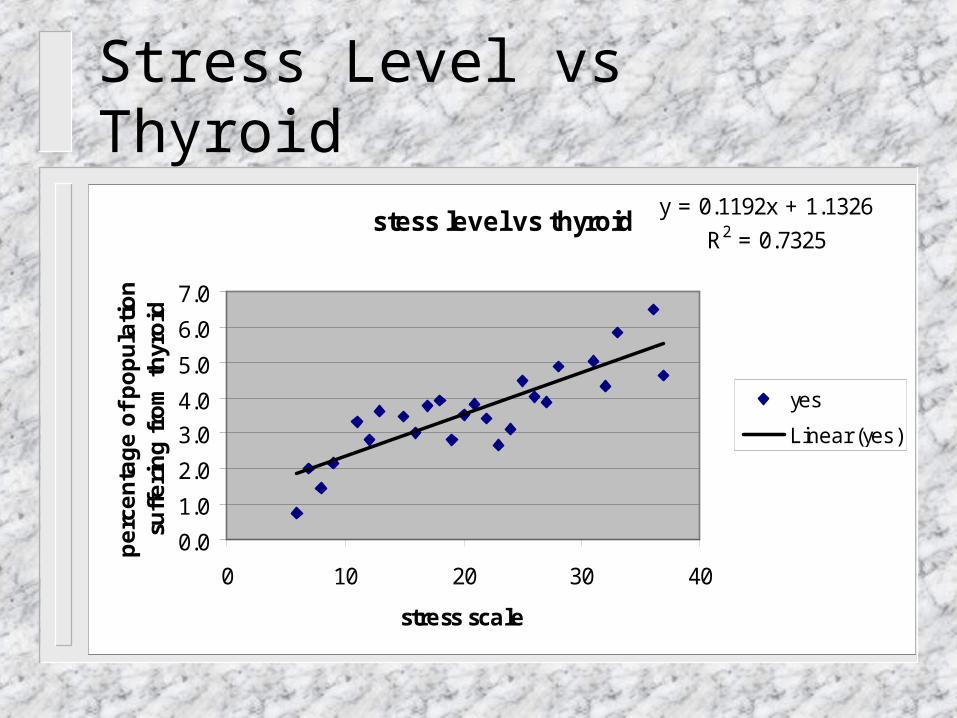
Stress Level vs Thyroid
stess level vs thyroidy = 0.1192x + 1.1326
R2 = 0.7325
0.0
1.0
2.0
3.0
4.0
5.0
6.0
7.0
0 10 20 30 40
stress scale
pe
rce
nta
ge
of
po
pu
lati
on
su
ffe
rin
g f
rom
th
yro
id
yes
Linear (yes)

Stress Level vs Thyroid The graph shows that higher the stress level the
greater the percentage of population suffering from thyroid will be greater
stress have an impact in worsening thyroid condition relationship is understandable as higher stress level
can cause trouble in the secretion of hormones and in the functioning of the body glands.
The average stress level is 20.6 with the median value of 20.5 in the range of 31
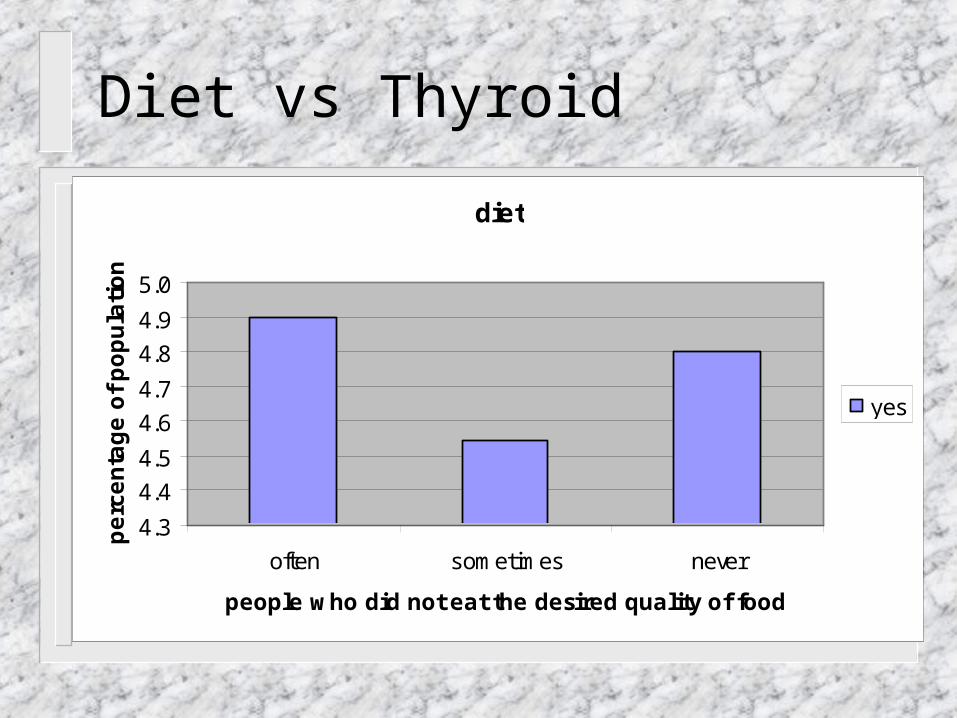
Diet vs Thyroid
diet
4.3
4.4
4.5
4.6
4.7
4.8
4.9
5.0
often sometimes never
people who did not eat the desired quality of food
pe
rce
nta
ge
of
po
pu
lati
on
yes

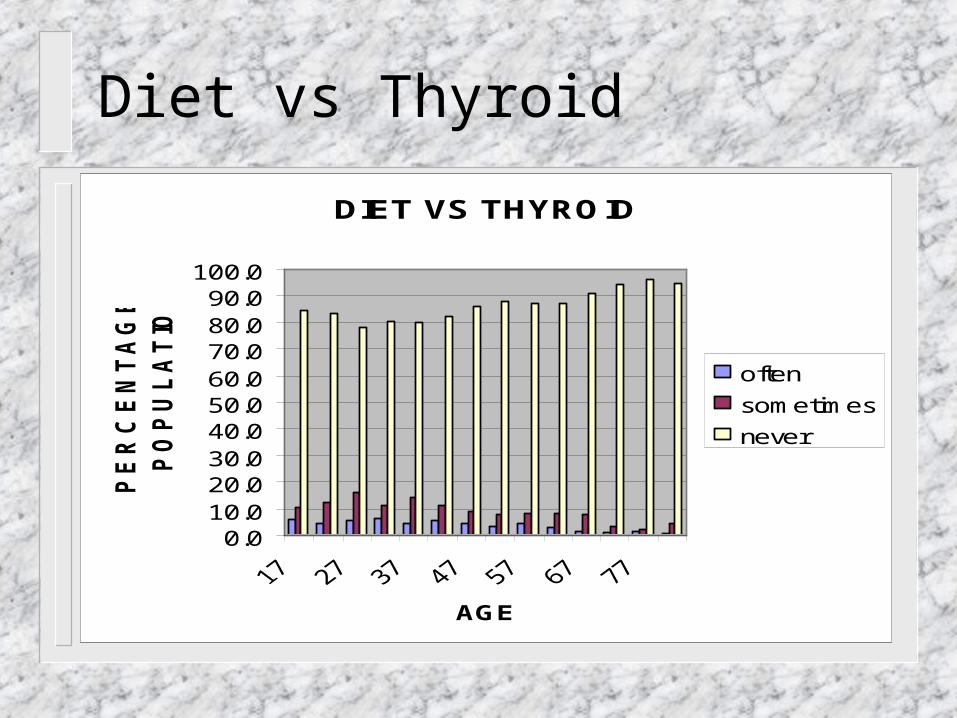
Diet vs Thyroid The graph shows a big difference between
people who have thyroid condition and their regular diet.
People who often did not eat the desired quality of food have the highest percentage of thyroid disorder.
This is understandable as these people are most likely to lack sufficient nutrition needed for the proper functioning of the body
Diet vs Thyroid
DIET VS THYROID
0.010.020.030.040.050.060.070.080.090.0
100.0
AGE
PE
RC
EN
TA
GE
OF
PO
PU
LA
TIO
N
often
sometimes
never

Diet vs Thyroid
DIETy = -0.0751x + 7.466
R2 = 0.7373
0.0
1.0
2.0
3.0
4.0
5.0
6.0
7.0
0 50 100
AGE
PE
RC
EN
TA
GE
OF
PO
PU
LA
TIO
N
often
Linear (often)
Diet vs Thyroid People in mature ages have less population who
have thyroid due to the fact that they often did not eat the desired quality of food.
Thus diet seem to have an impact on thyroid condition for those who are in young age.
For the people who are older there might be other factors that play the dominant role in worsening thyroid condition.
Thus poor diet can be considered as one factor why young people have thyroid.

Physical Activity vs Thyroid
physical activit vs thyroid
0.0
1.0
2.0
3.0
4.0
5.0
6.0
level1 level2 level3 level4
level of activity
pe
rce
nta
ge
of
po
pu
lati
on
yes
Physical Activity vs Thyroid
physical activity vs thyroid
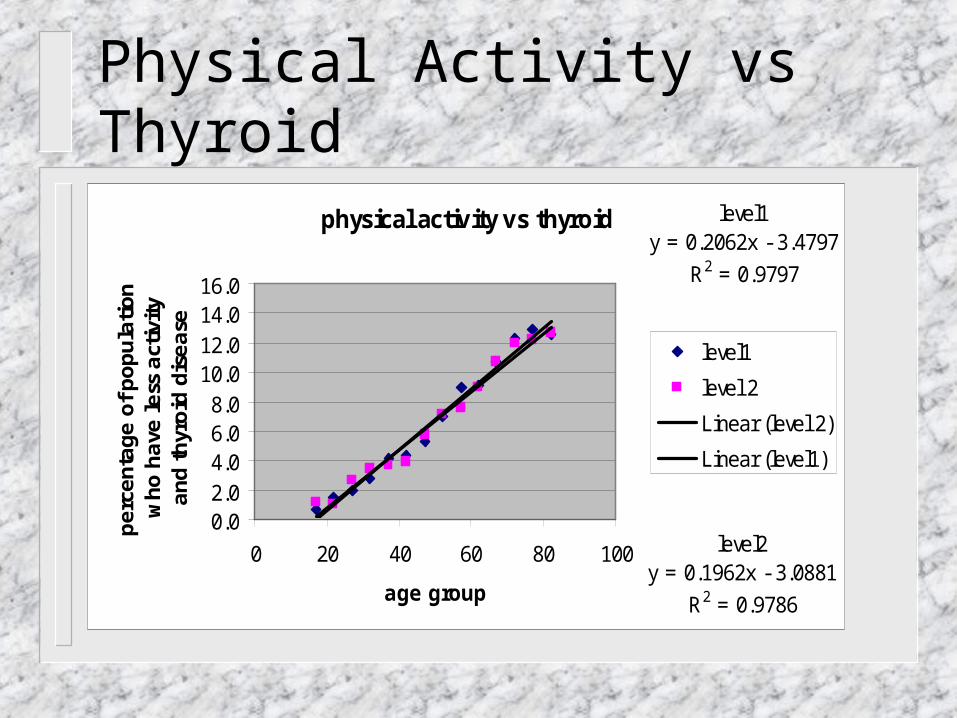
level2y = 0.1962x - 3.0881
R2 = 0.9786
level1y = 0.2062x - 3.4797
R2 = 0.9797
0.02.04.06.08.0
10.012.014.016.0
0 20 40 60 80 100
age group
pe
rce
nta
ge
of
po
pu
lati
on
w
ho
ha
ve l
ess
act
ivit
y a
nd
th
yro
id d
ise
ase
level1
level 2
Linear (level 2)
Linear (level1)

Physical Activity vs Thyroid The graph shows strong positive linear correlation
between the population suffering from thyroid disease with low physical activity level and age.
The relationship is understandable as with age the level of physical activity is likely to fall and this can result in high percentage of population suffering from thyroid disorder.
However physical activity itself has a negative correlation with the percentage of population suffering from thyroid.
The correlation is negative because increase in the level of physical activity will reduce the percentage of thyroid disorder cases.

Emotional Behaviour vs Thyroid
emotional behaviour vs thyroidy = 0.6698x + 3.8653
R2 = 0.9506
0.01.02.03.04.05.06.07.08.0
0 2 4 6
level of sadness
pe
rce
nta
ge
of
po
ula
tio
n
suff
eri
ng
fro
m t
hyr
oid
yes
Linear (yes)

Emotional Behaviour vs Thyroid
The emotional behavior of a person is divided into five levels of sadness. Level 5 being the highest level of sadness has the highest percentage of thyroid disease.
Thus from the graph conclusion can be made that the risk of thyroid disease increases with the level of sadness.
The relationship between emotional behavior and thyroid shows strong positive linear correlation with the correlation coefficient of coefficient of 0.9506.
Emotional Behaviour vs Thyroid females are at a high risk of thyroid disorder than males thyroid condition has strong positive correlation with age, BMI and
stress level and emotional behavior Increase in age, stress or BMI will result in an increase in the
percentage of population suffering from thyroid disorder. Emotional behavior of a person indicates how the person feels for
his life. People who have thyroid disorder tend to be more dissatisfied with
life insufficient diet and physical activity have negative correlation with
thyroid condition. Physical activity is one of the major indication of health