Embed Size (px)
Citation preview

Factors Affecting the Retention of Students Admitted from
CEGEP
By Xinrui Cao
(Student Number: 8673483)
Major paper presented to the
Department of Economics of the University of Ottawa
in partial fulfillment of the requirements of the M.A. Degree
Supervisor: Professor Victoria Barham
ECO 6999
Ottawa, Ontario
April 2018

Acknowledgements
Many people have offered me valuable assistance in my major paper writing. Grateful
acknowledgment is made to my supervisor, Professor Victoria Barham, who gave me
research idea, encouragement and valuable suggestions. I would like to express my
heartfelt gratitude to Professor Jean-Luc Daoust, who prepared the data for my
research. Also, I would like to thank Philippe Busser who helped me to get the access
to the computer that I used to analyze data.

Abstract
Using administrative data, I investigate the factors that affect retention of CEGEP
students in undergraduate studies at the University of Ottawa. I estimate a linear
probability model for first and second year retention rates. I find that age, sex,
difference in financial costs, and enrollment in the Faculty of Arts and the Faculty of
Social Sciences crucially affect both first year and second year retention. A surprising
finding is that the admission average has a positive effect on the second year retention
rate but does not affect first year retention. The citizenship status of the student affects
first year retention, but does not affect second year retention.

Content
1. Introduction ................................................................................................................ 1
2. A Brief Introduction to the CEGEP Admission Pathway .......................................... 3
3. Literature Review ....................................................................................................... 5
4. Data .......................................................................................................................... 10
5. Methodology ............................................................................................................ 15
6. Results ...................................................................................................................... 19
6.1 First Year Retention Rate ................................................................................... 19
6.2 Second Year Retention Rate .............................................................................. 22
6.3 Determinants of Academic Performance: CGPA .............................................. 24
6.4 Robustness Check: Comparison with Probit Estimates ..................................... 25
6.5 Robustness Check: LOCAL and FINANCIAL ................................................. 26
7. Conclusions .............................................................................................................. 28
References .................................................................................................................... 31
Appendix - Tables and Figures .................................................................................... 33

1
1. Introduction
There is a significant variety of research which has investigated the factors which
determine the retention rates of undergraduate students. The retention rate is defined
as the percentage of undergraduate students who continue to register in their program
for another year of study, and is considered to be an indicator of student satisfaction.
Low retention rates will result in lower graduation rates, potential financial losses and
may adversely affect the reputation of the university (Delen, 2010). The University of
Ottawa admits students directly from high school. In addition, however, there is a
significant intake from Quebec CEGEPs. Strikingly, the retention rates for the
CEGEP students after first and second year of study at uOttawa is 82.49% and
75.04%, respectively, which is lower than the first and second year retention rates for
the university as a whole (87.2% in 2014). However, students admitted from CEGEP
appear to be doing relatively well academically: it is therefore a puzzle to explain why
they are not persisting in their studies at uOttawa.
This paper focuses on the factors affecting first and second year retention rates for

2
students pursuing study at uOttawa who were admitted from CEGEP. There are no
other studies that have studied retention rates for out-of-province students in Canada,
thus it would be interesting to study retention rates for students who study across
provinces. Previous researches proposed that age, sex, admission average, program
language, whether the student is local, CGPA in the first year and citizenship are key
factors affecting retention rates ((Angrist, Lang & Oreopoulos (2009); Beattie,
Laliberté & Oreopoulos (2016); Bettinger, Long, Oreopoulos & Sanbonmatsu (2012);
Bean (1980); Childs, Finnie & Martinello (2017); Delen (2010); Herzog (2005);
Hochstein & Butler (1983); Hu & John (2001); Leppel (2002); Singell (2004);
Wohlgemuth et al (2007); Wetzel, O’Toole & Peterson (1999)), but there are no
studies which have highlighted the role of financial cost difference. Thus I construct
financial cost difference variable, which reflects difference in tuition and living costs
between uOttawa and Quebec universities, as well as scholarships. Besides, I include
the faculty that the student admitted as a new factor, which is not mentioned in
previous literature. In addition to studying retention rates, I also use OLS to examine
the determinants of academic performance (CGPA).

3
In this paper, I use the linear probability model to estimate the crucial factors that
affect retention rates of CEGEP students. These findings may help other researchers
to be aware of the effect of differences in financial costs and of the faculty of
admission on retention rates. It may also assist the institution in optimizing its policies
to improve retention in the university.
The structure of this paper is as follows. In section 2, I briefly introduce the CEGEP
program. Section 3 presents the related literature review on retention that is useful to
identify the potential explanatory variables. Section 4 describes the data. Section 5
discusses the methodology. Section 6 presents the result of the regression analysis.
Finally, section 7 concludes.
2. A Brief Introduction to the CEGEP Admission Pathway
The CEGEP program is a public pre-university education program offered exclusively
by the province of Quebec in Canada. It is a transition program between secondary

4
school and university1. Students in Quebec who want to pursue post-secondary
education after 5 years of high school need to complete two years of CEGEP before
they apply to university. Students in Quebec without a CEGEP diploma cannot enter
university in Quebec.
Unlike high school, CEGEP provides more specialized programs. Students choose the
field in which they are interested, and follow pre-university courses related to this
field, thus getting a better understanding of what university study entails. A key
purpose of CEGEP is to make sure that students in Quebec are well prepared for
university education.
Students in CEGEP who apply to a university in Ontario must satisfy the
requirements of the admitting institution, Importantly, they can apply to an Ontario
university after only one year of CEGEP courses, and are treated like Ontario
applicants who have completed grade 12. These students cannot be admitted to
Quebec universities with only one year of CEGEP.
1 Technical programs are also offered for students who do not plan to go to university.

5
CEGEP programs can be found that offer programs of study in both French and
English. Unlike pre-CEGEP schooling, students can choose to study in the language
they prefer2.
3. Literature Review
Student retention rates at university are of ongoing concern to decision makers in
academic institutions and in government. An extensive academic literature has sought
to uncover factors that affect student retention rates in undergraduate education.
Below, I provide a brief review of some of the variables that other researches have
found have an influence on retention rates.
A number of researchers have studied the link between gender and retention. Female
students are more likely to persist in their studies than are males in South America
(Angrist, Lang & Oreopoulos (2009); Beattie, Laliberté & Oreopoulos (2016); Bean
(1980); Childs, Finnie & Martinello (2017); Hu & John (2001); Leppel (2002);
2 Some students can choose the language of their high school education, and CEGEP programs are eligibility for English-language high school.

6
Wohlgemuth et al (2007)). In contrast, Herzog (2005) finds that females are more
likely to change programs than are males, but does not find any gender difference in
the drop out rate.
A number of studies have investigated the impact of past academic performance on
achievements in university. One key measurement of past academic performance is
high school grades. Many researchers find that students with higher high school
grades are less likely to drop out (Childs, Finnie & Martinello (2017); Delen (2010)).
Beattie, Laliberté & Oreopoulos (2016) find out that high school grades are a key
predictor of college GPA. They categorize students as thrivers (students whose
college GPA exceeds expectations) and divers (students whose college GPA is below
expectations), and find that thrivers are more likely to persist in their studies than are
divers. College GPA, which is an important measure of present academic
performance, has a strong positive correlation with retention (Childs, Finnie &
Martinello (2017); Delen (2010); Herzog (2005); Hu & John (2001); Leppel (2002);
Singell (2004); Wetzel, O’Toole & Peterson (1999); Wohlgemuth et al (2007)), but

7
this factor would lead to endogeneity problem.
Another significant predictor of retention is age. However, there is no consensus
about whether age has a positive or negative impact on retention. Some researchers
find that older students have a lower retention rate than younger students (Beattie,
Laliberté & Oreopoulos (2016); Hu & John (2001); Leppel (2002); Singell (2004)).
This may be due to the fact that older students receive lower grades in university
(Beattie, Laliberté & Oreopoulos (2016)); however, they also have greater job
experience, which may help them to form a clear idea of what their opportunities will
be once they obtain their degree (Leppel (2002)). Singell (2004) suggests that this
result is accordant with human capital theory, which suggests that older students have
less time to obtain the benefits of university.
A number of studies have explored whether or not students from the local community,
or state, are more likely to persist than are students who have chosen to enroll in a
university situated outside the province (or state) in which they permanently reside.

8
Herzog (2005) finds that out-of-state (non-local) students are more likely to drop out
than are in-state students. Singell (2004) finds that rural students are more likely to
persist than are urban students. Wohlgemuth et al (2007) find that students who live
in university residence on campus are more likely to persist than are students who
commute.
A number of American researchers have examined the link between financial aid and
academic persistence. An increase in the cost of university decreases the odds of
retention (Singell (2004); Wetzel, O’Toole & Peterson (1999)). When students
receive an increase in financial support, this leads to increase in persistence (Bettinger,
Long, Oreopoulos & Sanbonmatsu (2012); Delen (2010); Hu & John (2001); Singell
(2004); Wohlgemuth et al (2007)). Hochstein & Butler (1983) find that grants are
positively correlated with student persistence while loans are negatively associated
with persistence. Herzog (2005) suggests that loans increase the risk that a student
will transfer to another institution, but does not actually influence the decision to drop
out. In contrast, Garibaldi, Giavazzi, Ichino & Rettore (2012) find that the

9
relationship between tuition fees and retention is not significant.
Family income is found to be a significant predictor of student persistence. Students
from higher income families are less likely to drop out than are students from
middle-income and low-income families (Childs, Finnie & Martinello (2017); Herzog
(2005); Hu & John (2001); Leppel (2002); Singell (2004)).
Some researchers have examined ethnicity in relationship to retention and have found
mixed evidence. Hu & John (2001) find that African Americans, Hispanics, and
students from other ethnicities have the same probability of retention as do White
students. Leppel (2002) find that female African Americans students have higher
retention rates than male African Americans students. Leppel (2002) also finds that
Asian ethnicity has a positive impact on retention of both female and male students
compare with other ethnicities. Wohlgemuth et al (2007) find that ethnic minorities
are significantly more likely to drop out in the first year of university. Singell (2004)
finds that ethnicity is not a significant predictor of student retention.

10
A number of other potential factors have been investigated. Childs, Finnie &
Martinello (2017) find that students from two parent families are less likely to drop
out than are students from single mother families. Single students are more likely to
persist than are married students (Leppel (2002); Wetzel, O’Toole & Peterson (1999)).
Leppel (2002) finds that having children has a significantly positive impact on female
retention rates but a negative impact on male retention rates.
4. Data
This study uses administrative data extracted by the Office of the Registrar of the
University of Ottawa. These data includes all students who were admitted to the
University of Ottawa between 2010 and 2016 after completing at least one year of
study at a CEGEP. The data set contains information on a number of potential
explanatory variables in this study, which can be used to identify the factors affecting
the retention of students admitted from the CEGEP pathway. Each student is observed
for the first two years of the study at the University of Ottawa. Students who drop out
after their first year are observed only once.
11
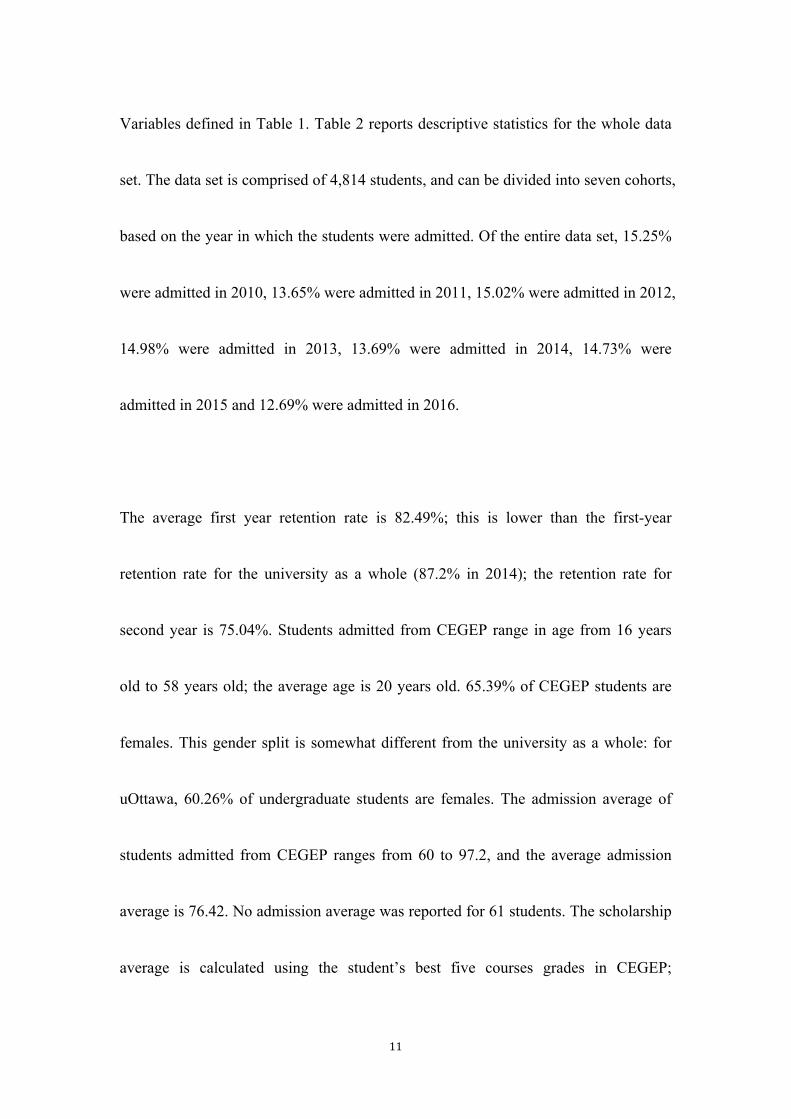
Variables defined in Table 1. Table 2 reports descriptive statistics for the whole data
set. The data set is comprised of 4,814 students, and can be divided into seven cohorts,
based on the year in which the students were admitted. Of the entire data set, 15.25%
were admitted in 2010, 13.65% were admitted in 2011, 15.02% were admitted in 2012,
14.98% were admitted in 2013, 13.69% were admitted in 2014, 14.73% were
admitted in 2015 and 12.69% were admitted in 2016.
The average first year retention rate is 82.49%; this is lower than the first-year
retention rate for the university as a whole (87.2% in 2014); the retention rate for
second year is 75.04%. Students admitted from CEGEP range in age from 16 years
old to 58 years old; the average age is 20 years old. 65.39% of CEGEP students are
females. This gender split is somewhat different from the university as a whole: for
uOttawa, 60.26% of undergraduate students are females. The admission average of
students admitted from CEGEP ranges from 60 to 97.2, and the average admission
average is 76.42. No admission average was reported for 61 students. The scholarship
average is calculated using the student’s best five courses grades in CEGEP;

12
scholarship averages range from 59.2 to 99.7, and the average scholarship average is
83.12. Below, I use the scholarship average to determine whether the student obtains
an admission scholarship. Students’ cumulative grade point average (CGPA) after
their first year at university ranges from 0.13 to 10; the average CGPA after first year
is 6.57. 48.92% of the students admitted from CEGEP come from the Outaouais
region close to Ottawa. 30.31% of these students choose to study in English at
uOttawa. A full 97.5% of students admitted from CEGEP are Canadian citizens.
CEGEP students are spread across all of the faculties. 15.48% enroll in the Faculty of
Arts, 3.3% in the Faculty of Law, 6.34% in the Faculty of Engineering, 11.94% in the
Telfer School of Management, 8.35% in the Faculty of Science, 12.36% in the
Faculty of Health Sciences, and 42.23% in the Faculty of Social Sciences.
In addition to the administrative data, I also use Statistics Canada data on tuition and
living expenses at Quebec universities to better measure the differences in the
financial costs of studying at uOttawa rather than at a Quebec university. With very
13
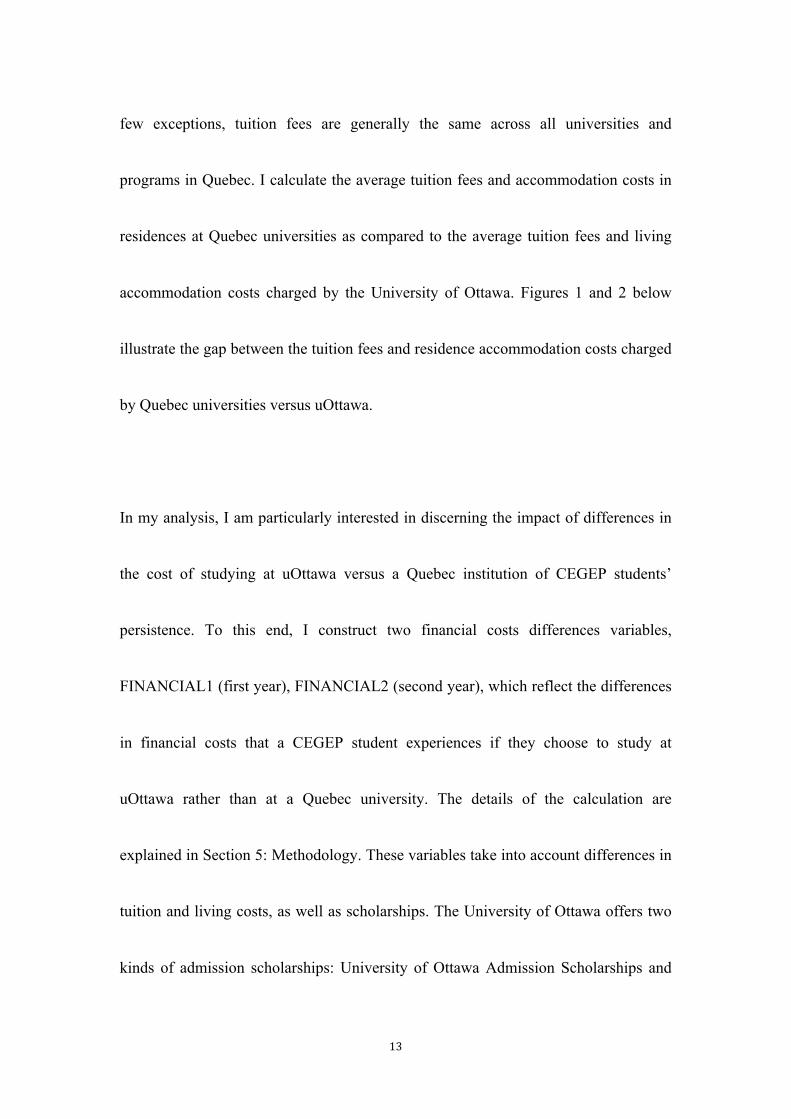
few exceptions, tuition fees are generally the same across all universities and
programs in Quebec. I calculate the average tuition fees and accommodation costs in
residences at Quebec universities as compared to the average tuition fees and living
accommodation costs charged by the University of Ottawa. Figures 1 and 2 below
illustrate the gap between the tuition fees and residence accommodation costs charged
by Quebec universities versus uOttawa.
In my analysis, I am particularly interested in discerning the impact of differences in
the cost of studying at uOttawa versus a Quebec institution of CEGEP students’
persistence. To this end, I construct two financial costs differences variables,
FINANCIAL1 (first year), FINANCIAL2 (second year), which reflect the differences
in financial costs that a CEGEP student experiences if they choose to study at
uOttawa rather than at a Quebec university. The details of the calculation are
explained in Section 5: Methodology. These variables take into account differences in
tuition and living costs, as well as scholarships. The University of Ottawa offers two
kinds of admission scholarships: University of Ottawa Admission Scholarships and

14
French Studies Bursary3. For the University of Ottawa Admission Scholarship, newly
admitted students with an admission average of 80% or more automatically receive
award between $1,000 and $4,000. Students with admission averages of 95-100%
receive $4,000, those with 90-94.9% receive $3,000, students with 85-89.9% receive
$2,000, and students with 80-84.9% can receive $1,000. Full-time students who take
at least 3 courses taught in French each term would receive the French Studies
Bursary ($1,000 per year), and for maintenance of the bursary, students need to
maintain full-time enrollment in French courses and maintain a minimum CGPA of
5.5 at the end of each academic year. Table 2 indicates that the financial costs
differences in the first year (FINANCIAL1) ranges from $-2022.62 to $6815.18, and
the average is $2671.93; the financial costs differences in the second year
(FINANCIAL2) ranges from $1977.38 to $6815.18, and the average is $3874.46.
3 Theinformationofscholarshipcanbefindathttps://www.uottawa.ca/financial-aid-awards/scholarships-and-bursaries/general-admission-scholarships-2017-2018

15
5. Methodology
In this paper, I use the linear probability model (LPM) to estimate the relationship
between retention rates and my explanatory variables. The linear probability model
can be used to study the relationship between a dichotomous dependent variable, such
as retention, and a set of explanatory variables. An alternative to the linear probability
model would be a probit model, which is widely used in regression analysis when the
dependent variable is a binary variable. The main drawback to the probit model is that
the estimated coefficients are difficult to interpret. In contrast, the assumption
underlying the linear probability model is that the probability of the outcome is a
linear function of the independent variables. As there are no restrictions placed on the
estimated coefficients in the LPM, there can be an unboundedness problem. However,
if most of the independent variables are categorical variables, this model is unlikely to
suffer from the unboundedness problem, and in such circumstances the linear
probability model is a good choice. In this paper, the linear probability model is used
to estimate the relationship; however, in section 6.4 I also report estimates obtained
using the probit model.

16
The linear probability model can be expressed as:
𝑦! = 𝛽! + 𝛽!𝑋! + 𝜇! 𝑓𝑜𝑟 𝑖 = 1,2,3,… ,𝑁
where 𝑦! is the binary dependent variable, and is equal to 1 if the student remains
enrolled in his/her program, and is equal to 0 if the student drops out; 𝑋! represents
the set of explanatory variables, which includes age, sex, admission average from
CEGEP, program language at uOttawa, citizenship, and the variable capturing the
difference in financial cost; 𝜇! is the error term.
For the linear probability model, the probability that 𝑦! = 1 is equal to the expected
value of 𝑦!:
𝑃 𝑦! = 1 𝑋! , 𝜇! = 𝐸 𝑦! 𝑋! , 𝜇! = 𝛽! + 𝛽!𝑋!
𝛽! measures the change in the probability of 𝑦! = 1 when 𝑋! changes, holding
other factors fixed:
∆𝑃 𝑦! = 1 𝑋! , 𝜇! = 𝛽!∆𝑋!
The estimated equation is:

17
𝑦! = 𝛽! + 𝛽!𝑋!
where 𝑦! is the predicted probability of retention. Therefore, 𝛽! is the predicted
probability of retention when each 𝑋! is equal to zero. The coefficient 𝛽! measures
the predicted change in the average probability of retention when 𝑋! increases by
one unit.
The FINANCIAL variable is constructed as: FINANCIAL = uOttawa tuition +
uOttawa living costs – Quebec tuition – living costs where they are permanently
located – admission scholarship. Consequently, for students from the Outaouais
region, FINANCIAL = uOttawa tuition + uOttawa living costs – Quebec tuition –
uOttawa living costs – admission scholarship = uOttawa tuition – Quebec tuition –
admission scholarship; for students from other regions in Quebec, FINANCIAL =
uOttawa tuition + uOttawa living costs – Quebec tuition – Quebec living costs –
admission scholarship.
Several of the studies of retention discussed in my literature review use a

18
dichotomous variable to distinguish between students from the local community and
students whose permanent residence is non-local. As all of the students in my study
are from Quebec, the variable “local/non-local” may be correlated with the variable
capturing differences in financial costs. Table 3 reports the correlation coefficients for
local variable and financial costs differences in first and second year. I find that the
correlation coefficient between local variable and financial costs differences in first
year is -0.5258, and between local variable and financial costs differences in second
year is -0.7453. Consequently, I omit local variable when I estimate the LPM model
for first year and second year retention to avoid problems with multicollnearity. As a
robustness check, in Section 6.5 I report estimates replacing my financial cost
difference variable with local/non-local.
In addition to studying retention rates, I also use OLS to examine the determinants of
academic performance. The OLS model can be expressed as:
𝑦 = 𝛼! + 𝛼!𝑋! + 𝜀! 𝑓𝑜𝑟 𝑖 = 1,2,3,… ,𝑁
where 𝑦 is the cumulative grade point average after first year in university, 𝑋!

19
represents the set of explanatory variables, which includes age, sex, admission
average from CEGEP, program language, citizenship, the difference in financial cost
in the first year, and the faculty which the students is admitted; 𝜀! is the error term.
6. Results
6.1 First Year Retention Rate
Table 4 reports the estimates for the LPM model for first year retention. In the
discussion below, I focus on the baseline specification (my preferred specification).
Age, gender, citizenship, the differences in financial costs, and admission to the
Faculty of Arts and to the Faculty of Social Sciences all statistically significantly
influence first year retention. The fact that age, sex, and citizenship are key factors
affecting student retention is consistent with the findings of Beattie, Laliberté &
Oreopoulos (2016), Hu & John (2001), Leppel (2002), Singell (2004), Angrist, Lang
& Oreopoulos (2009), Bean (1980), Childs, Finnie & Martinello (2017), Wohlgemuth
et al (2007), Herzog (2005).

20
The estimated coefficient for age is -.00668, which means that a 21-year-old student
is 0.67 percentage points less likely to remain at uOttawa than is a 20-year-old student.
The sign of the coefficient estimate of sex is negative: a male student is 2.24
percentage points less likely to persist than is a female student. A Canadian citizen is
7.34 percentage points less likely to persist at uOttawa than is a Permanent Resident.
An increase of $1000 in the financial costs differences in the first year decreases the
probability of retention by 2.79 percentage points. A student admitted to the Faculty
of Arts or to the Faculty of Social Sciences is 6.81 percentage points and 3.87
percentage points respectively less likely to persist. Surprisingly, the admission
average from CEGEP is not statistically significant; this is inconsistent with the
findings of Childs, Finnie & Martinello (2017), Delen (2010).
In my second specification, I interact sex and other explanatory variables. Sex and
citizenship as well as sex and differences in financial costs in first year interaction
terms are both statistically significant, which implies that the citizenship of citizen
reduces the retention of females more than it reduces the retention of males, and

21
higher financial costs differences in the first year reduces the retention of females less
than it reduces the retention of males.
In my third specification, I interact financial costs differences and other explanatory
variables. Differences in financial costs in first year and admission average as well as
sex and differences in financial costs in first year interaction terms are statistically
significant, which implies a higher admission average reduces the retention of the
students with a higher financial costs differences less than it reduces the retention of
students with a lower financial costs differences.
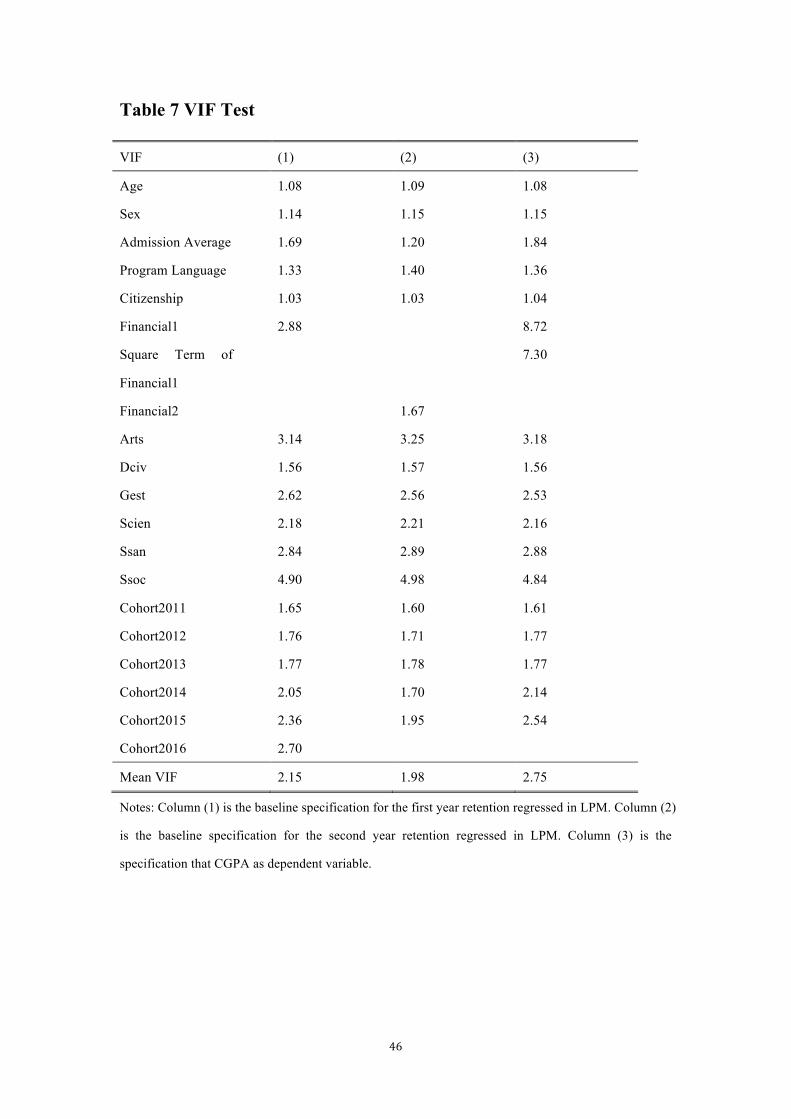
The VIF test indicates the multicollnearity problem. If VIF is greater than 10, then
there exists multicollnearity problem. The results in Table 7 show that there is no
multicollnearity problem for the baseline specification. Table 8 reports the results of
Wald test. According to the results we can reject the null hypothesis that estimated
coefficients of all explanatory variables are zero (p-value=0) at 1% significant level.

22
6.2 Second Year Retention Rate
In addition to first year retention, I also consider the second year retention in this
paper. The baseline specification is the same as the first year baseline specification,
except that I use the second year financial costs differences rather than the first year.
As some students drop out after first year, and the students admitted in 2016 were
only observed once, my sample size for second year retention is 4,157.
Table 5 reports the estimates for the LPM model for second year retention. Age,
gender, admission average, the differences in financial costs, admission to the Faculty
of Arts, to the Faculty of Health Sciences and to the Faculty of Social Sciences all
have a statistically significantly influence on second year retention. The fact that age,
sex, and admission average are key factors affecting student retention is consistent
with the findings of Beattie, Laliberté & Oreopoulos (2016), Hu & John (2001),
Leppel (2002), Singell (2004), Angrist, Lang & Oreopoulos (2009), Bean (1980),
Childs, Finnie & Martinello (2017), Wohlgemuth et al (2007), Delen (2010).

23
Although similar, the results are nonetheless somewhat different than for first year
retention. The estimated coefficient for age is -.01189, which means that a
21-year-old student is 1.19 percentage points less likely to remain at uOttawa than is a
20-year-old student. The sign of the coefficient estimate of sex is negative: a male
student is 2.85 percentage points less likely to persist than is a female student.
However, the result for the admission average is quite different: the estimated
coefficient is statistically significant, and an increase of 1 unit in the admission
average increases the probability of retention by 0.48 percentage points. An increase
of $1000 in the financial costs differences in the second year decreases the probability
of retention by 5.44 percentage points. A student admitted to the Faculty of Arts, the
Faculty of Health Sciences or the Faculty of Social Sciences is 10.08 percentage
points, 7.23 percentage points and 4.85 percentage points respectively less likely to
persist.
In my second specification, I interact sex and other explanatory variables. Unlike first
year retention, all the interaction terms are not statistically significant.

24
In my third specification, I interact the financial costs differences and the other
explanatory variables. The age and differences in financial costs in second year
interaction term is positive and statistically significant, which implies that older
students are less sensitive to financial costs differences than are younger student.
The results in Table 7 show that there is no multicollnearity problem for the baseline
specification. Table 8 reports the results of Wald test. According to the results we can
reject the null hypothesis that estimated coefficients of all explanatory variables are
zero (p-value=0) at 1% significant level.
6.3 Determinants of Academic Performance: CGPA
Table 6 shows the OLS results when first-year CGPA (CGPA1YR) is the dependent
variable. Admission average, program language, citizenship, the differences in
financial costs in the first year, the square term of differences in financial costs, and
admission to the Faculty of Law, the Telfer School of Management, the Faculty of
Science and the Faculty of Social Sciences are statistically significant. The program

25
language is English, difference in financial cost, students admitted to the Faculty of
Law, to the Telfer School of Management, to the Faculty of Science and to the
Faculty of Social Sciences have lower CGPA; the admission average and Canadian
citizenship have positive impact on CGPA. The significance of squared term of the
differences in financial costs suggests that there exists a non-linear relationship
between CGPA and the differences in financial costs. For the VIF test, Table 7
indicates that there is no multicollnearity problem for the regression.
6.4 Robustness Check: Comparison with Probit Estimates
The R-squared reported in Table 4 and Table 5 are small (0.0224 and 0.0376
respectively). A low R-squared does not imply that the regression is wrong and
useless, and whether or not the model is appropriate does not depend directly on
R-squared (Wooldridge (2012)).
However, as a robustness check, I estimated the baseline specification using a Probit
procedure. The results are reported in Table 9 and Table 10. Column (3) in Table 9

26
and Table 10 reproduce the results of the baseline specification for the first year
retention and the second year retention regressed in LPM previously reported in Table
4 and Table 5.
From the results in Table 9 and Table 10, I can see that, for the first year retention, the
coefficient estimates and average marginal effect of age, sex, citizenship, differences
in financial costs, the student admitted to the Faculty of Arts and the Faculty of Social
Sciences are statistically significant in the Probit model, which is consistent with the
result in LPM; while for the second year retention, the estimated coefficients and
average marginal effect of age, sex, admission average in CEGEP, differences in
financial costs, the student admitted to the Faculty of Arts, the Faculty of Health
Sciences and the Faculty of Social Sciences are statistically significant in the Probit
model, and the result is consistent with the result from the LPM as well.
6.5 Robustness Check: LOCAL and FINANCIAL
As a second robustness check, I substitute local variable for differences in financial

27
costs variable in the baseline specification of the LPM model for first year retention
and second year retention.
Table 11 reports the results. Local variable is statistically significant at the 1%
significance level as in financial costs differences in first and second year, and the
estimated coefficient is .06939 for first year and .08579 for second year. A local
student is therefore 6.94 percentage points more likely to persist than is a non-local
student in the first year, and a local student is 8.58 percentage points more likely to
persist than is a non-local student in the second year. Column (2) and (4) report that
financial costs differences in first and second year are statistically significant at 1%
significance level, and the estimated coefficient for financial costs differences in first
year is -.0000279, for financial costs differences in second year is -.0000544. From
the evidences above, I can conclude that a decrease of $2500 in the financial costs
differences has a similar effect with the retention rates in the first year as does being
local; a decrease of $1600 in the financial costs differences has a similar effect to
being local on retention rates in the second year.

28
Difference in the set of significant explanatory variables may be suggestive of
whether it is appropriate to interpret the financial costs differences in first and second
year variables as actually measuring the impact of the differences in financial costs
versus simply being non-local, and the appropriate interpretation of the financial costs
differences in first and second year variables is that it measures the effect of
differences in financial costs, and we cannot disentangle these two effects because of
multicollinearity.
7. Conclusion
This paper investigates the factors that affect the retention rates for CEGEP students
after the first and second year of undergraduate education. The study uses
administrative data extracted by the Office of the Registrar at the University of
Ottawa. There are no other studies which have looked at retention rates for
out-of-province students in Canada, or which have highlighted the role of financial
costs differences. The results show that age, sex, the differences in financial costs, and
the faculty to which the student is admitted of are crucial factors that affect retention

29
in the first year and the second year; all of these factors have a negative effect.
Surprisingly, I find that the admission average from CEGEP has positive effect on
second year retention but does not affect first year retention, which is unusual since
admission average is generally considered a key factor influence on first year
academic performance, which in turn affects first year retention. Canadian citizenship
negatively affects first year retention, but does not affect retention in the second year.
I also find that admission to the Faculty of Health Sciences has a negative influence
on second year retention but not first year retention.
The evidence suggests that the University of Ottawa should pay more attention to the
age and sex of the CEGEP students, and make strategies to diminish the differences in
financial costs, which includes tuition fees, accommodation costs and scholarships for
different regions. The result also suggests that the university should tailor its strategy
is the different faculties, especially the Faculty of Arts and the Faculty of Social
Sciences.

30
Limitation of this study is that it did not distinguish between students admitted after
over one year of CEGEP and those admitted after two years of CEGEP. Also, it did
not include detailed information regarding the permanent address, and therefore may
have underestimated the costs differences for students whose permanent address is in
a community in which they could choose to live at home while studying at university.
It would also have been useful to distinguish between programs which have limited
enrollment in Quebec and those which do not.

31
References
Angrist, J., Lang, D., & Oreopoulos, P. (2009). Incentives and services for college
achievement: Evidence from a randomized trial. American Economic Journal:
Applied Economics, 1 (1), 136-163.
Beattie, G., Laliberté, J. W. P., & Oreopoulos, P. (2016). Thrivers and Divers: Using
Non-Academic Measures to Predict College Success and Failure. National
Bureau of Economic Research: W22629.
Bean, J. P. (1980). Dropouts and turnover: The synthesis and test of a causal model of
student attrition. Research in Higher Education, 12 (2), 155-187.
Bettinger, E. P., Long, B. T., Oreopoulos, P., & Sanbonmatsu, L. (2012). The role of
application assistance and information in college decisions: Results from the
H&R Block FAFSA experiment. The Quarterly Journal of Economics, 127 (3),
1205-1242.
Childs, S. E., Finnie, R., & Martinello, F. (2017). Postsecondary Student Persistence
and Pathways: Evidence from the YITS-A in Canada. Research in Higher
Education, 58 (3), 270- 294.
Delen, D. (2010). A comparative analysis of machine learning techniques for student
retention management. Decision Support Systems, 49 (4), 498-506.
Garibaldi, P., Giavazzi, F., Ichino, A., & Rettore, E. (2012). College cost and time to
complete a degree: Evidence from tuition discontinuities. Review of Economics
and Statistics, 94 (3), 699-711.
Herzog, S. (2005). Measuring determinants of student return vs. dropout/stopout vs.
transfer: A first-to-second year analysis of new freshmen. Research in Higher
Education, 46 (8), 883-928.

32
Hu, S., & John, E. P. S. (2001). Student persistence in a public higher education
system: Understanding racial and ethnic differences. The Journal of Higher
Education, 72 (3), 265-286.
Hochstein, S. K., & Butler, R. R. (1983). The Effects of the Composition of a
Financial Aids Package on Student Retention. Journal of Student Financial Aid,
13 (1), 21-26.
Wooldridge, J. M. (2015). Introductory econometrics: A modern approach. Nelson
Education, 38-39.
Leppel, K. (2002). Similarities and differences in the college persistence of men and
women. The Review of Higher Education, 25 (4), 433-450.
Singell, L. D. (2004). Come and stay a while: does financial aid effect retention
conditioned on enrollment at a large public university? Economics of Education
Review, 23 (5), 459-471.
Wetzel, J. N., O’Toole, D., & Peterson, S. (1999). Factors affecting student retention
probabilities: A case study. Journal of Economics and Finance, 23 (1), 45-55.
Wohlgemuth, D., Whalen, D., Sullivan, J., Nading, C., Shelley, M., & Wang, Y.
(2007). Financial, academic, and environmental influences on the retention and
graduation of students. Journal of College Student Retention: Research, Theory
& Practice, 8 (4), 457-475.

33
Appendix - Tables and Figures
Figure 1 University Tuition Fees For Full-Time Undergraduate Canadian
Students
Source:
http://odesidownload.scholarsportal.info.proxy.bib.uottawa.ca/documentation/TLAC/tlac9310-tabl
es.html
0.00
1000.00
2000.00
3000.00
4000.00
5000.00
6000.00
7000.00
8000.00
9000.00
10000.00
Quebec
uOttawa

34
Figure 2 Living Accommodation Costs At Residences (Room Only)
Source:
http://odesidownload.scholarsportal.info.proxy.bib.uottawa.ca/documentation/TLAC/tlac9310-tabl
es.html
0.00
1000.00
2000.00
3000.00
4000.00
5000.00
6000.00
7000.00
8000.00
Quebec
uOttawa

35
Table 1 Definitions
Variables Definition
Dependent Variables
First Year Retention The individual remained in the program after the first year.
Second Year Retention The individual remained in the program after the second year.
Independent Variables
Age Age at admission
Sex The student is male.
Admission Average Admission average in CEGEP
Scholarship Average The best five courses average in CEGEP
CGPA Cumulative grade point average after first year in university
Local Students that come from the Outaouais region.
Program Language Program language is English.
Citizenship The student is Canadian citizen.
Permanent Resident The student is permanent resident.
Cohort2010 The student admitted in 2010.
Cohort2011 The student admitted in 2011.
Cohort2012 The student admitted in 2012.
Cohort2013 The student admitted in 2013.
Cohort2014 The student admitted in 2014.
Cohort2015 The student admitted in 2015.
Cohort2016 The student admitted in 2016.
Arts The student admitted in the Faculty of Arts.
Dciv The student admitted in the Faculty of Low.
Genie The student admitted in the Faculty of Engineering.
Gest The student admitted in the Telfer School of Management.
Scien The student admitted in the Faculty of Science.
Ssan The student admitted in the Faculty of Health Sciences.
Ssoc The student admitted in the Faculty of Social Sciences.
Financial1 Financial costs differences variable in the first year
Financial2 Financial costs differences variable in the second year

36
Table 2 Descriptive Statistics - Full Data Set (2010-2016)
Variables Obs. Mean Std. Dev. Min Max All University
Dependent Variables
First Year
Retention
4,814 .82489 .38010 0 1 87.2% (2014)
Second Year
Retention
4,203 .75042 .43282 0 1
Independent Variables
Age 4,814 20.02243 2.82084 16 58
Sex 4,814 .34607 .47577 0 1 39.74% (Fall
2015)
Admission
Average
4,753 76.42378 6.83306 60 97.2 86.3 (Fall 2015)
Scholarship
Average
4,021 83.11929 6.63168 59.2 99.7
CGPA 3,926 6.56897 1.79438 .13 10
Local 4,814 .48920 .49994 0 1
Program
Language
4,814 .30307 .45963 0 1
Citizenship 4,814 .97466 .15718 0 1
Permanent
Resident
4,814 .02514 .15655 0 1
Cohort2010 4,814 .152472 .35952 0 1
Cohort2011 4,814 .13648 .34333 0 1
Cohort2012 4,814 .15019 .35729 0 1
Cohort2013 4,814 .14977 .35688 0 1
Cohort2014 4,814 .13689 .34377 0 1
Cohort2015 4,814 .14728 .35442 0 1
Cohort2016 4,814 .12692 .33292 0 1
Arts 4,814 .15476 .36171 0 1
Dciv 4,814 .03303 .17873 0 1
Genie 4,814 .06336 .24363 0 1

37
Gest 4,814 .11944 .32434 0 1
Scien 4,814 .08351 .27667 0 1
Ssan 4,814 .12360 .32916 0 1
Ssoc 4,814 .42231 .49398 0 1
Financial1 4,814 2671.926 1794.461 -2022.62 6815.18
Financial2 4,814 3874.46 1173.775 1977.38 6815.18
Notes: The last column shows the sample of the university as a whole when the binary variable is equal
to 1. Source of the last column:
https://www.uottawa.ca/institutional-research-planning/resources/facts-figures/cudo/2016-menu

38
Table 3 Correlation Coefficients
Correlation
Coefficients
Local Admission
Average
Financial1 Financial2
Local 1.0000
Admission Average 0.0595 1.0000
Financial1 -0.5258 -0.3856 1.0000
Financial2 -0.7453 -0.0616 0.7913 1.0000

39
Table 4 First Year Retention
Variables (1) (2) (3)
Age -.0066777***
(.0023452)
-.0075659***
(.0028643)
-.0132657***
(.0049079)
Sex -.0223775*
(.0124886)
-.1284046
(.2177484)
.0096185
(.0204265)
Admission Average .0007385
(.0010493)
.0009794
(.0012066)
-.001783
(.0014642)
Program Language -.0094105
(.0140085)
-.0093873
(.0171393)
.0061137
(.0231526)
Citizenship -.0734123**
(.0326395)
-.122418***
(.0317165)
.0405502
(.0820144)
Financial1 -.0000279***
(5.18e-06)
-.0000234***
(5.55e-06)
-.0001072*
(.0000574)
Arts -.0681394***
(.0257811)
-.0660435**
(.0260825)
-.0628975**
(.0258343)
Dciv -.0530384
(.0349514)
-.0519427
(.034989)
-.0471575
(.035019)
Gest -.0100527
(.025178)
-.0064345
(.02538)
-.0030498
(.0251831)
Scien -.0198977
(.0264485)
-.0205197
(.0265139)
-.017846
(.0264669)
Ssan -.0013843
(.0254713)
.0011937
(.0256716)
.0001187
(.025535)
Ssoc -.0387219*
(.022607)
-.0376154*
(.0228523)
-.0349922
(.0226558)
Sex and Age
Interaction Term
.002736
(.0049771)
Sex and Admission
Average Interaction
Term
-.0005969
(.0019644)
Sex and Program .0048809

40
Language
Interaction Term
(.0275029)
Sex and Citizenship
Interaction Term
.1359928*
(.0772707)
Sex and Financial1
Interaction Term
-.000014*
(7.97e-06)
-.000012*
(6.83e-06)
Age and Financial1
Interaction Term
2.21e-06
(1.52e-06)
Admission Average
and Financial1
Interaction Term
9.37e-07**
(4.76e-07)
Program Language
and Financial1
Interaction Term
-3.73e-06
(6.79e-06)
Citizenship and
Financial1
Interaction Term
-.0000343
(.0000219)
Cohort2011 .0259337
(.0200448)
.0262091
(.0200609)
.0279051
(.0200485)
Cohort2012 .0301321
(.0205467)
.0310242
(.0205683)
.0331593
(.0206267)
Cohort2013 .0507787**
(.0199966)
.0513725***
(.0199806)
.0529057***
(.0200619)
Cohort2014 .0381632
(.0234041)
.0373966
(.0234296)
.0432199*
(.0234941)
Cohort2015 .0665743***
(.0246518)
.0664044***
(.0246698)
.0714734***
(.0246576)
Cohort2016 .0852045***
(.0277973)
.0851282***
(.0278222)
.0920525***
(.0278415)
N 4,753 4,753 4,753
R-squared 0.0224 0.0240 0.0250
Notes: Column (1) is the baseline specification. Column (2) is the specification includes sex_age,
sex_admavg, sex_lan, sex_citizen, sex_finan1 interaction terms. Column (3) is the specification

41
includes finan1_age, finan1_admavg, finan1_lan, finan1_citizen, sex_finan1 interaction terms.
*significant at 10% level. **significant at 5% level. ***significant at 1% level.

42
Table 5 Second Year Retention
Variables (1) (2) (3)
Age -.0118952***
(.0027027)
-.0121163***
(.0031882)
-.0412105***
(.0086208)
Sex -.0285327*
(.0151006)
-.009492
(.2457427)
-.0138969
(.0524174)
Admission Average .0048461***
(.0010392)
.0053833***
(.0012416)
.0000985
(.0037313)
Program Language .0198872
(.0174428)
.0368002*
(.021363)
.0126259
(.0661613)
Citizenship -.0523099
(.0421801)
-.0879222*
(.048719)
-.0132787
(.1446619)
Financial2 -.0000544***
(8.41e-06)
-.0000552***
(9.77e-06)
-.0003136***
(.0001075)
Arts -.1007554***
(.0307728)
-.1042145***
(.0309904)
-.0988015***
(.0309849)
Dciv .0226405
(.0399849)
.0195147
(.0401189)
.0232753
(.0400771)
Gest -.0125746
(.0306949)
-.0157409
(.0310159)
-.0089182
(.0309407)
Scien -.0470437
(.0322903)
-.0509913
(.0323458)
-.0466515
(.0323892)
Ssan -.0723129**
(.0317729)
-.0742821**
(.0318924)
-.0716783**
(.0319481)
Ssoc -.0484651*
(.0272958)
-.0522071*
(.0274228)
-.0480329*
(.0274188)
Sex and Age
Interaction Term
.0005717
(.0058805)
Sex and Admission
Average Interaction
Term
-.0015421
(.0021036)
Sex and Program -.0445616

43
Language Interaction
Term
(.0349237)
Sex and Citizenship
Interaction Term
.0918856
(.0931503)
Sex and Financial2
Interaction Term
2.95e-06
(.0000159)
-4.39e-06
(.0000141)
Age and Financial2
Interaction Term
8.41e-06***
(2.53e-06)
Admission Average
and Financial2
Interaction Term
1.29e-06
(1.01e-06)
Program Language
and Financial2
Interaction Term
2.10e-06
(.000016)
Citizenship and
Financial2
Interaction Term
-6.12e-06
(.0000368)
Cohort2011 .0132909
(.0225989)
.012764
(.0225952)
.0147255
(.0225459)
Cohort2012 .0414348*
(.0228383)
.0408707*
(.0228159)
.0420531*
(.0228246)
Cohort2013 .0563171**
(.022962)
.0557147**
(.0229533)
.0573338**
(.0229656)
Cohort2014 .0386971
(.0236418)
.0370928
(.0236673)
.0390978*
(.0236297)
Cohort2015 .0112559
(.0257188)
.0105562
(.0257144)
.0097853
(.0257072)
N 4,157 4,157 4,157
R-squared 0.0376 0.0385 0.0407
Notes: Column (1) is the baseline specification. Column (2) is the specification includes sex_age,
sex_admavg, sex_lan, sex_citizen, sex_finan2 interaction terms. Column (3) is the specification
includes finan2_age, finan2_admavg, finan2_lan, finan2_citizen, sex_finan2 interaction terms.
*significant at 10% level. **significant at 5% level. ***significant at 1% level.

44
Table 6 Academic Performance - CGPA
Variables Coef.
Age .0107637
(.0092469)
Sex .0320696
(.0528953)
Admission Average .1183354***
(.0048957)
Program Language -.9431312***
(.0602041)
Citizenship .3660389**
(.1509274)
Financial1 -.0002578***
(.0000403)
Square Term of
Financial1
1.89e-08***
(7.17e-09)
Arts -.1328063
(.123805)
Dciv -1.985762***
(.1762328)
Gest -.5009891***
(.1216681)
Scien -.56076***
(.1359393)
Ssan .108769
(.1250654)
Ssoc -.3797862***
(.1153189)
Cohort2011 -.0669879
(.0807308)
Cohort2012 .0257079
(.0820376)

45
Cohort2013 .2237985***
(.082738)
Cohort2014 .3613024***
(.096748)
Cohort2015 .5584913***
(.0992414)
N 3,883
*significant at 10% level. **significant at 5% level. ***significant at 1% level.
46
Table 7 VIF Test
VIF (1) (2) (3)
Age 1.08 1.09 1.08
Sex 1.14 1.15 1.15
Admission Average 1.69 1.20 1.84
Program Language 1.33 1.40 1.36
Citizenship 1.03 1.03 1.04
Financial1 2.88 8.72
Square Term of
Financial1
7.30
Financial2 1.67
Arts 3.14 3.25 3.18
Dciv 1.56 1.57 1.56
Gest 2.62 2.56 2.53
Scien 2.18 2.21 2.16
Ssan 2.84 2.89 2.88
Ssoc 4.90 4.98 4.84
Cohort2011 1.65 1.60 1.61
Cohort2012 1.76 1.71 1.77
Cohort2013 1.77 1.78 1.77
Cohort2014 2.05 1.70 2.14
Cohort2015 2.36 1.95 2.54
Cohort2016 2.70
Mean VIF 2.15 1.98 2.75
Notes: Column (1) is the baseline specification for the first year retention regressed in LPM. Column (2)
is the baseline specification for the second year retention regressed in LPM. Column (3) is the
specification that CGPA as dependent variable.

47
Table 8 Wald Test
(1) (2)
F(#, N) 6.02 9.96
Prob > F 0.0000 0.0000
Notes: Column (1) is the baseline specification for the first year retention regressed in LPM. Column (2)
is the baseline specification for the second year retention regressed in LPM.

48
Table 9 Probit Estimates – First Year Retention
(1) (2) (3)
Age -.0241838***
(.0073721)
-.0060478***
(.0018392)
-.0066777***
(.0023452)
Sex -.0907902*
(.0482554)
-.0227043*
(.0120591)
-.0223775*
(.0124886)
Admission Average .0029545
(.0041092)
.0007389
(.0010276)
.0007385
(.0010493)
Program Language -.0259852
(.0536177)
-.0064982
(.013408)
-.0094105
(.0140085)
Citizenship -.2989171**
(.149986)
-.0747516**
(.0374841)
-.0734123**
(.0326395)
Financial1 -.0001147***
(.0000206)
-.0000287***
(5.14e-06)
-.0000279***
(5.18e-06)
Arts -.2830828***
(.1093597)
-.0707918***
(.0273129)
-.0681394***
(.0257811)
Dciv -.2217323
(.1578997)
-.0554496
(.0394754)
-.0530384
(.0349514)
Gest -.0506207
(.1127286)
-.012659
(.0281897)
-.0100527
(.025178)
Scien -.0949087
(.1215735)
-.0237342
(.0303977)
-.0198977
(.0264485)
Ssan -.0126281
(.1172227)
-.003158
(.0293141)
-.0013843
(.0254713)
Ssoc -.1675041*
(.1018074)
-.0418885*
(.025447)
-.0387219*
(.022607)
Cohort2011 .1046555
(.0812641)
.0261717
(.0203164)
.0259337
(.0200448)
Cohort2012 .1200327
(.0799767)
.0300171
(.0199929)
.0301321
(.0205467)
Cohort2013 .204029**
(.0813705)
.0510225**
(.0203288)
.0507787**
(.0199966)

49
Cohort2014 .1597533*
(.0891325)
.0399503*
(.0222767)
.0381632
(.0234041)
Cohort2015 .2704131***
(.0938788)
.0676235***
(.023446)
.0665743***
(.0246518)
Cohort2016 .3555494***
(.1073499)
.0889139***
(.026797)
.0852045***
(.0277973)
N 4,753 4,753 4,753
Notes: Column (1) is the baseline specification for the first year retention regressed in probit model.
Column (2) is the average marginal effect for the first year retention. Column (3) is the baseline
specification for the first year retention regressed in LPM. *significant at 10% level. **significant at 5%
level. ***significant at 1% level.

50
Table 10 Probit Estimates – Second Year Retention
(1) (2) (3)
Age -.034228***
(.0074434)
-.0104519***
(.0022564)
-.0118952***
(.0027027)
Sex -.0947252**
(.0479661)
-.0289254**
(.0146297)
-.0285327*
(.0151006)
Admission Average .016171***
(.0034923)
.004938***
(.0010598)
.0048461***
(.0010392)
Program Language .0664076
(.0547263)
.0202783
(.0167023)
.0198872
(.0174428)
Citizenship -.1611032
(.1348358)
-.0491947
(.0411572)
-.0523099
(.0421801)
Financial2 -.0001783***
(.0000267)
-.0000544***
(8.05e-06)
-.0000544***
(8.41e-06)
Arts -.3431728***
(.1096883)
-.1047918***
(.033401)
-.1007554***
(.0307728)
Dciv .107389
(.1702088)
.0327925
(.0519696)
.0226405
(.0399849)
Gest -.0535878
(.1146399)
-.0163637
(.0350052)
-.0125746
(.0306949)
Scien -.1698359
(.120653)
-.0518614
(.0368229)
-.0470437
(.0322903)
Ssan -.2627917**
(.1147875)
-.0802465**
(.0350021)
-.0723129**
(.0317729)
Ssoc -.1762924*
(.1024944)
-.0538329*
(.0312743)
-.0484651*
(.0272958)
Cohort2011 .0415459
(.0750793)
.0126865
(.0229245)
.0132909
(.0225989)
Cohort2012 .1332836*
(.0746327)
.0406997*
(.0227685)
.0414348*
(.0228383)
Cohort2013 .181689**
(.0763022)
.0554808**
(.0232611)
.0563171**
(.022962)

51
Cohort2014 .1237503
(.0776459)
.0377886
(.023692)
.0386971
(.0236418)
Cohort2015 .0462463
(.0796222)
.0141218
(.0243119)
.0112559
(.0257188)
N 4,157 4,157 4,157
Notes: Column (1) is the baseline specification for the second year retention regressed in probit model.
Column (2) is the average marginal effect for the second year retention. Column (3) is the baseline
specification for the second year retention regressed in LPM. *significant at 10% level. **significant at
5% level. ***significant at 1% level.

52
Table 11 Robustness Test: Local Versus Financial
(1) (2) (3) (4)
Age -.0062936***
(.0023268)
-.0066777***
(.0023452)
-.0116246***
(.0027027)
-.0118952***
(.0027027)
Sex -.0243838*
(.0124944)
-.0223775*
(.0124886)
-.0284955*
(.0151032)
-.0285327*
(.0151006)
Admission
Average
.0035541***
(.0008606)
.0007385
(.0010493)
.0055753***
(.0010283)
.0048461***
(.0010392)
Program
Language
-.0337725***
(.0127562)
-.0094105
(.0140085)
-.0247597*
(.0152572)
.0198872
(.0174428)
Citizenship -.0689431**
(.0324953)
-.0734123**
(.0326395)
-.0508316
(.0420038)
-.0523099
(.0421801)
Local .0693926***
(.011139)
.0857957***
(.0135658)
Financial1 -.0000279***
(5.18e-06)
Financial2 -.0000544***
(8.41e-06)
Arts -.0622256**
(.0257589)
-.0681394***
(.0257811)
-.0991388***
(.0308555)
-.1007554***
(.0307728)
Dciv -.0327956
(.0352693)
-.0530384
(.0349514)
.0115657
(.0400189)
.0226405
(.0399849)
Gest -.0188767
(.0263225)
-.0100527
(.025178)
-.0146998
(.0307551)
-.0125746
(.0306949)
Scien .0021031
(.0253887)
-.0198977
(.0264485)
-.049322
(.0323286)
-.0470437
(.0322903)
Ssan -.0318065
(.0226967)
-.0013843
(.0254713)
-.0676429**
(.031868)
-.0723129**
(.0317729)
Ssoc -.0188767
(.0263225)
-.0387219*
(.022607)
-.0485789*
(.0273566)
-.0484651*
(.0272958)
Cohort2011 .0169889
(.0199067)
.0259337
(.0200448)
.0086885
(.0226)
.0132909
(.0225989)

53
Cohort2012 .0046174
(.019774)
.0301321
(.0205467)
.0075909
(.0220542)
.0414348*
(.0228383)
Cohort2013 .0271579
(.0192998)
.0507787**
(.0199966)
.0137494
(.0219816)
.0563171**
(.022962)
Cohort2014 -.0167277
(.0208237)
.0381632
(.0234041)
.0005254
(.0229588)
.0386971
(.0236418)
Cohort2015 -.0028072
(.020378)
.0665743***
(.0246518)
-.0544336**
(.0233935)
.0112559
(.0257188)
Cohort2016 -.0050765
(.0210672)
.0852045***
(.0277973)
N 4,753 4,753 4,157 4,157
Notes: Column (1) is the baseline specification replacing FINANCIAL1 with LOCAL for the first year
retention. Column (2) is the baseline specification for the first year retention regressed in LPM.
Column (3) is the baseline specification replacing FINANCIAL2 with LOCAL for the second year
retention. Column (4) is the baseline specification for the second year retention regressed in LPM.
*significant at 10% level. **significant at 5% level. ***significant at 1% level.