Embed Size (px)
Citation preview
AUSTRALIAN
apprenticeships
Factors affectingthe provision ofentry-level trainingby enterprises
K Ball
B Freeland
Australian Apprenticeships

2001 National Centre for Vocational Education Research LtdABN 87 007 967 311
ISBN 0 87397 696 7 web editionTD/TNC 65.63
Published byNCVER Ltd252 Kensington Road, Leabrook, SA 5068PO Box 115, Kensington Park, SA 5068, Australiawww.ncver.edu.au
Contents
ContentsExecutive summary ..................................................................................................5Introduction ................................................................................................................6
Background.................................................................................................................6Small and medium-sized enterprises ...........................................................................7
Distinctive features of Australian small and medium-sized enterprises.......................... 7Apprentices and trainees in small and medium-sized enterprises.................................. 8
Previous research....................................................................................................10Methodology ...........................................................................................................13
Scope 13Business Longitudinal Survey (BLS) ............................................................................. 13
Reliability of data......................................................................................................14
Data 14Analysis...................................................................................................................... 15
Factors affecting provision of apprentice and trainee training ...............17‘Non-training’ enterprise characteristics .....................................................................17‘Training’ enterprise characteristics ............................................................................22
Conclusions...............................................................................................................24References................................................................................................................26Appendix A...............................................................................................................27Appendix B ...............................................................................................................33

List of tables and figuresTable 1: Commencements of contracts of training by employer size (%), 1996–97 to 1998–99 .. 8Table 2: Number of enterprises by industry and employer size 1998–99 (000s) .....................13Table 3: Enterprises reporting provision of apprentice and trainee training by level of training
provision 1997–98 .....................................................................................................15Table 4: Significant characteristics influencing the propensity to provide entry-level training
................................................................................................................................16Table 5: Significance levels and odds-ratios for variables ....................................................18Table A-1: Apprentice and trainee training: construction of variables, BLS...........................27Table B-1: Factors influencing the propensity to provide apprentice, trade or traineeship
training ....................................................................................................................33

Executive summary 5
Executive summaryThis report has been prepared as part of the National Centre for Vocational Education andResearch (NCVER) Research and Evaluation program. The report examines the keydeterminants of apprentice and trainee employment in small and medium-sized enterprises.The study was undertaken in response to evidence of the increasing role played by small andmedium-sized firms in providing employment-based training in Australia.
The research presented in the report utilises unit record data from the four waves of theAustralian Bureau of Statistics, business growth and performance surveys conducted over theperiod 1994-95 to 1997-98. The surveys involved national questionnaires sent to 13 000businesses selected from the ABS business register. Only those businesses employing fewerthan 200 employees were included in the scope of the sample. The surveys were designed toprovide information on the growth and performance of Australia’s employing businesseswhile identifying the economic and structural characteristics of these businesses.
Statistical analysis, using a probit regression was undertaken to model the influence of thebusiness’ variables on the propensity of the businesses to provide apprentice and traineetraining.
The results from the regression analysis support many of the findings of training driverspresented in the literature review. It is likely that some of the variation in results between thisand other studies can be attributed to the use of different data and research methods.
The analysis provides no evidence of a single business characteristic acting as a trigger forsmall and medium-size enterprises to provide apprentice and trainee training. However,employment characteristics do affect an enterprise’s propensity to undertake apprentice andtrainee training. Larger firms and firms with a high proportion of full-time staff are morelikely to provide apprentice and trainee training than other firms. Firms that are expanding insize within the confines of their existing sites are also likely to provide apprentice and traineetraining. The analysis provides evidence which supports claims by employers that morestable economic conditions and the ability to expand their enterprise increases the propensityto train trade apprentice and trainees.
The research supports the view that employment and training are inextricably linked. Theanalysis highlights the relationship between expanding employment, the skills-needs ratioand the provision of apprentice and trainee training.
The analysis provides support to qualitative research that found the educational backgroundof managers and the traditions of apprentice training within an industry have considerableimpact on the decision to take on an apprentice.
The most important result of the regression analysis is the support provided to the concept ofa training culture. This analysis provides evidence of a significant effect of a training cultureon employers' propensity to provide entry-level training.
There are a number of elements of a training culture in small and medium-sized enterprisesthat emerge from the analysis of the business longitudinal survey. The training experiencesof enterprise decision-makers are a crucial factor influencing the decision to train apprenticesand trainees. If the head of a firm has a trade qualification then the firm is highly likely toconduct apprentice and trainee training. Firms that undertake programs of formal structuredtraining and on-the-job training for their employees are highly likely to utilise the apprenticeand trainee system for entry-level training.

6 Factors affecting the provision of entry-level training by enterprises
IntroductionBackgroundThis study examines the provision of apprentice and trainee training opportunities inAustralian small and medium-sized enterprises. The research utilised data from theAustralian Bureau of Statistics, business growth and performance surveys conductedbetween 1994-95 and 1997-98.
The objective of the research is to identify the key determinants of apprentice and traineeemployment in Australian small and medium-sized enterprises. The entry-level trainingactivities of small and medium-sized enterprises are of interest because they account for asignificant and growing proportion of Australia's total employment. The study wasundertaken in response to evidence of the increasing role played by small and medium-sizedfirms in providing employment-based training in Australia.
In a study of the structure of Australian business, the Department of Employment WorkplaceRelations and Small Business (DEWRSB 1999) found that about 95% of all enterprises inAustralia were private-sector 'small enterprises'. In an analysis of employment generation theAustralian Bureau of Statistics (ABS) reported that in 1996–97 small enterprises contributed53% of Australia’s total job generation and that private small enterprise employmentaccounted for 42% of total Australian employment (ABS 1998). These findings weresupported by the Productivity Commission which found that Australian firms with less than20 employees accounted for 53% of new employment over the ten years prior to 1994–95(Productivity Commission 1996).
The Productivity Commission (1996) attributed the expansion of employment in smallenterprises to the contraction in the share of public employment, increases in the sectoralemployment share of services and the reduction in the average size of a manufacturing firm.Although it is recognised that large enterprises are more likely to provide training than smalland medium-sized enterprises, the size of the enterprise is becoming less of a predictor oftraining than the market position and internal composition of the enterprise.
In a related study examining the changing nature of work and its implications for vocationaleducation and training (VET) in Australia Waterhouse, Wilson and Ewer (1999) reported:
The scale [size] of the enterprise . . . in which employment is found has changed . . . Selfemployment grew by 255 000 people between 1986 and 1993; the number of employees working forfirms employing fewer than 20 people increased from 1 271 000 to 1 509 000 over the same period,while enterprises employing more than 100 people shed some 7000 jobs.
(Waterhouse, Wilson & Ewer 1999, p.8)
Waterhouse, Wilson and Ewer (1999) attribute the growing importance of small enterprises toshifts in Australia's industrial composition. Significant changes which have affected theemployment composition include the downsizing and privatisation of public utilities andcontractions in manufacturing employment.
Employment opportunities and conditions found in small and medium-sized enterprisesdiffer from those in medium and large enterprises. According to the ProductivityCommission (1996) part-time employment is more prevalent in large enterprises than smallenterprises. Interestingly, casual employment (no access to paid sick leave) is more prevalentin small enterprises. Labour turnover tends to be higher in small enterprises; smallenterprises tend to expend less on staff training and average hourly rates of pay are lower foremployees of small enterprises. Braddy (1998) suggests that employment opportunities andthe entry-level training efforts of an enterprise are inextricably linked. While many positions

Introduction 7
involving entry-level training are newly created, current employees transferring into atraining contract will fill other positions in the training system.
Small and medium-sized enterprisesThe Organisation for Economic Cooperation and Development (OECD) noted as early as 1985that there was a tendency towards the concentration of workers in small enterprises inseveral of its member states, even after having taken into account shifts in industrial structureand sectoral composition. The OECD also found that ‘small firms have been particularlyimportant in net job growth over the past 10 or 15 years’ (OECD 1985, p.80).
The terms 'small enterprise' and 'small and medium-sized enterprises' have been defined inAustralia in a number of ways. Depending on the institutional or historical context, the majorcriteria for defining the size of enterprises include legal status, ownership status, thedistinction between the operation of an enterprise at a craft or industrial level, or the industryin which a firm operates. The ABS has generally used business size categories to define smalland medium-sized enterprises. The scope of this analysis will be the employment size of theenterprise, not the workplace.
The ABS defines small enterprises as those which employ less than 20 people. This definitionalso includes enterprises regarded as micro businesses—those employing less than fivepeople. Medium-sized enterprises are, however, considerably larger and are defined as thoseenterprises employing more than 20 but fewer than 200 people.
Distinctive features of Australian small and medium-sized enterprisesThe ABS (1997) small business study shows that, between 1983–84 and 1995-96, average smallenterprise employment growth was 3.7 per cent per annum. In 1995–96 small-enterprises:
• provided 31 per cent of total employment• paid 32 per cent of national salaries• accounted for 33 per cent of total sales of goods and services
Examining Australian enterprise composition, the Department of Employment, WorkplaceRelations and Small Business (DEWRSB 1999) shows that small enterprises display a numberof distinctive characteristics.
• In 1997 males accounted for 65 per cent of decision-makers/operators of smallenterprises. The 35 per cent of female decision-makers were over-represented in clericaloccupations. Among the trades, occupations traditionally the stronghold of apprenticeand trainee training, female representation was below 10 per cent.
• Small enterprises have a lower propensity to export goods and services than largeenterprises. Only 2 per cent of micro-enterprises (1 to 4 employees) exported goods andservices in 1995–96, compared with 38 per cent of enterprises employing 200 or more.
• In 1995-96 only 6 per cent of micro enterprises had employees represented by a union.The size of the enterprise is proportional to the likelihood of union representation.Enterprises with 100 or more employees had a union representation rate of 69 per cent.
8 Factors affecting the provision of entry-level training by enterprises
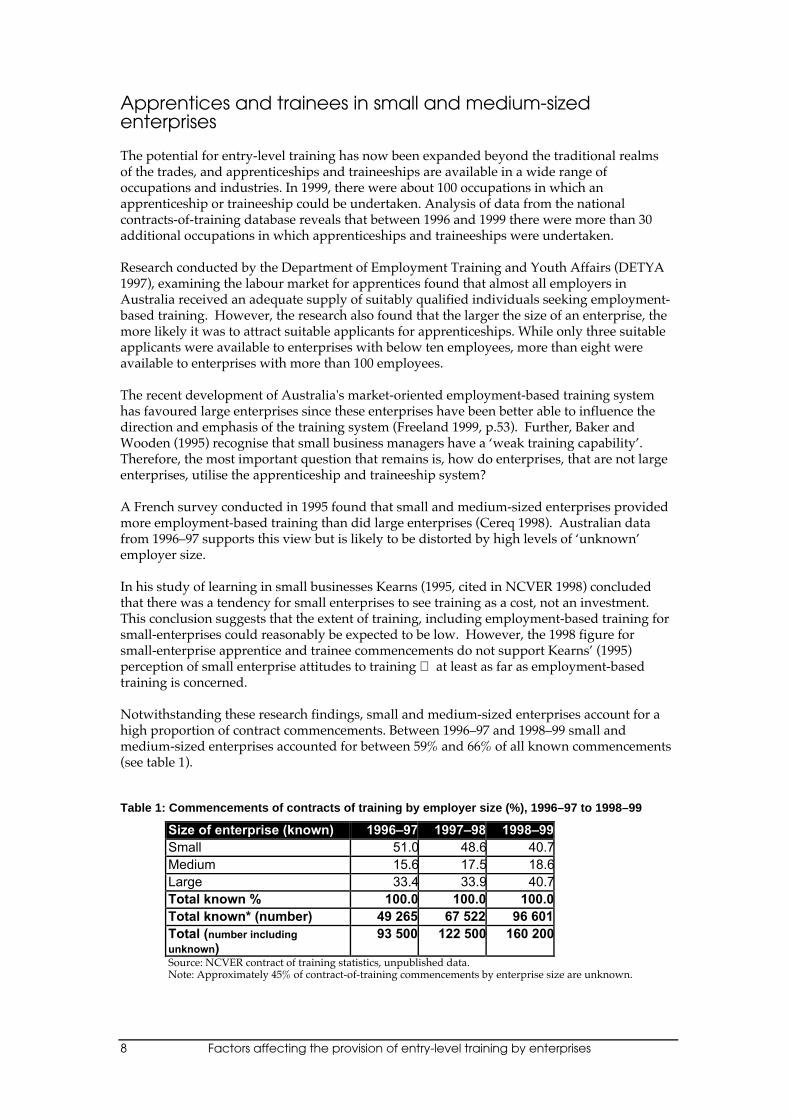
Apprentices and trainees in small and medium-sizedenterprisesThe potential for entry-level training has now been expanded beyond the traditional realmsof the trades, and apprenticeships and traineeships are available in a wide range ofoccupations and industries. In 1999, there were about 100 occupations in which anapprenticeship or traineeship could be undertaken. Analysis of data from the nationalcontracts-of-training database reveals that between 1996 and 1999 there were more than 30additional occupations in which apprenticeships and traineeships were undertaken.
Research conducted by the Department of Employment Training and Youth Affairs (DETYA1997), examining the labour market for apprentices found that almost all employers inAustralia received an adequate supply of suitably qualified individuals seeking employment-based training. However, the research also found that the larger the size of an enterprise, themore likely it was to attract suitable applicants for apprenticeships. While only three suitableapplicants were available to enterprises with below ten employees, more than eight wereavailable to enterprises with more than 100 employees.
The recent development of Australia's market-oriented employment-based training systemhas favoured large enterprises since these enterprises have been better able to influence thedirection and emphasis of the training system (Freeland 1999, p.53). Further, Baker andWooden (1995) recognise that small business managers have a ‘weak training capability’.Therefore, the most important question that remains is, how do enterprises, that are not largeenterprises, utilise the apprenticeship and traineeship system?
A French survey conducted in 1995 found that small and medium-sized enterprises providedmore employment-based training than did large enterprises (Cereq 1998). Australian datafrom 1996–97 supports this view but is likely to be distorted by high levels of ‘unknown’employer size.
In his study of learning in small businesses Kearns (1995, cited in NCVER 1998) concludedthat there was a tendency for small enterprises to see training as a cost, not an investment.This conclusion suggests that the extent of training, including employment-based training forsmall-enterprises could reasonably be expected to be low. However, the 1998 figure forsmall-enterprise apprentice and trainee commencements do not support Kearns’ (1995)perception of small enterprise attitudes to training at least as far as employment-basedtraining is concerned.
Notwithstanding these research findings, small and medium-sized enterprises account for ahigh proportion of contract commencements. Between 1996–97 and 1998–99 small andmedium-sized enterprises accounted for between 59% and 66% of all known commencements(see table 1).
Table 1: Commencements of contracts of training by employer size (%), 1996–97 to 1998–99
Size of enterprise (known) 1996–97 1997–98 1998–99Small 51.0 48.6 40.7Medium 15.6 17.5 18.6Large 33.4 33.9 40.7Total known % 100.0 100.0 100.0Total known* (number) 49 265 67 522 96 601Total (number includingunknown)
93 500 122 500 160 200
Source: NCVER contract of training statistics, unpublished data.Note: Approximately 45% of contract-of-training commencements by enterprise size are unknown.

Introduction 9
Private sector employers and group training companies were responsible for the majority(93%) of Australian apprentices and trainee commencements during 1998 (NCVER 1999).There were about 103 000 private sector commencements in 1998, while commencementswith group training companies were over 21 000.
Because of the increasingly important role played by small enterprises in providing entry-level employment and the expansion in the range of occupations available to apprentices andtrainees, it is important to examine the key determinants of entry-level training in small andmedium-sized enterprises.
10 Factors affecting the provision of entry-level training by enterprises
Previous researchIn Australia, as elsewhere, most research in the field of vocational education and training hasbeen driven by the perceived need to reform the public provision of training and thereforehas focused on the supply side of the training market. Research on the demand side hasprimarily concentrated on the processes of training within the enterprise and the benefits toemployers from an investment in training. To date, limited research has been conducted intothe drivers of apprenticeship training per se.
ABS (1997) statistics on training expenditure show that 13% of enterprises employingbetween one and 19 employees provide some training, compared with 51% of enterprisesemploying between 20 and 99 employees and 88% of enterprises with 100 or more employees.The Bureau of Industry Economics (BIE 1991) suggests that training of employees in smallenterprises is low owing to the low level of managerial and training skills of small enterpriseowners and managers.
Differences exist between the extent and type of training provided by enterprises withdifferent characteristics (for example, industry, size and history). In addition, the method oftraining delivery also differs between enterprises. Small and medium-sized enterprises do notsimply demand different levels of training by comparison with large firms, they also expressand fulfil this demand in myriad ways (Smith & Hayton 1999). Smith and Hayton identifiedmajor determinants affecting the training efforts of enterprises and developed a generalmodel representing enterprise training. Factors found to significantly affect the provision oftraining by enterprises included:
• competitive pressure• work re-organisation• new technology• quality processes• industrial and award restructuring• size of the enterprise• training infrastructure• level of training decision-making
Industries have their own traditions of training that are expressed very clearly at theenterprise level and have considerable impact on the level of training provided. In theconstruction industry there is a very strong tradition of apprentice training. Smith et al (1995)point out that this tradition of support for young tradespersons was most clearly articulatedby managers in the building and construction enterprises. They themselves often workedtheir way up to positions of management from a trade background and felt it was their dutyto the industry and to society at large to further the apprenticeship system within their ownenterprises.
…there were clear examples of relatively small enterprises supporting a surprisingly large numberof apprentices in a way that would have been viewed as uneconomic in other industries. Most of theapprentices were to be found in the major contracting enterprises but many of the largersubcontracting enterprises also hired apprentices.
(Smith et al 1995, p. 103)
It has been suggested by Ridoutt (2000) that other factors, including the occupations ofworkers employed, sector of employment (public versus private), size of the enterprise andemployment status of employees all exert an influence on the extent of training provision.Ridoutt provides examples from the ABS survey of education and training experience whichshow how these characteristics of enterprises have affected the provision of on-the-jobtraining.

Previous research 11
Long et al. (1999, table 5) have compiled a matrix of the factors which result in higherincidence of training provision. The matrix presents common findings of researchersexamining the 'drivers' of training provision. Large firms, firms working in finance andbusiness services, the public sector and economy-wide full employment (although lowunemployment may also be a driver) are common characteristics related to high levels oftraining provision.
Blandy et al. (1999) conclude that the type of training provided by firms is directly related tothe presence of internal labour markets, capital investments and competitive productionconditions.
If enterprises are to undertake training of staff then it must be seen as beneficial to do so. Thisis especially important for small enterprises which are less willing to adopt untested practicesand processes. While it is generally agreed that training does produce benefits for enterprisesand individuals (Billett & Cooper 1997), few studies have agreed on the extent of benefitsderived by enterprises from the provision of training. Studies of the effect of training onenterprises have tended to be based on marginal productivity of workers and theircontributions to production. Research by Long et al. (1999) examined the different types oftraining as they related to productivity. It was revealed that the drivers of productivityincreases were difficult to determine—in fact, they conclude ‘it is rarely possible to isolate theeffects due to particular characteristics of training’.
While it is agreed that training is beneficial to all enterprises to ensure their competitivenessand profitability, the conditions facing enterprises in the employment and organisation ofstaff do affect the type of training provided and the methods used for training. Theemployment and organisational characteristics of enterprises differ between industries, sizeof enterprises and regions.
While there has been considerable research undertaken which examines the influences ontraining provision, there has been only limited research on specific influences on entry-leveltraining. Examining employers and group training companies, the Department forEmployment Training and Youth Affairs (DETYA 1997) identified business activity,employment subsidies and the supply of suitable applicants as the key drivers in determiningthe extent of Australian enterprises’ entry-level training efforts. Kapuscinski (forthcoming)undertook a quantification of the influences on entry-level training using unit record datafrom the ABS training expenditure and training practices surveys. Kapuscinski's researchpresents a set of factors which he believes exert profound influences on the provision ofapprentice and traineeship training. The characteristics of firms found to affect the provisionof entry-level training include:
• size of firm• age of firm• share of full-time and permanent employees• competitiveness of firm relative to industry
In addition to the characteristics of firms, it was the training culture, measured byKapuscinski as the average training expenditure per worker, which was also shown to have apositive influence on the provision of entry-level training.
The stage of the business cycle is a key determinant of the provision of apprenticeshiptraining by firms. Kapuscinski (2000) reported preliminary findings of a model of entry leveltraining using data on the total number of contracts of training for entry level trainees (ie thetotal stock of apprentices and trainees at a given point in time) from 1968 to 1998. Theevidence from the model points to the significant impact of business cycles on theemployment of apprentices and trainees. Entry-level training falls with a risingunemployment rate and is positively related to both the vacancy rate and the employment-population ratio. These results demonstrate the importance of the state of the labour marketon the growth of entry level training.

12 Factors affecting the provision of entry-level training by enterprises
While it is agreed that training is beneficial to all enterprises to ensure their competitivenessand profitability, the conditions facing enterprises in the employment and organisation ofstaff affects the type of training provided and the methods used for training. Theemployment and organisational characteristics of enterprises differ between industries, sizeof enterprises and regions.
Methodology 13
MethodologyScopeThree distinct types of people work in Australia's small and medium-sized enterprises. Thethree groups are employers people working in their own business with employees [ABS,1995], own account workers and employees. Research activity relating to small andmedium-sized enterprises has focussed on employers and access to and suitability ofmanagement training (Gibb 1997). The scope of this analysis is employers who provideemployment-based training. Therefore, results from the analysis are directly related toemployees of small and medium-sized enterprises. Table 2 presents the national distributionof enterprises by industry and size.
Table 2: Number of enterprises by industry and employer size 1998–99 (000s)
SmallEnterprises
% EnterprisesSmall
LargeEnterprises
% EnterprisesLarge
TotalEnterprises
Mining 2.7 96.4 0.1 3.6 2.8Manufacturing 78.5 98.2 1.4 1.8 79.9Construction 162.6 99.8 0.3 0.2 162.9Wholesale trade 61.8 99.2 0.5 0.8 62.3Retail trade 154.7 99.5 0.8 0.5 155.5Accommodation, cafes & restaurants 35.0 98.9 0.4 1.1 35.4Transport & storage 57.5 99.7 0.2 0.3 57.7Finance & insurance 19.2 98.0 0.4 2.0 19.6Property & business services 199.4 99.6 0.9 0.4 200.3Education 20.8 98.1 0.4 1.9 21.2Health & community services 71.4 99.2 0.6 0.8 72.0Cultural & recreational services 62.9 99.7 0.2 0.3 63.1Personal & other services 74.8 99.7 0.2 0.3 75.0Total 1001.3 99.4 6.4 0.6 1007.7
Source: ABS (2000) Australian small business 1999, Cat no. 1321.0, Table 3.4 p.29
Small enterprises in table 2 are those enterprises employing less than 100 employees in anyindustry, a definition different from that used by the ABS (ABS, 1999). Therefore the datacontained in this table differs slightly from data published by the ABS.
Mining, finance and insurance and education are three industries in which the percentage ofenterprises classified as small enterprises is considerably below the average enterpriserepresentation. Although a limited number of industry groups have greater numbers oflarge enterprises, sampling techniques used in the data collection for the BusinessLongitudinal Survey (BLS) enables an accurate representation of enterprises by industry to bederived.
Business Longitudinal Survey (BLS) The Business Longitudinal Survey contains data derived from the 1994–95 through 1997–98business growth and performance surveys conducted by the ABS. These surveys weredesigned to provide information on the growth and performance of Australia's employingbusinesses while identifying the economic and structural characteristics of these businesses.

14 Factors affecting the provision of entry-level training by enterprises
All business units in the Australian economy were included in the scope of the study with theexception of:
• businesses not registered as employers with the Australian Taxation Office (this generallyrepresents non-employing enterprises)
• government enterprises
• businesses classified in the following ANZSIC industry classifications:
— agriculture, forestry and fishing
— electricity gas and water supply
— communication services
— government administration and defence
— education
— health and community services
— (the sub-divisions of other services and private households employing staff and theindustry groups of libraries, museums and parks and gardens were outside the scopeof the survey)
Only businesses employing less than 200 employees were included in the scope of the survey.
The unit represented by the data is referred to as the management unit. The managementunit is the highest level accounting unit within an enterprise and in most cases coincides withthe legal entity which owns the enterprise.
Reliability of dataTwo types of error are possible in survey-based data: sampling error and non-sampling error.
Sampling error is a measure of the variability which occurs because a sample, rather than theentire population, responds to the survey. One measure of the likely difference between thesample and the total population responses is the standard error. Standard errors enablecalculation of confidence intervals and significance levels for the estimates.
The second type of error, non-sampling error, can occur when:
• the survey is unable to obtain comprehensive data from the businesses surveyed
• errors result from reporting with inappropriate survey mechanisms, wording ofquestions creating misunderstanding or inability or unwillingness to provide accurateresponses
• errors as is from the processing of the survey, including coding and data recording errors
An additional non-sampling error has been introduced into the BLS by the processes of'confidentialising' the data at the ABS. For each of the financial variables included in thesurvey, values have been varied slightly to negate any risk of data matching with other datasets and identifying businesses. The process of changing financial values is referred to asperturbation. Perturbation used for the BLS varies or groups outlying values. Some recordswere dropped from the file following the perturbation because they were deemed to be 'largebusinesses' in terms other than employment.
DataThe analysis uses the unit record level data from the four waves of the business longitudinalsurvey (BLS) from 1994–95 to 1997–98 conducted by the ABS (1999). The surveys involvednational questionnaires sent to a sample of approximately 13 000 businesses selected from theABS business register. Only those businesses employing fewer than 200 employees were
Methodology 15
included in the scope of the survey. Attrition of enterprises occurred over the survey periodand enterprises did not respond to all surveys.
The analysis selected only small and medium-sized enterprises from the data (enterpriseswith less than 100 employees in 1997–98) and those enterprises which had responded to allsurveys. Only enterprises that continued in the survey over the four waves of the surveywere included because of their ability to provide trend data related to business practices andbusiness characteristics which could then be related to training responses from the 1997–98survey. Despite careful selection of the enterprises included in the sample, some questionsincluded in the compilation of variables for the analysis had missing responses.
Variables were created for the firm to represent the demographic characteristics of thedecision-maker of the firm, level of employment and employment trends, training practices,type of training, training providers used, business characteristics and practices, businesschanges and trends, business intentions and the financial performance of the enterprise.
In 1997–98, for the first time the survey included a question which asked respondents toestimate the percentage of persons during the financial year employed in the business thatwere trained in ‘trade and apprenticeship training and traineeships’. The options available forresponses were ‘none’, ‘up to 25%’, ‘26% to 50%’, ‘51% to 75%’ and ‘75% to 100%’. Responsesto this question were used to create a variable to represent whether or not a firm participatedin trade and apprenticeship training and traineeships. A statistically valid sample could notbe drawn from the data if responses are classified according to the five response options (seetable 3). To overcome this problem, responses were divided into ‘yes’ and ‘no’ responses.
Table 3: Enterprises reporting provision of apprentice and trainee training by level of trainingprovision 1997–98
Employees undertaking apprentice and trainee training Number ofEnterprises
% Enterprises
Nil 2466 78.0Up to 25% 601 19.026% to 50% 72 2.351% to 75% 10 0.376% to 100% 14 0.4Total valid responses 3163 100.0
Source: ABS, 1999
There were 697 (22%) enterprises in the ‘yes’ category and 2466 (78%) enterprises in the ‘no’category.
The data-collection method does not allow segregation by type of entry-level training apprenticeship or traineeship. Therefore, the findings reported refer to total trade andapprenticeship and traineeship training.
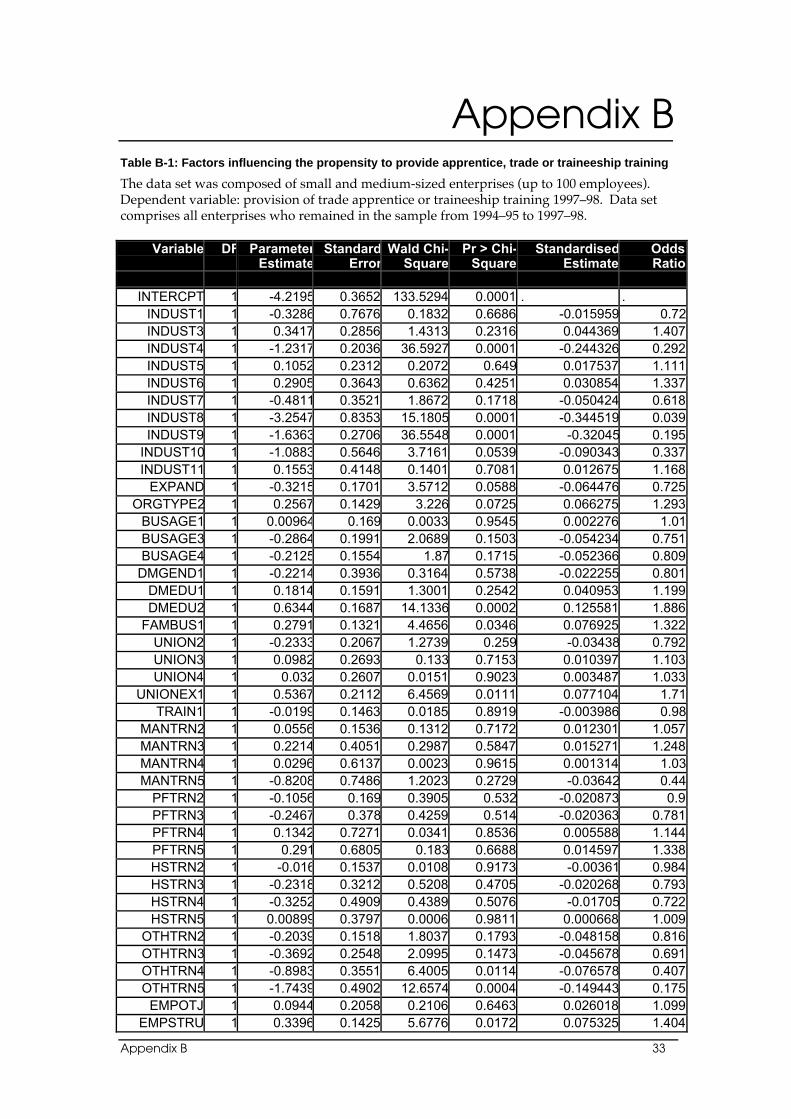
AnalysisStatistical analysis, using a probit regression, was undertaken to model the influence of thebusiness' variables on the propensity of the businesses to provide apprentice and traineetraining. The results of the regression analysis are detailed in appendix B.
The 95% level of significance was used to evaluate the regression results. Therefore, anyvariable in appendix B which has a (pr > chi-square) value less than or equal to 0.05 has astatistically significant influence on the provision of apprentice and trainee training byenterprises.
An evaluation of the influence of business characteristics has been made based on the sign ofthe parameter and associated odds ratios. The odds ratios are presented in table 4, together
16 Factors affecting the provision of entry-level training by enterprises
with an indication of the significance of the variable. The table serves as a reference for thediscussion in the next section. Parameter estimates and other information used in thevalidation of the regression are presented in appendix B.
Characteristics of enterprises that emerged as significant influences on the propensity ofsmall and medium-sized enterprises to participate in trade and apprenticeship training andtraineeships are shown in table 4.
Table 4: Significant characteristics influencing the propensity to provide entry-level training
Significant characteristic (group of variables) Type of influence
The industry in which the enterprise operates Not applicable
The educational background of the decision-maker Positive
If the enterprise is considered to be a family business Positive
Expanding levels of trade union membership Positive
Provision of 'other' training to staff Negative
Employers or owners providing structured training Positive
Associations providing training Positive
TAFE institutes providing training Positive
Universities providing training Negative
Provision of structured training Positive
Provision of on-the-job training Positive
Provision of seminars, conferences etc. Positive
Intended increased numbers of business locations Negative
Low level of full-time employees Negative
Greater size of enterprise Positive
Increasing level of employment Positive
Skills needs ratio (ratio of new employment to totalemployment)
Positive
Factors affecting provision of apprentice and trainee training 17
Factors affecting provisionof apprentice and trainee
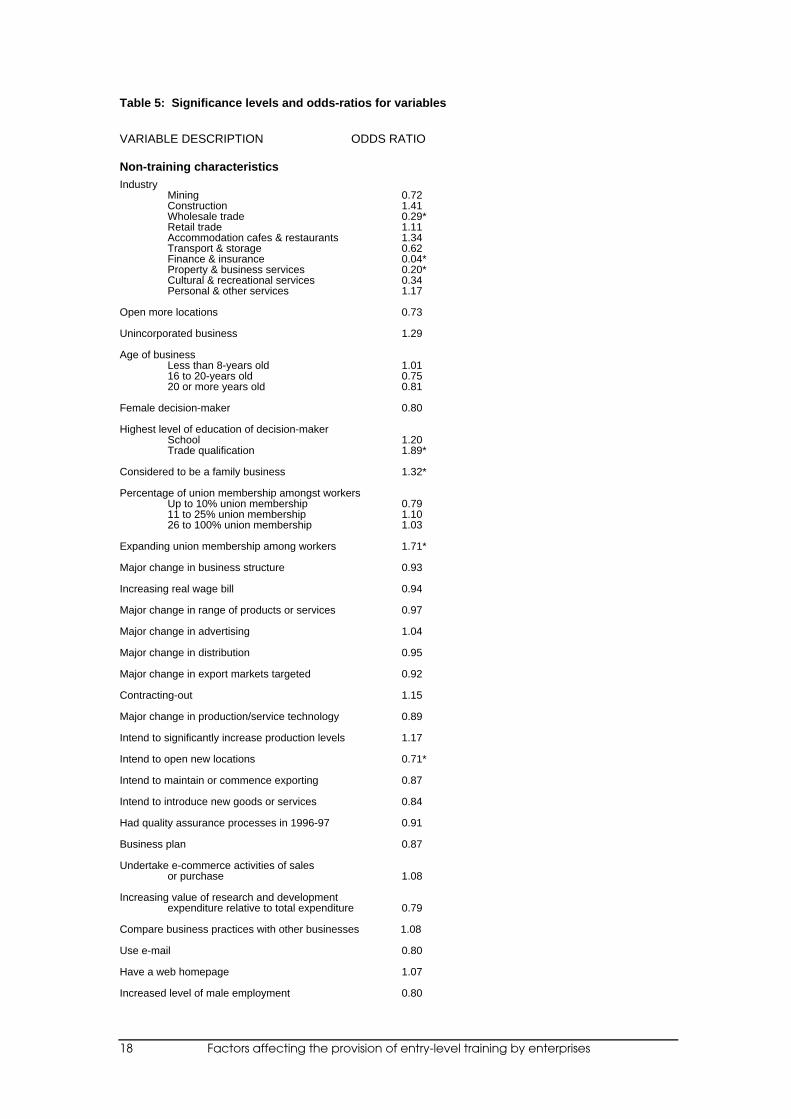
trainingThe impact of both training and non-training characteristics on the propensity of a firm toprovide entry-level training was examined. The significance levels and odds ratios forindividual variables included in the analysis are shown in table 5.
‘Non-training’ enterprise characteristicsThe ‘non-training’ enterprise characteristics that significantly influence the provision of entry-level training by a firm are:
• the industry in which the enterprise operates• the educational background of decision-maker• whether or not the enterprise is considered to be a family business• expanding levels of trade union membership among employees• the intention to increase the number of business locations• the size of the enterprise (entry-level measure)• increase in employment• level of full-time employment• increasing skills needs ratio (measured by the ratio of new employees to total
employment)
IndustryThe industry in which an enterprise operates has a significant influence on the provision ofapprentice and trainee training. When compared to manufacturing, enterprises fromindustries that were significantly less likely to provide apprentice and trainee traininginclude wholesale trade (70% less likely), finance and insurance (96% less likely) and propertyand business services (80% less likely). Notably, enterprises in finance and insurance were theleast likely, relative to manufacturing, to provide apprentice and trainee training. Theprovision of apprentice and trainee training for manufacturing enterprises was notsignificantly different from provision by enterprises in the industries of mining, retail trade,accommodation cafes and restaurants, transport and storage, cultural and recreationalservices or personal and other services.
18 Factors affecting the provision of entry-level training by enterprises
Table 5: Significance levels and odds-ratios for variables
VARIABLE DESCRIPTION ODDS RATIO
Non-training characteristicsIndustry
Mining 0.72Construction 1.41Wholesale trade 0.29*Retail trade 1.11Accommodation cafes & restaurants 1.34Transport & storage 0.62Finance & insurance 0.04*Property & business services 0.20*Cultural & recreational services 0.34Personal & other services 1.17
Open more locations 0.73
Unincorporated business 1.29
Age of businessLess than 8-years old 1.0116 to 20-years old 0.7520 or more years old 0.81
Female decision-maker 0.80
Highest level of education of decision-makerSchool 1.20Trade qualification 1.89*
Considered to be a family business 1.32*
Percentage of union membership amongst workersUp to 10% union membership 0.7911 to 25% union membership 1.1026 to 100% union membership 1.03
Expanding union membership among workers 1.71*
Major change in business structure 0.93
Increasing real wage bill 0.94
Major change in range of products or services 0.97
Major change in advertising 1.04
Major change in distribution 0.95
Major change in export markets targeted 0.92
Contracting-out 1.15
Major change in production/service technology 0.89
Intend to significantly increase production levels 1.17
Intend to open new locations 0.71*
Intend to maintain or commence exporting 0.87
Intend to introduce new goods or services 0.84
Had quality assurance processes in 1996-97 0.91
Business plan 0.87
Undertake e-commerce activities of salesor purchase 1.08
Increasing value of research and developmentexpenditure relative to total expenditure 0.79
Compare business practices with other businesses 1.08
Use e-mail 0.80
Have a web homepage 1.07
Increased level of male employment 0.80
Factors affecting provision of apprentice and trainee training 19
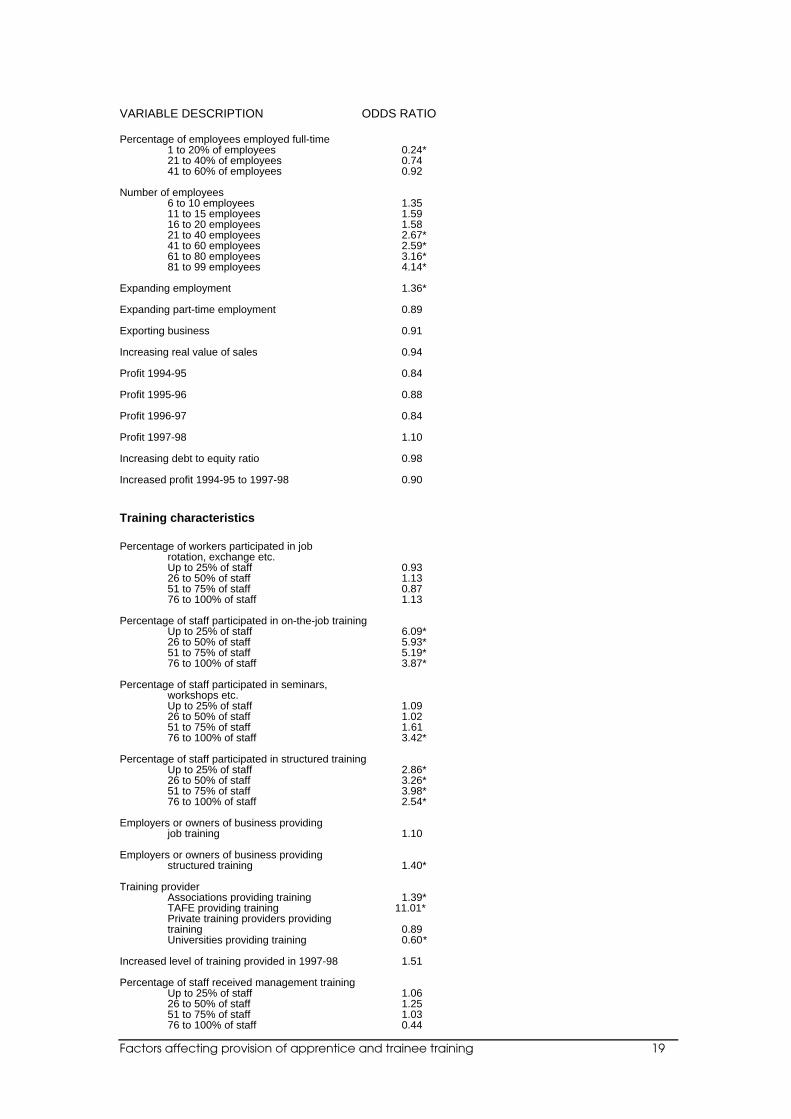
VARIABLE DESCRIPTION ODDS RATIO
Percentage of employees employed full-time1 to 20% of employees 0.24*21 to 40% of employees 0.7441 to 60% of employees 0.92
Number of employees6 to 10 employees 1.3511 to 15 employees 1.5916 to 20 employees 1.5821 to 40 employees 2.67*41 to 60 employees 2.59*61 to 80 employees 3.16*81 to 99 employees 4.14*
Expanding employment 1.36*
Expanding part-time employment 0.89
Exporting business 0.91
Increasing real value of sales 0.94
Profit 1994-95 0.84
Profit 1995-96 0.88
Profit 1996-97 0.84
Profit 1997-98 1.10
Increasing debt to equity ratio 0.98
Increased profit 1994-95 to 1997-98 0.90
Training characteristics
Percentage of workers participated in jobrotation, exchange etc.Up to 25% of staff 0.9326 to 50% of staff 1.1351 to 75% of staff 0.8776 to 100% of staff 1.13
Percentage of staff participated in on-the-job trainingUp to 25% of staff 6.09*26 to 50% of staff 5.93*51 to 75% of staff 5.19*76 to 100% of staff 3.87*
Percentage of staff participated in seminars,workshops etc.Up to 25% of staff 1.0926 to 50% of staff 1.0251 to 75% of staff 1.6176 to 100% of staff 3.42*
Percentage of staff participated in structured trainingUp to 25% of staff 2.86*26 to 50% of staff 3.26*51 to 75% of staff 3.98*76 to 100% of staff 2.54*
Employers or owners of business providingjob training 1.10
Employers or owners of business providingstructured training 1.40*
Training providerAssociations providing training 1.39*TAFE providing training 11.01*Private training providers providingtraining 0.89Universities providing training 0.60*
Increased level of training provided in 1997-98 1.51
Percentage of staff received management trainingUp to 25% of staff 1.0626 to 50% of staff 1.2551 to 75% of staff 1.0376 to 100% of staff 0.44
20 Factors affecting the provision of entry-level training by enterprises
VARIABLE DESCRIPTION ODDS RATIO
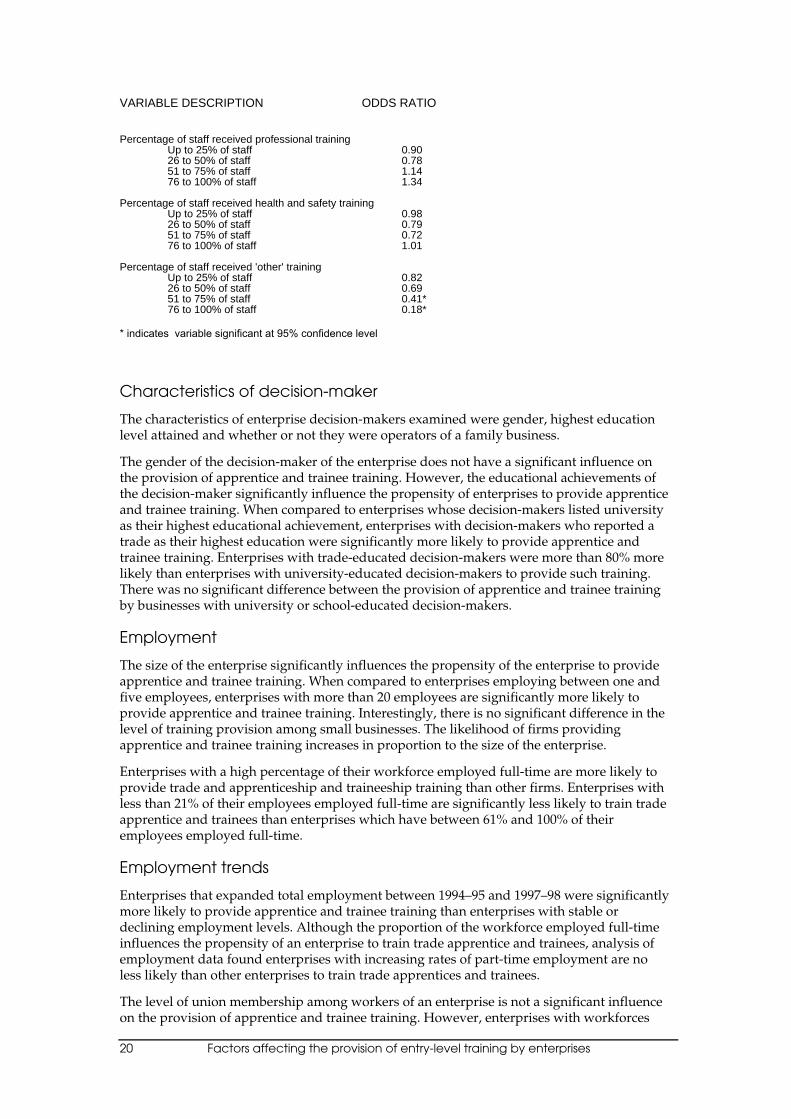
Percentage of staff received professional trainingUp to 25% of staff 0.9026 to 50% of staff 0.7851 to 75% of staff 1.1476 to 100% of staff 1.34
Percentage of staff received health and safety trainingUp to 25% of staff 0.9826 to 50% of staff 0.7951 to 75% of staff 0.7276 to 100% of staff 1.01
Percentage of staff received 'other' trainingUp to 25% of staff 0.8226 to 50% of staff 0.6951 to 75% of staff 0.41*76 to 100% of staff 0.18*
* indicates variable significant at 95% confidence level
Characteristics of decision-maker
The characteristics of enterprise decision-makers examined were gender, highest educationlevel attained and whether or not they were operators of a family business.
The gender of the decision-maker of the enterprise does not have a significant influence onthe provision of apprentice and trainee training. However, the educational achievements ofthe decision-maker significantly influence the propensity of enterprises to provide apprenticeand trainee training. When compared to enterprises whose decision-makers listed universityas their highest educational achievement, enterprises with decision-makers who reported atrade as their highest education were significantly more likely to provide apprentice andtrainee training. Enterprises with trade-educated decision-makers were more than 80% morelikely than enterprises with university-educated decision-makers to provide such training.There was no significant difference between the provision of apprentice and trainee trainingby businesses with university or school-educated decision-makers.
Employment
The size of the enterprise significantly influences the propensity of the enterprise to provideapprentice and trainee training. When compared to enterprises employing between one andfive employees, enterprises with more than 20 employees are significantly more likely toprovide apprentice and trainee training. Interestingly, there is no significant difference in thelevel of training provision among small businesses. The likelihood of firms providingapprentice and trainee training increases in proportion to the size of the enterprise.
Enterprises with a high percentage of their workforce employed full-time are more likely toprovide trade and apprenticeship and traineeship training than other firms. Enterprises withless than 21% of their employees employed full-time are significantly less likely to train tradeapprentice and trainees than enterprises which have between 61% and 100% of theiremployees employed full-time.
Employment trends
Enterprises that expanded total employment between 1994–95 and 1997–98 were significantlymore likely to provide apprentice and trainee training than enterprises with stable ordeclining employment levels. Although the proportion of the workforce employed full-timeinfluences the propensity of an enterprise to train trade apprentice and trainees, analysis ofemployment data found enterprises with increasing rates of part-time employment are noless likely than other enterprises to train trade apprentices and trainees.
The level of union membership among workers of an enterprise is not a significant influenceon the provision of apprentice and trainee training. However, enterprises with workforces
Factors affecting provision of apprentice and trainee training 21
which expanded their union membership between 1994–95 and 1997–98 were more likely toprovide apprentice and trainee training than those enterprises whose workforces experienceddeclining or stable levels of union membership.
Enterprises with increasingly male-dominated workforces are no more likely to provideapprentice and trainee training than other enterprises.
A skills-needs ratio was derived to identify enterprises with an increasing proportion of newemployees to total employees between 1996–97 and 1997–98. The skills-needs ratio measuresnew employment as a proportion of total employment. An increasing skills-needs ratiosignificantly increases the propensity of enterprises to provide apprentice and traineetraining. Enterprises with increasing skills needs ratios were 50% more likely to provideapprentice and trainee training than other enterprises.
Business characteristics
The legal classification of the organisation, incorporated or unincorporated, and the age of thebusiness do not have a significant influence on the provision of apprentice and traineetraining. However, enterprises that are considered to be a family business are more likely toprovide trade apprentice and trainee training than other enterprises.
Business changes
Expansion of business locations does not influence the likelihood of an enterprise providingtrade apprentice or traineeship training. Major changes to the business practices andoperations were examined in the analysis. Changes examined included major changes to therange of goods and services produced, the advertising, export marketing, the distribution ofgoods and services, production technology and major changes to the business structure.None of these major business changes were found to impact on the propensity of enterprisesto provide apprentice and trainee training.
Business intentions
The BLS contains data representing the business intentions of enterprises for the proceedingthree years. Business intentions examined by the BLS relate to changes in the number oflocations, levels of production, exports and the introduction of new products or services.Only the intention to open new locations in the preceding three years was a significantinfluence on the provision of apprentice and trainee training. Enterprises intending to opennew locations were significantly less likely to provide apprentice and trainee training thanenterprises that did not have expansionary intentions. This result is not surprising asenterprises opening new branches would require staff to be self-sufficient and fully trained ifthey are operating remote sites.
Business practices
The business practices of firms were examined to determine any influence on the provision ofapprentice and trainee training and included quality assurance, business planning andcomparison, e-commerce activities, use of computers, exporting and contracting-out.Enterprises that export goods or services are significantly less likely to provide apprenticeand trainee training than enterprises that do not export.
None of the other business practices examined in the analysis was shown to significantlyaffect the propensity of the enterprise to provide apprentice and trainee training.
Finances
The profitability of enterprises was measured for four continuous financial years beginning1994–95. There is no significant difference in the likelihood of profitable enterprises providingapprentice and trainee training than enterprises that did not provide a profit.
22 Factors affecting the provision of entry-level training by enterprises
Other business characteristics are represented by differences in characteristics over the fourwaves of the longitudinal survey. Characteristics examined included increasing salesrevenue, increasing profit, increasing wage bill, increasing percentage of spending onresearch and development and increasing debt-to-equity ratio. None of the financialcharacteristics was found to have a significant impact on the propensity of an enterprise toprovide apprentice and trainee training.
This finding implies that innovative enterprises (those increasing spending on research anddevelopment) are no more likely than other enterprises to provide apprentice and traineetraining.
‘Training’ enterprise characteristics
A number of training-based characteristics were found to significantly influence the provisionof entry-level training. The training practices, type of training and providers of training wereall found to influence the propensity to provide entry-level training.
Training practices
Enterprises which increased their overall levels of staff training were no more likely toprovide apprentice and trainee training than enterprises which maintained or reduced theiroverall level of staff training.
The approach to training delivery was examined in relation to the propensity of enterprises toprovide apprentice and trainee training. Two formal methods of training delivery, structuredand on-the-job, were found to significantly influence the propensity of enterprises to provideapprentice and trainee training. The higher the percentage of employees receiving structuredtraining (up to 75%) the higher the likelihood that the enterprise would provide apprenticeand trainee training.
Enterprises that provide staff with on-the-job training are significantly more likely to provideapprentice and trainee training than other enterprises. Interestingly, there was little differencein the likelihood of firms that provide more than 76% of their staff with structured trainingalso providing apprentice and trainee training compared to enterprises that providingbetween 26% and 50% of staff with structured training. It would appear that firms thatprovide more than a quarter of their staff with on-the-job training are significantly morelikely to train apprentices and trainees than other firms.
Firms that use the informal training method of job-rotation and job-exchanges are not likelyto provide apprentice and trainee training. Enterprises providing 76% or more of staffthrough seminars, workshops or conferences training had a greater propensity to provideapprentice and trainee training than other enterprises.
Type of training
The types of training examined in the analysis were management training, professionaltraining, health and safety training and ‘other’ training. In general, the type of trainingprovided does not influence the propensity of enterprises to provide apprentice and traineetraining. However, enterprises providing between 76% and 100% of their staff with ‘other’training have a significantly lower propensity to provide apprentice and trainee training thando firms which provide no ‘other’ training.
Providers of training
A number of types of training providers were included in the analysis to determine whetherthere were any differences in the propensity of firms to provide apprentice and traineetraining according to the type of training providers used. Classifications of training providersused in the analysis were:
Factors affecting provision of apprentice and trainee training 23
• employers or owners of enterprises providing on-the-job training
• employers or owners of enterprises providing structured training
• associations providing training
• Technical and Further Education (TAFE) providing training
• private training providers providing training
• universities providing training
There was no difference in the propensity to train trade apprentices and trainees forenterprises which provided on-the-job, structured training or used private training providerscompared with enterprises which did not use these providers.
Enterprises that utilised either associations (professional and industry) or TAFE for trainingwere significantly more likely to provide apprentice and trainee training than otherenterprises. Enterprises using TAFE as a training provider were more than ten times morelikely to provide apprentice and trainee training than enterprises that did not use TAFE toprovide any training. The use of associations for the provision of training increased the oddsof also providing apprentice and trainee training by more than 1.3 times.
Emphasising the educational divide, and supporting theories relating to training culture,enterprises using a university to provide training were significantly less likely to train tradeapprentice and trainees than other enterprises.
24 Factors affecting the provision of entry-level training by enterprises
ConclusionsThe results from the regression analysis support many of the findings of training driverspresented in the literature review. It is likely that some of the variation in results between thisand other studies can be attributed to the use of different data and research methods.
The analysis provides no evidence of a single business characteristic acting as a trigger forsmall and medium-size enterprises to provide apprentice and trainee training. However,employment characteristics do affect an enterprise’s propensity to undertake apprentice andtrainee training. Larger firms and firms with a high proportion of full-time staff are morelikely to provide apprentice and trainee training than other firms. Firms that are expanding insize within the confines of their existing sites are also likely to provide apprentice and traineetraining. The analysis provides evidence which supports claims by employers that morestable economic conditions and the ability to expand their enterprise increases the propensityto train trade apprentice and trainees.
Factors that were found to positively influence an enterprise to provide apprentice andtrainee training include:
• the educational background of the decision-maker
• family ownership
• expanding levels of trade union membership amongst employees
• the provision of structured training by the firm
• the provision of on-the-job training by the firm
• associations are used as training providers
• TAFE Institutes are used as training providers
• staff attend seminars and conferences
• increasing level of employment
• increasing skill needs
Claims by Braddy (1998) that employment and training are inextricably linked are supportedby the relationship highlighted in this analysis between expanding employment, the skills-needs ratio and the provision of apprentice and trainee training.
The analysis provides support to the qualitative research conducted by Smith et al (1995)where the educational background of managers and the traditions of apprentice trainingwithin an industry were found to have considerable impact on the decision to take on anapprentice.
Factors that were found to negatively influence an enterprise to provide apprentice andtrainee training include:
• an increase in the number of business locations
• a low proportion of full-time employees
• universities are used as training providers
The most important result of the regression analysis is the support provided to the concept ofa training culture. Different studies have defined a training culture in different ways—suchas, Kapuscinski's [forthcoming] expenditure measure and business planning, and thedecision-maker's commitment to training (Smith & Hayton 1999). This analysis providesevidence of a significant effect of a training culture on employers' propensity to provideentry-level training.

Conclusions 25
There are a number of elements of a training culture in small and medium-sized enterprisesthat emerge from the analysis of the BLS. The training experiences of enterprise decision-makers are a crucial factor influencing the decision to train apprentices and trainees. If thehead of a firm has a trade qualification then the firm is highly likely to conduct apprenticeand trainee training. Firms that undertake programs of formal structured training and on-the-job training for their employees are highly likely to utilise the apprentice and trainee systemfor entry-level training.
26 Factors affecting the provision of entry-level training by enterprises
ReferencesABS (Australian Bureau of Statistics) 1995, Small business in Australia, Cat no. 1321.0, AGPS,
Canberra.—— 1997, Employer training expenditure, Australia: July to September 1996, cat.6353.0, Australian
Government Publishing Service, Canberra.—— 1998, 1996–1997 Small and medium enterprise, business growth and performance survey,
cat.8141.0, AGPS, Canberra.—— 1999, Business longitudinal survey: Confidentialised unit record file draft documentation,
cat.8141.0.30.001, AGPS, Canberra.—— 2000, Australian small business 1999, Cat no. 1321.0Baker, M & Wooden, M (eds) 1995, Small and medium-sized enterprises and vocational education
and training, monograph series no.1, NCVER, Adelaide.BIE (Bureau of Industry Economics) 1991, Small business training, Departments of Employment,
Education, Training and Training and Industry, Technology and Commerce, Canberra.Billett, S & Cooper, M 1997, Returns to enterprises from investments in VET, Review of research,
NCVER, Adelaide.Blandy, R, Dockery, M, Hawke, A & Webster, E 1999, 'Enterprise returns on a training investment
in the Australian context', keynote address to the 7th annual international conference of post-compulsory education and training, Centre for Learning and Work Research, GriffithUniversity, Brisbane.
Braddy, P 1998, 'Adjusting the balance between employment and training’, paper presented at theconference, Creating our future, Brisbane 23–26 August, 1998.
Cereq 1998, Training & Employment, French newsletter from Cereq and associated centres, no. 32,Summer 1998.
DETYA (Department of Employment, Training and Youth Affairs) 1997, Labour market forapprentices, Analysis and Evaluation Division, DETYA, Canberra.
DEWRSB (Department of Employment, Workplace Relations and Small Business) 1999, ‘Australianbusiness at a glance’, <www.dewrsb.gov.au/group_obs/smallbus/austbusi.html> accessed2 March 2000, Marseille.
Freeland, B 1999, How supply and demand forces shape VET markets, NCVER, Adelaide.Gibb, J 1997, VET and small business, review of research, NCVER, Adelaide.Kapuscinski, C (Forthcoming), Entry level training in Australia in the nineties: An analysis of
factors influencing the provision of employer training to apprentices and trainees, REB reportno.6/2000, Research and Evaluation Branch, DETYA, Canberra
Kapuscinski, C (2000), ‘Apprenticeships and traineeships in Australia in the last 30 years: anempirical overview of the evidence’. Paper presented to the 29th Conference of Economists,June 2000.
Long, M, Ryan, R, Burke, G & Hopkins, S 1999, Enterprise-based education and training: Aliterature review, ACER and Monash University–ACER Centre for the Economics ofEducation and Training, Melbourne (unpublished).
NCVER (National Centre for Vocational Education Research) 1998, Small business and vocationaleducation and training, Research at a glance, NCVER, Adelaide.
NCVER 1999, Australian apprentice & trainee statistics: Trends 1995 to 1998: An overview, NCVER,Adelaide.
Organisation for Economic Cooperation and Development, 1985, 'Employment in small and largefirms: Where have the jobs come from?' in Employment Outlook, OECD, Paris.
Productivity Commission 1996, Small business and employment, Industry Commissionpublications, information paper, Canberra.
Ridoutt, L 2000, ‘Factors influencing the implementation of training in selected industries’,NVETRE project (work in progress report).
Smith, A & Hayton, G 1999, ‘What drives enterprise training? Evidence from Australia’,International Journal of Human Resource Management, vol.10, no.2, pp.251–272.
Smith, A, Roberts,P, Noble,C, Hayton, G and Thorne, E 1995, Enterprise training: the factors thataffect demand, Final report, Vol 1, Industry profiles and case study analysis, State TrainingBoard, Victoria
Waterhouse, P, Wilson, B & Ewer, P 1999, The changing nature and patterns of work andimplications for VET, Review of research, NCVER, Adelaide.
Appendix A 27
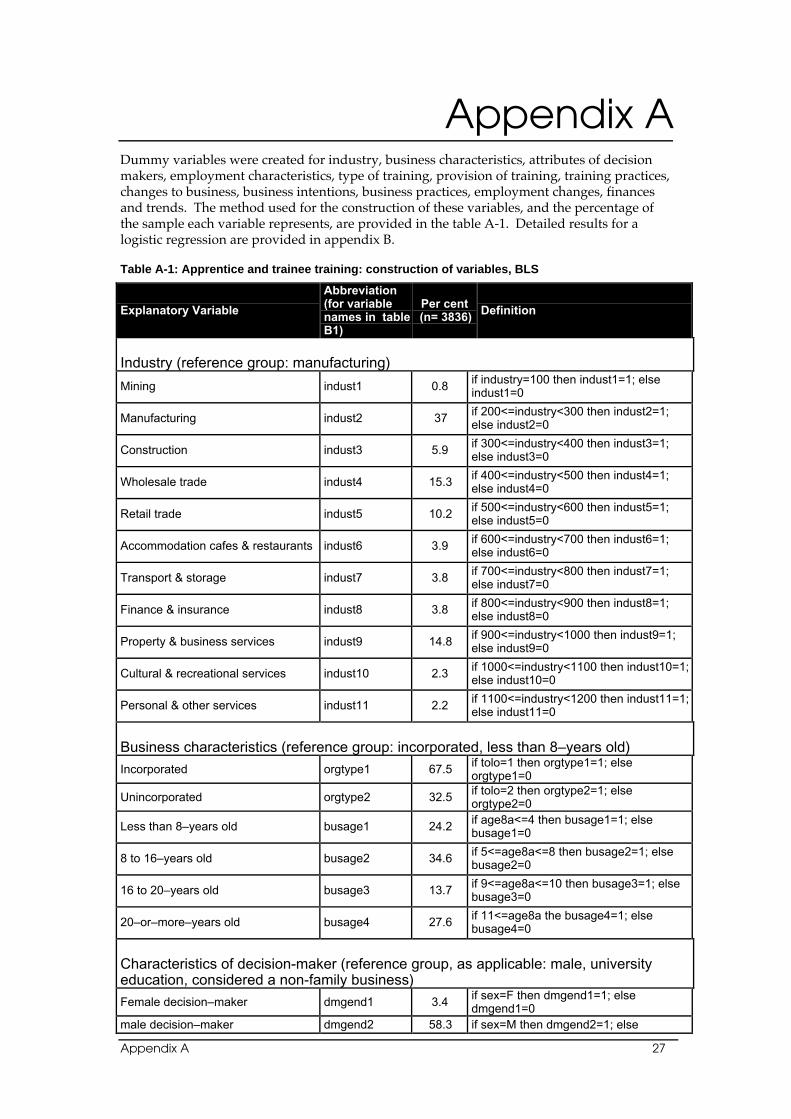
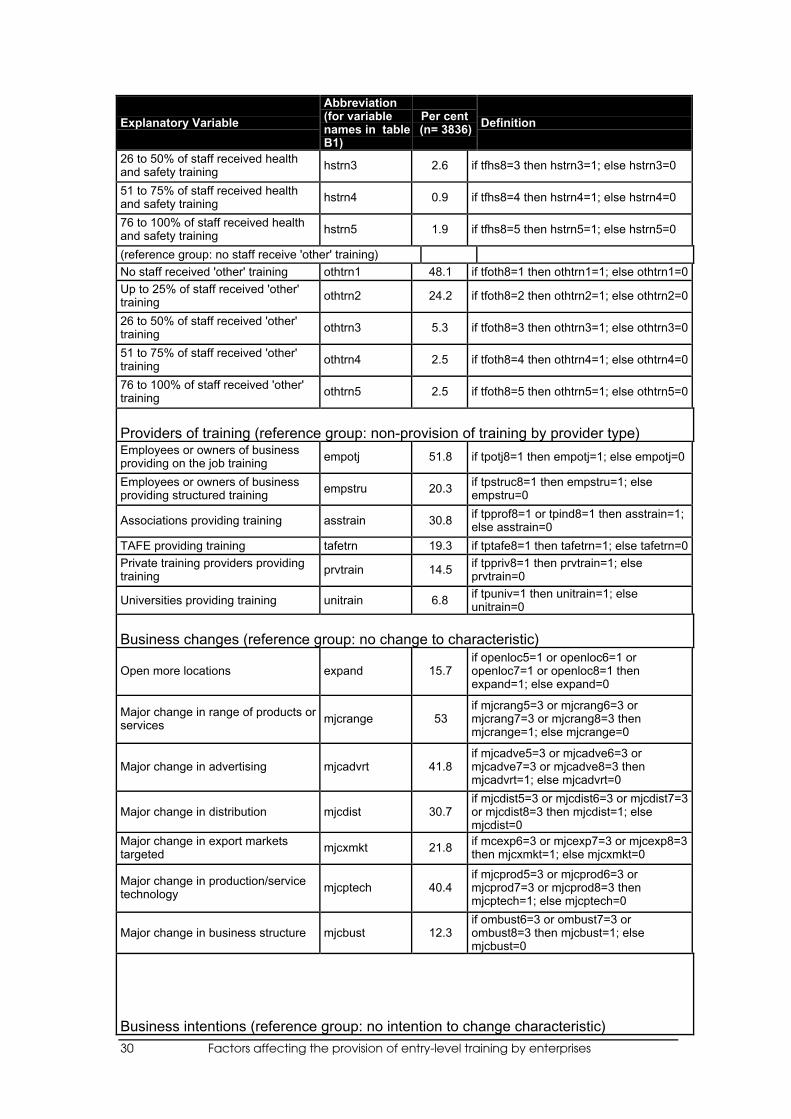
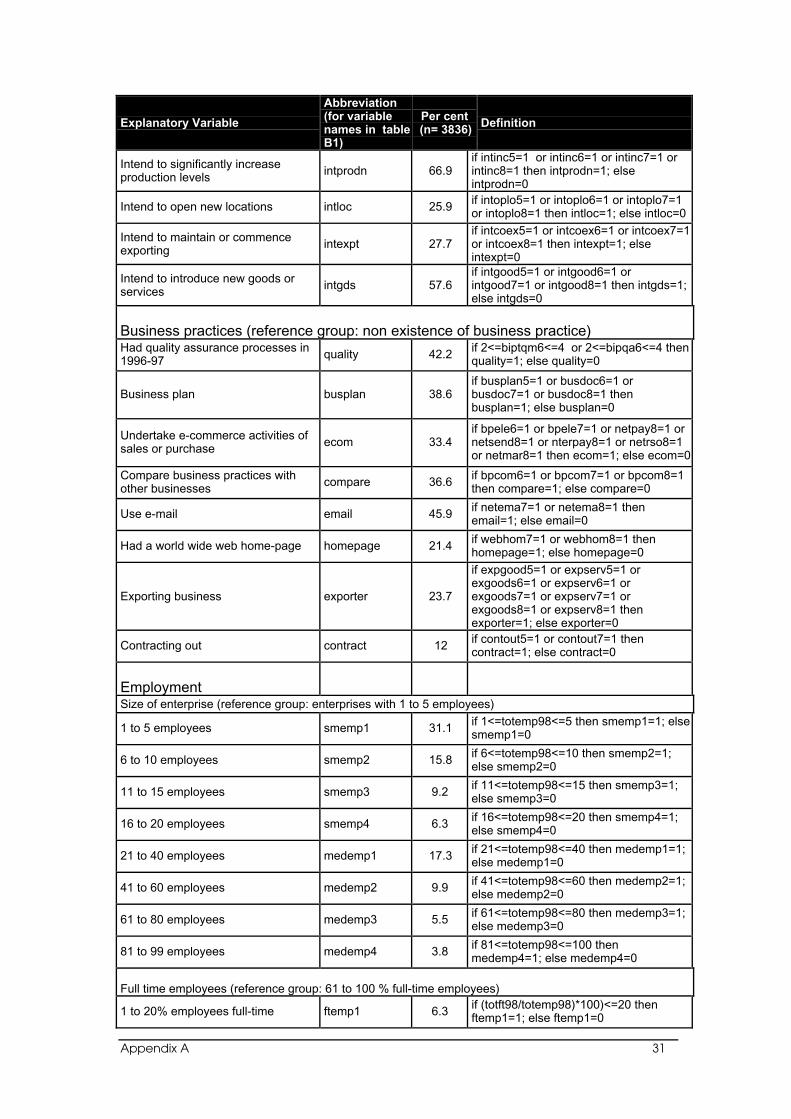
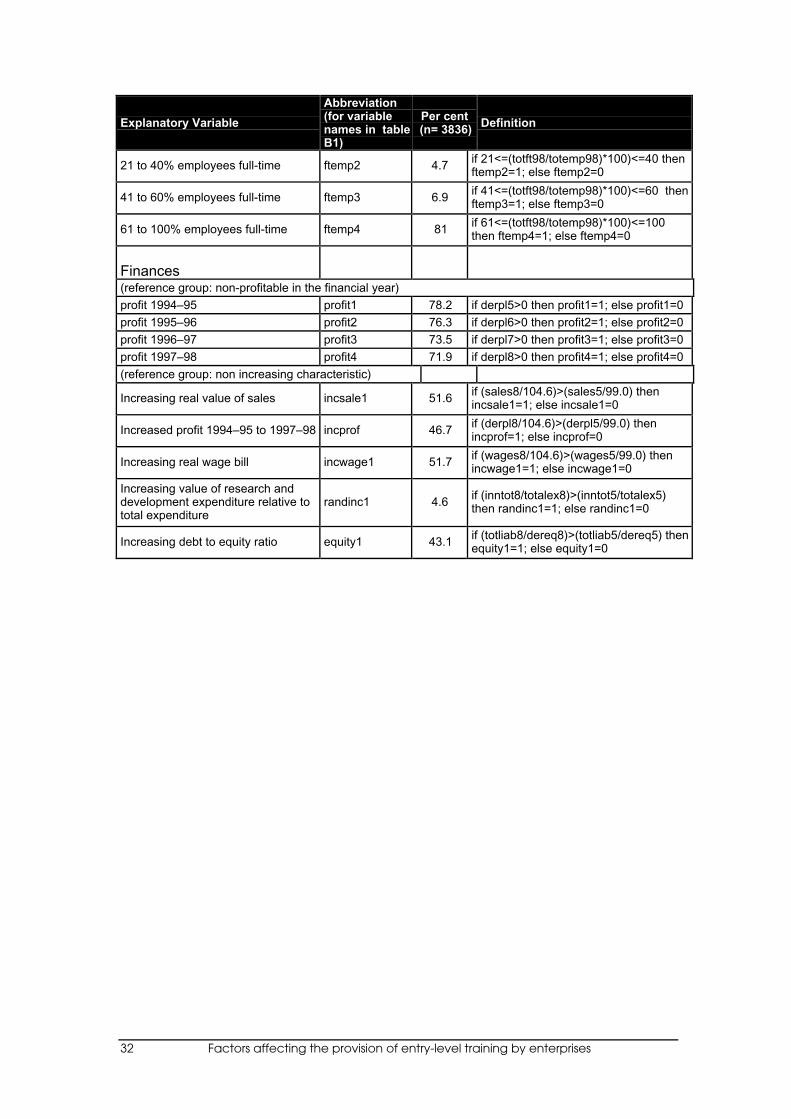
Appendix ADummy variables were created for industry, business characteristics, attributes of decisionmakers, employment characteristics, type of training, provision of training, training practices,changes to business, business intentions, business practices, employment changes, financesand trends. The method used for the construction of these variables, and the percentage ofthe sample each variable represents, are provided in the table A-1. Detailed results for alogistic regression are provided in appendix B.
Table A-1: Apprentice and trainee training: construction of variables, BLS
Explanatory Variable
Abbreviation(for variablenames in tableB1)
Per cent(n= 3836)
Definition
Industry (reference group: manufacturing)
Mining indust1 0.8if industry=100 then indust1=1; elseindust1=0
Manufacturing indust2 37if 200<=industry<300 then indust2=1;else indust2=0
Construction indust3 5.9if 300<=industry<400 then indust3=1;else indust3=0
Wholesale trade indust4 15.3if 400<=industry<500 then indust4=1;else indust4=0
Retail trade indust5 10.2if 500<=industry<600 then indust5=1;else indust5=0
Accommodation cafes & restaurants indust6 3.9if 600<=industry<700 then indust6=1;else indust6=0
Transport & storage indust7 3.8if 700<=industry<800 then indust7=1;else indust7=0
Finance & insurance indust8 3.8if 800<=industry<900 then indust8=1;else indust8=0
Property & business services indust9 14.8if 900<=industry<1000 then indust9=1;else indust9=0
Cultural & recreational services indust10 2.3if 1000<=industry<1100 then indust10=1;else indust10=0
Personal & other services indust11 2.2if 1100<=industry<1200 then indust11=1;else indust11=0
Business characteristics (reference group: incorporated, less than 8–years old)
Incorporated orgtype1 67.5if tolo=1 then orgtype1=1; elseorgtype1=0
Unincorporated orgtype2 32.5if tolo=2 then orgtype2=1; elseorgtype2=0
Less than 8–years old busage1 24.2if age8a<=4 then busage1=1; elsebusage1=0
8 to 16–years old busage2 34.6if 5<=age8a<=8 then busage2=1; elsebusage2=0
16 to 20–years old busage3 13.7if 9<=age8a<=10 then busage3=1; elsebusage3=0
20–or–more–years old busage4 27.6if 11<=age8a the busage4=1; elsebusage4=0
Characteristics of decision-maker (reference group, as applicable: male, universityeducation, considered a non-family business)
Female decision–maker dmgend1 3.4if sex=F then dmgend1=1; elsedmgend1=0
male decision–maker dmgend2 58.3 if sex=M then dmgend2=1; else
28 Factors affecting the provision of entry-level training by enterprises
Explanatory Variable
Abbreviation(for variablenames in tableB1)
Per cent(n= 3836)
Definition
dmgend2=0
school highest education of decision-maker
dmedu1 21.3if educatn=1 then dmedu1=1; elsedmedu1=0
Trade highest education of decisionmaker
dmedu2 15.2if educatn=2 then dmedu2=1; elsedmedu2=0
Tertiary highest education of decisionmaker
dmedu3 24.7if educatn=3 then dmedu3=1; elsedmedu3=0
Considered to be a family business fambus1 51.2if fambus=1 then fambus1=1; elsefambus1=0
Employment trendsUnion membership (reference group: no union membership)
No union membership amongworkers
union1 80.6if unionme8=1 then union1=1; elseunoin1=0
Up to 10% union membership amongworkers
union2 7.7if unionme8=2 then union2=1; elseunion2=0
11 to 25% union membership amongworkers
union3 3.8if unionme8=3 then union3=1; elseunion3=0
26 to 100% union membershipamong workers
union4 4.1if unionme8=4 then union4=1; elseunion4=0
(reference group: non increase of characteristic)
Expanding union membership amongworkers
unionex1 7.3if unionme8>unionme5 then unionex1=1;else unionex1=0
Increased level of male employment gendemp1 27if (totm98/totf98)>(totm96/totf96) thengendemp1=1; else gendemp1=0
Expanding employment expemp1 40.7if totemp98>totemp95 then expemp1=1;else expemp1=0
Expanding part-time employment expptep1 27.5if totpt98>totpt96 then expptep1=1; elseexpptep=0
Increasing skills needs ratio, newemployment to total employmentratio
skratio1 27.1If(newemp98/totemp98)>(newemp97/totemp97) then skratio1=1; else skratio1=0
Training practices(reference group: no increase in % of staff receiving training)
Increased level of training provided in1997–98
train1 15.7 if trainch8=1 then train1=1; else train1=0
(reference group: no workers participate in structured training)
No workers participated in structuredtraining
strain1 45if tmstru8=1 then strain1=1; elsestrain1=0
Up to 25% of workers participated instructured training
strain2 25.1if tmstru8=2 then strain2=1; elsestrain2=0
26 to 50% of workers participated instructured training
strain3 6.2if tmstru8=3 then strain3=1; elsestrain3=0
51 to 75% of workers participated instructured training
strain4 2.8if tmstru8=4 then strain4=1; elsestrain4=0
76 to 100% of workers participated instructured training
strain5 3.6if tmstru8=5 then strain5=1; elsestrain5=0
(reference group: no workers participate in on-the-job training)
No workers participated in on the jobtraining
otjtrn1 26.5 if tmotj8=1 then otjtrn1=1; else otjtrn1=0
Up to 25% of workers participated inon the job training
otjtrn2 22 if tmotj8=2 then otjtrn2=1; else otjtrn2=0
26 to 50% of workers participated inon the job training
otjtrn3 12.4 if tmotj8=3 then otjtrn3=1; else otjtrn3=0
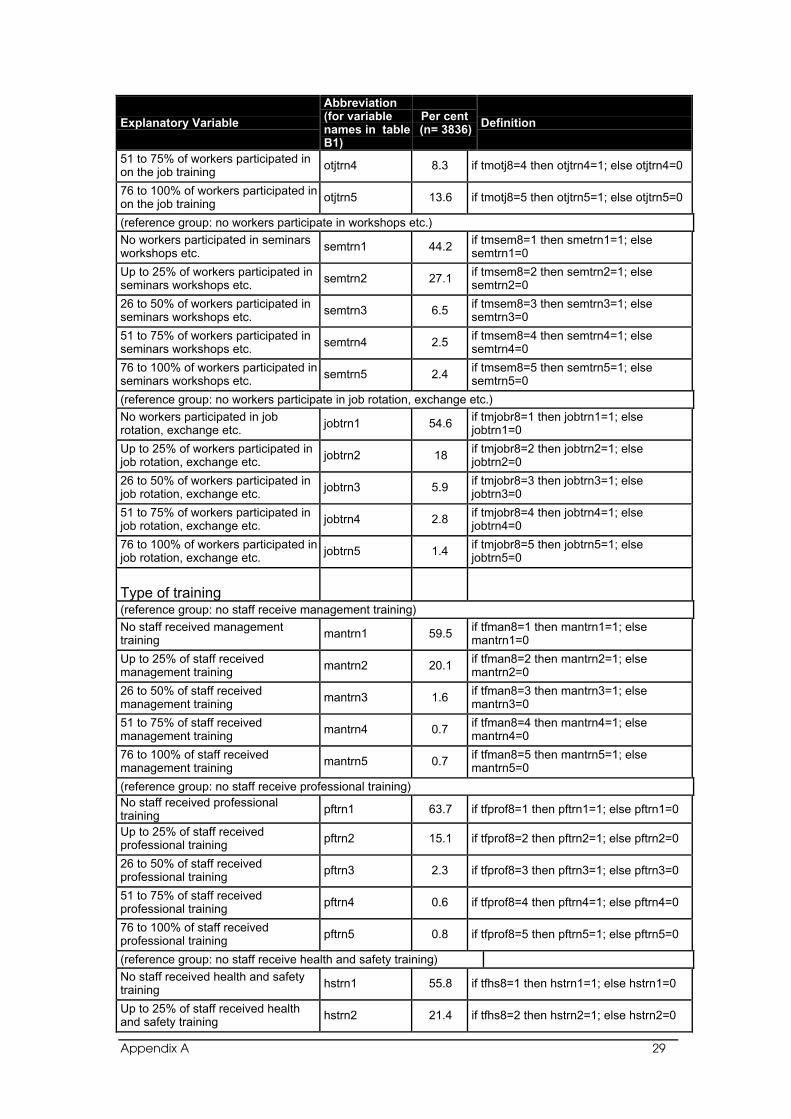
Appendix A 29
Explanatory Variable
Abbreviation(for variablenames in tableB1)
Per cent(n= 3836)
Definition
51 to 75% of workers participated inon the job training
otjtrn4 8.3 if tmotj8=4 then otjtrn4=1; else otjtrn4=0
76 to 100% of workers participated inon the job training
otjtrn5 13.6 if tmotj8=5 then otjtrn5=1; else otjtrn5=0
(reference group: no workers participate in workshops etc.)
No workers participated in seminarsworkshops etc.
semtrn1 44.2if tmsem8=1 then smetrn1=1; elsesemtrn1=0
Up to 25% of workers participated inseminars workshops etc.
semtrn2 27.1if tmsem8=2 then semtrn2=1; elsesemtrn2=0
26 to 50% of workers participated inseminars workshops etc.
semtrn3 6.5if tmsem8=3 then semtrn3=1; elsesemtrn3=0
51 to 75% of workers participated inseminars workshops etc.
semtrn4 2.5if tmsem8=4 then semtrn4=1; elsesemtrn4=0
76 to 100% of workers participated inseminars workshops etc.
semtrn5 2.4if tmsem8=5 then semtrn5=1; elsesemtrn5=0
(reference group: no workers participate in job rotation, exchange etc.)
No workers participated in jobrotation, exchange etc.
jobtrn1 54.6if tmjobr8=1 then jobtrn1=1; elsejobtrn1=0
Up to 25% of workers participated injob rotation, exchange etc.
jobtrn2 18if tmjobr8=2 then jobtrn2=1; elsejobtrn2=0
26 to 50% of workers participated injob rotation, exchange etc.
jobtrn3 5.9if tmjobr8=3 then jobtrn3=1; elsejobtrn3=0
51 to 75% of workers participated injob rotation, exchange etc.
jobtrn4 2.8if tmjobr8=4 then jobtrn4=1; elsejobtrn4=0
76 to 100% of workers participated injob rotation, exchange etc.
jobtrn5 1.4if tmjobr8=5 then jobtrn5=1; elsejobtrn5=0
Type of training(reference group: no staff receive management training)
No staff received managementtraining
mantrn1 59.5if tfman8=1 then mantrn1=1; elsemantrn1=0
Up to 25% of staff receivedmanagement training
mantrn2 20.1if tfman8=2 then mantrn2=1; elsemantrn2=0
26 to 50% of staff receivedmanagement training
mantrn3 1.6if tfman8=3 then mantrn3=1; elsemantrn3=0
51 to 75% of staff receivedmanagement training
mantrn4 0.7if tfman8=4 then mantrn4=1; elsemantrn4=0
76 to 100% of staff receivedmanagement training
mantrn5 0.7if tfman8=5 then mantrn5=1; elsemantrn5=0
(reference group: no staff receive professional training)No staff received professionaltraining
pftrn1 63.7 if tfprof8=1 then pftrn1=1; else pftrn1=0
Up to 25% of staff receivedprofessional training
pftrn2 15.1 if tfprof8=2 then pftrn2=1; else pftrn2=0
26 to 50% of staff receivedprofessional training
pftrn3 2.3 if tfprof8=3 then pftrn3=1; else pftrn3=0
51 to 75% of staff receivedprofessional training
pftrn4 0.6 if tfprof8=4 then pftrn4=1; else pftrn4=0
76 to 100% of staff receivedprofessional training
pftrn5 0.8 if tfprof8=5 then pftrn5=1; else pftrn5=0
(reference group: no staff receive health and safety training)
No staff received health and safetytraining
hstrn1 55.8 if tfhs8=1 then hstrn1=1; else hstrn1=0
Up to 25% of staff received healthand safety training
hstrn2 21.4 if tfhs8=2 then hstrn2=1; else hstrn2=0
30 Factors affecting the provision of entry-level training by enterprises
Explanatory Variable
Abbreviation(for variablenames in tableB1)
Per cent(n= 3836)
Definition
26 to 50% of staff received healthand safety training
hstrn3 2.6 if tfhs8=3 then hstrn3=1; else hstrn3=0
51 to 75% of staff received healthand safety training
hstrn4 0.9 if tfhs8=4 then hstrn4=1; else hstrn4=0
76 to 100% of staff received healthand safety training
hstrn5 1.9 if tfhs8=5 then hstrn5=1; else hstrn5=0
(reference group: no staff receive 'other' training)
No staff received 'other' training othtrn1 48.1 if tfoth8=1 then othtrn1=1; else othtrn1=0
Up to 25% of staff received 'other'training
othtrn2 24.2 if tfoth8=2 then othtrn2=1; else othtrn2=0
26 to 50% of staff received 'other'training
othtrn3 5.3 if tfoth8=3 then othtrn3=1; else othtrn3=0
51 to 75% of staff received 'other'training
othtrn4 2.5 if tfoth8=4 then othtrn4=1; else othtrn4=0
76 to 100% of staff received 'other'training
othtrn5 2.5 if tfoth8=5 then othtrn5=1; else othtrn5=0
Providers of training (reference group: non-provision of training by provider type)Employees or owners of businessproviding on the job training
empotj 51.8 if tpotj8=1 then empotj=1; else empotj=0
Employees or owners of businessproviding structured training
empstru 20.3if tpstruc8=1 then empstru=1; elseempstru=0
Associations providing training asstrain 30.8if tpprof8=1 or tpind8=1 then asstrain=1;else asstrain=0
TAFE providing training tafetrn 19.3 if tptafe8=1 then tafetrn=1; else tafetrn=0
Private training providers providingtraining
prvtrain 14.5if tppriv8=1 then prvtrain=1; elseprvtrain=0
Universities providing training unitrain 6.8if tpuniv=1 then unitrain=1; elseunitrain=0
Business changes (reference group: no change to characteristic)
Open more locations expand 15.7if openloc5=1 or openloc6=1 oropenloc7=1 or openloc8=1 thenexpand=1; else expand=0
Major change in range of products orservices
mjcrange 53if mjcrang5=3 or mjcrang6=3 ormjcrang7=3 or mjcrang8=3 thenmjcrange=1; else mjcrange=0
Major change in advertising mjcadvrt 41.8if mjcadve5=3 or mjcadve6=3 ormjcadve7=3 or mjcadve8=3 thenmjcadvrt=1; else mjcadvrt=0
Major change in distribution mjcdist 30.7if mjcdist5=3 or mjcdist6=3 or mjcdist7=3or mjcdist8=3 then mjcdist=1; elsemjcdist=0
Major change in export marketstargeted
mjcxmkt 21.8if mcexp6=3 or mjcexp7=3 or mjcexp8=3then mjcxmkt=1; else mjcxmkt=0
Major change in production/servicetechnology
mjcptech 40.4if mjcprod5=3 or mjcprod6=3 ormjcprod7=3 or mjcprod8=3 thenmjcptech=1; else mjcptech=0
Major change in business structure mjcbust 12.3if ombust6=3 or ombust7=3 orombust8=3 then mjcbust=1; elsemjcbust=0
Business intentions (reference group: no intention to change characteristic)
Appendix A 31
Explanatory Variable
Abbreviation(for variablenames in tableB1)
Per cent(n= 3836)
Definition
Intend to significantly increaseproduction levels
intprodn 66.9if intinc5=1 or intinc6=1 or intinc7=1 orintinc8=1 then intprodn=1; elseintprodn=0
Intend to open new locations intloc 25.9if intoplo5=1 or intoplo6=1 or intoplo7=1or intoplo8=1 then intloc=1; else intloc=0
Intend to maintain or commenceexporting
intexpt 27.7if intcoex5=1 or intcoex6=1 or intcoex7=1or intcoex8=1 then intexpt=1; elseintexpt=0
Intend to introduce new goods orservices
intgds 57.6if intgood5=1 or intgood6=1 orintgood7=1 or intgood8=1 then intgds=1;else intgds=0
Business practices (reference group: non existence of business practice)Had quality assurance processes in1996-97
quality 42.2if 2<=biptqm6<=4 or 2<=bipqa6<=4 thenquality=1; else quality=0
Business plan busplan 38.6if busplan5=1 or busdoc6=1 orbusdoc7=1 or busdoc8=1 thenbusplan=1; else busplan=0
Undertake e-commerce activities ofsales or purchase
ecom 33.4if bpele6=1 or bpele7=1 or netpay8=1 ornetsend8=1 or nterpay8=1 or netrso8=1or netmar8=1 then ecom=1; else ecom=0
Compare business practices withother businesses
compare 36.6if bpcom6=1 or bpcom7=1 or bpcom8=1then compare=1; else compare=0
Use e-mail email 45.9if netema7=1 or netema8=1 thenemail=1; else email=0
Had a world wide web home-page homepage 21.4if webhom7=1 or webhom8=1 thenhomepage=1; else homepage=0
Exporting business exporter 23.7
if expgood5=1 or expserv5=1 orexgoods6=1 or expserv6=1 orexgoods7=1 or expserv7=1 orexgoods8=1 or expserv8=1 thenexporter=1; else exporter=0
Contracting out contract 12if contout5=1 or contout7=1 thencontract=1; else contract=0
EmploymentSize of enterprise (reference group: enterprises with 1 to 5 employees)
1 to 5 employees smemp1 31.1if 1<=totemp98<=5 then smemp1=1; elsesmemp1=0
6 to 10 employees smemp2 15.8if 6<=totemp98<=10 then smemp2=1;else smemp2=0
11 to 15 employees smemp3 9.2if 11<=totemp98<=15 then smemp3=1;else smemp3=0
16 to 20 employees smemp4 6.3if 16<=totemp98<=20 then smemp4=1;else smemp4=0
21 to 40 employees medemp1 17.3if 21<=totemp98<=40 then medemp1=1;else medemp1=0
41 to 60 employees medemp2 9.9if 41<=totemp98<=60 then medemp2=1;else medemp2=0
61 to 80 employees medemp3 5.5if 61<=totemp98<=80 then medemp3=1;else medemp3=0
81 to 99 employees medemp4 3.8if 81<=totemp98<=100 thenmedemp4=1; else medemp4=0
Full time employees (reference group: 61 to 100 % full-time employees)
1 to 20% employees full-time ftemp1 6.3if (totft98/totemp98)*100)<=20 thenftemp1=1; else ftemp1=0
32 Factors affecting the provision of entry-level training by enterprises
Explanatory Variable
Abbreviation(for variablenames in tableB1)
Per cent(n= 3836)
Definition
21 to 40% employees full-time ftemp2 4.7if 21<=(totft98/totemp98)*100)<=40 thenftemp2=1; else ftemp2=0
41 to 60% employees full-time ftemp3 6.9if 41<=(totft98/totemp98)*100)<=60 thenftemp3=1; else ftemp3=0
61 to 100% employees full-time ftemp4 81if 61<=(totft98/totemp98)*100)<=100then ftemp4=1; else ftemp4=0
Finances(reference group: non-profitable in the financial year)
profit 1994–95 profit1 78.2 if derpl5>0 then profit1=1; else profit1=0
profit 1995–96 profit2 76.3 if derpl6>0 then profit2=1; else profit2=0
profit 1996–97 profit3 73.5 if derpl7>0 then profit3=1; else profit3=0
profit 1997–98 profit4 71.9 if derpl8>0 then profit4=1; else profit4=0
(reference group: non increasing characteristic)
Increasing real value of sales incsale1 51.6if (sales8/104.6)>(sales5/99.0) thenincsale1=1; else incsale1=0
Increased profit 1994–95 to 1997–98 incprof 46.7if (derpl8/104.6)>(derpl5/99.0) thenincprof=1; else incprof=0
Increasing real wage bill incwage1 51.7if (wages8/104.6)>(wages5/99.0) thenincwage1=1; else incwage1=0
Increasing value of research anddevelopment expenditure relative tototal expenditure
randinc1 4.6if (inntot8/totalex8)>(inntot5/totalex5)then randinc1=1; else randinc1=0
Increasing debt to equity ratio equity1 43.1if (totliab8/dereq8)>(totliab5/dereq5) thenequity1=1; else equity1=0
Appendix B 33
Appendix BTable B-1: Factors influencing the propensity to provide apprentice, trade or traineeship training
The data set was composed of small and medium-sized enterprises (up to 100 employees).Dependent variable: provision of trade apprentice or traineeship training 1997–98. Data setcomprises all enterprises who remained in the sample from 1994–95 to 1997–98.
Variable DF ParameterEstimate
StandardError
Wald Chi-Square
Pr > Chi-Square
StandardisedEstimate
OddsRatio
INTERCPT 1 -4.2195 0.3652 133.5294 0.0001 . .INDUST1 1 -0.3286 0.7676 0.1832 0.6686 -0.015959 0.72INDUST3 1 0.3417 0.2856 1.4313 0.2316 0.044369 1.407INDUST4 1 -1.2317 0.2036 36.5927 0.0001 -0.244326 0.292INDUST5 1 0.1052 0.2312 0.2072 0.649 0.017537 1.111INDUST6 1 0.2905 0.3643 0.6362 0.4251 0.030854 1.337INDUST7 1 -0.4811 0.3521 1.8672 0.1718 -0.050424 0.618INDUST8 1 -3.2547 0.8353 15.1805 0.0001 -0.344519 0.039INDUST9 1 -1.6363 0.2706 36.5548 0.0001 -0.32045 0.195
INDUST10 1 -1.0883 0.5646 3.7161 0.0539 -0.090343 0.337INDUST11 1 0.1553 0.4148 0.1401 0.7081 0.012675 1.168
EXPAND 1 -0.3215 0.1701 3.5712 0.0588 -0.064476 0.725ORGTYPE2 1 0.2567 0.1429 3.226 0.0725 0.066275 1.293
BUSAGE1 1 0.00964 0.169 0.0033 0.9545 0.002276 1.01BUSAGE3 1 -0.2864 0.1991 2.0689 0.1503 -0.054234 0.751BUSAGE4 1 -0.2125 0.1554 1.87 0.1715 -0.052366 0.809
DMGEND1 1 -0.2214 0.3936 0.3164 0.5738 -0.022255 0.801DMEDU1 1 0.1814 0.1591 1.3001 0.2542 0.040953 1.199DMEDU2 1 0.6344 0.1687 14.1336 0.0002 0.125581 1.886
FAMBUS1 1 0.2791 0.1321 4.4656 0.0346 0.076925 1.322UNION2 1 -0.2333 0.2067 1.2739 0.259 -0.03438 0.792UNION3 1 0.0982 0.2693 0.133 0.7153 0.010397 1.103UNION4 1 0.032 0.2607 0.0151 0.9023 0.003487 1.033
UNIONEX1 1 0.5367 0.2112 6.4569 0.0111 0.077104 1.71TRAIN1 1 -0.0199 0.1463 0.0185 0.8919 -0.003986 0.98
MANTRN2 1 0.0556 0.1536 0.1312 0.7172 0.012301 1.057MANTRN3 1 0.2214 0.4051 0.2987 0.5847 0.015271 1.248MANTRN4 1 0.0296 0.6137 0.0023 0.9615 0.001314 1.03MANTRN5 1 -0.8208 0.7486 1.2023 0.2729 -0.03642 0.44
PFTRN2 1 -0.1056 0.169 0.3905 0.532 -0.020873 0.9PFTRN3 1 -0.2467 0.378 0.4259 0.514 -0.020363 0.781PFTRN4 1 0.1342 0.7271 0.0341 0.8536 0.005588 1.144PFTRN5 1 0.291 0.6805 0.183 0.6688 0.014597 1.338HSTRN2 1 -0.016 0.1537 0.0108 0.9173 -0.00361 0.984HSTRN3 1 -0.2318 0.3212 0.5208 0.4705 -0.020268 0.793HSTRN4 1 -0.3252 0.4909 0.4389 0.5076 -0.01705 0.722HSTRN5 1 0.00899 0.3797 0.0006 0.9811 0.000668 1.009
OTHTRN2 1 -0.2039 0.1518 1.8037 0.1793 -0.048158 0.816OTHTRN3 1 -0.3692 0.2548 2.0995 0.1473 -0.045678 0.691OTHTRN4 1 -0.8983 0.3551 6.4005 0.0114 -0.076578 0.407OTHTRN5 1 -1.7439 0.4902 12.6574 0.0004 -0.149443 0.175
EMPOTJ 1 0.0944 0.2058 0.2106 0.6463 0.026018 1.099EMPSTRU 1 0.3396 0.1425 5.6776 0.0172 0.075325 1.404
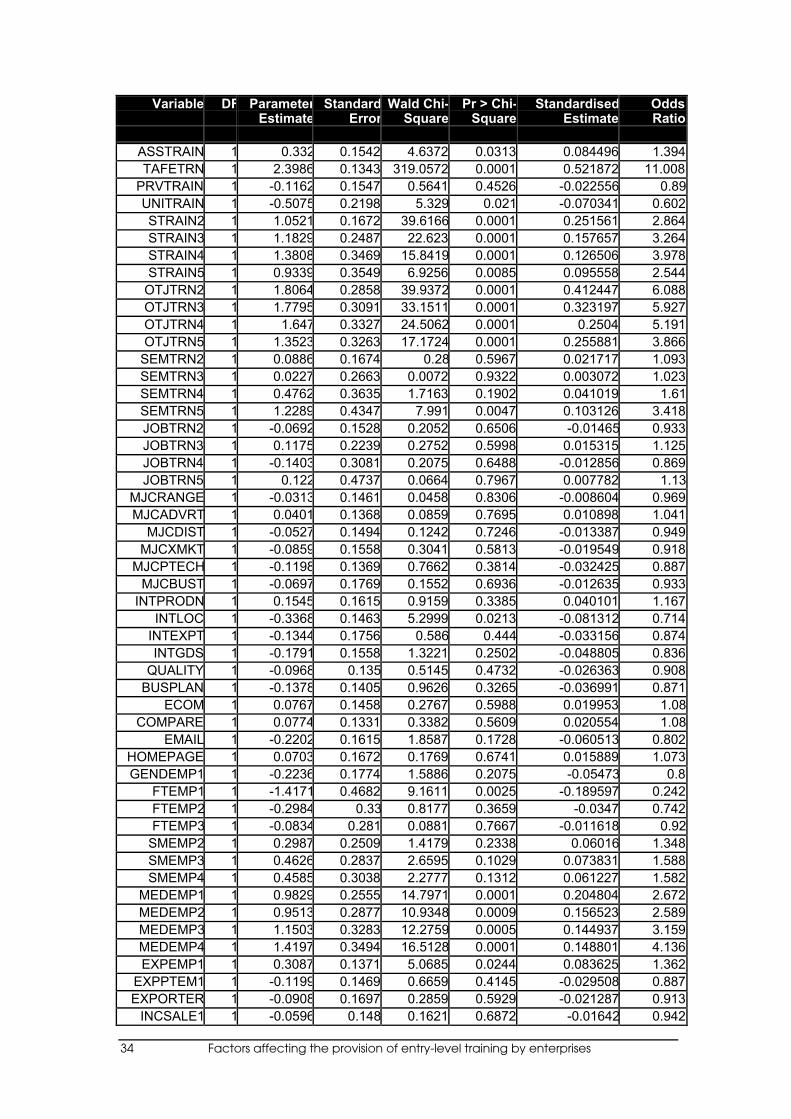
34 Factors affecting the provision of entry-level training by enterprises
Variable DF ParameterEstimate
StandardError
Wald Chi-Square
Pr > Chi-Square
StandardisedEstimate
OddsRatio
ASSTRAIN 1 0.332 0.1542 4.6372 0.0313 0.084496 1.394TAFETRN 1 2.3986 0.1343 319.0572 0.0001 0.521872 11.008
PRVTRAIN 1 -0.1162 0.1547 0.5641 0.4526 -0.022556 0.89UNITRAIN 1 -0.5075 0.2198 5.329 0.021 -0.070341 0.602STRAIN2 1 1.0521 0.1672 39.6166 0.0001 0.251561 2.864STRAIN3 1 1.1829 0.2487 22.623 0.0001 0.157657 3.264STRAIN4 1 1.3808 0.3469 15.8419 0.0001 0.126506 3.978STRAIN5 1 0.9339 0.3549 6.9256 0.0085 0.095558 2.544
OTJTRN2 1 1.8064 0.2858 39.9372 0.0001 0.412447 6.088OTJTRN3 1 1.7795 0.3091 33.1511 0.0001 0.323197 5.927OTJTRN4 1 1.647 0.3327 24.5062 0.0001 0.2504 5.191OTJTRN5 1 1.3523 0.3263 17.1724 0.0001 0.255881 3.866
SEMTRN2 1 0.0886 0.1674 0.28 0.5967 0.021717 1.093SEMTRN3 1 0.0227 0.2663 0.0072 0.9322 0.003072 1.023SEMTRN4 1 0.4762 0.3635 1.7163 0.1902 0.041019 1.61SEMTRN5 1 1.2289 0.4347 7.991 0.0047 0.103126 3.418JOBTRN2 1 -0.0692 0.1528 0.2052 0.6506 -0.01465 0.933JOBTRN3 1 0.1175 0.2239 0.2752 0.5998 0.015315 1.125JOBTRN4 1 -0.1403 0.3081 0.2075 0.6488 -0.012856 0.869JOBTRN5 1 0.122 0.4737 0.0664 0.7967 0.007782 1.13
MJCRANGE 1 -0.0313 0.1461 0.0458 0.8306 -0.008604 0.969MJCADVRT 1 0.0401 0.1368 0.0859 0.7695 0.010898 1.041
MJCDIST 1 -0.0527 0.1494 0.1242 0.7246 -0.013387 0.949MJCXMKT 1 -0.0859 0.1558 0.3041 0.5813 -0.019549 0.918
MJCPTECH 1 -0.1198 0.1369 0.7662 0.3814 -0.032425 0.887MJCBUST 1 -0.0697 0.1769 0.1552 0.6936 -0.012635 0.933
INTPRODN 1 0.1545 0.1615 0.9159 0.3385 0.040101 1.167INTLOC 1 -0.3368 0.1463 5.2999 0.0213 -0.081312 0.714
INTEXPT 1 -0.1344 0.1756 0.586 0.444 -0.033156 0.874INTGDS 1 -0.1791 0.1558 1.3221 0.2502 -0.048805 0.836
QUALITY 1 -0.0968 0.135 0.5145 0.4732 -0.026363 0.908BUSPLAN 1 -0.1378 0.1405 0.9626 0.3265 -0.036991 0.871
ECOM 1 0.0767 0.1458 0.2767 0.5988 0.019953 1.08COMPARE 1 0.0774 0.1331 0.3382 0.5609 0.020554 1.08
EMAIL 1 -0.2202 0.1615 1.8587 0.1728 -0.060513 0.802HOMEPAGE 1 0.0703 0.1672 0.1769 0.6741 0.015889 1.073GENDEMP1 1 -0.2236 0.1774 1.5886 0.2075 -0.05473 0.8
FTEMP1 1 -1.4171 0.4682 9.1611 0.0025 -0.189597 0.242FTEMP2 1 -0.2984 0.33 0.8177 0.3659 -0.0347 0.742FTEMP3 1 -0.0834 0.281 0.0881 0.7667 -0.011618 0.92
SMEMP2 1 0.2987 0.2509 1.4179 0.2338 0.06016 1.348SMEMP3 1 0.4626 0.2837 2.6595 0.1029 0.073831 1.588SMEMP4 1 0.4585 0.3038 2.2777 0.1312 0.061227 1.582
MEDEMP1 1 0.9829 0.2555 14.7971 0.0001 0.204804 2.672MEDEMP2 1 0.9513 0.2877 10.9348 0.0009 0.156523 2.589MEDEMP3 1 1.1503 0.3283 12.2759 0.0005 0.144937 3.159MEDEMP4 1 1.4197 0.3494 16.5128 0.0001 0.148801 4.136EXPEMP1 1 0.3087 0.1371 5.0685 0.0244 0.083625 1.362
EXPPTEM1 1 -0.1199 0.1469 0.6659 0.4145 -0.029508 0.887EXPORTER 1 -0.0908 0.1697 0.2859 0.5929 -0.021287 0.913
INCSALE1 1 -0.0596 0.148 0.1621 0.6872 -0.01642 0.942
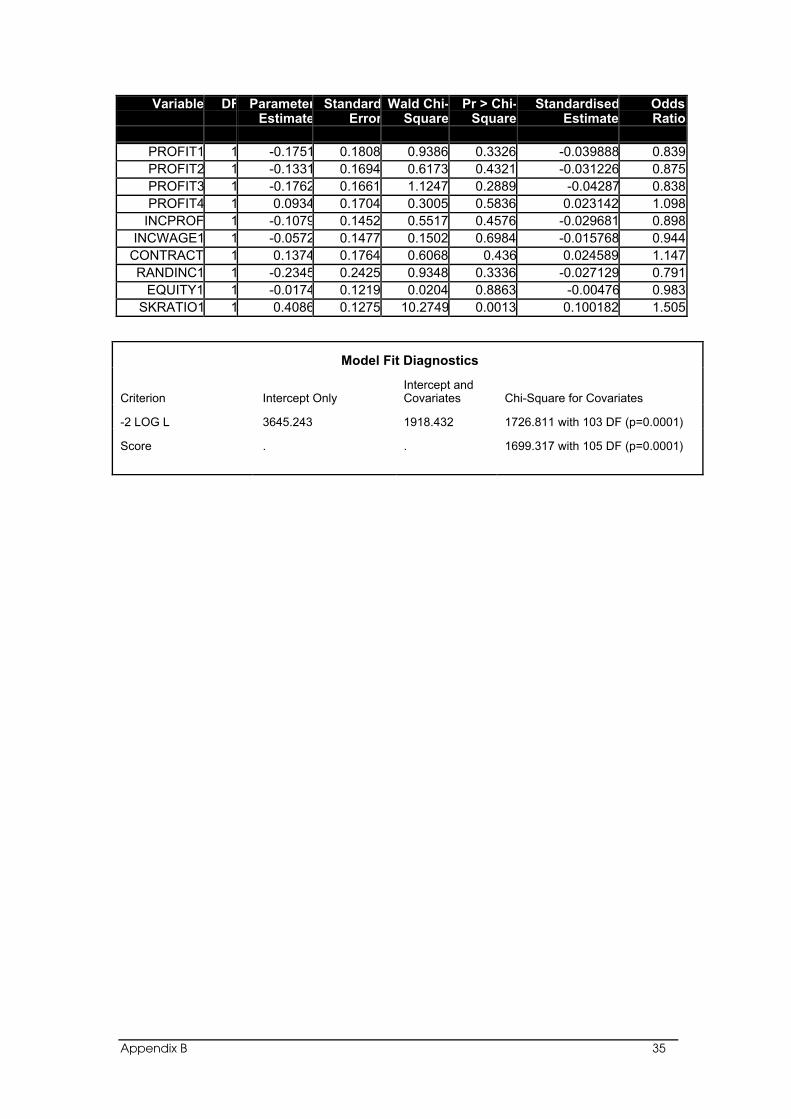
Appendix B 35
Variable DF ParameterEstimate
StandardError
Wald Chi-Square
Pr > Chi-Square
StandardisedEstimate
OddsRatio
PROFIT1 1 -0.1751 0.1808 0.9386 0.3326 -0.039888 0.839PROFIT2 1 -0.1331 0.1694 0.6173 0.4321 -0.031226 0.875PROFIT3 1 -0.1762 0.1661 1.1247 0.2889 -0.04287 0.838PROFIT4 1 0.0934 0.1704 0.3005 0.5836 0.023142 1.098
INCPROF 1 -0.1079 0.1452 0.5517 0.4576 -0.029681 0.898INCWAGE1 1 -0.0572 0.1477 0.1502 0.6984 -0.015768 0.944
CONTRACT 1 0.1374 0.1764 0.6068 0.436 0.024589 1.147RANDINC1 1 -0.2345 0.2425 0.9348 0.3336 -0.027129 0.791
EQUITY1 1 -0.0174 0.1219 0.0204 0.8863 -0.00476 0.983SKRATIO1 1 0.4086 0.1275 10.2749 0.0013 0.100182 1.505
Model Fit Diagnostics
Criterion Intercept OnlyIntercept andCovariates Chi-Square for Covariates
-2 LOG L 3645.243 1918.432 1726.811 with 103 DF (p=0.0001)
Score . . 1699.317 with 105 DF (p=0.0001)

apprenticeships
This is one in a series of publications on apprenticeships, nowavailable in print and on the internet. Published by NCVER, these coverfacts and figures on the current vital issues for Australian apprenticeships.
Available online only:
❖ Apprentices’ and trainees’ English language and literacy skills in workplace learning and performance: Employer and employee opinion, S O’Neill, A Gish
❖ Apprenticeship in Australia: An historical snapshot, J Ray❖ Factors affecting the provision of entry-level training by
enterprises, K Ball, B Freeland❖ Factors that contribute to retention and completion rates
for apprentices and trainees, R Harris, M Simons, K Bridge, J Bone, H Symons, B Clayton, B Pope, G Cummins, K Blom
❖ Issues and directions from a review of the Australian apprenticeship and traineeship literature, S Saunders
❖ Locational issues in new apprenticeships, T Dumbrell, W Finnegan, R de Montfort
❖ On-the-job traineeships: Advantages and disadvantages for employers and trainees, J Misko
❖ Review of the Australian apprenticeship and traineeship literature: References and their key issues, S Saunders
❖ Training for the skilled trades in Australia, 1980 to 2000: Training reforms, E Webster, M Dockery, T Bainger, R Kelly
Available in print and online:❖ Australian Apprenticeships: Facts, fiction and future ❖ Australian Apprenticeships: Research readings ❖ Australian Apprenticeships: Research at a glance
www.ncver.edu.au/apprentices.htmAUSTRALIAN