Embed Size (px)
Citation preview
Report No. CDOT-DTD-R-95-8
Factors Affecting the Inter-Laboratory Reproducibility of the Bulk Specific Gravity of
Samples Compacted Using the Texas Gyratory Compactor
Charles MacKean Colorado Department of Transportation 4201 East Arkansas Avenue Denver, Colorado 80222
Final Report June, 1995
Prepared in cooperation with the u.s. Department of Transportation Federal Highway Administration

The contents of this report reflect the views of the author who is
responsible for the facts and the accuracy of the data presented herein.
The contents do not necessarily reflect the official views of the Colorado
Transportation Institute, the Colorado Department of Transportation, or the
Federal Highway Administration. This report does not constitute a
standard, specification, or regulation.
Acknowledgements
Larry Lemar (COOT), for his patience and his thorough knowledge of the various COOT
test procedures. Oave Gallegos (COOT), Brad Black (COOT), Robert Meath (COOT),
and Mike Gallegos (Western Mobile), and all of the COOT Region laboratory testers for
their valuable insights and suggestions into the Texas gyratory compactor procedure and
its standardization. Tim Aschenbrener (COOT) and Robert LaForce (COOT) for their
encouragement and comments during the investigation.
The COOT study panel provided many valuable comments and suggestions for this
paper. CDOT participants were: Tim Aschenbrener, Robert LaForce, Steve Horton, Larry
Lemar, Oonna Harmelink, Alan Hotchkiss. Thanks to Richard Zamorra from the FHWA
who also participated in the study panel.
ii
Technical Report Documentation Page
1. Report No. 2. Government Accession No. 3. Recipient's Catalog No. CDOT-DTD-R-95-8
4. Tit le ·llnd Subtit le 5. Report Date June 1995
Factors Affecting the Inter-Laboratory Reproducibility of the Bulk Specific Gravity of Samples Compacted Using the Texas Gyratory Compactor
6. Performing Organization Code File No. 10.12
7. Author(s) Charles MacKean
9.Performing Organization Name and Address Colorado Department of Transportation 4201 East Arkansas Avenue Denver, Colorado 80222
12. Sponsoring Agency Name and Address Colorado Department of Transportation 4201 E. Arkansas Avenue Denver, Colorado 80222
15. Supplementary Notes
8. Performing Organization Rpt.No. CDOT-DTD-R-95-8
10. Work Unit No.(TRAIS)
11. Contract or Grant No.
13.Type of Rpt;and Period Covered Final Report
14. Sponsoring Agency Code
Prepared in Cooperation with the U.S. Department of Transportation Federal Highway Administration
16. Abstrac,t The Colorado Department of Transportation (COOT) uses the inter-laboratory variation of bulk specific gravity results from compacted asphalt mix samples to measure the reproducibility of laboratory compactive efforts. Matched asphalt mixes tested in different laboratories had average differences of sample bulk specific gravities which were statistically significant during the 1993 paving season. This investigation identified and addressed some of the causes of these inter-laboratory differences in sample bulk specific gravities. The findings have implications for the Texas gyratory compactor and possibly for the SUPERPAVE gyratory compactor.
When this investigation's recommendations were implemented in Colorado, inter-laboratory differences in average bulk specific gravity results dropped dramatically. Absolute differences between COOT Region laboratories and the COOT Central laboratory decreased from an average of 0.016 in 1993 to 0.002 in 1994.
By taking the following steps, repeatable compaction results were achieved. Formal, scheduled equipment calibration verificaticn was necessary for all laboratories testing asphalt mixes. Also, the loading of the mold and the compaction procedure had to be standardized to a very high degree. The loading and compaction methods must minimize segregation, have strict time limits, achievable by novice testers, be easily taught, and have high operator acceptance to minimize intentional procedure modification.
17. Key Words bulk specific gravity, HMA, Texas gyratory compactor, interlaboratory repeatability, SUPERPAVE gyratory compactor
18. Distribution Statement No Restrictions: This report is available to the public through the National Information Service, Springfield, Virginia 22161
19. Security Classif. (of this report) Unclassified
20. Security Classif.(of this page) Unclassified
21. No. of Pages 45
22. Price
iii
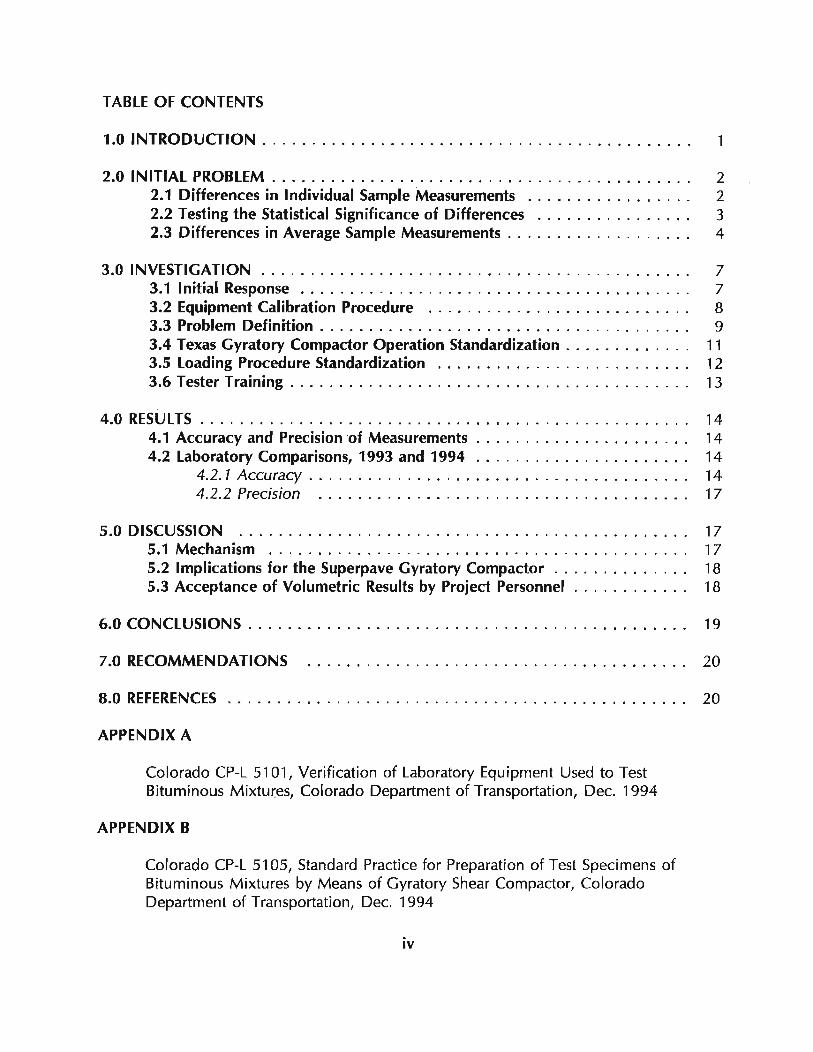
TABLE OF CONTENTS
1.0 INTRODUCTION. . . . . . . . . . . . . . . . . . . . . . . . . . . . . . . . . . . . . . . . . . . . 1
2.0 INITIAL PROBLEM. . . . . . . . . . . . . . . . . . . . . . . . . . . . . . . . . . . . . . . . . .. 2 2.1 Differences in Individual Sample Measurements ................. 2 2.2 Testing the Statistical Significance of Differences ................ 3 2.3 Differences in Average Sample Measurements. . . . . . . . . . . . . . . . . .. 4
3.0 INVESTIGATION ..... . . . . . . . . . . . . . . . . . . . . . . . . . . . . . . . . . . . . . . . 7 3.1 Initial Response ............. .. ......................... 7 3.2 Equipment Calibration Procedure ......... .. ............... . 8 3.3 Problem Definition . . . . . . . . . . . . . . . . . . . . . . . . . . . . . . . . . . . . .. 9 3.4 Texas Gyratory Compactor Operation Standardization . . . . . . . . . . . .. 11 3.5 Loading Procedure Standardization .......................... 12 3.6 Tester Training. . . . . . . . . . . . . . . . . . . . . . . . . . . . . . . . . . . . . . . . . 13
4.0 RESULTS. . . . . . . . . . . . . . . . . . . . . . . . . . . . . . . . . . . . . . . . . . . . . . . . .. 14 4.1 Accuracy and Precision of Measurements . . . . . . . . . . . . . . . . . . . . .. 14 4.2 Laboratory Comparisons, 1993 and 1994 ........... . .......... 14
4.2.1 Accuracy. . . . . . . . . . . . . . . . . . . . . . . . . . . . . . . . . . . . . .. 14 4.2.2 Precision ................ . ........ ... .......... 17
5.0 DISCUSSION ........... .. . .. ...... .. . . .................... 17 5.1 Mechanism ...................................... ..... 17 5.2 Implications for the Superpave Gyratory Compactor . . . . . . . . . . . . .. 18 5.3 Acceptance of Volumetric Results by Project Personnel . . . . . . . . . . .. 18
6.0 CONCLUSIONS . . . . . . . . . . . . . . . . . . . . . . . . . . . . . . . . . . . . . . . . . . . .. 19
7.0 RECOMMENDATIONS ............. . ......................... 20
8.0 REFERENCES .... . .......................................... 20
APPENDIX A
Colorado CP-L 5101, Verification of Laboratory Equipment Used to Test Bituminous Mixtures, Colorado Department of Transportation, Dec. 1994
APPENDIX B
Colorado CP-L 5105, Standard Practice for Preparation of Test Specimens of Bituminous Mixtures by Means of Gyratory Shear Compactor, Colorado Department of Transportation, Dec. 1994
iv
LIST OF FIGURES
Figure 1:
Figure 2:
Figure 3:
Differences in reported bulk specific gravity for matched samples tested by one COOT Region laboratory and the COOT Central laboratory . . . . . . . . . . . . . . . . . . . . . . . . . . . . . . . . . . . . . . . . .. 5
Mean differences of bulk specific gravities for the 1993 paving season for six laboratories and the COOT Central laboratory . . . . . . . . . . . . . . 6
Mean differences of bulk specific gravities for the 1993 and 1994 paving seasons between six laboratories and the COOT Central laboratory.. 16
LIST OF TABLES
Table 1.
Table 2.
Results from a typical two operator, two laboratory compaction experiment. . . . . . . . . . . . • . . . . . . . . . . . . . . . . . . . . . . . . . . . . . 9
Comparison of 1993 and 1994 observed differences in bulk specific gravity measurements reported by the COOT Central laboratory and the six COOT Region laboratories. . . . . . . . . . . . . . . . . . . . . . . . . . . .. 1 5
v

1.0 INTRODUCTION
The Colorado Department of Transportation (CDOT) routinely takes two matched
samples of hot mix asphalt (HMA) at job sites. Matched samples are samples which are
taken at the same time from the same material at a job site but are not recombined and
split. This means that some random variation in the material may exist between the
samples.
One of these samples is tested at one of six CDOT Region laboratories while the other
sample is tested at the COOT Central laboratory. The test results which are reported for
the two matched HMA samples are compared in this study. More importantly, the
average test results reported over 10 to 60 samples per laboratory are compared and
analyzed statistically. This analysis attempts to measure the ability of different
laboratories to repeat each others test results or the reproducibility of the test results.
Colorado began using Texas gyratory compactors during the 1992 paving season. Up to
and during the 1993 paving season, reproducibility of reported bulk specific gravity
results of compacted HMA samples was a problem. None of the six COOT Region
laboratories' results matched the COOT Central laboratory's results. This meant that
samples of mix tested in one laboratory would have, on average, different air void
contents than the same mixes tested in another laboratory.
A study for CDOT of flexible pavement test reproducibility was begun in 1992 by
Matthew Witczak and Chuck Hughes (1). The study identified the reproducibility of bulk
specific gravity results as a problem. This investigation was conducted in response to the
findings of the report by Witczak and Hughes.
The bulk specific gravity of compacted samples is used in the design and field control of
hot-mix bituminous pavements (HBP). COOT's HMA mix designs are generated in a
different laboratory from the test results used for production control. Thus, it is essential
- 1 -
that the measurements reported by both laboratories agree.
In addition to production control issues, COOT is currently moving towards a voids
acceptance program. This will base HMA pay factors on sample's air void contents and
voids in the mineral aggregate. Both of these measurements are calculated using the
bulk specific gravity of compacted samples. Colorado contractors may have a tendency
to submit higher bids if the reproducibility of tests which determine pay factors is an
issue.
Work had already been done by Krugler, Tahmoressi, and Rand (2) of the Texas DOT on
variables which affected VMA measurement. They discovered that the time of loading
affected the bulk specific gravities of compacted samp"les.
This investigation used these findings and made other discoveries during the process of
developing a compaction procedure which greatly reduced or eliminated the inter
laboratory differences in average sample bulk specific gravity results. The findings of this
investigation have implications for the Texas gyratory compactor and possibly for the
superpave gyratory compactor.
2.0 INITIAL PROBLEM
2.1 Differences in Individual Sample Measurements
During the 1993 paving season, matched samples were sent from paving projects to one
of the six CDOT Region laboratories as well as the COOT Central laboratory. The
reported bulk specific gravity results for these samples were tabulated and the results for
individual samples which were reported by the Central laboratory were subtracted from
the results reported by the Region laboratories.
Test results reported by each of the six Region laboratories were compared to the results
- 2 -
from the COOT Central laboratory for the 1993 and the 1994 paving seasons.
Comparisons of data for the 1993 paving s~ason showed that the bulk specific gravity
results reported by every COOT Region laboratory were statistically different from the
results reported by the COOT Central laboratory.
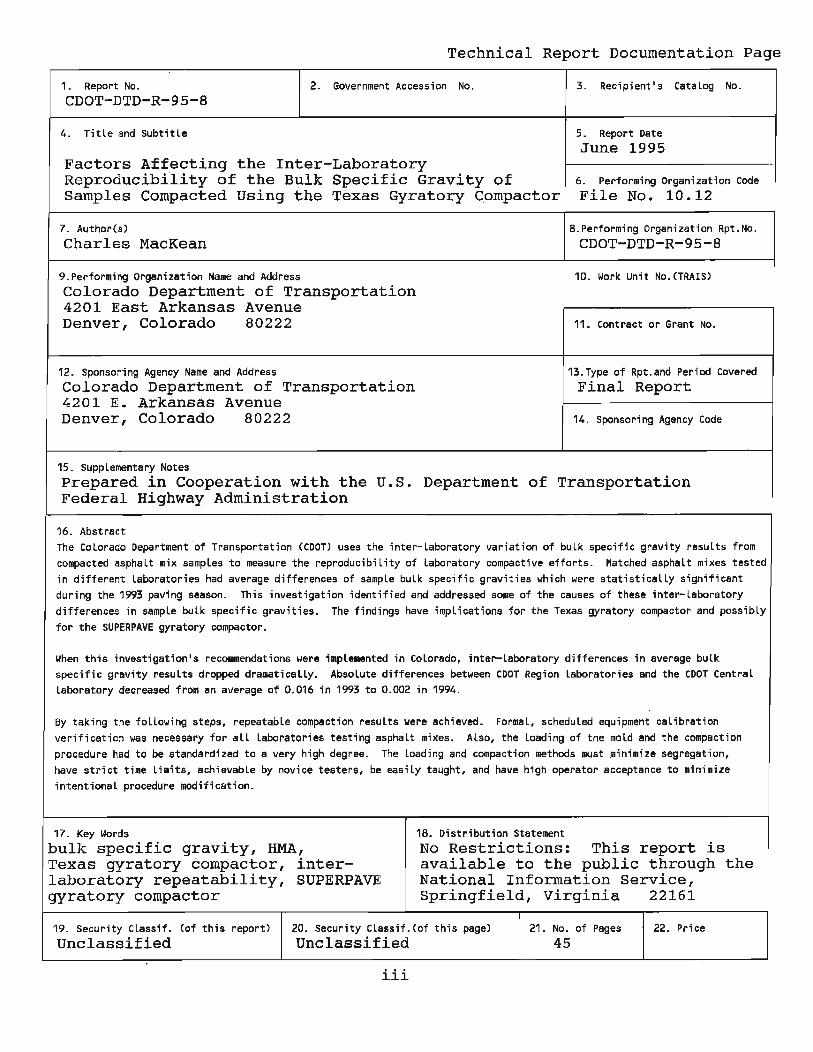
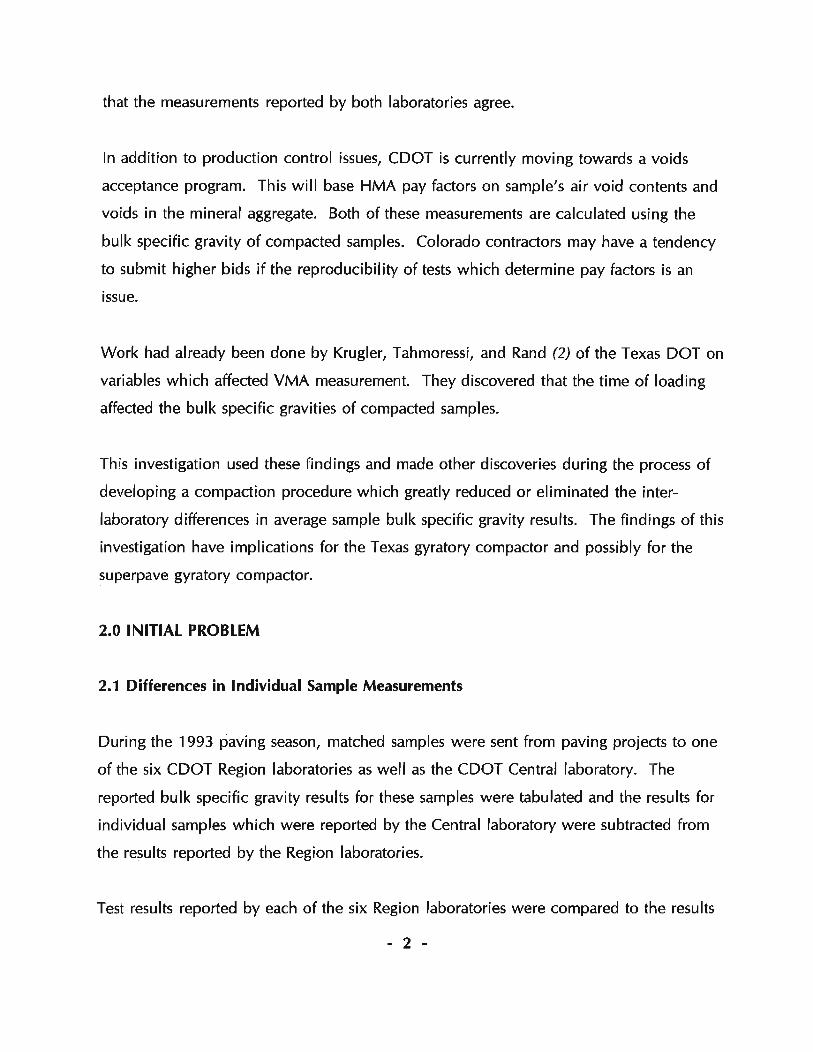
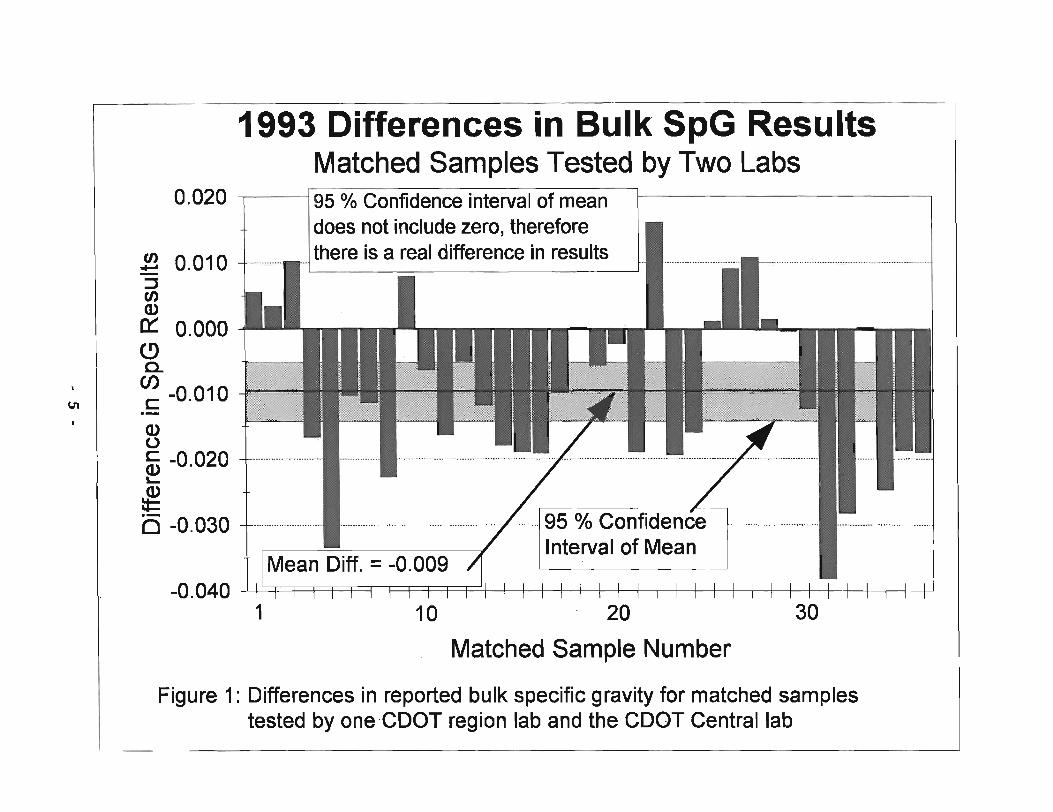
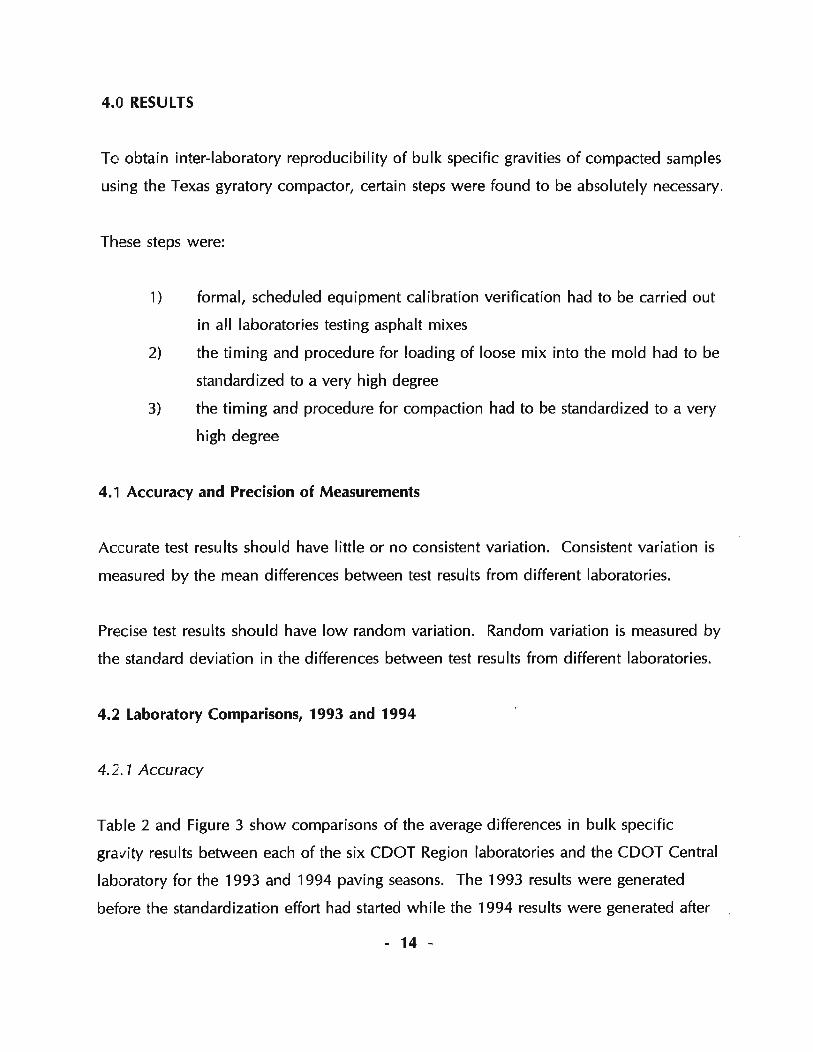
Figure 1 shows individual bulk specific gravity results reported during 1993 by the
COOT Central laboratory subtracted from the results reported by a single COOT Region
laboratory. Each point on the graph represents the difference between the reported bulk
specific gravity from the COOT Central laboratory and a COOT Region laboratory for
material sampled at the same time from the same paving project.
It can be seen that one laboratory reported a consistently different bulk specific gravity
from the other laboratory. This indicated that some aspect of the compaction procedures
used at the two laboratories was not the same.
2.2 Testing the Statistical Significance of Differences
The first question to be examined was whether the test result differences which were
being observed could have occurred by random chance. The Student's t test was used to
determine whether the true difference between laboratory results could have been equal
to zero. The true difference is the mean difference which would be observed if
hundreds of samples were tested and the results compared. The observed difference is
the mean difference which was observed with the limited data gathered during this
investigation.
Two possibilities were considered. The first was that there was no true difference in the
test procedures being used. That is, any observed difference in test results was caused
by random chance. The other possibility was that there was a true difference in the test
procedures being used. This would be indicated by an observed difference in the test
results large enough that it could not reasonably occur by random chance.
- 3 -
Observed differences between individual, matched test results reported by Region
labor~tories and the Central laboratory were tabulated. The mean and standard deviation
of the observed differences were calculated. A 95 percent confidence interval for the
true difference was calculated from the mean and standard deviation of the observed
differences. This confidence interval is the range of differences in which there is a 95
percent chance of finding the true difference. The equation for the possible range of true
differences is:
PD -D
to.05
s
n
the true mean difference of the entire population being sampled from
the mean difference of the observations in this investigation
1.960 for a large number of observations and a 95% confidence interval
(varies with n)
the standard deviation of the observed differences
the number of results used to find the observed difference
If the 95 percent confidence interval for the true difference includes zero, then it is
possible that the true difference is equal to zero. If the 95 percent confidence interval
does not include zero, then there is less than a 5 percent chance that there is no true
difference in the results being reported by the two laboratories. This indicates that the
difference in results reported by the two laboratories is statistically significant.
2.3 Differences in Average Sample Measurements
During the 1993 paving season, there were statistically significant differences between
the results being reported by every CDOT Region laboratory and the CDOT Central
laboratory.
- 4 -
til I
1993 Differences in Bulk SpG Results Matched Samples Tested by Two Labs
0.020 195 % Confidence interval of mean
~ 0.010 :J en Q)
0::: 0.000 C> a. W c: -0.010
Q) o ffi -0.020 ~
~
does not include zero, therefore there is a real difference in results
(5 -0.030 +---------- ----------- ------ 1---------------- --------------------------------------- -------1-----------1 95 % Confidence Interval of Mean
-0.040 I I' 'I I I I I I I I I I I I I I I I I I I I I I I I I
1 10 . 20 30
Matched Sample Number
Figure 1: Differences in reported bulk specific gravity for matched samples tested by one ·CDOT region lab and the COOT Central lab

a'I
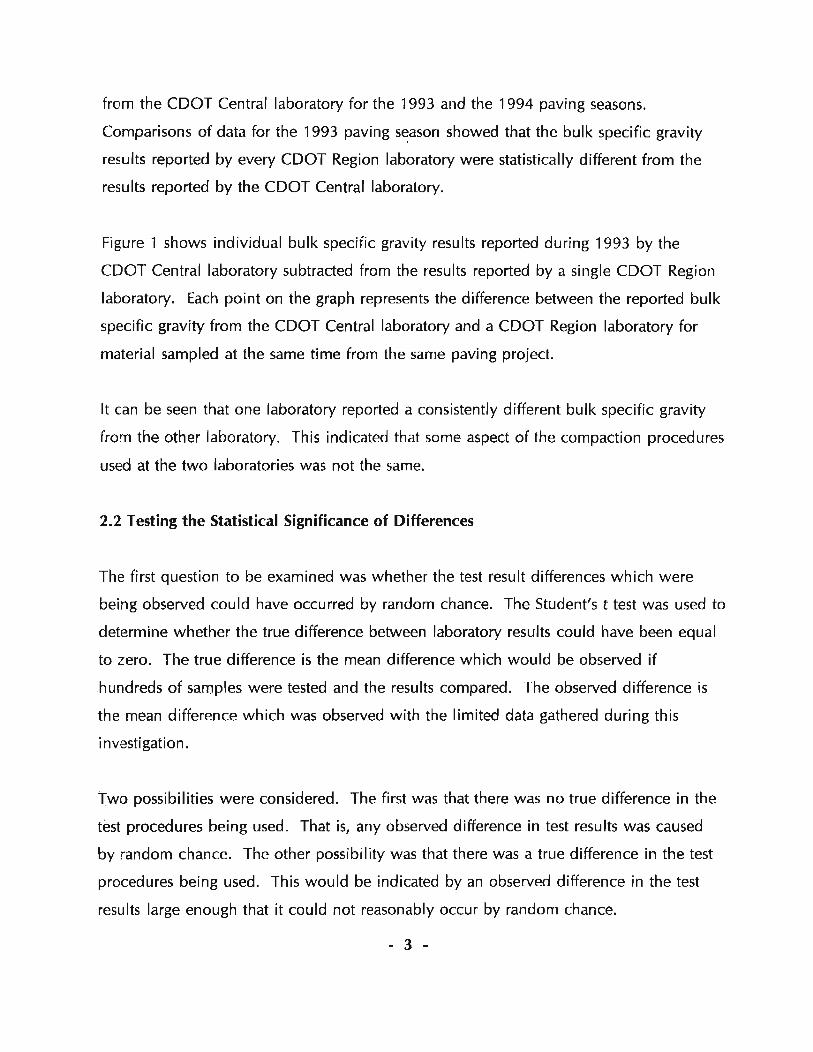
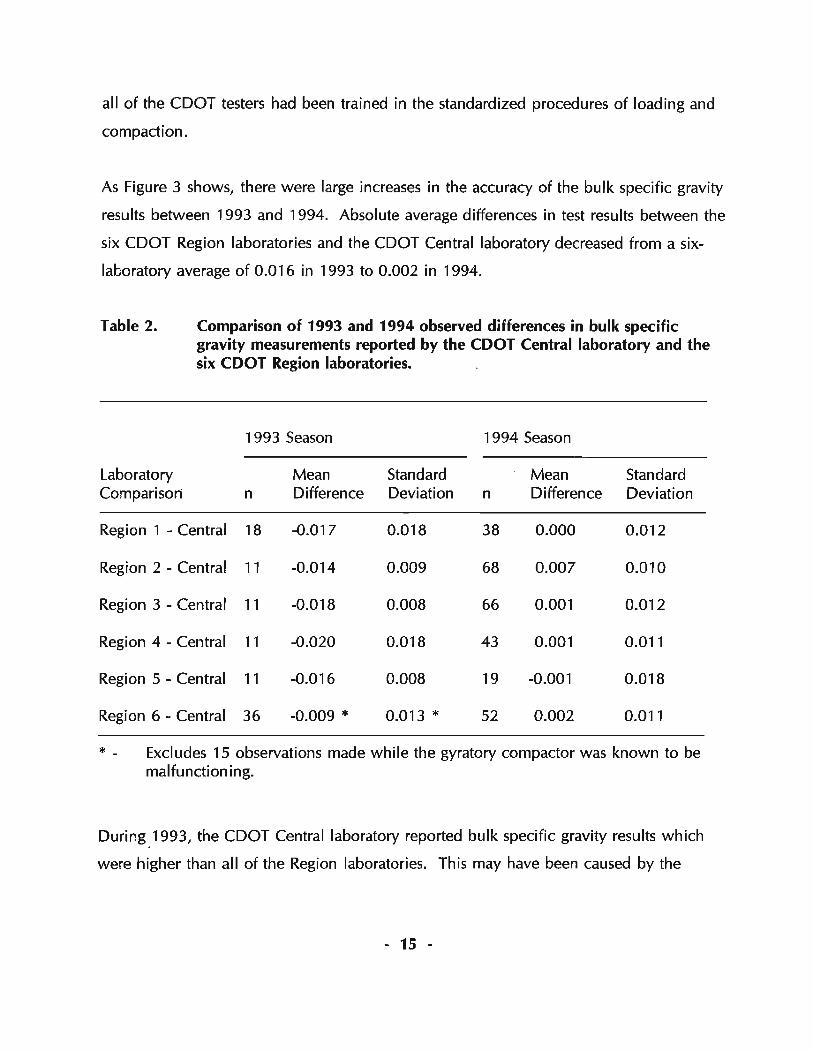
1993 Mean Diffs. in Bulk SpG Results Region - Central Lab, Abs. Value
0.025 -,--- - - ----- -------- _ _ _
Q) 0.020 u c ~ ~ 0.015 Cl (9
~ 0.010 c co Q)
~ 0.005
0.000 ~i{r@im;:@Zj ~
345 Region Lab
Figure 2: Mean differences of bulk specific gravities for the 1993 paving season for six labs
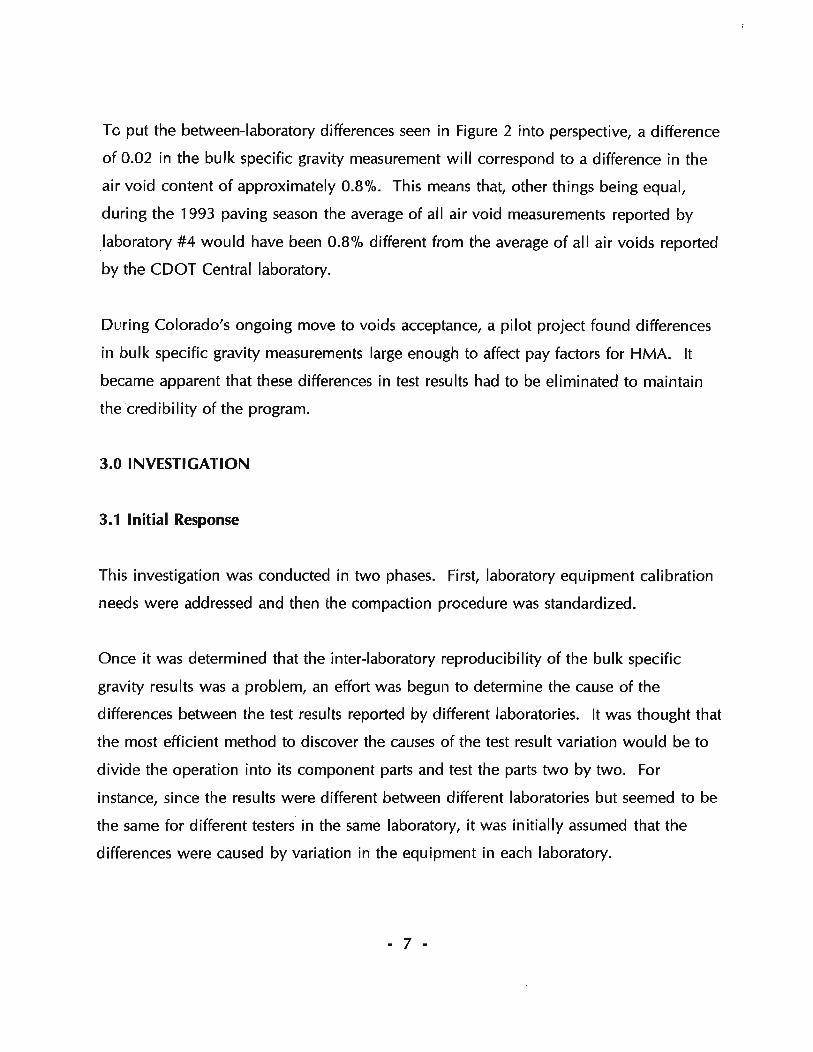
To put the between-laboratory differences seen in Figure 2 into perspective, a difference
of 0.02 in the bulk specific gravity measurement will correspond to a difference in the
air void content of approximately 0.8%. This means that, other things being equal,
during the 1993 paving season the average of all air void measurements reported by
laboratory #4 would have been 0.8% different from the average of all air voids reported
by the CDOT Central laboratory.
During Colorado's ongoing move to voids acceptance, a pilot project found differences
in bulk specific gravity measurements large enough to affect pay factors for HMA. It
became apparent that these differences in test results had to be eliminated to maintain
the credibility of the program.
3.0 INVESTIGATION
3.1 Initial Response
This investigation was conducted in two phases. First, laboratory equipment calibration
needs were addressed and then the compaction procedure was standardized.
Once it was determined that the inter-laboratory reprodUcibility of the bulk specific
gravity results was a problem, an effort was begun to determine the cause of the
differences between the test results reported by different laboratories. It was thought that
the most efficient method to discover the causes of the test result variation would be to
divide the operation into its component parts and test the parts two by two. For
instance, since the results were different between different laboratories but seemed to be
the same for different testers in the same laboratory, it was initially assumed that the
differences were caused by variation in the equipment in each laboratory.
- 7 -
3.2 Equipment Calibration Procedure
The initial assumption that variations in laboratory equipment calibration were causing
test result variation was addressed first.
The equipment checks which were routinely performed by the CDOT Central laboratory
were documented and an estimate of a reasonable frequency for these equipment checks
was made to produce a calibration verification checklist for laboratories testing HMA.
These standardized equipment checks allow all laboratories to conduct thorough,
documented verifications of their equipment. They also allow CDOT to effectively
communicate known equipment calibration concerns to all laboratories.
The checklist that was produced was given to all of the CDOT and private laboratories in
the state which use the Texas gyratory compactor. As part of the investigation,
equipment checks were also performed in many CDOT and private laboratories.
Equipment which was out of calibration was discovered in almost every laboratory
visited.
Once the equipment checks were carried out, persistent between-laboratory diffe"rences
were still found in the reported bulk specific gravities of compacted samples.
Fortunately, there was an immediate reduction in the occurrences of test results which
were so different that they caused emergency meetings to try to find the cause.
By reducing completely unpredictable differences in test results, equipment calibration
made it possible to obtain data which was precise enough to allow further research into
the root cause of the underlying reproducibility problems.
- 8 -
The equipment checks concerning volumetric properties of HMA fell into three
categories:
1) temperatures of ovens and water baths
2) compactor measurements and gage accuracy
3) Rice temperatures and vacuum measurement
The details of Colorado's equipment calibration verification procedure are contained in
Colorado CP .. 1 5101, Verification of Laboratory Equipment Used to Test Bituminous
Mixtures (Appendix 1). As new equipment calibration problems are discovered, new
sections are added to the procedure to instruct all laboratories to check for these
problems.
3.3 Problem Definition
Once equipment calibration errors were reduced to as Iowa level as possible, there
were still differences in the average bulk specific gravity results being reported by
different CDOT laboratories.
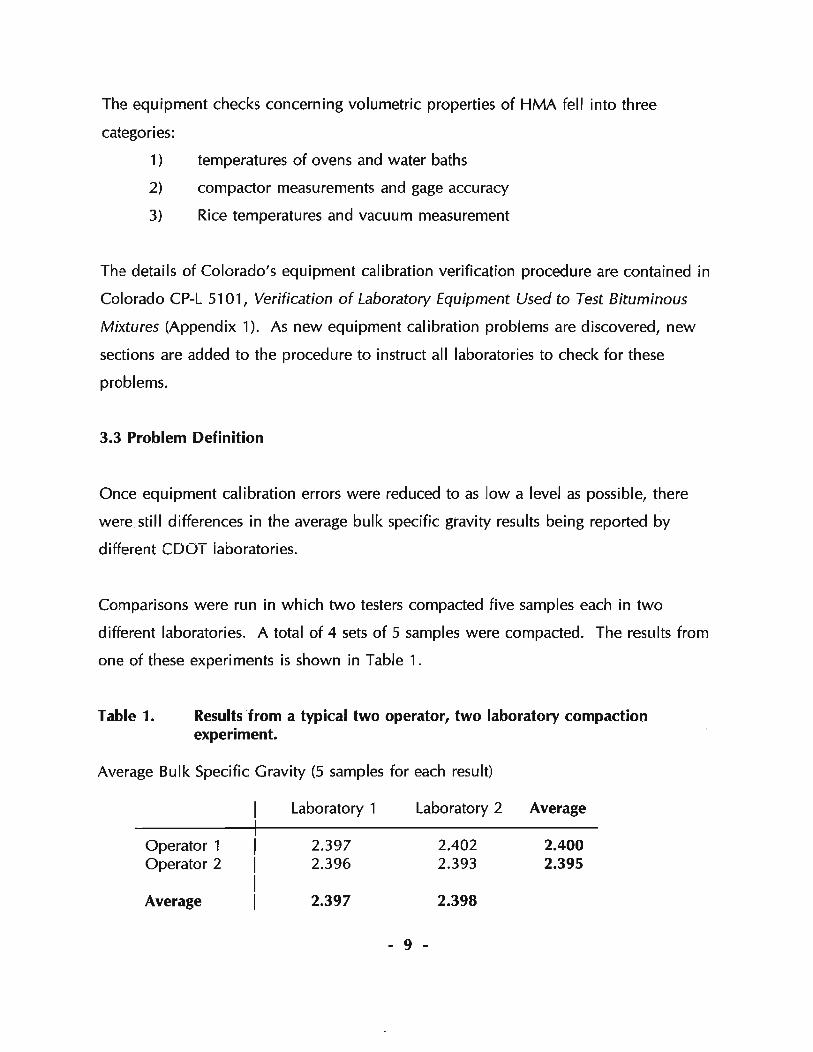
Comparisons were run in which two testers compacted five samples each in two
different laboratories. A total of 4 sets of 5 samples were compacted. The results from
one of these experiments is shown in Table 1.
Table 1. Results from a typical two operator, two laboratory compaction experiment.
Average Bulk Specific Gravity (5 samples for each result)
Operator 1 Operator 2
Average
Laboratory 1
2.397 2.396
2.397
Laboratory 2
- 9 -
2.402 2.393
2.398
Average
2.400 2.395
By examination, it is difficult to determine whether the differences in results were caused
by the laboratory, the operator, or an interaction such as when an operator uses
machines and equipment they are not familiar with.
Fortunately, when the results from different laboratories were matched by the order that
they were compacted and compared using a paired sample t test (Section 2.3), the data
turned out to be statistically indistinguishable. When the results from different operators
were matched by the order that they were compacted and compared using a paired
sample t test, the differences turned out to be statistically significant at the 95 percent
confidence level.
This experiment, as well as others, indicated that it was the operator's compaction style
and not the laboratory equipment which was the cause of the difference in tes,t results.
Next, an effort was made to identify which factors were causing the differences in test
results between operators. To assist in the analysis, the operations required to compact a
sample were divided into the following categories:
1) heating of the loose material to compaction temperature
2) loading of the loose material into the mold
3) operation of the Texas gyratory compactor
4) measurement of the sample's bulk specific gravity
Step one (standardized heating) and step four (standardized measurement of sample bulk
specific gravities) had already been addressed during the equipment calibration phase of
the investigation. These steps were therefore ruled out as causes of differences in the
reported bulk specific gravity measurements.
- 10 -
3.4 Texas Gyratory Compactor Operation Standardization
The compaction process was analyzed first. It was determined that the movement and
timing specified by the procedure could be standardized exactly. A method of
compacting was developed which standardizes every movement made by the operator of
the gyratory compactor. The method uses the sound of the Texas gyratory compactor's
counter mechanism (which produces one click per second) as a metronome which times
the operations required to compact a sample.
The compaction method which was developed and adopted is described in Appendix 2.
When this compaction method was first introduced, it was not popular with experienced
testers since it forced them to slow their operation of the gyratory compactor. This was
necessary to allow novice testers to perform the same operations in the same amount of
time as experienced testers.
Fortunately, operator acceptance rose dramatically once the method was shown to
reduce the differences in test results generated by testers of widely varying experience
levels who were testing material in the same laboratory.
Unfortunately, the compaction method which had been developed with a core group of
operators did not work as well when it was introduced to the rest of the operators in the
state. When laboratories which had not participated in the original compaction
standardization effort were asked to use the new method, the inter-laboratory differences
in sample bulk speCific gravity measurements immediately reappeared. The search for
the cause of the differences continued.
- 11 -
3.5 Loading Procedure Standardization
Another compaction experiment was conducted using two testers who were still
reporting different test results while using the newly standardized compaction method.
Each tester compacted three samples without being observed by the other tester. Three
samples were then compacted while the other tester watched. It was immediately
obvious that the loading techniques which the testers were using to load loose samples
into the mold were very different.
For the last three samples, the testers used the same loading procedure to load their
samples into the mold. The specific gravity results generated by the two operators for
these samples were statistically indistinguishable.
In an effort to identify a standardized loading procedure which would be acceptable to
all testers, a panel of CDOT and private laboratory testers was brought together and
given the task of identifying and testing a loading technique which would:
1) minimize segregation as much as possible.
2) be easily described and performed in a very standard way.
3) be teachable to an inexperienced tester and be correctly done by him or
her an hour later.
4) have high operator acceptance to minimize the chances for intentional
modification of the procedure to increase production or decrease the effort
required.
The panel identified an acceptable method. The method was then tested and refined in
the CDOT Central laboratory during the compaction of approximately SO sets of samples
from various paving projects.
- 12 -
The method which was identified:
1) has very strict limits on the time taken from oven to the first gyration. It
was found that 65 ± 10 seconds was acceptable to both novice and
experienced testers.
2) involves mixing the material and dumping it directly into the mold.
3) allows no rodding or other disturbance of the sample once it has been
placed into the mold.
Minimization of segregation during the loading procedure was thought to be a very high
priority. It was thought that segregation within the sample would have unpredictable
effects on the bulk specific gravity of specimens.
3.6 Tester Training
As soon as the standardized loading and compaction techniques were identified, CDOT
immediately documented the techniques into a formal procedure, CP-L 5105, Standard
Practice for Preparation of Test Specimens of Bituminous Mixtures by Means of Gyratory
Shear Compactor (Appendix 2). All COOT testers were trained in the new procedure
and every private laboratory in Colorado which owned a Texas gyratory compactor was
sent the new procedure. Private laboratory supervisors were also encouraged to send
two or three of their testers to visit the COOT Central laboratory whenever they had the
time. The testers then participated in informal, 30 to 60 minute training sessions in
which they observed and practiced the standardized compaction process.
The training was found to be an essential step in achieving reproducible results. It is
thought that, in the future, more formal tester training will be conducted in a joint effort
between COOT and the Colorado Asphalt Pavement Association.
- 13 -
4.0 RESULTS
To obtain inter-laboratory reproducibility of bulk specific gravities of compacted samples
using the Texas gyratory compactor, certain steps were found to be absolutely necessary.
These steps were:
1) formal, scheduled equipment calibration verification had to be carried out
in all laboratories testing asphalt mixes
2) the timing and procedure for loading of loose mix into the mold had to be
standardized to a very high degree
3) the timing and procedure for compaction had to be standardized to a very
high degree
4.1 Accuracy and Precision of Measurements
Accurate test results should have little or no consistent variation. Consistent variation is
measured by the mean differences between test results from different laboratories.
Precise test results should have low random variation. Random variation is measured by
the standard deviation in the differences between test results from different laboratories.
4.2 Laboratory Comparisons, 1993 and 1994
4.2.1 Accuracy
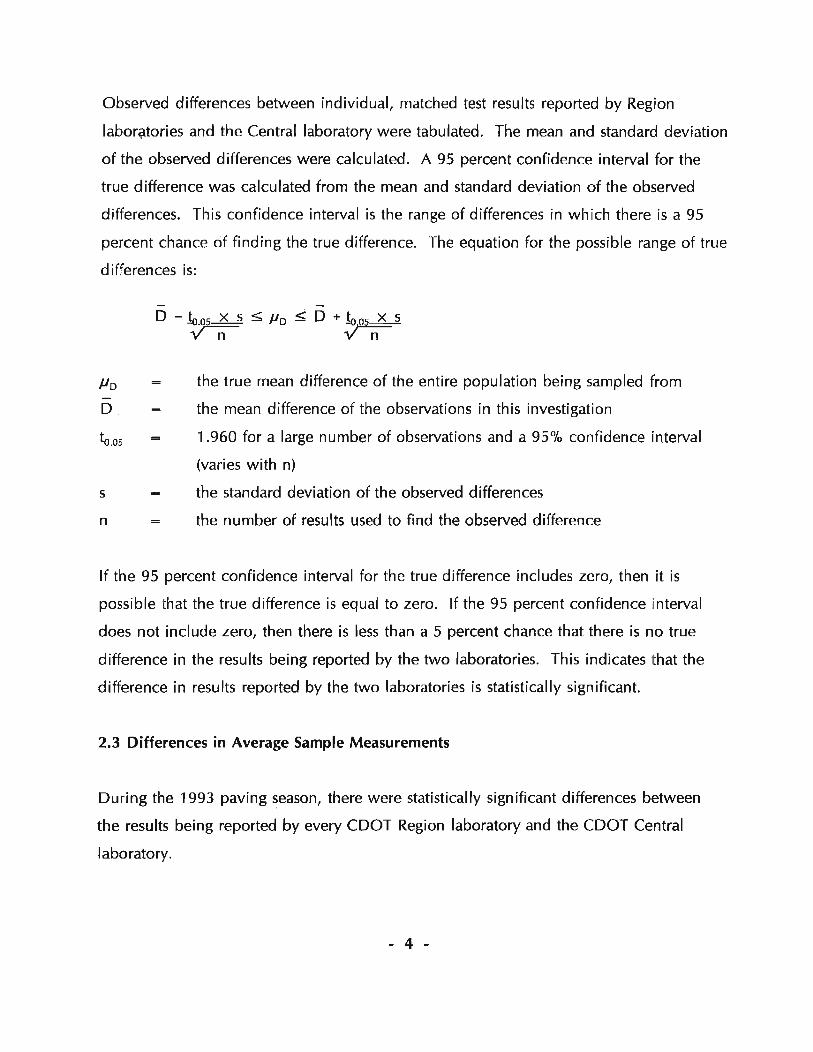
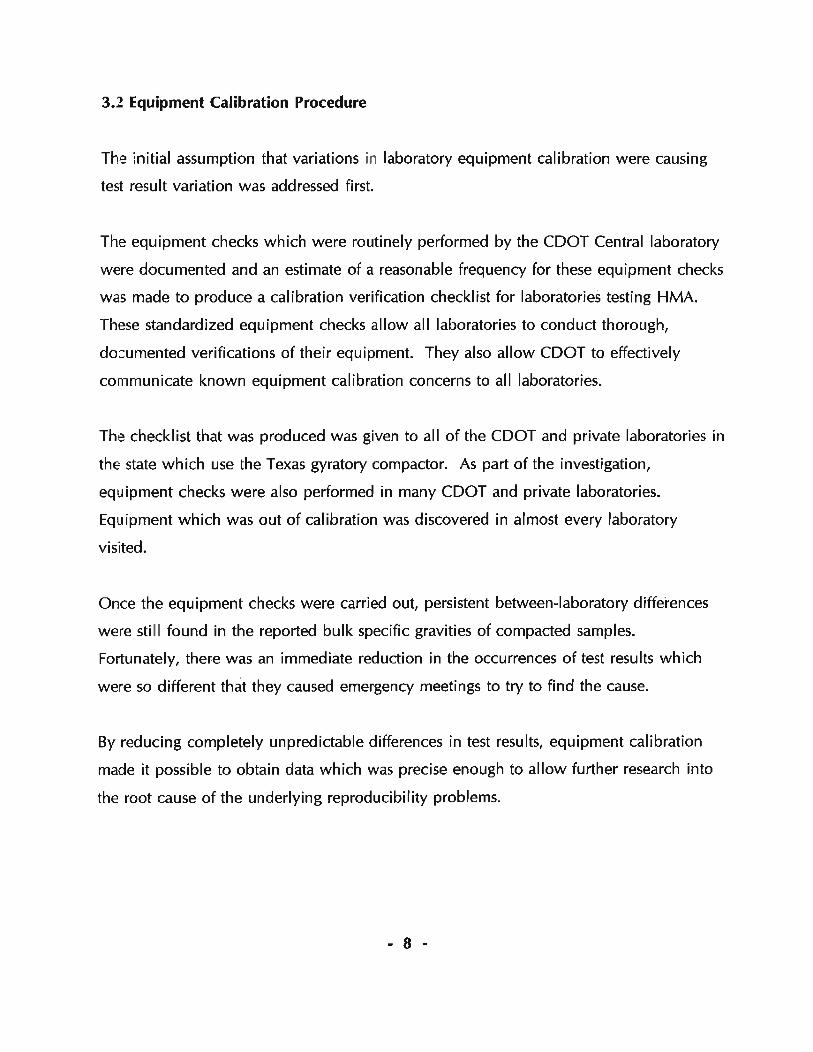
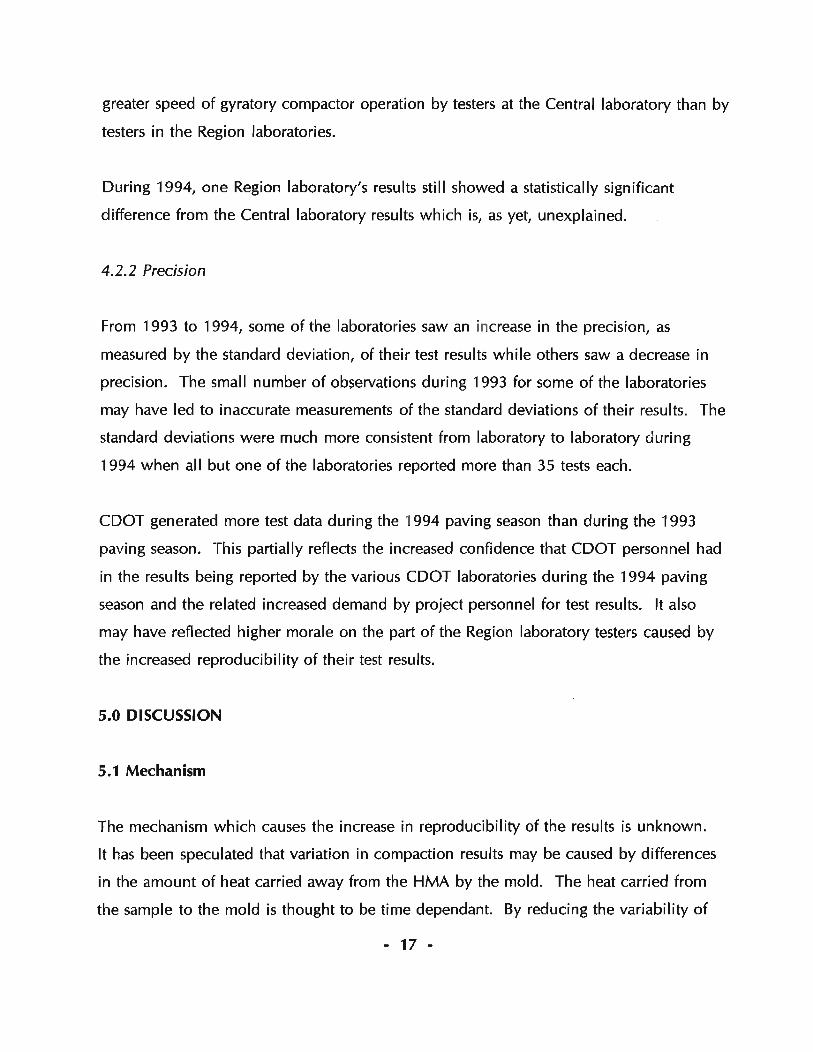
Table 2 and Figure 3 show comparisons of the average differences in bulk specific
gravity results between each of the six CDOT Region laboratories and the CDOT Central
laboratory for the 1993 and 1994 paving seasons. The 1993 results were generated
before the standardization effort had started while the 1994 results were generated after
• 14 -
all of the COOT testers had been trained in the standardized procedures of loading and
compaction.
As Figure 3 shows, there were large increases in the accuracy of the bulk specific gravity
results between 1993 and 1994. Absolute average differences in test results between the
six CDOT Region laboratories and the COOT Central laboratory decreased from a six
laboratory average of 0.016 in 1993 to 0.002 in 1994.
Table 2. Comparison of 1993 and 1994 observed differences in bulk specific gravity measurements reported by the CDOT Central laboratory and the six COOT Region laboratories.
1993 Season 1994 Season
Laboratory Mean Standard Mean Standard Comparison n Difference Deviation n Difference Deviation
Region 1 - Central 18 -0.017 0.018 38 0.000 0.01 2
Region 2 - Central 11 -0.014 0.009 68 0.007 0.010
Region 3 - Central 11 -0.018 0.008 66 0.001 0.01 2
Region 4 - Central 11 -0.020 0.018 43 0.001 0.011
Region 5 - Central 11 -0.016 0.008 19 -0.001 0.018
Region 6 - Central 36 -0.009 * 0.013 * 52 0.002 0.011
* Excludes 15 observations made while the gyratory compactor was known to be malfunction ing.
During 1993, the COOT Central laboratory reported bulk specific gravity results which
were higher than all of the Region laboratories. This may have been caused by the
- 15 -

~
="
93-94 Mean Diffs. in Bulk SpG Results Region - Central Lab, Absolute Value
0.025
Q)
g 0.020 Q) L..
~ .- 0.015 0 C> c% 0.010 c m ~ 0.005
0.000
I I.
Before Standardization
1 2
After Standardization
3 4 5 6 Region Lab
Figure 3: Mean" differences of bulk specific gravities for the 1993 and 1994 paving seasons for six labs
greater speed of gyratory compactor operation by testers at the Central laboratory than by
testers in the Region laboratories.
During 1994, one Region laboratory's results still showed a statistically significant
difference from the Central laboratory results which is, as yet, unexplained,
4.2.2 Precision .
From 1993 to 1994, some of the laboratories saw an increase in the precision, as
measured by the standard deviation, of their test results while others saw a decrease in
precision. The small number of ob~ervations during 1993 for some of the laboratories
may have led to inaccurate measurements of the standard deviations of their results. The
standard deviations were much more consistent from laboratory to laboratory during
1994 when all but one of the laboratories reported more than 35 tests each.
CDOT generated more test data during the 1994 paving season than during the 1993
paving season. This partially reflects the increased confidence that COOT personnel had
in the results being reported by the various CDOT laboratories during the 1994 paving
season and the related increased demand by project personnel for test results. It also
may have reflected higher morale on the part of the Region laboratory testers caused by
the increased reproducibility of their test results.
5.0 DISCUSSION
5.1 Mechanism
The mechanism which causes the increase in reproducibility of the results is unknown.
It has been speculated that variation in compaction results may be caused by differences
in the amount of heat carried away from the HMA by the mold. The heat carried from
the sample to the mold is thought to be time dependant. By reducing the variability of
- 17 -
the heat loss from the sample, the variability in the test results may also have been
reduced.
5.2 Implications for the Superpave Gyratory Compactor
These findings have potential implications for the superpave gyratory compactor
procedure.
Equipment which was out of calibration was discovered in almost every laboratory
which was visited. This points to a need for a standardized laboratory equipment
verification procedure which would be thorough and easy to follow. Laboratories
following the superpave gyratory compactor procedure will need to calibrate their
equipment in a very similar manner to laboratories which use the Texas gyratory
procedure. Following a standardized verification procedure such as CPL 5101 (Appendix
1) makes equipment verification easier and more thorough.
The standardization of the compaction method is not an issue with the superpave
gyratory compactor since the compactor is completely automated.
From CDOT's experience during this investigation, it is thought that the mold heating
and loading procedure for the superpave gyratory compactor should be standardized to a
very high degree at the outset. A loading method which minimizes segregation, has
strict time and temperature specifications, and has high operator acceptance, is critical to
obtaining results which will be repeatable between all laboratories.
5.3 Acceptance of Volumetric Results by Project Personnel
Contractors and project personnel are more likely to use test results which are credible
and repeatable to control the volumetric properties of HBP during production. One
indication of this was the large increase in the number of samples which were tested
- 18 -
during the 1994 paving season over the number tested during the 1993 season.
6.0 CONCLUSIONS
The following conclusions were drawn from this investigation:
1) For the Texas gyratory compactor, compaction test results can be made
repeatable from laboratory to laboratory by standardizing the loading and
the compaction procedure. This investigation found a decrease in average
mean differences of bulk specific gravity results between laboratories from
0.016 or 0.64% air voids before standardization to 0.002 or 0.08% air
voids after standardization.
2) A scheduled, equipment calibration procedure was found to be necessary
to get test result precision in asphalt testing laboratories.
3) The precision and accuracy of test results are affected by the experience
and training of the testers.
4) Continuous follow up of laboratory reproducibility statistics is necessary to
ensure that testing quality is maintained. This may be accomplished by
acceptance testing procedures and round robin testing.
5) The precision of the bulk specific gravity test results (as meas~red by their
standard deviation) did not uniformly increase after procedure
standardization was introduced. The reasons for this are unclear although
limited data from 1993 (before standardization) for many laboratories may
have led to inaccurate measurement of test result standard deviation for
1993's results.
- 19 -
7.0 RECOMMENDATIONS
1) All procedures for compacting HMA samples should have very strict time
and method specifications for loading loose mixture into the mold and for
compaction.
2) Documented equipment calibration should be required frofT! all
laboratories testing HMA.
3) The current loading procedures of SHRP M-002 and AASHTO TP4 should
be examined and unified before they become widely used. It is hoped that
the resulting procedure will take into account the findings of this
investigation.
4) Tester training should be considered as essential in the effort to obtain
inter-Iabora,tory reproducibility of test results. Documentation of tester
training will almost certainly be necessary as voids acceptance is
implemented.
8.0 REFERENCES
1) Matthew Witczak and Chuck Hughes, An Investigative Study of the Colorado
Department of Transportation Asphalt Mixture Design Procedure, Aguirre
Engineers, Englewood, CO, Nov. 1993.
2) Paul Krugler, Maghsoud Tahmoressi, and Dale Rand, Improving the Precision of
Test Methods used in VMA Determination. Journal of the Association of Asphalt
Paving Technologists, Vol 61, 1992, pp 272-303
- 20 -
APPENDIX A
Colorado CP-L 5101, Verification of Laboratory Equipment Used to Test Bituminous
Mixtures, Colorado Department of Transportation, Dec. 1994

CP-L 5101 12/7/94 Page 1
Colorado Procedure L 5101
Method of Test For
Verification of Laboratory Equipment used to Test Bituminous Mixtures
1. Scope
1.1 This method of test covers the verification of laboratory equipment used to test bituminous mixtures and provides documentation that the verification has been done.
2. Referenced Documents
2.1 CP-L Procedures
2.2 AASHTO Standards T 27 Sieve Analysis of Fine and Coarse
Aggregates T 209 Maximum Specific Gravity of Bituminous
Paving Mixtures T 246 Resistance to Deformation and Cohesion
of Bituminous Mixtures by Means of Hveem Apparatus
T 283 Resistance of Compacted Bituminous Mixture to Moisture Induced Damage
2.3 ASTM Standards D 4013 Preparation of Test Specimens of
Bituminous Mixtures by Means of Gyratory Shear Compactor
3. Terminology
3.1 Daily Verification - Verification procedures which are carried out each day the laboratory equipment is used for testing. The verification is
A- l
documented once per month. .
3.2 Weekly Verification Verification procedures which are carried out approximately once per week while the laboratory equipment is being used for testing. The verification is documented once per month.
3.3 Monthly Verification Verification procedures which are carried out approximately once per month while the laboratory equipment is being used for testing. The verification is documented.
3.4 Annual Verification Verification procedures which are carried out approximately once per year. This may be done at the same time as the equipment is being calibrated. The verification is documented.
4. Apparatus
4.1 Thermometers - Conforming to the requirements of ASTM. The thermometers shall be capable of reading 77°F by 0.2°F (25°C by 0.1°C), 140°F by 0.2°F (60°C by 0.1°C), 250°F by 0.5°F (121°C by 0.2°C).
4.2 6" angle plate--machined from aluminum, steel, or plastiC (plexiglass or similar material). The plate should be between 5 in. and 6 in. (12.5 and 15 cm) wide and 2 in. (5 cm) high at the
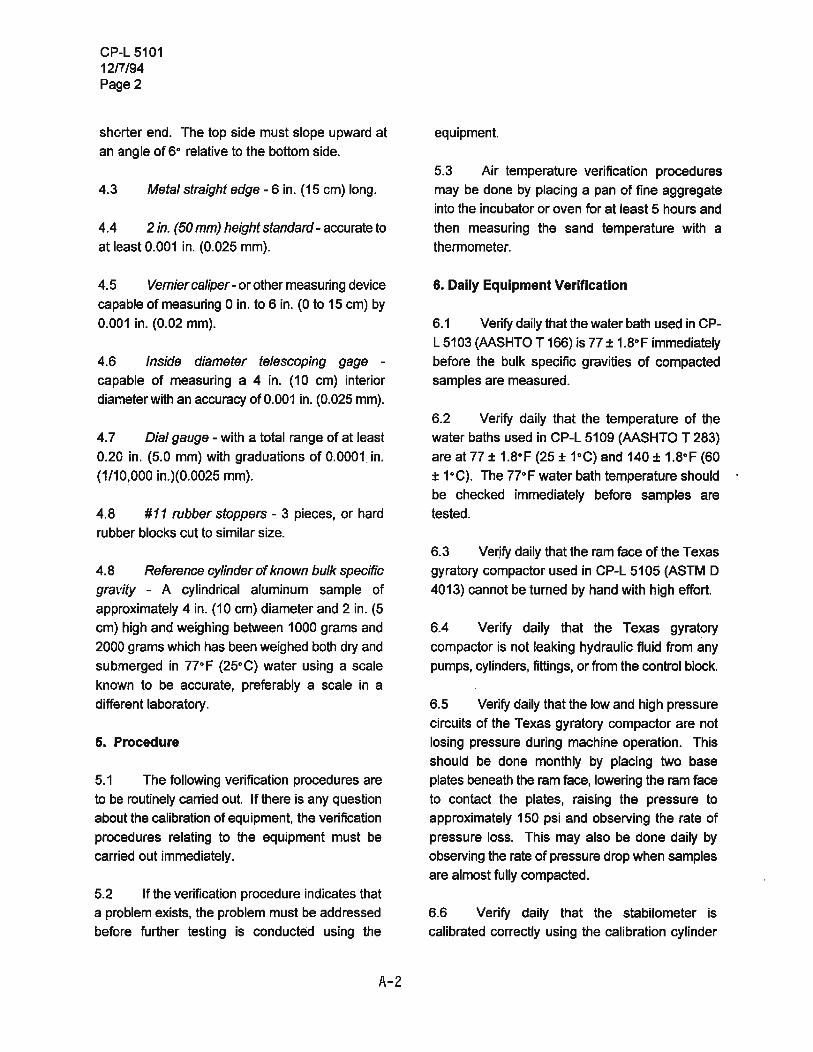
CP-L 5101 1217/94 Page 2
shorter end. The top side must slope upward at
an angle of 6° relative to the bottom side.
4.3 Metal straight edge - 6 in. (15 cm) long.
4.4 2 in. (50 mm) height standard - accurate to at least 0.001 in. (0.025 mm).
4.5 Vernier caliper - or other measuring device
capable of measuring 0 in. to 6 in. (0 to 15 cm) by
0.001 in. (0.02 mm).
4.6 Inside diameter telescoping gage -capable of measuring a 4 in. (10 cm) interior
diameter with an accuracy of 0.001 in. (0.025 mm).
4.7 Dial gauge - with a total range of at least
0.20 in. (5.0 mm) with graduations of 0.0001. in. (1/10,000 in.)(0.0025 mm).
4.8 #11 rubber stoppers - 3 pieces, or hard
rubber blocks cut to similar size.
4.8 Reference cylinder of known bulk specific gra\'ity - A cylindrical aluminum sample of
approximately 4 in. (10 cm) diameter and 2 in. (5 cm) high and weighing between 1000 grams and
2000 grams which has been weighed both dry and
submerged in 77°F (25°C) water using a scale
known to be accurate, preferably a scale in a different laboratory.
5. Procedure
5.1 The following verification procedures are
to be routinely carried out. If there is any question about the calibration of equipment, the verification
procedures relating to the equipment must be carried out immediately.
5.2 If the verification procedure indicates that a problem exists, the problem must be addressed before further testing is conducted using the
A-2
equipment.
5.3 Air temperature verification procedures may be done by placing a pan of fine aggregate into the incubator or oven for at least 5 hours and
then measuring the sand temperature with a
thermometer.
6. Daily Equipment Verification
6.1 Verify daily that the water bath used in CP
L 5103 (AASHTO T 166) is 77 ± 1.8°F immediately before the bulk specific gravities of compacted samples are measured.
6.2 Verify daily that the temperature of the water baths used in CP-L 5109 (AASHTO T 283)
are at 77 ± 1.8°F (25 ± 1°C) and 140 ± 1.8°F (60
± 1°C). The 77°F water bath temperature should be checked immediately before samples are tested.
6.3 Ver.ify daily that the ram face of the :rexas gyratory compactor used in CP-L 5105 (ASTM 0 4013) cannot be turned by hand with high effort.
6.4 Verify daily that the Texas gyratory
compactor is not leaking hydraulic fluid from any pumps, cylinders, fittings, or from the control block.
6.5 Verify daily that the low and high pressure
circuits of the Texas gyratory compactor are not losing pressure during machine operation. This
should be done monthly by placing two base plates beneath the ram face, lowering the ram face
to contact the plates, raising the pressure to approximately 150 psi and observing the rate of
pressure loss. This may also be done daily by observing the rate of pressure drop when samples are almost fully compacted.
6.6 Verify daily that the stabilometer is
calibrated correctly using the calibration cylinder
and procedure specified in CP-L 51 OS (AASHTO
T 24S).
7. Weekly Equipment Verification
7.1 Verify weekly that the oil in the vacuum
pump used if! CP-L 5102 (AASHTO T 209) is not
contaminated with water. Examine the desiccating
crystals and oven dry them when necessary
7.2 Verify weekly that the liquid in the
stabilometer specified in CP-L 510S (AASHTO T 246) is free from air bubbles by rolling the
stabilometer around with the valve oriented
upwards and tapping the stabilometer body with a
rubber mallet.
7.3 Verify at least weekly that the testing
machine settings used to test Hveem stabilities
and Lottman tensile strengths yield testing head
speeds of 0.050 in. (0.13 cm) per minute and 0.20 in. (0.51 cm) per minute respectively. This may be
done by testing a sample which has been
previously tested and is at test temperature.
8. Monthly Equipment Verification
8.1 Verify monthly that the temperature of the
incubator is at 77 ± 1.8aF (25 ± 1aC).
8.2 Verify monthly that the oven thermostats
are maintaining the temperature ofthe 140 ± 5a F
(SO ± 2.8a C) oven and the 250 ± 5a F (121.3 ± 2.8aC) oven.
8.3 Verify monthly that the mercury in the
manometer used to measure the vacuum applied
to samples is free of air bubbles.
8.4 Oven dry the desiccating agent in the
vacuum pump setup (indicating silica gel. S-1S mesh. has been found to work for this purpose).
A-3
CP-L 5101 1217/94 Page 3
8.5 Verify the weights of the flasks used to
measure the maximum specific gravity in CP-L
5102 (AASHTO T 209). The weights are
measured with the flasks full of 77 ± 1 a F (25 ± 0.5a C) water and covered by the same cover plate
that is used during the test. If you are using
temperatures other than 77a F (25a C) in CP-L 5102
(the Rice test). prepare a chart of flask weight vs.
water temperature containing at least 5 points
which should span all of the temperatures you will
be using.
8.S Verify monthly that the top edge of the
stabilometer diaphragm is 3.5 in. (88.9 mm) above
the stabilometer base using a metal ruler. If the
correct base position is not marked on the base
then this measurement must be checked daily.
8.7.1 Verify that the inside diameter of each
Texas gyratory mold being used to compact
Hveem samples is 4.010 ± 0:002 in. (101.85 ± .05 mm) at a point approximately 0.5 in. (12 mm)
above the bottom edge of the mold when the mold
is at room temperature.
8.7.2 Verify that the inside diameter of each
Texas gyratory mold being used to compact
Lottman samples is 4.010 ± O.OOS in. (101.85 ± .15 mm) at a point approximately 0.5 in. (12 mm)
above the bottom edge of the mold when the mold
is at room temperature. Molds which no longer
have the correct inside diameter for Hveem
samples may be used to compact Lottman
samples until they fail to meet the less stringent
diameter specification for molds used to compact
Lottman samples.
8.8 Verify that the Texas gyratory ram face
and bottom plates are not worn by holding a metal
straightedge ruler next to them. Use an allen key
to verify that the hex bolts holding the ram face to
the piston are tightened.
CP-L 5101 1217/94 Page 4
8.9 Verify the ~exas gyratory ram face displacement which corresponds to a single stroke ofthe metering pump (high pressure pump). Use a dial gauge capable of measuring 0.0001 in. (.0025 mm) to confirm that a single stroke of the
metering pump produces a ram face movement of 0.020 in. (0.508 mm). By loading three #11 or #12 rubber stoppers to resist the load and by using mold bases as metal spacers, the ram face movement may be confirmed at a pressure of about 50 psi (345 kPa) gage reading. This verification must be done each time the metering pump is rebuilt.
8.10 Verify that the tilt of the Texas gyratory
compactor mold is 6° by sliding the 6° angle plate beneath the mold track after a sample has been gyrated and before the tilt cam handle has been raised. Check that the wear stripe on the tilt bearings is less than 3/16 in. wide.
8.11 Verify that the gage used to measure the height of samples for CP-L 5106 (AASHTO T 246) is accurate using the 2 in. (50.8 mm) height standard.
8.12 Verify that the freezer temperature is 0 ± 5°F (-18 ± 3°C).
8.13 Verify tha.t all scales are level.
8.14 Verify the scale readings using · a reference weight or weights.
8.15 Verify that the weights of the reference cylinder of known bulk specific gravity when dry and when submerged in 77°F (25°C) water are within 0.2 grams of the weights recorded earlier when using a different scale known to be accurate.
8.16 Verify that the #200 (75 IJ) sieve screen used for aggregate washes is free from holes and is tight.
A-4
8.17 Verify that the sieve screen mesh used for gradations are tight and that there are no holes in the screens.
9. Annual Equipment Verification
9.1 Many of the annual verification steps are best carried out by a certified calibration service.
9.2 Verify the time that aggregate sieving is done by running the sieving adequacy test defined in AASHTO T 27-93.
9.3 Verify the readings of the Texas gyratory compactor's pressure gages by using a load cell which can withstand at least 20,000 Ibs. (89 kN) The load reading on the load cell in Ibs. should be 8.0 times higher than the gage pressure reading in psi.
9.4 Verify the readout on the testing machine for accuracy using a load cell.
9.5 Verify that the outside diameter of the Hveem stabilometer calibration cylinder is 4.000 ± 0.005 in. (101.6 ± 0.13 mm).
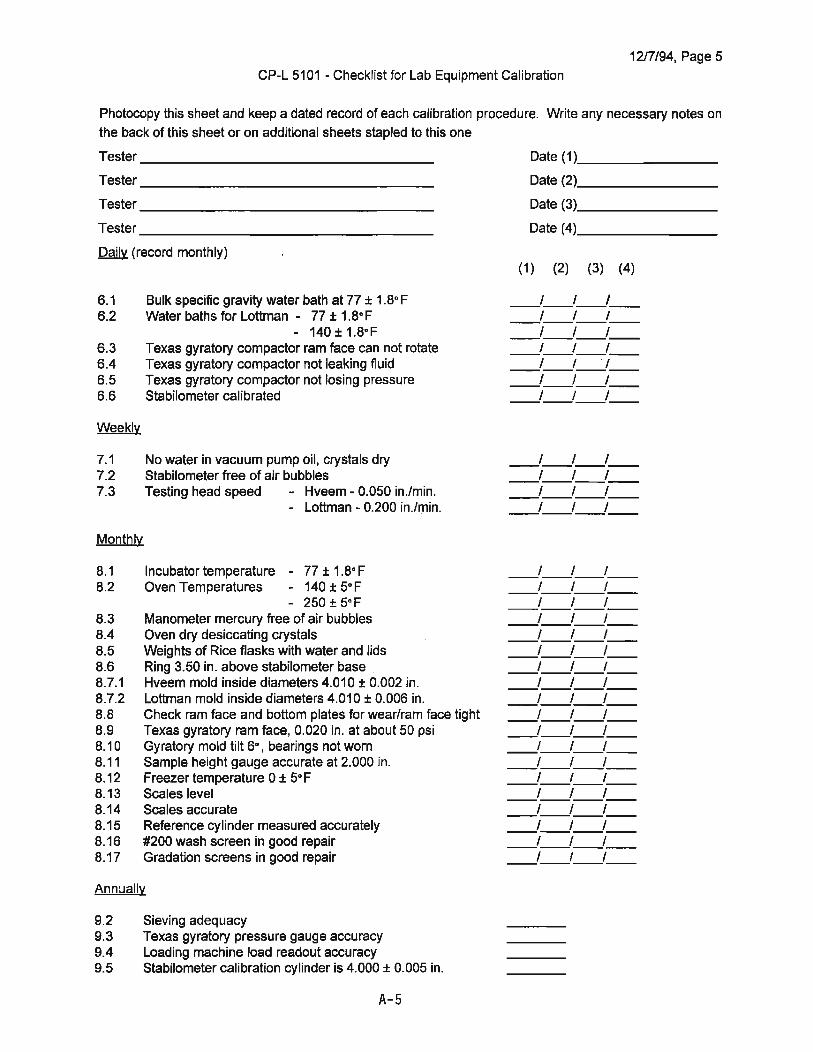
1217'94, Page 5 CP-L 5101 - Checklist for Lab Equipment Calibration
Photocopy this sheet and keep a dated record of each calibration procedure. Write any necessary notes on
the back of this sheet or on additional sheets stapled to this one
Tester ________________ _
Tester ________________ _
Tester ________________ _
Tester _ _______________ _
Daily (record monthly)
6.1 6.2
6.3 6.4 6.5 6.6
Weekly
7.1 7.2 7.3
Monthly
8.1 8.2
8.3 8.4 8.5 8.6 8.7.1 8.7.2 8.8 8.9 8.10 8.11 8.12 8.13 8.14 8.15 8.16 8.17
Bulk specific gravity water bath at 77 ± 1.80 F Water baths for Lottman - 77 ± 1.8°F
- 140 ± 1.8°F Texas gyratory compactor ram face can not rotate Texas gyratory compactor not leaking fluid Texas gyratory compactor not lOSing pressure Stabilometer calibrated
No water in vacuum pump oil, crystals dry Stabilometer free of air bubbles Testing head speed - Hveem - 0.050 in.lmin.
- Lottman - 0.200 in.lmin.
Incubator temperature - 77 ± 1.80 F Oven Temperatures - 140 ± 5°F
- 250 ± 5°F Manometer mercury free of air bubbles Oven dry desiccating crystals Weights of Rice flasks with water and lids Ring 3.50 in. above stabilometer base . Hveem mold inside diameters 4.010 ± 0.002 in. Lottman mold inside diameters 4.010 ± 0.006 in. Check ram face and bottom plates for wear'ram face tight Texas gyratory ram face, 0.020 in. at about 50 psi Gyratory mold tilt 6°, bearings not worn Sample height gauge accurate at 2.000 in. Freezer temperature 0 ± 5°F Scales level Scales accurate Reference cylinder measured accurately #200 wash screen in good repair Gradation screens in good repair
Annually
9.2 Sieving adequacy 9.3 Texas gyratory pressure gauge accuracy 9.4 Loading machine load readout accuracy 9.5 Stabilometer calibration cylinder is 4.000 ± 0.005 in.
A-5
Date (1), ______ _
Date (2). ______ _
Date (3). __ -'--___ _
Date (4) ______ _
(1) (2) (3) (4)
--'--'--'----'--'--'---'-'-'----'--'--'----'--'--'---'-'-'----'--'--'--
-'-'-'---'-'-'----'--'--'---'-'-'-
--'--'--'----'--'--'----'--'--'----'--'--'---'-'-'---'-'-'----'--'--'---'-'-'---'-'-'----'--'--'----'-'--'----'--'--'---'-'-'----'--'--'---'-'-'---'--'--'----'--'--'---'-'-'---'-'-'--
APPENDIX B
Colorado CP-L 5105, Standard Practice for Preparation of Test Specimens of Bituminous
Mixtures by Means of Gyratory Shear Compactor, Colorado Department of
Transportation, Dec. 1994
CP-L 5105 12/7/94 Page 1
Colorado Procedure L 5105
Method of Test For
Standard Practice for Preparation of Test Specimens of Bituminous Mixtures by Means of Gyratory Shear Compactor
ASTM 04013 - 81
1. Scope
1.1 This practice covers the preparation of 10
cm or 4 in. diameter test specimens of bituminous
mixtures containing -22.4 mm (-718 in.) aggregate.
1.2 The values stated in 81 units are to be regarded as standard.
1.3 This standard may involve hazardous materials, operations, and equipment. This
standard does not purport to address all of the
safety problems associated with its use. It is the
responsibility of the user of this standard to
establish appropriate safety and health practices
and determine the applicability of regulatory limitations prior to use.
2. Referenced Document
2.1 ASTM Standard: E 4 Practices for Load Verification of Testing Machines
3. Summary of Practice
3.1 This practice employs gyratory-shearing
action of the mixture at low initial pressures allowing orientation of the aggregate particles to
aid compaction, and then nongyratory compression at high pressure for consolidation
8-1
and shaping.
4. Significance and Use
4.1 The specimens are compacted to simulate
the density, aggregate degradation. and structural
characteristics possible in the actual road surface when proper construction procedure is used in the
placement of the material. The specimens may be
used to determine stability, density, strength, water susceptibility, etc., of bituminous mixtures by
specified test methods.
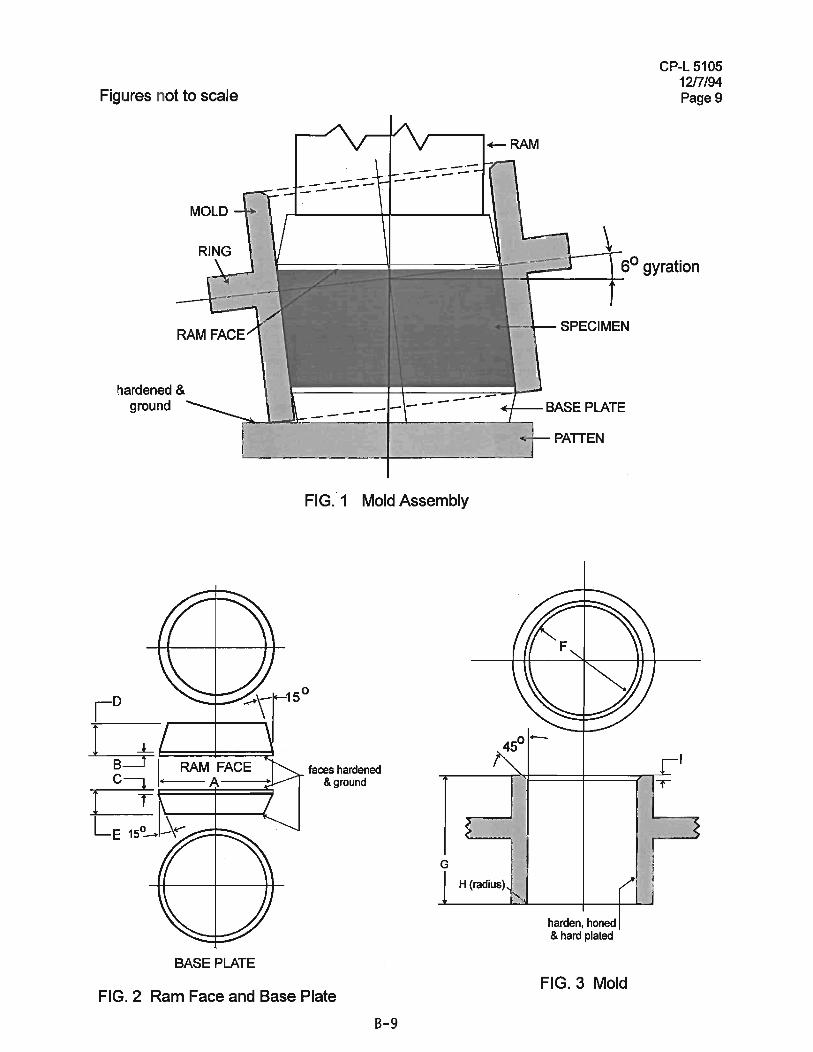
5. Apparatus
5.1 Gyratory-Shear Molding Press:
5.1.1 Press Platen, which is hardened and ground flat.
5.1.2 Hydraulic Compaction Ram, with
non rotating metal face as shown in Figs. 1 and 2. The ram face is hardened and ground flat. The
ram varies the vertical opening between the ram face and the press platen from +11 cm (4.5 in.)
down to less than 2.5 cm (1.0 in.).
5.1.3 Low-Pressure Gage, with automatic valve for high pressure protection and with a capability
of indicating within ±2 kPa (±O.3 psi) the following:
CP-L 5105 1217/94 Page 2
5.1.3.1 Pregyration Stress-219 kPa (31.8 psi on
sample. 50 psi on gage), which is 1779 N (400 Ibf)
total for 10 cm or 4 in. diameter specimens.
5.1 .3.2 End Point Stress-657 kPa (95.3 psi QD.
sample, 150 psi on gage), which is 5338 N (1200
Ibf) total for 10 cm or 4 in. diameter specimens.
5.1 .4 High-Pressure Gage, with capability of
indicating within ±110 kPa (±16 psi) the following:
5.1.4.1 Consolidation Stress-11.0 MPa (1590 psi
on sample. 2500 psj on gage); which is 89 kN (20
000 Ibf) total for 10 cm or 4 in. diameter Hveem
specimens. Lottman specimens shall be
consolidated as specified in section 12.1.2.
NOTE 1 The pregyration stress, the end point
stress and the consolidation stress may be
specjfied to have values other than those given
above. The gage end point stress is found in the
project plans jn Table 403-1 in the project special
provisions. The gage pregYration stress and
consolidation stress corresponding to various end
point stresses are found in Table 1,
TABLE 1 Gauge Pressures for Variable Compaetive Efforts in pSi. and (kPa)
Pregyration End Point Consolidation
Stress Stress Stress
10 (70) 25 (170) 2500 (17,200)
20 (140) 50 (340) 2500 (17,200)
20 (140) 75 (520) 2500 (17,200)
30 (210) 100 (690) 2500 (17,200)
30 (210) 125 (860) 2500 (17,200)
5.1.5 Tilt Mechanism, to cock the mold 6° while
the specimen is under pregyration stress (see
5: 1.3.1). In reverse manner, it squares the mold
axia!ly against the press platen with a smooth
quick motion.
B-2
5.1.6 Gyration Mechanism, to move the mold
about the ram face 12° total angle and produce
gyratory shear compaction of the specimen. An
electric motor drives the gyration mechanism at
approximately 1 s/cycle.
5.1.7 Count Mechanism, to shut the gyration
motor off after three complete cycles and to stop it
in the loading position with an electric brake.
5.1.8 Hydraulic Hand Pump, which meters 0.51
mm (0.020 in.) ram movement, with a smooth
quick motion.
5.2 Gyratory MOld-Rigid metal mold as shown
in Figs. 1 and 3, with a concentric hardened ring
for manipulating gyratory action, and harden~ to
at least 55 HRC honed and hard-plated interior.
5.3 Base Plate-Solid metal plate as shown in
Figs. 1 and 2. Top and bottom surfaces are
hardened and ground flat.
5.4 Wide-Mouth Funnel, approximately 230
mm (9 in.> in diameter and 75 mm (3 in.> deep with
mouth that fits iAsiae conforms to the top inside
edge of the mold.
5.5 Scale or Balance, having at least 4500 g
capacity, sensitive to 0.1 g.
5.8 &~ve a1 SeFeefl A 25 "'''' (1 iR.) sereeR
af 22.4 "'''' (118 iR.) sieve.
5.7 Spatula-A flexible spatula having a blade
about 100 mm (4 in.) long and between 25 mm (1
in.) and 50 mm (2 in.) 29 "'''' (0/4 iR.) wide.
5.8 SpaaR A large sl3eeA wijh a right aAgle
beAa bel't't'eeR tAe Beth'l BRa ABAale.
5.9 Measuring Device--A micrometer dial
assembly or calipers for determining the height of
the specimens to within 0.25 mm CO.01 in.) is
suitable for this purpose.
5.10 Specimen Extrusion Device--A rigid right
cylinder, having a minimum height of 115 mm (4
1/2 in.), and a diameter of approximately 98 mm (3
7/8 in.) to be used as a pedestal to allow an
operator to press a sample from the mold by hand.
wi#!- A converted arbor press or some similar
device or other methods of specimen extrusion
that do not damage the specimen may be used if the specimen cannot be removed from the mold by
b.mJ.d..
5.11 Oven, for specimen mixtures and mold
assemblies having a range from 38 to 175°C
45E}a-G (100 to 350°F aooaF) and thermostatically
controlled to within ±3°C (±5°F).
5.12 Non-Metallic Surface-A non-metallic
tabletop or a square of 1/4" plywood or other
material which thermally inSulates the mold and
base plate from metallic tabletop surfaces.
5.13 Miscel/aneous--Thermometers, tFe'oVels,
gloves, and mixing pans.
6. Materials
6.1 Kerosene.
6.2 Lubricating Oil, lightweight grade.
6.3 Paper Disks, 10.16 cm or4 in. diameter.
7. Test Specimen
7.1 Preparation of Mixture--Prepare the
bituminous mixture in accordance with the
specified test method.
1....1.L Preparation of Plant Produced Samples-Plant produced material shall be heated in a
8-3
CP-L 5105 1217/94 Page 3
loosely covered container only until samples of the
proper weight can be prepared. A minimum of 3
Hveem samples shall be tested.
7.1.2.1 Preparation of Laboratory Produced
Samples--Samples produced in the laboratory
shall be individually batched using dry or oven-dry
aggregates which have been separated into their
component sizes. If lime is added to the dry
aggregates, it shall be hydrated using the amount
of water expected to be added at the plant. The
combined aggregates shall be oven dried for a
minimum of 2 hours before the addition of asphalt
cement. If the moisture loss from the aggregate
sample cayses the aggregate weight to drop below
the target weight enough to cause the actual
asphalt cement content to change by more than
0.05 %, the sample will be discarded. Any
moisture loss will be corrected for by (1)
calculating and reporting the exact percent asphalt
cement content of each sample or (2) adding a
corrected amount of asphalt cement to achieve the
targeted asphalt cement percentage or (3) adding
additional aggregate to bring the sample to the
target weight. A minimum of 2 Hveem samples
shall be tested at each of at least 3 asphalt
contents and the tested asphalt contents shall
span the target void content. Asphalt cement
which is added to the aggregate must be in a
container more than 75% full and covered by a
loose fitting lid to reduce oxidation if it is in the
oven for more than 2 hours.
7.1.2.2 Temperature at Mixing for Laboratorv Produced Samples--the aggregates and asphalt
cement for mixes using normal asphalt cement
shall be heated in an oven having a temperature of
149 ± 3°C (300 ± 5°F) for at least 2 hours before
mixing. The aggregates and asphalt cement for
mixes using rubberized or polymerized asphalt
cement shall be heated in an oven having a
temperature of 163 ± 3°C (325 ± 5° F) for at least
2 hours before mixing.
CP-L 5105 12/7/94 Page 4
7.1 .2.3 Aggregate Mixing of Laboratorv Produced
Samples--Samoles shall be mixed using a
mechanical mixer. Samples shall be mixed until
they are thoroughly coated with a minimum mixing
time of one minute.
7.2 Amount of Mixture--Prepare constant-weighed amounts of bituminous mixture
such that the compacted specimen heights are
within the tolerances of the specified test method. Initial laboratory produced Hveem specimens shall
be prepared with a target aggregate weight of 955
grams. Initial plant produced Hyeem specimens
shall be prepared with a target total weight of 1000
grams. If the specimen heights for Hveem
samples is not in the range of 53.3 ± 2.5 mm (2.1 ± 0.1 in.} the specimen weight shall be corrected.
Specimen heights for Lottman samples shall be
63.5 + 6.5 mm (2.5 + 0.25 in.) and Lottman
specimens shall have an air void content of 7.0 + ~ If an initial specimen height is not within
tolerances, revise the constant weight of subsequent specimens by multiplying the initial
constant weight by the optimum height and
dividing by the initial height as follows:
Revised constant weight
= (initial constant weight) X (optimum height) initial height
7.2.1 Example--The specified height is 2.10 ± 0.10 in. 2.99 ± 9.26 iA. The weight of the initial
specimen is selected to be 1000.0 g, 2599.9 fiI, and it is compacted to 2.32 in. The constant weight for the next and subsequent specimens of this
mixture should be (1000.0 g x 2.10 in.lI2.32 in.: or 905.2 g. E2599.9 fiI l( 2.99 iA.)/-2.a2 iA.; aF 2155.2
§:"
8. Calibration
8-4
8.1 Gage Scales-The scales on the low- and
high-pressure gages may indicate the pressure of
the hydraulic system or the force of the ram.
Distinct pOints on the low pressure gage must be
determined for pregyration stress (5.1.3.1) and end point stress (5.1.3.2), and one point on the
high pressure gage for the consolidation stress
(5.1.4.1). These points are shown in table 1.
8.2 Verification--The low- and high-pressure
gages should be verified annually or whenever the
accuracy. of the gages is in guestion on the
gyratory-shear molding press at the points
determined in 8.1, in accordance with ASIM Method E 4. The ram face displacement
corresponding to one full stroke of the high
pressure pump should be verified monthly using
CP-L 5101.
9. Preparation for Test and Compaction Temperatures
9.1 Mil( ~at fflil( asj:t~alt fflil(tl:lFes t~at eeAtaiA
asj:t~alt eeffieAt aAEi eafflj:taet iAte test sj:teeiFAeAs at a tefflj:teFBb:IFe at 121 ± a9 G E259 ± 69 F).
u...L Compaction temperatures of plant
produced and laboratorv produced samples-Mixtures shall be heated in a forced draft oyen
having temperatures as follows. Mixtures using
normal asphalt cement shall be heated in an oven
having a temperature of 121 ± 3°C (250 ± 5°F).
Hveem mixtures using rubberized or polymerized
asphalt cement shall be heated in an oven having
a temperature of 149 + 3°C (300 ± 50 Ft Lottman
mixtures using rubberized or polymerized asphalt cement shall be heated in an oven having a
temperature of 121 ± 3°C (250 ± 5°F). . The mix
compaction temperatures are the same as the
speCified oven temperatures and have the same
tolerances.
9.1.2 Plant produced samples-shall be heated
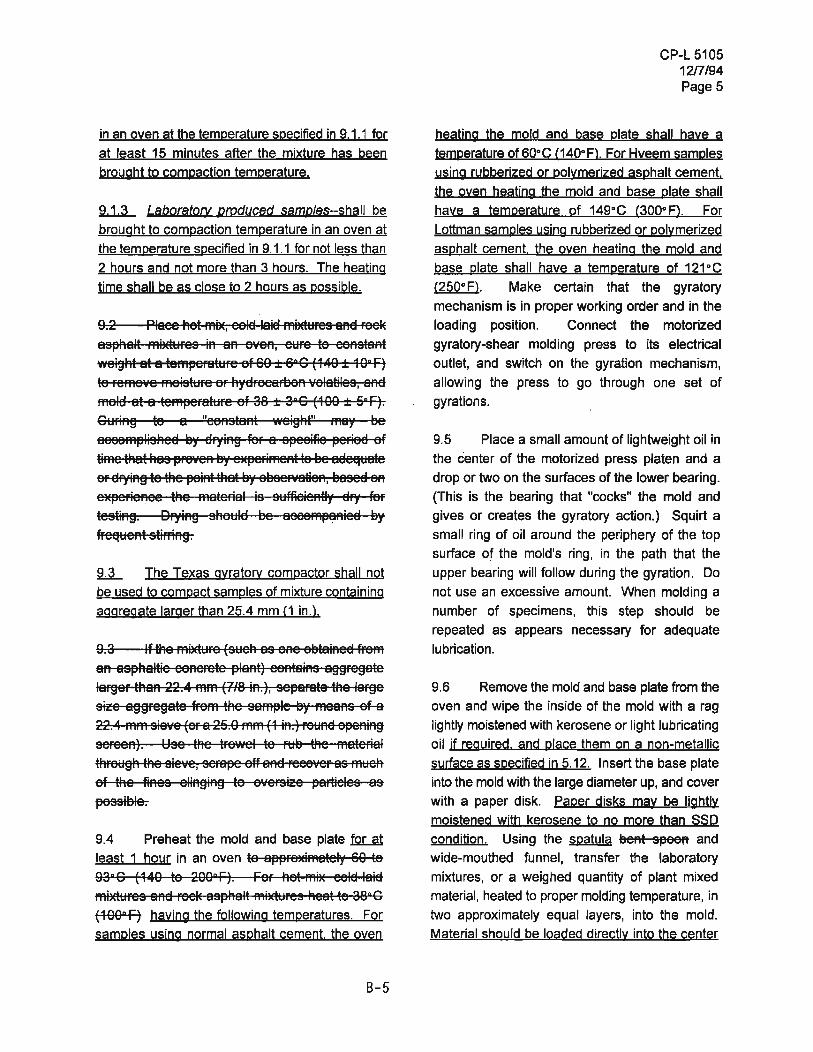
in an oven at the temperature specified in 9.1.1 for
at least 15 minutes after the mixture has been
brought to compaction temperature.
9.1.3 Laboratoty produced samples-shall be
brought to compaction temperature in an oven at
the temperature specified in 9.1.1 for not less than
2 hours and not more than 3 hours. The heating
time shall be as close to 2 hours as possible.
9.2 Plaee ~et IflBE, eela laia lfliKtI::lFes aAa Feel(
asphalt Ifli~dl::lres iA aA eveA, el::lre te eeAstaAt
weig~t at a tefl'tl'eratl::lFe at 68 ± 6°0 (148 ± 10° F)
te FefflaVe fflaistl::lre aF ~yaFeeaFbaA valatiles, SAa
Iflald at a tefflpef8tl::lre af a8 ± 3°0 (100 ± 5°F).
01::1 FiAg te a "eaAstaAt · .... eig~r' Iflsy be
aeealfl"lis~ea by af)'iAg feF a speeitie F'eFiad af
tilfle t~at ~as F'Fe\'ElA by eHF'eFiffleAt te be sdeejl::late
eF aF)'iAg te t~e "aiAt t~at by ebseFVatiaA, based eA
expeFieAee t~e lflateFial is sl::lftieieAtly af)' feF
testiAg. DF)'iAg s~al::lla be aeealflp~Aiea by
ft:eejl::leAt stiFFiAg.
9.3 The Texas gyratorY compactor shall not
be used to compact samples of mixture containing
aggregate larger than 25.4 mm (1 in.l.
9.3 It ~e fflildl::lre (sl::le~ as aAe abtaiAea fFelfl
aA asp~altie eaAeFete "laAij eaAtaiAs sggFegste
ISFgef t~SA 22.4 Ifllfl (11-8 iA.), sepaF8te t~e ISFge
si~e aggregate tFeIfl t~e salflF'le by lfleSAS at S
22.4 Iflfl't sie¥e EaF S 25.9 ffllfl (1 iA.) FeI::lAa apeAiAg
SeFeeA). Use t~e tFe' .... el te Fl::lb t~e IflsteFial
t~Fel::lg~ t~e sie¥e, seF8"e e# SAa FeeaVef as Ifll::le~
at the tiAes eliAgiAg te a'ieFSiz!e l'aFtieles as
I'essible.
9.4 Preheat the mold and base plate .fQL.et
least 1 hour in an oven te aF'"Fexilflately · 60 ta
93"0 (140 te 200°F). Fef ~et Iflix eeld laid
ffiixtl::lres aAa Feelt as,,~alt ffiixttlfes ~eat te 38°0
(108° F) having the following temperatures. For
samples using normal asphalt cement. the oven
8-5
CP-L 5105 1217/94 Page 5
heating the mold and base plate shall have a
temperature ofSO°C (140°Fl. For Hveem samples
using rubberized or polymerized asphalt cement.
the oven heating the mold and base plate shall
have a temperature of 149°C (300°F). For
Lottman samples using rubberized or polymerized asphalt cement. the oyen heating the mold and
base plate shall have a temperature of 121°C
(250° Fl. Make certain that the gyratory
mechanism is in proper working order and in the
loading position. Connect the motorized
gyratory-shear molding press to its electrical
outlet, and switch on the gyration mechanism,
allowing the press to go through one set of
gyrations.
9.5 Place a small amount of lightweight oil in
the center of the motorized press platen and a
drop or two on the surfaces of the lower bearing.
(This is the bearing that "cocks" the mold and
gives or creates the gyratory action.) Squirt a
small ring of oil around the periphery of the top
surface of the mold's ring, in the path that the
upper bearing will follow during the gyration. Do
not use an excessive amount. When molding a
number of specimens, this step should be
repeated as appears necessary for adequate
lu brication.
9.S Remove the mold and base plate from the
oven and wipe the inside of the mold with a rag
lightly moistened with kerosene or light lubricating
oil if required, and place them on a non-metallic
syrface as specified in 5.12. Insert the base plate
into the mold with the large diameter up, and cover
with a paper disk. paper disks may be lightly
moistened with kerosene to no more than SSp
condition. Using the spatula beAt sF'aeA and
wide-mouthed funnel, transfer the laboratory
mixtures, or a weighed quantity of plant mixed
material, heated to proper molding temperature, in
two approximately equal layers, into the mold.
Material should be loaded directly into the center
CP-L 5105 1217/94 Page 6
of the bottom of the mold and efforts should be
made to prevent falling material from hitting the
funnel or sides of the mold. Efforts should be
made to avoid segregation which is noticed as
non-uniform rocky areas on the top and sides of
molded samples. Do not intentionally place fine
matedal on the top or bottom of the sample. Use
the spatula to pre§s down the top of each layer
only enough to prevent loss of aggregate. Do not
rod or saw around the edge of the sample. tJse
t~e sfl'lall s~atl:lla te ffie\'e aAY laFge aggFegate a
sffiall ElistaAee f¥'h'ay freFA aAY SI:lRaee t~at ffil:lst l3e
FAeIEleEI sffieelA. Le'.'el t~e te~ ef eae~ layeF w~ile
~Fe9siAg t~e FABteRal Ele'HAwaFEI wit~ t~e s~eeA.
Place a paper disk on top of the mixture and level
the top surface of the sample by pressing down on
it by hand using the specimen extrusion device.
Be careful to avoid loss of material and
segregation of particles.
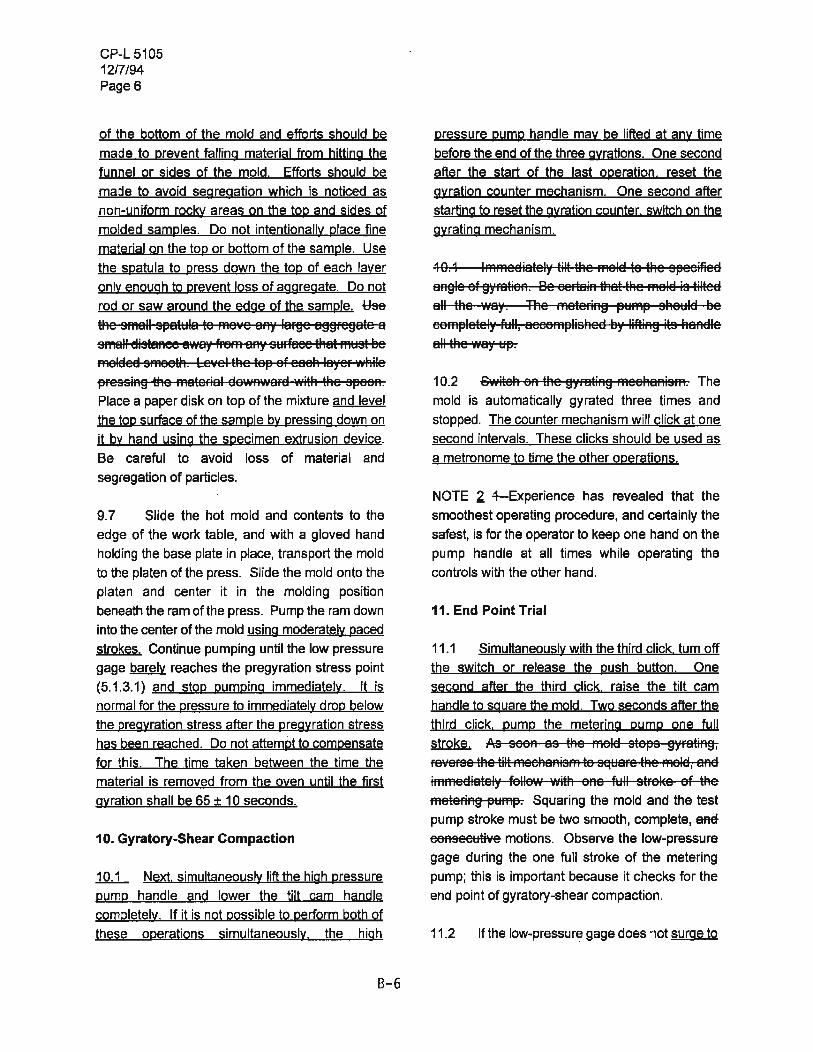
9.7 Slide the hot mold and contents to the
edge of the work table, and with a gloved hand
holding the base plate in place, transport the mold
to the platen of the press. Slide the mold onto the
platen and center it in the molding position
beneath the ram of the press. Pump the ram down
into the center of the mold using moderately paced
strokes. Continue pumping until the low pressure
gage barely reaches the pregyration stress point
(S.1.3.1) and stop pumping immediately. It is
normal for the pressure to immediately drop below
the pregyration stress after the pregyration stress
has been reached. po not attemPt to compensate
for this. The ijme taken between the time the
material is removed from the oven until the first
gyration shall be 65 ± 10 seconds.
10. Gyratory-Shear Compaction
.1Q.L Next, simultaneously lift the high pressure
pump handle and lower the ijlt cam handle
completely. If it is not possible to oerform both of
these ooerations simultaneou§ly. the high
8-6
pressure pump handle may be lifted at any time
before the end of the three gyrations. One second
after the start of the last operation, reset the
gyration counter mechanism. One second after
starting to reset the gyratjon counter. switch on the
gyrating mechanism.
10.1 IffiffieEliately tilt tAe ffialEi te t~e s~eei#ieEl aAgle af gYFatiaA. Be eeFtaiA tAat t~e ffialEi is tiiteEi
all t~e way. T~e ffieteFiAg ~I:lffi~ s~al:llEi l3e
eeffi~letely ftllI, aeeeffi~lis~eEl l3y IiftiAg its ~aAEIle
all t~e ·,·i8Y I:l~.
10.2 S'.¥ite~ aA t~e gYFBtiAg ffiee~aAisffi, The
mold is automatically gyrated three times and
stopped. The counter mechani§m will click at one
Second intervals. These clicks should be used as
a metronome to time the other operations,
NOTE 2. 4--Experience has revealed that the
smoothest operating procedure, and certainly the
safest, is for the operator to keep one hand on the
pump handle at all times while operating the
controls with the other hand,
11. End Point Trial
11.1 Simultaneously with the third click. turn off
the switch or release the push button. One
second after the third click, raise the tilt cam
handle to square the mold, Two seconds after the
third click, pump the metedng pump one full
stroke. As seaA as tAe ffialEi sta~s gYFBtiAg,
Fe'l8FSe t~e tilt FFIElehaAisffi te ~l:laFe ~e FAeIEl, aAEI
ifl'lffieEliately felle'H wit~ aAe ftlil stFeIEe af the
ffieteFiAg ~I:lfl'l~, Squaring the mold and the test
pump stroke must be two smooth, complete, ene eaAseel:lti',e motions. Observe the low-pressure
gage during the one full stroke of the metering
pump; this is important because it checks for the
end point of gyratory-Shear compaction.
11.2 If the low-pressure gage does not surge to
feEIeI:t end point . stress (5.1.3.2), adjust the
pressure to pregyration stress (5.1.3.1), and
repeat the procedure in Section 10. During
molding when the gage comes to rest between
pregyration stress arid end point stress, drop the
pressure to about 10 psi below pregyration stress
and pump back up to it at a moderate speed:
11.2.1 Example-Suppose the pregyration stress
is 345 kPa (50 psi) on the low-pressure gage and
the end pOint stress is 1034 kPa (150 psi). If the
mold is squared and the test pump stroked once,
three types of conditions are possible:
11.2.1.1 The low-pressure gage goes to 414 kPa (60 psi) and drops to 310 kPa (45 psi);
pump to 345 kPa (50 psi) and repeat the
procedure in Section 10.
11.2.1.2 The low-pressure gage reaches 965 kPa (140 psi) and drops to 793 kPa (115 psi);
release the pressure to approximately 276 kPa (40 psi), pump to 345 kPa (50 psi), and repeat the
procedure in Section 10.
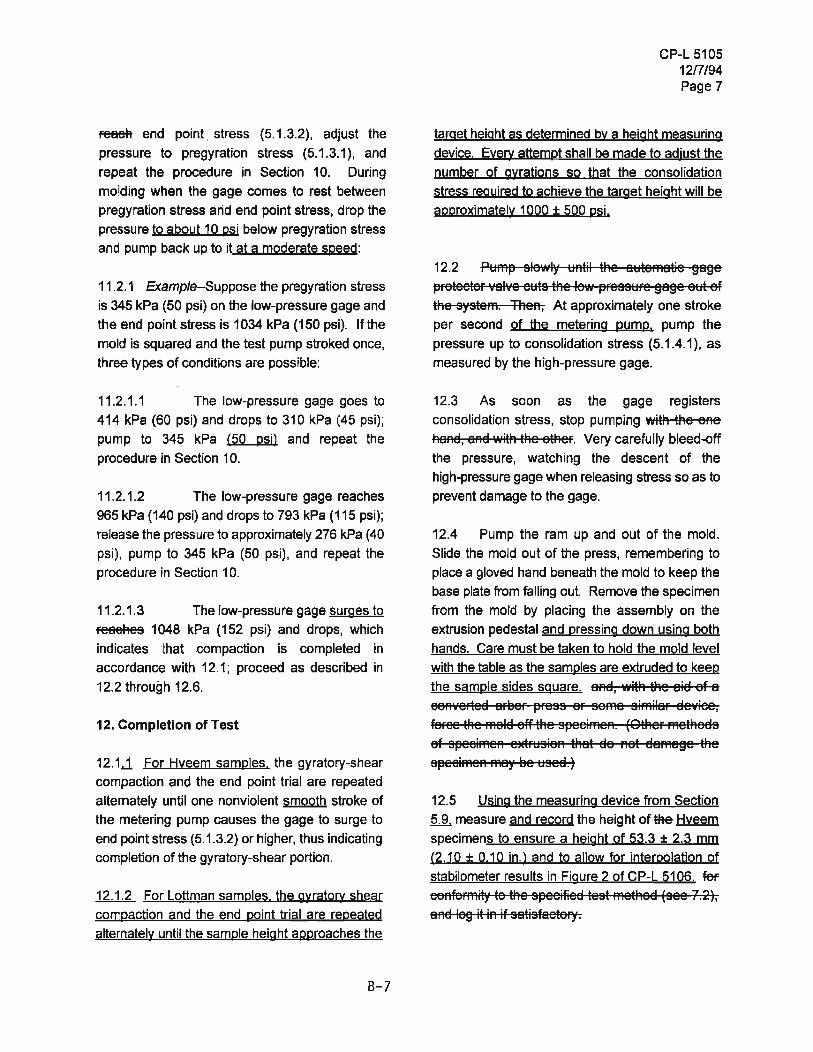
11.2.1.3 The low-pressure gage surges to
reaet:les 1048 kPa (152 psi) and drops, which
indicates that compaction is completed in
accordance with 12.1; proceed as described in
12.2 through 12.6.
12. Completion of Test
12.1.1 For Hveem samples, the gyratory-shear
compaction and the end point trial are repeated altemately until one nonviolent smooth stroke of the metering pump causes the gage to surge to
end point stress (5.1.3.2) or higher, thus indicating
completion of the gyratory-shear portion.
12.1.2 For Lottman samples. the gVratorv shear
compaction and the end point trial are repeated
altemately until the sample height approaches the
8-7
CP-L 5105 1217/94 Page 7
taraet height as determined by a height measuring
device. Eyery attempt shall be made to adiust the
number of gyrations so that the consolidation stress required to achieve the target height will be
approximately 1000 ± 500 psi.
12.2 Pl:Jm~ slowly 1::1 Atil tt:le al::ltomatie gage ~reteeter valve el:Jts the 10000' ~ressl::lre gage al::lt of
tt:le system. Tt:leA, At approximately one stroke per second of the metering pump. pump the
pressure up to consolidation stress (5.1.4.1), as
measured by the high-pressure gage.
12.3 As soon as the gage registers
consolidation stress, stop pumping 'IIitt:l tt:le eAe
haAa, aAa with tt:le etheF. Very carefully bleed-off
the pressure, watching the descent of the high-pressure gage when releasing stress so as to prevent damage to the gage.
12.4 Pump the ram up and out of the mold.
Slide the mold out of the press, remembering to
place a gloved hand beneath the mold to keep the base plate from falling out Remove the specimen
from the mold by placing the assembly on the
extrusion pedestal and pressing down using both
hands. Care must be taken to hold the mold level
with the table as the samples are extruded to keep
the sample sides square. aAa, with tAe aia of a
eaAr/erlea areer ~ress OF same similaF aeviee,
feFee the mala eff the speeimeA. (Ott:leF metheas
of s~eeimeA ~Fl::lsieA that ae Aet aamage tt:le
s~eeimeA may ee I::Isea.)
12.5 Using the measyring device from Section 5.9, measure and record the height of the Hveem
specimens to ensure a height of 53.3 ± 2.3 mm
(2.10 ± 0.10 in.) and to allow for interpolation of
stabilometer results in Figure 2 of CP-L 5106. fer: eeAfermity to tI=Ie speeifiea test metRaa (see 7.2),
aAa lag itiA if satisfaetol)'.
CP-L 5105 12/7/94 Page 8
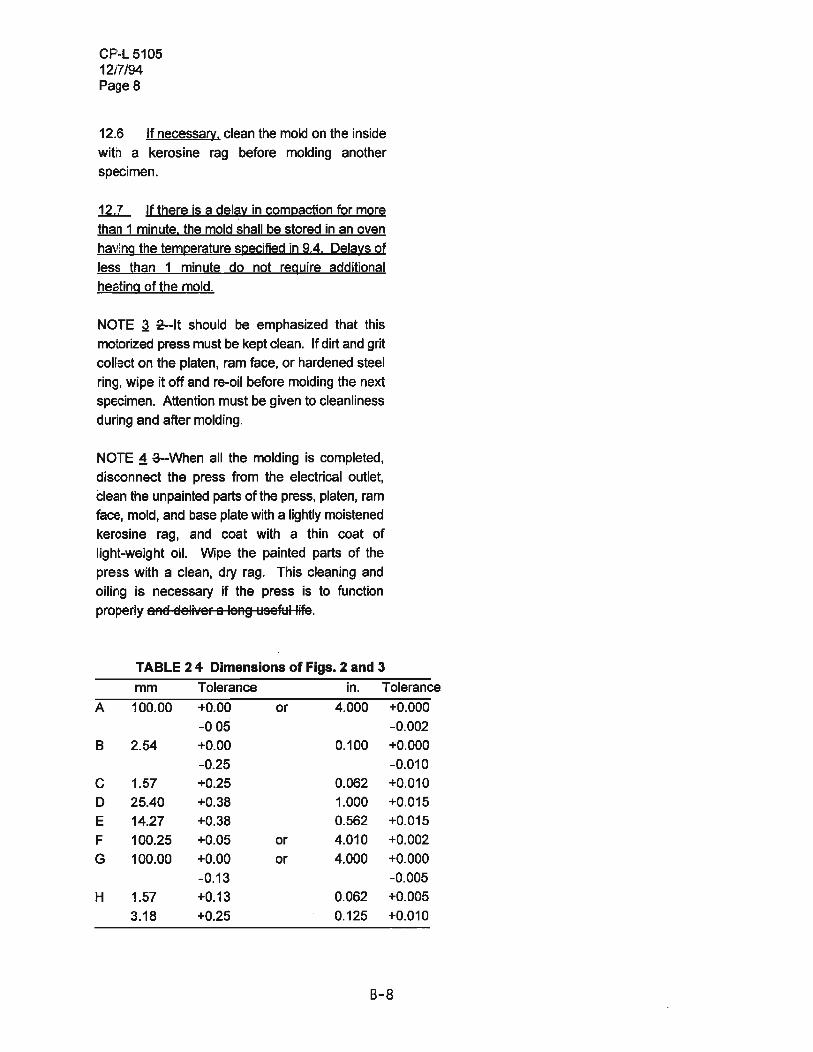
12.6 If necessary. clean the mold on the inside
with a kerosine rag before molding another
specimen.
12.7 If there is a delay in compaction for more
than 1 minute. the mold shall be stored in an oven having the temperature specified in 9.4. Delavs of
less than 1 minute do not require additional
. heating of the mold.
NOTE ~ 2---lt should be emphasized that this
motorized press must be kept clean. If dirt and grit collect on the platen, ram face, or hardened steel
ring, wipe it off and re-oil before molding the next
specimen. Attention must be given to cleanliness
during and after molding.
NOTE ~ 3-When all the molding is completed,
disconnect the press from the electrical outlet,
dean the unpainted parts of the press, platen, ram face, mold, and base plate with a lightly moistened
kerosine rag, and coat with a thin coat of light-weight oil. Wipe the painted parts of the
press with a clean, dry rag. This cleaning and
oiling is necessary if the press is to function
properly BREI Eleli'teF a leRg l:.IseftJl life.
TABLE 24- Dimensions of Figs. 2 and 3
mm Tolerance in, Tolerance
A 100,00 +0,00 or 4.000 +0.000
-005 -0.002
B 2.54 +0.00 0.100 +0.000
-0.25 -0.010
C 1.57 +0.25 0.062 +0.010
D 25.40 +0.38 1.000 +0.015
E 14.27 +0.38 0.562 +0.015
F 100.25 +0.05 or 4,010 +0.002
G 100.00 +0.00 or 4.000 +0.000
-0.13 -0.005
H 1.57 +0.13 0.062 +0.005
3,18 +0.25 0.125 +0.010
8-8
Figures not to scale
hardened & ground
BASE PLATE
--- -----
~RAM
CP-L 5105 12n/94 Page 9
\L------lJ------=,.,\..----".-:---=t-, 60 gyration
FIG. 1 Mold Assembly
faces hardened & ground
G
.---'1--- SPECIMEN
! H (radiUS)-l"
harden, honed & hard plated
FIG. 3 Mold FIG. 2 Ram Face and Base Plate
B-9