Embed Size (px)
Citation preview
Factors affecting savanna tree sapling
recruitment
Snehalatha Vadigi
A thesis submitted in partial fulfillment of the academic requirements
for the degree of
Doctor of Philosophy
School of Life Sciences
College of Agriculture, Engineering and Science
University of KwaZulu-Natal
Pietermaritzburg
Supervisor: Prof. David Ward
January 2013
i
Preface
The research presented in this thesis was carried out at the School of Life Sciences (SLS)
of the University of KwaZulu-Natal (UKZN) at Pietermaritzburg, South Africa, from 2009 to
2012, under the supervision of Professor David Ward.
The thesis, submitted in candidature for the Degree of Philosophy (Ph.D.) is the product
of the candidate‟s unaided investigations and writings, with due acknowledgements and credit
given and cited in appropriate sections of the text, and original in substance, not having been
submitted in whole or in part to be examined for any degree, nor is it concurrently being
submitted in candidature for any other degree.
The thesis is presented in a manuscript-based format. Except the Introduction (Chapter 1)
and Conclusion (Chapter 5), each manuscript (or data chapter) follows the format of the journal
where it has been submitted for publication. As a result, the thesis will not follow a consistent
format. Tables and figures have been provided at the end of each paper (or data chapter) as they
were submitted to the respective journal. Some overlaps in the introduction and method section
of several chapters were unavoidable.
Snehalatha Vadigi (Candidate)
7th
January 2013
I certify that above statements are true:
Prof. David Ward (Supervisor)
7th
January 2013

ii
College of Agriculture, Engineering and Science
Declaration 1: Plagiarism
I, the undersigned, hereby declare that the work contained in this dissertation is my
original work and that it has not previously in its entirety or in part been submitted at any
university for a degree
The research reported in the thesis, except where otherwise indicated, is my original
research
This thesis has not been submitted for any degree or examination at any other university
This thesis does not contain other person‟s writing, unless specifically acknowledged as
being sourced from other researchers. Where other written sources have been quoted,
then:
Their words have been re-written but the general information attributed to them has been
referenced.
Where their exact words have been used verbatim, then their writing has been placed in
italics and inside quotation marks, and referenced.
This thesis does not contain text, graphics or tables copied and pasted from the internet,
unless specifically acknowledged, and the source being detailed in the thesis and in the
Reference sections.
Snehalatha Vadigi (Candidate)
7th
January 2013

iii
Declaration 2: Publications
Details of contributions to publications that form part and/or include research presented in this
thesis
Publication 1: Published in Plant Ecology
Vadigi, S & Ward, D, (2012) Fire and nutrient gradient effects on the sapling ecology of four
Acacia species in the presence of grass competition. Plant Ecology 213: 1793-1802. DOI:
10.1007/s11258-012-0134-1
Author contributions: SV conceived the paper with DW. SV carried out the experiment,
collected and analysed the data as well and wrote the paper while DW contributed valuable
comments to the manuscript.
Publication 2: Submitted to Ecosphere
Vadigi, S & Ward, D, (2012) Shade, nutrients and grass competition are important for tree
sapling establishment in a humid savanna
Author contributions: SV conceived the paper with DW. SV carried out the experiment,
collected and analysed the data and wrote the paper while DW contributed valuable comments to
the manuscript.
Publication 3: Submitted to Functional Ecology
Vadigi, S & Ward, D, (2012) Herbivory effects on saplings are influenced by nutrients and
grass competition in a humid South African savanna
Author contributions: SV conceived the paper with DW. SV carried out the experiment,
collected and analysed the data and wrote the paper while DW contributed valuable comments to
the manuscript.
Snehalatha Vadigi
7th
January 2013

iv
Dedication
Father, my strength.

v
Abstract
Savannas are globally important ecosystems characterized by the coexistence of trees and
grasses. Woody plants, which are slow-growing dominant life forms, influence the physiognomic
structure and function of savanna ecosystems. Their density and distribution provides sustenance
to a vast and unique savanna biodiversity, by forming a major source of food material to large
mammalian herbivores, sheltering them and through their facilitation of diverse plant species.
Savanna tree existence is strongly affected by factors that determine their sapling
recruitment. We defined „sapling‟ as a young tree, in the first season of its growth, which does
not depend on cotyledonary reserves (=seedling stage) and relies on external resources to grow
further. Sapling recruitment may strictly be defined as the progression of a young plant from
seedling to sapling stage. However, we believe that savanna tree saplings, present within the
grass layer in the initial years of their growth, are equally vulnerable to environmental stresses.
This study examines the factors affecting tree sapling establishment in a humid savanna (1250
mm mean annual precipitation). Additionally, the effects of fire were tested in a greenhouse
experiment. Dominant species from humid savannas (> 1000 mm MAP), Acacia karroo, Acacia
sieberiana, Schotia brachypetala and Strychnos spinosa, and mesic savannas (approx. 750 mm
MAP), Acacia nigrescens, Acacia tortilis, Colophospermum mopane and Combretum
apiculatum, were studied. In this thesis I examined the effects of resource availability (water,
nutrients and light), disturbances (fire and herbivory) and competition (grass) on the sapling
ecology of these species. Sapling recruitment and growth were assessed in terms of survival and
aboveground growth responses, i.e. total biomass, stem growth rates (used as proxy measures for

vi
assessing persistence) and leaf biomass proportion (important for producing root reserves
necessary to resprout).
I studied the effects of fire and a nutrient gradient on survival and growth of four Acacia
species in the presence of grass competition, in a controlled greenhouse experiment. Generally,
Acacias invest in defenses after herbivory. I also determined their physical and chemical defense
investments in this experiment. Sapling survival was not influenced by nutrients but highly
varied among the species due to fire, indicating that fires may have a differential effect on
species composition at a landscape scale. Intermediate levels of nutrients were found to be
beneficial for sapling growth than high and low levels. This may be due to an increase in grass
competition at higher levels of nutrients. Fires did not have a positive influence on sapling
defence investment.
To evaluate the relative importance of resource availability on sapling tree recruitment
and its interactions with grass competition, I tested the effects of water (frequent irrigation vs.
rainfall), shade (presence vs. absence), nutrients (addition vs. no addition) and grass competition
(presence vs. absence) on sapling survival and growth under controlled field conditions in a
humid South African savanna. Treatments did not have an effect on sapling survival, indicating
that mortality is not defined by resource availability and grass competition in humid savannas.
Shade had the greatest negative effect on sapling growth, suppressing the beneficial effects of
nutrients and absence of grass competition. Nutrient limitation and grass competition had a
relatively small influence on savanna sapling growth. Frequency of water availability had no
effect on sapling growth, perhaps owing to high rainfall experienced over the experimental

vii
period. Therefore, canopy shade can be considered to be an important driver of tree dynamics in
humid savannas with some degree of influence by nutrient availability and grass competition.
The effects of clipping (i.e. simulated herbivory of grass and tree saplings) as influenced
by nutrient availability and grass competition were examined on sapling survival and growth of
all study species in a humid savanna. None of the treatments had an effect on sapling survival.
This signifies that herbivory alone cannot significantly decrease plant density in humid savannas.
However, tree saplings grew taller with a reduction in diameter and overall biomass, implying
that saplings may become more susceptible to fires after herbivory. Nutrient addition and grass
competition in general had a positive and negative effect, respectively, on sapling growth. This
response was prominent in the stem length growth rates of defoliated saplings of one humid and
two mesic species. These results imply that clipping (or herbivory) is the major factor reducing
sapling vigour to establish, but is affected by both grass competition and nutrient availability.
This study shows that fire has a differential effect on sapling survival of different species,
particularly between humid savanna species. Light interception among all other resources limits
the recruitment of saplings into adult size classes. Clipping, nutrient availability and grass
competition had a relatively small direct effect, but may interact with other factors to alter
sapling establishment dynamics. Wet-season droughts in humid savannas are not a hindrance to
tree establishment because sapling survival was not dependent on frequency of rainfall. Thus, in
humid savannas, fires can have a major impact on tree species density and composition while
canopy shade has a very high potential to alter tree distribution.

viii
Table of Contents
PREFACE ..................................................................................................................... I
DECLARATION 1: PLAGIARISM ................................................................................... II
DECLARATION 2: PUBLICATIONS ............................................................................... III
DEDICATION .............................................................................................................. IV
ABSTRACT .................................................................................................................. V
TABLE OF CONTENTS .............................................................................................. VIII
LIST OF FIGURES ....................................................................................................... XI
LIST OF TABLES ....................................................................................................... XIV
ACKNOWLEDGEMENTS ........................................................................................... XVII
CHAPTER 1: INTRODUCTION ........................................................................................ 1
Savanna definition and distribution ....................................................................................... 1
Climate and types of savanna ................................................................................................ 1
Importance of tree cover in savannas..................................................................................... 3
Determinants of tree cover in savannas – Sapling establishment .......................................... 4
Factors affecting tree sapling establishment .......................................................................... 5
Frequent rainfall / water availability .............................................................................. 5
Light interception / shade ............................................................................................... 6
Soil nutrient availability ................................................................................................. 7
Grass competition ........................................................................................................... 7
Fire .................................................................................................................................. 8
Herbivory ........................................................................................................................ 9
Aims and outline of the thesis .............................................................................................. 10
References ............................................................................................................................ 11
CHAPTER 2: FIRE AND NUTRIENT GRADIENT EFFECTS ON THE SAPLING ECOLOGY OF
FOUR ACACIA SPECIES IN THE PRESENCE OF GRASS COMPETITION* ............................24
Abstract ................................................................................................................................ 25
Introduction .......................................................................................................................... 26
Materials and methods ......................................................................................................... 29
Study design ................................................................................................................. 29
Sapling development and transplantation ..................................................................... 30
Nutrient treatment ......................................................................................................... 31
Fire treatment ............................................................................................................... 32
Growth variables .......................................................................................................... 32
ix
Defence variables ......................................................................................................... 33
Data analysis ................................................................................................................. 34
Results .................................................................................................................................. 34
Sapling survival ............................................................................................................ 34
Growth and defence responses ..................................................................................... 35
Discussion ............................................................................................................................ 36
Conclusions .......................................................................................................................... 38
Acknowledgements .............................................................................................................. 39
References ............................................................................................................................ 39
CHAPTER 3: SHADE, NUTRIENTS AND GRASS COMPETITION ARE IMPORTANT FOR TREE
SAPLING ESTABLISHMENT IN A HUMID SAVANNA .......................................................52
Abstract ................................................................................................................................ 53
Introduction .......................................................................................................................... 54
Methods................................................................................................................................ 58
Study site ...................................................................................................................... 58
Experimental design and treatments ............................................................................. 60
Sapling development and transplanting ....................................................................... 63
Data collection and compilation ................................................................................... 64
Statistical analysis ........................................................................................................ 65
Results .................................................................................................................................. 67
Relative growth rate of sapling stem length ................................................................. 67
Relative growth rate of sapling basal stem diameter .................................................... 68
Sapling dry biomass ..................................................................................................... 68
Proportion leaf to sapling dry biomass ......................................................................... 69
Acacia nigrescens ......................................................................................................... 69
Sapling survival ............................................................................................................ 70
Sapling growth ............................................................................................................. 71
Water ..................................................................................................................... 71
Shade ..................................................................................................................... 72
Nutrients ................................................................................................................ 74
Grass competition ................................................................................................. 75
Conclusions .......................................................................................................................... 76
Acknowledgements .............................................................................................................. 77
Literature cited ..................................................................................................................... 78
List of figures ....................................................................................................................... 91
Supplemental material ....................................................................................................... 105

x
CHAPTER 4: HERBIVORY EFFECTS ON SAPLINGS ARE INFLUENCED BY NUTRIENTS AND
GRASS COMPETITION IN A HUMID SOUTH AFRICAN SAVANNA .................................114
Summary ............................................................................................................................ 115
Introduction ........................................................................................................................ 117
Materials and Methods ....................................................................................................... 121
Study site .................................................................................................................... 121
Experimental design and treatments ........................................................................... 122
Sapling development and transplanting ..................................................................... 124
Data collection and compilation ................................................................................. 125
Statistical analysis ...................................................................................................... 126
Results ................................................................................................................................ 128
Relative growth rate in stem length ............................................................................ 128
Relative growth rate in stem basal diameter .............................................................. 130
Allocation trade-off between stem length and diameter ............................................ 131
Sapling dry biomass ................................................................................................... 131
Proportion of leaf to sapling dry biomass .................................................................. 132
Discussion .......................................................................................................................... 132
Sapling survival .......................................................................................................... 132
Effects of clipping on sapling growth ........................................................................ 133
Effects of nutrients on sapling growth ....................................................................... 134
Effects of grass competition on sapling growth ......................................................... 135
Synthesis ............................................................................................................................ 136
Acknowledgements ............................................................................................................ 138
References .......................................................................................................................... 138
Supporting information ...................................................................................................... 162
CHAPTER 5: CONCLUSIONS .....................................................................................170
General discussion ............................................................................................................. 170
Research summary and specific future directions ............................................................. 172
Interpretation and further general research directions ....................................................... 176
References .......................................................................................................................... 177
APPENDIX I: TABLES OF BIOLOGICAL RESULTS ........................................................184
APPENDIX II: TABLES OF CORRELATION MATRICES .................................................204

xi
List of Figures
CHAPTER 2: FIRE AND NUTRIENT GRADIENT EFFECTS ON THE SAPLING ECOLOGY
OF FOUR ACACIA SPECIES IN THE PRESENCE OF GRASS COMPETITION*
Fig. 1 Mean (+ SE) of the post-fire ratio of final-initial relative growth rate of stem height
(RGRh) in mm mm-1
week-1
to final-initial relative growth rate of stem basal diameter
(RGRd) in mm mm-1
week-1
of Acacia saplings with and without fire treatment ………...47
Fig. 2 Mean (+ SE) of the post-fire growth responses of Acacia saplings with and without fire
treatment. a Final log10 transformed root dry biomass in mg. b Final square root-
transformed shoot dry biomass in mg …………………………………………………….48
Fig. 3 Mean (+ SE) grass dry biomass in g, showing the effect of different levels of nutrients
with and without fire treatment …………………………………………………………...49
Fig. 4 Mean (+ SE) of the post-fire, ratio of final-initial relative growth rate of stem height
(RGRh) in mm mm-1
week-1
to final-initial relative growth rate of stem basal diameter
(RGRd) in mm mm-1
week-1
of A. nigrescens, showing the effect of different levels of
nutrients (including the data from individuals treated with fire) …………………………50
Fig. 5 Mean (+ SE) log10 transformed leaf CT concentrations of A. karroo, showing the effect of
different levels of nutrients without any fire treatment …………………………………...51
CHAPTER 3: SHADE, NUTRIENTS AND GRASS COMPETITION ARE IMPORTANT FOR
TREE SAPLING ESTABLISHMENT IN A HUMID SAVANNA
Fig. 1 Mean (± 1SE) relative growth rate of stem length (RGRL) values of (a) humid and (b)
mesic species showing the effects of shade ……………………………………………….91
Fig. 2 Mean (± 1SE) relative growth rate of stem length (RGRL) values of (a) humid and (b)
mesic species showing the effects of shade and nutrients. To be read as a two-way
interactive effect of shade and nutrients on RGRL of each species separately …………....91
Fig. 3 Mean (± 1SE) relative growth rate of stem length (RGRL) values of (a) humid and (b)
mesic species showing the effects of shade and grass. To be read as a two-way interactive
effect of shade and grass on RGRL of each species separately …………………………....91
Fig. 4 Mean (± 1SE) relative growth rate of stem basal diameter (RGRD) values of (a) humid and
(b) mesic species showing the effects of shade ……………………………………….......91

xii
Fig. 5 Mean (± 1SE) relative growth rate stem basal diameter (RGRD) values of (a) humid and
(b) mesic species showing the effects of shade and nutrients. To be read as a two-way
interactive effect of shade and nutrients on RGRD of each species separately …………....92
Fig. 6 Mean (± 1SE) relative growth rate of stem basal diameter (RGRD) values of (a) humid and
(b) mesic species showing the effects of shade and grass. To be read as a two-way
interactive effect of shade and grass on RGRD of each species separately ………………..92
Fig. 7 The log10 mean (± 1SE) sapling dry biomass (SDB) values (mg) of (a) humid and (b)
mesic species showing the effects of shade ……………………………………………….92
Fig. 8 The log10 mean (± 1SE) sapling dry biomass (SDB) values (mg) of (a) humid and (b)
mesic species showing the effects of shade and nutrients. To be read as a two-way
interactive effect of shade and nutrients on SDB of each species separately ……………..92
Fig. 9 The log10 mean (± 1SE) sapling dry biomass (SDB) values (mg) of (a) humid and (b)
mesic species showing the effects of shade and grass. To be read as a two-way interactive
effect of shade and grass on SDB of each species separately ……………………………..93
Fig. 10 Mean (± 1SE) leaf proportion (ratio of leaf dry biomass to total sapling dry biomass)
values of (a) humid and (b) mesic species showing the effects of shade and grass. To be
read as a two-way interactive effect of shade and grass on leaf proportion of each species
separately ………………………………………………………………………………….93
Fig. 11 Mean (± 1SE) sapling dry biomass (SDB) values of Acacia nigrescens, showing the
effects of shade and grass ………………………………………………………………....93
Fig. B1 Schematic treatment plot layout.....................................................................................112
CHAPTER 4: HERBIVORY EFFECTS ON SAPLINGS ARE INFLUENCED BY
NUTRIENTS AND GRASS COMPETITION IN A HUMID SOUTH AFRICAN SAVANNA
Fig. 1 Mean (± 1SE) relative growth rate of sapling stem length (RGRL) of (a) humid and (b)
mesic species in response to clipping treatment………………………………………....150
Fig. 2 Mean (± 1SE) relative growth rate sapling stem length (RGRL) of (a) humid and (b) mesic
species in response to clipping and nutrient availability. To be read as a two-way
interactive effect of clipping and nutrients on RGRL of each species separately …….....152
Fig. 3 Mean (± 1SE) relative growth rate of sapling stem length (RGRL) of (a) humid and (b)
mesic species in response to clipping and grass competition. To be read as a two-way
interactive effect of clipping and grass on RGRL of each species separately ……….......154

xiii
Fig. 4 Mean (± 1SE) relative growth rate of sapling stem basal diameter (RGRD) of (a) humid
and (b) mesic species in response to clipping treatment……………………………….155
Fig. 5 Mean (± 1SE) relative growth rate of sapling stem basal diameter (RGRD) of (a) humid
and (b) mesic species in response to clipping and grass competition. To be read as a two-
way interactive effect of clipping and grass on RGRD of each species separately ……157
Fig. 6 The log10 mean (± 1SE) sapling dry biomass (SDB) values (mg) of (a) humid and (b)
mesic species in response to clipping treatment ………………………………………158
Fig. 7 The log10 mean (± 1SE) sapling dry biomass (SDB) values (mg) of (a) humid and (b)
mesic species in response to grass competition …………………………………….....159
Fig. 8 Mean (± 1SE) leaf proportion (LP - taken as a ratio of leaf dry biomass to total sapling dry
biomass) values of (a) humid and (b) mesic species in response to clipping treatment
………………………………………………………………………………………….161

xiv
List of Tables
CHAPTER 2: FIRE AND NUTRIENT GRADIENT EFFECTS ON THE SAPLING ECOLOGY
OF FOUR ACACIA SPECIES IN THE PRESENCE OF GRASS COMPETITION*
Table 1. Species-wise ANOVA (unbalanced design) results showing the effects of fire (two
levels), nutrients (five levels) and their interactions on the growth and defence responses of
Acacia karroo, A. nigrescens, A. tortilis and A. sieberiana saplings, after the burning
treatment was applied ……………………………………………………………………..46
CHAPTER 3: SHADE, NUTRIENTS AND GRASS COMPETITION ARE IMPORTANT FOR
TREE SAPLING ESTABLISHMENT IN A HUMID SAVANNA
Table 1. Linear mixed model (lme) analysis using maximum likelihood, showing the individual
and interactive effects of water, shade, nutrient and grass treatments (two levels each) on
sapling growth of all species, excluding Acacia nigrescens…………………………........88
Table 2. Linear mixed model (lme) analysis using maximum likelihood, showing the individual
and interactive effects of water, shade, nutrient and grass treatments (two levels each) on
Acacia nigrescens sapling growth …………………………………………………..........90
Table A1. Linear mixed model (lme) analysis using maximum likelihood, showing the
individual and interactive effects of water, shade, nutrient and grass treatments (two levels
each) on Acacia karroo sapling growth…………………………………………….........105
Table A2. Linear mixed model (lme) analysis using maximum likelihood, showing the
individual and interactive effects of water, shade, nutrient and grass treatments (two levels
each) on Acacia sieberiana sapling growth ..………………………………………........106
Table A3. Linear mixed model (lme) analysis using maximum likelihood, showing the
individual and interactive effects of water, shade, nutrient and grass treatments (two levels
each) on Schotia brachypetala sapling growth ………………………………………….107
Table A4. Linear mixed model (lme) analysis using maximum likelihood, showing the
individual and interactive effects of water, shade, nutrient and grass treatments (two levels
each) on Strychnos spinosa sapling growth ……………………………………………..108
Table A5. Linear mixed model (lme) analysis using maximum likelihood, showing the
individual and interactive effects of water, shade, nutrient and grass treatments (two levels
each) on Acacia tortilis sapling growth ……………………………………………........109

xv
Table A6. Linear mixed model (lme) analysis using maximum likelihood, showing the
individual and interactive effects of water, shade, nutrient and grass treatments (two levels
each) on Colophospermum mopane sapling growth ……………………………………110
Table A7. Linear mixed model (lme) analysis using maximum likelihood, showing the
individual and interactive effects of water, shade, nutrient and grass treatments (two levels
each) on Combretum apiculatum sapling growth ………………………………………111
CHAPTER 4: HERBIVORY EFFECTS ON SAPLINGS ARE INFLUENCED BY
NUTRIENTS AND GRASS COMPETITION IN A HUMID SOUTH AFRICAN SAVANNA
Table 1. Linear mixed model (lme) analysis using maximum likelihood, showing the individual
and interactive effects of clipping (D), nutrient (N) and grass (G) treatments (two levels
each) on sapling growth of all species ………………………………………………….149
Table S1. Linear mixed model (lme) analysis using maximum likelihood, showing the individual
and interactive effects of clipping (D), nutrient (N) and grass (G) treatments (two levels
each) on Acacia karroo sapling growth ………………………………………………...162
Table S2. Linear mixed model (lme) analysis using maximum likelihood, showing the individual
and interactive effects of clipping (D), nutrient (N) and grass (G) treatments (two levels
each) on Acacia sieberiana sapling growth …………………………………………….163
Table S3. Linear mixed model (lme) analysis using maximum likelihood, showing the individual
and interactive effects of clipping (D), nutrient (N) and grass (G) treatments (two levels
each) on Schotia brachypetala sapling growth …………………………………………164
Table S4. Linear mixed model (lme) analysis using maximum likelihood, showing the individual
and interactive effects of clipping (D), nutrient (N) and grass (G) treatments (two levels
each) on Strychnos spinosa sapling growth …………………………………………….165
Table S5. Linear mixed model (lme) analysis using maximum likelihood, showing the individual
and interactive effects of clipping (D), nutrient (N) and grass (G) treatments (two levels
each) on Acacia nigrescens sapling growth …………………………………………….166
Table S6. Linear mixed model (lme) analysis using maximum likelihood, showing the individual
and interactive effects of clipping (D), nutrient (N) and grass (G) treatments (two levels
each) on Acacia tortilis sapling growth ………………………………………………...167
Table S7. Linear mixed model (lme) analysis using maximum likelihood, showing the individual
and interactive effects of clipping (D), nutrient (N) and grass (G) treatments (two levels
each) on Combretum apiculatum sapling growth ………………………………………168

xvi
Table S8. Linear mixed model (lme) analysis using maximum likelihood, showing the individual
and interactive effects of clipping (D), nutrient (N) and grass (G) treatments (two levels
each) on Colophospermum mopane sapling growth …………………………………....169

xvii
Acknowledgements
One sentence my father wrote to me not so long ago struck me as tremendously true and
now lives within me:
“God‟s blessings always will be there where intentions are positive and efforts and aim are
strong.”
Reflecting back from where I had started off my journey through my doctoral studies I
see many things have come together to make this work possible. Several people, some who were
complete strangers to me at the time, have provided their timely support and helped me to reach
this level. Every one of you deserves a „Thank you!‟, even if I cannot mention you all by name
here, and I humbly do so now.
First of all I would like to thank my supervisor, Prof. David M. Ward, for putting his faith
in me. Thank you for providing me with opportunities, your constant support in every possible
way and guidance. His lessons in statistics and constructive feedback have enabled me to build
my thesis. I also thank him for his unreserved commitment and persistent efforts in helping me to
complete my Ph.D. studies.
I am grateful to Dr. Kyle W. Tomlinson for his intellectual input at every step of the way.
He has been a key person who helped me with learning the „R statistical program‟ and provided
me with the necessary impetus to better understand the analyses. I also thank Mr. Eduardo R.M.
Barbosa for giving me advice on very useful details before the experiments were carried out.
Thanks are due to Prof. Michael J. Crawley of Imperial College, UK; Dr. Roger W.
Payne of VSN International, UK; Prof. Joachim Saborowski and Mr. P.M.S.A Ruwan of the

xviii
University of Göttingen, Germany; and Mr. Asnake Worku of the University of KwaZulu-Natal,
SA, for their time, effort and useful insights into the statistical analyses of my studies.
This thesis was co-funded by the National Research Foundation, South Africa and the
Shell Foundation, The Netherlands. Financial support extended to myself by the NRF research
grant which was given to Prof. D. Ward is gratefully acknowledged. In addition, I would like to
thank the University of KwaZulu-Natal for the doctoral research grant awarded to me. Dr. Steven
de Bie, Shell Foundation, The Netherlands as well as Dr. Frank van Langevelde and Prof.
Herbert H.T. Prins, Wageningen University, The Netherlands are duly acknowledged for their
efforts to provide financial assistance to run the GEST (Global Experiment on Savanna Tree
seedlings) field project at KwaMbonambi.
I wish to thank Mondi Group based at KwaMbonambi for providing me with space and
the necessary permission to carry out my field work in their nursery. Field experiments were
made possible with the support of many people working at Mondi nursery. Special mention goes
to the nursery manager Mr. Mark Holmes, Mr. Ananias Nsele and Mr. John Mthethwa from
Khubazi contractors.
To the technical and administrative staff of the School of Life Sciences in UKZN, Mr.
George R. Carelse, Mr. Martin J.C. Hampton, Mr. Renny S. Noble, Mr. Rogan B. Roth, Mrs.
Stephné G. Stuart and Mrs. Alison Young, your assistance with various things (huge and little)
has made my ride manageable and smooth - thank you very much. A special mention to Ms.
Vanessa Stuart, her extraordinary administrative work has been of immense help, particularly
when intiating the experiments. I thank Mr. Jerry Naicken for his helpful tips in building the
experimental structures.

xix
I had great joy working with my assistants, not only were they hard working and a fun-
filled bunch of people but also extremely kind and loving. This document would not have been
possible without their firm indispensible efforts. Thank you very much Abeba Mario Fiyori,
Nomasonto Mthiyane, Thokozani Myeza, Thuli Ncube, Mduduzi Nene, Akilimali Ngomu,
Andile Shange, Nompumelelo Shishane and Sphamandla Shishane.
I would like to thank Mrs. Jennifer Russell and Mrs. Tiffany P. Pillay for their help with
editorial work and Mr. Hendrik Göhman for assistance with data entry. Dr. Zivanai Tsvuura
provided me with important tips while writing up my thesis.
Pursuing a Ph.D. career can often be an overwhelming experience, exceptionally so when
staying far away from one‟s family. I have been privileged to come across a few good souls who
have enriched my life in S.A. and helped me through many a trying time. My dearest thanks to
Dr. Manoj G. Kulkarni, Dr. Mayashree C. Padyachee and Mr. Jean K.H.A. Schuermans; you
have supported me in your endless generous ways with various things both academic and
personal. I am indebted to you. To Jerry and his family, who have treated me like their daughter
and given me a home away from home. The late Dr. Zama P. Mtshali, for the inspiration she
instilled in me by being there like a sister. I thank Ms. Olufunke Fajinmi, Dr. Jack R.
Kambatuku, Mr. Akilimali Ngomu and Mr. Desale Y. Okubamichael for their kind and
encouraging words at different times of need. Special mentions to Bereket and Kahsay (Dessu‟s
friends) for the kindness they have shown during the latter stages of my thesis write-up; I am
touched. To Desale, Jack, Jennifer, Kayleigh, Tiffany, Zivanai and my „tea time‟ mates, I have
greatly enjoyed your pleasant companionship, friendly banter and several thought-provoking
discussions about God, religion, politics, science and human nature!

xx
Friends from home and my family have been such huge blessings. I am very grateful to
those who have put up with me through my Ph.D roller-coaster ride and gave me moral and
emotional support. To Sagar and Ravindra, you never miss a chance to let me know that you are
there and that you care. I thank Anil, Kumudini, Pavani, Shashi and Sirisha from whom I have
received unconditional support. Thank you to my dearest brothers Meenakethan, Chiranjeevi,
Sridhar and Shyam for being there and giving me the „call me if you need anything‟ attitude
always. Finally, I would like to thank my mom and dad for keeping me in their prayers and
giving me their infinite love and support.
“The woods are lovely, dark and deep,
But I have promises to keep,
And miles to go before I sleep.”
– Robert Frost.

1
Chapter 1: Introduction
Savanna definition and distribution
Savanna ecosystems are characterized by a continuous layer of mostly C4 grasses with a
discontinuous spread of trees and distinct wet and dry seasons (Bourlière and Hadley 1970, Frost
et al. 1986, van Langevelde et al. 2003). Savannas occupy about 20 % of the earth‟s terrestrial
landscape (Scholes and Walker 1993, Shorrocks 2007). Geographically, savannas occur largely
across the tropical (1600 M ha) and to a lesser extent in North American temperate regions (15
M ha) (Scholes and Archer 1997). The majority of the tropical savannas occur in Africa,
followed by South America, Australia, India and Southeast Asia (Scholes and Archer 1997,
Shorrocks 2007). In Africa, savanna constitutes approximately 40 % of the total land area and
covers most sub-Saharan regions (Okigbo 1985, Scholes and Walker 1993). At a global scale,
savannas occupy regions receiving mean annual rainfall ranging between 200-1500 mm, falling
within a short period of a few months, with average temperatures ranging from 20-30 oC
(Shorrocks 2007). Tropical savannas receive < 25 mm of rainfall during the driest period of the
year (Nix 1983).
Climate and types of savanna
The physiognomic structure of savannas is generally modified by the density and
organisation of savanna woody plant communities (Sarmiento 1984, Hoffmann 1996, Jeltsch et
al. 2000). Walter (1971) proposed that the tree cover of savannas is mainly dependent on plant-
available moisture (rainfall and soil water). The climate of savanna ecosystems varies from
2
humid to arid, mainly based on the quantity and seasonality of the rainfall (Johnson and Tothill
1985). Savannas form a broad transition zone between desert steppes and tropical woodland,
with an increase in tree density across an increasing rainfall gradient (Bourlière and Hadley
1983, Accatino et al. 2010). However, in reality it is difficult to distinguish among savanna types
depending on a single climatic variable (Menaut et al. 1985, Lehmann et al. 2009). Even within
the rainfall boundary there is no precise demarcation of savanna types. Menaut et al. (1985) have
distinguished three savanna zones, viz. humid (> 1000 mm rainfall and < 2 mo dry period),
mesic (rainfall between 500-1200 mm and < 8 mo dry period) and arid (< 600 mm and > 8 mo
dry period). While humid zones are clearly identified as areas receiving MAP > 1000 mm
(Mordelet et al. 1997), there still is no consensus over the categorization of arid, semi-arid and
mesic savannas. Sankaran et al. (2005) considered savannas receiving < 650 MAP as arid or
semi-arid while Staver et al. (2011) and Buitenwerf et al. (2012) have considered that the
savannas receiving approx. 500 MAP were semi-arid. Savannas with approx. 700 mm of rainfall
annually were categorized as semi-arid by Higgins et al. (2010). However, corresponding to a
classification done by Menaut et al. (1985), Bond and Midgley (2012) and Buitenwerf et al.
(2012) described these savannas as mesic. In the present thesis, we considered humid savannas
as areas receiving > 1000 mm MAP, mesic savannas receiving approx. 750 mm MAP and arid
savannas as areas receiving < 500 mm MAP.
The structure of savannas is not only determined by the amount of rainfall received but
also various other factors enabling tree-grass coexistence. Frost et al. (1986) have postulated the
importance of plant-available moisture, plant-available nutrients, fire and herbivory in
determining coexistence of dominant savanna growth forms. Savannas exist in zones that range
from low rainfall but with relatively high nutrient levels to high rainfall with low nutrient levels.

3
In this respect, du Toit (1995) had explicitly classified savannas as moist-dystrophic (> 650 mm
MAP with nutrient-poor leached soils) and arid-eutrophic (< 650 mm MAP with nutrient-rich
soils). However, tree-grass coexistence in savannas is also strongly driven by the temporal
effects of recurring disturbances, such as fire and herbivory (Jeltsch et al. 2000, van Langevelde
et al. 2003). Hence, interactions of water and nutrient availability with fire and herbivory at a
regional scale significantly determine savanna vegetation structure (Solbrig et al. 1996, Sankaran
et al. 2005, van Langevelde et al. 2011).
Importance of tree cover in savannas
African savannas have high floristic species richness (1750 species) which is comparable
to that of rainforests (2020 species) (Menaut 1983). Density and distribution of trees in savannas
maintain ecosystem structure (Menaut et al. 1990, Hoffmann 1996). Ecologically, at a local
scale, trees increase plant species richness and structural complexity by providing a distinct
microclimate under sub-canopy zones with increased soil nutrients (Vetaas 1992, Roos and
Allsopp 1997, Manning et al. 2006). Savannas of Africa sustain a wide variety of large
mammalian herbivore populations, constituting grazers, browsers and mixed feeders
(McNaughton and Georgiadis 1986, du Toit 2003). Although trees provide high quality forage to
large mammalian herbivores, they also support a wide faunal diversity by providing shelter
(Belsky and Canham 1994, Cumming et al. 1997, Fenton et al. 1998). Trees also provide food
for a variety of invertebrate fauna. Evergreen tree species form a major source of reserve food
material during the dry season to a range of wild ungulate browsers (Owen-Smith 1985). In
addition to their ecological importance, many species of savanna trees also have high

4
commercial and nutritional value for humans (Kristensen and Mette Lykke 2003). Decline in tree
cover reduces the capacity to retain a vast and unique savanna biodiversity. However, an increase
in the abundance of woody plants or “bush encroachment” (also known as “shrub encroachment”
in North America) is considered a serious problem to the quality, productivity, long-term
economic viability of rangelands and ecological integrity of savanna biomes (van Auken 2000,
Roques et al. 2001, Ward 2005). Considering that African savannas form the basis for major
industries such as agriculture, pastoralism and tourism (Lamprey 1983, Hadley 1985, Scholes
and Walker 1993, Prins 2000), an understanding of the factors driving tree cover in savannas is
crucial.
Determinants of tree cover in savannas – Sapling establishment
A young plant completes its seedling phase when it ceases to depend on food reserves
stored in the cotyledons and starts relying on external resources (Hanley et al. 2004). We
considered „saplings‟ as juvenile plants, in the first season of their growth, relying on external
resources, after shedding their cotyledons during the seedling phase. There is no clear
demarcation for the end of sapling phase. We presume that saplings, in their initial years of
growth, are similarly vulnerable to environmental stresses as seedlings. The sapling stage is the
most fragile phase in the life history of savanna trees (McPherson 1997, Higgins et al. 2000,
Bond 2008, Chidumayo 2008). Tree recruitment success in savannas is determined by sapling
resilience to adversity (Vadigi and Ward 2012) and the conditions that allow saplings to establish
(Midgley and Bond 2001, Chidumayo 2008). The survival and growth of tree seedlings, most
often are suppressed by competition within the grass layer (Jurena and Archer 2003, Riginos and

5
Young 2007), and are mainly influenced by resource availability (water, light and nutrients)
(O‟Connor 1995, Kraaij and Ward 2006) and disturbances such as fire and herbivory (Sankaran
et al. 2008, Midgley et al. 2010). These factors affect sapling recruitment either directly or by
interacting with one another.
Factors affecting tree sapling establishment
Frequent rainfall / water availability
Water stress during the dry season of savannas has a major impact on the survival of
woody seedlings (Scholes 1985, Gignoux et al. 2009). The length and severity of the dry season
is also very important in determining tree establishment (Nix 1983, Kraaij and Ward 2006,
Shorrocks 2007). Although tree seedlings rapidly develop an extensive root system to gain better
access to water (Ward and Esler 2011), evenly distributed rainfall is still a requirement to
compensate for the loss of water through transpiration (Menaut 1983). Studies in semi-arid
(Harrington 1991, Kraaij and Ward 2006) and humid savannas (Hoffmann 1996, Gignoux et al.
2009) have shown that a drought during the wet growing season is detrimental to tree seedlings.
Rainfall amount also alters the competitive equilibrium between grasses and tree saplings, as
grasses can establish themselves even in the presence of low rainfall (Menaut 1983).

6
Light interception / shade
Solar energy is a common plant resource requirement that is variably received at global,
regional and temporal scales. Plants in the humid tropics of Africa receive relatively low solar
radiation due to its interception by cloud cover and suspended aerosols, whereas clear skies make
arid zones more prone to high radiation and temperatures (Jagtap 1995, Shorrocks 2007). Within
savanna systems, light reception contrasts with seasonal variation in cloud cover. Light
intensities received on rainy days in arid savannas are equivalent to those of humid tropics
whereas light intensities characteristic of arid zones are received during drought periods in
humid savannas (Nix 1983). Shaded micro-sites created by established woody plants provide a
local-scale spatial heterogeneity in the amount of light received at ground level (O‟Connor 1995,
Rolhauser et al. 2011). Plants commonly undergo stress due to high transpiration rates with
increased radiation levels. Sub-canopy microsites provide structural complexity to savannas by
increased soil moisture, as well as increased nutrients due to high litter decomposition and
animal activity and alleviation of grass competition by shading (Vetaas 1992, Hoffmann 1996,
Riginos et al. 2009, Salazar et al. 2012). Amelioration of solar radiation and stressful
environments under canopy shade is considered favourable for savanna tree sapling recruitment
(O‟Connor 1995, Hoffmann 1996, Rolhauser et al. 2011, Salazar et al. 2012). Tree canopies may
facilitate grass growth in arid savannas due to amelioration of radiation but suppress grass
production in humid conditions (Dohn et al. 2012). Therefore, the competitive effect of grasses
on tree saplings may be altered based on light availability.

7
Soil nutrient availability
The interaction between the coexisting trees and grasses in savannas is widely understood
to be controlled by light and water availability (House et al. 2003). However, nutrients may
directly affect the competitive and facilitative interactions between trees and grasses (Scholes
and Hall 1996, House et al. 2003). Tree seedling establishment in savannas can be affected by
nutrients after water availability is taken into account (Kraaij and Ward 2006, Cramer et al.
2012). Plant productivity of terrestrial ecosystems is commonly limited by available soil nitrogen
under natural conditions (Miller and Cramer 2005). On a continental scale, humid savannas
consist of leached and infertile soils whereas arid savannas have relatively fertile soils (Scholes
and Walker 1993, du Toit 1995). Nutrients may have both direct positive effects and indirect
negative effects on savanna tree sapling recruitment. Availability of nutrients may directly
enhance seedling growth (Wakeling et al. 2010) or suppress seedling establishment by increasing
grass competition (Cohn et al. 1989, Kraaij and Ward 2006, van der Waal et al. 2009).
Grass competition
Grass competition can strongly suppress growth at all life history stages of woody plants
(Riginos 2009), although increases in tree density may have an intense negative effect on grasses
(Riginos et al. 2009). Grass competition is a major impediment for tree seedling survival and
establishment, capable of creating a bottleneck for the succession of trees in savannas (Higgins et
al. 2000, Jurena and Archer 2003, Riginos and Young 2007, Bond 2008, Ward and Esler 2011,
Grellier et al. 2012). Young tree seedlings share the same rooting niche with grasses (Menaut

8
1983, Cramer et al. 2010, Ward and Esler 2011) and compete directly for water, nutrients and
light (van der Waal et al. 2009). Indirectly, grasses hinder sapling growth by increasing fire
intensity and frequency through accumulation of combustible fuel loads (Bond 2008). Humid
savannas are capable of supporting more fires than mesic areas because moisture is not limited
for grass production (Trollope 1980, Sankaran et al. 2008). Grass biomass may also benefit from
nitrogen fixation by tree seedlings (Kambatuku et al. 2013) which may in turn be detrimental to
seedlings. However, grasses may provide moist microclimatic conditions (Grellier et al. 2012)
and cover from browsers, facilitating tree sapling establishment (Riginos and Young 2007,
Seymour 2008).
Fire
Fires are common disturbance phenomena regulating tree establishment in tropical
savannas, albeit at a more local scale (Frost et al. 1986, Lehmann et al. 2008). Historically,
lightning was the principal source of fires in savannas (Solbrig et al. 1996) although deliberate
(anthropogenic) use of fires started very early in African savannas (Scholes and Archer 1997).
Nevertheless, savanna trees are highly resistant to fires and probably evolved under the influence
of fires (Helm et al. 2011). However, fires are capable of reducing tree density through sapling
mortality and diversity due to species-specific responses of trees to fires (Silva 1996, Andersen
et al. 2005, Zida et al. 2007, Gordijn et al. 2012). Intensity of fires determines the recruitment of
trees into larger size classes (Govender et al. 2006). Very young saplings have the ability to resist
fire by resprouting (Midgley and Bond 2001, Clarke et al. 2013). However, repetitive

9
disturbances such as intensive browsing after fire (Dublin et al. 1990; Midgley et al. 2010) and
frequent fires (Wigley et al. 2009) may lead to mortality.
Herbivory
African savannas accommodate a highly diverse group of mammalian herbivore species
(Jewell 1985, Holdo et al. 2009), especially compared to the savannas in Australia and South
America (Bond 2008). Savanna herbivores broadly includes grazers, browsers and mixed feeders
(Holdo et al. 2009), which constitutes native ungulates, domestic livestock, small rodents and an
array of invertebrates (Shaw et al. 2002). Relatively, among all the other factors affecting tree
populations, herbivory by mammals has a very small effect (Roques et al. 2001, Sankaran et al.
2005, Bond 2008). Browsing mammalian herbivores have the ability to alter the tree vegetation
structure but rarely have a devastating effect (van de Vijver et al. 1999, Bond 2008). However,
the effects of large mammalian browsers, such as elephants, (van de Vijver et al. 1999, Western
and Maitumo 2004) and small mammalian browsers can have a significant negative effect on
shrub dynamics (Augustine and McNaughton 2004), especially when large trees are represented
in low densities (Dublin et al. 1990). Tree recruitment in savannas may also be affected by heavy
sapling predation by invertebrates (Weltzin et al. 1997, Shaw et al. 2002). However, substantial
landscape-level vegetation changes due to insect herbivory are found mainly in North America
(Naiman 1988) while ungulates play a prominent role in African savannas (Andersen and
Lonsdale 1990). An increase in grazing pressure has been noted as a main cause for reduced fire
frequency, leading to mass tree recruitment or bush encroachment (van Auken 2000, Roques et
al. 2001, van Langevelde et al. 2003, Briggs et al. 2005, Gordijn et al. 2012).

10
Aims and outline of the thesis
This study seeks to evaluate the relative effects of various factors influencing the
recruitment of different humid and mesic savanna species saplings in a humid South African
savanna. All these factors were tested in a field experimental study, except for a test of the
effects of fire which was performed under controlled greenhouse conditions. The field
experiment was replicated by another PhD student, Eduardo Barbosa, in a mesic savanna site
near the Kruger national park in South Africa. These field studies were undertaken as a part of a
global experiment on savanna tree saplings (GEST), which are being conducted in mesic and
humid savannas in Australia, India, and South America.
Chapter 2 investigates the effects of fire, five different levels of nutrients and their interactions
on saplings of four Acacia species. Survival, growth and defence responses were evaluated after
six month study period under irrigated greenhouse conditions. This chapter was published in
Plant Ecology.
Chapter 3 examines the effects of resource availability (frequent water supply, shading and
nutrients) and grass competition on the sapling survival and growth of eight savanna tree species
from both humid and mesic origins. This study was conducted in a controlled field experiment
for one wet season under field conditions. This chapter has been submitted to Ecosphere.
Chapter 4 deals with the effects of clipping with respect to nutrient availability and grass
competition on the sapling survival and growth of eight savanna tree species from humid and

11
mesic savannas. This study was conducted under irrigated conditions in the same field
experiment described in Chapter 3. This chapter has been submitted to Functional Ecology.
Chapter 5 provides an overview of the study results in the context of tree establishment in
humid savannas along with an outline of directions for future research.
I measured aboveground growth responses in terms of sapling investment in total
biomass, stem growth rates (important to withstand fires) (Higgins et al. 2000, Clarke et al.
2013) and leaves (important to produce root reserves) (Sakai and Sakai 1998) which will enable
successful recruitment. Many studies have indicated that herbivory induced defense investment
in savanna trees (Gowda 1997, Rohner and Ward 1997, Zinn et al. 2007). However, investment
in defences after fire has been less frequently investigated (see Gowda and Raffaele 2004).
Hence, we studied sapling allocation to defences with fire treatment.
References
Andersen, A.N., Cook, G.D., Corbett, L.K., Douglas, M.M., Eager, R.W., Russell-Smith, J.,
Setterfield, S.A., Williams, R.J. and Woinarski, J.C.Z. (2005) Fire frequency and
biodiversity conservation in Australian tropical savannas: implications from the Kapalga
fire experiment. Austral Ecology, 30, 155-167.
Andersen, A.N. and Lonsdale, W.M. (1990) Herbivory by insects in Australian tropical
savannas: A review. Journal of Biogeography, 17, 433-444.

12
Accatino, F., De Michele, C., Vezzoli, R., Donzelli, D. and Scholes, R.J. (2010) Tree-grass co-
existence in savanna: interactions of rain and fire. Journal of Theoretical Biology, 267,
235-242.
Augustine, D.J. and McNaughton, S.J. (2004). Regulation of shrub dynamics by native browsing
ungulates on East African rangeland. Journal of Applied Ecology, 41, 45-58.
Belsky, A.J. and Canham, C.D. (1994) Forest gaps and isolated savanna trees. BioScience, 44,
77-84.
Bond, W.J. (2008) What limits trees in C4 grasslands and savannas? Annual Review of Ecology,
Evolution and Systematics, 39, 641-659.
Bond, W.J. and Midgley, G.F. (2012) Carbon dioxide and the uneasy interactions of trees and
savannah grasses. Philosophical Transactions of the Royal Society B: Biological
Sciences, 367, 601-612.
Bourlière, F. and Hadley, M. (1970) The ecology of tropical savannas. Annual Review of
Ecology and Systematics, 1, 125-152.
Bourlière, F. and Hadley, M. (1983) Present-day savannas: an overview. Ecosystems of the world
13: tropical savannas (ed. by F. Bourlière), pp. 1-15. Elsevier Scientific Publishing
Company, Amsterdam.
Briggs, J.M., Knapp, A.K., Blair, J.M., Heisler, J.L., Hoch, G.A., Lett, M.S. and McCarron, J.K.
(2005) An ecosystem in transition: causes and consequences of the conversion of mesic
grassland to shrubland. BioScience, 55, 243-254.
Buitenwerf, R., Bond, W.J., Stevens, N. and Trollope, W.S.W. (2012) Increased tree densities in
South African savannas: > 50 years of data suggests CO2 as a driver. Global Change
Biology, 18, 675-684.

13
Chidumayo, E. (2008) Implications of climate warming on seedling emergence and mortality of
African savanna woody plants. Plant Ecology, 198, 61-71.
Clarke, P.J., Lawes, M.J., Midgley, J.J., Lamont, B.B., Ojeda, F., Burrows, G.E., Enright, N.J.
and Knox, K.J.E. (2013). Resprouting as a key functional trait: how buds, protection and
resources drive persistence after fire. New Phytologist, 197, 19-35.
Cohn, E.J., van Auken, O.W. and Bush, J.K. (1989) Competitive interactions between Cynodon
dactylon and Acacia smallii seedlings at different nutrient levels. American Midland
Naturalist, 121, 265-272.
Cramer, M.D., Wakeling, J.L. and Bond, W.J. (2012) Belowground competitive suppression of
seedling growth by grass in an African savanna. Plant Ecology, 213, 1655-1666.
Cramer, M.D., van Cauter, A. and Bond, W.J. (2010) Growth of N2-fixing African savanna
Acacia species is constrained by below-ground competition with grass. Journal of
Ecology, 98, 156-167.
Cumming, D.H.M., Fenton M.B., Rautenbach I.L., Taylor R.D., Cumming G.S., Cumming M.S.,
Dunlop J.M., Ford G.S., Hovorka M.D., Johnston D.S., Kalcounis M.C., Mahlanga, Z.
and Portfors, C.V. (1997) Elephants, woodlands and biodiversity in miombo woodland in
southern Africa. South African Journal of Science, 93, 231-236.
Dohn, J., Dembélé, F., Karembé, M., Moustakas, A., Amévor, K.A. and Hanan, N.P. (2012) Tree
effects on grass growth in savannas: competition, facilitation and the stress-gradient
hypothesis. Journal of Ecology, doi: 10.1111/1365-2745.12010.
Dublin, H.T., Sinclair, A.R.E. and McGlade, J. (1990) Elephants and fire as causes of multiple
stable states in the Serengeti-Mara woodlands. Journal of Animal Ecology, 59, 1147-
1164.

14
du Toit, J.T. (1995) Determinants of the composition and distribution of wildlife communities in
southern Africa. Ambio, 24, 2-6.
du Toit, J.T., Rogers, K.H. and Biggs, H.C. (2003) The Kruger experience: ecology and
management of savanna heterogeneity. Island Press, Washington D.C., USA.
Fenton, M.B., Cumming, D.H.M., Rautenbach, I.L., Cumming, G.S., Cumming, M.S., Ford, G.,
Taylor, R.D., Dunlop, J., Hovorka, M.D., Johnston, D.S., Portfors, C.V., Kalcounis, M.C.
and Mahlanga, Z. (1998) Bats and the loss of tree canopy in African woodlands.
Conservation Biology, 12, 399-407.
Frost, P., Medina, E., Menaut, J.C., Solbrig, O., Swift, M. and Walker, B.H. (1986) Responses of
savannas to stress and disturbance. In: Report of a meeting of an IUBS working group on
decade of the tropics programme/tropical savanna ecosystems eds. P. Frost, E. Medina,
J.C. Menaut, O. Solbrig, M. Swift and B.H. Walker. IUBS, Paris.
Gignoux, J., Lahoreau, G., Julliard, R. and Barot, S. (2009) Establishment and early persistence
of tree seedlings in an annually burned savanna. Journal of Ecology, 97, 484-495.
Gordijn, P.J., Rice, E. and Ward, D. (2012) The effects of fire on woody plant encroachment are
exacerbated by succession of trees of decreased palatability. Perspectives in Plant
Ecology, Evolution and Systematics, 14, 411-422.
Govender, N., Trollope, W.S.W. and van Wilgen, B.W. (2006) The effect of fire season, fire
frequency, rainfall and management on fire intensity in savanna vegetation in South
Africa. Journal of Applied Ecology, 43, 748-758.
Gowda, J.H. (1997) Physical and chemical response of juvenile Acacia tortilis trees to browsing.
Experimental evidence. Functional Ecology, 11, 106-111.
15
Gowda, J. and Raffaele, E. (2004) Spine production is induced by fire: a natural experiment with
three Berberis species. Acta Oecologica, 26, 239-245.
Grellier, S., Barot, S., Janeau, J.L. and Ward, D. (2012) Grass competition is more important
than seed ingestion by livestock for Acacia recruitment in South Africa. Plant Ecology,
213, 899-908.
Hadley, M. (1985) Comparative aspects of land use and resource management in savanna
environments. Ecology and management of the world’s savannas (ed. by J.C. Tothill and
J.J. Mott), pp. 142-158. Australian Academy of Science, Canberra.
Hanley, M.E., Fenner, M., Whibley, H. and Darvill, B. (2004) Early plant growth: Identifying
the end point of the seedling phase. New Phytologist, 163, 61-66.
Harrington, G.N. (1991) Effects of soil moisture on shrub seedling survival in semi-arid
grassland. Ecology, 72, 1138-1149.
Helm, C., Wilson, G., Midgley, J., Kruger, L. and Witkowski, E.T.F. (2011) Investigating the
vulnerability of an African savanna tree (Sclerocarya birrea ssp. caffra) to fire and
herbivory. Austral Ecology, 36, 964-973.
Higgins, S.I., Bond, W.J. and Trollope, W.S.W. (2000) Fire, resprouting and variability: A recipe
for grass-tree coexistence in savanna. Journal of Ecology, 88, 213-229.
Higgins, S.I., Scheiter, S. and Sankaran, M. (2010) The stability of African savannas: insights
from the indirect estimation of the parameters of a dynamic model. Ecology, 91, 1682-
1692.
Hoffmann, W.A. (1996) The effects of fire and cover on seedling establishment in a Neotropical
savanna. Journal of Ecology, 84, 383-393.

16
Holdo, R.M., Holt, R.D. and Fryxell, J.M. (2009) Grazers, browsers, and fire influence the extent
and spatial pattern of tree cover in the Serengeti. Ecological Applications, 19, 95-109.
House, J.I., Archer, S., Breshears, D.D., Scholes, R.J. and NCEAS tree-grass interactions
participants. (2003) Conundrums in mixed woody–herbaceous plant systems. Journal of
Biogeography, 30, 1763-1777.
Jagtap, S.S. (1995) Environmental characterization of the moist lowland savanna of Africa.
Moist savannas of Africa: potentials and constraints for crop production. (ed. by B.T.
Kang, I.O. Akobundu, V.M. Manyong, R.J. Carsky, N. Sanginga and E.A. Kueneman),
pp 9-30. Proceedings of the international workshop held at Cotonou, Republic of Benin,
19 – 23 September 1994. International Institute of Tropical Agriculture, Ibadan, Nigeria.
Jeltsch, F., Weber, G.E. and Grimm, V. (2000) Ecological buffering mechanisms in savannas: A
unifying theory of long-term tree-grass coexistence. Plant Ecology, 150, 161-171.
Jewell, P.A. (1985) Man-made shifts in the ecological carrying capacity of African savannas.
Ecology and management of the world’s savannas (ed. by J.C. Tothill and J.J. Mott), pp.
342-344. Australian Academy of Science, Canberra.
Johnson, R.W. and Tothill, J.C. (1985) Definition and broad geographic outline of savanna lands.
Ecology and management of the world’s savannas (ed. by J.C. Tothill and J.J. Mott), pp.
1-13. Australian Academy of Science, Canberra.
Jurena, P.N. and Archer, S. (2003) Woody plant establishment and spatial heterogeneity in
grasslands. Ecology, 84, 907–919.
Kambatuku, J., Cramer, M. and Ward, D. (2013) Nitrogen fertilisation reduces grass-induced N2
fixation of tree seedlings from semi-arid savannas. Plant and Soil, 365, 307-320.

17
Kraaij, T. and Ward, D. (2006) Effects of rain, nitrogen, fire and grazing on tree recruitment and
early survival in bush-encroached savanna, South Africa. Plant Ecology, 186, 235-246.
Kristensen, M. and Mette Lykke, A. (2003) Informant-based valuation of use and conservation
preferences of savanna trees in Burkina Faso. Economic Botany, 57, 203-217.
Lamprey, H.F. (1983) Pastoralism yesterday and today: the over-grazing problem. Ecosystems of
the world 13: tropical savannas (ed. by F. Bourlière), pp. 643-665. Elsevier Scientific
Publishing Company, Amsterdam.
Lehmann, C.E.R., Prior, L.D., Williams, R.J. and Bowman, D.M.J.S. (2008) Spatio-temporal
trends in tree cover of a tropical mesic savanna are driven by landscape disturbance.
Journal of Applied Ecology, 45, 1304-1311.
Lehmann, C.E.R., Ratnam, J. and Hutley, L.B. (2009) Which of these continents is not like the
other? Comparisons of tropical savanna systems: key questions and challenges. New
Phytologist 181, 508-511.
Manning, A.D., Fischer, J. and Lindenmayer, D.B. (2006) Scattered trees are keystone structures
– implications for conservation. Biological Conservation, 132, 311-321.
McNaughton, S.J. and Georgiadis, N.J. (1986) Ecology of African grazing and browsing
mammals. Annual Review of Ecology and Systematics, 17, 39-65.
McPherson, G.R. (1997) Ecology and management of North American savannas. University of
Arizona Press, Tucson, Arizona, USA.
Menaut, J.C. (1983) The vegetation of African savannas. Ecosystems of the world 13: tropical
savannas (ed. by F. Bourlière), pp. 109-145. Elsevier Scientific Publishing Company,
Amsterdam.

18
Menaut, J.C., Barbault, R., Lavelle, P. and Lepaze, M. (1985) African savannas: biological
systems of humification and mineralization. Ecology and management of the world’s
savannas (ed. by J.C. Tothill and J.J. Mott), pp. 14-33. Australian Academy of Science,
Canberra.
Menaut, J.C., Gignoux, J., Prado, C. and Clobert, J. (1990) Tree community dynamics in a humid
savanna of the Cote-d'Ivoire: modelling the effects of fire and competition with grass and
neighbours. Journal of Biogeography, 17, 471-481.
Midgley, J.J. and Bond, W.J. (2001) A synthesis of the demography of African acacias. Journal
of Tropical Ecology, 17, 871-886.
Midgley, J.J., Lawes, M.J. and Chamaillé-Jammes, S. (2010) Savanna woody plant dynamics:
the role of fire and herbivory, separately and synergistically. Australian Journal of
Botany, 58, 1-11.
Miller, A.J. and Cramer, M.D. (2005) Root nitrogen acquisition and assimilation. Root
physiology: from gene to function (ed. by H. Lambers and T. Colmer), pp. 1-36. Springer,
Netherlands.
Mordelet, P., Menaut, J.C. and Mariotti, A. (1997) Tree and grass rooting patterns in an African
humid savanna. Journal of Vegetation Science, 8, 65-70.
Naiman R.J. (1988) Animal influences on ecosystem dynamics. BioScience, 38, 750-752.
Nix, H.A. (1983) Climate of tropical savannas. Ecosystems of the world 13: tropical savannas
(ed. by F. Bourlière), pp. 37-61. Elsevier Scientific Publishing Company, Amsterdam.
O'Connor, T.G. (1995) Acacia karroo invasion of grassland: environmental and biotic effects
influencing seedling emergence and establishment. Oecologia, 103, 214-223.

19
Okigbo, B.N. (1985) Land use and productive potentials of African savannas. Ecology and
management of the world’s savannas (ed. by J.C. Tothill and J.J. Mott), pp. 95-106.
Australian Academy of Science, Canberra.
Owen-Smith, N. (1985) Ecology of browsing by African wild ungulates. Ecology and
management of the world’s savannas (ed. by J.C. Tothill and J.J. Mott), pp. 345-349.
Australian Academy of Science, Canberra.
Prins, H.H.T. (2000) Wildlife utilisation for tourism and sportshunting: does the southern
African example work for Africa? Reports of the Netherlands Commission for
International Nature Protection, 36, 29-40.
Riginos, C. (2009) Grass competition suppresses savanna tree growth across multiple
demographic stages. Ecology, 90, 335-340.
Riginos, C., Grace, J.B., Augustine, D.J. and Young, T.P. (2009) Local versus landscape-scale
effects of savanna trees on grasses. Journal of Ecology, 97, 1337-1345.
Riginos, C. and Young, T.P. (2007) Positive and negative effects of grass, cattle, and wild
herbivores on Acacia saplings in an East African savanna. Oecologia, 153, 985-95.
Rohner, C. and Ward, D. (1997) Chemical and mechanical defense against herbivory in two
sympatric species of desert Acacia. Journal of Vegetation Science, 8, 717-726.
Rolhauser, A.G., Chaneton, E.J. and Batista, W.B. (2011) Influence of conspecific and
heterospecific adults on riparian tree species establishment during encroachment of a
humid palm savanna. Oecologia, 167, 141-148.
Roos, P.C. and Allsopp, N. (1997) Soil nutrient ecology associated with Acacia sieberana at
different tree densities in a South African savanna. African Journal of Range and Forage
Science, 14, 39-44.

20
Roques, K.G., O'Connor, T.G. and Watkinson, A.R. (2001) Dynamics of shrub encroachment in
an African savanna: relative influences of fire, herbivory, rainfall and density
dependence. Journal of Applied Ecology, 38, 268-280.
Sakai, A. and Sakai, S. (1998) A test for the resource remobilization hypothesis: tree sprouting
using carbohydrates from above-ground parts. Annals of Botany, 82, 213–216.
Salazar, A., Goldstein, G., Franco, A.C. and Miralles-Wilhelm, F. (2012) Differential seedling
establishment of woody plants along a tree density gradient in Neotropical savannas.
Journal of Ecology, 100, 1411-1421.
Sankaran, M., Ratnam, J. and Hanan, N. (2008) Woody cover in African savannas: the role of
resources, fire and herbivory. Global Ecology and Biogeography, 17, 236-245.
Sankaran, M., Hanan, N.P., Scholes, R.J., Ratnam, J., Augustine, D.J., Cade, B.S., Gignoux, J.,
Higgins, S.I., Le Roux, X., Ludwig, F., Ardo, J., Banyikwa, F., Bronn, A., Bucini, G.,
Caylor, K.K., Coughenour, M.B., Diouf, A., Ekaya, W., Feral, C.J., February, E.C., Frost,
P.G.H., Hiernaux, P., Hrabar, H., Metzger, K.L., Prins, H.H.T., Ringrose, S., Sea, W.,
Tews, J., Worden, J. and Zambatis, N. (2005) Determinants of woody cover in African
savannas. Nature, 438, 846-849.
Sarmiento, G. (1984) The ecology of neotropical savannas. 1st edition, Harvard University Press,
Cambridge.
Scholes, R.J. (1985) Drought related grass, tree and herbivore mortality in a southern African
savanna. Ecology and management of the world’s savannas (ed. by J.C. Tothill and J.J.
Mott), pp. 350-353. Australian Academy of Science, Canberra.
Scholes, R.J. and Archer, S.R. (1997) Tree-grass interactions in savannas. Annual Review of
Ecology and Systematics, 28, 517-544.

21
Scholes, R.J. and Hall, D.O. (1996) The carbon budget of tropical savannas, woodlands and
grasslands. Global change: effects on coniferous forests and grasslands, SCOPE, V56
(ed. by A.I. Breymeyer, D.O. Hall, J.M. Melillo, G.I. Agren), pp 69-100. Wiley,
Chichester.
Scholes, R.J. and Walker, B.H. (1993) An African savanna: synthesis of the Nylsvley study, 1st
ed. University Press, Cambridge.
Seymour, C. (2008) Grass, rainfall and herbivores as determinants of Acacia erioloba (Meyer)
recruitment in an African savanna. Plant Ecology, 197, 131-138.
Shaw, M.T., Keesing, F. and Ostfeld, R.S. (2002) Herbivory on Acacia seedlings in an East
African savanna. Oikos, 98, 385-392.
Shorrocks, B. (2007) The biology of African savannahs, 1st edition, Oxford University Press,
Oxford.
Silva, J.F. (1996) Biodiversity and stability in tropical savannas. Biodiversity and savanna
ecosystem processes (ed. by G. Heldmaier, O.L. Lange, H.A. Mooney and U. Sommer),
pp. 161-171. Springer-Verlag, Berlin.
Solbrig, O.T., Medina, E. and Silva, J.F. (1996) Determinants of tropical savannas. Biodiversity
and savanna ecosystem processes (ed. by G. Heldmaier, O.L. Lange, H.A. Mooney and
U. Sommer), pp. 31-41. Springer-Verlag, Berlin.
Staver, A.C., Bond, W.J. and February, E.C. (2011) History matters: tree establishment
variability and species turnover in an African savanna. Ecosphere, 2, art49.
Trollope, W.S.W. (1980) Controlling bush encroachment with fire in the savanna areas of South
Africa. Proceedings of the Annual Congresses of the Grassland Society of Southern
Africa, 15, 173-177.

22
Vadigi, S. and Ward, D. (2012) Fire and nutrient gradient effects on the sapling ecology of four
Acacia species in the presence of grass competition. Plant Ecology, 213, 1793-1802.
van Auken, O.W. (2000) Shrub invasions of North American semiarid grasslands. Annual
Review of Ecology and Systematics, 31, 197-215.
van de Vijver, C.A.D.M., Foley, C.A. and Olff, H. (1999) Changes in the woody component of
an East African savanna during 25 years. Journal of Tropical Ecology, 15, 545-564.
van der Waal, C., de Kroon, H., de Boer, W.F., Heitkönig, I.M.A., Skidmore, A.K., de Knegt,
H.J., van Langevelde, F., van Wieren, S.E., Grant, R.C., Page, B.R., Slotow, R., Kohi,
E.M., Mwakiwa, E. and Prins, H.H.T. (2009) Water and nutrients alter herbaceous
competitive effects on tree seedlings in a semi-arid savanna. Journal of Ecology, 97, 430-
439.
van Langevelde, F., Tomlinson, K., Barbosa, E.R.M., de Bie, S., Prins, H.H.T. and Higgins, S.I.
(2011) Understanding tree-grass coexistence and impacts of disturbance and resource
variability in savannas. Ecosystem function in savannas: measurement and modelling at
landscape to global scales (ed. by M.J. Hill and N.P. Hanan), pp. 257–271. CRC Press,
Boca Raton, Florida, USA.
van Langevelde, F., van de Vijver, C.A.D.M., Kumar, L., van de Koppel, J., de Ridder, N., van
Andel, J., Skidmore, A.K., Hearne, J.W., Stroosnijder, L., Bond, W.J., Prins, H.H.T. and
Rietkerk, M. (2003) Effects of fire and herbivory on the stability of savanna ecosystems.
Ecology, 84, 337-350.
Vetaas, O.R. (1992) Micro-site effects of trees and shrubs in dry savannas. Journal of Vegetation
Science, 3, 337-344.

23
Wakeling, J.L., Cramer, M.D. and Bond, W.J. (2010) Is the lack of leguminous savanna trees in
grasslands of South Africa related to nutritional constraints? Plant and Soil, 336, 173-
182.
Walter, H. (1971) Ecology of tropical and subtropical vegetation. Oliver and Boyd, Edinburgh,
UK.
Ward, D. (2005) Do we understand the causes of bush encroachment in African savannas?
African Journal of Range and Forage Science, 22, 101-105.
Ward, D. and Esler, K. (2011) What are the effects of substrate and grass removal on recruitment
of Acacia mellifera seedlings in a semi-arid environment? Plant Ecology, 212, 245-250.
Weltzin, J.F., Archer, S. and Heitschmidt, R.K. (1997) Small mammal regulation of vegetation
structure in a temperate savanna. Ecology, 78, 751-763.
Western, D. and Maitumo, D. (2004) Woodland loss and restoration in a savanna park: a 20-year
experiment. African Journal of Ecology, 42, 111-121.
Wigley, B.J., Cramer, M.D. and Bond, W.J. (2009) Sapling survival in a frequently burnt
savanna: mobilisation of carbon reserves in Acacia karroo. Plant Ecology, 203, 1-11.
Zida, D., Sawadogo, L., Tigabu, M., Tiveau, D. and Odén, P.C. (2007) Dynamics of sapling
population in savanna woodlands of Burkina Faso subjected to grazing, early fire and
selective tree cutting for a decade. Forest Ecology and Management, 243, 102-115.
Zinn, A.D., Ward, D. and Kirkman, K. (2007) Inducible defences in Acacia sieberiana in
response to giraffe browsing. African Journal of Range and Forage Science, 24, 123-129.

24
Chapter 2: Fire and nutrient gradient effects on the sapling ecology of four Acacia species
in the presence of grass competition*
Snehalatha Vadigi1, and David Ward
1,2
1School of Life Sciences, University of KwaZulu-Natal, Private Bag X01, Scottsville,
Pietermaritzburg, 3209, South Africa
2Email: [email protected]
* Published in Plant Ecology (2012), Volume 213, Issue 11, Pages 1793–1802.

25
Abstract
The variation among tree species in their sapling responses to disturbances such as fire,
herbivory and grass competition results in different probabilities of recruitment into savanna
communities. A sapling‟s ability to persist under these disturbances depends on its investment in
growth, defences and stored reserves, based on soil available nutrients. We examined the
survival and investments in growth and defence of the saplings of four Acacia species, in the
presence of competing grasses, under varying soil nutrient levels. We also have evaluated the
effects of fire on these saplings. We performed the study in a greenhouse at the UKZN Botanical
Garden, Pietermaritzburg, South Africa. Nutrients had no significant effect on the survival of tree
saplings regardless of fire treatment. Only 22.5 % saplings survived after fire treatment
compared with 84 % of control saplings. Acacia sieberiana showed the highest resprout survival,
while A. karroo did not survive the fire. Growth in A. nigrescens increased only at intermediate
levels (0.5N, 1N) of the fertiliser provided. Condensed tannins in A. karroo also decreased at an
intermediate level (1N) of fertiliser. Resprouts grew faster in stem height than in diameter and
did not invest in chemical defences. No treatment had an effect on the proportion of root and
shoot dry biomass. In conclusion, African acacias are not dependent on soil nutrients for their
survival and differ in their ability to resprout after fire. Intermediate levels of nutrient availability
are beneficial to sapling development as opposed to zero and high nutrient levels, due to nutrient-
grass dynamics. The benefits of post-fire grass removal and an increase in nutrients can be
effectively utilised by only a few species of acacias.
Key-words Condensed tannins ∙ Coppicing ∙ Humid savanna ∙ Mesic savanna ∙ Relative growth
rate ∙ Resprouting ∙ Sapling establishment

26
Introduction
In savannas, grass fires and herbivory are common disturbances limiting tree population
density (Scholes and Archer 1997; Higgins et al. 2000; Sankaran et al. 2008; Staver et al. 2009;
Midgley et al. 2010). Savanna trees have evolved under the influence of fire and herbivory
(Helm et al. 2011). Many species are capable of resprouting after burning (Archibald and Bond
2003; Balfour and Midgley 2006; Wigley et al. 2009). Trees resist herbivory by investing in
various chemical and mechanical defences (Rohner and Ward 1997; Ward and Young 2002;
reviewed in Stamp 2003) as well as rapid stem growth (Palo et al. 1993). Tree resilience to
disturbances is prominent mainly in adults while the saplings remain largely susceptible (Higgins
et al. 2000; Augustine and McNaughton 2004; Staver et al. 2009; Wahungu et al. 2011),
although young trees may defend themselves better than mature trees (Brooks and Owen-Smith
1994; Rohner and Ward 1997; Ward and Young 2002). Hence, sapling establishment and growth
play a defining role in the demographic composition of savanna tree population structure (Prins
and Van der Jeugd 1993; King et al. 1997; Hanley 1998; Staver et al. 2009; Goheen et al. 2010).
Rare „triggering events‟ favourable for mass tree recruitment can occur (Kraaij and Ward 2006;
Meyer et al. 2009), but more often than not savanna tree seedlings struggle to establish in the
presence of disturbances and competing grasses (Ward and Esler 2011; Kambatuku et al. 2013).
Fire damage activates plants to resprout by mobilizing the stored carbon from roots to
aboveground growth, later replenishing their depleted carbohydrate reserves (Schutz et al. 2009;
Wigley et al. 2009). However, if disturbances persist then depletion of sapling reserves may
result (Wigley et al. 2009; Paula and Ojeda 2011). Repetitive disturbances usually involve

27
intensive browsing after fire (Dublin et al. 1990; Midgley et al. 2010) and frequent fires (Wigley
et al. 2009).
Resprouting success is mainly determined by species-specific bud anatomy, bud
protection and resource availability (Wigley et al. 2009; Lawes and Clarke 2011). Many savanna
species resprout from stem basal buds that are well protected and tolerant of disturbances
(Midgley et al. 2010; Lawes and Clarke 2011). Effective bud protection results in higher
resistance to fire and is primarily governed by stem bark thickness (commonly proportional to
stem diameter) and height (Gignoux et al. 1997; Hoffmann and Solbrig 2003; Balfour and
Midgley 2006; Lawes et al. 2011). Physiologically it is important for savanna saplings to have
high resource investment rates in overall stem growth, but the allocation to stem height may be
gained at a cost of diameter and vice versa (Sumida et al. 1997). Trade-offs exist not only
between stem height and diameter growth, but also in overall plant growth and defence
investment (Hean and Ward 2012). Plant investment in growth and defences is primarily
determined by soil nutrient availability. Although resprouting roots depend highly on starch
nutrient reserves (Miyanishi and Kellman 1986), they also obtain other mineral nutrition from
soil (Teixeira et al. 2002; Peguero and Espelta 2011). Plants grow less in nutrient-poor soils and
continued assimilation of carbon, not utilised in growth, results in the formation of carbon-based
defences. On the other hand, plants at high nutrient availability do not invest in defences as
growth is not restricted (Bryant et al. 1983). Savanna tree sapling establishment may depend on
species-specific abilities to resist fires (stem height and diameter growth), deter herbivores
(defence investment) and store root starch determined by the availability of soil nutrients.

28
We conducted an experiment to understand the resprouting ability, growth and defence
responses of four predominant African Acacia species‟ saplings to fire, five different nutrient
levels and their combinations. This experiment was conducted in the presence of grass
competition to mimic natural savanna conditions. We studied two humid savanna species (high
rainfall of >1,000 mm year-1
and low soil nutrients), viz. Acacia karroo (a subtropical coastal
variety from Richards Bay, Ward 2011) and A. sieberiana var. woodii and two mesic savanna
species (lower rainfall ~ 750 mm year-1
and nutrient-rich soils), viz. A. nigrescens and A. tortilis
(Du Toit 1995; Mordelet et al. 1997; Bond et al. 2003; Buitenwerf et al. 2012). We predicted the
following:
1. Fire, irrespective of the nutrient treatment given, will not have an effect on sapling
survival. Most savanna acacias are capable resprouters (Midgley and Bond 2001) even at
the seedling stage (Hean and Ward 2012).
2. Soil nutrients will have no effect on sapling survival and will mainly be necessary for
increased growth. Acacias have persistent cotyledonary reserves which provide
prolonged support after seedling emergence (Dube et al. 2010). Established seedlings are
hard to eliminate in the absence of disturbances and are capable of withstanding grass
competition with increased nutrient availability (Cohn et al. 1989).
3. Investment in growth and defence for resprouts will increase simultaneously, particularly
if competition with grass is removed. The growth rates of resprouting trees will be greater
in terms of height than in diameter. Although immediate plant growth after fire is
common for resprouters, induction of plant defences is also possible (Gowda and
Raffaele 2004) and a quick attainment of minimum escape height from subsequent grass

29
fires is important for successful recruitment (Higgins et al. 2000). The trade-off between
height growth to escape fires and diameter will result in tall shoots with small diameters
and low shoot biomass. Conversely, replenishment of root carbohydrate reserves will
increase root:shoot biomass ratios.
4. Stem growth investment will be high and allocation to defences should be low with an
increase in soil nutrients, regardless of grass competition. Resource-rich environments
favour fast-growing plants associated with low defences, while resource-poor areas
promote slow-growing plants with high defences (Endara and Coley 2011). To attain a
minimum escape height to avoid fires, savanna tree saplings should invest in stem height
growth faster than diameter with an increase in nutrient availability. Root carbohydrate
storage will decrease with the increase in available soil nutrients for sapling shoot
growth. Thus root:shoot biomass will decrease with increasing nutrient concentrations.
5. Saplings provided with both fire and nutrients will invest more in regrowth than defences
and their input in root storage will be slower than shoot growth, as soil nutrient levels
increase. Therefore, root:shoot biomass ratios of resprouts will decrease as nutrient
concentrations increase.
Materials and methods
Study design
We investigated the effects of five levels of fertilisation (control, 13, 26, 52 and 104 g –
details given below) and two levels of fire (control and fire) on the survival, growth and defence
responses of saplings of four Acacia species in a completely crossed randomized experiment

30
under greenhouse conditions. The temperature was controlled to mimic ambient conditions,
which fluctuated between 15 and 30 ˚C. Bins with a 95 L capacity (top diameter 0.45 m and
height 0.6 m) were filled with Umgeni sand aggregate (alluvial sand from the Umgeni river, near
Pietermaritzburg, South Africa). Each bin, which contained two saplings of the same species,
received one of the 10 treatment combinations (2 fire levels x 5 nutrient levels), which were
replicated three times. This resulted in a total of 240 saplings (60 saplings x 4 species) growing
in 120 bins. To replicate the grass component of the savanna, we sowed Eragrostis curvula, a
widespread savanna grass species, in each bin. A handful (~12 g) of grass seeds was sprinkled in
all the bins following the application of fertilizer, enabling them to establish prior to planting the
tree saplings.
Sapling development and transplantation
The seeds were scarified after being soaked in 95 % concentrated sulphuric acid for 1h.
They were then washed thoroughly with water to remove the traces of acid and then soaked in
water for 12 h. Thereafter, one seed was planted in a 750-mL potting bag containing a mixture
of soil, vermiculite and coconut coir (to increase porosity and water retention). After 2-3 months,
the saplings were transplanted into the bins in early January 2010, except the A. nigrescens
saplings that were transplanted a month later due to delayed germination. The mean ± SE
heights of the saplings at the time of transplantation were 284.31 ± 34.20 mm for Acacia karroo,
124.25 ± 13.34 for A. nigrescens, 226.29 ± 41.24 mm for A. sieberiana, 63.05 ± 18.21 mm for A.
tortilis. Two saplings in each bin were positioned at least 0.30 m apart across the bin diameter to
reduce the probability of intraspecific root competition. Only saplings with no foliar damage
were transplanted with minimal or no disturbance to the roots. Saplings were allowed to

31
acclimate to the new conditions for 1 month and any saplings that died during this period were
replaced (n = 3).
Nutrient treatment
The nutrient compound applied was an Osmocote® exact fertiliser, which was a water-
soluble, granular, controlled-release fertilizer with 15 % of total nitrogen, 9 % phosphorus
pentoxide, 11 % potassium oxide, 2.5 % magnesium oxide and other trace elements. This
fertiliser was chosen for the steady and continuous release pattern over the study period. We took
26 g (1N) of Osmocote®
fertilizer as a basic amount, for each 0.16 m2 surface area of the bin, to
compute the five levels of nutrient application: 0 g (0N); 13 g (0.5N); 26 g (1N); 52 g (2N) and
104 g (4N). Nitrogen among all other nutrients is the most important element in plant growth,
according to Liebig‟s law (Tilman 1987). The basic amount of (26 g) fertiliser was calculated
such that nitrogen supply rate will be at 24.3 g N m-2
year-1
, which is close to the highest
nitrogen application rate of 27.2 g N m-2
year-1
used by Tilman (1987). Several Acacia species
nodulate (De Faria et al. 1989); nutrient addition in terms of nitrogen may seem redundant for
nitrogen-fixing acacias. However, fixing nitrogen, like growth, is a major carbon investment for
the plant (Chapin et al. 1987) and nodulation decreases as soil nutrients increase (Kambatuku et
al. 2013). Hence, we assumed that despite being able to fix nitrogen, addition of nitrogen should
still have an effect on sapling growth and our nutrient prediction will hold true. Each bin was
fitted with a micro-jet irrigation system with the capacity to deliver 20 L h-1
and operated for half
an hour every day, to provide water to the saplings.

32
Fire treatment
One month after the saplings were established, fire was applied to half the bins at
sufficient intensity (flame height ≤ 0.45 m) to burn all the above-ground plant material. One
week prior to burning, the grass in the bins was cut and placed in the same bins to dry, which
provided the fuel for burning. A butane blow torch was used to burn the grass and a metal shield,
encircling the saplings about to be burnt, prevented the fire from spreading to other bins. Soil
temperature readings (in ˚C) at a depth of 5 cm were recorded in each bin using a digital
thermosensor probe before setting fire to the grass and immediately after the fire subsided. The
difference in soil temperature gave an indication of temperature increase in the top soil. There
was no significant difference across the nutrient levels in either grass dry biomass (used as fuel)
at the time of burning (ANOVA, F = 1.32, error df = 59, p = 0.274) or soil temperature
(ANOVA, F = 1.86, error df = 57, p = 0.130), ensuring homogeneity of fire treatment. The
burned saplings were left to regrow for 4 weeks.
Growth variables
Measurements of all surviving saplings were taken in March 2010 and July 2010 (in
April 2010 and July 2010 for A. nigrescens). Stem height (from base to tip of the plant in mm)
and stem basal diameter (mean of two readings taken diagonally opposite to each other 1 cm
above the soil in mm) were the physical growth attributes measured for each sapling. Height and
diameter of the longest stem of each coppice was measured. Percentage survival of saplings was
calculated as the number of live saplings at harvest relative to the number of live saplings before
burning. Calculations for relative growth rate of sapling stem height (RGRh) and relative growth
rate of basal stem diameter (RGRd) were based on the ln stem height increment and ln basal
33
diameter increment, respectively, per unit time (Kohi et al. 2009). All live saplings and grass
were harvested at the end of July 2010 and oven dried at 60 ˚C for 48 h. Root and shoot dry
biomasses were assessed to evaluate sapling resource allocation. Root biomass is proportional to
its carbohydrate content (Schutz et al. 2009) and can act as an indirect quantification of root
reserves. Oven-dried grass biomass from each bin was also recorded.
Defence variables
Mechanical and chemical defence measures are positively correlated (Ward and Young
2002) and may reflect an overall investment in sapling defence investment. All species in this
study invest in condensed tannins (CT) and have either spines or prickles (Rooke et al. 2004;
Van Wyk and Van Wyk 2007; Zinn et al. 2007; Mboumba and Ward 2008). We measured CT
using a standard acid-butanol assay (Hagerman 2011), as CTs are the principal protein-
precipitating tannins found in forage leaves, reducing the animal‟s digestive ability by directly
binding to their gut proteins (Horigome et al. 1988), forming a direct measure of unpalatability to
herbivores. We used 2 g of the dried and powdered leaf material per sapling to prepare the
extracts for the assay. The absorbance was read at 550 nm with a spectrophotometer (Hagerman
2011). The CT concentration was calculated in mg mL-1
quebracho equivalents (QE) because
there is no absolute standard for CT (Hagerman 2011). Quebracho for the standard was obtained
from A. Hagerman (Miami University, Oxford, Ohio, USA).
Mean lengths of four thorns were measured on each surviving sapling in the final month
of the experiment. The main stem was divided into four equal regions from the apex to the base
and the longest thorn in each region was measured. The linear length from base to tip of each
thorn was taken, using vernier calipers.

34
Data analysis
All analyses were done using GenStat (Version 12.1, VSN International 2009). Mean
values of the two saplings in each bin for each variable were used for analysis to avoid
pseudoreplication. However, the binomial data for survival of each sapling were considered.
Only the saplings that were not treated with fire were used to assess the effect of different
nutrient levels on survival because there was high mortality among the fire-treated saplings. χ2
tests were used to test for differences in sapling survival. Variables not conforming to ANOVA
assumptions were transformed. Box-Cox estimation of the best-fit power-lambda value (-0.3)
was used to transform thorn length data. Log10 values of root:shoot dry biomass ratio and CT
were used. All variables including ratio of RGRh to RGRd were analysed for each species
separately. In addition log10 values of root dry biomass and square root-transformed data of shoot
biomass were also analysed. High sapling mortality caused unequal sample sizes of the data sets;
therefore an unbalanced ANOVA (Shaw and Mitchell-Olds 1993) with fire and nutrients as fixed
factors was performed. A two-way ANOVA was performed on the grass biomass data to check
for fertiliser effect. Scheffe post hoc tests were done for multiple comparisons.
Results
Sapling survival
Fire had a high impact on sapling survival. Of the saplings treated with fire, only 22.5 %
survived, compared with a survival of 84 % of the control saplings (χ2
= 88.24, n = 240, p <
0.0001). There was no significant effect of fire on sapling survival in A. sieberiana (χ2
= 0.08, n
= 60, p = 0.77). Fire had a significant negative effect on A. nigrescens (χ2
= 41.71, n = 60, p <
35
0.0001) and A. tortilis (χ2 = 21.55, n = 60, p < 0.0001) and clearly on A. karroo (no survival, n =
30). The highest coppice survival was observed in A. sieberiana (70 %), followed by A.
nigrescens (10 %) and A. tortilis (10 %), with no survival in A. karroo (χ2
= 52.90, n = 120, p <
0.0001). Among the saplings not treated with fire, humid species - A. karroo (100 %) and A.
sieberiana (93 %) - had better survival than mesic species - A. nigrescens (73 %) and A. tortilis
(69 %) (χ2
= 15.10, n = 119, p < 0.01).
There was no significant effect of different levels of nutrients on the survival of the
unburned saplings (A. karroo, no test, 100 % survival; A. nigrescens, χ2
= 8.57, n = 30, p = 0.07;
A. sieberiana, χ2
= 4.43, n = 30, p = 0.35; A. tortilis, χ2
= 3.92, n = 30, p = 0.41) and burned
saplings (A. karroo, no test, 0 survival; A. nigrescens, χ2
= 2.22, n = 30, p = 0.69; A. sieberiana,
χ2
= 0.63, n = 30, p = 0.95; A. tortilis, χ2
= 5.92, n = 30, p = 0.20).
Growth and defence responses
Fire had a significant effect on the sapling relative growth rate ratio of A. nigrescens and
A. sieberiana (Table 1). RGRh: RGRd of the coppicing main stems of these species was higher
than unburnt saplings (Fig. 1). No significant differences were found in the ratio between root
and shoot dry biomass with any of the treatments (Table 1). Additionally, root (F = 9.64, error df
= 26, p = 0.006; Fig. 2a) and shoot dry biomass (F = 7.79, error df = 26, p = 0.013; Fig. 2b) was
significantly higher only in unburned A. sieberiana when compared to the burned saplings of the
same species. Fire had no significant effect on the condensed tannin levels of all saplings (Table
1). The final thorn length of A. nigrescens was significantly affected by the fire treatment (Table
1). However, the sample size of the fire-treated A. nigrescens saplings with thorns was very
small (n = 2) and consequently is not discussed further.

36
Fertiliser had a significant effect on grass biomass with and without fire (F = 3.44, error
df = 116, p < 0.05). In both burned and unburned treatments, grass biomass increased with
successive nutrient increments (Fig. 3). Nutrients had a significant effect on the relative growth
rate ratio of A. nigrescens (Table 1). Growth rate ratio in A. nigrescens increased at lower levels
of added fertiliser when compared to high levels (Fig. 4). Nutrients had a significant effect on
tannins in unburned A. karroo only (Table 1). CT concentrations of A. karroo were lowest at the
intermediate level of nutrients provided (Fig. 5). Nutrient treatments had no significant effect on
the final thorn length of the four Acacia saplings (Table 1). Except with regard to the RGRh:
RGRd ratio of A. nigrescens, fire × nutrient interactions had no significant effect on the growth
and defence responses of the studied Acacia saplings. However, the sample size of resprouts at
different individual nutrient levels is very small (n = 1) and is not discussed further.
Discussion
General patterns in sapling investment strategies, based on the treatments applied and
common to all four acacias, were not observed. In accordance with our prediction, nutrient level
increase had no effect on the survival of intact Acacia saplings. Dube et al. (2010) have found
that in the absence of disturbances, Acacia seedlings had 100 % survival rate due to their
persistent cotyledons, which assist in establishment. Seedlings can survive even in the presence
of very little photosynthetic plant material (Kitajima 2003). Hence, without disturbances,
mortality is rare in established tree seedlings (Gignoux et al. 2009). We also found that nutrients
had no effect on the survival of saplings treated with fire. This could be due to the overpowering
effect of fire which killed many saplings. However, A. sieberiana had high survival after fire
without any nutrient effect. Hence, soil nutrients do not appear to play a role in the survival of

37
Acacia saplings. High mortality after fire, excluding A. sieberiana, observed in our study is in
contrary to our prediction. Although Hean and Ward (2012) recorded 100 % survival in multiple
Acacia species following burning, they did not test A. nigrescens, A. tortilis and the sub-species
of A. karroo which performed poorly with fire treatment in our study. Hence survival ability in
Acacia saplings after fire may not be generalised for the entire genus.
Consistent with our prediction, fire improved the subsequent growth rates of stem height
relative to diameter in A. nigrescens and A. sieberiana. Higgins et al. (2000) implied that plant
growth in terms of height is an important strategy to escape fire. Contrastingly, stem diameter
has also been shown to be critical for escape through fire for savanna plants (Hoffmann and
Solbrig 2003; Balfour and Midgley 2006). Recently, Lawes et al. (2011) have suggested that
stem height and diameter growth are different pathways to achieve bark thickness adequate
enough to protect the cambium and buds. Gowda and Raffaele (2004) have found that burned
plants of Berberis spp., a fire-adapted genus, invested in defence without overcompensating
shoot growth. However, contrary to our prediction, investment in defences after fire is not
fundamental for the Acacia species we studied.
Nutrient increase did not have an effect on the growth and defence investment of Acacia
saplings as predicted. However, increased RGRh: RGRd ratio of A. nigrescens (0.5N, 1N) and a
decline in CT concentration of A. karroo at intermediate levels (1N) of fertiliser could indicate
high utilisation of nutrients in sapling growth at these levels. This result partially supports our
hypothesis that savanna saplings invest in growth and not in defences with increasing nutrient
availability. High levels of supplemented nutrients (2N, 4N) would have resulted in an increase
in grass competition, which might have reduced sapling stem growth rates and increased defence

38
investment. Cohn et al. (1989) had observed that stargrass (Cynodon dactylon) was a better
competitor than Acacia smallii seedlings in the presence of nutrients. However, no significant
change in grass biomass at intermediate nutrient levels (0.5N, 1N) might indicate a higher
competitive ability of Acacia saplings than grasses.
We observed no difference in root to shoot biomass ratio under any given treatment. This
indicates that the carbohydrate reserves from resprouting roots are replenished simultaneously as
shoots develop and contrary to our prediction, shoot growth does not exceed root biomass with
the increase in soil nutrient availability. Furthermore, though the resprouts in A. sieberiana are
smaller than unburnt saplings in terms of root and shoot biomass, the proportion of investment in
roots and shoots remains similar under any given treatment.
Conclusions
Sapling survival was not affected by soil nutrients. Mortality due to fire varies highly
among Acacia species and cannot be generalised. Stem height growth of Acacia saplings
increased rapidly after fire with no change in defence investment. Soil nutrient increase can be
beneficial to Acacia sapling growth to a certain extent, with a reduction in defence investment
and ability to withstand grass competition. The negative effects of increased grass competition
on sapling growth (Cohn et al.1989; Van der Waal et al. 2009) was limited only to high levels of
nutrient availability. Post-fire resprouting shoots invest simultaneously in root and shoot
biomass.

39
Acknowledgements
We would like to thank Mduduzi Nene, Andile Shange, Nompumelelo Shishane and Patrick
Shishane for their help with the practical aspects of the project. Thanks are due to Alison Young
and Vanessa Stuart for technical assistance. We thank Jennifer Russell and Desale Okubamichael
for their comments on an earlier draft. We would also like to thank anonymous reviewers for
their valuable suggestions to improve the manuscript. We are grateful to the National Research
Foundation for funding DW.
References
Archibald S, Bond WJ (2003) Growing tall vs growing wide: tree architecture and allometry of
Acacia karroo in forest, savanna, and arid environments. Oikos 102:3-14
Augustine DJ, McNaughton SJ (2004) Regulation of shrub dynamics by native browsing
ungulates on East African rangeland. J Appl Ecol 41:45-58
Balfour DA, Midgley JJ (2006) Fire induced stem death in an African acacia is not caused by
canopy scorching. Austral Ecol 31:892-896
Bond WJ, Midgley GF, Woodward FI (2003) The importance of low atmospheric CO2 and fire
in promoting the spread of grasslands and savannas. Glob Change Biol 9:973-982
Brooks R, Owen-Smith N (1994) Plant defenses against mammalian herbivores: are juvenile
Acacia more heavily defended than mature trees? Bothalia 24:211–215
Bryant JP, Chapin FS III, Klein DR (1983) Carbon/nutrient balance of boreal plants in relation to
vertebrate herbivory. Oikos 40:357-368

40
Buitenwerf R, Bond WJ, Stevens N, Trollope WSW (2012) Increased tree densities in South
African savannas: > 50 years of data suggests CO2 as a driver. Glob Change Biol 18:675-
684
Chapin FS III, Bloom AJ, Field CB, Waring RH (1987) Plant responses to multiple
environmental factors. BioScience 37:49-57
Cohn EJ, Auken OWV, Bush JK (1989) Competitive interactions between Cynodon dactylon and
Acacia smallii seedlings at different nutrient levels. Am Midl Nat 121:265-272
De Faria SM, Lewis GP, Sprent JI, Sutherland JM (1989) Occurrence of nodulation in the
Leguminosae. New Phytol 111:607-619
Du Toit JT (1995) Determinants of the composition and distribution of wildlife communities in
southern Africa. Ambio 24:2-6
Dube S, Mlambo D, Sebata A (2010) Response of Faidherbia albida (Del.) A. Chev., Acacia
nigrescens Oliver. and Acacia nilotica (L.) Willd ex Del. seedlings to simulated
cotyledon and shoot herbivory in a semi-arid savanna in Zimbabwe. Afr J Ecol 48:361-
367
Dublin HT, Sinclair ARE, McGlade J (1990) Elephants and fire as causes of multiple stable
states in the Serengeti-Mara woodlands. J Anim Ecol 59:1147-1164
Endara MJ, Coley PD (2011) The resource availability hypothesis revisited: a meta-analysis.
Funct Ecol 25:389-398
Gignoux J, Clobert J, Menaut JC (1997) Alternative fire resistance strategies in savanna trees.
Oecologia 110:576-583
Gignoux J, Lahoreau G, Julliard R, Barot S (2009) Establishment and early persistence of tree
seedlings in an annually burned savanna. J Ecol 97:484-495
41
Goheen JR, Palmer TM, Keesing F, Riginos C, Young TP (2010) Large herbivores facilitate
savanna tree establishment via diverse and indirect pathways. J Anim Ecol 79:372-382
Gowda J, Raffaele E (2004) Spine production is induced by fire: a natural experiment with three
Berberis species. Acta Oecol 26:239-245
Hagerman AE (2011) The tannin handbook. http://www.users.muohio.edu/hagermae/. Accessed
11 November 2011
Hanley ME (1998) Seedling herbivory, community composition and plant life history traits.
Persp Plant Ecol Evol Syst 1:191-205
Hean JW, Ward D (2012) Fire and herbivory are not substitutable: evidence from regrowth
patterns and changes in physical and chemical defences in Acacia seedlings. J Veg Sci
13:13-23
Helm C, Wilson G, Midgley J, Kruger L, Witkowski ETF (2011) Investigating the vulnerability
of an African savanna tree (Sclerocarya birrea ssp. caffra) to fire and herbivory. Austral
Ecol 36:964-973
Higgins SI, Bond WJ, Trollope WSW (2000) Fire, resprouting and variability: a recipe for grass-
tree coexistence in savanna. J Ecol 88:213-229
Hoffmann WA, Solbrig OT (2003) The role of topkill in the differential response of savanna
woody species to fire. For Ecol Manage 180:273-286
Horigome T, Kumar R, Okamoto K (1988) Effects of condensed tannins prepared from leaves of
fodder plants on digestive enzymes in vitro and in the intestine of rats. Br J Nut 60:275-
285
42
Kambatuku JR, Cramer MD, Ward D (2013) Nitrogen fertilisation reduces grass-induced N2
fixation of tree seedlings of semi-arid savannas. Plant Soil. doi: 10.1007/s11104-012-
1389-y
King J, Moutsinga JB, Doufoulon G (1997) Conversion of anthropogenic savanna to production
forest through fire-protection of the forest-savanna edge in Gabon, Central Africa. For
Ecol Manage 94:233-247
Kitajima K (2003) Impact of cotyledon and leaf removal on seedling survival in three tree
species with contrasting cotyledon functions. Biotropica 35:429-434
Kohi EM, de Boer WF, Slot M, van Wieren SE et al (2009) Effects of simulated browsing on
growth and leaf chemical properties in Colophospermum mopane saplings. Afr J Ecol
48:190-196
Kraaij T, Ward D (2006) Effects of rain, nitrogen, fire and grazing on tree recruitment and early
survival in bush-encroached savanna, South Africa. Plant Ecol 186:235-246
Lawes M, Clarke P (2011) Ecology of plant resprouting: populations to community responses in
fire-prone ecosystems. Plant Ecol 212:1937-1943
Lawes MJ, Adie H, Russell-Smith J, Murphy B, Midgley JJ (2011) How do small savanna trees
avoid stem mortality by fire? The roles of stem diameter, height and bark thickness.
Ecosphere 2: 1-13
Mboumba GB, Ward D (2008) Phenotypic plasticity and local adaptation in two extreme
populations of Acacia karroo. Afr J Range Forage Sci 25:121-130
Meyer KM, Wiegand K, Ward D (2009) Patch dynamics integrate mechanisms for savanna tree-
grass coexistence. Basic Appl Ecol 10: 491-499

43
Midgley JJ, Bond WJ (2001) A synthesis of the demography of African acacias. J Trop Ecol
17:871-886
Midgley JJ, Lawes MJ, Chamaillé-Jammes S (2010) Savanna woody plant dynamics: the role of
fire and herbivory, separately and synergistically. Aust J Bot 58:1-11
Miyanishi K, Kellman M (1986) The role of root nutrient reserves in regrowth of two savanna
shrubs. Can J Bot 64:1244-1248
Mordelet P, Menaut JC, Mariotti A (1997) Tree and grass rooting patterns in an African humid
savanna. J Veg Sci 8:65-70
Palo RT, Gowda J, Högberg P (1993) Species height and root symbiosis, two factors influencing
antiherbivore defense of woody plants in East African savanna. Oecologia 93:322-326
Paula S, Ojeda F (2011) Response to recurrent disturbance in two co-occurring resprouter heath
species: the ecological consequences of withstanding herbivores. Plant Ecol 212:2035-
2045
Peguero G, Espelta JM (2011) Disturbance intensity and seasonality affect the resprouting ability
of the neotropical dry-forest tree Acacia pennatula: do resources stored below-ground
matter? J Trop Ecol 27:539-546
Prins HHT, Van der Jeugd HP (1993) Herbivore population crashes and woodland structure in
East Africa. J Ecol 81:305-314
Rohner C, Ward D (1997) Chemical and mechanical defense against herbivory in two sympatric
species of desert Acacia. J Veg Sci 8:717-726
Rooke T, Danell K, Bergström R, Skarpe C, Hjältén J (2004) Defensive traits of savanna trees –
the role of shoot exposure to browsers. Oikos 107:161-171

44
Sankaran M, Ratnam J, Hanan N (2008) Woody cover in African savannas: the role of resources,
fire and herbivory. Glob Ecol and Biogeogr 17: 236-245
Scholes RJ, Archer SR (1997) Tree-grass interactions in savannas. Annu Rev Ecol Syst 28:517-
544
Schutz AEN, Bond WJ, Cramer MD (2009) Juggling carbon: allocation patterns of a dominant
tree in a fire-prone savanna. Oecologia 160:235-246
Shaw RG, Mitchell-Olds T (1993) ANOVA for unbalanced data: An overview. Ecology
74:1638-1645
Stamp N (2003) Out of the quagmire of plant defense hypotheses. Q Rev Biol 78:23-55
Staver AC, Bond WJ, Stock WD, Van Rensburg SJ, Waldram MS (2009) Browsing and fire
interact to suppress tree density in an African savanna. Ecol Appl 19: 1909-1919
Sumida A, Ito H, Isagi Y (1997) Trade-off between height growth and stem diameter growth for
an evergreen oak, Quercus glauca, in a mixed hardwood forest. Funct Ecol 11: 300-309
Teixeira PC, Novais RF, Barros NF, Neves JCL, Teixeira JL (2002) Eucalyptus urophylla root
growth, stem sprouting and nutrient supply from the roots and soil. For Ecol Manage
160:263-271
Tilman D (1987) Secondary succession and the pattern of plant dominance along experimental
nitrogen gradients. Ecol Monogr 57:189-214
Van der Waal C, de Kroon H, de Boer WF, Heitkönig IMA et al (2009) Water and nutrients alter
herbaceous competitive effects on tree seedlings in a semi-arid savanna. J Ecol 97:430-
439
Van Wyk B, Van Wyk P (2007) Field guide to trees of southern Africa. Struik, Cape Town

45
Wahungu GM, Mureu LK, Kimuyu DM, Birkett A, Macharia PG, Burton J (2011) Survival,
recruitment and dynamics of Acacia drepanolobium Sjøstedt seedlings at Olpejeta
Conservancy, Kenya, between 1999 and 2009. Afr J Ecol 49: 227-233
Ward D (2011) Population differentiation in a purported ring species, Acacia karroo
(Mimosoideae). Biol J Linn Soc 104:748-755
Ward D, Esler K (2011) What are the effects of substrate and grass removal on recruitment of
Acacia mellifera seedlings in a semi-arid environment? Plant Ecol 212:245-250
Ward D, Young TP (2002) Effects of large mammalian herbivores and ant symbionts on
condensed tannins of Acacia drepanolobium in Kenya. J Chem Ecol 28:921-937
Wigley BJ, Cramer MD, Bond WJ (2009) Sapling survival in a frequently burnt savanna:
mobilisation of carbon reserves in Acacia karroo. Plant Ecol 203:1-11
Zinn AD, Ward D, Kirkman K (2007) Inducible defences in Acacia sieberiana in response to
giraffe browsing. Afr J Range and Forage Sci 24:123-129

46
Table 1 Species-wise ANOVA (unbalanced design) results, showing the effects of fire (two levels), nutrients (five levels) and their
interactions on the growth and defence responses of Acacia karroo, A. nigrescens, A. tortilis and A. sieberiana saplings, after the
burning treatment was applied
Growth response parameters Defence response parameters
df RGRh : RGRd
Root : shoot biomass
df CT conc.
Thorn length
F
p
F
p
F
p
F
p
A. karroo Fire
-
-
-
-
- -
-
-
-
Nutrients 4 1.7
0.2260
1.06
0.4240
4 8.16
0.0050
0.13
0.9670
Fire × Nutrients -
-
-
-
- -
-
-
-
Error df
14
14
13
14 A. nigrescens
Fire 1 206.5
<0.0010
0.82
0.3860
1 1.07
0.3280
6.89
0.0280
Nutrients 4 13.18
<0.0010
0.8
0.5530
4 1.28
0.3480
1.15
0.3940
Fire × Nutrients 2 35.44
<0.0010
0.14
0.8680
1 3.6
0.0900
0.74
0.4110
Error df
17
17
15
15 A. sieberiana
Fire 1 42.6
<0.0010
0.08
0.7810
1 0.28
0.6020
4.22
0.0560
Nutrients 4 2.91
0.0640
0.52
0.7220
4 2.46
0.0910
0.33
0.8520
Fire × Nutrients 4 1.26
0.3360
1.77
0.1810
4 0.22
0.9250
0.37
0.8270
Error df
22
26
24
27 A. tortilis
Fire 1 5.6
0.0500
0.14
0.7170
1 0.2
0.6710
0.11
0.7440
Nutrients 4 0.73
0.6000
2.36
0.1510
4 0.99
0.4800
0.39
0.8110
Fire × Nutrients 1 0.36
0.5700
0.96
0.3600
1 1.65
0.2470
1.51
0.2540
Error df 13 13 12 14 Ratio of final-initial relative growth rate of stem height (RGRh) to final-initial relative growth rate in stem basal diameter (RGRd) measured in mm mm
-1
week-1
, final log 10 transformed root/shoot dry biomass ratio measured in mg, final log 10 transformed leaf CT concentration (in mg mL-1
QE) and final
power (-0.3) transformed mean thorn length (in mm) were analysed. The degrees of freedom (df), error df, F-value and significance are indicated per factor
and factor interactions. The values bold are significant (p < 0.05) and absent values are indicative of factors with df = 0

47
a
b
a b aa
Species
RG
R h
: R
GR
d
0
10
20
30
40
50
60
70
80No Fire
Fire
A.
nig
rescen
s
A.
tort
ilis
A.
sie
beri
an
a
Fig. 1 Mean (+ SE) of the post-fire ratio of final-initial relative growth rate of stem height
(RGRh) in mm mm-1
week-1
to final-initial relative growth rate of stem basal diameter (RGRd) in
mm mm-1
week-1
of Acacia saplings with and without fire treatment. Initial readings were taken
in March 2010 (except for A. nigrescens taken in April 2010) and the final readings were taken
in July 2010. Significant differences (p < 0.001) within the species as given by an unbalanced
ANOVA are indicated with dissimilar letters above the bars. Acacia karroo was excluded from
this comparison because there was complete mortality of burned saplings.

48
0
1
2
3
4
5
a
a
a
b a a
a)lo
g10 r
oo
t d
ry b
iom
ass (
mg
)
A. n
igre
scen
s
A. to
rtil
is
A. sie
beri
an
a
Species
Sq
ua
re-r
oo
t s
ho
ot
dry
bio
ma
ss
(m
g)
0
20
40
60
80
100
120
a
a
a
ba
a
b)
Species
A.
nig
res
ce
ns
A.
sie
be
ria
na
A.
tort
ilis
Fig. 2 Mean (+ SE) of the post-fire growth responses of Acacia saplings with ( ) and without
fire ( ) treatment. Significant differences (p < 0.05) within species as given by an unbalanced
ANOVA are indicated with dissimilar letters above the bars. a Final log10 transformed root dry
biomass in mg. b Final square root-transformed shoot dry biomass in mg. Readings were taken at
the end of the experiment in July 2010. Acacia karroo was excluded from this comparison
because there was complete mortality of burned saplings.
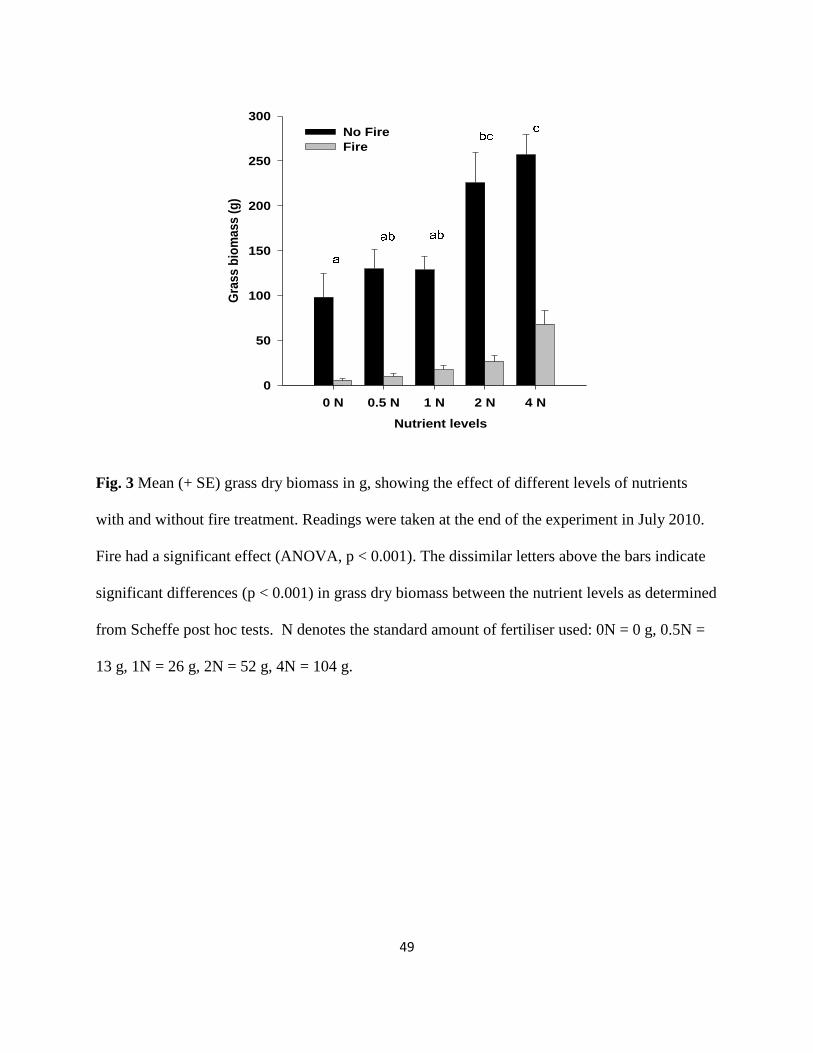
49
Nutrient levels
0 N 0.5 N 1 N 2 N 4 N
Gra
ss b
iom
ass (
g)
0
50
100
150
200
250
300
No Fire
Fire
Fig. 3 Mean (+ SE) grass dry biomass in g, showing the effect of different levels of nutrients
with and without fire treatment. Readings were taken at the end of the experiment in July 2010.
Fire had a significant effect (ANOVA, p < 0.001). The dissimilar letters above the bars indicate
significant differences (p < 0.001) in grass dry biomass between the nutrient levels as determined
from Scheffe post hoc tests. N denotes the standard amount of fertiliser used: 0N = 0 g, 0.5N =
13 g, 1N = 26 g, 2N = 52 g, 4N = 104 g.

50
Nutrient levels
0N 0.5N 1N 2N 4N
RG
Rh
: R
GR
d
0
10
20
30
40
50
b
aaa
c
Fig. 4 Mean (+ SE) of the post-fire, ratio of final-initial relative growth rate of stem height
(RGRh) in mm mm-1
week-1
to final-initial relative growth rate of stem basal diameter (RGRd) in
mm mm-1
week-1
of A. nigrescens, showing the effect of different levels of nutrients (including
the data from individuals treated with fire). Initial readings were taken in April 2010 and the
final readings were taken in July 2010. The dissimilar letters above the bars indicate significant
differences (p < 0.01) among different nutrient levels, as determined from Scheffe post hoc tests.
N denotes the standard amount of fertilizer used: 0N = 0 g, 0.5N = 13 g, 1N = 26 g, 2N = 52 g,
4N = 104 g.

51
a
Nutrient levels
0N 0.5N 1N 2N 4N
log
10 C
T c
on
cen
trati
on
(m
g m
l-1 Q
E)
1.68
1.70
1.72
1.74
1.76
ab
b
a
ab
Fig. 5 Mean (+ SE) log10 transformed leaf CT concentrations of A. karroo, showing the effect of
different levels of nutrients without any fire treatment. The dissimilar letters above the bars
indicate significant differences (p < 0.01) among different nutrient levels as determined from
Scheffe post hoc tests. N denotes the standard amount of fertilizer used: 0N = 0 g, 0.5N = 13 g,
1N = 26 g, 2N = 52 g, 4N = 104 g.

52
Chapter 3: Shade, nutrients and grass competition are important for tree sapling
establishment in a humid savanna
Snehalatha Vadigi1, and David Ward
1,2
1School of Life Sciences, University of KwaZulu-Natal, Private Bag X01, Scottsville,
Pietermaritzburg, 3209, South Africa
2Email: [email protected]
# Submitted to Ecosphere on October 31st 2012.

53
Abstract. The structure and function of savannas is contingent upon tree sapling
establishment into the ecosystem. Frequent rainfall, canopy shade and nutrient availability are
the factors influencing recruitment of tree saplings. Grass competition has potential to change the
tree establishment dynamics by interacting with these factors. The factors affecting tree sapling
establishment have been well studied and tested in arid and semi-arid environments (approx. 750
mm MAP) compared to humid (> 1000 mm MAP) savanna ecosystems. We studied the effects
of water (frequent irrigation vs. rainfall), shade (presence vs. absence), nutrient (addition vs. no
addition) and grass competition (presence vs. absence) on sapling survival and growth of four
humid savanna species and four mesic savanna species, under controlled field conditions in a
humid South African savanna. None of the treatments had an effect on sapling survival. Growth
of the saplings did not depend on the frequency of watering, probably due to high rainfall
received in humid savannas. Shade had a strong negative effect on sapling growth, suppressing
the beneficial effects of nutrient availability and absence of grass competition. Net positive
effects of nutrient availability had less influence over sapling growth compared to the negative
effects exerted by grass competition. Overall shoot growth increased with nutrients while
investment in leaves drastically declined with grass competition. We conclude that canopy shade
is a strong potential driver of structure and function of humid savanna ecosystems, although we
recognize that nutrient limitation and grass competition additionally influence tree sapling
establishment.
Key words: relative growth rate; sapling survival; grass competition; tree canopy; mesic
savanna species; water availability; nutrients; Acacia.
54
INTRODUCTION
Savanna ecosystems are characterized by the co-existence of trees and grasses (Frost et
al. 1986, Sankaran et al. 2004). Trees alter savanna ecosystem properties through interception of
solar radiation, soil nutrient mediation and water availability (Vetaas 1992, Roos and Allsopp
1997, Shaw et al. 2002, Ludwig et al. 2003). Sapling recruitment is a critical life history stage of
savanna woody plants which have long life spans (Scholes and Archer 1997, Chidumayo 2008).
If the environmental conditions are not conducive, sapling establishment can be a major concern
for tree recruitment into the ecosystem (Midgley and Bond 2001). Therefore, the factors that
influence successful establishment of tree saplings into savannas control ecosystem functioning
(Shaw et al. 2002). Sapling limitation by disturbances, fire and herbivory is often very intense
(Midgley et al. 2010). Apart from disturbances, recruitment is also strongly limited by resource
availability (water, light and nutrients) and grass competition (O‟Connor 1995, Kraaij and Ward
2006, Sankaran et al. 2008, Riginos 2009, Ward and Esler 2011).
Woody cover is primarily determined by water availability in arid or semi-arid regions (<
650 mm mean annual precipitation) while other (disturbance-based) factors play an important
role in tree cover dynamics in areas receiving > 650 mm MAP (Sankaran et al. 2005). Kraaij and
Ward (2006) found that rainfall was the key factor in Acacia mellifera sapling establishment. In
many savannas, seeds germinate with the onset of rainy season after being stimulated by dry
season fires (Gashaw and Michelsen 2002). However, an early wet season drought after
germination can cause heavy mortality of tree saplings (Harrington 1991, Hoffmann 1996,
Gignoux et al. 2009). Therefore, frequent rainfall is more important than overall mean annual
precipitation in estimating tree sapling establishment (Hoffmann 1996, Wilson and Witkowski

55
1998, Kraaij and Ward 2006). In their patch dynamics model, Meyer et al. (2007) have also
explained the importance of recurring rainfall events for trees to establish.
Established woody plants often facilitate tree sapling recruitment by ameliorating
stressful environments. Canopy microsite facilitation may enable the woody colonisers to form
bush clumps (San José et al. 1991, O‟Connor 1995, Rolhauser et al. 2011). Generally, canopy
microsites enhance the recruitment and survival of woody saplings by intercepting light and
thereby reducing high irradiance, increasing soil moisture, enhancing nutrients due to the
decomposition of high litter cover and alleviating grass competition by shading grasses out
(Hoffmann 1996, Salazar et al. 2012). Heightened animal activity under canopies also increases
soil nutrient availability within the canopy zone (Vetaas 1992, Dean et al. 1999). However, other
studies have shown that grasses increase in density in sub-canopy zones, eliminating any tree
sapling establishment (Belsky et al. 1989, Scholes and Archer 1997, Abdallah and Chaieb 2012).
Additionally, seedling response to canopy cover may be species-specific (see Hoffmann 1996).
While shade may promote seedling establishment, some species such as Colophospermum
mopane exhibit shade intolerance (Mlambo and Nyathi 2004).
Nutrients can be the second most important resource limitation for tree sapling
establishment after rainfall (Kraaij and Ward 2006, Cramer et al. 2012). Nutrients have direct
positive effects and indirect negative effects on savanna tree sapling recruitment. Savanna
Acacia sapling growth rates were positively correlated with the available soil nutrients
(Wakeling et al. 2010). On the other hand, nutrient supplementation may cause an increase in
grass productivity which in turn suppresses tree sapling establishment (Cohn et al. 1989, Kraaij

56
and Ward 2006, Riginos 2009, van der Waal et al. 2011). However, the presence of nutrients
may ameliorate the effects of grass competition (Cramer et al. 2012).
Competitive interactions between tree saplings and grasses may contribute significantly
to the structure and function of savanna vegetation (Cramer and Bond 2013, Grellier et al. 2012).
Grass competition affects savanna tree sapling establishment by mediating a number of abiotic
stresses (see e.g. Cramer et al. 2010). Tree seedlings compete with grasses directly for light,
mineral nutrients and soil moisture (Scholes and Archer 1997, van der Waal et al. 2009, Grellier
et al. 2012). Grass competition can suppress growth at all life history stages of woody plants with
a pronounced effect on sapling growth, survival and establishment (Riginos and Young 2007,
Riginos 2009, Cramer et al. 2010, Kambatuku et al. 2011). However, grasses may also facilitate
tree sapling establishment by providing moist microclimatic conditions and cover from browsers
(Riginos and Young 2007, Seymour 2008, Grellier et al. 2012).
Many studies have drawn conclusions on various environmental factor effects based on
semi-arid to mesic savanna systems. Hoffmann (1996), Gignoux et al. (2009), Rolhauser et al.
(2011) and Bond et al. (2012) have made some key observations on tree sapling establishment in
humid savannas. Very few studies conducted on savannas have concentrated on multiple species
to make general interpretations of the seedling dynamics across environmental gradients (see
Hoffmann and Franco 2003, Tomlinson et al. 2012). Differences in plant relative growth rates
within savanna species can have important consequences for the structure of savannas. Stem
survival ensures persistence of saplings in disturbance prone savannas and species-specific
functional traits determines sapling regenerative capacity. Biomass allocation to stems (Clarke et
al. 2013) and rapid stem growth rates in terms of height (Higgins et al. 2000) and diameter

57
(Gignoux et al. 1997) are the plant trait parameters found to be important in resisting fires.
Savanna trees resprout by utilising stored root carbohydrate reserves (Schutz et al. 2009)
substantially derived from leaf photosynthesis (Sakai and Sakai 1998). Hence, investment in
leaves or leaf biomass provides an indirect measure of sapling success in savannas. We designed
a controlled field experiment in a humid savanna to test the simultaneous effects of frequent
water availability, shade, nutrient availability and grass competition on sapling survival and
growth (in terms of shoot biomass, relative growth rates in stem length and diameter and leaf
biomass proportion) of four dominant humid (> 1000 mm MAP) savanna species and four
dominant mesic (approx. 750 mm MAP) savanna species. Based on the individual factor effects
followed by the interactive effects on sapling survival and growth, we predicted that:
1) Regular watering increases the tree seedling survival (Kraaij and Ward 2006).
Frequency of water availability has little effect on plant growth; however shrub
seedlings subjected to severe water stress or drought increase their input into root
biomass with a lower investment in shoots (Padilla et al. 2009). Hence, frequent
watering will increase the survival of tree saplings with a high input in shoot growth.
2) Canopy shade mitigates stressful conditions and facilitates tree seedling survival
(Salazar et al. 2012). Plants growing under shade have high allocation to stems and
leaves at the expense of roots (Poorter et al. 2012). Hence, shade will have a positive
effect on the survival and stem growth rates of all saplings with the exception of
shade-intolerant species such as Acacia tortilis (Smith and Shackleton 1988) and
Colophospermum mopane (Mlambo and Nyathi 2004).

58
3) Nutrients enhance the establishment success of tree seedlings (Siemann and Rogers
2003, Wakeling et al. 2010). It is well known that plants increase proportional
allocation to roots with a decrease in shoot investment, particularly in leaves, at low
nutrient levels (Poorter et al. 2012). Hence, nutrients will enhance the survival and
growth of tree saplings.
4) Grass competition suppresses tree sapling establishment even under high nutrient
availability (Grellier et al. 2012). Savanna tree seedlings increase their root biomass
with a decrease in aboveground growth, in the presence of grass competition (Cramer
et al. 2010, Kambatuku et al. 2011, Ward and Esler 2011). Hence, grass competition
will negatively effect sapling survival and growth.
5) While grass in the presence of high resources (regular water supply, natural light,
additional nutrients) will exert maximum negative effects on tree saplings, saplings
growing in the absence of grasses and in the presence of high resource levels will
have high survival and growth rates.
METHODS
Study site
The study was conducted on Mondi nursery grounds, KwaMbonambi which is situated in
the north-eastern coastal region of KwaZulu-Natal, South Africa (28˚35′59.20″ S, 32˚10′47.22″
E). The long-term mean annual rainfall (1984 – 2010) of the study area is 1250 mm with a

59
maximum rainfall of 2233 mm in 1987 and a minimum of 563 mm recorded in 1992. Although
precipitation is experienced throughout the year, rainfall in the area occurs predominantly in the
summer months and on average peaks in November and February.
The terrain at KwaMbonambi is generally flat and is comprised of Recent sediments of
Quaternary, clayey, alluvial sands of aeolian deposition overlying the Cretaceous conglomerates
of the Berea formation or Maputaland group (King 1982, Mucina and Rutherford 2006). The
high permeability of the soils allows rapid leaching of the nutrients due to heavy rainfall in these
areas. Vegetation is classified as Maputaland wooded grassland, which consists of flat coastal
plain supporting sandy grasslands rich in geoxylic suffrutices, dwarf shrubs and small trees
(Mucina and Rutherford 2006).
The experimental site was fenced to exclude large herbivores (> 5 kg) from the area.
Experimental blocks were laid out in an open, non-wooded and flat 70 m × 50 m area. The area
was mown in the past and was not previously fertilised. Topsoil samples (up to 15 cm depth)
were randomly collected from the experimental site and were sent to the University of KwaZulu-
Natal laboratory, Pietermaritzburg, South Africa for soil N and P analysis. Nitrogen was
analysed in a LECO Truspec Nitrogen Analyser (LECO corporation, Michigan) using the Dumas
combustion method and phosphorous was analysed using a Technicon Autoanalyser II
(Technicon Industrial Systems, Tarrytown, N.Y.). The topsoil in the study area contained a mean
(±SE) of 0.1051 (± 0.013) % total N and 0.0236 (± 0.0021) % total P on a dry matter basis (n =
12 samples).

60
Experimental design and treatments
We studied the effects of regular water availability, shade, nutrient availability and grass
competition on the sapling growth of eight savanna tree species. In order to test whether savanna
tree species from different climate types have a similar or different growth patterns with respect
to the treatments provided, we selected four humid savanna species, i.e. Acacia karroo Hayne (a
subtropical coastal variety from Richards Bay (Ward 2011)), Acacia sieberiana Burtt Davy,
Schotia brachypetala Sond. and Strychnos spinosa Lam. and four species from mesic savannas,
i.e. Acacia nigrescens Oliv., Acacia tortilis Hayne, Combretum apiculatum Sond. and
Colophospermum mopane J.Kirk ex J. Léonard, as our study species. Tree species were selected
based on dominance in their respective climate types. The most widespread grass species in
South Africa, Eragrostis curvula, was used to study the effects of grass competition on the tree
sapling growth.
The experimental site was cleared of all vegetation prior to the application of the
treatments. We adopted a split-plot design to accommodate and test for all the treatment factors
in a limited space. Water and shade treatments were applied at a whole plot level and at the split-
plot level the treatment combinations of nutrients and grass were provided. The two whole-plot
treatment factors of water (W) and shade (S) had two levels namely natural rain and even rainfall
frequency and natural light and shade respectively. Within each whole plot treatment
combination, two sub-plot treatment factors of nutrients or external fertilization (N) and grass
(G), with two levels, viz. presence and absence were provided. One set of four whole plots, each
containing four sub-plots was considered as one block unit. The whole plots in each block unit
were spaced at least 2 m apart from one another. Each block unit was replicated five times, with

61
at least 3 m distance between block units. Randomisation of block units in the experimental area
and whole plots within each block unit was done. Four saplings of each species were planted at
least 15 cm apart in sub-squares within each sub-plot. Hence, the four saplings of each species
were planted in [2W × 2S × (2N × 2G)] × 5 = 80 sub-plots.
Whole plot treatments were provided under experimental structures that were each 2 m
high by 7 m × 7 m (n = 20 whole-plots). Plastic-roofed structures, made of 200 μm-thick clear
greenhouse plastic film, were used to prevent the entry of rain water in the irrigated whole-plots.
Irrigation was provided such that each sub-plot, under even-water treated whole-plots, received
an amount of water close to the long-term average annual rainfall at regular time intervals (for 90
min every 24 h) over a period of 24 weeks. Within the experimental period of 6 months each
sub-plot in the open received about 1722 L or 431 mm (34 % of long-term MAP in this drought
year) of rainfall and in the irrigated whole-plots received 5000 L or 1250 mm (100 % of long-
term MAP) of water. Commercially available 80 % shade cloth was used for the whole-plot
structures treated with shade, such that saplings are shaded at all times. We used a Sunfleck PAR
Ceptometer model SF-80 (Decagon Devices Inc., Washington, DC, USA) and calculated the
PAR transmission percentage based on Bauhus et al. (2004). On a cloudless sunny day we
measured the photosynthetically active radiation (PAR) in µmol m-2
s-1
within a range of 400 –
700 nm. We recorded an average percentage transmission at 1 m above the ground, approx. 10 %
(87.3 µmol m-2
s-1
) and approx. 55 % (504.1 µmol m-2
s-1
) of PAR in the open (905.9 µmol m-2
s-
1) in the shaded plots and under the plastic roofed structures, respectively. The shade provided in
our study was substantial enough to mimic the attenuation of natural light under savanna trees.
For example, the canopies of Acacia mearnsii stands were reported by Bauhus et al. (2004) to

62
transmit 18.5 % of the open PAR. Salazar et al. (2012) have found that 32 % of natural sun light
was sufficient for sapling emergence in various Neotropical woody savanna species.
Four sub-plots of 2 m × 2 m area were situated at the centre, leaving a peripheral width of
1.25 m, of the whole-plot. Sub-plots within the whole plots were spaced 0.5 m apart from one
another. “Osmocote exact” was the nutrient compound applied to all sub-plots provided with
nutrient treatment. It was a water soluble, granular, controlled-release fertilizer. The nutrient
composition was 15 % N, 9 % P2O3, 11 % K2O, 2.5 % MgO and other trace elements. This
fertilizer was chosen for the steady and continuous release pattern over a 12 month period.
Nitrogen is an important limiting factor for plant growth in tropical savannas (Bremen and de
Wit 1983). The fertilizer was applied once-off in October 2009 at the rate of 4 g N m-2
month-1
.
This amount was approximately double the highest level of nitrogen (2.3 g m-2
month-1
) provided
by Tilman (1987) and 2.8 g N m-2
month-1
applied by Kraaij and Ward (2006) in their study. The
fertilizer applied amounted to 320 g/ m2. Ten days after the fertilizer was added, 300 g of grass
seeds were sown in each grass treatment sub-plot. Within each grass sub-plot, the soil was lightly
compacted after the grass seeds were added. Grasses were allowed to establish for two months
before tree saplings were transplanted into the plots. However, grass was cut to 2 cm above
ground prior to tree sapling transplantation to reduce grass competition and give some time for
the tree saplings to establish. All plots were weeded every month to keep other herbaceous plants
from interfering with the experiment. We observed that, under shade, grasses had established and
grew very well for the first few months but, by the end of the experiment, the grasses thinned
out. Therefore, in our analyses we have assumed that the tree saplings under the shade also
endured adequate grass competition.

63
Sapling development and transplanting
The hard-coated seeds of A. karroo, A. nigrescens, A. sieberiana, A. tortilis and S.
brachypetala were soaked in concentrated sulphuric acid and scarified for 1 h. They were then
washed thoroughly with water to remove the traces of acid and then soaked in water for 12 h.
The soft-coated seeds of C. mopane, C. apiculatum, and S. spinosa were not treated with acid but
were soaked in 0.2 % HgCl2 solution for 5 min to decontaminate the seeds and were then washed
thoroughly and soaked in water for 12 h. Each seed was planted in 750 mL potting bags, were
then allowed to grow in a mixture of soil, vermiculite and coconut coir. In order for the seeds to
adapt to natural soil conditions, soil (up to 15 cm depth) from the experimental site was used.
Vermiculite and coconut coir mixture was used to increase the porosity and water retention of
the soil. After planting the seeds, potting bags were placed in mist beds under shade, ensuring
moist conditions throughout the day. However, C. mopane seeds do not require a high water
supply, as they are highly permeable to water and germinate easily (Mlambo et al. 2007) and
therefore were watered once every week. Saplings were grown for 2 – 3 months and were
transplanted into the treatment plots. All the saplings were transplanted after the first heavy
rainfall for the season occurred; transplantation was completed by mid-January 2010. Acacia
nigrescens were represented in only four replicate block units due to low germination and
consequent lack of sapling availability. The potting bags were sprayed with a general
preventative fungicide (Previcur®) once every week until the saplings were transplanted.
Transplanted saplings in all plots were provided with water for a few days, allowing them to
adapt to natural conditions and mitigate stress. Some replacement of dead saplings (n = 412)
within a month after transplanting was done.

64
Data collection and compilation
Sapling survival status, as live or dead, was noted at the end of the wet season in June
2010 on all the saplings that were planted at the beginning of the experiment in February 2010.
Sapling growth measurements were taken at the beginning and the end of the experiment within
the wet season. Stem length (from the base to apex) and basal stem diameter (two perpendicular
readings) were the pre-harvest measurements taken on each sapling. At the end of the
experiment, in June 2010, aboveground plant material of half the number of live saplings were
harvested, marked and placed in brown paper bags. The other half of the saplings was allowed to
grow to the next season. Plant material collected was allowed to dry in a drying oven for 48 h at
60 ˚C. Harvested grass material was dried under the sun and weighed in g. Post-harvest dried leaf
and stem material of each tree sapling were weighed separately in mg.
A quick attainment of overall sapling growth is essential to ensure its establishment in a
savanna ecosystem (Vadigi and Ward 2012). Hence, we analysed sapling growth in terms of
relative growth rate of the stem length (RGRL), relative growth rate of the stem basal diameter
(RGRD), total aboveground dry weight, proportion of leaf dry biomass to the total aboveground
plant dry weight (leaf mass proportion). The total aboveground dry biomass for each tree sapling
was calculated as the sum of leaf and stem dry weight. Calculations for relative growth rate of
sapling stem length (RGRL) and relative growth rate of sapling basal stem diameter (RGRD) were
based on the increments in ln (stem length) and ln (basal diameter), respectively, per unit time
(Kohi et al. 2009).

65
Statistical analysis
We used linear mixed modelling with multilevel regression and analysed our data using
the R statistical program (R Development Core Team 2011). A multilevel model is not only
capable of integrating predictors that vary across different spatio-temporal scales but also can
incorporate non-predictor variables explaining the between-group variation (Qian et al. 2010).
Furthermore, linear mixed models are capable of dealing better with missing values in the data
than conventional ANOVA (Piepho et al. 2003; Schielzeth and Nakagawa 2012). The predictor
factor effects on binomial survival data were estimated by using “glmer” (generalized linear
mixed model) function and effects on sapling growth were analyzed by using ANOVA output of
the “lme” (linear mixed model) function.
In our full model, we tested the fixed effects of species (Spp), water (W), shade (S),
nutrients (N) and grass (G) treatments on the sapling survival and growth in order to understand
species differences in response to treatment factors given. Species were considered as fixed
effects because they were selected based on their dominance in either humid or mesic habitats.
We excluded A. nigrescens from our full model analyses due to many missing values
(unbalanced data), due to inadequate replication and complete sapling mortality which occurred
under natural conditions in the presence of nutrients and grass. The outcomes measured at the
sub-plot scale in the hierarchical structure are affected by factors measured at that scale and
factors working at the whole-plot level within the randomized blocks (Qian et al. 2010;
Schielzeth and Nakagawa 2012). A random factor was modelled to adjust variations in the data
due to a complicated spatial pseudo-replication arising from the split-plot design (Piepho et al
2003, Crawley 2007). We considered a split-plot error term associated with the treatment factors,

66
representing a sub-plot level interaction of nutrient and grass within a whole-plot level of water
and shade interaction within block (Blk) in our maximum likelihood models. In other words,
block and the block × treatment interaction were considered as random effects in the models. We
analysed the sub-plot means for each measured growth response variable of each species to avoid
pseudo-replication at the sapling level. Equation (1) shows an example of the „lme‟ model used
in R for the overall analysis:
Overall RGRL ~ Spp*W*S*N*G, random=~1|Blk/W:S/N:G Eqn (1)
The above model represents predictor parameter effects on relative growth rate in sapling
stem length (RGRL) as a linear function of all species interacting with full factorial treatment
factors viz. water (W), shade (S), nutrients (N), and grass (G) with a split-plot error. To test for
the effects of treatments on individual species we modelled individual species growth as a linear
function of the full factorial treatment effects, excluding the largest four-way interaction term for
A. nigrescens, with split-plot error term in Eqn (2).
Individual spp RGRL ~ W*S*N*G, random=~1|Blk/W:S/N:G Eqn (2)
To avoid Type Ι errors we only present individual species results where they are
consistent with the overall analysis. However, the results for A. nigrescens, which were not
included in our full model analyses, are presented separately. We also performed similar
generalized linear mixed model (glmer) analyses on sapling survival, but observed no overall
effects of the various treatments provided. Hence, the results of survival analyses are not
presented. We observed 79 % overall sapling survival. All growth variables were checked for
general linear model assumptions and the variable, sapling dry biomass, was log10 transformed to

67
ensure normal distribution and homogeneity of variances. All main effects, interactions and
treatment differences were considered to be significant at α = 0.01, after Bonferroni corrections.
RESULTS
Relative growth rate of sapling stem length
There were significant differences among the species in all parameters measured (Table
1). Water did not have an overall effect on relative growth rate of sapling stem length (RGRL)
(Table 1). RGRL differed significantly among species with the shade treatment (Table 1). There
was an inconsistent pattern of investment in RGRL between species of same savanna type with
respect to shade treatment (Fig. 1a, b). Nutrients had an overall significant positive effect on
sapling RGRL (Table 1). When each species was tested separately, the nutrient fertilisation was
positive and significant only for C. mopane saplings (Table A6; mean ± 1SE, 0.007 ± 0.003 mm
mm-1
week-1
without nutrients and 0.020 ± 0.003 mm mm
-1 week
-1 with nutrients). Shade and
nutrient interactions had a significant effect on overall sapling RGRL (Table 1). All species
showed a positive effect of nutrients on RGRL only in the presence of natural light (Fig. 2a, b).
Overall, sapling RGRL decreased significantly in the presence of grass competition (Table 1).
When each species was tested separately, the results were significant for S. brachypetala only
(Table A3; mean ± 1SE, 0.027 ± 0.003 mm mm-1
week-1
with no grass and 0.016 ± 0.002 mm
mm-1
week-1
with grass). Shade and grass had a significant interaction effect on the overall
sapling RGRL (Table 1). The negative effect of grass on RGRL was found, under natural light, in
five out of seven species (Fig. 3a, b).

68
Relative growth rate of sapling basal stem diameter
Water did not have an overall effect on relative growth rate of sapling basal stem
diameter (RGRD) (Table 1). All species had significantly higher RGRD in the presence of natural
light when compared to the shaded saplings, except in S. spinosa where shade was beneficial to
sapling RGRD (Table 1, Fig. 4a, b). Nutrients had an overall significant positive effect on sapling
RGRD (Table 1). When the individual species was tested separately, the nutrient effects on
sapling RGRD were significant in all species except C. mopane (mesic spp.) and S. spinosa
(humid spp.) (Table A1 - A7). The shade by nutrient interaction was significant on overall
sapling RGRD (Table 1). The positive nutrient effect on sapling RGRD was higher only in the
presence of natural light in all species, except S. spinosa (Fig. 5a, b). Grass competition had an
overall significant negative effect on the sapling RGRD (Table 1). When each species was tested
separately, the significant negative effect of grass competition on RGRD was not observed for A.
sieberiana only (humid sp.) (Table A1 - A7). There was a significant interactive effect of shade
and grass on overall sapling RGRD (Table 1). However, the negative effect of grass competition
on sapling RGRD of all species was observed only under natural light conditions (Table 1, Fig.
6a, b).
Sapling dry biomass
Water had no significant overall effect on (log10) sapling dry biomass (SDB) (Table 1).
Shade had an overall significant negative effect on SDB (Table 1). The SDB of only A. karroo
and S. spinosa (humid spp.) were found not to be affected by shade treatment (Fig. 7a, b).
Nutrients had an overall significant effect on SDB. When considering the results from individual
species analyses, a positive significant difference was not observed in S. spinosa only (Table A1-

69
A7). Shade and nutrient interaction had a significant effect on the overall SDB (Table 1). The
positive effect of nutrient addition on SDB was observed only under natural light conditions in
all species, except S. spinosa (Fig. 8a, b). Grass competition had an overall significant negative
effect on SDB (Table 1). All species showed a significant decrease in their SDB with grass
competition (Table A1-A7). However, there was a significant shade by grass interactive effect on
overall SDB (Table 1). The negative effect of grass competition was observed only under natural
light conditions (Fig. 9a, b).
Proportion leaf to sapling dry biomass
Water, shade and nutrients did not have an overall effect on the proportion of the leaf
biomass (LP) of all species (Table 1). Grass competition had an overall significant negative
effect on sapling LP (Table 1). Based on the individual species analyses, there was a significant
decrease in the leaf biomass proportion of A. sieberiana and S. brachypetala (humid spp.) and A.
tortilis and C. mopane (mesic spp.), in the presence of grass (Table A1-A7). There was a
significant interactive effect of shade and grass on overall sapling LP (Table 1). The negative
effect of grass competition on sapling LP was observed under natural light conditions only, in all
species except S. spinosa (Fig. 10a, b).
Acacia nigrescens
No treatment had an effect on relative growth rate of stem length (RGRL) of A.
nigrescens saplings (Table 2). Grass competition had a significant negative effect on the relative
growth rate in stem basal diameter (RGRD) of A. nigrescens saplings (Table 2; mean ± 1SE,
0.046 ± 0.003 mm mm-1
week-1
without grass and 0.031 ± 0.003 mm mm-1
week-1
with grass).
The main effects of nutrient and grass had a significant impact on (log10) sapling dry biomass

70
(SDB) of A. nigrescens (Table 2). Acacia nigrescens saplings had higher SDB in the presence of
nutrients (3.547 ± 0.116 mg) than without nutrients (3.152 ± 0.114 mg). The presence of grass
competition reduced the SDB of A. nigrescens (mean ± 1SE, 3.606 ± 0.101 mg without grass and
3.016 ± 0.113 mg with grass). There was a significant interactive effect of shade and grass on A.
nigrescens‟ SDB (Table 2). A negative effect of grass competition on A. nigrescens‟ SDB was
observed only in the presence of natural light conditions (Fig. 11). Acacia nigrescens saplings
had a significantly higher proportion of leaf biomass (LP) in the presence of shade (0.338 ±
0.165, mean ± 1SE) than under natural light (0.245 ± 0.027, mean ± 1SE; Table 2). Water
interacting with grass had a significant effect on the LP of A. nigrescens saplings (Table 2).
Acacia nigrescens saplings had higher LP without grass competition and frequent watering
(0.334 ± 0.019, mean ± 1SE) than in the presence of grass and under natural rainfall (0.256 ±
0.044, mean ± 1SE).
DISCUSSION
Sapling survival
No treatment had a significant effect on the survival of the savanna tree saplings we
studied. Although there was high sapling mortality in open plots due to a short dry period
immediately after transplanting, irrigation and shade did not have a significant effect on sapling
survival, despite the fact that the even water treatment received approximately double the rainfall
that was received in the open. Humid savannas may receive solar radiation equivalent to arid
zones during the dry periods in between rainfall seasons (Jagtap 1995). Generally, dry spells
71
during the wet season are fatal to tree seedlings in arid/semi-arid savannas (Wilson and
Witkowski 1998, Kraaij and Ward 2006) and may also be so in humid savannas (Hoffmann
1996). However, irradiance received in humid savanna zones in Africa is reduced due to the
presence of cloud cover and suspended aerosols (Jagtap 1995) and may have promoted sapling
survival against adversity in the open plots. Hence, shade and an increase in moisture availability
under tree canopies (O‟Connor 1995) may have no effect on tree sapling survival in humid
savannas. Greater soil nutrient availability under tree canopies is also often cited as a plausible
reason for an increase in tree sapling survival (Vetaas 1992, Hoffmann 1996, Salazar 2012).
However, consistent with the findings of Vadigi and Ward (2012) for Acacia saplings, we found
no nutrient effect on sapling survival in any species. Grass competition, identified as the greatest
hurdle for sapling survival by Grellier et al. (2012) and Ward and Esler (2011), also did not have
an effect on sapling survival. Perhaps, in humid savannas, other environmental factors such as
temperature, fire and herbivory play a more influential role in savanna sapling survival (Shaw et
al. 2002, Hoffmann and Solbrig 2003, Sharam et al. 2006, Chidumayo 2008, Gignoux et al.
2009).
Sapling growth
Water
We found that frequent water supply had no effect on any measured growth parameters of
the savanna tree saplings, despite the fact that the even-water treatment received approximately
double the rainfall that was received in the natural-water treatment in this drought year. Many
studies have indicated the dependence of frequent rainfall in tree sapling establishment
(Hoffmann 1996, Wilson and Witkowski 1998, Kraaij and Ward 2006, Gignoux et al. 2009, van

72
der Waal et al. 2009). Contrastingly, our results show that in humid savannas, sapling growth
does not depend on rainfall frequency. This also indirectly supports the idea that trees growing in
sites receiving heavy rainfall (> 1000 mm mean annual rainfall) are not constrained by water
availability for their establishment (see also Sankaran et al. 2005). Nonetheless, we found that A.
nigrescens had a higher proportion of leaf biomass (LP) with irrigation in the absence of grass
competition when compared to A. nigrescens saplings growing in the presence of grass under
natural conditions. Similarly, Kraaij and Ward (2006) found that watering and grass defoliation
were necessary to trigger mass recruitment of A. mellifera saplings.
Shade
Shade had mixed effects, with more negative than positive effects, on sapling growth.
Very few positive effects were observed, for example on the RGRL of S. brachypetala and LP of
A. nigrescens. There is a strong consensus that mitigation of environmental stress under canopy
shade facilitates tree sapling growth (Hoffmann 1996, Siemann and Rogers 2003, Rolhauser et
al. 2011, Salazar et al. 2012). Low irradiance, reduced temperature and enhanced moisture
availability are the characteristics associated with shade benefiting sapling growth (Vetaas 1992,
O‟Connor 1995, Salazar et al. 2012). However, in our study, the more frequent negative effects
show that, in humid savannas, shade inhibited tree sapling establishment regardless of water
availability. Similarly, Milton (1982) has found that shade significantly reduced the growth rates
of certain Australian Acacia species. Furthermore, Chirara (2001) established that low irradiance
had a strong negative effect on A. karroo seedlings, even in the presence of high water
availability. Many savanna woody plants especially leguminous trees can be shade intolerant
(Kambatuku et al. 2011). As indicated earlier, the interception of solar radiation by cloud cover

73
and aerosols is higher in humid than arid savanna regions in Africa (Jagtap 1995) and more so
during the wet season. Therefore, it could possibly mean that the solar radiation received in
humid savannas is adequate for sapling growth and shading is detrimental. The positive growth
investment in S. brachypetala and A. nigrescens under shade may have led to an increase in
sapling efficiency of light reception. Due to low light availability under canopy shade, saplings
invest heavily in shoot growth and not in root reserves, which makes them more vulnerable to
drought (Barnes 2001). For this reason, fire is also a considerable threat, particularly as fire is a
phenomenon frequent to humid savannas (Bond 2008, Gignoux et al. 2009). Hence, the benefits
of shade on sapling growth in S. brachypetala and A. nigrescens may not apply to long-term
survival and growth.
Many studies have cited nutrient increases in the sub-canopy soil zone due to high litter
cover, animal droppings, nutrient re-distribution and N2 fixation by leguminous trees (Bernhard-
Reversat 1982, Belsky et al. 1989, Vetaas 1992, Belsky 1994, Scholes and Archer 1997,
Abdallah and Chaieb 2012, Boyd and Davies 2012, Salazar et al. 2012). Some of them have
noted an improvement in herbaceous production, as a result of an increase in sub-canopy soil
fertility (Belsky et al. 1989, Scholes and Archer 1997, Abdallah and Chaieb 2012), and quality
(Treydte et al. 2007). However, other authors have observed a decline in grass production under
shade (Hoffmann 1996, Salazar et al. 2012), especially in humid savannas (Mordelet and Menaut
1995). Ludwig et al. (2001) have concluded that herbaceous density depends on the interactions
between soil fertility, shade and water availability under tree canopies. Savanna tree saplings
establish well on highly fertile soils with no grass competition in the sub-canopy zones
(Rolhauser et al. 2011, Salazar et al. 2012). Conversely, we found that the majority of our study
species grew better (except in proportion of leaf biomass (LP)) with nutrients, but only under

74
natural light. We also found that the negative effect of grass competition on sapling growth was
suppressed under shade. In other words, except for a few species, the effect was significant only
under full sunlight. Midgley and Bond (2001) have described shaded under-canopy sites as poor
sites for Acacia sapling establishment. Similarly our results have indicated that shade exerts a
strong negative effect on savanna tree sapling growth despite favourable conditions in terms of
moisture and nutrient availability and decrease in grass competition. Hence, shade must be
included in modelling studies as an important manipulator of savanna ecosystem properties.
Nutrients
In most cases, the main effects of nutrient addition on sapling growth were not
significant. However, there were several instances of positive nutrient effects on sapling growth:
RGRL of C. mopane, RGRD of all spp except C. mopane, S. spinosa and A. nigrescens, SDB of
all species except S. spinosa. Tree species in savannas generally are associated with fertile soils
and have high nutritional requirements (Ben-Shahar 1991). However, moist-dystrophic savannas
may host increased woody vegetation of low nutritional quality (du Toit 1995). Additionally,
Acacia sapling growth rates were higher in nutrient-rich soils when compared to growth in
nutrient-poor grassland soils (Wakeling et al. 2010). In contrast, certain studies have found that
abundant soil nutrients improve herbaceous productivity which in turn suppresses tree sapling
establishment (Cohn et al. 1989, Kraaij and Ward 2006, van der Waal et al. 2011). Although we
did not find any significant nutrient-grass interactive effect on sapling growth, the negative
effects exerted by grasses were greater than the positive effects of nutrients (see also Kambatuku
et al. 2013 for Acacia mellifera). However, some positive nutrient effects observed in our study
could mean that nutrients partially ameliorate the effects of grass competition (see also Cramer et

75
al. 2012). We also found that most species invest in basal diameter and overall plant biomass
when provided with nutrients. Investment in stems (height or diameter) for increased growth out
of the “flame zone” is important for saplings (Lawes et al. 2011), especially in humid
environments.
Grass competition
Grass competition had a negative effect on sapling growth (but not survival – see above).
There was no effect of grass competition on RGRL of all species excluding A. nigrescens and S.
brachypetala, RGRD of A. sieberiana, and LP of S. spinosa and C. apiculatum. It is widely
understood that grass competition is a basic hindrance to savanna tree sapling establishment
(Riginos and Young 2007, Kambatuku et al. 2011, Ward and Esler 2011, Grellier et al. 2012).
Presence of grass competition reduces tree sapling growth even when conditions are conducive
for tree establishment (Riginos 2009, Ward and Esler 2011). However, exclusion of grass alone
might not be sufficient for tree sapling establishment (Seymour 2008). Alleviation of grass
competition with the presence of high rainfall and soil nutrients is necessary for mass tree
recruitment (Ward 2005, Kraaij and Ward 2006). With grass competition, saplings invested less
in biomass and leaves. This could mean that grasses outcompeted tree saplings. It could also
possibly mean that, in the presence of grass, saplings invested more in root biomass than in shoot
biomass (Riginos 2009) to reach deeper layers of soil for access to water and perhaps to
minimize competition. Kambatuku et al. (2011) have shown that the grasses competing with A.
mellifera saplings invested more in root production. In our study, we found that grass
competition had a considerable negative effect on sapling LP when compared to other treatments

76
provided. Therefore, proportional investment in leaves could be a good indicator of savanna tree
sapling sensitivity to grass competition.
CONCLUSIONS
Among the factors tested, shade is an important factor with the potential to affect the
ecosystem properties of a humid savanna. Shade exerted a strong negative effect on tree sapling
growth, reducing the beneficial effects of nutrients and absence of grass competition. Nutrient
supplementation increased sapling growth, especially in terms of basal diameter and total
biomass. Grass competition is detrimental to tree sapling growth. The negative effects of grass
competition are considerable relative to the benefits of nutrient addition on sapling growth (see
also Kambatuku et al. 2013). Sapling growth did not depend on the frequency of rainfall as the
mean annual precipitation is high in humid savannas. Environmental conditions in humid
savannas are conducive for the persistence of tree saplings (survival) without the necessity of any
additional resource benefits such as frequent water availability, canopy shade and nutrients.
Sapling survival was also not affected by the presence of grass competition.
Elevated CO2 levels associated with climate change, regardless of water availability or
nutrients may impose woody canopy closure in humid savannas (Murphy and Bowman 2012).
However, we found that shade inhibits savanna tree establishment in humid savanna ecosystems
and therefore canopy closure might be hard for savanna tree species to attain. However, forest
tree species are adapted to shade and can flourish under dense vegetation cover, particularly in
areas receiving high rainfall (Hoffmann et al. 2004). In humid savannas, frequent fires can be a

77
major hindrance to forest tree establishment, but canopy shade can protect saplings and facilitate
recruitment. In this context, we will further examine the factorial drivers of savanna-forest tree
sapling establishment in a South African humid savanna. This will help us understand the
existence of savanna-forest ecotone boundaries in African humid zones.
ACKNOWLEDGEMENTS
This study was funded by The Shell Foundation, The Netherlands and the National Research
Foundation, South Africa. We are grateful to people working at Mondi nursery in
KwaMbonambi, especially Mark Holmes, for helping us with the practical aspects of our
experimental study. We would like to thank Dr. Kyle Tomlinson for his valuable help with many
things. We thank Professor Joachim Saborowski and P.M.S.A. Ruwan of the University of
Göttingen, Germany for statistical advice. We would also like to thank Professor Michael J
Crawley of Imperial College and Professor Roger W Payne of VSN International, UK for their
help with our data analysis. We thank George Carelse, Stephné Stuart, Vanessa Stuart and Alison
Young for the technical assistance provided. We also thank Nomasonto Mthiyane, Thokozani
Myeza, Thuli Ncube, Akilimali Ngomu, Andile Shange, Nompumelelo Shishane and
Sphamandla Shishane for their assistance in the field.

78
LITERATURE CITED
Abdallah, F., and M. Chaieb. 2012. The influence of trees on nutrients, water, light availability
and understorey vegetation in an arid environment. Applied Vegetation Science 15:501-
512.
Barnes, M. E. 2001. Seed predation, germination and seedling establishment of Acacia erioloba
in northern Botswana. Journal of Arid Environments 49:541-554.
Bauhus, J., A. P. van Winden, and A. B. Nicotra. 2004. Aboveground interactions and
productivity in mixed-species plantations of Acacia mearnsii and Eucalyptus globulus.
Canadian Journal of Forest Research 34:686-694.
Belsky, A. J. 1994. Influences of trees on savanna productivity: tests of shade, nutrients, and
tree-grass competition. Ecology 75:922-932.
Belsky, A. J., R. G. Amundson, J. M. Duxbury, S. J. Riha, A. R. Ali, and S. M. Mwonga. 1989.
The effects of trees on their physical, chemical and biological environments in a semi-
arid savanna in Kenya. Journal of Applied Ecology 26:1005-1024.
Ben-Shahar, R. 1991. Abundance of trees and grasses in a woodland savanna in relation to
environmental factors. Journal of Vegetation Science 2:345-350.
Bernhard-Reversat, F. 1982. Biogeochemical cycle of nitrogen in a semi-arid savanna. Oikos
38:321-332.
Bond, W. J. 2008. What limits trees in C4 grasslands and savannas? Annual Review of Ecology,
Evolution and Systematics 39:641-659.
Bond, W. J., G. D. Cook, and R. J. Williams. 2012. Which trees dominate in savannas? The
escape hypothesis and eucalypts in northern Australia. Austral Ecology 37:678-685.

79
Boyd, C. S., and K. W. Davies. 2012. Differential seedling performance and environmental
correlates in shrub canopy vs. interspace microsites. Journal of Arid Environments 87:50-
57.
Bremen, H., and C. T. de Wit. 1983. Rangeland productivity and exploitation in the Sahel.
Science 221:1341-1347.
Chidumayo, E. N. 2008. Implications of climate warming on seedling emergence and mortality
of African savanna woody plants. Plant Ecology 198:61-71.
Chirara, C. 2001. Tree invasion in a semi-arid savanna in Zimbabwe: seedling recruitment of
Acacia karroo. PhD Dissertation. Utrecht University, The Netherlands.
Clarke, P. J., M. J. Lawes, J. J. Midgley, B. B. Lamont, F. Ojeda, G. E. Burrows, N. J. Enright,
and K. J. E. Knox. 2013. Resprouting as a key functional trait: how buds, protection and
resources drive persistence after fire. New Phytologist 197:19-35.
Cohn, E. J., O. W. van Auken, and J. K. Bush. 1989. Competitive interactions between Cynodon
dactylon and Acacia smallii seedlings at different nutrient levels. American Midland
Naturalist 121:265-272.
Cramer, M. D., and W. J. Bond. 2013. N-fertilization does not alleviate grass competition
induced reduction of growth of African savanna species. Plant and Soil 366:
Cramer, M. D., J. L. Wakeling, and W. J. Bond. 2012. Belowground competitive suppression of
seedling growth by grass in an African savanna. Plant Ecology 213:1655-1666.
Cramer, M. D., A. van Cauter, and W. J. Bond. 2010. Growth of N2-fixing African savanna
Acacia species is constrained by below-ground competition with grass. Journal of
Ecology 98:156-167.
Crawley, M. J. 2007. The R book. John Wiley & Sons, West Sussex, Chichester, England.

80
Dean, W. R. J., S. J. Milton, and F. Jeltsch. 1999. Large trees, fertile islands, and birds in arid
savanna. Journal of Arid Environments 41:61-78.
du Toit, J. T. 1995. Determinants of the composition and distribution of wildlife communities in
southern Africa. Ambio 1:2-6.
Frost, P., E. Medina, J. C. Menaut, O. Solbrig, M. Swift, and B. Walker, editors. 1986.
Responses of savannas to stress and disturbance. Report of a meeting of an IUBS
working group on decade of the tropics programme/tropical savanna ecosystems.
Biology International Special Issue 10. IUBS, Paris.
Gashaw, M., and A. Michelsen. 2002. Influence of heat shock on seed germination of plants
from regularly burnt savanna woodlands and grasslands in Ethiopia. Plant Ecology
159:83-93.
Gignoux, J., G. Lahoreau, R. Julliard, and S. Barot. 2009. Establishment and early persistence of
tree seedlings in an annually burned savanna. Journal of Ecology 97:484-495.
Gignoux, J., J. Clobert, and J. C. Menaut. 1997. Alternative fire resistance strategies in savanna
trees. Oecologia 110:576-583.
Grellier, S., S. Barot, J. L. Janeau, and D. Ward. 2012. Grass competition is more important than
seed ingestion by livestock for Acacia recruitment in South Africa. Plant Ecology
213:899-908.
Harrington, G. N. 1991. Effects of soil moisture on shrub seedling survival in semi-arid
grassland. Ecology 72:1138-1149.
Higgins, S. I., W. J. Bond, and W. S. W. Trollope. 2000. Fire, resprouting and variability: a
recipe for grass-tree coexistence in savanna. Journal of Ecology 88:213-229.

81
Hoffmann, W. A. 1996. The effects of fire and cover on seedling establishment in a neotropical
savanna. Journal of Ecology 84:383-393.
Hoffmann, W. A. and A. C. Franco. 2003. Comparative growth analysis of tropical forest and
savanna woody plants using phylogenetically independent contrasts. Journal of Ecology
91:475-484.
Hoffmann, W. A., B. Orthen, and A. C. Franco. 2004. Constraints to seedling success of savanna
and forest trees across the savanna-forest boundary. Oecologia 140:252-260.
Hoffmann, W. A., and O. T. Solbrig. 2003. The role of topkill in the differential response of
savanna woody species to fire. Forest Ecology and Management 180:273-286.
Jagtap, S. S. 1995. Environmental characterization of the moist lowland savanna of Africa. Pages
9-30 in B.T. Kang, I. O. Akobundu, V. M. Manyong, R. J. Carsky, N. Sanginga and E. A.
Kueneman, editors. Moist savannas of Africa: potentials and constraints for crop
production. Proceedings of the international workshop held at Cotonou, Republic of
Benin, 19 – 23 September 1994. International Institute of Tropical Agriculture, Ibadan,
Nigeria.
Kambatuku, J. R., M. D. Cramer, and D. Ward. 2011. Savanna tree–grass competition is
modified by substrate type and herbivory. Journal of Vegetation Science 22:225-237.
Kambatuku, J. R., M. D. Cramer, and D. Ward. 2013. Nitrogen fertilisation reduces grass-
induced N2 fixation of tree seedlings from semi-arid savannas. Plant and Soil 365:307-
320
King, L. C. 1982. The Natal monocline: explaining the origin and scenery of Natal, South Africa.
Second Edition. University of Natal Press, Pietermaritzburg.

82
Kohi, E. M., W. F. de Boer, M. Slot, S. E. van Wieren, J. G. Ferwerda, R. C. Grant, I. M. A.
Heitkönig, H. J. de Knegt, N. Knox, F. van Langevelde, M. Peel, R. Slotow, C. van der
Waal, and H. H. T. Prins. 2009. Effects of simulated browsing on growth and leaf
chemical properties in Colophospermum mopane saplings. African Journal of Ecology
48:190-196.
Kraaij, T., and D. Ward. 2006. Effects of rain, nitrogen, fire and grazing on tree recruitment and
early survival in bush-encroached savanna, South Africa. Plant Ecology 186:235-246.
Lawes, M. J., H. Adie, J. Russell-Smith, B. Murphy, and J. J. Midgley. 2011. How do small
savanna trees avoid stem mortality by fire? The roles of stem diameter, height and bark
thickness. Ecosphere 2:1-13.
Ludwig, F., H. de Kroon, H. H. T. Prins, and F. Berendse. 2001. Effects of nutrients and shade
on tree-grass interactions in an East African savanna. Journal of Vegetation Science
12:579-588.
Ludwig, F., T. E. Dawson, H. Kroon, F. Berendse, and H. H. T. Prins. 2003. Hydraulic lift in
Acacia tortilis trees on an East African savanna. Oecologia 134:293-300.
Meyer, K. M., K. Wiegand, D. Ward, and A. Moustakas. 2007. The rhythm of savanna patch
dynamics. Journal of Ecology 95:1306-1315.
Midgley, J. J. and W. J. Bond. 2001. A synthesis of the demography of African acacias. Journal
of Tropical Ecology 17:871-886.
Midgley, J. J., M. J. Lawes, and S. Chamaillé-Jammes. 2010. Savanna woody plant dynamics:
the role of fire and herbivory, separately and synergistically. Australian Journal of Botany
58:1-11.

83
Milton, S. J. 1982. Effects of shading on nursery grown Acacia seedlings. South African Journal
of Botany 48:245-272.
Mlambo, D., P. Nyathi, and E. Mwenje. 2007. Influence of microhabitat on survival of
Colophospermum mopane seeds and seedlings in a semi-arid African savanna. Pages 61-
78 in A. K. Scaggs, editor. New research in forest ecology. Nova Science Publishers,
Inc., New York, USA.
Mordelet, P. and J. C. Menaut. 1995. Influence of trees on above-ground production dynamics of
grasses in a humid savanna. Journal of Vegetation Science 6:223-228.
Mucina. L., and M. C. Rutherford, editors. 2006. The vegetation of South Africa, Lesotho and
Swaziland. Strelitzia 19. South African National Biodiversity Institute, Pretoria, South
Africa.
Murphy, B. P., and D. M. J. S. Bowman. 2012. What controls the distribution of tropical forest
and savanna? Ecology Letters 15:748-758.
O‟Connor, T. G. 1995. Acacia karroo invasion of grassland: environmental and biotic effects
influencing seedling emergence and establishment. Oecologia 103:214-223.
Padilla, F., J. Miranda, M. Jorquera, and F. Pugnaire. 2009. Variability in amount and frequency
of water supply affects roots but not growth of arid shrubs. Plant Ecology 204:261-270.
Piepho, H. P., A. Büchse, and K. Emrich. 2003. A hitchhiker‟s guide to mixed models for
randomized experiments. Journal of Agronomy and Crop Science 189:310-322.
Poorter, H., K. J. Niklas, P. B. Reich, J. Oleksyn, P. Poot, and L. Mommer. 2012. Biomass
allocation to leaves, stems and roots: meta-analyses of interspecific variation and
environmental control. New Phytologist 193:30-50.

84
Qian, S. S., T. F. Cuffney, I. Alameddine, G. McMahon, and K. H. Reckhow. 2010. On the
application of multilevel modeling in environmental and ecological studies. Ecology
91:355-361.
Riginos, C. 2009. Grass competition suppresses savanna tree growth across multiple
demographic stages. Ecology 90:335-340.
Riginos, C., and T. P. Young. 2007. Positive and negative effects of grass, cattle, and wild
herbivores on Acacia saplings in an East African savanna. Oecologia 153:985-995.
Rolhauser, A. G., E. J. Chaneton, and W. B. Batista. 2011. Influence of conspecific and
heterospecific adults on riparian tree species establishment during encroachment of a
humid palm savanna. Oecologia 167:141-148.
Roos, P. C., and N. Allsopp. 1997. Soil nutrient ecology associated with Acacia sieberiana at
different tree densities in a South African savanna. African Journal of Range and Forage
Science 14:39-44.
Sakai, A. and S. Sakai. 1998. A test for the resource remobilization hypothesis: tree sprouting
using carbohydrates from above-ground parts. Annals of Botany 82:213-216.
Salazar, A., G. Goldstein, A. C. Franco, and F. Miralles-Wilhelm. 2012. Differential seedling
establishment of woody plants along a tree density gradient in neotropical savannas.
Journal of Ecology. [doi: 10.1111/j.1365-2745.2012.02028.x]
San Jose, J. J., M. R. Farinas, and J. Rosales. 1991. Spatial patterns of trees and structuring
factors in a Trachypogon savanna of the Orinoco llanos. Biotropica 23:114-123.
Sankaran, M., N. P. Hanan, R. J. Scholes, J. Ratnam, D. J. Augustine, B. S. Cade, J. Gignoux, S.
I. Higgins, X. Le Roux, F. Ludwig, J. Ardo, F. Banyikwa, A. Bronn, G. Bucini, K. K.
Caylor, M. B. Coughenour, A. Diouf, W. Ekaya, C. J. Feral, E. C. February, P. G. H.
85
Frost, P. Hiernaux, H. Hrabar, K. L. Metzger, H. H. T. Prins, S. Ringrose, W. Sea, J.
Tews, J. Worden, and N. Zambatis. 2005. Determinants of woody cover in African
savannas. Nature 438:846-849.
Sankaran, M., J. Ratnam, and N. Hanan. 2008. Woody cover in African savannas: the role of
resources, fire and herbivory. Global Ecology and Biogeography 17:236-245.
Sankaran, M., J. Ratnam, and N. P. Hanan. 2004. Tree–grass coexistence in savannas revisited –
insights from an examination of assumptions and mechanisms invoked in existing
models. Ecology Letters 7:480-490.
Schielzeth, H., and S. Nakagawa. 2012. Nested by design: model fitting and interpretation in a
mixed model era. Methods in Ecology and Evolution. [doi: 10.1111/j.2041-
210x.2012.00251.x]
Scholes, R. J., and S. R. Archer. 1997. Tree-grass interactions in savannas. Annual Review of
Ecology and Systematics 28:517-544.
Schutz, A. E., W. J. Bond, and M. D. Cramer. 2009. Juggling carbon: allocation patterns of a
dominant tree in a fire-prone savanna. Oecologia 160:235-246.
Seymour, C. L. 2008. Grass, rainfall and herbivores as determinants of Acacia erioloba (Meyer)
recruitment in an African savanna. Plant Ecology 197:131-138.
Shaw, M. T., F. Keesing, and R. S. Ostfeld. 2002. Herbivory on Acacia seedlings in an East
African savanna. Oikos 98:385-392.
Sharam, G., A. R. E. Sinclair, and R. Turkington. 2006. Establishment of broad-leaved thickets
in serengeti, Tanzania: the influence of fire, browsers, grass competition, and elephants.
Biotropica 38:599-605.

86
Siemann, E., and W. E. Rogers. 2003. Changes in light and nitrogen availability under pioneer
trees may indirectly facilitate tree invasions of grasslands. Journal of Ecology 91:923-
931.
Smith, T. M., and S. E. Shackleton. 1988. The effects of shading on the establishment and
growth of Acacia tortilis seedlings. South African Journal of Botany 54:375-379.
Tilman, D. 1987. Secondary succession and the pattern of plant dominance along experimental
nitrogen gradients. Ecological Monographs 57:189-214.
Tomlinson, K. W., F. J. Sterck, F. Bongers, D. A. da Silva, E. R. M. Barbosa, D. Ward, F. T.
Bakker, M. van Kaauwen, H. H. T. Prins, S. de Bie, and F. van Langevelde. 2012.
Biomass partitioning and root morphology of savanna trees across a water gradient.
Journal of Ecology 100:1113-1121.
Treydte, A. C., I. M. A. Heitkönig, H. H. T. Prins, and F. Ludwig. 2007. Trees improve grass
quality for herbivores in African savannas. Perspectives in Plant Ecology, Evolution and
Systematics 8:197-205.
Vadigi, S., and D. Ward. 2012. Fire and nutrient gradient effects on the sapling ecology of four
Acacia species in the presence of grass competition. Plant Ecology 213:1793-1802.
Van der Waal, C., A. Kool, S. S. Meijer, E. Kohi, I. M. A. Heitkönig, W. F. de Boer, F. van
Langevelde, R. C. Grant, M. J. S. Peel, R. Slotow, H. J. de Knegt, H. H. T. Prins, and H.
de Kroon. 2011. Large herbivores may alter vegetation structure of semi-arid savannas
through soil nutrient mediation. Oecologia 165:1095-1107.
Van der Waal, C., H. de Kroon, W. F. de Boer, I. M. A. Heitkönig, A. K. Skidmore, H. J. de
Knegt, F. van Langevelde, S. E. van Wieren, R. C. Grant, B. R. Page, R. Slotow, E. M.
Kohi, E. Mwakiwa, and H. H. T. Prins. 2009. Water and nutrients alter herbaceous

87
competitive effects on tree seedlings in a semi-arid savanna. Journal of Ecology 97:430-
439.
Vetaas, O. R. 1992. Micro-site effects of trees and shrubs in dry savannas. Journal of Vegetation
Science 3:337-344.
Wakeling, J. L., M. D. Cramer, and W. J. Bond. 2010. Is the lack of leguminous savanna trees in
grasslands of South Africa related to nutritional constraints? Plant and Soil 336:173-182.
Ward, D. 2005. Do we understand the causes of bush encroachment in African savannas?
African Journal of Range and Forage Science 22:101-105.
Ward, D. 2011. Population differentiation in a purported ring species, Acacia karroo
(Mimosoideae). Biological Journal of the Linnean Society 104:748-755.
Ward, D. and K. J. Esler. 2011. What are the effects of substrate and grass removal on
recruitment of Acacia mellifera seedlings in a semi-arid environment? Plant Ecology
212:245-250.
Wilson, T. B., and E. T. F. Witkowski. 1998. Water requirements for germination and early
seedling establishment in four African savanna woody plant species. Journal of Arid
Environments 38:541-550.

88
TABLE 1. Linear mixed model (lme) analysis using maximum likelihood, showing the individual and interactive effects of water, shade, nutrient and
grass treatments (two levels each) on all species, excluding Acacia nigrescens. Interaction effects of nutrient and grass (sub-plot) within water and shade
(whole plot) within replicates (random effects of block units) was considered as split-plot error. We analyzed final-initial relative growth rate of stem
length (RGRL in mm mm-1
week-1
), final-initial relative growth rate in stem basal diameter (RGRD in mm mm-1
week-1
), final proportion of leaf to sapling
dry biomass (LP), final log10 transformed sapling dry biomass (SDB in mg). The numerator degrees of freedom (df), error df, F-value and significance are
indicated per factor and factor interactions. The values in bold are significant using a Bonferroni correction (p < 0.01)
Source df RGRL
RGRD
LP
SDB
Err df
F
p
Err df
F
p
Err df
F
p
Err df
F
p
Spp
6
359
41.99
<.0001
360
44.07
<.0001
360
44.72
<.0001
361
122.07
<.0001
W
1
12
5.81
0.0329
12
3.07
0.1052
12
0.52
0.4863
12
4.18
0.0635
S
1
12
0.02
0.8960
12
6.18
0.0287
12
1.04
0.3288
12
10.94
0.0062
N
1
48
24.24
<.0001
48
35.48
<.0001
48
4.14
0.0473
48
55.28
<.0001
G
1
48
12.48
0.0009
48
76.29
<.0001
48
27.90
<.0001
48
116.64
<.0001
Spp:W
6
359
2.52
0.0211
360
1.43
0.2025
360
2.73
0.0133
361
1.98
0.0678
Spp:S
6
359
4.08
0.0006
360
5.97
<.0001
360
2.61
0.0173
361
4.45
0.0002
W:S
1
12
0.01
0.9066
12
1.11
0.3130
12
2.05
0.1777
12
0.76
0.4007
Spp:N
6
359
0.31
0.9338
360
2.50
0.0220
360
1.14
0.3401
361
2.60
0.0177
W:N
1
48
0.67
0.4156
48
0.04
0.8382
48
0.40
0.5284
48
0.45
0.5076
S:N
1
48
32.71
<.0001
48
15.07
0.0003
48
3.83
0.0563
48
12.18
0.0010
Spp:G
6
359
0.64
0.6986
360
1.42
0.2067
360
1.91
0.0789
361
3.73
0.0013
W:G
1
48
0.05
0.8213
48
0.69
0.4086
48
4.41
0.0409
48
0.60
0.4431
S:G
1
48
11.93
0.0012
48
46.92
<.0001
48
18.56
0.0001
48
58.04
<.0001
N:G
1
48
0.54
0.4659
48
0.04
0.8358
48
6.75
0.0124
48
0.42
0.5214
Spp:W:S
6
359
1.31
0.2510
360
2.47
0.0238
360
2.38
0.0289
361
1.44
0.1977
Spp:W:N
6
359
2.54
0.0202
360
0.86
0.5255
360
1.51
0.1730
361
0.85
0.5332
Spp:S:N
6
359
0.77
0.5938
360
2.08
0.0554
360
1.60
0.1467
361
1.73
0.1119
W:S:N
1
48
0.07
0.7914
48
1.57
0.2164
48
0.00
0.9577
48
0.01
0.9210
Spp:W:G
6
359
0.89
0.5021
360
0.53
0.7875
360
0.42
0.8665
361
1.24
0.2842
Spp:S:G
6
359
1.60
0.1464
360
2.21
0.0412
360
0.42
0.8646
361
2.36
0.0298
W:S:G
1
48
0.40
0.5286
48
0.03
0.8602
48
2.40
0.1283
48
0.03
0.8713

89
Spp:N:G
6
359
0.68
0.6630
360
0.97
0.4449
360
1.14
0.3383
361
0.21
0.9729
W:N:G
1
48
0.01
0.9175
48
1.82
0.1836
48
2.34
0.1325
48
0.15
0.6963
S:N:G
1
48
1.20
0.2786
48
0.00
0.9791
48
0.17
0.6805
48
1.21
0.2764
Spp:W:S:N
6
359
1.07
0.3796
360
0.70
0.6521
360
1.09
0.3702
361
0.68
0.6658
Spp:W:S:G
6
359
1.36
0.2279
360
0.50
0.8064
360
0.79
0.5821
361
0.57
0.7581
Spp:W:N:G
6
359
1.37
0.2247
360
1.27
0.2724
360
1.67
0.1282
361
0.58
0.7482
Spp:S:N:G
6
359
0.52
0.7943
360
0.55
0.7672
360
0.33
0.9229
361
1.22
0.2971
W:S:N:G
1
48
0.43
0.5172
48
2.20
0.1444
48
0.01
0.9183
48
1.78
0.1881
Spp:W:S:N:G
6
359
2.06
0.0571
360
1.16
0.3259
360
0.93
0.4730
361
1.14
0.3404
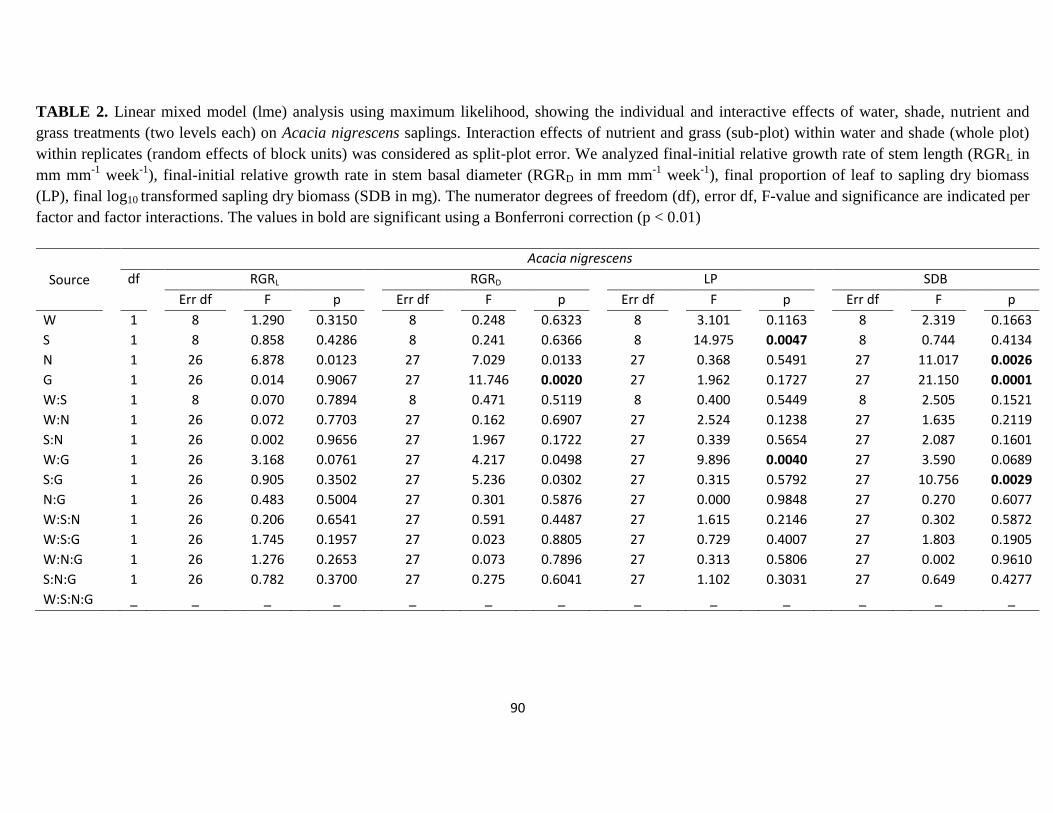
90
TABLE 2. Linear mixed model (lme) analysis using maximum likelihood, showing the individual and interactive effects of water, shade, nutrient and
grass treatments (two levels each) on Acacia nigrescens saplings. Interaction effects of nutrient and grass (sub-plot) within water and shade (whole plot)
within replicates (random effects of block units) was considered as split-plot error. We analyzed final-initial relative growth rate of stem length (RGRL in
mm mm-1
week-1
), final-initial relative growth rate in stem basal diameter (RGRD in mm mm-1
week-1
), final proportion of leaf to sapling dry biomass
(LP), final log10 transformed sapling dry biomass (SDB in mg). The numerator degrees of freedom (df), error df, F-value and significance are indicated per
factor and factor interactions. The values in bold are significant using a Bonferroni correction (p < 0.01)
Source
Acacia nigrescens
df RGRL RGRD LP SDB
Err df F p Err df F p Err df F p Err df F p
W 1 8 1.290 0.3150 8 0.248 0.6323 8 3.101 0.1163 8 2.319 0.1663
S 1 8 0.858 0.4286 8 0.241 0.6366 8 14.975 0.0047 8 0.744 0.4134
N 1 26 6.878 0.0123 27 7.029 0.0133 27 0.368 0.5491 27 11.017 0.0026
G 1 26 0.014 0.9067 27 11.746 0.0020 27 1.962 0.1727 27 21.150 0.0001
W:S 1 8 0.070 0.7894 8 0.471 0.5119 8 0.400 0.5449 8 2.505 0.1521
W:N 1 26 0.072 0.7703 27 0.162 0.6907 27 2.524 0.1238 27 1.635 0.2119
S:N 1 26 0.002 0.9656 27 1.967 0.1722 27 0.339 0.5654 27 2.087 0.1601
W:G 1 26 3.168 0.0761 27 4.217 0.0498 27 9.896 0.0040 27 3.590 0.0689
S:G 1 26 0.905 0.3502 27 5.236 0.0302 27 0.315 0.5792 27 10.756 0.0029
N:G 1 26 0.483 0.5004 27 0.301 0.5876 27 0.000 0.9848 27 0.270 0.6077
W:S:N 1 26 0.206 0.6541 27 0.591 0.4487 27 1.615 0.2146 27 0.302 0.5872
W:S:G 1 26 1.745 0.1957 27 0.023 0.8805 27 0.729 0.4007 27 1.803 0.1905
W:N:G 1 26 1.276 0.2653 27 0.073 0.7896 27 0.313 0.5806 27 0.002 0.9610
S:N:G 1 26 0.782 0.3700 27 0.275 0.6041 27 1.102 0.3031 27 0.649 0.4277
W:S:N:G _ _ _ _ _ _ _ _ _ _ _ _ _

91
List of figures
FIG. 1. Mean (± 1SE) relative growth rate of stem length (RGRL) values of (a) humid and (b)
mesic species showing the effects of shade. Negative effects of shade on sapling RGRL were
observed only in Acacia tortilis and Colophospermum mopane (mesic spp.).
FIG. 2. Mean (± 1SE) relative growth rate of stem length (RGRL) values of (a) humid and (b)
mesic species showing the effects of shade and nutrients. The treatment levels of nutrients (N1-
nutrient addition and N0 – no nutrients) are represented on the x-axis, for each species. To be
read as a two-way interactive effect of shade and nutrients on RGRL of each species separately.
Positive effects of nutrient addition on sapling RGRL were observed only in the presence of
natural light (no shade).
FIG. 3. Mean (± 1SE) relative growth rate of stem length (RGRL) values of (a) humid and (b)
mesic species showing the effects of shade and grass. The treatment levels of grass (G1- grass
competition and G0 – no grass) are represented on the x-axis, for each species. To be read as a
two-way interactive effect of shade and grass on RGRL of each species separately. Negative
effects of grass competition on sapling RGRL were observed only in the presence of natural light
(no shade), except for Combretum apiculatum (mesic sp.) and Strychnos spinosa (humid sp.).
FIG. 4. Mean (± 1SE) relative growth rate of stem basal diameter (RGRD) values of (a) humid
and (b) mesic species showing the effects of shade. Shade had a negative effect on sapling RGRD
of all species, except for Strychnos spinosa (humid sp.).

92
FIG. 5. Mean (± 1SE) relative growth rate stem basal diameter (RGRD) values of (a) humid and
(b) mesic species showing the effects of shade and nutrients. The treatment levels of nutrients
(N1- nutrient addition and N0 – no nutrients) are represented on the x-axis for each species. To
be read as a two-way interactive effect of shade and nutrients on RGRD of each species
separately. Positive effects of nutrient addition on sapling RGRD were observed only in the
presence of natural light (no shade), except for Strychnos spinosa (humid sp.).
FIG. 6. Mean (± 1SE) relative growth rate of stem basal diameter (RGRD) values of (a) humid
and (b) mesic species showing the effects of shade and grass. The treatment levels of grass (G1-
grass competition and G0 – no grass) are represented on the x-axis, for each species. To be read
as a two-way interactive effect of shade and grass on RGRD of each species separately. Negative
effects of grass competition on sapling RGRD were observed only in the presence of natural light
(no shade).
FIG. 7. The log10 mean (± 1SE) sapling dry biomass (SDB) values (mg) of (a) humid and (b)
mesic species showing the effects of shade. Shade had a negative effect on SDB of all species,
except Acacia karroo and Strychnos spinosa (humid spp.).
FIG. 8. The log10 mean (± 1SE) sapling dry biomass (SDB) values (mg) of (a) humid and (b)
mesic species showing the effects of shade and nutrients. The treatment levels of nutrients (N1-
nutrient addition and N0 – no nutrients) are represented on the x-axis, for each species. To be
read as a two-way interactive effect of shade and nutrients on SDB of each species separately.
Positive effects of nutrient addition on SDB were observed only in the presence of natural light
(no shade), except for Strychnos spinosa (humid sp.).

93
FIG. 9. The log10 mean (± 1SE) sapling dry biomass (SDB) values (mg) of (a) humid and (b)
mesic species showing the effects of shade and grass. The treatment levels of grass (G1- grass
competition and G0 – no grass) are represented on the x-axis, for each species. To be read as a
two-way interactive effect of shade and grass on SDB of each species separately. Negative
effects of grass competition on SDB were observed only in the presence of natural light (no
shade).
FIG. 10. Mean (± 1SE) leaf proportion (ratio of leaf dry biomass to total sapling dry biomass)
values of (a) humid and (b) mesic species showing the effects of shade and grass. The treatment
levels of grass (G1- grass competition and G0 – no grass) are represented on the x-axis, for each
species. To be read as a two-way interactive effect of shade and grass on leaf proportion of each
species separately. Negative effects of grass competition on sapling leaf proportion were
observed only in the presence of natural light (no shade), except for Strychnos spinosa (humid
sp.).
FIG. 11. Mean (± 1SE) sapling dry biomass (SDB) values of Acacia nigrescens, showing the
effects of shade and grass. Negative effects of grass competition on SDB were observed only in
the presence of natural light (no shade).

94
RG
RL (
mm
mm
-1 w
eek-1
)
-0.02
0.00
0.02
0.04
0.06 No shade
Shade
Humid species
A.karroo A.sieberiana S.brachypetala S.spinosa
a)
RG
RL (
mm
mm
-1 w
ee
k-1
)
-0.02
0.00
0.02
0.04
0.06 No Shade
Shade
Mesic species
A.tortilis C.apiculatum C.mopane
b)
FIG. 1.

95
RG
RL (
mm
mm
-1w
eek-1
)
-0.04
-0.02
0.00
0.02
0.04
0.06
Humid species
N1N0 N0 N1 N0 N0N1 N1
S.spinosaS.brachypetalaA.karroo A.sieberiana
a)No shade
Shade
RG
RL (
mm
mm
-1w
ee
k-1
)
-0.04
-0.02
0.00
0.02
0.04
0.06 No shade
Shade
Mesic species
A.tortilis C.apiculatum C.mopane
N0 N0 N1 N0 N1N1
b)
FIG. 2.
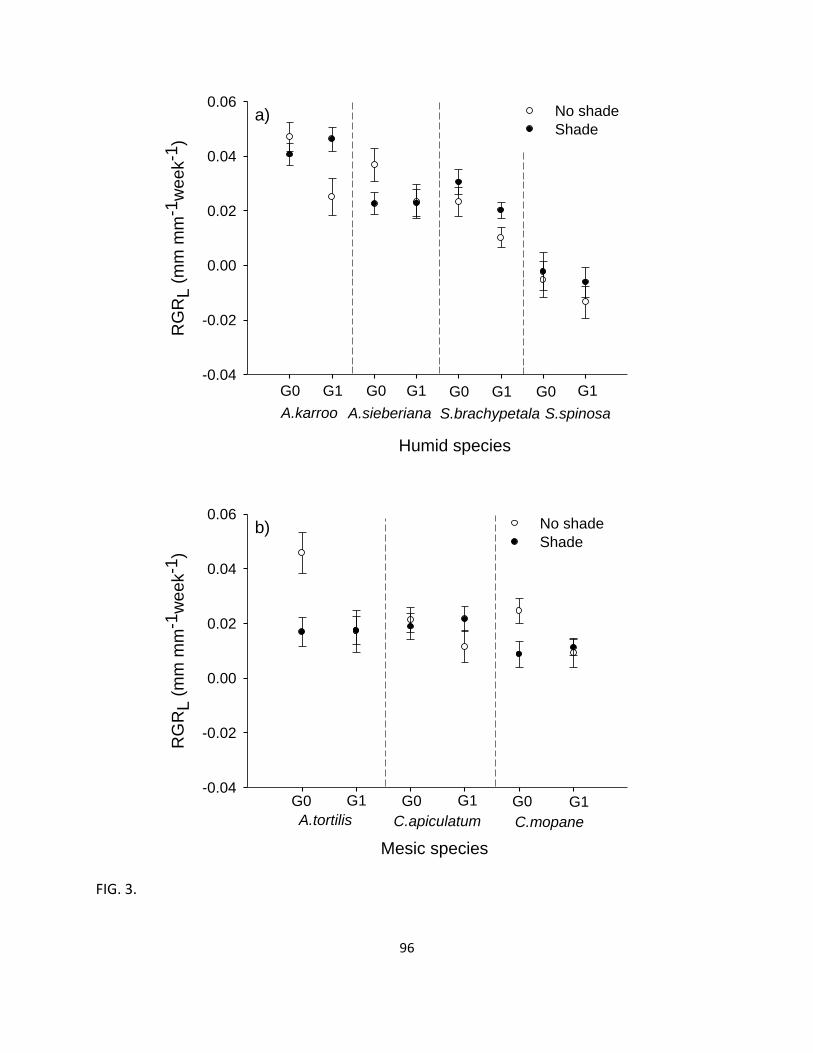
96
RG
RL (
mm
mm
-1w
eek-1
)
-0.04
-0.02
0.00
0.02
0.04
0.06No shade
Shade
Humid species
A.karroo A.sieberiana S.brachypetala S.spinosa
G1G0 G0 G1 G0 G0G1 G1
a)
RG
RL (
mm
mm
-1w
ee
k-1
)
-0.04
-0.02
0.00
0.02
0.04
0.06No shade
Shade
Mesic species
A.tortilis C.apiculatum C.mopane
G0 G0 G1 G0 G1G1
b)
FIG. 3.

97
RG
RD
(m
m m
m-1
week-1
)
0.00
0.01
0.02
0.03
0.04
0.05
0.06
0.07No shade
Shade
Humid species
A.karroo A.sieberiana S.brachypetala S.spinosa
a)
RG
RD
(m
m m
m-1
we
ek-1
)
0.00
0.01
0.02
0.03
0.04
0.05
0.06
0.07No shade
Shade
Mesic species
A.tortilis C.apiculatum C.mopane
b)
FIG. 4.

98
a)
RG
RD
(m
m m
m-1
week-1
)
0.00
0.01
0.02
0.03
0.04
0.05
0.06
0.07
0.08 No shade
Shade
Humid species
N1N0 N0 N1 N0 N0N1 N1
S.spinosaS.brachypetalaA.karroo A.sieberiana
a)
b)
RG
RD
(m
m m
m-1
week-1
)
0.00
0.01
0.02
0.03
0.04
0.05
0.06
0.07
0.08No shade
Shade
Mesic species
A.tortilis C.apiculatum C.mopane
N0 N0 N1 N0 N1N1
b)
FIG. 5.
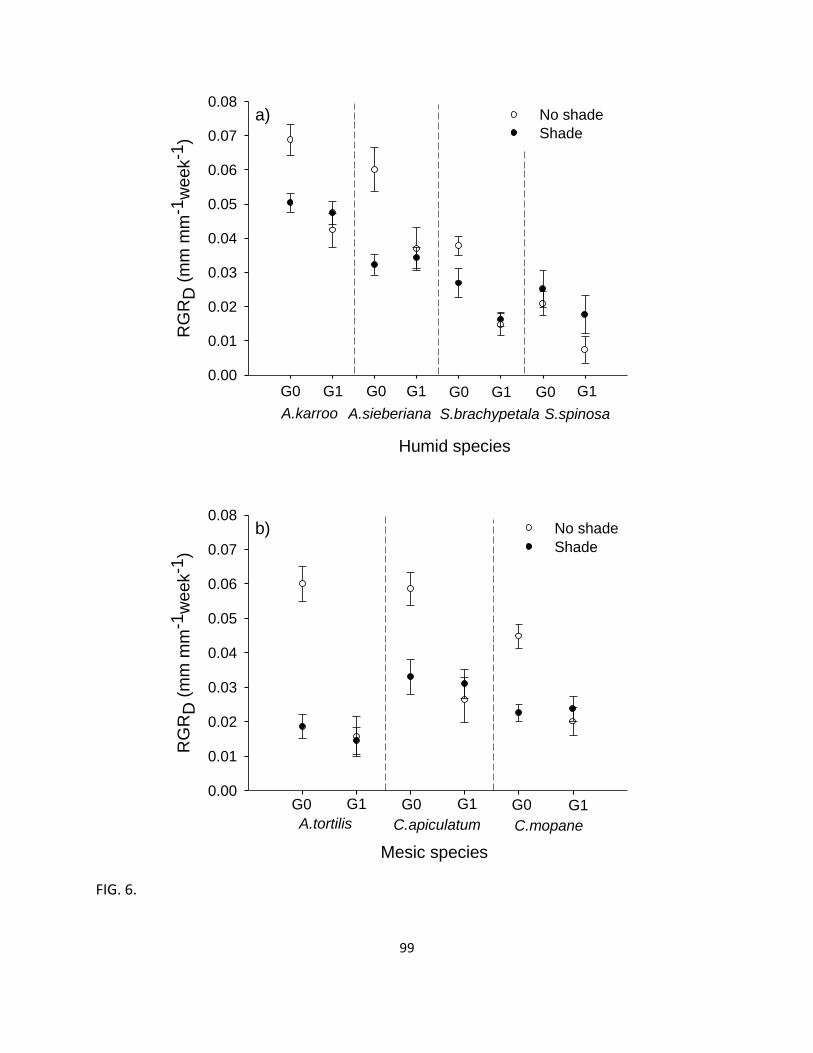
99
RG
RD
(m
m m
m-1
week-1
)
0.00
0.01
0.02
0.03
0.04
0.05
0.06
0.07
0.08No shade
Shade
Humid species
A.karroo A.sieberiana S.brachypetala S.spinosa
G1G0 G0 G1 G0 G0G1 G1
a)
RG
RD
(m
m m
m-1
week-1
)
0.00
0.01
0.02
0.03
0.04
0.05
0.06
0.07
0.08No shade
Shade
Mesic species
A.tortilis C.apiculatum C.mopane
G0 G0 G1 G0 G1G1
b)
FIG. 6.

100
(lo
g10)
Sa
plin
g d
ry b
iom
ass (
mg
)
2.2
2.4
2.6
2.8
3.0
3.2
3.4
3.6
3.8
4.0
4.2No shade
Shade
Humid species
A.karroo A.sieberiana S.brachypetala S.spinosa
a)
b)
(log
10)
Saplin
g d
ry b
iom
ass (
mg)
2.2
2.4
2.6
2.8
3.0
3.2
3.4
3.6
3.8
4.0
4.2No shade
Shade
Mesic species
A.tortilis C.apiculatum C.mopane
b)
FIG. 7.

101
(log10)
Saplin
g d
ry b
iom
ass (
mg)
2.0
2.5
3.0
3.5
4.0
4.5
5.0 No shade
Shade
N1N0 N0 N1 N0 N0N1 N1
Humid species
A.karroo A.sieberiana S.brachypetala S.spinosa
a)
(log10)
Saplin
g d
ry b
iom
ass (
mg)
2.0
2.5
3.0
3.5
4.0
4.5
5.0 No shade
Shade
Mesic species
A.tortilis C.apiculatum C.mopane
N0 N0 N1 N0 N1N1
b)
FIG. 8.

102
(lo
g10)
Sa
plin
g d
ry b
iom
ass (
mg
)
2.0
2.5
3.0
3.5
4.0
4.5
5.0No shade
Shade
G1G0 G0 G1 G0 G0G1 G1
Humid species
A.karroo A.sieberiana S.brachypetala S.spinosa
a)
(lo
g10)
Sa
plin
g d
ry b
iom
ass (
mg
)
2.0
2.5
3.0
3.5
4.0
4.5
5.0No shade
Shade
Mesic species
A.tortilis C.apiculatum C.mopane
G0 G0 G1 G0 G1G1
b)
FIG. 9.

103
Leaf : to
tal saplin
g d
ry b
iom
ass
0.1
0.2
0.3
0.4
0.5
0.6
0.7
0.8No shade
Shade
Humid species
A.karroo A.sieberiana S.brachypetala S.spinosa
G1G0 G0 G1 G0 G0G1 G1
a)
Lea
f :
tota
l sa
plin
g d
ry b
iom
ass
0.1
0.2
0.3
0.4
0.5
0.6
0.7
0.8
Mesic species
A.tortilis C.apiculatum C.mopane
G0 G0 G1 G0 G1G1
b)No shade
Shade
FIG. 10.

104
Acacia nigrescens
(log10)
Saplin
g d
ry b
iom
ass
2.2
2.4
2.6
2.8
3.0
3.2
3.4
3.6
3.8
4.0
4.2No shade
Shade
No grass Grass
FIG. 11.

105
SUPPLEMENTAL MATERIAL
Appendix A
Table A1-A7 Results of linear mixed model analysis for each species
TABLE A1. Linear mixed model (lme) analysis using maximum likelihood, showing the individual and interactive effects of water, shade, nutrient and
grass treatments (two levels each) on Acacia karroo saplings. Interaction effects of nutrient and grass (sub-plot) within water and shade (whole plot)
within replicates (random effects of block units) was considered as split-plot error. We analyzed final-initial relative growth rate of stem length (RGRL in
mm mm-1
week-1
), final-initial relative growth rate in stem basal diameter (RGRD in mm mm-1
week-1
), final proportion of leaf to sapling dry biomass
(LP), final log10 transformed sapling dry biomass (SDB in mg). The numerator degrees of freedom (df), error df, F-value and significance are indicated
per factor and factor interactions. The values in bold are significant, using a Bonferroni correction (p < 0.01)
Source
Acacia karroo
df RGRL RGRD LP SDB
Err df F p Err df F p Err df F p Err df F p
W 1 12 1.441 0.2531 12 0.924 0.3554 12 0.011 0.9182 12 0.014 0.9072
S 1 12 1.533 0.2393 12 2.961 0.1109 12 0.053 0.8216 12 0.116 0.7395
N 1 47 6.341 0.0153 47 21.587 <.0001 47 0.572 0.4533 47 9.969 0.0028
G 1 47 3.302 0.0756 47 22.215 <.0001 47 2.687 0.1079 47 18.811 0.0001
W:S 1 12 0.293 0.5982 12 0.559 0.4689 12 0.001 0.9802 12 0.133 0.7213
W:N 1 47 0.178 0.6746 47 0.542 0.4652 47 0.339 0.5632 47 0.219 0.6423
S:N 1 47 4.076 0.0492 47 12.436 0.001 47 0.107 0.7445 47 3.955 0.0526
W:G 1 47 0.564 0.4562 47 1.085 0.3028 47 4.160 0.0470 47 0.535 0.4683
S:G 1 47 9.922 0.0028 47 14.824 0.0004 47 8.269 0.0060 47 11.504 0.0014
N:G 1 47 0.126 0.7244 47 0.060 0.8082 47 8.531 0.0054 47 0.150 0.7006
W:S:N 1 47 1.544 0.2202 47 0.080 0.7792 47 0.784 0.3803 47 0.254 0.6166
W:S:G 1 47 4.543 0.0383 47 0.013 0.9086 47 0.220 0.6414 47 0.334 0.5658
W:N:G 1 47 0.106 0.7461 47 0.003 0.9552 47 7.524 0.0086 47 0.032 0.8592
S:N:G 1 47 1.751 0.1922 47 0.082 0.7765 47 0.901 0.3473 47 1.305 0.2591
W:S:N:G 1 47 5.465 0.0237 47 0.603 0.4412 47 0.080 0.7791 47 1.477 0.2304

106
TABLE A2. Linear mixed model (lme) analysis using maximum likelihood, showing the individual and interactive effects of water, shade, nutrient and
grass treatments (two levels each) on Acacia sieberiana saplings. Interaction effects of nutrient and grass (sub-plot) within water and shade (whole plot)
within replicates (random effects of block units) was considered as split-plot error. We analyzed final-initial relative growth rate of stem length (RGRL
in mm mm-1
week-1
), final-initial relative growth rate in stem basal diameter (RGRD in mm mm-1
week-1
), final proportion of leaf to sapling dry biomass
(LP), final log10 transformed sapling dry biomass (SDB in mg). The numerator degrees of freedom (df), error df, F-value and significance are indicated
per factor and factor interactions. The values in bold are significant, using a Bonferroni correction (p < 0.01)
Source
Acacia sieberiana
df RGRL
RGRD
LP
SDB
Err df
F
p
Err df
F
p
Err df
F
p
Err df
F
p
W
1
12
4.559
0.0541
12
8.050
0.0150
12
2.377
0.1491
12
4.772
0.0495
S
1
12
1.664
0.2214
12
14.528
0.0025
12
0.005
0.9479
12
5.201
0.0416
N
1
46
5.728
0.0208
46
13.378
0.0007
45
3.564
0.0655
46
15.600
0.0003
G
1
46
1.872
0.1779
46
6.047
0.0178
45
9.281
0.0039
46
27.152
<.0001
W:S
1
12
0.791
0.3914
12
6.075
0.0298
12
11.095
0.0060
12
3.570
0.0832
W:N
1
46
0.019
0.8910
46
1.389
0.2446
45
0.398
0.5316
46
1.223
0.2745
S:N
1
46
5.709
0.0210
46
7.660
0.0081
45
0.703
0.4062
46
0.000
0.9980
W:G
1
46
0.212
0.6477
46
1.026
0.3165
45
0.0003
0.9857
46
3.809
0.0571
S:G
1
46
1.875
0.1775
46
9.321
0.0038
45
1.400
0.2430
46
10.177
0.0026
N:G
1
46
0.119
0.7319
46
2.381
0.1297
45
0.007
0.9357
46
0.043
0.8369
W:S:N
1
46
2.596
0.114
46
3.472
0.0688
45
0.977
0.3282
46
1.429
0.2380
W:S:G
1
46
0.0001
0.9941
46
0.295
0.5894
45
0.003
0.9548
46
1.106
0.2985
W:N:G
1
46
0.141
0.7088
46
0.152
0.6983
45
0.157
0.6937
46
0.005
0.9450
S:N:G
1
46
0.068
0.7961
46
0.289
0.5932
45
0.014
0.9064
46
3.560
0.0655
W:S:N:G
1
46
2.030
0.1610
46
1.544
0.2203
45
1.422
0.2393
46
1.533
0.2220

107
TABLE A3. Linear mixed model (lme) analysis using maximum likelihood, showing the individual and interactive effects of water, shade, nutrient and
grass treatments (two levels each) on Schotia brachypetala saplings. Interaction effects of nutrient and grass (sub-plot) within water and shade (whole
plot) within replicates (random effects of block units) was considered as split-plot error. We analyzed final-initial relative growth rate of stem length
(RGRL in mm mm-1
week-1
), final-initial relative growth rate in stem basal diameter (RGRD in mm mm-1
week-1
), final proportion of leaf to sapling dry
biomass (LP), final log10 transformed sapling dry biomass (SDB in mg). The numerator degrees of freedom (df), error df, F-value and significance are
indicated per factor and factor interactions. The values in bold are significant, using a Bonferroni correction (p < 0.01)
Source
Schotia brachypetala
df RGRL
RGRD
LP
SDB
Err df
F
p
Err df
F
p
Err df
F
p
Err df
F
p
W
1
12
0.721
0.4125
12
0.575
0.4629
12
0.934
0.3530
12
0.001
0.9803
S
1
12
3.664
0.0797
12
5.935
0.0314
12
1.049
0.3259
12
9.678
0.0090
N
1
42
3.537
0.0670
42
11.798
0.0013
42
2.805
0.1014
42
9.429
0.0037
G
1
42
8.831
0.0049
42
35.885
<.0001
42
8.896
0.0047
42
23.513
<.0001
W:S
1
12
1.777
0.2073
12
1.307
0.2752
12
4.844
0.0481
12
3.078
0.1049
W:N
1
42
3.062
0.0874
42
0.073
0.7891
42
4.238
0.0458
42
0.006
0.9408
S:N
1
42
8.199
0.0065
42
1.214
0.2769
42
8.688
0.0052
42
6.771
0.0127
W:G
1
42
0.758
0.3890
42
1.960
0.1689
42
0.819
0.3707
42
3.243
0.0789
S:G
1
42
0.049
0.8256
42
4.480
0.0403
42
2.823
0.1003
42
18.450
0.0001
N:G
1
42
0.596
0.4445
42
0.194
0.6617
42
1.014
0.3197
42
0.002
0.9676
W:S:N
1
42
0.355
0.5548
42
0.003
0.9590
42
2.710
0.1072
42
1.070
0.3069
W:S:G
1
42
0.298
0.5883
42
0.705
0.4058
42
2.146
0.1504
42
0.032
0.8588
W:N:G
1
42
0.325
0.5716
42
0.007
0.9319
42
0.739
0.3947
42
0.001
0.9748
S:N:G
1
42
1.038
0.3140
42
2.157
0.1494
42
1.333
0.2548
42
0.001
0.9816
W:S:N:G
1
42
0.655
0.4229
42
0.082
0.7761
42
0.447
0.5072
42
0.627
0.4330
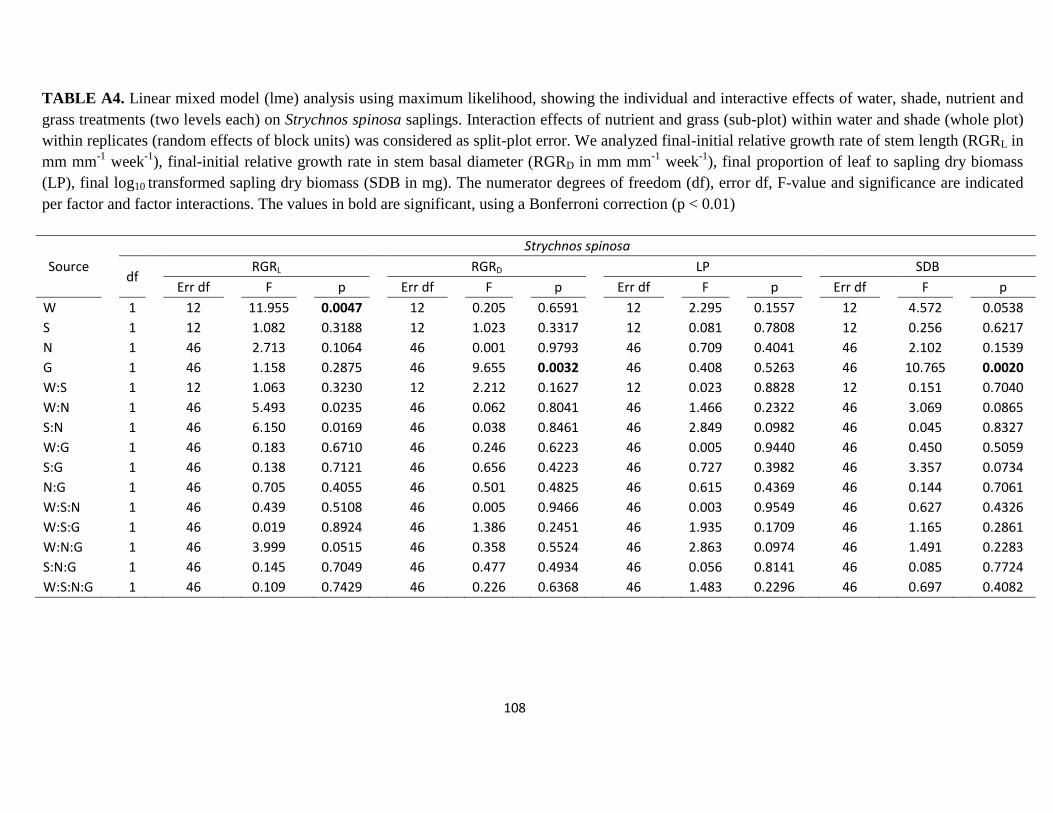
108
TABLE A4. Linear mixed model (lme) analysis using maximum likelihood, showing the individual and interactive effects of water, shade, nutrient and
grass treatments (two levels each) on Strychnos spinosa saplings. Interaction effects of nutrient and grass (sub-plot) within water and shade (whole plot)
within replicates (random effects of block units) was considered as split-plot error. We analyzed final-initial relative growth rate of stem length (RGRL in
mm mm-1
week-1
), final-initial relative growth rate in stem basal diameter (RGRD in mm mm-1
week-1
), final proportion of leaf to sapling dry biomass
(LP), final log10 transformed sapling dry biomass (SDB in mg). The numerator degrees of freedom (df), error df, F-value and significance are indicated
per factor and factor interactions. The values in bold are significant, using a Bonferroni correction (p < 0.01)
Source
Strychnos spinosa
df RGRL
RGRD
LP
SDB
Err df
F
p
Err df
F
p
Err df
F
p
Err df
F
p
W
1
12
11.955
0.0047
12
0.205
0.6591
12
2.295
0.1557
12
4.572
0.0538
S
1
12
1.082
0.3188
12
1.023
0.3317
12
0.081
0.7808
12
0.256
0.6217
N
1
46
2.713
0.1064
46
0.001
0.9793
46
0.709
0.4041
46
2.102
0.1539
G
1
46
1.158
0.2875
46
9.655
0.0032
46
0.408
0.5263
46
10.765
0.0020
W:S
1
12
1.063
0.3230
12
2.212
0.1627
12
0.023
0.8828
12
0.151
0.7040
W:N
1
46
5.493
0.0235
46
0.062
0.8041
46
1.466
0.2322
46
3.069
0.0865
S:N
1
46
6.150
0.0169
46
0.038
0.8461
46
2.849
0.0982
46
0.045
0.8327
W:G
1
46
0.183
0.6710
46
0.246
0.6223
46
0.005
0.9440
46
0.450
0.5059
S:G
1
46
0.138
0.7121
46
0.656
0.4223
46
0.727
0.3982
46
3.357
0.0734
N:G
1
46
0.705
0.4055
46
0.501
0.4825
46
0.615
0.4369
46
0.144
0.7061
W:S:N
1
46
0.439
0.5108
46
0.005
0.9466
46
0.003
0.9549
46
0.627
0.4326
W:S:G
1
46
0.019
0.8924
46
1.386
0.2451
46
1.935
0.1709
46
1.165
0.2861
W:N:G
1
46
3.999
0.0515
46
0.358
0.5524
46
2.863
0.0974
46
1.491
0.2283
S:N:G
1
46
0.145
0.7049
46
0.477
0.4934
46
0.056
0.8141
46
0.085
0.7724
W:S:N:G
1
46
0.109
0.7429
46
0.226
0.6368
46
1.483
0.2296
46
0.697
0.4082

109
TABLE A5. Linear mixed model (lme) analysis using maximum likelihood, showing the individual and interactive effects of water, shade, nutrient and
grass treatments (two levels each) on Acacia tortilis saplings. Interaction effects of nutrient and grass (sub-plot) within water and shade (whole plot)
within replicates (random effects of block units) was considered as split-plot error. We analyzed final-initial relative growth rate of stem length (RGRL in
mm mm-1
week-1
), final-initial relative growth rate in stem basal diameter (RGRD in mm mm-1
week-1
), final proportion of leaf to sapling dry biomass
(LP), final log10 transformed sapling dry biomass (SDB in mg). The numerator degrees of freedom (df), error df, F-value and significance are indicated
per factor and factor interactions. The values in bold are significant, using a Bonferroni correction (p < 0.01)
Source
Acacia tortilis
df RGRL
RGRD
LP
SDB
Err df
F
p
Err df
F
p
Err df
F
p
Err df
F
p
W
1
12
7.484
0.0181
12
10.809
0.0065
12
1.435
0.2540
12
9.660
0.0091
S
1
12
5.770
0.0334
12
20.362
0.0007
12
0.357
0.5615
12
19.151
0.0009
N
1
38
5.739
0.0216
38
8.031
0.0073
39
0.016
0.8997
39
10.301
0.0027
G
1
38
5.125
0.0294
38
26.704
<.0001
39
14.766
0.0004
39
30.081
<.0001
W:S
1
12
0.707
0.4168
12
0.318
0.5835
12
2.895
0.1146
12
1.107
0.3135
W:N
1
38
1.428
0.2396
38
1.433
0.2388
39
2.912
0.0959
39
0.066
0.7983
S:N
1
38
14.551
0.0005
38
1.454
0.2354
39
0.004
0.9516
39
3.478
0.0697
W:G
1
38
2.292
0.1384
38
0.031
0.8604
39
0.437
0.5127
39
0.432
0.5151
S:G
1
38
8.568
0.0057
38
20.610
0.0001
39
6.175
0.0174
39
18.030
0.0001
N:G
1
38
0.192
0.6634
38
0.250
0.6203
39
2.186
0.1473
39
0.605
0.4414
W:S:N
1
38
0.362
0.5511
38
1.822
0.1851
39
2.088
0.1564
39
0.008
0.9278
W:S:G
1
38
0.524
0.4736
38
0.123
0.7278
39
0.000
0.9981
39
0.234
0.6316
W:N:G
1
38
0.638
0.4294
38
0.006
0.9407
39
1.778
0.1901
39
0.168
0.6846
S:N:G
1
38
0.102
0.7514
38
0.551
0.4623
39
0.070
0.7924
39
0.224
0.6387
W:S:N:G
1
38
0.021
0.8863
38
5.451
0.0249
39
0.411
0.5252
39
1.665
0.2046

110
TABLE A6. Linear mixed model (lme) analysis using maximum likelihood, showing the individual and interactive effects of water, shade, nutrient and
grass treatments (two levels each) on Colophospermum mopane saplings. Interaction effects of nutrient and grass (sub-plot) within water and shade
(whole plot) within replicates (random effects of block units) was considered as split-plot error. We analyzed final-initial relative growth rate of stem
length (RGRL in mm mm-1
week-1
), final-initial relative growth rate in stem basal diameter (RGRD in mm mm-1
week-1
), final proportion of leaf to sapling
dry biomass (LP), final log10 transformed sapling dry biomass (SDB in mg). The numerator degrees of freedom (df), error df, F-value and significance are
indicated per factor and factor interactions. The values in bold are significant, using a Bonferroni correction (p < 0.01)
Source
Colophospermum mopane
df RGRL
RGRD
LP
SDB
Err df
F
p
Err df
F
p
Err df
F
p
Err df
F
p
W
1
12
0.020
0.8894
12
0.325
0.5794
12
1.781
0.2068
12
0.394
0.5422
S
1
12
3.137
0.1019
12
4.923
0.0465
12
18.894
0.0010
12
21.241
0.0006
N
1
46
13.942
0.0005
46
6.333
0.0154
46
2.040
0.1599
46
8.953
0.0044
G
1
46
2.562
0.1163
46
13.530
0.0006
46
9.108
0.0041
46
15.776
0.0002
W:S
1
12
0.137
0.7181
12
0.162
0.694
12
1.914
0.1917
12
0.161
0.6953
W:N
1
46
2.457
0.1238
46
1.335
0.2539
46
0.179
0.6746
46
0.140
0.7097
S:N
1
46
4.860
0.0325
46
2.740
0.1047
46
0.257
0.6149
46
6.100
0.0173
W:G
1
46
0.436
0.5124
46
2.081
0.1559
46
2.593
0.1142
46
0.380
0.5406
S:G
1
46
4.765
0.0342
46
16.597
0.0002
46
3.301
0.0757
46
5.779
0.0203
N:G
1
46
3.543
0.0661
46
0.550
0.4619
46
0.246
0.6224
46
0.172
0.6807
W:S:N
1
46
0.025
0.8744
46
0.001
0.9787
46
0.174
0.6786
46
0.158
0.6929
W:S:G
1
46
3.471
0.0689
46
1.285
0.2628
46
4.466
0.0400
46
0.346
0.5595
W:N:G
1
46
0.007
0.9360
46
4.570
0.0379
46
0.939
0.3375
46
0.405
0.5276
S:N:G
1
46
0.226
0.6367
46
0.309
0.5810
46
0.280
0.5994
46
0.003
0.9590
W:S:N:G
1
46
3.883
0.0548
46
0.198
0.6586
46
0.279
0.5997
46
1.890
0.1759
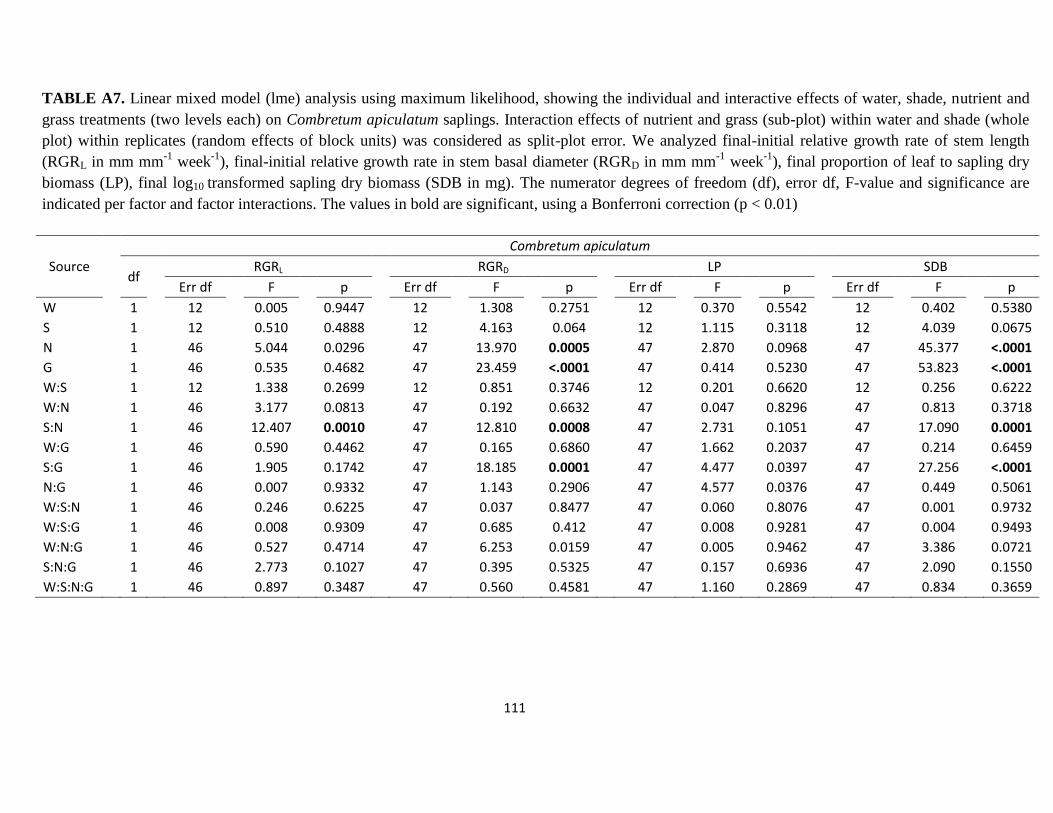
111
TABLE A7. Linear mixed model (lme) analysis using maximum likelihood, showing the individual and interactive effects of water, shade, nutrient and
grass treatments (two levels each) on Combretum apiculatum saplings. Interaction effects of nutrient and grass (sub-plot) within water and shade (whole
plot) within replicates (random effects of block units) was considered as split-plot error. We analyzed final-initial relative growth rate of stem length
(RGRL in mm mm-1
week-1
), final-initial relative growth rate in stem basal diameter (RGRD in mm mm-1
week-1
), final proportion of leaf to sapling dry
biomass (LP), final log10 transformed sapling dry biomass (SDB in mg). The numerator degrees of freedom (df), error df, F-value and significance are
indicated per factor and factor interactions. The values in bold are significant, using a Bonferroni correction (p < 0.01)
Source
Combretum apiculatum
df RGRL
RGRD
LP
SDB
Err df
F
p
Err df
F
p
Err df
F
p
Err df
F
p
W
1
12
0.005
0.9447
12
1.308
0.2751
12
0.370
0.5542
12
0.402
0.5380
S
1
12
0.510
0.4888
12
4.163
0.064
12
1.115
0.3118
12
4.039
0.0675
N
1
46
5.044
0.0296
47
13.970
0.0005
47
2.870
0.0968
47
45.377
<.0001
G
1
46
0.535
0.4682
47
23.459
<.0001
47
0.414
0.5230
47
53.823
<.0001
W:S
1
12
1.338
0.2699
12
0.851
0.3746
12
0.201
0.6620
12
0.256
0.6222
W:N
1
46
3.177
0.0813
47
0.192
0.6632
47
0.047
0.8296
47
0.813
0.3718
S:N
1
46
12.407
0.0010
47
12.810
0.0008
47
2.731
0.1051
47
17.090
0.0001
W:G
1
46
0.590
0.4462
47
0.165
0.6860
47
1.662
0.2037
47
0.214
0.6459
S:G
1
46
1.905
0.1742
47
18.185
0.0001
47
4.477
0.0397
47
27.256
<.0001
N:G
1
46
0.007
0.9332
47
1.143
0.2906
47
4.577
0.0376
47
0.449
0.5061
W:S:N
1
46
0.246
0.6225
47
0.037
0.8477
47
0.060
0.8076
47
0.001
0.9732
W:S:G
1
46
0.008
0.9309
47
0.685
0.412
47
0.008
0.9281
47
0.004
0.9493
W:N:G
1
46
0.527
0.4714
47
6.253
0.0159
47
0.005
0.9462
47
3.386
0.0721
S:N:G
1
46
2.773
0.1027
47
0.395
0.5325
47
0.157
0.6936
47
2.090
0.1550
W:S:N:G
1
46
0.897
0.3487
47
0.560
0.4581
47
1.160
0.2869
47
0.834
0.3659
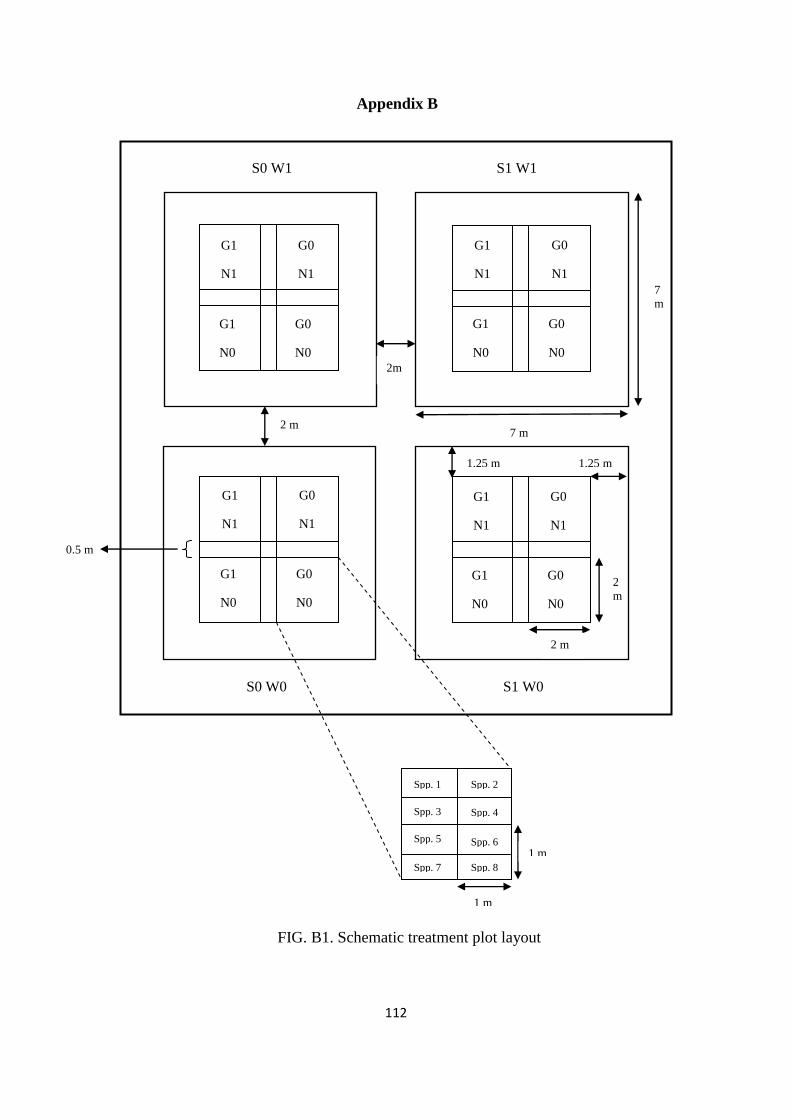
112
Appendix B
0.5 m
S1 W1
S0 W0 S1 W0
2m
2 m 7 m
7
m
1.25 m 1.25 m
2
m
2 m
1 m
1 m
S0 W1
G1
N1
G0
N1
G1
N0
G0
N0
G1
N1
G0
N1
G1
N0
G0
N0
G1
N1
G0
N1
G1
N0
G0
N0
G1
N1
G0
N1
G1
N0
G0
N0
Spp. 1 Spp. 2
Spp. 4
Spp. 6
Spp. 8
Spp. 5
Spp. 7
Spp. 3
FIG. B1. Schematic treatment plot layout

113
Treatments provided
W1: Regular watering.
W0: Natural rainfall.
S1: 80 % Shade level.
S0: Natural light.
G1: Grass present.
G0: Grass absent.
N1: With fertilizer.
N0: Without fertilizer.
Whole plot treatments
Sub-plot treatments
Block

114
Chapter 4: Herbivory effects on saplings are influenced by nutrients and grass
competition in a humid South African savanna
Snehalatha Vadigi1 and David Ward
1,2
1School of Life Sciences, University of KwaZulu-Natal, Private Bag X01, Scottsville,
Pietermaritzburg, 3209, South Africa
2Corresponding author e-mail: [email protected]
# Submitted to Functional Ecology on 18th
December 2012.

115
Summary
1. Herbivory is a common disturbance influencing savanna vegetation composition and
structure. Grazers and browsers interfere with sapling establishment dynamics by
direct consumption of plant tissue and changing soil nutrient status and grass
competition. Studies evaluating the effects of herbivory on sapling establishment have
mostly been extrapolated from single species.
2. In a controlled field experiment, we studied the effects of clipping (presence vs
absence of simulated grazing and browsing), nutrients (presence vs absence), grass
competition (presence vs absence) and their interactive effects on sapling survival and
growth of four humid and four mesic savanna species. We conducted this experiment
in a humid South African savanna.
3. Sapling survival was not affected by the treatments provided. Clipped saplings of all
species increased their investment in relative growth rate of stem length (RGRL). On
the other hand, clipping had a greater negative impact on relative growth rate of more
humid than mesic species in terms of stem diameter (RGRD) (of 2 humid species),
total dry biomass (of 2 humid and 1 mesic species) and proportion of leaf biomass (of
4 humid and 2 mesic species).
4. Nutrients had a positive effect on the RGRL of Acacia tortilis, Combretum apiculatum
and Colophospermum mopane and sapling biomass of Schotia brachypetala, Acacia
nigrescens and Combretum apiculatum. Positive effects of nutrients on RGRL of
Acacia karroo, Acacia tortilis and Colophospermum mopane were observed in their
clipped saplings only.
116
5. Grass competition had a strong negative impact on all growth parameters measured.
The defoliated saplings of three species, Acacia sieberiana, Combretum apiculatum
and Colophospermum mopane had lower RGRL with grass competition whereas intact
saplings showed no significant response. The presence of both grass and nutrients had
a significant negative effect on the RGRL of Strychnos spinosa saplings.
6. Synthesis. Saplings grow faster in length but the overall investment in shoots is
reduced, after clipping. Nutrients and grass competition have positive and negative
effects on sapling growth, respectively. After clipping, humid species were more
vulnerable to grass competition with reduced ability to use nutrients than mesic
species. In conclusion, herbivory increases sapling vulnerability to further
disturbances, with humid species being more susceptible than mesic species.
Key-words: Acacia, browsing, grazing, mesic savanna, relative growth rate, tree sapling
biomass.

117
Introduction
Variability in tree demography largely determines the structure of savannas (Staver, Bond &
February 2011). Recruitment of tree saplings into adults is a critical phase of woody plant
existence in savannas (Scholes & Archer 1997; Chidumayo 2008, Wakeling, Cramer & Bond
2012). Tree sapling establishment is a rare event in the presence of fire, herbivory and grass
competition (Prins & van der Jeugd 1993; Ward 2005; Lehmann, Prior & Bowman 2009).
However, an undue increase in tree abundance or woody plant encroachment causes a decline
in species richness (Smit 2004; Ratajczak, Nippert & Collins 2012). Woody plant
encroachment is caused mainly by the removal of grasses by intense grazing and subsequent
decrease in the fuel loads for fires (Scholes & Archer 1997; van Auken 2000; Roques,
O‟Connor & Watkinson 2001; van Langevelde et al. 2003; Briggs et al. 2005). An increase in
plant-available resources and a reduction in ungulate browsers can also significantly increase
tree recruitment (Prins & van der Jeugd 1993; Ward 2005).
African savannas host a wide range of mammalian herbivores, constituting grazers
and browsers (Holdo, Holt & Fryxell 2009). Large generalist herbivores such as elephants
can have devastating effects on closed canopy woodlands and convert them to open savannas
(Cumming et al. 1997; van de Koppel & Prins 1998; Shrader et al. 2012), although it may
largely depend on woody vegetation response to rainfall, elephant densities and distribution
(Guldemond & Van Aarde 2008). Tree recruitment rates can also be greater than browser-
induced adult tree mortality (Dublin, Sinclair & McGlade 1990). Mortality of large trees
creates open spaces with fertile sub-canopy soils, which promotes growth of tree saplings or
nutritive grasses (Riginos & Young 2007; Ludwig, de Kroon & Prins 2008). Therefore, large
mammalian herbivores may alter savanna vegetation structure without necessarily reducing
woody plant densities (van de Vijver, Foley & Olff 1999). However, woody vegetation

118
encroachment can be suppressed in the presence of both small specialist and large generalist
mammal browsers (Augustine & McNaughton 2004). Major effects driven by invertebrate
herbivory on tree seedlings in Africa can increase mortality and restrict recruitment (Shaw et
al. 2002). However, Western & Maitumo (2004) have found that large mammalian
herbivores had more negative effects on woody plants than invertebrates in Africa.
Herbivores can have a direct positive effect on savanna tree growth. For example,
heavy browsing stimulated shoot re-growth with high nutritive quality in Acacia nigrescens
growing in fertile soils (du Toit, Bryant & Frisby 1990). Indirectly, large herbivores enrich
local soil nutrient levels, through dung and urine deposits, affecting savanna vegetation
structure (van der Waal et al. 2011). Nutrient-rich areas support herbivores by offering high-
quality forage and maintain the soil fertility in a positive feedback system (du Toit et al.
1990; Augustine, McNaughton & Frank 2003; Asner et al. 2009; Mbatha & Ward 2010; van
der Waal et al. 2011). In contrast, intense herbivore preference of plant species with high leaf
nitrogen content, particularly in nutrient poor soils, may reduce plant available resources
(Ritchie, Tilman & Knops 1998). Although nutrients directly promote tree growth, high
utilization of nutrients for grass growth might increase the negative competitive effects on
woody saplings (van der Waal et al. 2009). Grass competition is among the potential factors
restricting tree recruitment especially when the rainfall is high (Goheen et al. 2010; Grellier
et al. 2012). Large herbivore grazers enhance tree sapling establishment by removing grasses
(Roques et al. 2001). On the other hand, grasses may exert potential positive effects on tree
establishment by protecting the saplings from browsers (Seymour 2008). Therefore, both
grazers and browsers interact to alter the competitive interactions between trees and grasses
(Scholes & Archer 1997).
119
Many studies evaluating herbivory effects on the role of sapling establishment in
woody plant encroachment have been based on single species (Kraaij & Ward 2006; Riginos
& Young 2007; Scogings & Mopipi 2008; Goheen et al. 2010). Owing to the probability that
any indigenous tree species may proliferate under favourable conditions, understanding
sapling establishment dynamics of multiple species with respect to herbivory can help predict
changes in vegetation at an ecosystem level. Persistence of savanna saplings amidst
disturbances is mainly determined by their ability to resprout utlising stored root reserves
(Bond & van Wilgen 1996). Success of the saplings is mainly affected by their ability to
resist, viz., allocation to stems (Clarke et al. 2013), particularly fast growth rates in height
(Higgins, Bond & Trollope 2000) and diameter (Gignoux, Clobert & Menaut 1997), recurring
disturbances such as fire and herbivory. Replenishment of sapling reserves for re-
establishment is mainly derived from undamaged leaves (Sakai & Sakai 1998) and new
leaves produced after disturbance. Therefore, investment in plant photosynthetic material also
has a deterministic role in promoting tree success.
We conducted a field experiment to evaluate the effects of clipping grass and tree
saplings (i.e. both grazing and browsing), nutrient availability and grass competition on
sapling survival and growth of eight indigenous savanna tree species in a humid South
African savanna. In order to test whether savanna tree species from different climate types
have a similar or different growth patterns, we selected four humid savanna species (> 1000
mm mean annual precipitation) i.e. Acacia karroo (Hayne) (a subtropical coastal variety from
Richards Bay (Ward 2011)), Acacia sieberiana (Burtt Davy), Schotia brachypetala (Sond.)
and Strychnos spinosa (Lam.) and four species from mesic savannas (approx. 750 mm mean
annual precipitation), i.e. Acacia nigrescens (Oliv.), Acacia tortilis (Hayne), Combretum
apiculatum (Sond.) and Colophospermum mopane (J.Kirk ex J.Léonard), as our study

120
species. Tree species were selected based on their dominance in their respective climate
types. The most widespread grass species in South Africa, Eragrostis curvula, was used to
study the effects of grass competition in relation to herbivory on the tree sapling growth. We
performed our study under irrigated conditions to control for variation in rainfall which may
directly interfere with our study by affecting sapling survival and growth. Water, amounting
to the long-term mean annual rainfall (1250 mm) of the study area, was supplied to plants at
regular time intervals over the 6 month study period. Based on the individual factor effects
followed by the interactive effects on sapling survival and growth, we predicted that:
1. Tree saplings will resprout and grow fast after clipping. Very young savanna tree
seedlings have the ability to resprout and invest root reserves rapidly in growth after
herbivory (Bergström 1992; Dube, Mlambo & Sebata 2009). Herbivore impact on
plants is greatest on nutrient-rich soils as they prefer feeding on plants with high
nutrient content (Levick & Rogers 2008; Asner et al. 2009). Mesic tree species
evolved in eutrophic soils with high browsing pressure (du Toit 1995). Therefore,
mesic species should be well adapted to herbivory and grow better with clipping
treatment than humid species.
2. Nutrient addition will increase the survival and growth of tree saplings (Wakeling,
Cramer & Bond 2010). Plants invest in root biomass more than stems with soil
nutrient limitation (Poorter et al. 2012). Humid species grow under high rainfall
conditions and on nutrient-poor soils, whereas mesic species occur in areas with low
rainfall and nutrient-rich soils (du Toit 1995). Therefore mesic species, adapted to
their native soil conditions, will perform better than humid species in the presence of
nutrients.
121
3. Grass competition should have a strong negative effect on tree sapling survival and
growth (Kambatuku, Cramer & Ward 2011; Grellier et al. 2012). Savanna seedlings
increase their investment in root mass at the expense of shoots in the presence of grass
competition (Kambatuku et al. 2011). Grasses may provide moist microclimatic
conditions (Grellier et al. 2012) conducive for sapling establishment in mesic
savannas (less evapotranspiration), but may be inhibitory to sapling establishment
(due to low light availability) in humid savannas. Thus, species that evolved under
humid conditions will be more negatively affected by grass competition than mesic
species.
4. Survival and growth will be highest in clipped saplings treated with nutrients and no
grass competition whereas intact saplings will exhibit lowest survival and growth with
no nutrients and in the presence of grass competition.
Materials and Methods
STUDY SITE
The experimental study was conducted on Mondi nursery grounds, KwaMbonambi
which is situated in the north-eastern coastal region of KwaZulu-Natal, South Africa
(28˚35′59.20″ S, 32˚10′47.22″ E). The long-term mean annual rainfall (1984 – 2010) of the
study area is 1250 mm. Rainfall occurs predominantly in the summer months, with peaks in
November and February. The terrain at KwaMbonambi is generally flat and is comprised of
Recent sediments of Quaternary, clayey, alluvial sands of aeolian deposition overlying the
Cretaceous conglomerates of the Berea formation or Maputaland group (King 1982, Mucina
and Rutherford 2006). The high permeability of the soils allows rapid leaching of the

122
nutrients due to the heavy rainfall in these areas. Vegetation is classified as Maputaland
wooded grassland (Mucina and Rutherford 2006).
EXPERIMENTAL DESIGN AND TREATMENTS
The experimental site was fenced to exclude large mammalian herbivores (> 5 kg)
from the area. The site was cleared of all vegetation prior to the application of the treatments
and was not previously fertilized. Topsoil samples (up to 15 cm depth) were randomly
collected from the experimental site and were sent to the University of KwaZulu-Natal
laboratory, Pietermaritzburg, South Africa for soil N and P analysis. Nitrogen was analysed
in a LECO Truspec Nitrogen Analyser (LECO corporation, Michigan) using the Dumas
combustion method and phosphorous was analysed using a Technicon Autoanalyser II
(Technicon Industrial Systems, Tarrytown, N.Y.). The topsoil in the study area contained a
mean (±SE) of 0.1051 (± 0.013) % total N and 0.0236 (± 0.0021) % total P on a dry matter
basis (n = 12 samples).
We adopted a split-plot design with irrigation provided at a whole-plot level. Ten 7 m
× 7 m whole-plots were randomly scattered in an open, non-wooded and topographically flat
70 m × 50 m area. Clipping treatment with two levels, clipped and non-clipped, was
performed at a whole-plot level. The two sub-plot treatment factors of nutrient fertilization
(N) and grass (G), each had two levels, viz. presence and absence, within a given whole-plot
treatment. Four sub-plots of 2 m × 2 m area with 0.5 m distance between them were situated
at the centre, leaving a peripheral width of 1.25 m, of the whole-plot.
“Osmocote exact” was the fertiliser applied to all sub-plots provided with nutrient
treatment. It was a water soluble, granular, controlled-release fertilizer. The nutrient
composition was 15 % of N, 9 % of P2O3, 11 % of K2O, 2.5 % of MgO and other trace
elements. This fertilizer was chosen for the steady and continuous release pattern over a 12
123
month period. Nitrogen is an important limiting factor for plant growth in tropical savannas
(Bremen & de Wit 1983). The fertilizer was applied once-off in October 2009 at the rate of
4 g N m-2
month-1
. This amount was approx. double the highest level of nitrogen (2.3 g m-2
month-1
) provided by Tilman (1987) and 2.8 g N m-2
month-1
applied by Kraaij & Ward
(2006) in their study. The fertilizer applied amounted to 640 g sub-plot-1
.
Ten days after the fertilizer was added, 300 g of grass seeds were sown in each grass
treatment sub-plot. Within each grass sub-plot, the soil was compacted after the grass seeds
were added. Grasses were allowed to establish for two months before tree saplings were
transplanted into the plots. However, grass was cut to 2 cm above ground prior to tree sapling
transplantation to reduce grass competition and give some time for the tree saplings to
establish. All plots were weeded every month to keep other herbaceous plants from
interfering with the experiment. Four saplings of each species were planted at least 15 cm
apart in sub-squares within each sub-plot. The two whole plot clipping treatments alongwith
four sub-plots (nutrient and grass treatment combinations) were taken as a unit and replicated
five times. Hence, the four saplings of each species were planted in [2C × (2N × 2G)] × 5 =
40 sub-plots.
Plastic-roofed structures, made of 200 μm-thick clear greenhouse plastic film approx.
2 m aboveground were used to prevent the entry of rainwater in the irrigated whole-plots.
Each whole-plot structure was surrounded by wire mesh at 0.50 m high aboveground, to
exclude small mammalian herbivores. Percentage transmission of photosynthetically active
radiation (PAR) through the plastic was calculated (based on Bauhus, van Winden & Nicotra
2004) at 1 m above the ground using a Sunfleck PAR Ceptometer model SF-80 (Decagon
Devices Inc., Washington, DC, USA). We recorded an average percentage transmission
approx. 55 % (504.1 µmol m-2
s-1
) of PAR in the open (905.9 µmol m-2
s-1
) under the plastic

124
roofed structures. Salazar et al. (2012) have found that 32 % of natural sun light was
sufficient for seedling emergence in various Neotropical woody savanna species. The plastic
used in our study did not inhibit the saplings from receiving an adequate PAR. Irrigation was
provided such that each sub-plot within the experimental period of six months (24 weeks)
received an amount of water (5000 L) equal to the long-term average annual rainfall (1250
mm) at regular time intervals.
Clipping was done once in half the number of whole plots, three months after
transplanting the 2-3 month-old tree saplings in April 2010. In the whole-plots provided with
clipping treatment each sapling was clipped at the second internode. In addition, grass was
cut to 2 cm above ground in the grassy sub-plots within the whole-plots of the clipping
treatment.
SAPLING DEVELOPMENT AND TRANSPLANTING
The hard-coated seeds of Acacia karroo, Acacia nigrescens, Acacia sieberiana,
Acacia tortilis and Schotia brachypetala were soaked in concentrated sulphuric acid and
scarified for 1 h. They were then washed thoroughly with water to remove the traces of acid
and then soaked in water for 12 h. The soft-coated seeds of Colophospermum mopane,
Combretum apiculatum, and Strychnos spinosa were not treated with acid but were soaked in
0.2 % HgCl2 solution for 5 min to decontaminate the seeds and were then washed thoroughly
and soaked in water for 12 h. Each seed was planted in 750 mL potting bags, were then
allowed to grow in a mixture of soil, vermiculite and coconut coir. In order for the seeds to
acclimate to natural soil conditions, soil (up to 15 cm depth) from the experimental site was
used. Vermiculite and coconut coir mixture was used to increase the porosity and water
125
retention of the soil. After planting the seeds, potting bags were placed in mist beds under
shade, ensuring moist conditions throughout the day. However, Colophospermum mopane
seeds do not require a high water supply, as they are highly permeable to water and germinate
easily (Mlambo et al. 2007) and therefore were watered only once every week. Saplings were
grown for 2 – 3 months and were transplanted into the treatment plots. All the saplings were
transplanted after the first heavy rainfall for the season occurred; transplantation was
completed by mid-January 2010. The potting bags were sprayed with a general preventative
fungicide once every week until the saplings were transplanted. For them to establish,
saplings were watered immediately after transplantation. Some replacement of dead saplings
(n = 146) within a month after transplanting was done.
DATA COLLECTION AND COMPILATION
Sapling survival status (live or dead), was noted at the end of the experiment in June
2010 on all the saplings that were planted at the beginning of the experiment in February
2010. Sapling growth was measured following clipping treatment; initial measurements were
taken immediately after clipping in April 2010 and at the end of the experiment in June 2010.
Stem length (from the base to apex), basal stem diameter (two perpendicular readings) were
the pre-harvest measurements taken on each sapling. In June 2010, aboveground plant
material of half the number of live saplings was harvested. The other half of the saplings was
allowed to grow to the next season. Plant material collected was allowed to dry in a drying
oven for 48 h at 60 ˚C. Harvested grass material was sun-dried and weighed in g. Post-harvest
dried leaf and stem material of each tree sapling was weighed separately in mg.

126
Rapid attainment of overall sapling growth is essential to ensure its establishment in a
savanna ecosystem (Vadigi & Ward 2012). Hence, we analysed sapling growth in terms of
relative growth rate of the stem length (RGRL), relative growth rate of the stem basal
diameter (RGRD), total aboveground dry weight or sapling dry biomass (SDB), as well as
proportion of leaf dry biomass to the total aboveground plant dry weight (LP). The total
aboveground dry biomass for each tree sapling was calculated as the sum of leaf and stem dry
weight. Calculations for relative growth rate of sapling stem length (RGRL) and relative
growth rate of sapling basal stem diameter (RGRD) were based on the increment in ln (stem
length) and ln (basal diameter) , respectively, per unit time (Kohi et al. 2009). The initial
stem length used to calculate RGRL was taken after clipping.
STATISTICAL ANALYSIS
We used linear mixed modelling with multilevel regression and analysed our data
using the R statistical program (R Development Core Team 2011). A multilevel model is not
only capable of integrating predictors that vary across different spatio-temporal scales but can
also incorporate non-predictor variables explaining the between-group variation (Qian et al.
2010). Furthermore, linear mixed models are capable of dealing better with missing values in
the data than conventional ANOVA (Piepho, Büchse & Emrich 2003; Schielzeth &
Nakagawa 2012). The predictor factor effects on binomial survival data were estimated by
using “glmer” (generalized linear mixed model) function and effects on sapling growth were
analyzed by using ANOVA output of “lme” (linear mixed model) function.
In our full model, we tested the fixed effects of species (Spp), clipping (C), nutrients
(N) and grass (G) treatments on sapling survival and growth in order to understand species
127
differences in response to treatment factors given. Species were considered as fixed effects
because they were selected based on their dominance in either humid or mesic habitats. The
outcomes measured at the sub-plot scale in the hierarchical structure are affected by factors
measured at that scale and factors operating at the whole-plot level within the randomized
blocks (Qian et al. 2010; Schielzeth & Nakagawa 2012). A random factor was modelled to
adjust variations in the data due to a complicated spatial pseudo-replication arising from the
split-plot design (Piepho et al. 2003, Crawley 2007). We considered a split-plot error term
associated with the treatment factors, representing a sub-plot level interaction of nutrient and
grass within a whole-plot level of clipping within block / replicate (Blk) in our maximum
likelihood models. In other words, block and the block × treatment interactions were
considered as random effects in the models. We analysed the sub-plot means for each
measured growth response variable of each species to avoid pseudo-replication at the sapling
level. Equation (1) shows an example of the „lme‟ model used in R for the overall analysis:
Overall RGRL ~ Spp*C*N*G, random=~1|Blk/C/N:G Eqn (1)
The above model represents predictor parameter effects on relative growth rate in
sapling stem length (RGRL) as a linear function of all species interacting with full factorial
treatment factors, viz. clipping (C), nutrients (N), and grass (G) with a split-plot error. To test
for the effects of treatments on individual species, we modelled individual species growth as
a linear function of the full factorial treatment effects with a split-plot error term in Eqn (2).
Individual spp RGRL ~ C*N*G, random=~1|Blk/C/N:G Eqn (2)
To avoid Type Ι errors we only present individual species results where they are
consistent with the overall analysis. We also performed similar generalized linear mixed

128
model (glmer) analyses on sapling survival, but observed no overall effects of the various
treatments provided. Hence, the results of survival analyses are not presented.
All growth variables were checked for general linear model assumptions and the
variable, sapling dry biomass, was log10 transformed to ensure normal distribution and
homogeneity of variances. All main effects, interactions and treatment differences were
considered to be significant at α = 0.01, after Bonferroni corrections. Additionally, we tested
for the investment trade-off between RGRL and RGRD using a simple linear regression
analysis.
Results
RELATIVE GROWTH RATE IN STEM LENGTH
Species differed significantly in all of the growth parameters measured (Table 1). The
clipping treatment had an overall positive effect on relative growth rate in stem length
(RGRL), which differed significantly among species (Table 1). All species showed a
significantly higher RGRL with clipping (see Tables S1 to S8 in Supporting Information, Fig.
1a,b). Nutrients had an overall positive effect on sapling RGRL although species differed
significantly in their RGRL with nutrient treatment (Table 1). When each species was tested
separately, a significant positive effect of nutrients was observed only in Acacia tortilis
(without nutrients = 0.068 ± 0.017 (mean + S.E.), with nutrients = 0.086 ± 0.026 mm mm-1
week-1
; Table S6), Combretum apiculatum (without nutrients = 0.076 ± 0.020, with nutrients
= 0.106 ± 0.025 mm mm-1
week-1
; Table S7) and Colophospermum mopane (without
nutrients = 0.068 ± 0.015, with nutrients = 0.088 ± 0.020 mm mm
-1 week
-1; Table S8).
129
The interaction of clipping treatment with nutrients had an overall significant effect
on sapling RGRL, which differed significantly among the species (Table 1). When individual
species results were considered, the interactive effects of clipping and nutrients were
significant only for the sapling RGRL of Acacia karroo, Strychnos spinosa (humid species),
Acacia tortilis and Colophospermum mopane (mesic species) (see Tables S1 to S8). Among
these species, positive effects of nutrients were observed only in clipped saplings except S.
spinosa which showed a decrease in RGRL of clipped saplings with nutrients (Fig. 2a,b).
Grass competition had an overall negative effect on sapling RGRL. Species differed
significantly in their RGRL with grass treatment (Table 1). When each species was tested
separately, significant negative effect of grass competition was observed in five species out of
eight, viz. A. karroo (without grass = 0.093 ± 0.020, with grass = 0.076 ± 0.017 mm mm-1
week-1
; Table S1), Acacia sieberiana (without grass = 0.107 ± 0.024, with grass = 0.083 ±
0.019 mm mm-1
week-1
; Table S2), A. tortilis (without grass = 0.088 ± 0.023, with grass =
0.064 ± 0.020 mm mm-1
week-1
; Table S6), Combretum apiculatum (without grass = 0.114 ±
0.027, with grass = 0.068 ± 0.016 mm mm-1
week-1
; Table S7) and C. mopane (without grass
= 0.091 ± 0.019, with grass = 0.066 ± 0.016 mm mm
-1 week
-1; Table S8).
The interactive effects of clipping and grass had an overall significant effect on
sapling RGRL and differed among the species (Table 1). Clipping and grass interactions were
significant only in A. sieberiana, C. apiculatum and C. mopane, as observed after each
species was tested separately (see Tables S1 to S8). In these species, the negative effect of
grass competition was observed only in clipped saplings (Fig. 3a,b).
The interaction of nutrients with grass had a significant overall effect on sapling
RGRL (Table 1). When each species were tested separately, the results were significant for
S. spinosa only (see Tables S1 to S8). RGRL of S. spinosa was the lowest in the presence of
130
both nutrients and grass (0.055 ± 0.019 mm mm-1
week-1
) when compared to the other three
combinations (i.e. without nutrients and grass = 0.062 ± 0.029, with nutrients and without
grass = 0.075 ± 0.026, without nutrients and with grass = 0.075 ± 0.028 mm mm-1
week-1
).
RELATIVE GROWTH RATE IN STEM BASAL DIAMETER
Clipping had an overall significant negative effect on sapling relative growth rate in
stem basal diameter (RGRD), which differed significantly among the species (Table 1). When
individual species analyses were considered, relative growth rate in stem basal diameter was
found to be significant only for Acacia karroo and Acacia sieberiana (see Tables S1 to S8,
Fig. 4a,b). Grass competition had a significant overall negative effect on RGRD (Table 1).
Based on individual species results, the significant negative effect of grass competition was
observed on sapling RGRD of A. karroo (without grass = 0.023 ± 0.002, with grass = 0.015 ±
0.002 mm mm-1
week-1
; Table S1), Schotia brachypetala (without grass
= 0.013 ± 0.002
(mean + S.E.), with grass = 0.003 ± 0.002 mm mm-1
week-1
; Table S3), Acacia tortilis
(without grass = 0.016 ± 0.002, with grass = 0.003 ± 0.002 mm mm
-1 week
-1; Table S6),
Combretum apiculatum (without grass = 0.020 ± 0.001, with grass = 0.010 ± 0.003 mm mm
-1
week-1
; Table S7) and Colophospermum mopane (without grass = 0.016 ± 0.002, with grass =
0.007 ± 0.002 mm mm-1
week-1
; Table S8).
The clipping treatment interacting with grass competition had a significant effect on
overall sapling RGRD (Table 1). Based on individual species results, intact saplings of only
S. brachypetala exhibited significantly lower RGRD whereas clipped saplings showed no
significant effect of grass competition (see Table S3; Fig. 5a,b).

131
ALLOCATION TRADE-OFF BETWEEN STEM LENGTH AND DIAMETER
Relative growth rate in stem length was negatively correlated with RGRD on the non-
clipped saplings of Schotia brachypetala (r = -0.464, n = 20, P < 0.05) and Strychnos spinosa
(r = -0.559, n = 20, P < 0.01). However, in Colophospermum mopane we found a strong
positive effect (r = 0.782, n = 20, P < 0.0001). Relative growth of stem length of clipped S.
brachypetala saplings had a positive effect on its RGRD (r = 0.525, n = 20, P < 0.05).
SAPLING DRY BIOMASS
Clipping significantly reduced the overall (log10) sapling dry biomass (SDB), which
differed significantly among the species (Table 1). When each species was tested separately,
the significant negative effect of clipping on SDB was observed only in Acacia sieberiana, S.
brachypetala and C. mopane (see Tables S1 to S8, Fig. 6a,b). Nutrients had an overall
significant positive effect on SDB (Table 1). Based on the individual species results, the
positive effect of nutrients on SDB was observed only in S. brachypetala (without nutrients =
2.720 ± 0.076 (mean + S.E.), with nutrients = 2.923 ± 0.101 mm mm-1
week-1
; Table S3),
Acacia nigrescens (without nutrients = 2.800 ± 0.139, with nutrients = 3.260 ± 0.167 mm
mm-1
week-1
; Table S5) and Combretum apiculatum (without nutrients = 3.073 ± 0.143, with
nutrients = 3.637 ± 0.151 mm mm-1
week-1
; Table S7). Grass competition had an overall
significant negative effect on sapling SDB, which differed significantly among species (Table
1). All species had a significantly lower SDB in the presence of grass competition (see Tables
S1 to S8, Fig. 7a, b).

132
PROPORTION OF LEAF TO SAPLING DRY BIOMASS
The proportion of leaf to sapling dry biomass (LP) differed significantly among the
species in response to clipping (Table 1). Clipped saplings had lower LP when compared to
the intact plants in all humid and two mesic (Combretum apiculatum and Colophospermum
mopane) species (Fig. 8a,b). Grass competition had a significant negative effect on overall
sapling LP (Table 1). The negative effect of grass competition, based on each species‟ results,
was observed only in Acacia karroo (without grass = 0.365 ± 0.023 (mean + S.E.), with grass
= 0.286 ± 0.034 mm mm-1
week-1
; Table S1), Acacia sieberiana (without grass = 0.336 ±
0.026, with grass = 0.276 ± 0.039 mm mm-1
week-1
; Table S2) and Acacia tortilis (without
grass = 0.364 ± 0.023, with grass = 0.210 ± 0.024 mm mm
-1 week
-1; Table S6).
Discussion
SAPLING SURVIVAL
We observed no significant differences in sapling survival with respect to any
treatment provided. In other words, saplings survived clipping and are capable of tolerating
intense herbivory. Similarly, Hean & Ward (2012) found that clipping produced no mortality
on the seedlings of Acacia species. Nutrients also had no effect on sapling survival, similar to
the results obtained by Vadigi & Ward (2012). The increase in negative effects of grass
competition in the presence of nutrients, as shown by van der Waal et al. (2009), also
produced no significant mortality among tree saplings in our study. Grass competition was
found to be a major factor limiting tree recruitment (Ward & Esler 2011; Grellier et al. 2012).
Frequent and intense grazing may indirectly facilitate tree seedling survival by suppressing

133
grass competition (Hagenah et al. 2009). In our study, clipping was performed only once and
despite being watered daily, grasses did not significantly eliminate tree saplings. Fires can
critically impair tree sapling survival in savannas, and certain species may respond poorly to
burning (Vadigi & Ward 2012). Zida et al. (2007) have also provided evidence that tree
species richness is significantly reduced under annual fire regimes as sapling response to fires
is species-specific. However, lack of a sapling survival response to clipping and other
environmental factors (Vadigi & Ward, unpublished data) may emphasize that fires are more
important than browsing in determining the composition of humid savanna vegetation.
EFFECTS OF CLIPPING ON SAPLING GROWTH
Saplings of all species grew faster in terms of stem length after clipping. However,
clipping had a negative effect in certain species with respect to all other growth parameters
measured. Similarly, Fornara & du Toit (2007) observed that browsed Acacia nigrescens
plants in the wet season exhibited pulsed shoot growth which depended on stored nutrient
reserves within the tree. However, as also indicated by Fornara & du Toit (2007), we did not
find an increased investment in biomass compared to non-clipped saplings, at least not within
the period of our study. Previous studies have noted a positive effect of browsing or clipping
on compensatory shoot or leaf regrowth in trees (Bergström 1992; Scogings & Mopipi 2008;
Scogings, Mamashela & Zobolo 2012). Contrastingly, Augustine & McNaughton (2004)
found a decrease in leaf biomass and growth rate of twigs, and consequently reduced
recruitment among saplings that were browsed by the small mammalian herbivore, the dik-
dik (Madoqua kirkii). In our study, the negative effects of clipping on sapling growth (as
measured by the functional traits of RGRD, SDB and LP) were observed more often in humid
than mesic species. Hence, saplings of humid species could be more vulnerable to the effects

134
of browsing than mesic species. This supports our prediction that mesic species are well
adapted to herbivory, as they evolved in eutrophic soils and under high browsing pressure (du
Toit 1995). In this context, we also note that clipping did not induce sapling investment in
basal diameter as we found after fire treatment (Vadigi & Ward 2012). With one exception
(Schotia brachypetala), the clipped saplings invested simultaneously in stem length and
diameter but their intact saplings exhibited a trade-off between these two parameters. This
may indicate that S. brachypetala compensates for the loss of tissue by investing heavily in
shoot growth (volume), thereby overcoming the trade-off between the investment in stem
length and diameter.
EFFECTS OF NUTRIENTS ON SAPLING GROWTH
Sankaran, Ratnam & Hanan (2008) have indicated that, apart from water, soil nutrient
availability influences woody cover in African savannas. Soil nutrients and water increase
tree regenerative capacity and forage quality for herbivores (Grant & Scholes 2006; Scogings
& Mopipi 2008; Asner et al. 2009). In our study, the majority of species did not show any
effect of nutrients on the various growth parameters measured. However, positive effects of
nutrients were observed on RGRL of Acacia tortilis, Combretum apiculatum and
Colophospermum mopane and sapling biomass of S. brachypetala, Acacia nigrescens and C.
apiculatum. This could mean that only a few species among many may benefit from the
presence of nutrients, which in turn determines specific landscape usage by herbivores based
on the quality of the forage species. Beneficial effects of nutrient supplementation were
observed in Acacia mellifera seedlings despite grass competition (Kambatuku, Cramer &
Ward 2013). In accordance with our expectation, more mesic species benefited from nutrients
than humid species in terms of sapling growth. Humid savanna species typically adapted to

135
nutrient-poor conditions, may be investing more in roots than shoots in the presence of
favourable conditions.
Positive effects of nutrients on RGRL of Acacia karroo, Acacia tortilis and
Colophospermum mopane were observed only on their clipped saplings. These species may
respond to herbivory by rapid investments in shoot regrowth by an effective utilization of soil
resources. Moreover, the negative effect of nutrient addition on the clipped saplings of
Strychnos spinosa could mean that these saplings may be investing more in defences than in
regrowth. Within a plant, a trade-off may exist between regrowth and investment in defence
(Rohner & Ward 1997), although this may depend on whether the plants occur in high or
low-nutrient environments (Ward & Young 2002). Savanna trees may frequently invest in
defences in the presence of herbivory (e.g. Rohner & Ward 1997; Ward & Young 2002; Zinn,
Ward & Kirkman 2007).
EFFECTS OF GRASS COMPETITION ON SAPLING GROWTH
Negative effects of grass competition are as important as fire and herbivory in
determining woody plant demography (Riginos 2009; Grellier et al. 2012). Although grasses
are known to strongly suppress tree sapling establishment (Jurena & Archer 2003; Riginos
&Young 2007; Kambatuku et al. 2011; Grellier et al. 2012), they also exert negative
competitive effects on the growth of large trees (Riginos 2009). Sapling growth in all
parameters we measured was reduced in the presence of grass competition. In particular, the
RGRL of two humid and three mesic species, RGRD of two humid and three mesic species,
SDB of all species, and LP of two humid and one mesic species were lower with grass
competition. The competitive effects of grass were found in both mesic and humid species.

136
Therefore, a strong negative impact on sapling growth in our study indicates that grass
competition is a major hurdle for overall tree recruitment in savannas. In addition, we note
that Acacia karroo saplings are highly vulnerable to grass competition because this species‟
growth was significantly reduced in all parameters measured. Consistent with this result,
Chirara, Frost & Gwarazimba (1998) found that, under irrigated conditions, grass clipping
promoted seedling growth in A. karroo, an encroaching species in many savannas. However,
grasses may protect tree saplings by concealing them from herbivores (Riginos & Young
2007) and by reducing their transpiration (Grellier et al. 2012).
The clipped saplings of three species, Acacia sieberiana, Combretum apiculatum and
Colophospermum mopane invested less in RGRL in the presence of grass competition
whereas intact saplings showed no significant response (Fig. 4a,b). Contrastingly, we found a
reduction in the RGRD of intact saplings of Schotia brachypetala with grass competition but
not in the clipped plants (Fig. 5a,b). This result could mean that in the presence of grass
competition and herbivory, saplings increase their investment rates in stem diameter at the
cost of length.
Synthesis
By comparing the main results found here with our previous study (Vadigi & Ward
2012) we found that saplings have invested in stem length in response to burning and
clipping where as positive investment in basal diameter was observed only after burning but
not after clipping (negative). In addition, clipped saplings had invested less in total shoot
biomass. These characteristic responses to fire and herbivory were distinctly found in Acacia
sieberiana. This leads to increased sapling susceptibility to further disturbances, particularly
137
fire, as stem diameter or thickness may be more important than height in determining tree
sensitivity to disturbances (Midgley, Lawes & Chamaillé-Jammes 2010). Additionally, we
found that humid species were more vulnerable than mesic species to clipping and grass
competition with a reduced ability to utilize nutrients. Therefore, sapling resilience to
disturbances is reduced more after herbivory than by fire, with humid species more
susceptible than mesic species.
Herbivory (by browsers) and fire are the major factors curbing tree sapling
establishment and subsequent encroachment (Trollope 1980; Prins & van der Jeugd 1993;
Roques et al. 2001). Woody plant invasion reduces biodiversity and palatable grass species
(Trollope 1980; Ward 2005) although trees in an open savanna are important in maintaining
species diversity (Cumming et al. 1997; Fenton et al. 1998; Smit 2004). Management of
savannas is challenged by the need to sustain large mammalian herbivore populations and
maintain vegetation biodiversity (Asner et al. 2009). Based on our results, we assume that
herbivory can effectively curb tree recruitment only when it is followed by fire, i.e. after
saplings coppice. Trollope (1980) suggested that woody plant encroachment can best be
managed by allowing browsing after fires, particularly when burning is made practically easy
in humid savannas with the accumulation of excess grass fuel load. Therefore, tree-
encroached areas may require a management combination of fire and herbivory, particularly
when nutrient resources are not limited (Staver et al. 2009). Patch-wise alternation of
browsing and fire treatments will create an opportunity for the establishment of trees of
different species with the maintenance of diversity. However to achieve this, studies
considering different landscapes need to be conducted in order to assess the individual
species‟ responses to fire and forage-species preferences of herbivores (Gordijn et al. 2012).

138
These studies will enable us to identify the species vulnerable to both disturbances (viz. fire
and herbivory) and accommodate them into management plans.
Acknowledgements
This study was funded by The Shell Foundation (The Netherlands) and the National
Research Foundation, South Africa. We are grateful to people working at Mondi nursery in
KwaMbonambi, especially Mark Holmes, for helping us with the practical aspects of our
experimental study. We would like to thank Dr. Kyle Tomlinson for his valuable help with
many things. We thank Professor Joachim Saborowski and P.M.S.A. Ruwan of the
University of Göttingen, Germany for statistical advice. We would also like to thank
Professor Michael J Crawley of Imperial College and Professor Roger W. Payne of VSN
International, UK for their help with our data analysis. We thank George Carelse, Stephné
Stuart, Vanessa Stuart and Alison Young for the technical assistance provided. We also thank
Nomasonto Mthiyane, Thokozani Myeza, Thuli Ncube, Akilimali Ngomu, Andile Shange,
Nompumelelo Shishane and Sphamandla Shishane for their assistance in the field.
References
Asner, G.P., Levick, S.R., Kennedy-Bowdoin, T., Knapp, D.E., Emerson, R., Jacobson, J.,
Colgan, M.S. & Martin, R.E. (2009) Large-scale impacts of herbivores on the
structural diversity of African savannas. Proceedings of the National Academy of
Sciences of the United States of America, 106, 4947-4952.

139
Augustine, D.J. & McNaughton, S.J. (2004) Regulation of shrub dynamics by native
browsing ungulates on East African rangeland. Journal of Applied Ecology, 41, 45-
58.
Augustine, D.J., McNaughton, S.J. & Frank, D.A. (2003) Feedbacks between soil nutrients
and large herbivores in a managed savanna ecosystem. Ecological Applications, 13,
1325-1337.
Bauhus, J., van Winden, A.P. & Nicotra, A.B. (2004) Aboveground interactions and
productivity in mixed-species plantations of Acacia mearnsii and Eucalyptus
globulus. Canadian Journal of Forest Research, 34, 686-694.
Bergström, R. (1992) Browse characteristics and impact of browsing on trees and shrubs in
African savannas. Journal of Vegetation Science, 3, 315-324.
Bond, W.J. & van Wilgen, B.W. (1996) Fire and plants. Chapman & Hall, London, UK.
Bremen, H. & de Wit, C.T. (1983) Rangeland productivity and exploitation in the Sahel.
Science, 221, 1341-1347.
Briggs, J.M., Knapp, A.K., Blair, J.M., Heisler, J.L., Hoch, G.A., Lett, M.S. & McCarron,
J.K. (2005) An ecosystem in transition: causes and consequences of the conversion of
mesic grassland to shrubland. BioScience, 55, 243-254.
Chidumayo, E. (2008) Implications of climate warming on seedling emergence and mortality
of African savanna woody plants. Plant Ecology, 198, 61-71.
Chirara, C., Frost, P.G.H. & Gwarazimba, V.E.E. (1998) Grass defoliation affecting survival
and growth of seedlings of Acacia karroo, an encroaching species in southwestern
Zimbabwe. African Journal of Range and Forage Science, 15, 41-47.
Clarke, P.J., Lawes, M.J., Midgley, J.J., Lamont, B.B., Ojeda, F., Burrows, G.E., Enright,
N.J. & Knox, K.J.E. (2013) Resprouting as a key functional trait: how buds,
protection and resources drive persistence after fire. New Phytologist, 197, 19-35.

140
Crawley, M.J. (2007) The R Book. John Wiley & Sons Ltd, West Sussex, England.
Cumming, D.H.M., Fenton, M.B., Rautenbach, I.L., Taylor, R.D., Cumming, G.S.,
Cumming, M.S., Dunlop, J.M., Ford, G.S., Hovorka, M.D., Johnston, D.S.,
Kalcounis, M.C., Mahlanga, Z. & Portfors, C.V. (1997) Elephants, woodlands and
biodiversity in miombo woodland in southern Africa. South African Journal of
Science, 93, 231-236.
Dohn, J., Dembélé, F., Karembé, M., Moustakas, A., Amévor, K.A. & Hanan, N.P. (2012)
Tree effects on grass growth in savannas: competition, facilitation and the stress-
gradient hypothesis. Journal of Ecology, doi: 10.1111/1365-2745.12010.
Dube, S., Mlambo, D. & Sebata, A. (2009) Response of Faidherbia albida (Del.) A. Chev.,
Acacia nigrescens Oliver. and Acacia nilotica (L.) Willd ex Del. seedlings to
simulated cotyledon and shoot herbivory in a semi-arid savanna in Zimbabwe. African
Journal of Ecology, 48, 361-367.
Dublin, H.T., Sinclair, A.R.E. & McGlade, J. (1990) Elephants and fire as causes of multiple
stable states in the Serengeti-Mara woodlands. Journal of Animal Ecology, 59, 1147-
1164.
du Toit, J.T. (1995) Determinants of the composition and distribution of wildlife
communities in southern Africa. Ambio, 24, 2-6.
du Toit, J.T., Bryant, J.P. & Frisby, K. (1990) Regrowth and palatability of Acacia shoots
following pruning by African savanna browsers. Ecology, 71, 149-154.
Fenton, M.B., Cumming, D.H.M., Rautenbach, I.L., Cumming, G.S., Cumming, M.S., Ford,
G., Taylor, R.D., Dunlop, J., Hovorka, M.D., Johnston, D.S., Portfors, C.V.,
Kalcounis, M.C. & Mahlanga, Z. (1998) Bats and the loss of tree canopy in African
woodlands. Conservation Biology, 12, 399-407.

141
Fornara, D.A. & du Toit, J.T. (2007) Browsing lawns? Responses of Acacia nigrescens to
ungulate browsing in an African savanna. Ecology, 88, 200-209.
Gignoux, J., Clobert, J. & Menaut, J.C. (1997) Alternative fire resistance strategies in
savanna trees. Oecologia, 110, 576-583.
Goheen, J.R., Palmer, T.M., Keesing, F., Riginos, C. & Young, T.P. (2010) Large herbivores
facilitate savanna tree establishment via diverse and indirect pathways. Journal of
Animal Ecology, 79, 372-382.
Gordijn, P.J., Rice, E. & Ward, D. 2012. The effects of fire on woody plant encroachment are
exacerbated by succession of trees of decreased palatability. Perspectives in Plant
Ecology, Evolution and Systematics, 14, 411-422.
Grant, C.C. & Scholes, M.C. (2006) The importance of nutrient hot-spots in the conservation
and management of large wild mammalian herbivores in semi-arid savannas.
Biological Conservation, 130, 426-437.
Grellier, S., Barot, S., Janeau, J.L. & Ward, D. (2012) Grass competition is more important
than seed ingestion by livestock for Acacia recruitment in South Africa. Plant
Ecology, 213, 899-908.
Guldemond, R. & Van Aarde, R. (2008) A meta-analysis of the impact of African elephants
on savanna vegetation. Journal of Wildlife Management, 72, 892-899.
Hagenah, N., Munkert, H., Gerhardt, K. & Olff, H. (2009) Interacting effects of grass height
and herbivores on the establishment of an encroaching savanna shrub. Plant Ecology,
201, 553-566.
Hean, J.W. & Ward, D. (2012) Fire and herbivory are not substitutable: evidence from
regrowth patterns and changes in physical and chemical defences in Acacia seedlings.
Journal of Vegetation Science, 23, 13-23.

142
Higgins, S.I., Bond, W.J. & Trollope, W.S.W. (2000) Fire, resprouting and variability: a
recipe for grass-tree coexistence in savanna. Journal of Ecology, 88, 213-229.
Holdo, R.M., Holt, R.D. & Fryxell, J.M. (2009) Grazers, browsers, and fire influence the
extent and spatial pattern of tree cover in the Serengeti. Ecological Applications, 19,
95-109.
Jurena, P.N. & Archer, S. (2003) Woody plant establishment and spatial heterogeneity in
grasslands. Ecology, 84, 907–919.
Kambatuku, J.R., Cramer, M.D. & Ward, D. (2011) Savanna tree–grass competition is
modified by substrate type and herbivory. Journal of Vegetation Science, 22, 225-237.
Kambatuku, J., Cramer, M. & Ward, D. (2013) Nitrogen fertilisation reduces grass-induced
N2 fixation of tree seedlings from semi-arid savannas. Plant and Soil, 365, 307-320.
King, L.C. (1982) The Natal Monocline: explaining the origin and scenery of Natal, South
Africa, 2nd
edn. University of Natal Press, Pietermaritzburg, South Africa.
Kohi, E.M., De Boer, W.F., Slot, M., van Wieren, S.E., Ferwerda, J.G., Grant, R.C.,
Heitkönig, I.M.A., de Knegt, H.J., Knox, N., van Langevelde, F., Peel, M., Slotow,
R., van der Waal, C. & Prins, H.H.T. (2009) Effects of simulated browsing on growth
and leaf chemical properties in Colophospermum mopane saplings. African Journal of
Ecology, 48, 190-196.
Kraaij, T. & Ward, D. (2006) Effects of rain, nitrogen, fire and grazing on tree recruitment
and early survival in bush-encroached savanna, South Africa. Plant Ecology, 186,
235-246.
Lehmann, C.E., Prior, L.D. & Bowman, D.M.J.S. (2009) Fire controls population structure in
four dominant tree species in a tropical savanna. Oecologia, 161, 505-515.
Levick, S. & Rogers, K. (2008) Patch and species specific responses of savanna woody
vegetation to browser exclusion. Biological Conservation, 141, 489-498.

143
Ludwig, F., de Kroon, H. & Prins, H.H.T. (2008) Impacts of savanna trees on forage quality
for a large African herbivore. Oecologia, 155, 487-496.
Mbatha, K.R. & Ward, D. (2010) Effects of herbivore exclosures on variation in quality and
quantity of plants among management and habitat types in a semiarid savanna.
African Journal of Range and Forage Science, 27, 1-9.
Midgley, J. J., Lawes, M. J. & Chamaillé-Jammes, S. (2010) Savanna woody plant dynamics:
the role of fire and herbivory, separately and synergistically. Australian Journal of
Botany, 58, 1-11.
Mlambo, D., Nyathi, P. & Mwenje, E. (2007) Influence of microhabitat on survival of
Colophospermum mopane seeds and seedlings in a semi-arid African savanna. New
research in forest ecology (ed A.K. Scaggs), pp. 61-78. Nova Science Publishers, Inc.,
New York.
Mucina, L. & Rutherford, M.C. (2006) The vegetation of South Africa, Lesotho and
Swaziland. Strelitzia 19. South African National Biodiversity Institute, Pretoria, South
Africa.
Piepho, H.P., Büchse, A. & Emrich, K. (2003) A hitchhiker's guide to mixed models for
randomized experiments. Journal of Agronomy and Crop Science, 189, 310-322.
Poorter, H., Niklas, K.J., Reich, P.B., Oleksyn, J., Poot, P. & Mommer, L. (2012) Biomass
allocation to leaves, stems and roots: meta-analyses of interspecific variation and
environmental control. New Phytologist, 193, 30-50.
Prins, H.H.T. & van der Jeugd, H.P. (1993) Herbivore population crashes and woodland
structure in East Africa. Journal of Ecology, 81, 305-314.
Qian, S.S., Cuffney, T.F., Alameddine, I., McMahon, G. & Reckhow, K.H. (2010) On the
application of multilevel modeling in environmental and ecological studies. Ecology,
91, 355-361.
144
Ratajczak, Z., Nippert, J.B. & Collins, S.L. (2012) Woody encroachment decreases diversity
across North American grasslands and savannas. Ecology, 93, 697-703.
Riginos, C. (2009) Grass competition suppresses savanna tree growth across multiple
demographic stages. Ecology, 90, 335-340.
Riginos, C. & Young, T.P. (2007) Positive and negative effects of grass, cattle, and wild
herbivores on Acacia saplings in an East African savanna. Oecologia, 153, 985-995.
Ritchie, M.E., Tilman, D. & Knops, J.M.H. (1998) Herbivore effects on plant and nitrogen
dynamics in oak savanna. Ecology, 79, 165-177.
Rohner, C. & Ward, D. (1997) Chemical and mechanical defense against herbivory in two
sympatric species of desert Acacia. Journal of Vegetation Science, 8, 717-726.
Roques, K.G., O'Connor, T.G. & Watkinson, A.R. (2001) Dynamics of shrub encroachment
in an African savanna: relative influences of fire, herbivory, rainfall and density
dependence. Journal of Applied Ecology, 38, 268-280.
Sakai, A. & Sakai, S. (1998) A test for the resource remobilization hypothesis: tree sprouting
using carbohydrates from above-ground parts. Annals of Botany, 82, 213-216.
Salazar, A., Goldstein, G., Franco, A.C. & Miralles-Wilhelm, F. (2012) Differential seedling
establishment of woody plants along a tree density gradient in Neotropical savannas.
Journal of Ecology, 100, 1411-1421.
Sankaran, M., Ratnam, J. & Hanan, N. (2008) Woody cover in African savannas: the role of
resources, fire and herbivory. Global Ecology and Biogeography, 17, 236-245.
Schielzeth, H. & Nakagawa, S. (2012) Nested by design: model fitting and interpretation in a
mixed model era. Methods in Ecology and Evolution, doi: 10.1111/j.2041-
210x.2012.00251.x.
Scholes, R.J. & Archer, S.R. (1997) Tree-grass interactions in savannas. Annual Review of
Ecology and Systematics, 28, 517-544.

145
Scogings, P.F., Mamashela, T.C. & Zobolo, A.M. (2012) Deciduous sapling responses to
season and large herbivores in a semi-arid African savanna. Austral Ecology,
doi:10.1111/j.1442-9993.2012.02454.x.
Scogings, P.F. & Mopipi, K. (2008) Effects of water, grass and N on responses of Acacia
karroo seedlings to early wet season simulated browsing: Aboveground growth and
biomass allocation. Journal of Arid Environments, 72, 509-522.
Seymour, C. (2008) Grass, rainfall and herbivores as determinants of Acacia erioloba
(Meyer) recruitment in an African savanna. Plant Ecology, 197, 131-138.
Shaw, M.T., Keesing, F. & Ostfeld, R.S. (2002) Herbivory on Acacia seedlings in an East
African savanna. Oikos, 98, 385-392.
Shrader, A.M., Bell, C., Bertolli L. & Ward, D. (2012) Forest or the trees: At what scale do
elephants make foraging decisions? Acta Oecologica, 42, 3-10.
Smit, G.N. (2004) An approach to tree thinning to structure southern African savannas for
long-term restoration from bush encroachment. Journal of Environmental
Management, 71, 179-191.
Staver, A.C., Bond, W.J. & February, E.C. (2011) History matters: tree establishment
variability and species turnover in an African savanna. Ecosphere, 2, art49.
Tilman, D. (1987) Secondary succession and the pattern of plant dominance along
experimental nitrogen gradients. Ecological Monographs, 57, 189-214.
Trollope, W. S. W. (1980) Controlling bush encroachment with fire in the savanna areas of
South Africa. Proceedings of the Annual Congresses of the Grassland Society of
southern Africa, 15, 173-177.
Vadigi, S. & Ward, D. (2012) Fire and nutrient gradient effects on the sapling ecology of four
Acacia species in the presence of grass competition. Plant Ecology, 213, 1793-1802.

146
van Auken, O.W. (2000) Shrub invasions of North American semiarid grasslands. Annual
Review of Ecology and Systematics, 31, 197-215.
van de Koppel, J. & Prins, H.H.T. (1998) The importance of herbivore interactions for the
dynamics of African savanna woodlands: an hypothesis. Journal of Tropical Ecology,
14, 565-576.
van der Waal, C., de Kroon, H., de Boer, W.F., Heitkönig, I.M.A., Skidmore, A.K., de Knegt,
H.J., van Langevelde, F., van Wieren, S.E., Grant, R.C., Page, B.R., Slotow, R., Kohi,
E.M., Mwakiwa, E. & Prins, H.H.T. (2009) Water and nutrients alter herbaceous
competitive effects on tree seedlings in a semi-arid savanna. Journal of Ecology, 97,
430-439.
van der Waal, C., Kool, A., Meijer, S.S., Kohi, E., Heitkönig, I.M.A., de Boer, W.F., van
Langevelde, F., Grant, R.C., Peel, M.J.S., Slotow, R., de Knegt, H.J., Prins, H.H.T &
de Kroon, H. (2011) Large herbivores may alter vegetation structure of semi-arid
savannas through soil nutrient mediation. Oecologia, 165, 1095-1107.
van Langevelde, F., van de Vijver, C.A.D.M., Kumar, L., van de Koppel, J., de Ridder, N.,
van Andel, J., Skidmore, A.K., Hearne, J.W., Stroosnijder, L., Bond, W.J., Prins,
H.H.T. & Rietkerk, M. (2003) Effects of fire and herbivory on the stability of savanna
ecosystems. Ecology, 84, 337-350.
van de Vijver, C.A.D.M., Foley, C.A. & Olff, H. (1999) Changes in the woody component of
an East African savanna during 25 years. Journal of Tropical Ecology, 15, 545-564.
Wakeling, J.L., Cramer, M.D. & Bond, W.J. (2010) Is the lack of leguminous savanna trees
in grasslands of South Africa related to nutritional constraints? Plant and Soil, 336,
173-182.
Wakeling, J.L., Cramer, M.D. & Bond, W.J. (2012) The savanna-grassland „treeline‟: why
don‟t savanna trees occur in upland grasslands? Journal of Ecology, 100, 381-391.

147
Ward, D. (2005) Do we understand the causes of bush encroachment in African savannas?
African Journal of Range and Forage Science, 22, 101-105.
Ward, D. (2011) Population differentiation in a purported ring species, Acacia karroo
(Mimosoideae). Biological Journal of the Linnean Society, 104, 748-755.
Ward, D. & Esler, K. (2011) What are the effects of substrate and grass removal on
recruitment of Acacia mellifera seedlings in a semi-arid environment? Plant Ecology,
212, 245-250.
Ward, D. & Young, T.P. (2002) Effects of large mammalian herbivores and ant symbionts on
condensed tannins of Acacia drepanolobium in Kenya. Journal of Chemical Ecology,
28, 921-937.
Western, D. & Maitumo, D. (2004) Woodland loss and restoration in a savanna park: a 20-
year experiment. African Journal of Ecology, 42, 111-121.
Zida, D., Sawadogo, L., Tigabu, M., Tiveau, D. & Odén, P.C. (2007) Dynamics of sapling
population in savanna woodlands of Burkina Faso subjected to grazing, early fire and
selective tree cutting for a decade. Forest Ecology and Management, 243, 102-115.
Zinn, A.D., Ward, D. & Kirkman, K. (2007) Inducible defences in Acacia sieberiana in
response to giraffe browsing. African Journal of Range and Forage Science, 24, 123-
129.

148
Supporting Information (see below Figures)
Additional Supporting Information may be found in the online version of this article:
Table S1. Linear mixed model analysis results of Acacia karroo growth parameters
Table S2. Linear mixed model analysis results of Acacia sieberiana growth parameters
Table S3. Linear mixed model analysis results of Schotia brachypetala growth parameters
Table S4. Linear mixed model analysis results of Strychnos spinosa growth parameters
Table S5. Linear mixed model analysis results of Acacia nigrescens growth parameters
Table S6. Linear mixed model analysis results of Acacia tortilis growth parameters
Table S7. Linear mixed model analysis results of Combretum apiculatum growth parameters
Table S8. Linear mixed model analysis results of Colophospermum mopane growth
parameters

149
Table 1. Linear mixed model (lme) analysis using maximum likelihood, showing the individual and interactive effects of clipping (D), nutrient (N) and grass
(G) treatments (two levels each) on all species. Treatments were provided in the presence of irrigation (high water availability) and natural light. Interactive
effects of nutrient and grass (sub-plot) within the treatment clipping (performed at a whole plot level) within replicates (block units) were considered as split-
plot error. We analyzed final - initial relative growth rate of stem length (RGRL in mm mm-1
week-1
) and final - initial relative growth rate in stem basal
diameter (RGRD in mm mm-1
week-1
), after clipping in April 2010. The final proportion of leaf to sapling dry biomass (LP) and final log 10 transformed
sapling dry biomass (SDB in mg), taken in June 2010, were analyzed. The numerator degrees of freedom (df), error df, F-value and significance are indicated
per factor and factor interactions. The values in bold are significant, using a Bonferroni correction (p < 0.01)
Source
df
RGRL RGRD LP SDB
Err df
F
P
Err df
F
P
Err df
F
P
Err df
F
P
Spp
7
205
10.42
<.0001
205
14.83
<.0001
204
30.74
<.0001
205
36.63
<.0001
D
1
4
775.75
<.0001
4
36.49
0.0038
4
3.14
0.1509
4
23.15
0.0086
N
1
24
21.14
0.0001
24
1.31
0.2632
24
1.35
0.2559
24
33.52
<.0001
G
1
24
54.53
<.0001
24
40.98
<.0001
24
20.03
0.0002
24
138.08
<.0001
Spp:D
7
205
12.86
<.0001
205
3.56
0.0012
204
2.88
0.0069
205
5.09
<.0001
Spp:N
7
205
3.22
0.0029
205
1.51
0.1649
204
0.55
0.7991
205
2.18
0.0372
D:N
1
24
10.38
0.0036
24
1.97
0.1734
24
0.03
0.8547
24
7.64
0.0108
Spp:G
7
205
3.18
0.0032
205
0.92
0.4904
204
1.22
0.2943
205
5.56
<.0001
D:G
1
24
38.86
<.0001
24
12.46
0.0017
24
0.53
0.4720
24
3.16
0.0883
N:G
1
24
18.09
0.0003
24
0.00
0.9745
24
0.12
0.7353
24
2.75
0.1103
Spp:D:N
7
205
4.61
0.0001
205
0.77
0.6139
204
1.74
0.1009
205
0.36
0.9244
Spp:D:G
7
205
3.36
0.0021
205
0.57
0.7834
204
1.31
0.2462
205
1.35
0.2279
Spp:N:G
7
205
1.61
0.1343
205
0.40
0.9017
204
0.50
0.8321
205
0.64
0.7183
D:N:G
1
24
4.27
0.0498
24
5.41
0.0289
24
0.66
0.4237
24
1.47
0.2379
Spp:D:N:G 7
205
1.92
0.0677
205
0.46
0.8632
204
1.02
0.4184
205
0.95
0.4664
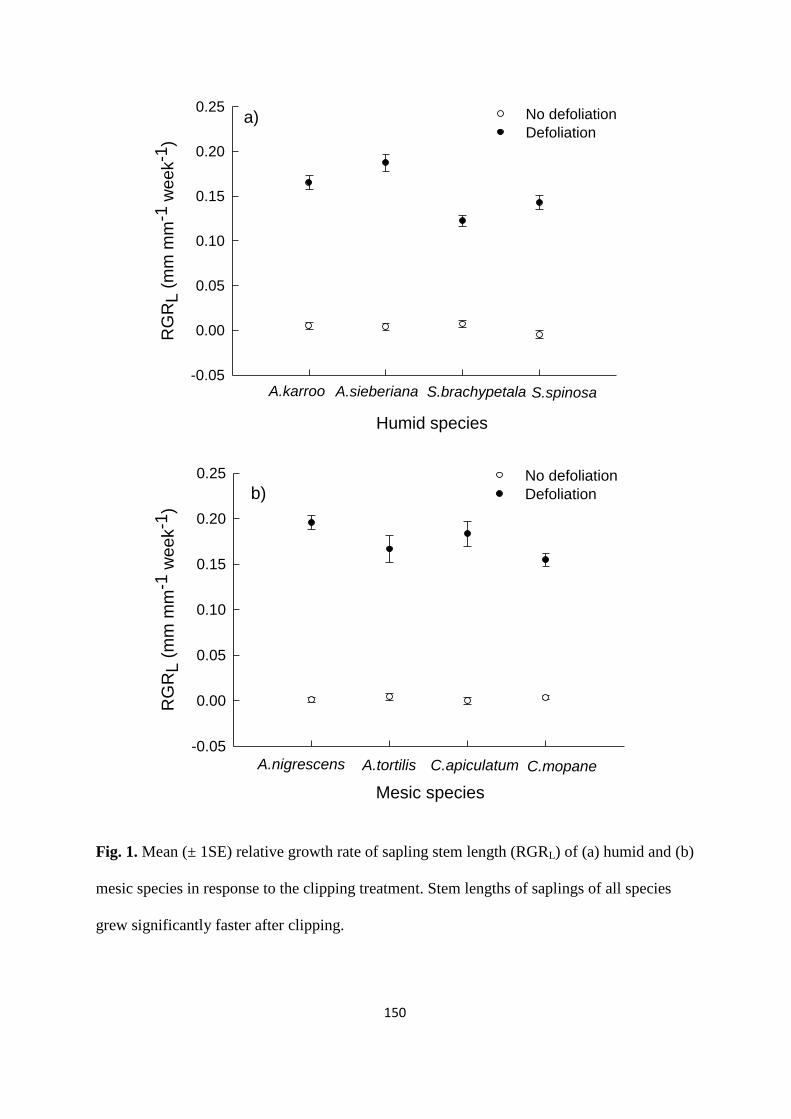
150
RG
RL (
mm
mm
-1 w
ee
k-1
)
-0.05
0.00
0.05
0.10
0.15
0.20
0.25No defoliation
Defoliation
Humid species
A.karroo A.sieberiana S.brachypetala S.spinosa
a)
b)
RG
RL (
mm
mm
-1 w
ee
k-1
)
-0.05
0.00
0.05
0.10
0.15
0.20
0.25 No defoliation
Defoliation
C.apiculatum C.mopaneA.nigrescens
Mesic species
A.tortilis
b)
Fig. 1. Mean (± 1SE) relative growth rate of sapling stem length (RGRL) of (a) humid and (b)
mesic species in response to the clipping treatment. Stem lengths of saplings of all species
grew significantly faster after clipping.

151
RG
RL (
mm
mm
-1 w
eek-1
)
-0.05
0.00
0.05
0.10
0.15
0.20
0.25
0.30 No defoliation
Defoliation
Humid species
N1N0 N0 N1 N0 N0N1 N1
A.karroo A.sieberiana S.brachypetala S.spinosa
a)
RG
RL (
mm
mm
-1 w
eek-1
)
-0.05
0.00
0.05
0.10
0.15
0.20
0.25
0.30 No defoliation
Defoliation
N1
C.apiculatum C.mopane
N0
A.nigrescens
Mesic species
N0 N1N0
A.tortilis
N1N1 N0
b)

152
Fig. 2. Mean (± 1SE) relative growth rate sapling stem length (RGRL) of (a) humid and (b)
mesic species in response to clipping and nutrient availability. The treatment levels of
nutrients (N1- nutrient addition and N0 – no nutrients) are represented on the x-axis, for each
species. To be read as a two-way interactive effect of clipping and nutrients on RGRL of each
species separately. Significant increases in RGRL with nutrients were observed only in
defoliated saplings of Acacia karroo, Acacia tortilis and Colophospermum mopane whereas
Strychnos spinosa showed a decrease in defoliated sapling RGRL with nutrients, relative to
unfertilized plants.

153
RG
RL (
mm
mm
-1 w
eek-1
)
-0.05
0.00
0.05
0.10
0.15
0.20
0.25
0.30No defoliation
Defoliation
Humid species
A.karroo A.sieberiana S.brachypetala S.spinosa
G1G0 G0 G1 G0 G0G1 G1
a)
RG
RL (
mm
mm
-1 w
eek-1
)
-0.05
0.00
0.05
0.10
0.15
0.20
0.25
0.30No defoliation
Defoliation
Mesic species
G0 G0 G0G0G1
A.nigrescens A.tortilis C.apiculatum C.mopane
G1G1 G1
b)

154
Fig. 3. Mean (± 1SE) relative growth rate of sapling stem length (RGRL) of (a) humid and (b)
mesic species in response to clipping and grass competition. The treatment levels of grass
(G1- grass competition and G0 – no grass) are represented on the x-axis, for each species. To
be read as a two-way interactive effect of clipping and grass on RGRL of each species
separately. A negative effect of grass competition on RGRL was observed only in defoliated
saplings of Acacia sieberiana, Combretum apiculatum and Colophospermum mopane
relative to the sapling RGRL with no grass competition.

155
RG
RD
(m
m m
m-1
week-1
)
0.00
0.01
0.02
0.03
0.04
0.05 No defoliation
Defoliation
Humid species
A.karroo A.sieberiana S.brachypetala S.spinosa
a)
RG
RD
(m
m m
m-1
week-1
)
0.00
0.01
0.02
0.03
0.04
0.05No defoliation
Defoliation
C.apiculatum C.mopaneA.nigrescens
Mesic species
A.tortilis
b)
Fig. 4. Mean (± 1SE) relative growth rate of sapling stem basal diameter (RGRD) of (a)
humid and (b) mesic species in response to the clipping treatment. Relative growth rate in
stem basal diameter was significantly lower in defoliated Acacia karroo and Acacia
sieberiana saplings.
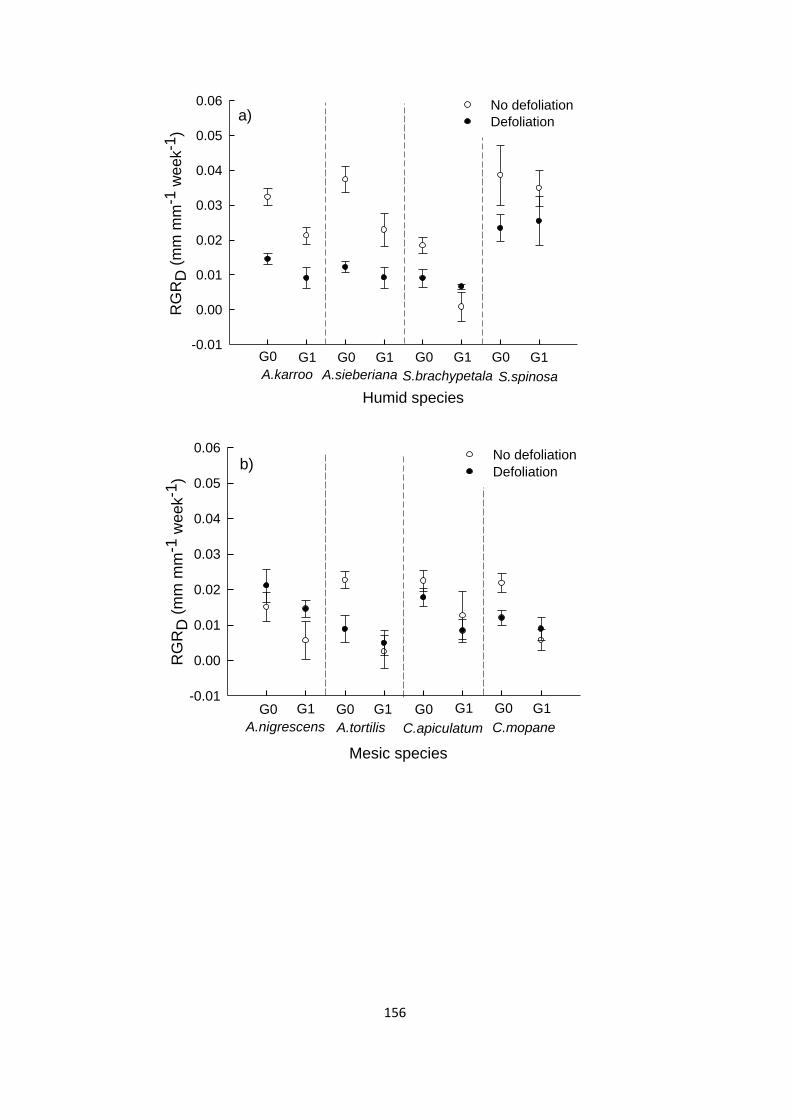
156
RG
RD
(m
m m
m-1
we
ek-1
)
-0.01
0.00
0.01
0.02
0.03
0.04
0.05
0.06 No defoliation
Defoliation
Humid species
G1G0 G0 G1 G0 G0G1 G1
A.karroo A.sieberiana S.brachypetala S.spinosa
a)
RG
RD
(m
m m
m-1
we
ek-1
)
-0.01
0.00
0.01
0.02
0.03
0.04
0.05
0.06No defoliation
Defoliation
Mesic species
G0 G0 G0G0G1
A.nigrescens A.tortilis C.apiculatum C.mopane
G1G1 G1
b)

157
Fig. 5. Mean (± 1SE) relative growth rate of sapling stem basal diameter (RGRD) of (a)
humid and (b) mesic species in response to clipping and grass competition. The treatment
levels of grass (G1- grass competition and G0 – no grass) are represented on the x-axis, for
each species. To be read as a two-way interactive effect of clipping and grass on RGRD of
each species separately. A significant negative effect of grass competition on sapling RGRD
was observed in the absence of clipping in Schotia brachypetala.

158
(lo
g10)
Sa
plin
g d
ry b
iom
ass (
mg
)
2.0
2.5
3.0
3.5
4.0
4.5 No defoliation
Defoliation
Humid species
A.karroo A.sieberiana S.brachypetala S.spinosa
a)
(log
10
) S
ap
ling
dry
bio
mass (
mg)
2.0
2.5
3.0
3.5
4.0
4.5 No defoliation
Defoliation
C.apiculatum C.mopaneA.nigrescens
Mesic species
A.tortilis
b)
Fig. 6. The log10 mean (± 1SE) sapling dry biomass (SDB) values (mg) of (a) humid and (b)
mesic species in response to the clipping treatment. Sapling dry biomass was significantly
lower in defoliated Acacia sieberiana, Schotia brachypetala and Colophospermum mopane
saplings.

159
(lo
g1
0)
Sap
ling d
ry b
iom
ass (
mg
)
2.0
2.5
3.0
3.5
4.0
4.5 No grass
Grass
Humid species
A.karroo A.sieberiana S.brachypetala S.spinosa
a)
(lo
g1
0)
Sa
plin
g d
ry b
iom
ass (
mg
)
2.0
2.5
3.0
3.5
4.0
4.5 No grass
Grass
C.apiculatum C.mopaneA.nigrescens
Mesic species
A.tortilis
b)
Fig. 7. The log10 mean (± 1SE) sapling dry biomass (SDB) values (mg) of (a) humid and (b)
mesic species in response to grass competition. All species showed significantly lower SDB
in the presence of grass competition.
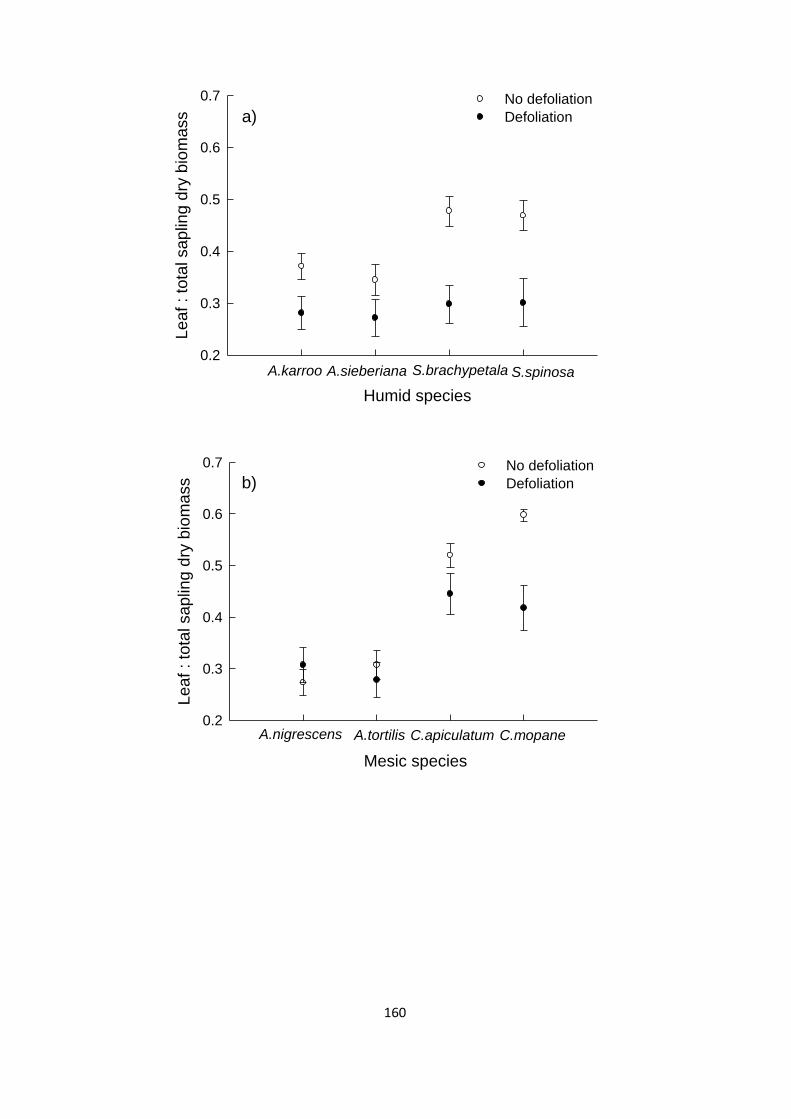
160
Le
af
: to
tal sa
plin
g d
ry b
iom
ass
0.2
0.3
0.4
0.5
0.6
0.7 No defoliation
Defoliation
Humid species
A.karroo A.sieberiana S.brachypetala S.spinosa
a)
Lea
f : to
tal saplin
g d
ry b
iom
ass
0.2
0.3
0.4
0.5
0.6
0.7 No defoliation
Defoliation
C.apiculatum C.mopaneA.nigrescens
Mesic species
A.tortilis
b)

161
Fig. 8. Mean (± 1SE) leaf proportion (LP - taken as a ratio of leaf dry biomass to total
sapling dry biomass) values of (a) humid and (b) mesic species in response to the clipping
treatment. Defoliated saplings had lower LP when compared to the intact plants in Acacia
karroo, Acacia sieberiana, Schotia brachypetala, Strychnos spinosa, Combretum apiculatum
and Colophospermum mopane.

162
Supporting information
Table S1. Linear mixed model (lme) analysis using maximum likelihood, showing the individual and interactive effects of clipping (D), nutrient (N) and
grass (G) treatments (two levels each) on Acacia karroo saplings. Treatments were provided in the presence of irrigation (high water availability) and
natural light. Interactive effects of nutrient and grass (sub-plot) within the treatment clipping (performed at a whole plot level) within replicates (block
units) was considered as split plot error. We analyzed final-initial relative growth rate of stem length (RGRL in mm mm-1
week-1
) and final-initial relative
growth rate in stem basal diameter (RGRD in mm mm-1
week-1
) after clipping in April 2010. The final proportion of leaf to sapling dry biomass (LP) and
final log10 transformed sapling dry biomass (SDB in mg), taken in June 2010, were analyzed. The numerator degrees of freedom (df), error df, F-value and
significance are indicated per factor and factor interactions. The values in bold are significant, using a Bonferroni correction (p < 0.01)
Source
Acacia karroo
df RGRL RGRD LP SDB
Err df
F
p
Err df
F
p
Err df
F
p
Err df
F
p
D
1
4
164.7995
0.0002
4
38.9369
0.0034
4
1.7631
0.2549
4
10.8405
0.0301
N
1
24
5.7784
0.0243
24
0.3512
0.5590
24
0.219
0.6440
24
5.4105
0.0288
G
1
24
11.3578
0.0025
24
11.9446
0.0021
24
10.8977
0.0030
24
14.9996
0.0007
D:N
1
24
10.2968
0.0038
24
0.2008
0.6581
24
4.3184
0.0486
24
0.22
0.6433
D:G
1
24
7.1135
0.0135
24
1.3485
0.2570
24
0.2381
0.6300
24
0.1124
0.7403
N:G
1
24
0.2645
0.6118
24
0.0774
0.7832
24
0.6702
0.4210
24
0.8192
0.3744
D:N:G 1
24
5.5234
0.0273
24
4.176
0.0521
24
0.0002
0.9892
24
0.3419
0.5642

163
Table S2. Linear mixed model (lme) analysis using maximum likelihood, showing the individual and interactive effects of clipping (D), nutrient (N) and
grass (G) treatments (two levels each) on Acacia sieberiana saplings. Treatments were provided in the presence of irrigation (high water availability) and
natural light. Interactive effects of nutrient and grass (sub-plot) within the treatment clipping (performed at a whole plot level) within replicates (block
units) was considered as split plot error. We analyzed final-initial relative growth rate of stem length (RGRL in mm mm-1
week-1
) and final-initial relative
growth rate in stem basal diameter (RGRD in mm mm-1
week-1
) after clipping in April 2010. The final proportion of leaf to sapling dry biomass (LP) and
final log10 transformed sapling dry biomass (SDB in mg), taken in June 2010, were analyzed. The numerator degrees of freedom (df), error df, F-value and
significance are indicated per factor and factor interactions. The values in bold are significant, using a Bonferroni correction (p < 0.01)
Source
Acacia sieberiana
df RGRL RGRD LP SDB
Err df
F
p
Err df
F
p
Err df
F
p
Err df
F
p
D
1
4
509.8795
<.0001
4
33.9561
0.0043
4
0.9417
0.3868
4
24.9335
0.0075
N
1
24
0.0347
0.8539
24
1.4615
0.2385
23
0.0003
0.9867
24
5.3191
0.0300
G
1
24
11.196
0.0027
24
6.772
0.0156
23
2.808
0.1073
24
33.6515
<.0001
D:N
1
24
0.3936
0.5363
24
1.2017
0.2839
23
0.8986
0.3530
24
2.9697
0.0977
D:G
1
24
11.6317
0.0023
24
2.9284
0.0999
23
2.5244
0.1258
24
3.9787
0.0576
N:G
1
24
7.7577
0.0103
24
0.0086
0.9268
23
0.0791
0.7810
24
1.2874
0.2677
D:N:G 1
24
4.1142
0.0538
24
0.0785
0.7818
23
0.0027
0.9589
24
0.308
0.5840

164
Table S3. Linear mixed model (lme) analysis using maximum likelihood, showing the individual and interactive effects of clipping (D), nutrient (N) and
grass (G) treatments (two levels each) on Schotia brachypetala saplings. Treatments were provided in the presence of irrigation (high water availability)
and natural light. Interactive effects of nutrient and grass (sub-plot) within the treatment clipping (performed at a whole plot level) within replicates (block
units) was considered as split plot error. We analyzed final-initial relative growth rate of stem length (RGRL in mm mm-1
week-1
) and final-initial relative
growth rate in stem basal diameter (RGRD in mm mm-1
week-1
) after clipping in April 2010. The final proportion of leaf to sapling dry biomass (LP) and
final log10 transformed sapling dry biomass (SDB in mg), taken in June 2010, were analyzed. The numerator degrees of freedom (df), error df, F-value and
significance are indicated per factor and factor interactions. The values in bold are significant, using a Bonferroni correction (p < 0.01)
Source
Schotia brachypetala
df RGRL RGRD LP SDB
Err df
F
p
Err df
F
p
Err df
F
p
Err df
F
p
D
1
4
143.5584
0.0003
4
0.5684
0.4928
4
10.8334
0.0302
4
22.7708
0.0088
N
1
24
1.0931
0.3062
24
2.9621
0.0981
24
0.2683
0.6092
24
8.0157
0.0092
G
1
24
4.0652
0.0551
24
17.9153
0.0003
24
6.3282
0.0190
24
36.4627
<.0001
D:N
1
24
1.9293
0.1776
24
0.2961
0.5914
24
0.4308
0.5179
24
3.8648
0.0610
D:G
1
24
2.9936
0.0964
24
10.4143
0.0036
24
0.8286
0.3717
24
3.309
0.0814
N:G
1
24
2.1488
0.1557
24
1.1103
0.3025
24
0.6495
0.4282
24
0.001
0.9754
D:N:G
1
24
0.0005
0.9821
24
6.3467
0.0188
24
2.7229
0.1119
24
0.2275
0.6377

165
Table S4. Linear mixed model (lme) analysis using maximum likelihood, showing the individual and interactive effects of clipping (D), nutrient (N) and
grass (G) treatments (two levels each) on Strychnos spinosa saplings. Treatments were provided in the presence of irrigation (high water availability) and
natural light. Interactive effects of nutrient and grass (sub-plot) within the treatment clipping (performed at a whole plot level) within replicates (block
units) was considered as split plot error. We analyzed final-initial relative growth rate of stem length (RGRL in mm mm-1
week-1
) and final-initial relative
growth rate in stem basal diameter (RGRD in mm mm-1
week-1
) after clipping in April 2010. The final proportion of leaf to sapling dry biomass (LP) and
final log10 transformed sapling dry biomass (SDB in mg), taken in June 2010, were analyzed. The numerator degrees of freedom (df), error df, F-value and
significance are indicated per factor and factor interactions. The values in bold are significant, using a Bonferroni correction (p < 0.01)
Source
Strychnos spinosa
df RGRL RGRD LP SDB
Err df
F
p
Err df
F
p
Err df
F
p
Err df
F
p
D
1
4
167.9813
0.0002
4
3.1486
0.1507
4
3.7745
0.1240
4
7.2289
0.0547
N
1
23
0.0211
0.8859
23
2.4787
0.1291
23
1.3758
0.2528
23
0.4367
0.5153
G
1
23
1.0248
0.3219
23
0
0.9993
23
0.9803
0.3324
23
16.1504
0.0005
D:N
1
23
16.774
0.0004
23
0.9634
0.3365
23
3.728
0.0659
23
1.1888
0.2869
D:G
1
23
1.5443
0.2265
23
0.528
0.4748
23
0.8121
0.3768
23
0.1001
0.7545
N:G
1
23
11.1992
0.0028
23
0.3238
0.5748
23
0.1837
0.6722
23
2.3594
0.1382
D:N:G 1
23
2.5728
0.1224
23
0.0048
0.9455
23
1.3078
0.2646
23
0.1249
0.7270

166
Table S5. Linear mixed model (lme) analysis using maximum likelihood, showing the individual and interactive effects of clipping (D), nutrient (N) and
grass (G) treatments (two levels each) on Acacia nigrescens saplings. Treatments were provided in the presence of irrigation (high water availability) and
natural light. Interactive effects of nutrient and grass (sub-plot) within the treatment clipping (performed at a whole plot level) within replicates (block
units) was considered as split plot error. We analyzed final-initial relative growth rate of stem length (RGRL in mm mm-1
week-1
) and final-initial relative
growth rate in stem basal diameter (RGRD in mm mm-1
week-1
) after clipping in April 2010. The final proportion of leaf to sapling dry biomass (LP) and
final log10 transformed sapling dry biomass (SDB in mg), taken in June 2010, were analyzed. The numerator degrees of freedom (df), error df, F-value and
significance are indicated per factor and factor interactions. The values in bold are significant, using a Bonferroni correction (p < 0.01)
Source
Acacia nigrescens
df RGRL RGRD LP SDB
Err df
F
p
Err df
F
p
Err df
F
p
Err df
F
p
D
1
2
450.8569
0.0022
2
0.123
0.7594
2
0.0472
0.8481
2
0.2617
0.6599
N
1
15
0.1591
0.6955
15
2.7104
0.1205
15
1.1965
0.2913
15
10.1154
0.0062
G
1
15
1.292
0.2735
15
6.9382
0.0188
15
0.5461
0.4713
15
32.1384
<.0001
D:N
1
15
0.1637
0.6915
15
0.743
0.4022
15
2.1365
0.1645
15
2.8126
0.1142
D:G
1
15
4.9481
0.0419
15
1.024
0.3276
15
0.0563
0.8157
15
0.2062
0.6562
N:G
1
15
1.143
0.3019
15
2.2868
0.1513
15
0.3413
0.5678
15
0.7897
0.3882
D:N:G 1
15
0.0291
0.8669
15
0.2764
0.6067
15
0.0239
0.8792
15
0.3613
0.5568

167
Table S6. Linear mixed model (lme) analysis using maximum likelihood, showing the individual and interactive effects of clipping (D), nutrient (N) and
grass (G) treatments (two levels each) on Acacia tortilis saplings. Treatments were provided in the presence of irrigation (high water availability) and
natural light. Interactive effects of nutrient and grass (sub-plot) within the treatment clipping (performed at a whole plot level) within replicates (block
units) was considered as split plot error. We analyzed final-initial relative growth rate of stem length (RGRL in mm mm-1
week-1
) and final-initial relative
growth rate in stem basal diameter (RGRD in mm mm-1
week-1
) after clipping in April 2010. The final proportion of leaf to sapling dry biomass (LP) and
final log10 transformed sapling dry biomass (SDB in mg), taken in June 2010, were analyzed. The numerator degrees of freedom (df), error df, F-value and
significance are indicated per factor and factor interactions. The values in bold are significant, using a Bonferroni correction (p < 0.01)
Source
Acacia tortilis
df RGRL RGRD LP SDB
Err df
F
p
Err df
F
p
Err df
F
p
Err df
F
p
D
1
3
199.6878
0.0008
3
2.0539
0.2473
3
0.5175
0.5239
3
23.2825
0.0170
N
1
18
12.8224
0.0021
18
0.0405
0.8427
18
0.0771
0.7845
18
5.4247
0.0317
G
1
18
9.7044
0.0060
18
15.5461
0.0010
18
28.499
<.0001
18
32.6542
<.0001
D:N
1
18
10.2902
0.0049
18
1.7373
0.2040
18
0.1723
0.6830
18
1.6078
0.2210
D:G
1
18
0.571
0.4596
18
6.4513
0.0205
18
0.4672
0.5030
18
3.4705
0.0789
N:G
1
18
7.7684
0.0122
18
0.2729
0.6078
18
2.9712
0.1019
18
1.5663
0.2268
D:N:G 1
18
3.3023
0.0859
18
0.0903
0.7673
18
5.9991
0.0248
18
2.4784
0.1328

168
Table S7. Linear mixed model (lme) analysis using maximum likelihood, showing the individual and interactive effects of clipping (D), nutrient (N) and
grass (G) treatments (two levels each) on Combretum apiculatum saplings. Treatments were provided in the presence of irrigation (high water availability)
and natural light. Interactive effects of nutrient and grass (sub-plot) within the treatment clipping (performed at a whole plot level) within replicates (block
units) was considered as split plot error. We analyzed final-initial relative growth rate of stem length (RGRL in mm mm-1
week-1
) and final-initial relative
growth rate in stem basal diameter (RGRD in mm mm-1
week-1
) after clipping in April 2010. The final proportion of leaf to sapling dry biomass (LP) and
final log10 transformed sapling dry biomass (SDB in mg), taken in June 2010, were analyzed. The numerator degrees of freedom (df), error df, F-value and
significance are indicated per factor and factor interactions. The values in bold are significant, using a Bonferroni correction (p < 0.01)
Source
Combretum apiculatum
df RGRL RGRD LP SDB
Err df
F
p
Err df
F
p
Err df
F
p
Err df
F
p
D
1
4
593.0952
<.0001
4
0.5753
0.4904
4
1.8045
0.2503
4
8.3381
0.0447
N
1
24
15.6141
0.0006
24
3.4105
0.0772
24
1.2992
0.2656
24
31.598
<.0001
G
1
24
36.4946
<.0001
24
8.3144
0.0082
24
7.4197
0.0118
24
87.7157
<.0001
D:N
1
24
6.2374
0.0198
24
1.4357
0.2425
24
1.3654
0.2541
24
2.2258
0.1487
D:G
1
24
37.0992
<.0001
24
0.0036
0.9528
24
3.2121
0.0857
24
2.009
0.1692
N:G
1
24
1.8671
0.1845
24
0.159
0.6936
24
0.0793
0.7806
24
0.3718
0.5477
D:N:G 1
24
1.6573
0.2102
24
1.2973
0.2659
24
0.3358
0.5676
24
5.5901
0.0265

169
Table S8. Linear mixed model (lme) analysis using maximum likelihood, showing the individual and interactive effects of clipping (D), nutrient (N) and
grass (G) treatments (two levels each) on Colophospermum mopane saplings. Treatments were provided in the presence of irrigation (high water
availability) and natural light. Interactive effects of nutrient and grass (sub-plot) within the treatment clipping (performed at a whole plot level) within
replicates (block units) was considered as split plot error. We analyzed final-initial relative growth rate of stem length (RGRL in mm mm-1
week-1
) and
final-initial relative growth rate in stem basal diameter (RGRD in mm mm-1
week-1
) after clipping in April 2010. The final proportion of leaf to sapling dry
biomass (LP) and final log 10 transformed sapling dry biomass (SDB in mg), taken in June 2010, were analyzed. The numerator degrees of freedom (df),
error df, F-value and significance are indicated per factor and factor interactions. The values in bold are significant, using a Bonferroni correction (p <
0.01)
Source
Colophospermum mopane
df RGRL RGRD LP SDB
Err df
F
p
Err df
F
p
Err df
F
p
Err df
F
p
D
1
4
688.8154
<.0001
4
1.7106
0.2610
4
6.6396
0.0615
4
67.2889
0.0012
N
1
24
27.6064
<.0001
24
1.1712
0.2899
24
0.1846
0.6713
24
3.9554
0.0582
G
1
24
42.4533
<.0001
24
14.3835
0.0009
24
1.1794
0.2883
24
15.959
0.0005
D:N
1
24
18.3622
0.0003
24
2.5949
0.1203
24
0.0291
0.8661
24
3.0484
0.0936
D:G
1
24
14.396
0.0009
24
6.6203
0.0167
24
0.1854
0.6706
24
1.5471
0.2256
N:G
1
24
5.1601
0.0324
24
1.2235
0.2796
24
0.021
0.8861
24
0.0905
0.7661
D:N:G 1
24
7.7311
0.0104
24
5.7051
0.0251
24
0.0022
0.9627
24
0.4628
0.5028

170
Chapter 5: Conclusions
General discussion
The physiognomy of savannas ranges from open grasslands with few trees to tall closed
woodlands with underlying grass layer (Cole 1986, Jeltsch et al. 2000). A unified theory
explaining the mechanism behind long-term coexistence of trees and grass in savannas remains
elusive (Sankaran et al. 2004, Wiegand et al. 2006, Bond 2008, Higgins et al. 2010). Early
ecological models concentrated on competition-based niche separation between the two life
forms to explain coexistence (Walter 1939, Walker et al. 1981). The niche separation mechanism
invoked by Walter (1939) assumes that water is the primary factor that limits plant growth in
semi-arid savannas, with trees and grasses avoiding competition by accessing water at different
depths of soil. Grasses access upper soil layers whereas trees access deeper layers of soil.
However, this model largely ignores the competition that might arise between tree seedlings and
grasses when their roots are confined to the upper layers of soil profile (Jurena and Archer 2003,
Ward 2005). Walter‟s (1939) two-layer hypothesis also ignores the role of other factors that
might play an important role in maintaining tree-grass ratios in areas receiving heavy rainfall or
where there is no water limitation. More recent models have recognized the fundamental roles of
disturbance (fire and herbivory) and climatic variability (mainly unpredictable variations in
rainfall) in explaining the coexistence of trees and grasses in savannas (Higgins et al. 2000;
Jeltsch et al. 2000). These models advocate coexistence through various environmental effects on
different life history stages of trees (Sankaran et al. 2004) and concur that tree sapling
recruitment is critical to the long-term dynamics of savannas. It is commonly recognized that the

171
sapling stage is the most vulnerable phase in the life history cycle of trees (Harper 1977, Bond
2008, Chidumayo 2008), particularly due to their slow growth.
Primarily, tree sapling recruitment is affected by the limitation of resources such as
water, nutrients and light (O‟Connor 1995, Davis et al. 1999, Kraaij and Ward 2006) and
disturbances such as fire and herbivory (Jeltsch et al. 2000, Sankaran et al. 2008, Midgley et al.
2010). All these factors influence tree establishment either directly or indirectly by affecting
grass competitive effects on sapling growth (Davis et al. 1999, van Langevelde et al. 2011). The
importance of fire and herbivory (disturbances) in restricting savanna sapling growth increases
along the mean annual rainfall gradient (Sankaran et al. 2005). While sapling recruitment is
mainly limited by water supply in arid savannas (Jeltsch et al. 1996, Higgins et al. 2000, Kraaij
and Ward 2006), fire and herbivory have greater effects in humid savannas (van Langevelde et
al. 2003, Bond 2008).
Physiologically, from a sapling perspective, the ability of savanna trees to utilize
available resources and invest rapidly in aboveground growth will determine its establishment in
the ecosystem despite the disturbances that may be encountered. Although savanna saplings have
the ability to resprout and persist after disturbances (Bond and van Wilgen 1996, Gignoux et al.
1997), it is sapling stem growth rates (particularly in height) that determine escape frequency
from fires (Higgins et al. 2000). The allocation to stem height occurs at the expense of diameter
(Sumida et al. 1997), which is positively correlated with bark thickness (Gignoux et al. 1997).
However, Lawes et al. (2011) have recently suggested that stem diameter and height are different
pathways to achieve thick bark and suggest the importance of bark thickness in stem protection
against fires. Savanna tree saplings utilize stored nonstructural carbohydrate root reserves to
172
resprout (Schutz et al. 2009, Wigley et al. 2009) and resources for storage are mainly derived
from photosynthesis when the leaves are not damaged (Sakai and Sakai 1998). Thus, the key
species-specific traits or proxy stem-growth measurements that determine the success of savanna
tree saplings will be their total aboveground growth, stem growth rates (diameter and height),
and investment in leaves. Wherever pertinent in this chapter, I refer to these plant functional
growth traits (see e.g. Poorter et al. 2012, Siefert 2012) as „growth‟ for convenience.
Research summary and specific future directions
Induction of defences in savanna tree species due to herbivory, even at the sapling stage
(Hean and Ward 2012), is well known (Gowda 1997, Rohner and Ward 1997, Zinn et al. 2007).
It is well understood that defence investment by saplings resprouting after fire is expensive but
important to prevent further damage due to herbivory. However, there is a notably scarcity of
studies investigating resprouter defence dynamics (Clarke et al. 2013). Hence, in Chapter 2, I
investigated the effects of fire and nutrient gradient on the survival, growth and in particular
defence investment of four Acacia species‟ saplings under greenhouse conditions. In Chapter 2,
I found that burning had no influence on resprout defence investment but the resprouts
significantly increased stem height growth rate. This indicates that resprouts may remain very
vulnerable to herbivores. My study also confirms that species differ considerably in their sapling
tolerance to burning (Bond 2008). Within the humid species tested, Acacia sieberiana was
tolerant with high resprout survival, whereas Acacia karroo showed complete intolerance to fire.
It implies there could be a major shift in tree species composition of humid savannas even after a
single fire event. Clarke et al. (2013) recognized an ongoing debate about bud-bank limitation

173
being more important than resource limitation in determining resprouting success of plants. My
results show that resource limitation has no effect on a sapling‟s ability to resprout. This adds
weight to the notion that species-specific ability to produce and protect buds determines sapling
regenerative success. Based on these results, future research could focus on investigating the
effects of different intensities of fire and frequency of fires on sapling regenerative capability of
various species. Fire intensity determines tree dynamics in mesic and humid savanna (Govender
et al. 2006). However, the frequency of fire at a particular intensity will help determine the time
taken to exhaust the bud bank for a given species (Clarke et al. 2013). This will enable us to
categorize species according to their resilience to fires and better predict landscape level changes
in species structure and composition.
In Chapter 3, I explored the relative importance of water, nutrients, shade availability,
grass competition and their interactions on tree sapling establishment in a humid savanna. I
studied the survival and growth of four humid and four mesic savanna tree species. My study
also contributes to the understanding of species-specific functional traits in a humid
environment, which may provide a useful insight to savanna ecosystem functioning (Lehmann et
al. 2009, Poorter et al. 2012, Siefert 2012). I found that, in humid savannas, sapling survival was
not dependent on any of the factors provided. This could largely be due to the presence of
favourable conditions such as low irradiance, temperature and high rainfall in humid savannas
(Jagtap 1995). It is generally understood that humid savannas support high grass fuel loads,
resulting in frequent fires inhibiting tree seedling establishment (Trollope 1980, Bond 2008,
Sankaran et al. 2008). My results indicated that shade is the most important factor suppressing
tree sapling growth in humid savannas, although grass competition also had a substantial
174
negative effect. Therefore, light could be a potential limiting factor affecting tree-grass
coexistence in humid savannas.
In the wake of continuous and rapid increases in global atmospheric CO2 (Norby and Zak
2011), further research could be streamlined to understand the effects of CO2 concentration on
sapling growth which may better predict ecosystem level changes in humid savannas. Increased
concentrations of CO2 activate plant photosynthesis and productivity and indirectly affect the
ecosystem (Ainsworth and Rogers 2007, Kgope et al. 2010). An increase in plant growth with an
increase in CO2 produces a high demand for nutrients, leading to a rapid exhaustion of nutrients
which in turn may limit further increases in plant growth even in the presence of elevated CO2
levels (Körner 2006). Hence, benefits of CO2 increase on plant productivity are contingent upon
the availability of other resources such as water, light and nutrients (Körner 2006). In addition,
numerous studies based on temperate ecosystems suggest that it is important to understand CO2
interactions with other environmental factors such as temperature, precipitation and soil moisture
(Leakey et al. 2012). However, Kgope et al. (2010) indicated that CO2 may indirectly interact
with fire and herbivory in tropical savannas by altering tree sapling growth, productivity and
ability to recover from disturbances. Despite disturbances, higher growth rates of C3 trees than
C4 grasses (dominant in savannas) under elevated CO2 levels will enable woody canopy closure
(Ward 2010) causing reduction in C4 grasses which require open, high-light environments to
flourish (Bond et al. 2003). However, based on the results obtained from Chapter 3, it will be
worth determining whether the benefits accrued to tree saplings by increased CO2 concentrations
will overcome the negative effects of shading on tree sapling growth (to attain canopy closure) in
humid savannas.
175
In Chapter 4, I tested the effects of clipping (i.e. simulated herbivory by clipping grass
and tree saplings), nutrient availability, grass competition and their interactions on sapling
survival and growth of four humid and four mesic savanna tree species. This study was
performed under controlled field conditions in a humid savanna. My main observation is that
clipping had no effect on sapling survival. However, defoliated saplings invested rapidly in stem
length with a reduced investment in thickness and total biomass. Defoliated saplings were more
sensitive to grass competition and benefitted more from nutrient addition than intact plants.
Grass competition had a substantial negative effect on sapling growth. The results in Chapter 4
support the perception that herbivory has a relatively low impact on tree population density
(Roques et al. 2001, Sankaran et al. 2005) but can alter savanna vegetative distribution (van de
Vijver et al. 1999, Bond 2008). Additionally, these results indicate that tree saplings can become
more vulnerable to fire after herbivory (or browsing), particularly in the presence of high grass
biomass in humid savannas (Bond 2008), despite the fact that investment in stem length is high.
It is well understood that fire and herbivory act synergistically to restrict tree recruitment in
savannas (Midgley et al. 2010; Hean and Ward 2011). Lack of investment in defenses after fire
(Chapter 2) and aboveground biomass after clipping (Chapter 4) provides a clear physiological
mechanism of sapling vulnerability, in terms of its aboveground functional traits. At an
ecosystem level, large mammalian herbivore preferences play an important role in the
distribution of woody plants (Levick and Rogers 2008; Gordijn et al. 2012). Therefore, further
research on herbivory could include tree species interactions with herbivore preferences to
understand woody plant establishment dynamics.

176
Interpretation and further general research directions
In our study, the mesic species had more or less similar aboveground growth whereas
among humid species there was a high variation in growth; this particular pattern of variability
was observed in all the functional traits measured (see Chapter 3). Clearly, more studies are
needed of the intraspecific variation in plant functional traits (cf. Kattge et al. 2011, Poorter et al.
2012, Siefert 2012). Among the humid species I studied, the two Acacia species had higher
growth than Schotia brachypetala and Strychnos spinosa. However, these differences were not
very obvious when these plants were defoliated (see Chapter 4). Studying plant trait variation
between humid and mesic savannas will also help us understand the importance of phylogenetic
differences among trees in these savanna types (see e.g. Cavender-Bares et al. 2004, Cadotte et
al. 2009). For example, in a common garden experiment, Tomlinson et al. (2012) have shown
that humid species differed from semi-arid species by allocating higher biomass to roots than
shoots, although they observed considerable variation in traits among humid species perhaps due
to phylogenetic differences.
Based on our results in Chapter 3, tests including a light intensity gradient might provide
more insight on plant functional traits. Specific traits of tree species can scale up to provide a
better indication of characteristic features of savannas across a climate gradient. For example,
forest species are well adapted to shade but lack sufficient root reserves to support sprouting
after fires whereas savanna seedlings can resprout (Hoffmann et al. 2004). Hence, sprouting is
the key trait difference between forest and savanna species‟ saplings that determines their
success in their respective biomes (Bond 2008). However, factorial drivers for the existence of
savanna-forest ecotone boundaries in African humid zones have not been studied. Similarly,

177
there are no studies comparing the traits of dry forest and arid savanna tree species (Bond 2008).
Studies on constraints to tree distribution based on their functional traits (see e.g. Cornelissen et
al. 2003, Kattge et al. 2011, Poorter et al. 2012, Siefert 2012) across the drier end of the moisture
gradient coupled with studies of humid savannas and forest ecotones are required to understand
tree demography among different savanna ecosystems.
References
Ainsworth E.A. and Rogers A. 2007. The response of photosynthesis and stomatal conductance
to rising [CO2]: mechanisms and environmental interactions. Plant, Cell and Environment
30: 258-270.
Bond W.J. 2008. What limits trees in C4 grasslands and savannas? Annual Review of Ecology,
Evolution and Systematics 39: 641-659.
Bond W.J., Midgley G.F. and Woodward F.I. 2003. The importance of low atmospheric CO2 and
fire in promoting the spread of grasslands and savannas. Global Change Biology 9: 973-
982.
Bond W.J. and van Wilgen B.W. 1996. Fire and plants. Chapman & Hall, London, UK.
Cadotte M., Cavender-Bares J., Oakley T. and Tilman D. 2009. Using evolutionary, functional
and trait diversity to understand patterns of plant community productivity. PloS ONE 4:
e5695.
Cavender-Bares J., Ackerly D.A., Baum D. and Bazzaz F.A. 2004. Phylogenetic overdispersion
in the assembly of Floridian oak communities. American Naturalist 163: 823-843.
178
Chidumayo E. 2008. Implications of climate warming on seedling emergence and mortality of
African savanna woody plants. Plant Ecology 198: 61-71.
Clarke P.J., Lawes M.J., Midgley J.J., Lamont B.B., Ojeda F., Burrows G.E., Enright N.J. and
Knox K.J.E. 2013. Resprouting as a key functional trait: how buds, protection and
resources drive persistence after fire. New Phytologist 197: 19-35.
Cole M.M. 1986. The savannas: biogeography and geobotany. Academic Press, London, UK.
Cornelissen, J.H.C., Cerabolini B, Castro-Díez P, Villar-Salvador P, Montserrat-Martí G,
Puyravaud J.P., Maestro M, Werger M.J.A. and Aerts, R. 2003. Functional traits of
woody plants: correspondence of species rankings between field adults and laboratory-
grown seedlings? Journal of Vegetation Science 14: 311-322.
Davis M.A., Wrage K.J., Reich P.B., Tjoelker M.G., Schaeffer T. and Muermann C. 1999.
Survival, growth, and photosynthesis of tree seedlings competing with herbaceous
vegetation along a water-light-nitrogen gradient. Plant Ecology 145: 341-350.
Gignoux J., Clobert J. and Menaut J.C. 1997. Alternative fire resistance strategies in savanna
trees. Oecologia 110: 576-583.
Gordijn P.J., Rice E. and Ward D. 2012. The effects of fire on woody plant encroachment are
exacerbated by succession of trees of decreased palatability. Perspectives in Plant
Ecology, Evolution and Systematics 14: 411-422.
Govender N., Trollope W.S.W. and van Wilgen B.W. 2006. The effect of fire season, fire
frequency, rainfall and management on fire intensity in savanna vegetation in South
Africa. Journal of Applied Ecology 43: 748-758.
Gowda J.H. 1997. Physical and chemical response of juvenile Acacia tortilis trees to browsing.
Experimental evidence. Functional Ecology 11: 106-111.

179
Harper J.L. 1977. The population biology of plants. Academic Press, New York, USA.
Hean J.W. and Ward D. 2012. Fire and herbivory are not substitutable: evidence from regrowth
patterns and changes in physical and chemical defences in Acacia seedlings. Journal of
Vegetation Science 23: 13-23.
Higgins S.I., Bond W.J. and Trollope W.S.W. 2000. Fire, resprouting and variability: A recipe
for grass-tree coexistence in savanna. Journal of Ecology 88: 213-229.
Higgins S.I., Scheiter S. and Sankaran M. 2010. The stability of African savannas: insights from
the indirect estimation of the parameters of a dynamic model. Ecology 91: 1682-1692.
Hoffmann W.A., Orthen B. and Franco A.C. 2004. Constraints to seedling success of savanna
and forest trees across the savanna-forest boundary. Oecologia 140: 252-260.
Jagtap S.S. 1995. Environmental characterization of the moist lowland savanna of Africa. In:
B.T. Kang, I.O. Akobundu, V.M. Manyong, R.J. Carsky, N. Sanginga, E.A. Kueneman
(eds), Moist savannas of Africa: potentials and constraints for crop production.
Proceedings of the international workshop held at Cotonou, Republic of Benin, 19-23
September 1994. International Institute of Tropical Agriculture, Ibadan, Nigeria, pp. 9-
30.
Jeltsch F., Milton S.J., Dean W.R.J. and van Rooyen N. 1996. Tree spacing and coexistence in
semiarid savannas. Journal of Ecology 84: 583-595.
Jeltsch F., Weber G.E. and Grimm V. 2000. Ecological buffering mechanisms in savannas: A
unifying theory of long-term tree-grass coexistence. Plant Ecology 150: 161-171.
Jurena P.N. and Archer S. 2003. Woody plant establishment and spatial heterogeneity in
grasslands. Ecology 84: 907–919.

180
Kattge J., Diaz S, Lavorel S. et al. 2011. TRY – a global database of plant traits. Global Change
Biology 17:2905-2935.
Kgope B.S., Bond W.J. and Midgley G.F. 2010. Growth responses of African savanna trees
implicate atmospheric [CO2] as a driver of past and current changes in savanna tree
cover. Austral Ecology 35: 451-463.
Körner C. 2006. Plant CO2 responses: an issue of definition, time and resource supply. New
Phytologist 172: 393-411.
Kraaij T. and Ward D. 2006. Effects of rain, nitrogen, fire and grazing on tree recruitment and
early survival in bush-encroached savanna, South Africa. Plant Ecology 186: 235-246.
Lawes M.J., Adie H., Russell-Smith J., Murphy B. and Midgley J.J. 2011. How do small savanna
trees avoid stem mortality by fire? The roles of stem diameter, height and bark thickness.
Ecosphere 2: 1-13.
Leakey A.D.B., Bishop K.A. and Ainsworth E.A. 2012. A multi-biome gap in understanding of
crop and ecosystem responses to elevated CO2. Current Opinion in Plant Biology 15:
228-236.
Lehmann C.E.R., Ratnam J. and Hutley L.B. 2009. Which of these continents is not like the
other? Comparisons of tropical savanna systems: key questions and challenges. New
Phytologist 181: 508-511.
Levick S. and Rogers K. 2008. Patch and species specific responses of savanna woody
vegetation to browser exclusion. Biological Conservation 141: 489-498.
Midgley J.J., Lawes M.J. and Chamaillé-Jammes S. 2010. Savanna woody plant dynamics: the
role of fire and herbivory, separately and synergistically. Australian Journal of Botany
58: 1-11.

181
Norby R.J. and Zak D.R. 2011. Ecological lessons from free-air CO2 enrichment (FACE)
experiments. Annual Review of Ecology, Evolution, and Systematics 42: 181-203.
O'Connor T.G. 1995. Acacia karroo invasion of grassland: environmental and biotic effects
influencing seedling emergence and establishment. Oecologia 103: 214-223.
Poorter H., Niklas K.J., Reich P.B., Oleksyn J., Poot P. and Mommer L. 2012. Biomass
allocation to leaves, stems and roots: meta-analyses of interspecific variation and
environmental control. New Phytologist 193: 30-50.
Rohner C. and Ward D. 1997. Chemical and mechanical defense against herbivory in two
sympatric species of desert Acacia. Journal of Vegetation Science 8: 717-726.
Roques K.G., O'Connor T.G. and Watkinson A.R. 2001. Dynamics of shrub encroachment in an
African savanna: relative influences of fire, herbivory, rainfall and density dependence.
Journal of Applied Ecology 38: 268-280.
Sakai A. and Sakai S. 1998. A test for the resource remobilization hypothesis: tree sprouting
using carbohydrates from above-ground parts. Annals of Botany 82: 213–216.
Sankaran M., Hanan N.P., Scholes R.J., Ratnam J., Augustine D.J., Cade B.S., Gignoux J.,
Higgins S.I., Le Roux X., Ludwig F., Ardo J., Banyikwa F., Bronn A., Bucini G., Caylor
K.K., Coughenour M.B., Diouf A., Ekaya W., Feral C.J., February E.C., Frost P.G.H.,
Hiernaux P., Hrabar H., Metzger K.L., Prins H.H.T., Ringrose S., Sea W., Tews J.,
Worden J. and Zambatis N. 2005. Determinants of woody cover in African savannas.
Nature 438: 846-849.
Sankaran M., Ratnam J. and Hanan N.P. 2004. Tree–grass coexistence in savannas revisited –
insights from an examination of assumptions and mechanisms invoked in existing
models. Ecology Letters 7: 480-490.

182
Sankaran M., Ratnam J. and Hanan N. 2008. Woody cover in African savannas: the role of
resources, fire and herbivory. Global Ecology and Biogeography 17: 236-245.
Schutz A.E.N., Bond W.J. and Cramer M.D. 2009. Juggling carbon: allocation patterns of a
dominant tree in a fire-prone savanna. Oecologia 160: 235-246.
Siefert A. 2012. Incorporating intraspecific variation in tests of trait-based community assembly.
Oecologia 170: 767-775.
Sumida A., Ito H. and Isagi Y. 1997. Trade-off between height growth and stem diameter growth
for an evergreen oak, Quercus glauca, in a mixed hardwood forest. Functional Ecology
11: 300-309.
Tomlinson K.W., Sterck F.J., Bongers F., da Silva D.A., Barbosa E.R.M., Ward D., Bakker F.T.,
van Kaauwen M., Prins H.H.T., de Bie S. and van Langevelde F. 2012. Biomass
partitioning and root morphology of savanna trees across a water gradient. Journal of
Ecology 100: 1113-1121.
Trollope W.S.W. 1980. Controlling bush encroachment with fire in the savanna areas of South
Africa. Proceedings of the Annual Congresses of the Grassland Society of Southern
Africa 15: 173-177.
van de Vijver C.A.D.M., Foley C.A. and Olff H. 1999. Changes in the woody component of an
East African savanna during 25 years. Journal of Tropical Ecology 15: 545-564.
van Langevelde F., Tomlinson K., Barbosa E.R.M., de Bie S., Prins H.H.T. and Higgins S.I.
2011. Understanding tree-grass coexistence and impacts of disturbance and resource
variability in savannas. In: M.J. Hill and N.P. Hanan (eds), Ecosystem function in
savannas: measurement and modelling at landscape to global scales. CRC Press, Boca
Raton, Florida, USA, pp. 257–271.

183
van Langevelde F., van de Vijver C.A.D.M., Kumar L., van de Koppel J., de Ridder N., van
Andel J., Skidmore A.K., Hearne J.W., Stroosnijder L., Bond W.J., Prins H.H.T. and
Rietkerk M. 2003. Effects of fire and herbivory on the stability of savanna ecosystems.
Ecology 84: 337-350.
Walker B.H., Ludwig D., Holling C.S. and Peterman R.M. 1981. Stability of semi-arid savanna
grazing systems. Journal of Ecology 69: 473-498.
Walter H. 1939. Grassland, savanne und busch der arideren teile Afrikas in ihrer ökologischen
bedingtheit. Jahrbücher für Wissenschaftliche Botanik 87: 750-860.
Ward D. 2005. Do we understand the causes of bush encroachment in African savannas? African
Journal of Range and Forage Science 22: 101-105.
Ward D. 2010. A resource ratio model of the effects of changes in CO2 on woody plant invasion.
Plant Ecology 209: 147-152.
Wiegand K., Saltz D. and Ward D. 2006. A patch-dynamics approach to savanna dynamics and
woody plant encroachment - insights from an arid savanna. Perspectives in Plant
Ecology, Evolution and Systematics 7: 229-242.
Wigley B.J, Cramer M.D. and Bond W.J. 2009. Sapling survival in a frequently burnt savanna:
mobilisation of carbon reserves in Acacia karroo. Plant Ecology 203: 1-11.
Zinn A.D., Ward D. and Kirkman K. 2007. Inducible defences in Acacia sieberiana in response
to giraffe browsing. African Journal of Range and Forage Science 24: 123-129.

184
Appendix I: Tables of biological results
Chapter 2: Fire and nutrient gradient effects on the sapling ecology of four Acacia species in the presence of grass competition
Table 1. Mean growth, with standard error (SE), of Acacia karroo saplings under the influence of various treatment combinations
after fire was applied. We measured ratio of final-initial relative growth rate of stem height (RGRh in mm mm-1
week-1
) to final-initial
relative growth rate in stem basal diameter (RGRd in mm mm-1
week-1
), ratio of final log10 transformed root dry biomass (in mg) to
shoot dry biomass (in mg), final log10 transformed leaf CT concentration (in mg mL-1
QE) and final power (-0.3) transformed mean
thorn length (in mm). Two levels of fire provided are indicated as „0‟ (control) and „1‟ (burning). Five levels of nutrients indicate the
concentration of fertiliser applied, 0 g (0); 13 g (0.5); 26 g (1); 52 g (2) and 104 g (4), per 0.16 m2. See Methods for further details
Treatment combination RGRh : RGRd Root : shoot biomass CT Conc Thorn length
Nutrients
Fire
Mean
SE
Mean
SE
Mean
SE
Mean
SE
0
0
-0.0130
0.1650
-0.2246
0.1102
1.7240
0.0054
0.5159
0.0173
0.5
0
0.0590
0.1030
-0.1399
0.0897
1.7470
0.0035
0.5214
0.0359
1
0
0.1350
0.0080
-0.2467
0.1109
1.7090
0.0101
0.5388
0.0396
2
0
0.0200
0.0520
0.1052
0.2367
1.7360
0.0026
0.5209
0.0165
4
0
0.2700
0.2370
-0.2575
0.1394
1.7090
0.0022
0.5098
0.0313
0
1
*
*
*
*
*
*
*
*
0.5
1
*
*
*
*
*
*
*
*
1
1
*
*
*
*
*
*
*
*
2
1
*
*
*
*
*
*
*
*
4 1 * * * * * * * *

185
Table 2. Mean growth, with standard error (SE), of Acacia nigrescens saplings under the influence of various treatment combinations
after fire was applied. We measured ratio of final-initial relative growth rate of stem height (RGRh in mm mm-1
week-1
) to final-initial
relative growth rate in stem basal diameter (RGRd in mm mm-1
week-1
), ratio of final log10 transformed root dry biomass (in mg) to
shoot dry biomass (in mg), final log10 transformed leaf CT concentration (in mg mL-1
QE) and final power (-0.3) transformed mean
thorn length (in mm). Two levels of fire provided are indicated as „0‟ (control) and „1‟ (burning). Five levels of nutrients indicate the
concentration of fertiliser applied, 0 g (0); 13 g (0.5); 26 g (1); 52 g (2) and 104 g (4), per 0.16 m2. See Methods for further details
Treatment combination RGRh : RGRd Root : shoot biomass CT Conc Thorn length
Nutrients
Fire
Mean
SE
Mean
SE
Mean
SE
Mean
SE
0
0
0.9100
0.7620
0.0923
0.1341
1.6820
0.0079
0.8295
0.0121
0.5
0
0.5620
0.2270
-0.0104
0.0399
1.6820
0.0101
0.7859
0.0254
1
0
1.6530
0.7950
-0.0402
0.0175
1.7010
0.0163
0.8323
0.0123
2
0
0.8080
0.6390
0.0550
0.0712
1.7150
0.0132
0.8158
0.0429
4
0
-7.5890
6.7210
-0.0651
0.0463
1.6970
0.0052
0.8365
0.0403
0
1
*
*
*
*
*
*
*
*
0.5
1
86.5130
*
0.0532
*
1.7360
*
0.8528
*
1
1
50.3850
*
0.1347
*
*
*
*
*
2
1
*
*
*
*
*
*
*
*
4 1 5.4750 * 0.0503 * 1.6860 * 0.9718 *

186
Table 3. Mean growth, with standard error (SE), of Acacia sieberiana saplings under the influence of various treatment combinations
after fire was applied. We measured ratio of final-initial relative growth rate of stem height (RGRh in mm mm-1
week-1
) to final-initial
relative growth rate in stem basal diameter (RGRd in mm mm-1
week-1
), ratio of final log10 transformed root dry biomass (in mg) to
shoot dry biomass (in mg), final log10 transformed leaf CT concentration (in mg mL-1
QE) and final power (-0.3) transformed mean
thorn length (in mm). Two levels of fire provided are indicated as „0‟ (control) and „1‟ (burning). Five levels of nutrients indicate the
concentration of fertiliser applied, 0 g (0); 13 g (0.5); 26 g (1); 52 g (2) and 104 g (4), per 0.16 m2. See Methods for further details
Treatment combination RGRh : RGRd Root : shoot biomass CT Conc Thorn length
Nutrients
Fire
Mean
SE
Mean
SE
Mean
SE
Mean
SE
0
0
0.6340
0.3130
0.6683
0.1971
1.4030
0.0779
0.5376
0.0272
0.5
0
-0.0850
0.8270
0.4393
0.0253
0.8450
0.2708
0.5076
0.0451
1
0
2.4650
1.4780
0.5114
0.1086
1.3960
0.1552
0.6576
0.1027
2
0
-5.8500
6.5330
0.4864
0.0420
1.2010
0.1690
0.5324
0.0945
4
0
11.2650
10.6920
0.2264
0.0535
1.4080
0.0262
0.4911
0.2374
0
1
2.5070
0.3540
0.4435
0.1160
1.4820
0.1726
0.6919
0.0392
0.5
1
1.6310
0.2500
0.4974
0.1015
1.0870
0.2383
0.6272
0.0554
1
1
2.4250
0.1920
0.4029
0.0069
1.5830
*
0.6391
0.0688
2
1
2.2170
0.4860
0.4080
0.0017
1.2220
0.2143
0.6702
0.0555
4 1 1.2820 0.1700 0.5319 0.0848 1.3130 0.0759 0.6725 0.0922

187
Table 4. Mean growth, with standard error (SE), of Acacia tortilis saplings under the influence of various treatment combinations
after fire was applied. We measured ratio of final-initial relative growth rate of stem height (RGRh in mm mm-1
week-1
) to final-initial
relative growth rate in stem basal diameter (RGRd in mm mm-1
week-1
), ratio of final log10 transformed root dry biomass (in mg) to
shoot dry biomass (in mg), final log10 transformed leaf CT concentration (in mg mL-1
QE) and final power (-0.3) transformed mean
thorn length (in mm). Two levels of fire provided are indicated as „0‟ (control) and „1‟ (burning). Five levels of nutrients indicate the
concentration of fertiliser applied, 0 g (0); 13 g (0.5); 26 g (1); 52 g (2) and 104 g (4), per 0.16 m2. See Methods for further details
Treatment combination RGRh : RGRd Root : shoot biomass CT Conc Thorn length
Nutrients
Fire
Mean
SE
Mean
SE
Mean
SE
Mean
SE
0
0
1.6430
0.5890
0.3645
0.0187
1.6900
0.0046
0.5698
0.0290
0.5
0
0.9130
0.2330
0.2451
*
1.7030
*
0.6200
0.0212
1
0
5.8750
4.6080
0.2029
0.0998
1.7240
0.0135
0.6042
0.0222
2
0
0.6810
0.1480
0.1092
0.0846
1.6700
0.0041
0.6700
0.0943
4
0
1.1250
0.1770
0.2396
0.0230
1.6680
0.0337
0.6587
0.0505
0
1
2.7770
1.3040
0.3517
0.0494
1.6500
*
0.6259
0.0467
0.5
1
*
*
*
*
*
*
*
*
1
1
*
*
*
*
*
*
*
*
2
1
*
*
*
*
*
*
*
*
4 1 1.5290 * 0.0641 * 1.7060 * 0.5771 *
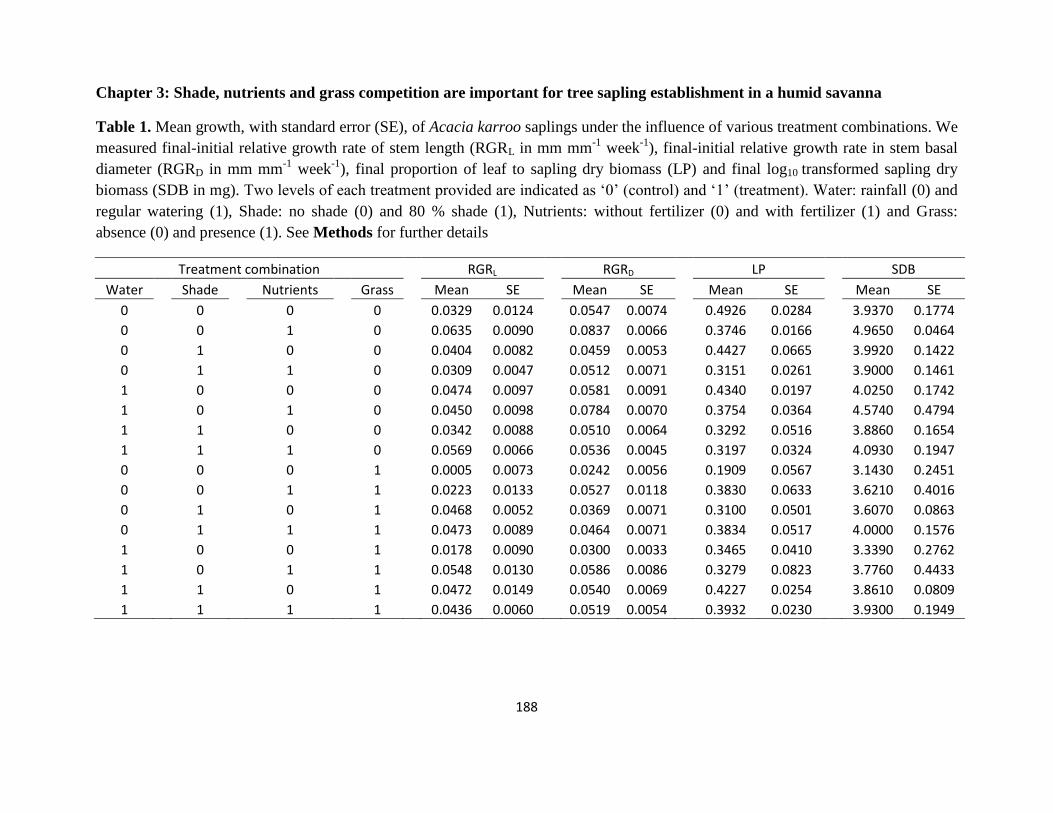
188
Chapter 3: Shade, nutrients and grass competition are important for tree sapling establishment in a humid savanna
Table 1. Mean growth, with standard error (SE), of Acacia karroo saplings under the influence of various treatment combinations. We
measured final-initial relative growth rate of stem length (RGRL in mm mm-1
week-1
), final-initial relative growth rate in stem basal
diameter (RGRD in mm mm-1
week-1
), final proportion of leaf to sapling dry biomass (LP) and final log10 transformed sapling dry
biomass (SDB in mg). Two levels of each treatment provided are indicated as „0‟ (control) and „1‟ (treatment). Water: rainfall (0) and
regular watering (1), Shade: no shade (0) and 80 % shade (1), Nutrients: without fertilizer (0) and with fertilizer (1) and Grass:
absence (0) and presence (1). See Methods for further details
Treatment combination RGRL RGRD LP SDB
Water
Shade
Nutrients
Grass
Mean SE
Mean SE
Mean SE
Mean SE
0
0
0
0
0.0329 0.0124
0.0547 0.0074
0.4926 0.0284
3.9370 0.1774
0
0
1
0
0.0635 0.0090
0.0837 0.0066
0.3746 0.0166
4.9650 0.0464
0
1
0
0
0.0404 0.0082
0.0459 0.0053
0.4427 0.0665
3.9920 0.1422
0
1
1
0
0.0309 0.0047
0.0512 0.0071
0.3151 0.0261
3.9000 0.1461
1
0
0
0
0.0474 0.0097
0.0581 0.0091
0.4340 0.0197
4.0250 0.1742
1
0
1
0
0.0450 0.0098
0.0784 0.0070
0.3754 0.0364
4.5740 0.4794
1
1
0
0
0.0342 0.0088
0.0510 0.0064
0.3292 0.0516
3.8860 0.1654
1
1
1
0
0.0569 0.0066
0.0536 0.0045
0.3197 0.0324
4.0930 0.1947
0
0
0
1
0.0005 0.0073
0.0242 0.0056
0.1909 0.0567
3.1430 0.2451
0
0
1
1
0.0223 0.0133
0.0527 0.0118
0.3830 0.0633
3.6210 0.4016
0
1
0
1
0.0468 0.0052
0.0369 0.0071
0.3100 0.0501
3.6070 0.0863
0
1
1
1
0.0473 0.0089
0.0464 0.0071
0.3834 0.0517
4.0000 0.1576
1
0
0
1
0.0178 0.0090
0.0300 0.0033
0.3465 0.0410
3.3390 0.2762
1
0
1
1
0.0548 0.0130
0.0586 0.0086
0.3279 0.0823
3.7760 0.4433
1
1
0
1
0.0472 0.0149
0.0540 0.0069
0.4227 0.0254
3.8610 0.0809
1 1 1 1 0.0436 0.0060 0.0519 0.0054 0.3932 0.0230 3.9300 0.1949

189
Table 2. Mean growth, with standard error (SE), of Acacia sieberiana saplings under the influence of various treatment combinations.
We measured final-initial relative growth rate of stem length (RGRL in mm mm-1
week-1
), final-initial relative growth rate in stem
basal diameter (RGRD in mm mm-1
week-1
), final proportion of leaf to sapling dry biomass (LP) and final log10 transformed sapling
dry biomass (SDB in mg). Two levels of each treatment provided are indicated as „0‟ (control) and „1‟ (treatment). Water: rainfall (0)
and regular watering (1), Shade: no shade (0) and 80 % shade (1), Nutrients: without fertilizer (0) and with fertilizer (1) and Grass:
absence (0) and presence (1). See Methods for further details
Treatment combination RGRL RGRD LP SDB
Water
Shade
Nutrients
Grass
Mean SE
Mean SE
Mean SE
Mean SE
0
0
0
0
0.0143 0.0134
0.0327 0.0085
0.5921 0.0332
3.5840 0.1576
0
0
1
0
0.0403 0.0138
0.0595 0.0095
0.4890 0.0392
4.0450 0.3282
0
1
0
0
0.0161 0.0075
0.0275 0.0061
0.4546 0.0367
3.5160 0.0899
0
1
1
0
0.0205 0.0107
0.0345 0.0032
0.3870 0.0679
3.6250 0.0898
1
0
0
0
0.0344 0.0059
0.0543 0.0077
0.4236 0.0418
4.3110 0.1322
1
0
1
0
0.0585 0.0077
0.0939 0.0089
0.3722 0.0155
5.0080 0.1374
1
1
0
0
0.0282 0.0082
0.0291 0.0101
0.4703 0.0597
3.5290 0.1595
1
1
1
0
0.0256 0.0066
0.0376 0.0055
0.4719 0.0785
3.8540 0.2239
0
0
0
1
0.0135 0.0057
0.0294 0.0058
0.4958 0.0476
3.3300 0.1809
0
0
1
1
0.0143 0.0034
0.0239 0.0109
0.3289 0.0413
2.9780 0.3006
0
1
0
1
0.0139 0.0113
0.0320 0.0071
0.3581 0.0531
3.1030 0.2911
0
1
1
1
0.0261 0.0079
0.0364 0.0061
0.3758 0.0617
3.7570 0.1796
1
0
0
1
0.0140 0.0106
0.0272 0.0085
0.2929 0.0803
3.2200 0.3558
1
0
1
1
0.0483 0.0147
0.0623 0.0154
0.2755 0.0706
3.7420 0.3779
1
1
0
1
0.0323 0.0119
0.0378 0.0076
0.4600 0.0716
3.1710 0.1221
1 1 1 1 0.0186 0.0095 0.0309 0.0057 0.3783 0.0417 3.6120 0.1129
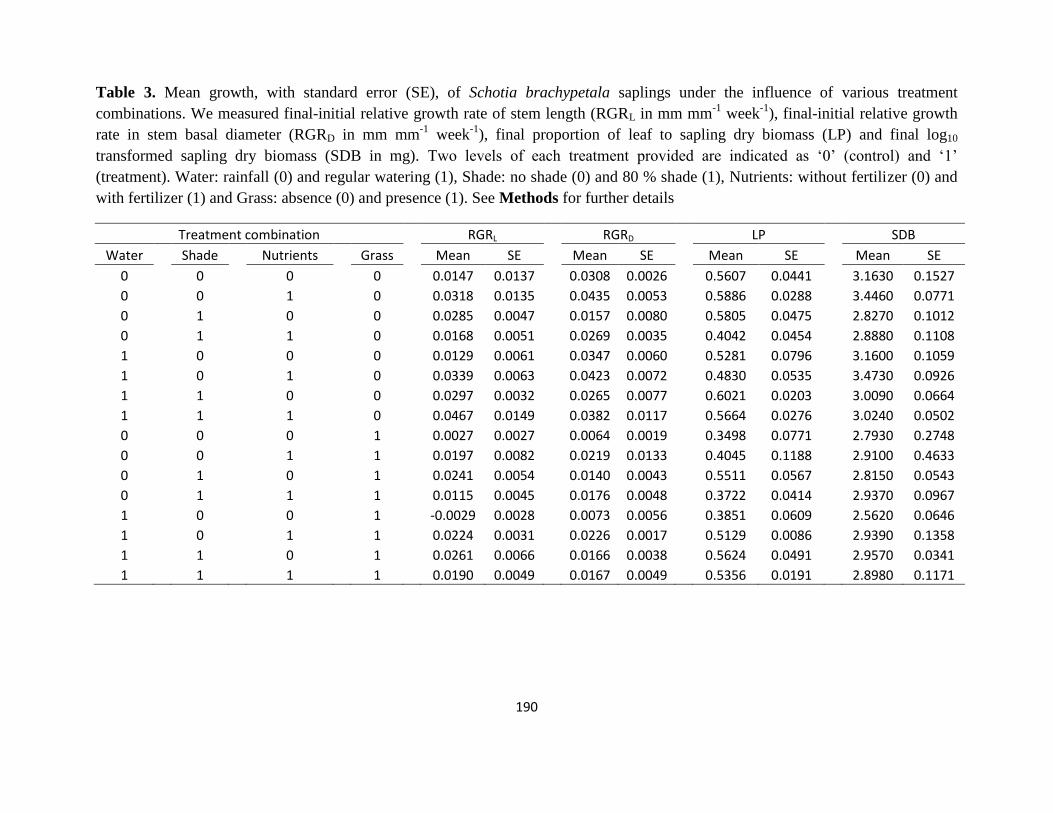
190
Table 3. Mean growth, with standard error (SE), of Schotia brachypetala saplings under the influence of various treatment
combinations. We measured final-initial relative growth rate of stem length (RGRL in mm mm-1
week-1
), final-initial relative growth
rate in stem basal diameter (RGRD in mm mm-1
week-1
), final proportion of leaf to sapling dry biomass (LP) and final log10
transformed sapling dry biomass (SDB in mg). Two levels of each treatment provided are indicated as „0‟ (control) and „1‟
(treatment). Water: rainfall (0) and regular watering (1), Shade: no shade (0) and 80 % shade (1), Nutrients: without fertilizer (0) and
with fertilizer (1) and Grass: absence (0) and presence (1). See Methods for further details
Treatment combination RGRL RGRD LP SDB
Water
Shade
Nutrients
Grass
Mean SE
Mean SE
Mean SE
Mean SE
0
0
0
0
0.0147 0.0137
0.0308 0.0026
0.5607 0.0441
3.1630 0.1527
0
0
1
0
0.0318 0.0135
0.0435 0.0053
0.5886 0.0288
3.4460 0.0771
0
1
0
0
0.0285 0.0047
0.0157 0.0080
0.5805 0.0475
2.8270 0.1012
0
1
1
0
0.0168 0.0051
0.0269 0.0035
0.4042 0.0454
2.8880 0.1108
1
0
0
0
0.0129 0.0061
0.0347 0.0060
0.5281 0.0796
3.1600 0.1059
1
0
1
0
0.0339 0.0063
0.0423 0.0072
0.4830 0.0535
3.4730 0.0926
1
1
0
0
0.0297 0.0032
0.0265 0.0077
0.6021 0.0203
3.0090 0.0664
1
1
1
0
0.0467 0.0149
0.0382 0.0117
0.5664 0.0276
3.0240 0.0502
0
0
0
1
0.0027 0.0027
0.0064 0.0019
0.3498 0.0771
2.7930 0.2748
0
0
1
1
0.0197 0.0082
0.0219 0.0133
0.4045 0.1188
2.9100 0.4633
0
1
0
1
0.0241 0.0054
0.0140 0.0043
0.5511 0.0567
2.8150 0.0543
0
1
1
1
0.0115 0.0045
0.0176 0.0048
0.3722 0.0414
2.9370 0.0967
1
0
0
1
-0.0029 0.0028
0.0073 0.0056
0.3851 0.0609
2.5620 0.0646
1
0
1
1
0.0224 0.0031
0.0226 0.0017
0.5129 0.0086
2.9390 0.1358
1
1
0
1
0.0261 0.0066
0.0166 0.0038
0.5624 0.0491
2.9570 0.0341
1 1 1 1 0.0190 0.0049 0.0167 0.0049 0.5356 0.0191 2.8980 0.1171

191
Table 4. Mean growth, with standard error (SE), of Strychnos spinosa saplings under the influence of various treatment combinations.
We measured final-initial relative growth rate of stem length (RGRL in mm mm-1
week-1
), final-initial relative growth rate in stem
basal diameter (RGRD in mm mm-1
week-1
), final proportion of leaf to sapling dry biomass (LP) and final log10 transformed sapling
dry biomass (SDB in mg). Two levels of each treatment provided are indicated as „0‟ (control) and „1‟ (treatment). Water: rainfall (0)
and regular watering (1), Shade: no shade (0) and 80 % shade (1), Nutrients: without fertilizer (0) and with fertilizer (1) and Grass:
absence (0) and presence (1). See Methods for further details
Treatment combination RGRL RGRD LP SDB
Water
Shade
Nutrients
Grass
Mean SE
Mean SE
Mean SE
Mean SE
0
0
0
0
-0.0153 0.0144
0.0149 0.0074
0.4804 0.0765
2.8280 0.2297
0
0
1
0
-0.0174 0.0148
0.0077 0.0039
0.4012 0.0367
2.6750 0.1325
0
1
0
0
0.0099 0.0133
0.0284 0.0083
0.3934 0.1163
2.5540 0.0923
0
1
1
0
-0.0264 0.0146
0.0315 0.0195
0.2933 0.0799
2.4930 0.2490
1
0
0
0
-0.0119 0.0113
0.0284 0.0078
0.3863 0.0818
2.7810 0.1746
1
0
1
0
0.0214 0.0054
0.0314 0.0030
0.5535 0.0098
3.0780 0.1624
1
1
0
0
-0.0069 0.0152
0.0171 0.0075
0.4726 0.0979
2.6120 0.0860
1
1
1
0
0.0143 0.0053
0.0233 0.0055
0.4821 0.0675
2.9810 0.1278
0
0
0
1
-0.0417 0.0113
0.0019 0.0087
0.2683 0.1020
2.2670 0.1681
0
0
1
1
-0.0118 0.0070
0.0024 0.0026
0.4306 0.0294
2.4000 0.1010
0
1
0
1
-0.0112 0.0076
0.0227 0.0155
0.4030 0.0765
2.5790 0.0726
0
1
1
1
-0.0163 0.0126
0.0181 0.0165
0.3732 0.1118
2.4890 0.1266
1
0
0
1
-0.0145 0.0053
0.0140 0.0066
0.4400 0.0345
2.5890 0.1991
1
0
1
1
0.0144 0.0050
0.0103 0.0108
0.4959 0.0548
2.5860 0.0914
1
1
0
1
0.0006 0.0105
0.0166 0.0041
0.4376 0.0701
2.4560 0.1827
1 1 1 1 0.0021 0.0128 0.0132 0.0072 0.4524 0.1026 2.6740 0.1128

192
Table 5. Mean growth, with standard error (SE), of Acacia nigrescens saplings under the influence of various treatment combinations.
We measured final-initial relative growth rate of stem length (RGRL in mm mm-1
week-1
), final-initial relative growth rate in stem
basal diameter (RGRD in mm mm-1
week-1
), final proportion of leaf to sapling dry biomass (LP) and final log10 transformed sapling
dry biomass (SDB in mg). Two levels of each treatment provided are indicated as „0‟ (control) and „1‟ (treatment). Water: rainfall (0)
and regular watering (1), Shade: no shade (0) and 80 % shade (1), Nutrients: without fertilizer (0) and with fertilizer (1) and Grass:
absence (0) and presence (1). See Methods for further details
Treatment combination RGRL RGRD LP SDB
Water
Shade
Nutrients
Grass
Mean SE
Mean SE
Mean SE
Mean SE
0
0
0
0
0.0120 0.0050
0.0357 0.0023
0.1592 0.0787
3.8100 0.1656
0
0
1
0
0.0245 0.0013
0.0625 0.0095
0.2983 0.0231
4.0530 0.6521
0
1
0
0
0.0121 0.0106
0.0373 0.0095
0.3871 0.0122
3.3080 0.0973
0
1
1
0
0.0121 0.0081
0.0386 0.0046
0.2492 0.0748
3.5300 0.1058
1
0
0
0
0.0004 0.0045
0.0436 0.0160
0.2430 0.0350
3.1110 0.4628
1
0
1
0
0.0344 0.0108
0.0615 0.0016
0.3261 0.0235
4.1300 0.2241
1
1
0
0
0.0220 0.0116
0.0493 0.0091
0.3701 0.0276
3.4590 0.2068
1
1
1
0
0.0214 0.0073
0.0486 0.0034
0.3992 0.0282
3.7180 0.1610
0
0
0
1
-0.0225 *
0.0074 *
0.0000 *
2.2790 *
0
0
1
1
* *
* *
* *
* *
0
1
0
1
0.0093 0.0067
0.0353 0.0084
0.3299 0.0344
3.3540 0.1806
0
1
1
1
0.0340 0.0119
0.0378 0.0031
0.2434 0.0349
3.3780 0.1523
1
0
0
1
0.0063 0.0137
0.0137 0.0120
0.1865 0.0924
2.2910 0.1151
1
0
1
1
0.0250 0.0109
0.0332 0.0054
0.3246 0.0600
2.8290 0.2772
1
1
0
1
0.0188 0.0026
0.0334 0.0094
0.3814 0.0413
3.1160 0.1475
1 1 1 1 0.0264 0.0141 0.0458 0.0088 0.3214 0.0487 3.4000 0.2769

193
Table 6. Mean growth, with standard error (SE), of Acacia tortilis saplings under the influence of various treatment combinations. We
measured final-initial relative growth rate of stem length (RGRL in mm mm-1
week-1
), final-initial relative growth rate in stem basal
diameter (RGRD in mm mm-1
week-1
), final proportion of leaf to sapling dry biomass (LP) and final log10 transformed sapling dry
biomass (SDB in mg). Two levels of each treatment provided are indicated as „0‟ (control) and „1‟ (treatment). Water: rainfall (0) and
regular watering (1), Shade: no shade (0) and 80 % shade (1), Nutrients: without fertilizer (0) and with fertilizer (1) and Grass:
absence (0) and presence (1). See Methods for further details
Treatment combination RGRL RGRD LP SDB
Water
Shade
Nutrients
Grass
Mean SE
Mean SE
Mean SE
Mean SE
0
0
0
0
0.0379 0.0262
0.0432 0.0153
0.4825 0.0291
2.9490 0.4159
0
0
1
0
0.0667 0.0154
0.0641 0.0080
0.4242 0.0286
4.1200 0.4949
0
1
0
0
0.0163 0.0106
0.0197 0.0057
0.3086 0.0474
2.5260 0.1942
0
1
1
0
0.0071 0.0146
0.0117 0.0123
0.2759 0.0550
2.6780 0.3320
1
0
0
0
0.0220 0.0084
0.0528 0.0053
0.3962 0.0447
3.5040 0.2401
1
0
1
0
0.0616 0.0070
0.0748 0.0094
0.3723 0.0297
4.0790 0.2618
1
1
0
0
0.0287 0.0081
0.0167 0.0124
0.3891 0.0800
2.4750 0.3292
1
1
1
0
0.0150 0.0068
0.0284 0.0080
0.3081 0.0674
2.7490 0.1366
0
0
0
1
-0.0039 0.0064
0.0106 0.0092
0.2133 0.0656
2.0760 0.1906
0
0
1
1
0.0183 0.0138
0.0089 0.0152
0.2612 0.0824
2.4500 0.1864
0
1
0
1
0.0121 0.0091
-0.0016 0.0088
0.1236 0.0398
2.1200 0.1490
0
1
1
1
0.0019 0.0089
0.0197 0.0054
0.3165 0.0816
2.3700 0.2131
1
0
0
1
0.0005 0.0051
-0.0024 0.0127
0.2014 0.0641
2.2640 0.0926
1
0
1
1
0.0474 0.0158
0.0372 0.0049
0.2177 0.0266
2.9440 0.2244
1
1
0
1
0.0263 0.0084
0.0195 0.0056
0.3731 0.0482
2.5890 0.1083
1 1 1 1 0.0312 0.0110 0.0214 0.0095 0.2845 0.0703 2.5970 0.1021

194
Table 7. Mean growth, with standard error (SE), of Colophospermum mopane saplings under the influence of various treatment
combinations. We measured final-initial relative growth rate of stem length (RGRL in mm mm-1
week-1
), final-initial relative growth
rate in stem basal diameter (RGRD in mm mm-1
week-1
), final proportion of leaf to sapling dry biomass (LP) and final log10
transformed sapling dry biomass (SDB in mg). Two levels of each treatment provided are indicated as „0‟ (control) and „1‟
(treatment). Water: rainfall (0) and regular watering (1), Shade: no shade (0) and 80 % shade (1), Nutrients: without fertilizer (0) and
with fertilizer (1) and Grass: absence (0) and presence (1). See Methods for further details
Treatment combination RGRL RGRD LP SDB
Water
Shade
Nutrients
Grass
Mean SE
Mean SE
Mean SE
Mean SE
0
0
0
0
0.0137 0.0068
0.0329 0.0040
0.6749 0.0325
3.2800 0.1252
0
0
1
0
0.0285 0.0112
0.0518 0.0069
0.6912 0.0486
3.6200 0.1806
0
1
0
0
0.0034 0.0153
0.0132 0.0087
0.4995 0.0322
2.9040 0.1401
0
1
1
0
0.0168 0.0055
0.0237 0.0035
0.4513 0.0477
3.0730 0.1084
1
0
0
0
0.0212 0.0092
0.0456 0.0072
0.6249 0.0287
3.3400 0.1653
1
0
1
0
0.0348 0.0089
0.0490 0.0073
0.5951 0.0247
3.6800 0.0307
1
1
0
0
0.0137 0.0077
0.0328 0.0105
0.5614 0.0271
3.0980 0.0926
1
1
1
0
0.0011 0.0075
0.0203 0.0065
0.5319 0.0372
3.0330 0.0318
0
0
0
1
-0.0054 0.0040
0.0133 0.0060
0.5408 0.0734
2.8760 0.1442
0
0
1
1
0.0463 0.0152
0.0216 0.0193
0.4373 0.0454
3.2790 0.2063
0
1
0
1
0.0033 0.0059
0.0262 0.0037
0.4927 0.0735
3.0190 0.1051
0
1
1
1
0.0133 0.0043
0.0278 0.0042
0.4208 0.0403
2.9060 0.1125
1
0
0
1
-0.0039 0.0016
0.0159 0.0057
0.5930 0.0119
3.0330 0.0696
1
0
1
1
0.0144 0.0053
0.0301 0.0059
0.5777 0.0251
3.2320 0.1802
1
1
0
1
0.0075 0.0073
0.0152 0.0056
0.5197 0.0467
2.8460 0.1244
1 1 1 1 0.0209 0.0058 0.0256 0.0065 0.5064 0.0337 2.9690 0.0677

195
Table 8. Mean growth, with standard error (SE), of Combretum apiculatum saplings under the influence of various treatment
combinations. We measured final-initial relative growth rate of stem length (RGRL in mm mm-1
week-1
), final-initial relative growth
rate in stem basal diameter (RGRD in mm mm-1
week-1
), final proportion of leaf to sapling dry biomass (LP) and final log10
transformed sapling dry biomass (SDB in mg). Two levels of each treatment provided are indicated as „0‟ (control) and „1‟
(treatment). Water: rainfall (0) and regular watering (1), Shade: no shade (0) and 80 % shade (1), Nutrients: without fertilizer (0) and
with fertilizer (1) and Grass: absence (0) and presence (1). See Methods for further details
Treatment combination RGRL RGRD LP SDB
Water
Shade
Nutrients
Grass
Mean SE
Mean SE
Mean SE
Mean SE
0
0
0
0
0.0105 0.0088
0.0387 0.0102
0.6106 0.0376
3.5170 0.1661
0
0
1
0
0.0365 0.0095
0.0686 0.0117
0.5270 0.0215
4.1580 0.1019
0
1
0
0
0.0077 0.0120
0.0268 0.0040
0.5443 0.0305
3.2400 0.0840
0
1
1
0
0.0211 0.0080
0.0340 0.0027
0.4630 0.0669
3.4440 0.2291
1
0
0
0
0.0151 0.0102
0.0598 0.0044
0.5530 0.0252
3.7810 0.1875
1
0
1
0
0.0232 0.0075
0.0668 0.0065
0.5205 0.0322
4.1960 0.1492
1
1
0
0
0.0287 0.0077
0.0401 0.0040
0.5096 0.0348
3.2820 0.1390
1
1
1
0
0.0182 0.0099
0.0311 0.0073
0.3636 0.0573
3.4880 0.1468
0
0
0
1
-0.0027 0.0032
0.0110 0.0094
0.4413 0.0979
2.7950 0.2138
0
0
1
1
0.0384 0.0195
0.0260 0.0152
0.5072 0.0491
3.3090 0.1322
0
1
0
1
0.0271 0.0068
0.0333 0.0037
0.5285 0.0343
3.2410 0.0929
0
1
1
1
0.0114 0.0058
0.0314 0.0054
0.4815 0.0449
3.2340 0.1390
1
0
0
1
-0.0026 0.0074
0.0140 0.0051
0.4874 0.0848
2.6860 0.1513
1
0
1
1
0.0183 0.0059
0.0541 0.0145
0.5179 0.0255
3.6980 0.1961
1
1
0
1
0.0280 0.0136
0.0269 0.0105
0.5117 0.0471
3.1130 0.1400
1 1 1 1 0.0177 0.0073 0.0324 0.0092 0.4880 0.0652 3.3360 0.1412

196
Chapter 4: Herbivory effects on saplings are influenced by nutrients and grass competition in a humid South African savanna
Table 1. Mean growth, with standard error (SE), of Acacia karroo saplings under the influence of various treatment combinations,
after clipping. We measured final-initial relative growth rate of stem length (RGRL in mm mm-1
week-1
), final-initial relative growth
rate in stem basal diameter (RGRD in mm mm-1
week-1
) after clipping in April 2010. The final proportion of leaf to sapling dry
biomass (LP) and final log10 transformed sapling dry biomass (SDB in mg) at the end of the experiment were measured. Two levels of
each treatment provided are indicated as „0‟ (control) and „1‟ (treatment). Water: rainfall (0) and regular watering (1), Shade: no shade
(0) and 80 % shade (1), Nutrients: without fertilizer (0) and with fertilizer (1) and Grass: absence (0) and presence (1). See Methods
for further details
Treatment combination RGRL RGRD LP SDB
Clipping
Nutrients
Grass
Mean SE
Mean SE
Mean SE
Mean SE
0
0
0
0.0043 0.0038
0.0339 0.0028
0.4340 0.0197
4.0250 0.1742
0
1
0
0.0097 0.0086
0.0308 0.0045
0.3754 0.0364
4.5740 0.4794
1
0
0
0.1736 0.0126
0.0122 0.0013
0.3054 0.0543
3.1690 0.0809
1
1
0
0.1877 0.0125
0.0168 0.0028
0.3472 0.0576
3.7600 0.0882
0
0
1
0.0102 0.0060
0.0172 0.0036
0.3465 0.0410
3.3390 0.2762
0
1
1
-0.0034 0.0108
0.0253 0.0024
0.3279 0.0823
3.7760 0.4433
1
0
1
0.1277 0.0145
0.0110 0.0056
0.1951 0.0591
2.8080 0.1756
1 1 1 0.1714 0.0132 0.0071 0.0027 0.2756 0.0819 2.8730 0.1313

197
Table 2. Mean growth, with standard error (SE), of Acacia sieberiana saplings under the influence of various treatment combinations,
after clipping. We measured final-initial relative growth rate of stem length (RGRL in mm mm-1
week-1
), final-initial relative growth
rate in stem basal diameter (RGRD in mm mm-1
week-1
) after clipping in April 2010. The final proportion of leaf to sapling dry
biomass (LP) and final log10 transformed sapling dry biomass (SDB in mg) at the end of the experiment were measured. Two levels of
each treatment provided are indicated as „0‟ (control) and „1‟ (treatment). Water: rainfall (0) and regular watering (1), Shade: no shade
(0) and 80 % shade (1), Nutrients: without fertilizer (0) and with fertilizer (1) and Grass: absence (0) and presence (1). See Methods
for further details
Treatment combination RGRL RGRD LP SDB
Clipping
Nutrients
Grass
Mean SE
Mean SE
Mean SE
Mean SE
0
0
0
0.0023 0.0031
0.0341 0.0044
0.4236 0.0418
4.3110 0.1322
0
1
0
0.0046 0.0023
0.0406 0.0061
0.3722 0.0155
5.0080 0.1374
1
0
0
0.1912 0.0135
0.0117 0.0031
0.2634 0.0675
3.2690 0.1414
1
1
0
0.2311 0.0126
0.0127 0.0013
0.2865 0.0519
3.6130 0.1453
0
0
1
0.0081 0.0146
0.0185 0.0061
0.2929 0.0803
3.2200 0.3558
0
1
1
-0.0004 0.0062
0.0274 0.0073
0.2755 0.0706
3.7420 0.3779
1
0
1
0.1774 0.0158
0.0093 0.0054
0.2490 0.1032
2.9490 0.1877
1 1 1 0.1491 0.0140 0.0091 0.0035 0.2886 0.0773 2.7820 0.1640

198
Table 3. Mean growth, with standard error (SE), of Schotia brachypetala saplings under the influence of various treatment
combinations, after clipping. We measured final-initial relative growth rate of stem length (RGRL in mm mm-1
week-1
), final-initial
relative growth rate in stem basal diameter (RGRD in mm mm-1
week-1
) after clipping in April 2010. The final proportion of leaf to
sapling dry biomass (LP) and final log10 transformed sapling dry biomass (SDB in mg) at the end of the experiment were measured.
Two levels of each treatment provided are indicated as „0‟ (control) and „1‟ (treatment). Water: rainfall (0) and regular watering (1),
Shade: no shade (0) and 80 % shade (1), Nutrients: without fertilizer (0) and with fertilizer (1) and Grass: absence (0) and presence
(1). See Methods for further details
Treatment combination RGRL RGRD LP SDB
Clipping
Nutrients
Grass
Mean SE
Mean SE
Mean SE
Mean SE
0
0
0
0.0042 0.0047
0.0199 0.0041
0.5281 0.0796
3.1600 0.1059
0
1
0
0.0105 0.0048
0.0169 0.0026
0.4830 0.0535
3.4730 0.0926
1
0
0
0.1217 0.0095
0.0059 0.0043
0.3459 0.0808
2.7120 0.1370
1
1
0
0.1431 0.0075
0.0121 0.0029
0.3708 0.0862
2.8110 0.1077
0
0
1
0.0109 0.0140
-0.0061 0.0069
0.3851 0.0609
2.5620 0.0646
0
1
1
0.0007 0.0043
0.0077 0.0033
0.5129 0.0086
2.9390 0.1358
1
0
1
0.1089 0.0086
0.0070 0.0014
0.2551 0.0693
2.4450 0.0574
1 1 1 0.1144 0.0176 0.0063 0.0007 0.2205 0.0511 2.4710 0.1656

199
Table 4. Mean growth, with standard error (SE), of Strychnos spinosa saplings under the influence of various treatment combinations,
after clipping. We measured final-initial relative growth rate of stem length (RGRL in mm mm-1
week-1
), final-initial relative growth
rate in stem basal diameter (RGRD in mm mm-1
week-1
) after clipping in April 2010. The final proportion of leaf to sapling dry
biomass (LP) and final log10 transformed sapling dry biomass (SDB in mg) at the end of the experiment were measured. Two levels of
each treatment provided are indicated as „0‟ (control) and „1‟ (treatment). Water: rainfall (0) and regular watering (1), Shade: no shade
(0) and 80 % shade (1), Nutrients: without fertilizer (0) and with fertilizer (1) and Grass: absence (0) and presence (1). See Methods
for further details
Treatment combination RGRL RGRD LP SDB
Clipping
Nutrients
Grass
Mean SE
Mean SE
Mean SE
Mean SE
0
0
0
-0.0220 0.0141
0.0465 0.0155
0.3863 0.0818
2.7810 0.1746
0
1
0
0.0102 0.0043
0.0307 0.0083
0.5535 0.0098
3.0780 0.1624
1
0
0
0.1463 0.0089
0.0245 0.0070
0.3553 0.1040
2.5190 0.0818
1
1
0
0.1566 0.0157
0.0219 0.0027
0.3291 0.1076
2.6120 0.1253
0
0
1
-0.0099 0.0032
0.0396 0.0089
0.4400 0.0345
2.5890 0.1991
0
1
1
0.0018 0.0050
0.0302 0.0055
0.4959 0.0548
2.5860 0.0914
1
0
1
0.1605 0.0116
0.0258 0.0123
0.2622 0.0846
2.3140 0.0762
1 1 1 0.1097 0.0153 0.0250 0.0085 0.2613 0.0994 2.1990 0.1343

200
Table 5. Mean growth, with standard error (SE), of Acacia nigrescens saplings under the influence of various treatment combinations,
after clipping. We measured final-initial relative growth rate of stem length (RGRL in mm mm-1
week-1
), final-initial relative growth
rate in stem basal diameter (RGRD in mm mm-1
week-1
) after clipping in April 2010. The final proportion of leaf to sapling dry
biomass (LP) and final log10 transformed sapling dry biomass (SDB in mg) at the end of the experiment were measured. Two levels of
each treatment provided are indicated as „0‟ (control) and „1‟ (treatment). Water: rainfall (0) and regular watering (1), Shade: no shade
(0) and 80 % shade (1), Nutrients: without fertilizer (0) and with fertilizer (1) and Grass: absence (0) and presence (1). See Methods
for further details
Treatment combination RGRL RGRD LP SDB
Clipping
Nutrients
Grass
Mean SE
Mean SE
Mean SE
Mean SE
0
0
0
-0.0062 0.0042
0.0098 0.0035
0.2481 0.0276
3.0310 0.3672
0
1
0
0.0022 0.0026
0.0203 0.0067
0.3272 0.0183
3.8360 0.3418
1
0
0
0.1973 0.0119
0.0217 0.0094
0.3860 0.0502
3.2960 0.1882
1
1
0
0.2159 0.0088
0.0204 0.0032
0.3028 0.0450
3.4710 0.2121
0
0
1
0.0073 0.0099
0.0029 0.0086
0.2038 0.0737
2.2950 0.0893
0
1
1
-0.0021 0.0027
0.0091 0.0067
0.3246 0.0600
2.8290 0.2772
1
0
1
0.1841 0.0066
0.0176 0.0034
0.2717 0.0867
2.6480 0.0763
1 1 1 0.1846 0.0258 0.0114 0.0025 0.2665 0.0888 2.7610 0.1375
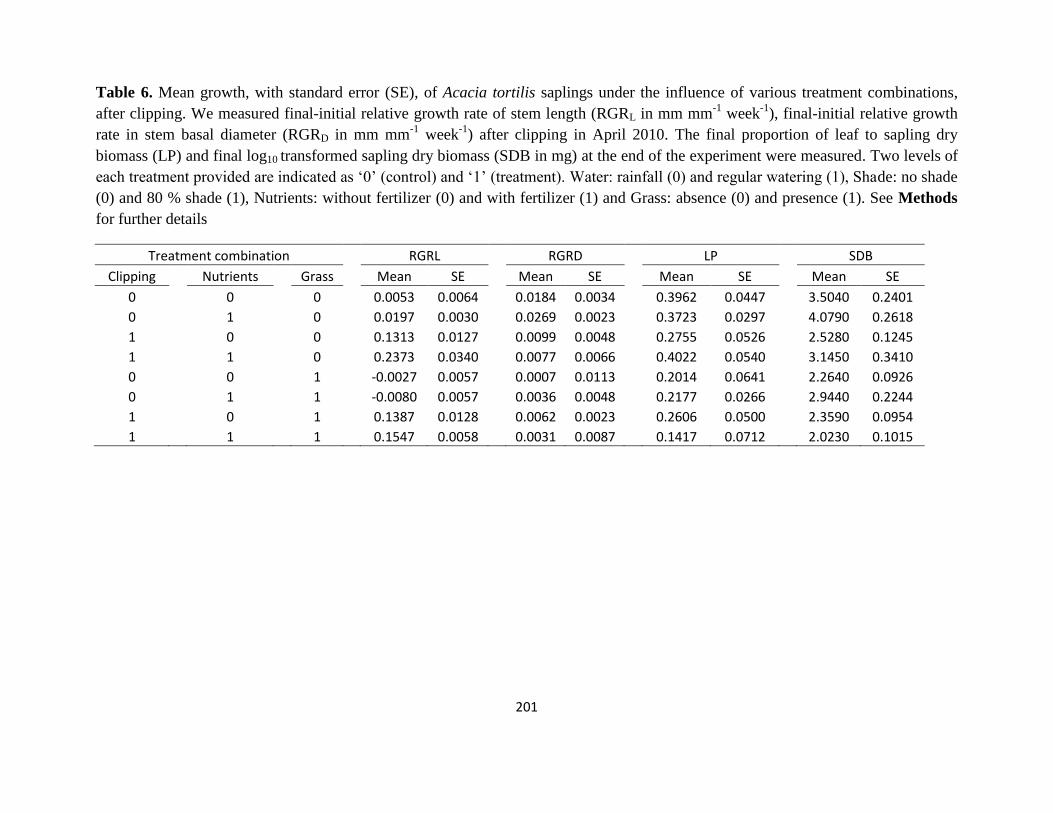
201
Table 6. Mean growth, with standard error (SE), of Acacia tortilis saplings under the influence of various treatment combinations,
after clipping. We measured final-initial relative growth rate of stem length (RGRL in mm mm-1
week-1
), final-initial relative growth
rate in stem basal diameter (RGRD in mm mm-1
week-1
) after clipping in April 2010. The final proportion of leaf to sapling dry
biomass (LP) and final log10 transformed sapling dry biomass (SDB in mg) at the end of the experiment were measured. Two levels of
each treatment provided are indicated as „0‟ (control) and „1‟ (treatment). Water: rainfall (0) and regular watering (1), Shade: no shade
(0) and 80 % shade (1), Nutrients: without fertilizer (0) and with fertilizer (1) and Grass: absence (0) and presence (1). See Methods
for further details
Treatment combination RGRL RGRD LP SDB
Clipping
Nutrients
Grass
Mean SE
Mean SE
Mean SE
Mean SE
0
0
0
0.0053 0.0064
0.0184 0.0034
0.3962 0.0447
3.5040 0.2401
0
1
0
0.0197 0.0030
0.0269 0.0023
0.3723 0.0297
4.0790 0.2618
1
0
0
0.1313 0.0127
0.0099 0.0048
0.2755 0.0526
2.5280 0.1245
1
1
0
0.2373 0.0340
0.0077 0.0066
0.4022 0.0540
3.1450 0.3410
0
0
1
-0.0027 0.0057
0.0007 0.0113
0.2014 0.0641
2.2640 0.0926
0
1
1
-0.0080 0.0057
0.0036 0.0048
0.2177 0.0266
2.9440 0.2244
1
0
1
0.1387 0.0128
0.0062 0.0023
0.2606 0.0500
2.3590 0.0954
1 1 1 0.1547 0.0058 0.0031 0.0087 0.1417 0.0712 2.0230 0.1015

202
Table 7. Mean growth, with standard error (SE), of Colophospermum mopane saplings under the influence of various treatment
combinations, after clipping. We measured final-initial relative growth rate of stem length (RGRL in mm mm-1
week-1
), final-initial
relative growth rate in stem basal diameter (RGRD in mm mm-1
week-1
) after clipping in April 2010. The final proportion of leaf to
sapling dry biomass (LP) and final log10 transformed sapling dry biomass (SDB in mg) at the end of the experiment were measured.
Two levels of each treatment provided are indicated as „0‟ (control) and „1‟ (treatment). Water: rainfall (0) and regular watering (1),
Shade: no shade (0) and 80 % shade (1), Nutrients: without fertilizer (0) and with fertilizer (1) and Grass: absence (0) and presence
(1). See Methods for further details
Treatment combination RGRL RGRD LP SDB
Clipping
Nutrients
Grass
Mean SE
Mean SE
Mean SE
Mean SE
0
0
0
0.0074 0.0053
0.0228 0.0050
0.6249 0.0287
3.3400 0.1653
0
1
0
0.0091 0.0018
0.0209 0.0028
0.5951 0.0247
3.6800 0.0307
1
0
0
0.1463 0.0084
0.0110 0.0045
0.4525 0.0657
2.8340 0.1173
1
1
0
0.2015 0.0079
0.0130 0.0005
0.4391 0.1058
2.8250 0.1063
0
0
1
-0.0049 0.0024
0.0034 0.0056
0.5930 0.0119
3.0330 0.0696
0
1
1
0.0007 0.0040
0.0080 0.0022
0.5777 0.0251
3.2320 0.1802
1
0
1
0.1264 0.0072
0.0167 0.0031
0.3919 0.1002
2.6090 0.1329
1 1 1 0.1434 0.0098 0.0010 0.0020 0.3859 0.0935 2.6540 0.1049
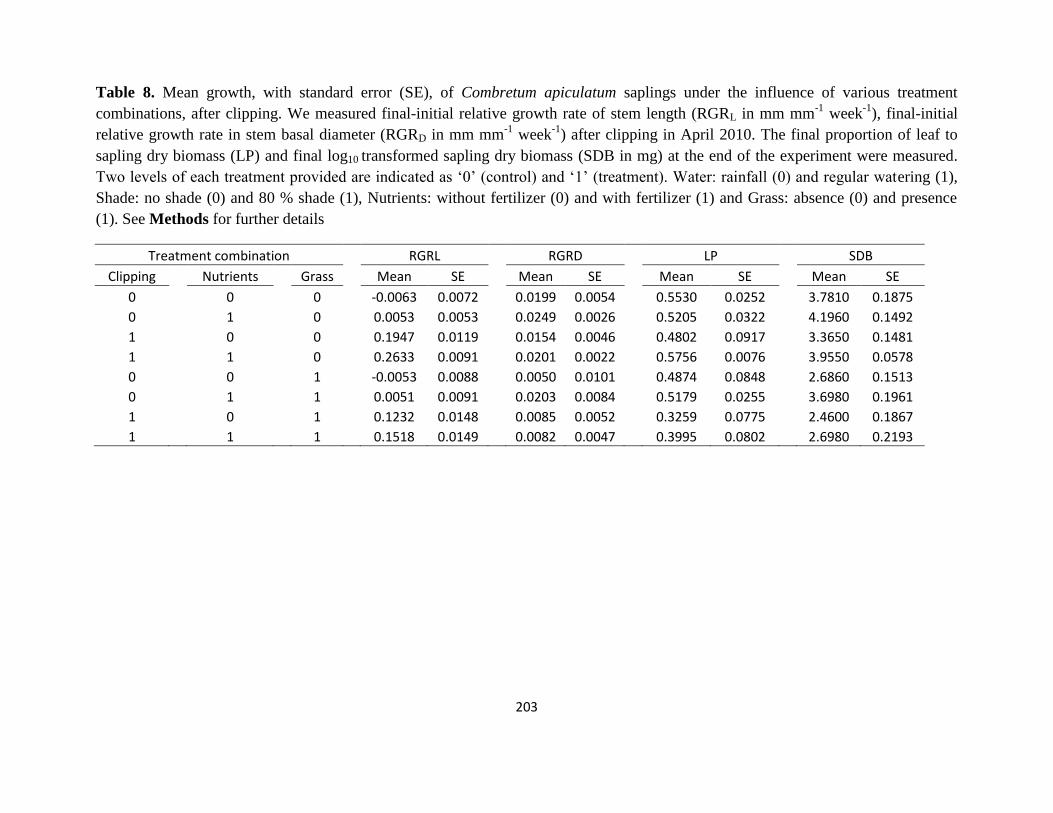
203
Table 8. Mean growth, with standard error (SE), of Combretum apiculatum saplings under the influence of various treatment
combinations, after clipping. We measured final-initial relative growth rate of stem length (RGRL in mm mm-1
week-1
), final-initial
relative growth rate in stem basal diameter (RGRD in mm mm-1
week-1
) after clipping in April 2010. The final proportion of leaf to
sapling dry biomass (LP) and final log10 transformed sapling dry biomass (SDB in mg) at the end of the experiment were measured.
Two levels of each treatment provided are indicated as „0‟ (control) and „1‟ (treatment). Water: rainfall (0) and regular watering (1),
Shade: no shade (0) and 80 % shade (1), Nutrients: without fertilizer (0) and with fertilizer (1) and Grass: absence (0) and presence
(1). See Methods for further details
Treatment combination RGRL RGRD LP SDB
Clipping
Nutrients
Grass
Mean SE
Mean SE
Mean SE
Mean SE
0
0
0
-0.0063 0.0072
0.0199 0.0054
0.5530 0.0252
3.7810 0.1875
0
1
0
0.0053 0.0053
0.0249 0.0026
0.5205 0.0322
4.1960 0.1492
1
0
0
0.1947 0.0119
0.0154 0.0046
0.4802 0.0917
3.3650 0.1481
1
1
0
0.2633 0.0091
0.0201 0.0022
0.5756 0.0076
3.9550 0.0578
0
0
1
-0.0053 0.0088
0.0050 0.0101
0.4874 0.0848
2.6860 0.1513
0
1
1
0.0051 0.0091
0.0203 0.0084
0.5179 0.0255
3.6980 0.1961
1
0
1
0.1232 0.0148
0.0085 0.0052
0.3259 0.0775
2.4600 0.1867
1 1 1 0.1518 0.0149 0.0082 0.0047 0.3995 0.0802 2.6980 0.2193

204
Appendix II: Tables of correlation matrices
Chapter 2: Fire and nutrient gradient effects on the sapling ecology of four Acacia species
in the presence of grass competition
Species-wise correlation matrix for study variables – values provided in bold are
significant (p < 0.05)
Acacia karroo
RGRh RGRd Root
biomass Shoot
biomass CT conc.
RGRh 1.0000 RGRd 0.4817 1.0000
Root biomass 0.4995 0.5435 1.0000 Shoot biomass 0.5745 0.6317 0.9084 1.0000
CT conc. -0.2138 -0.0294 0.2392 0.0434 1.0000
Thorn length -0.3399 -0.4769 -0.7428 -0.8688 -0.1583
Acacia sieberiana
RGRh RGRd Root
biomass Shoot
biomass CT conc.
RGRh 1.0000 RGRd 0.8122 1.0000
Root biomass -0.2756 0.0809 1.0000 Shoot biomass -0.2764 0.0983 0.9503 1.0000
CT conc. 0.1999 0.1037 -0.0232 -0.0368 1.0000
Thorn length 0.1504 -0.2064 -0.8618 -0.9094 0.0887
Acacia nigrescens
RGRh RGRd Root
biomass Shoot
biomass CT conc.
RGRh 1.0000 RGRd 0.1358 1.0000
Root biomass -0.1297 0.5269 1.0000 Shoot biomass -0.1363 0.5457 0.9103 1.0000
CT conc. 0.0489 -0.4275 -0.0373 -0.0594 1.0000
Thorn length 0.2794 -0.4934 -0.8955 -0.865 -0.1049
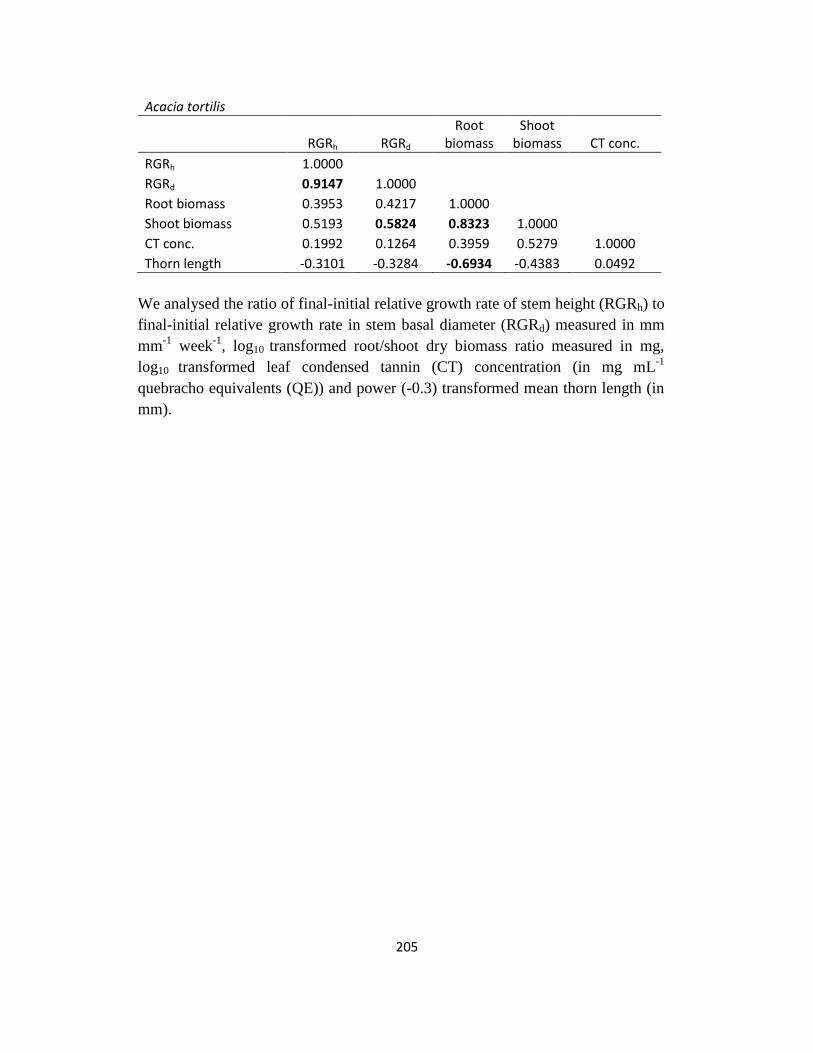
205
Acacia tortilis
RGRh RGRd Root
biomass Shoot
biomass CT conc.
RGRh 1.0000 RGRd 0.9147 1.0000
Root biomass 0.3953 0.4217 1.0000 Shoot biomass 0.5193 0.5824 0.8323 1.0000
CT conc. 0.1992 0.1264 0.3959 0.5279 1.0000
Thorn length -0.3101 -0.3284 -0.6934 -0.4383 0.0492
We analysed the ratio of final-initial relative growth rate of stem height (RGRh) to
final-initial relative growth rate in stem basal diameter (RGRd) measured in mm
mm-1
week-1
, log10 transformed root/shoot dry biomass ratio measured in mg,
log10 transformed leaf condensed tannin (CT) concentration (in mg mL-1
quebracho equivalents (QE)) and power (-0.3) transformed mean thorn length (in
mm).

206
Chapter 3: Shade, nutrients and grass competition are important for tree sapling
establishment in a humid savanna
Species-wise correlation matrix for study variables – values provided in bold are
significant (p < 0.05)
Acacia karroo
Acacia nigrescens
RGRL RGRD LP
RGRL RGRD LP
RGRL 1.0000
RGRL 1.0000
RGRD 0.6031 1.0000
RGRD 0.5493 1.0000
LP 0.3172 0.2314 1.0000
LP 0.4336 0.3626 1.0000
SDB 0.6185 0.7852 0.3471
SDB 0.3628 0.7876 0.3055
Acacia sieberiana
Acacia tortilis
RGRL RGRD LP
RGRL RGRD LP
RGRL 1.0000
RGRL 1.0000
RGRD 0.6597 1.0000
RGRD 0.5351 1.0000
LP 0.1109 0.1183 1.0000
LP 0.3654 0.3811 1.0000
SDB 0.5886 0.7572 0.2032
SDB 0.7165 0.7652 0.4276
Schotia brachypetala
Colophospermum mopane
RGRL RGRD LP
RGRL RGRD LP
RGRL 1.0000
RGRL 1.0000
RGRD 0.4229 1.0000
RGRD 0.5395 1.0000
LP 0.3235 0.2503 1.0000
LP 0.2104 0.2995 1.0000
SDB 0.3783 0.5867 0.3798
SDB 0.6492 0.6786 0.5169
Strychnos spinosa
Combretum apiculatum
RGRL RGRD LP
RGRL RGRD LP
RGRL 1.0000
RGRL 1.0000
RGRD 0.0128 1.0000
RGRD 0.4417 1.0000
LP 0.6841 0.0188 1.0000
LP 0.2331 0.3189 1.0000
SDB 0.6085 0.2207 0.5835
SDB 0.4879 0.7504 0.4048
We analyzed final-initial relative growth rate of stem length (RGRL in mm mm-1
week-1
),
final-initial relative growth rate in stem basal diameter (RGRD in mm mm-1
week-1
), final
proportion of leaf to sapling dry biomass (LP), and final log10 transformed sapling dry
biomass (SDB in mg).

207
Chapter 4: Herbivory effects on saplings are influenced by nutrients and grass competition
in a humid South African savanna
Species-wise correlation matrix for study variables – values provided in bold are
significant (p < 0.05)
Acacia karroo
Acacia nigrescens
RGRL RGRD LP
RGRL RGRD LP
RGRL 1.0000
RGRL 1.0000 RGRD -0.548 1.0000
RGRD 0.2321 1.0000
LP -0.0805 0.5206 1.0000
LP 0.2 0.1598 1.0000
SDB -0.3238 0.6773 0.5245
SDB 0.0798 0.3774 0.2764
Acacia sieberiana
Acacia tortilis
RGRL RGRD LP
RGRL RGRD LP
RGRL 1.0000
RGRL 1.0000 RGRD -0.5287 1.0000
RGRD -0.2378 1.0000
LP -0.1176 0.3897 1.0000
LP 0.0108 0.4991 1.0000
SDB -0.4273 0.7022 0.4623
SDB -0.2175 0.5372 0.5272
Schotia brachypetala
Colophospermum mopane
RGRL RGRD LP
RGRL RGRD LP
RGRL 1.0000
RGRL 1.0000 RGRD -0.0963 1.0000
RGRD -0.0899 1.0000
LP -0.4867 0.4746 1.0000
LP -0.4376 0.1876 1.0000
SDB -0.3956 0.5473 0.6376
SDB -0.5593 0.4029 0.6553
Strychnos spinosa
Combretum apiculatum
RGRL RGRD LP
RGRL RGRD LP
RGRL 1.0000
RGRL 1.0000 RGRD -0.3538 1.0000
RGRD -0.0709 1.0000
LP -0.2236 -0.027 1.0000
LP -0.0638 0.435 1.0000
SDB -0.2843 -0.0103 0.6619
SDB -0.0381 0.5005 0.5868
We analysed final - initial relative growth rate of stem length (RGRL in mm mm-1
week-1
)
and final - initial relative growth rate in stem basal diameter (RGRD in mm mm-1
week-1
),
after clipping in April 2010. The final proportion of leaf to sapling dry biomass (LP) and
final log10 transformed sapling dry biomass (SDB in mg), taken in June 2010, were also
analyzed.

208