Embed Size (px)
Citation preview

ISSN 2039-2117 (online) ISSN 2039-9340 (print)
Mediterranean Journal of Social Sciences MCSER Publishing, Rome-Italy
Vol 5 No 5 April 2014
273
Factors Affecting Performance in the Kenya Certificate of Primary Education a
Case of Kirinyaga West District Kenya
Kaniaru Samuel Wakori
School of Education, Mount Kenya University [email protected]
Doi:10.5901/mjss.2014.v5n5p Abstract
This study covers the main factors affecting performances of Kenya certificate of Primary Education in Kirinyaga west district, Kirinyaga County. Eshiwan, (1993) found that the school based factors that influence performance of pupils include availability of teaching and learning materials, school and class sizes, time utilization, syllabus coverage and the efficiency of the school administration. Ngaroga (2007) agrees that school physical facilities such as classroom, laboratories, desks and books have a direct bearing on good performance among student in developing countries. This research critically examined school management, teaching and learning resources, teacher-pupil ratio and syllabus coverage which has direct bearing on how pupils perform in K.C.P.E. The study was conducted in twelve sampled public primary schools in Kirinyaga West District. Comparison of annual K.C.P.E results was done in order to identify the trends of the past five years. This study borrowed alot from famous educationists and psychologists like J.B Watson, Lefranciois (1994) and Mbiti M. David (1984). The performance of K.C.P.E is seen to depend mainly on how an efficient school Administration is able to allocate resources and ensure a thorough coverage of subject syllabus. Survey method of collecting quantitative and qualitative data was used. Kirinyaga West District has a population of 41 public primary schools. Twelve public primary schools were stratified and randomly selected for the study. The data was collected through questionnaires, document analysis, interviews and discussions. The data then was analyzed and presented in tables, pie charts and bar graphs while references are provided. The study found out that teaching and learning materials and teachers were not adequate. School management practices were wanting and coverage of syllabus was not thorough. Lack of capacity among school management committee was a major challenge. The study recommend that more teaching and learning materials be provided, employment of additional teachers and capacity building be enhanced to school management; supervision of school be intensified and parents be fully involved in educational programmes.
1. Background of the Study This study was carried out in Kirinyaga West District. The district was recently carved up from the larger Kirinyaga District, which is now divided into four District. The administrative centre is situated at Baricho town, South West of Kerugoya; Kerugoya town was the larger district headquarter’s before the split . Kirinyaga West district boarders, Mathira East District (Nyeri County) at the East and Murang’a district respectively.
Economically, the district is characterized by farming and trading. Residents in this area keep lifestock mainly for milk and fresh. Since the district is situated at the slopes of Mount Kenya, there is enough rainfall to facilitate arable farming. Subsistence farming of food crops such as maize, beans and bananas is carried out. The district produces coffee but at small scale farming. The district has a network of roads such as the Nairobi-Nyeri highway, Sagana – Kutus road, and Kagio-Baricho – Kerugoya tarmac road. Transportation of goods and services is easy, therefore, enabling the growth of businesses dealing in food stuffs, transport, hardware’s and information communication technology. The residence of this district can be regarded as a middle class earners. The residents in this area are Agikuyu with a special Kikuyu dialect. Education is given priority in all development planning. Almost every primary school formed a public day secondary school in the same school compound.
Kirinyaga West District has forty one public schools and sixteen private schools. Although the district post average K.C.P.E results in general, public schools are always at the bottom of the list of
schools performance. In the year 2009, for example, the first public primary school was at position eleven. Therefore none of the public school was at top ten.
The total number of pupils who sat for K.C.P.E in the year 2009 from public primary schools were 1688. The mean standard score for that year was 256.54 as compared to 306.30 in year 2008, registering a drop of 49.76 marks. The table below explains districts K.C.P.E performance since 2005.

ISSN 2039-2117 (online) ISSN 2039-9340 (print)
Mediterranean Journal of Social Sciences MCSER Publishing, Rome-Italy
Vol 5 No 5 April 2014
274
Table 1: District Performance 2005 – 2010
Year 2005 2006 2007 2008 2009 2010 K.C.P.E Mean standard 264.05 259.38 262.78 306.30 256.54 248.59
Source: District education office (K.C.P.E result analysis) Kirinyaga West. From the table, the mean standard score is hardly above half mark of 250 out of 500, except year 2008. This means that there are very few pupils who join provincial and national public secondary schools from public primary schools.
It is also worrying that in year 2009 only 6 girls and 22 boys attained quality grades of between 350-399 scores. As if this is not bad enough, non of the students in the public schools scored 400 marks and above.
Kirinyaga west district is divided into two zones, Kiine and Mwerua. Kiine had the most-of the pupils with poor performance. In year 2009 Kiine zone had 5 candidates who scored less than 100 scores, ranging between 86 marks and 98 marks. Mwerua had one candidate with less than 100 scores. The tables below indicates performance per subject in Kirinyaga west district in year 2009 and 2010 Table 2: District Subjects Performance Year 2009
Subject English Kiswahili Maths Science S/Studies & CRE Total Mean Standard Score 50.87 53.83 49.58 51.33 51.28 256.54
Source: K.C.P.E Analysis Table 3: District Subject Performance Per Zone Year 2010
Subject English Kiswahili Maths Science S/Studies& CRE Total Mwerua Zone 53.34 50.43 49.11 52.42 51.31 256.61
Kiine Zone 49.72 47.48 48.19 50.24 50.04 245.67 District mean score 248.59( year 2010)
Source: District 2009 and 2010 K.C.P.E results analysis (D.E.O’s Office, Kirinyaga West) The national examinations are seen as the basis of progression in the academic arena in Kenyan education. This study was be guided by the theory of Kelly’s personal construct theory (PCT) advanced by Kelly (1905 – 1966). It is adopted for this study because it is an idiographic approach, stressing the uniqueness of each individual. It is a phenomenological approach, that is a view of the world through a persons own eyes and not an observer interpretation or analysis. (Gross, 2005). The theory postulates that we are all scientists in the sense that we put our own interpretation. (or theory) on the world of events and from these personal theories we produce hypothesis (prediction about future events). Every time we act we are putting our hypothesis to the test and in this sense behaviour is the independent variable- it is experiment depending on the outcome, our hypothesis are either validated or not. (Cited in Gross psychology 5th Ed pg 743).
The achievement of good grades after sitting for the Kenya Certificate of Primary Education is a bench mark for joining a good secondary school which would facilitate passing in Kenya Certificate of Secondary Education to secure a place in the local university. Therefore the study of performance in primary school level, National Examination is vital to reduce wastage (Eshiwani, 1993). This study portrays that a school which is endowed with physical materials which enhance teaching and learning, has more internal efficiency that translates into better Kenya Certificate of Education performance. Teaching and learning materials also help in retention and ease of comprehension. It is also clear that syllabus coverage has to go hand in hand with the teaching and learning materials. Some subjects such as science and mathematics require practical approach that can only be done with adequacy of resources. 1.1 Statement of the Problem Most of the studies were carried out when the public schools did not face competition from the private schools. Communication technology has also improved and parents are now more involved than ever before.
Study carried out by Mulwa (2004) on factors influencing pupils academic performance in Mutongoi division, Kitui
ISSN 2039-2117 (online) ISSN 2039-9340 (print)
Mediterranean Journal of Social Sciences MCSER Publishing, Rome-Italy
Vol 5 No 5 April 2014
275
district found that parents poverty affected pupils K.C.P.E performance. Heavy workload on teachers affected adequate teaching preparation and revision for examination. Likewise, poor time utilization as a result of pupils absenteeism and lack of co-operation from parents as a result of their low academic achievement and ignorance, influence K.C.P.E performance. Mulwa (2004) recommended economic and upgrading of rural folk, employment of more teachers, cohesion between teachers, pupils and parents and expected parents contribution towards their children’s education.
Goggle organization carried a study in 2009 in six districts, Embu, Murang’a Nairobi, Garrissa, Gucha and Baringo. The research purpose was to improve quality teaching in primary schools in Kenya. The study concentrated on mathematics, English and science. The respondents here were teachers, head teachers and students just as the former study conducted in Mutongoi division, Kitui district. The study found that availability or lack of teaching aids, head teachers supervision of lessons and social relations within school amenities contribute to learners achievement. Low performing schools continue to add less value to students achievement throughout the year (goggle, 2009). Both studies failed to include important educational stake holders such as parents, SMC’s members and D.E.O’s. Therefore, there was need to examine the factors that affected the performance K.C.P.E in Kirinyaga West District of Kirinyaga County, whereby all the stake holders were involved. There was also need to conduct a research on teaching methods of all examinable subjects at primary school level. 1.2 Objectives of the Study This study was being guided by four main objectives:-
1. To identify the effect of teaching and learning materials on Kenya certificate of Primary Education Examination.
2. To investigate how teacher-pupil ratio affects performance of pupils in Kenya certificate of primary Education. 3. To examine how school management practices affect performance of Kenya Certificate of Primary Education
Examination. 4. To examine how time utilization and syllabus coverage affect pupil’s performance in Kenya Certificate of
Primary Education Examination. 5. To examine the challenges faced by schools while enhancing K.C.P.E performance.
1.3 Research Questions The research was guided by questions that the study sought to answer on completion. Therefore the study answered pertinent questions which stake holders in the education sector in Kirinyaga West District wished to get their solution. Those questions were:-
1. What is the relationship between teaching and learning materials and K.C.P.E performance? 2. What is the effect of teacher-pupil ratio on K.C.P.E performance? 3. What is the relationship between school management practices and K.C.P.E performance? 4. What are the effects of time utilization and syllabus coverage on K.C.P.E performance? 5. What are the challenges faced by schools while trying to enhance K.C.P.E performance?
1.4 Significance of the Study Since Kirinyaga West District Public Primary schools had not been posting good results in Kenya certificate of Primary Education for a period of more than five years, it was of importance to study this phenomenon, in order to identify factors that had lead to this academic decline. By doing this, stake holders such as teachers, parents and pupils would be able to address anomalies, then improve on education standards in this area. Hence, this was an important study to be undertaken to arrest the academic decline in Kirinyaga West District. 1.5 Scope of the Study This study on factors affecting the performance of K.C.P.E in public primary schools of Kirinyaga West District was conducted between May 2011 and August 2011.Stratified random sampling of schools was be done. The study was conducted in (12) twelve randomly selected public primary schools in Kirinyaga West District. Data was collected by the researcher using Questionnaires, interviews and document analysis techniques. The study was specifically sought to
ISSN 2039-2117 (online) ISSN 2039-9340 (print)
Mediterranean Journal of Social Sciences MCSER Publishing, Rome-Italy
Vol 5 No 5 April 2014
276
determine the effect of availability or lack of teaching and learning materials, teacher-pupil ratio, school management practices, syllabus coverage and challenges faced by public schools. 1.6 Assumptions of the Study The study found out that what had been assumed turned out to be real. It had been assumed that the study would have been conducted as scheduled, there wouldn’t have been other independent, variables except learning resources, school management, syllabus coverage, teacher-pupil ratio and challenges. The assumptions were verified to be true by the study. 1.7 Theoretical Frame Work This study was modeled on the environmental theory of J. B. Watson who prided himself that if he was given dozen children and his own environment to raise them in, he would produce any kind of person. He would shape one into a beggar, another into a thief, the third to a banker and so on. This position attributes a variation in intellectual ability to environment causes, that is nurture and nature. However in adopting this theory the researcher was not ignorant of its short comings. Lefrancios (1994) integrationist theory recognized that genes or nature contribute certain potentialities towards intellectual endowment but explains that actual child’s intellectual ability lies in the interaction between what is genetically given and the environment. (Gross 2005).
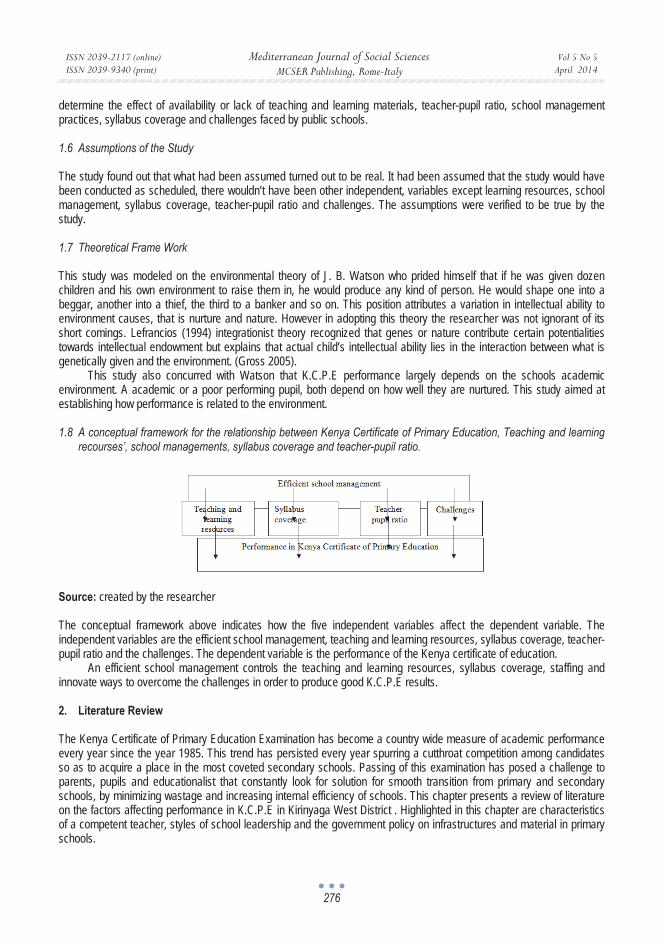
This study also concurred with Watson that K.C.P.E performance largely depends on the schools academic environment. A academic or a poor performing pupil, both depend on how well they are nurtured. This study aimed at establishing how performance is related to the environment. 1.8 A conceptual framework for the relationship between Kenya Certificate of Primary Education, Teaching and learning
recourses’, school managements, syllabus coverage and teacher-pupil ratio.
Source: created by the researcher The conceptual framework above indicates how the five independent variables affect the dependent variable. The independent variables are the efficient school management, teaching and learning resources, syllabus coverage, teacher-pupil ratio and the challenges. The dependent variable is the performance of the Kenya certificate of education.
An efficient school management controls the teaching and learning resources, syllabus coverage, staffing and innovate ways to overcome the challenges in order to produce good K.C.P.E results. 2. Literature Review The Kenya Certificate of Primary Education Examination has become a country wide measure of academic performance every year since the year 1985. This trend has persisted every year spurring a cutthroat competition among candidates so as to acquire a place in the most coveted secondary schools. Passing of this examination has posed a challenge to parents, pupils and educationalist that constantly look for solution for smooth transition from primary and secondary schools, by minimizing wastage and increasing internal efficiency of schools. This chapter presents a review of literature on the factors affecting performance in K.C.P.E in Kirinyaga West District . Highlighted in this chapter are characteristics of a competent teacher, styles of school leadership and the government policy on infrastructures and material in primary schools.

ISSN 2039-2117 (online) ISSN 2039-9340 (print)
Mediterranean Journal of Social Sciences MCSER Publishing, Rome-Italy
Vol 5 No 5 April 2014
277
2.1 Roles of Examination Eshiwan (1993) argues that one of the major roles of examination in education system is the selection and placement of candidates in various institutions and stations in society. In Kenya, the examination system/structure has been based on their structures or levels of the education system. Therefore, there are examinations for those leaving primary and secondary level education. The Kenya Certificate of Primary Education (K.C.P.E) is taken at the end of the eighth year of primary education. The primary objectives of the K.C.P.E are to rank candidates according to the attainment of knowledge, skills and attitudes and to improve the learning process in primary schools by providing the schools. K.C.P.E also provides the schools with constant feedback on candidates’ performance. The performance is used as a base for selecting pupils to secondary schools and post primary training institutions. Currently, candidates are being tested on five subjects, mathematics, English, Kiswahili, Science, social studies and Religious education.
Eshiwani (1993) explains that one of the major functions of any examination systems is to measure the output of the educational systems in which it operates: This output is often referred to as pupil’s achievement. Internal efficiency is reflected in a system by achievement and the number of pupils who have successfully completed a cycle or a course. Ebrima (2000) however highlights gender disparities in access to education. Sixty-four percent of women in Sub-Saharan Africa are illiterate compared to forty percent of the male population. As one proceeds up the educational literacy, these gender disparities grow in magnitude. The higher the level of education, the greater the gender disparity (Ebrima, 2000).
The legacy of unequal access to education primarily stems from obstacles resulting from gendering division of labour. The roles played by African women traditionally included domestic work, child rearing, agriculture and cultural activities. Virtually, this leaves them with no time for educational pursuits. Ebrima argues that these obstacles are compounded by patriarchal structures of power which not only place greater value to boys’ education than that of girls, but also discriminates against women in an spheres of social fife. Further, the same factors dictate women’s submissiveness to male authority. Ebrima (2000), observes some religious traditions may restrict women’s activities to domestic tasks, stressing their role as mothers, which limits their access to education. It is important to know that certain ethnical areas in Kenya have not been spared this gender disparity in education against the girl child. Early marriages, initiations and overburdening by domestic chores to the girl child are very much pronounced in most Kenyan society.
Economists view education as none excludable goods, commonly called social benefits or externalities. These benefits include ability to participate effectively in the democratic process, good citizenship, respect to authority, improvement to countries, level of technology and production (Benson, 1978). 2.2 Teaching Learning Materials in Kenya Eshiwan (1993) found that the school based factors that influence the performance in pupils include availability in teaching and learning materials. The primary material infrastructure programme has documented that poor primary infrastructure is one of the major barriers to improving access and quality in primary education in Kenya. Therefore the schools physical facilities such as classroom, laboratories, desks and books have direct bearing on performance among students in developing countries. Ngaroga (2007) talks of teaching and learning materials as those that are accessed in the school environment, collected and brought. These materials can be three dimensions, real objects, two dimensions and others being electronic. Teaching and learning resources have many advantages as they form a focal point of attention, arouse interest; stimulate the learners imagination save time and promote-retention and memory. However in Kenya most of the resources are not evenly distributed as schools are located in different environment allover the country. Schools in marginalized areas have few environmental resources as compared to those in wet places.
The Kenyan government since 2003 has come up with measurers to reduce variation of teaching and learning materials through the Kenya education support programme and school infrastructure and material programme. Each pupil in primary school is allocated with some amount of money each year for purchase of these materials. J.S, Farrant (1980) agrees that teaching and learning resources are important in enabling learners to achieve high marks. Basic resources such as chalkboard, books must be availed for any school to perform well. Individualized learning is almost impossible without these resources. 2.3 Staffing and Performance Improvement Strategy The teachers on duty in public primary school by year 2010 were 19,640 against curriculum based establishment of 23,619 creating a shortage of 3,919, (Central province stake holders conference 2010). Therefore there is need to recruit and deploy teachers in public primary schools.

ISSN 2039-2117 (online) ISSN 2039-9340 (print)
Mediterranean Journal of Social Sciences MCSER Publishing, Rome-Italy
Vol 5 No 5 April 2014
278
The central province has come up with a strategy to improve academic standards known as “Operation effective 40/35/30”. This is a clarion call that demanded effective utilization of engagement time in classroom. The main emphasis was on prudent management of time and other school resources to achieve desired results.
The ministry of education came up with new categorization of public primary school for equity in dispersing free primary education funds. The strategy was based on allocating propotionally more funds for instructional materials with the lowest text books per pupils ratio. The press statement by the ministry of education reported that some schools that would receive increased funding, included some schools that were old with high textbooks consumption rates. Such schools raised serious audit queries that were being scrutinized for disciplinary action where applicable. (Ministry of Education press statement on funding of FPE, May 2010) The government allocates 6.6% of its GDP to education, the minister noted. 2.4 Administrative Leadership Mbiti (1984) states that the success of any organization depends largely on active administration procedures. Leadership is concerned with the execution of those policies and decisions which help to direct the activities of an organization towards achieving a particular objective. Mbiti observes that people obey their leaders since it is a tradition to obey while others obey expecting material gains and other still obey because of their legitimacy of leadership. 2.5 Views of Leadership Leadership can be viewed as a personality gift. Some people think that leaders have in born trait to lead. This view treats leaders as being born and not made. The other view is looking at leadership as a set of function e.g performing ceremonial and executive functions. Leadership can also be viewed as a shared relationship, whereby duties and responsibilities distributed through delegation and guidance. The social process of consideration is cited by as fourth view of leadership (Mbiti 1984).
Ngaroga (2007) concurs with Mbiti that educational administration is a social process which is involved in the arrangement of the human and material resources in programme for education and using these resources carefully to achieve educational objectives, which are:
To provide a child with proper atmosphere and desirable conditions to enable it to develop socially, intellectually, morally and physically. To provide in-service training for teachers so that they may develop professionally and be worthy of tasks entrusted to them. It should also enable them to keep pace with advances in knowledge in their respective fields. To develop abilities and skills in teachers, by providing links between ideas and tested scientific knowledge on one hand and practical problems and existing. To gear up all school programmes and activities to achieve the purpose of the school.
Moreover the school administration is seen as the implementer of educational programmes among other functions such as planning school programmes, procurement of funds and other materials. Also recruiting/obtaining and developing staff, maintaining of effective inter-relationships with the community, evaluating quality of outcome. Maintaining the school culture is a functions of schools administration for a smooth flow of school’s activities. The school leadership has to employ management skills by utilizing physical and human resources through co-operative efforts. Management means running of educational institutions such as school business, school plant and the guidance of teachers and; organizing pupil personnel services.(Ngaroga, 2007)
In order to study the Kenya Certificate of Primary Education in relation to the school, administration/leadership, one has to evaluate the availability of the elements of administration in the school setup. The patent indicators are division of labour, hierarchy of authority, unity of command and co-ordination, are of importance in the leadership portrayed by the school administrators. Despite the school head having power and authority to commission school resources to action, the approach of execution of these functions is very important of late, the school management is moving from control to democracy, therefore, school performance can be linked to the leadership styles adopted by a school. Leadership as the process of influencing the activities and behaviour of an individual or a group in an effort to achieve a given goal. Further, leadership is an interactive process between the leader and the members of a group. The type of interaction between them is responsible for the success or failure of the organization. (Ngaroga, 2007)
A successful school head is seen to be committed to a specific purpose or goal sensitive to the feelings of other, takes interest in improving the group, is sincere, consistent, tolerant and able to resolve conflicts. However, leadership
ISSN 2039-2117 (online) ISSN 2039-9340 (print)
Mediterranean Journal of Social Sciences MCSER Publishing, Rome-Italy
Vol 5 No 5 April 2014
279
styles differ, from one leader to the other. Mbiti, (1984) discusses various leadership styles. He lists the styles as, autocratic, democratic, and laissez-faire. Autocracy/coercive is one whose approach to everyone in the school is authoritarian or dictatorial thus creating fear-among the staff and pupils, kills creativity and leads to high staff turnover.
Democratic leadership rests on the idea that authority to lead must be rendered legitimate by the people and consultation must be done before arriving to decisions while laissez leadership has no definite rules and regulations to guide the organization. 2.6 Characteristics of Effective Schools Central province stake holders’ educational conference (2010) described effective schools as those with strong administrative leadership and management, clear school goals shared by all, safe and orderly school climate, frequent monitoring and assessment of student progress and high expectation for student performance. Education and schooling should be looked at as a company of parents, teachers, pupils, workers and customers in good business, we want to make more profits and not losses, then we will be forced to close down the business. A good and safe school has clearly articulated and enforced discipline policy that stresses good conduct as well as respect for learners, teachers and academic work. 2.7 Challenges Facing Public Primary Schools Poverty and hunger are some of the major challenges facing Kenya today (poverty eradication commission, January – June 2009). The proportion of people living below the poverty line increased from 52 percent in 1997 to an estimated 56 percent between 2000 and 2002. (Education stakeholders conference 26th June 2009) held at Nyeri stated that equal educational opportunity is a human rights issue. Every child should be provided with a first-rate primary and secondary education that develops human potential, that is as a result of meeting intellectual, social and spiritual challenges. The conferences was able to identify that educational gaps between the advantaged and disadvantaged pupils are huge, and continued to handicap poor children in their pursuit of higher education, good jobs and better life.
However the challenge is to inform parents fully about the progress of their children and school. Moreover the district and public officials must reward success and have capacity to intervene in cases of failure.
Central province faces challenges that have led to decline in educational standards. They include insecurity from organized gangs i.e. Mungiki, inadequate curriculum delivery due to low level of commitment by teachers and ineffective supervision by school heads, drug abuse, inadequate guidance and counselling in schools. Other external threats to schools are child labour, instable families, lack and inadequate resources in the district and shortage of education officers. Those challenges were seriously noted in Kirinyaga West district public primary schools.
Examination in an Education system plays the role of placement of candidates in various institutions and stations in society (Eshiwan, 1993). K.C.P.E is the National examination that is used for selection and placement of pupils who join secondary schools. Teaching and learning resources enhance comprehension and retention.
Mbiti (1984) argues that the success of any organization depends largely on active administration procedures. Reviewing the literature on administration assisted in strengthening the study. The role of the school head in staffing and motivating is important for successful school performance. Teachers are required to cover the syllabus in the stipulated time and should have thorough comprehension of the subject content. 3. Methodology and Research Design Research design is the overall strategy for conducting the research. This study adopted the survey design. Survey is a present oriental methodology that investigates populations by selecting samples to analyze and discover occurrences (Oso and Onen 2008). The survey design describes issues without manipulating them, so it is generally the explanation of events as they are, as they were or as they will be. Survey studies can be longitudinal or cross sectional. Cross sectional survey takes a shorter time than longitudinal survey. In cross sectional survey, data is collected at one point in time, while in longitudinal survey, data is collected at a several point in time (Mugenda 1999). This study adopted cross sectional survey that enabled the reporting of the finding in the shortest time possible and reduced the budget involved. 3.1 Population Population is the entire number of elements with similar characteristics that a researcher wishes to study. Normally
ISSN 2039-2117 (online) ISSN 2039-9340 (print)
Mediterranean Journal of Social Sciences MCSER Publishing, Rome-Italy
Vol 5 No 5 April 2014
280
population is so big for a study that requires immediate reporting and therefore a sample is chosen. A sample is a representative of the population chosen for the purpose of the study.
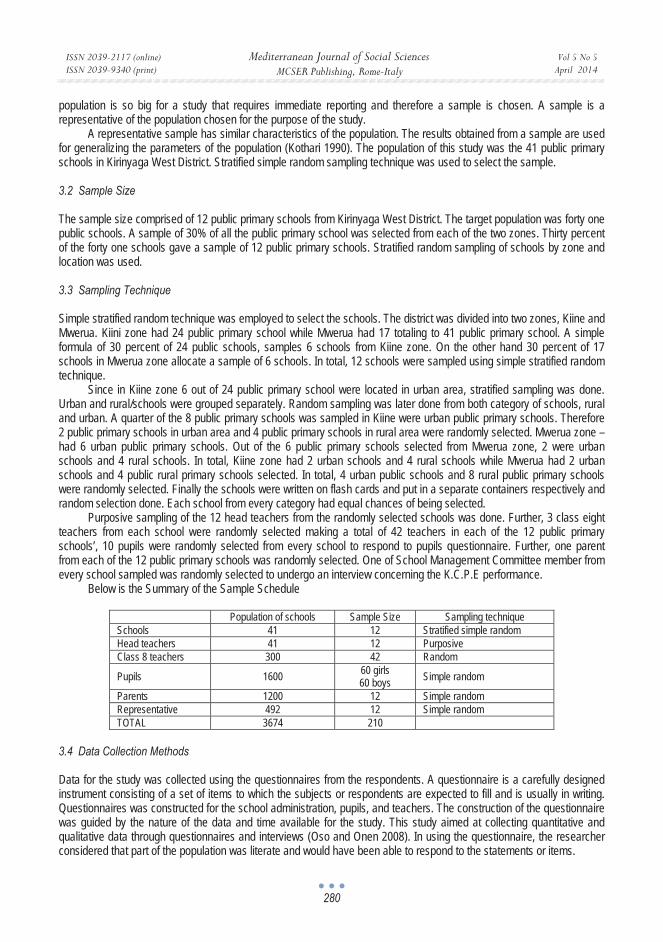
A representative sample has similar characteristics of the population. The results obtained from a sample are used for generalizing the parameters of the population (Kothari 1990). The population of this study was the 41 public primary schools in Kirinyaga West District. Stratified simple random sampling technique was used to select the sample. 3.2 Sample Size The sample size comprised of 12 public primary schools from Kirinyaga West District. The target population was forty one public schools. A sample of 30% of all the public primary school was selected from each of the two zones. Thirty percent of the forty one schools gave a sample of 12 public primary schools. Stratified random sampling of schools by zone and location was used. 3.3 Sampling Technique Simple stratified random technique was employed to select the schools. The district was divided into two zones, Kiine and Mwerua. Kiini zone had 24 public primary school while Mwerua had 17 totaling to 41 public primary school. A simple formula of 30 percent of 24 public schools, samples 6 schools from Kiine zone. On the other hand 30 percent of 17 schools in Mwerua zone allocate a sample of 6 schools. In total, 12 schools were sampled using simple stratified random technique.
Since in Kiine zone 6 out of 24 public primary school were located in urban area, stratified sampling was done. Urban and rural/schools were grouped separately. Random sampling was later done from both category of schools, rural and urban. A quarter of the 8 public primary schools was sampled in Kiine were urban public primary schools. Therefore 2 public primary schools in urban area and 4 public primary schools in rural area were randomly selected. Mwerua zone – had 6 urban public primary schools. Out of the 6 public primary schools selected from Mwerua zone, 2 were urban schools and 4 rural schools. In total, Kiine zone had 2 urban schools and 4 rural schools while Mwerua had 2 urban schools and 4 public rural primary schools selected. In total, 4 urban public schools and 8 rural public primary schools were randomly selected. Finally the schools were written on flash cards and put in a separate containers respectively and random selection done. Each school from every category had equal chances of being selected.
Purposive sampling of the 12 head teachers from the randomly selected schools was done. Further, 3 class eight teachers from each school were randomly selected making a total of 42 teachers in each of the 12 public primary schools’, 10 pupils were randomly selected from every school to respond to pupils questionnaire. Further, one parent from each of the 12 public primary schools was randomly selected. One of School Management Committee member from every school sampled was randomly selected to undergo an interview concerning the K.C.P.E performance.
Below is the Summary of the Sample Schedule
Population of schools Sample Size Sampling technique Schools 41 12 Stratified simple random Head teachers 41 12 PurposiveClass 8 teachers 300 42 Random
Pupils 1600 60 girls60 boys Simple random
Parents 1200 12 Simple randomRepresentative 492 12 Simple randomTOTAL 3674 210
3.4 Data Collection Methods Data for the study was collected using the questionnaires from the respondents. A questionnaire is a carefully designed instrument consisting of a set of items to which the subjects or respondents are expected to fill and is usually in writing. Questionnaires was constructed for the school administration, pupils, and teachers. The construction of the questionnaire was guided by the nature of the data and time available for the study. This study aimed at collecting quantitative and qualitative data through questionnaires and interviews (Oso and Onen 2008). In using the questionnaire, the researcher considered that part of the population was literate and would have been able to respond to the statements or items.
ISSN 2039-2117 (online) ISSN 2039-9340 (print)
Mediterranean Journal of Social Sciences MCSER Publishing, Rome-Italy
Vol 5 No 5 April 2014
281
Structured and open ended questionnaire were adopted for this study. This type of questionnaire allows for precise response and in-depth thoughts expression. (Mugenda and Mugenda, 1999). On the other hand interviews, document analysis, observation and focused group discussions were used. The SMC’s representatives and parents provided information through interviews. Further, was document analysis of the sampled schools.
Interviews allow the respondent to explain their point of view and offer extra information. However they are expensive and time consuming (Mugenda and Mugenda, 1999). The study carried an observation during the visit to the selected 12 schools to make an independent opinion. 3.5 Research Instruments The researcher developed questionnaires, interview schedule and document analysis schedule for collecting data. Questionnaires were for the headteachers, teachers and pupils. The questionnaire as a tool was deemed fit as it does not reveal the identity of the respondents thereby providing them opportunity to fill in information more freely. The headteachers, teachers and pupils were not required to give their names. It was assumed that their responses would be kept confidential. Questionnaires would also enable the researcher to quantify responses for analytical purposes (Mugenda, 1999). The questionnaire was based on the objectives of the study.
The questionnaire for teachers had two sections. Section A sought demographic information of teachers. The information included age, gender, academic and professional qualification of the respondents. Section B of the questionnaire sought information on teachers lessons preparation, medium of instruction, text books available for teaching and learning, syllabus coverage, teaching workload and teacher-pupil ratio. The teachers were also provided with an open ended item to give information on challenges faced by the school.
The questionnaire for headteachers had three sections. Section A sought demographic information of the headteacher. Section B had fifteen items that sought to identify how school managers allocated duties, motivated teachers and solved conflicts in their respective schools. Open ended questions were used for soughting information on enrollment, staff establishment and challenges faced by the school.
The questionnaire for students for students had twelve items. The first item sought information on gender since the respondents were half male and half female, item two and three sought information of promotion of pupils from class 7 to 8 and tests administered since joining class 8. Item 5 was used to identify the variety of teachers guide used by teachers while item 6,7,8,9 and 10 sought information on proper teaching and learning practices adopted by both pupils and teachers. Item 11 and 12 were used for identifying the challenges faced by the pupils while at school.
The observation schedule had 7 items whose purpose was for identifying the general school infrastructure and suitability of conducive learning environment. The researcher made self assessment of the sampled schools using the items. There was an interview schedule for school management committee. The SMC members are important educational stake holders therefore their view about school management was important. Also parents were orally interviewed about being involved in school programmes.
Document analysis schedule was also used. The K.C.P.E analysis for five years, 2005 to 2010 was conducted using the schedule. The analysis enabled comparison of K.C.P.E performance of the 12 schools sampled. 3.6 Instrument Validity To ensure that the instruments would have measured what they intended to, piloting of instruments was done on the target population before the actual research was conducted. A sample of one school (10% of the sample size intended) from Kirinyaga west district was selected through simple random sampling. The respondents from this school responded to the questions in their respective instruments. However, those respondents were not included in the main study. This was to test validity. Borg & Gall (1989) explain validity as the degree to which a test measures what it intended to measure. Content validity was verified by the researcher and the supervisor. Instrument and content validation is necessary before the real research is conducted. 3.7 Instrument Reliability To test for the reliability of the items in the questionnaire, the researcher used the split half method. This method was adapted as it is suitable for constructs such as attitude, reception, opinion and achievement. The split –half method was used to determine of reliability coefficient.
The method involves administering the test to a small sample then splitting the lest into two subjects/halves; even
ISSN 2039-2117 (online) ISSN 2039-9340 (print)
Mediterranean Journal of Social Sciences MCSER Publishing, Rome-Italy
Vol 5 No 5 April 2014
282
items in one subject and even items in another subject. The scores of the two subjects for each individual are computed separately. The pearson product moment correlation coefficient was used to obtain the correlation coefficient. Since the correlation obtained represents the reliability of only half the test, reliability for the entire test must be obtained. Therefore, correction was done by application spearman Brown Prophecy formula. The correlation coefficient was high. All the instruments had above 0.8675 correlation coefficient meaning that they had high split half reliability. 3.8 Research Procedure The administration of the questionnaires to the respondent was by hand delivery. The respondents were requested to complete the questionnaire themselves. The head teachers, teachers, pupils, SMCs and parents of the sampled schools were approached and explained the purpose of the study explained then requested to participate.
Confidentiality was exercised by assuring the respondents that the findings were limited to the study. The questionnaires were issued to the respondents who will be given enough time to respond freely to the items. The researcher later went round the schools collecting the questionnaires. Further, the researcher requested for discussion between him and the school teaching staff. Request was also be made through the selected school head teacher to meet one School Management Committee member and a class eight parent representative for an interview. 3.9 Data Analysis Method The collected started by verifying the accuracy and completeness. Quantitive data was analysed through descriptive statistics, by use of percentages, mean, mode and frequencies to arrive at conclusion. The researcher examined responses given by headteachers, teachers, parents, SMC’s representatives, and students to make valid conclusions. The results were represented in Charts and tables for proper analysis and interpretation. The figures arrived at show the dominant factors influencing the performance of K.C.P.E. Qualitative data was interpreted from open ended items and the interview schedule and the findings given in form of words. Both quantitive and qualitive information assisted the researcher to make conclusion. 4. Data Analysis and Interpretation Data was analyzed mathematically as according to the research objectives. Data was presented using tables, figures and diagrams. Discussions were made by the use of frequencies (f) and percentages (5%). The return rate and response rate was as intended in all research procedure. All the interviews responded and rate of return of the questionnaires was 100% as indicated in table 4.0 Table 4.0: Distribution of Respondents and their Percentages
Category of respondents Frequency (f) Percentage (%)HeadteachersTeachers Pupils SMC’s members Parents
1242 120 12 12
621 61 6 6
Total 198 100 4.1 Demographic information Section A of the teachers and the headteachers questionnaire sought personal information about age, gender academic and professional qualification in relation to performance in the school. 47% the teachers were between 40 and 50 years old, 36% between 30 and 40 years, 11% between 50 and 55 year while only 6% were between 20 and 30 years old. This proved that very few young teachers were in the schools in the district who could assist children in games, sports and other co-curricular activities. The age of the headteacher ranged between 40 to 55 years. 83% were between 40-55 years while 17% were between 50- 55 years old. The district lacked young school heads. This could be as a result of retirement age being raised from 55 years to 60 years therefore not creating room for young aspiring head teachers.
Furthermore, 83% of the headteachers were male while 17% were female. Therefore female teachers needed to
ISSN 2039-2117 (online) ISSN 2039-9340 (print)
Mediterranean Journal of Social Sciences MCSER Publishing, Rome-Italy
Vol 5 No 5 April 2014
283
be encouraged to apply for school headship inorder to mentor the girl child. On the other hand, 18 male teachers and 17 female teachers randomly responded to the questionnaires. This meant that gender parity existed during allocation of subjects to class eight teachers.
89% of the teachers were educated to form four level, while 11% were form six school leavers; However, 16% of them later advanced to diploma level, 19% were elevated to approved teachers status and 11% attained had degree certificates. Further, 54% of the teachers had not gone for further study.
School heads were 67% form four leavers and 33% form six leavers. 67% of the school heads were still at P1 level. 25% had earned diploma certificate while 8% had a degree certificate. Eshiwan (1993) identified efficiency of the school administration as one of the most important factor than enhances pupils academic performance. Therefore, there is need to enroll for further training. 4.1.1 Effect of Teaching and Learning Materials on K.C.P.E The study sought to identify the effect of teaching and learning materials on Kenya certificate of primary education examination. The table below shows the frequency and the percentages of teachers response on the number of text books allocated to pupils in the schools visited. Table 4.1: Average Number of Text Books Allocated to Class 8 Pupils
3 – 5 pupils per book 2 pupils per book 1 pupil per book Total Frequency 12 20 4 36
Percentage (%) 33.33% 55.56% 11.11% 100%
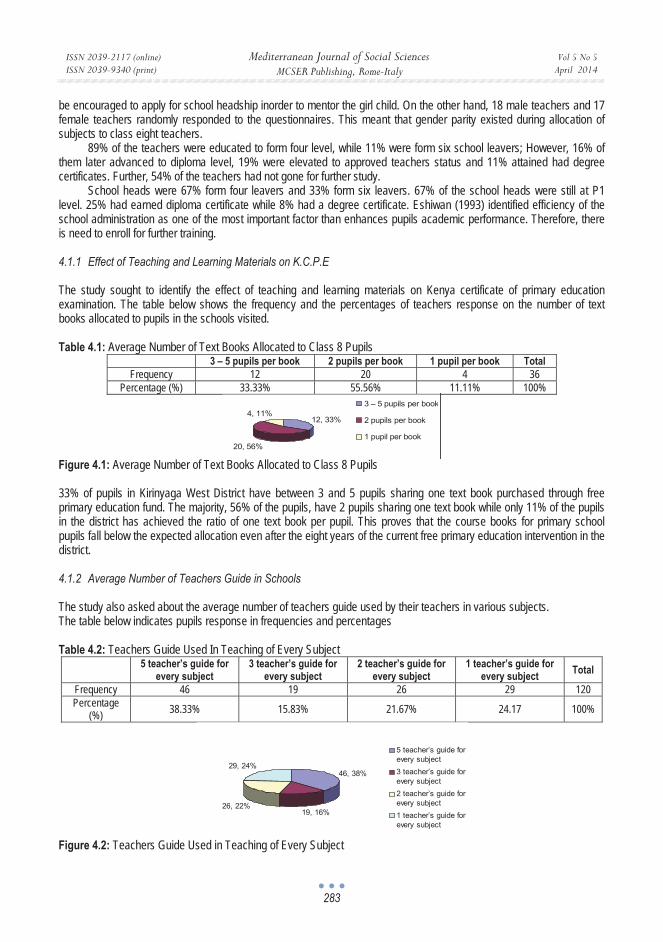
Figure 4.1: Average Number of Text Books Allocated to Class 8 Pupils 33% of pupils in Kirinyaga West District have between 3 and 5 pupils sharing one text book purchased through free primary education fund. The majority, 56% of the pupils, have 2 pupils sharing one text book while only 11% of the pupils in the district has achieved the ratio of one text book per pupil. This proves that the course books for primary school pupils fall below the expected allocation even after the eight years of the current free primary education intervention in the district. 4.1.2 Average Number of Teachers Guide in Schools The study also asked about the average number of teachers guide used by their teachers in various subjects. The table below indicates pupils response in frequencies and percentages Table 4.2: Teachers Guide Used In Teaching of Every Subject
5 teacher’s guide for every subject
3 teacher’s guide for every subject
2 teacher’s guide for every subject
1 teacher’s guide for every subject Total
Frequency 46 19 26 29 120 Percentage
(%) 38.33% 15.83% 21.67% 24.17 100%
Figure 4.2: Teachers Guide Used in Teaching of Every Subject
12, 33%
20, 56%
4, 11%3 – 5 pupils per book
2 pupils per book
1 pupil per book
46, 38%
19, 16%26, 22%
29, 24%
5 teacher’s guide forevery subject 3 teacher’s guide forevery subject 2 teacher’s guide forevery subject 1 teacher’s guide forevery subject

ISSN 2039-2117 (online) ISSN 2039-9340 (print)
Mediterranean Journal of Social Sciences MCSER Publishing, Rome-Italy
Vol 5 No 5 April 2014
284
From the table 38.33% of the teachers use a variety of at least 5 teachers guide in their teaching subjects, 16% use 3 teachers’ guide, while 22% and 24% teach using 2 and 1 teachers guide respectively. 4.1.3 Variety of Teaching Aids used in Schools The use of teaching aids in the district is tabulated in the table below. Table 4.3: Teaching aids used by teachers in the district
Charts Flash cards Real objects Posters Radio No teaching Total Frequency 16 2 2 4 1 11 36
Percentage (%) 44.44% 5.56% 5.56% 11.10 2.78% 30.56% 100%
Figure 4.3: Teaching aids used by teachers in the district 44.44% of the teachers use charts as the main teaching aid in Kirinyaga West district. 5.56% use either flash cards or real objects respectively. Posters are used by 11.10% of the teachers. Its only 2.78 teachers who use radio as a teaching and learning aid. The rest 30.56% use no teaching aids. 4.2 Teacher Pupil Ratio and its Effect on K.C.P.E The study further sought to investigate how teacher-pupil ratio affects performance of pupils in Kenya certificate of primary education are indicated in the table 4.4 Table 4.4: Average Number of Class 8 Pupils in the District per School
10 – 20 pupils 20 – 30 pupils 30 – 40 pupils 50 and above pupils Total Frequency 0 0 11 25 36
Percentage (%) 0% 0% 30.56% 69.44% 100%
Figure 4.4: Average Number of Class 8 Pupils in the District per School From the table above, the schools visited had 30.56% of pupils in class 8 between 30 and 40, while 69% of the schools have more than 50 class eight pupils mostly in a single rooms due to shortage of teachers. 4.2.1 Number of Lessons Taught by Teachers per Week Further the study examined how teacher –pupil ratio affects performance of pupils in K.C.P.E. In Kirinyaga district. 6% of the teachers taught below 10 lessons every week, another 6% taught between 20 – 30 lessons in a week. The rest of the
16, 43%
2, 6%2, 6%4, 11%
1, 3%
11, 31%Charts Flash cards Real objects Posters Radio No teaching Aids
0, 0%
0, 0%
11, 31%
25, 69%
10 – 20 pupils
20 – 30 pupils
30 – 40 pupils
50 and abovepupils
ISSN 2039-2117 (online) ISSN 2039-9340 (print)
Mediterranean Journal of Social Sciences MCSER Publishing, Rome-Italy
Vol 5 No 5 April 2014
285
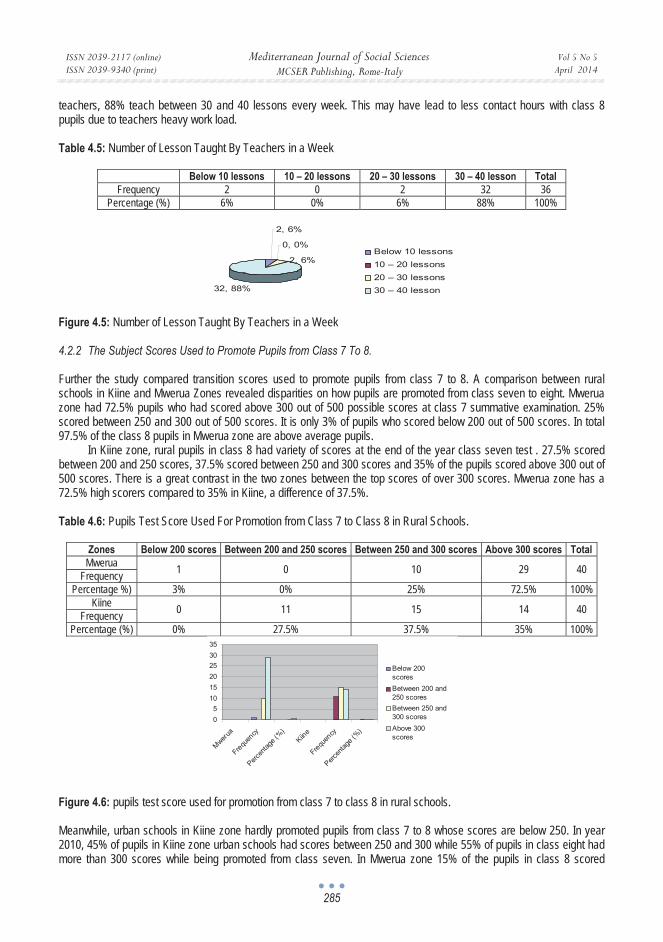
teachers, 88% teach between 30 and 40 lessons every week. This may have lead to less contact hours with class 8 pupils due to teachers heavy work load. Table 4.5: Number of Lesson Taught By Teachers in a Week
Below 10 lessons 10 – 20 lessons 20 – 30 lessons 30 – 40 lesson Total Frequency 2 0 2 32 36
Percentage (%) 6% 0% 6% 88% 100%
Figure 4.5: Number of Lesson Taught By Teachers in a Week 4.2.2 The Subject Scores Used to Promote Pupils from Class 7 To 8. Further the study compared transition scores used to promote pupils from class 7 to 8. A comparison between rural schools in Kiine and Mwerua Zones revealed disparities on how pupils are promoted from class seven to eight. Mwerua zone had 72.5% pupils who had scored above 300 out of 500 possible scores at class 7 summative examination. 25% scored between 250 and 300 out of 500 scores. It is only 3% of pupils who scored below 200 out of 500 scores. In total 97.5% of the class 8 pupils in Mwerua zone are above average pupils.
In Kiine zone, rural pupils in class 8 had variety of scores at the end of the year class seven test . 27.5% scored between 200 and 250 scores, 37.5% scored between 250 and 300 scores and 35% of the pupils scored above 300 out of 500 scores. There is a great contrast in the two zones between the top scores of over 300 scores. Mwerua zone has a 72.5% high scorers compared to 35% in Kiine, a difference of 37.5%. Table 4.6: Pupils Test Score Used For Promotion from Class 7 to Class 8 in Rural Schools.
Zones Below 200 scores Between 200 and 250 scores Between 250 and 300 scores Above 300 scores Total Mwerua 1 0 10 29 40 Frequency
Percentage %) 3% 0% 25% 72.5% 100% Kiine 0 11 15 14 40 Frequency
Percentage (%) 0% 27.5% 37.5% 35% 100%
Figure 4.6: pupils test score used for promotion from class 7 to class 8 in rural schools. Meanwhile, urban schools in Kiine zone hardly promoted pupils from class 7 to 8 whose scores are below 250. In year 2010, 45% of pupils in Kiine zone urban schools had scores between 250 and 300 while 55% of pupils in class eight had more than 300 scores while being promoted from class seven. In Mwerua zone 15% of the pupils in class 8 scored
2, 6%
0, 0%
2, 6%
32, 88%
Below 10 lessons 10 – 20 lessons 20 – 30 lessons 30 – 40 lesson
05
101520253035
Mwerua
Frequen
cy
Percen
tage (%
)Kiin
e
Frequen
cy
Percen
tage (%
)
Below 200scores Between 200 and250 scores Between 250 and300 scores Above 300scores
ISSN 2039-2117 (online) ISSN 2039-9340 (print)
Mediterranean Journal of Social Sciences MCSER Publishing, Rome-Italy
Vol 5 No 5 April 2014
286
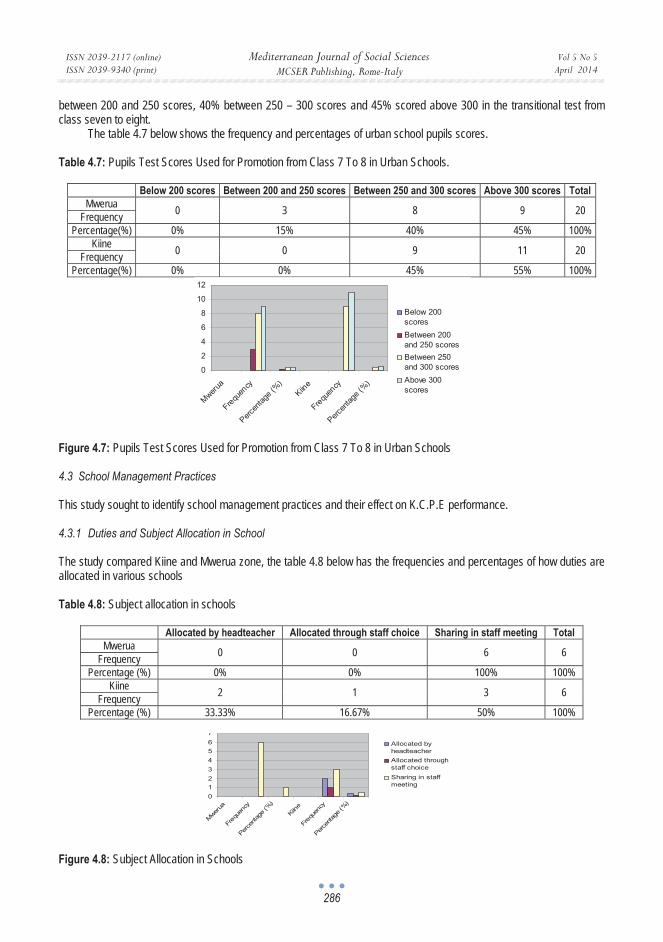
between 200 and 250 scores, 40% between 250 – 300 scores and 45% scored above 300 in the transitional test from class seven to eight.
The table 4.7 below shows the frequency and percentages of urban school pupils scores. Table 4.7: Pupils Test Scores Used for Promotion from Class 7 To 8 in Urban Schools.
Below 200 scores Between 200 and 250 scores Between 250 and 300 scores Above 300 scores Total Mwerua 0 3 8 9 20 Frequency
Percentage(%) 0% 15% 40% 45% 100% Kiine 0 0 9 11 20 Frequency
Percentage(%) 0% 0% 45% 55% 100%
Figure 4.7: Pupils Test Scores Used for Promotion from Class 7 To 8 in Urban Schools 4.3 School Management Practices This study sought to identify school management practices and their effect on K.C.P.E performance. 4.3.1 Duties and Subject Allocation in School The study compared Kiine and Mwerua zone, the table 4.8 below has the frequencies and percentages of how duties are allocated in various schools Table 4.8: Subject allocation in schools
Allocated by headteacher Allocated through staff choice Sharing in staff meeting Total Mwerua 0 0 6 6 Frequency
Percentage (%) 0% 0% 100% 100% Kiine 2 1 3 6 Frequency
Percentage (%) 33.33% 16.67% 50% 100%
Figure 4.8: Subject Allocation in Schools
0
2
4
6
8
10
12
Mwerua
Frequen
cy
Percen
tage (%
)Kiin
e
Frequen
cy
Percen
tage (%
)
Below 200scores Between 200and 250 scores Between 250and 300 scores Above 300scores
01234567
Mwerua
Freq
uenc
y
Percen
tage (
%)
Kiine
Freq
uenc
y
Percen
tage (
%)
Allocated byheadteacher Allocated throughstaff choice Sharing in staffmeeting

ISSN 2039-2117 (online) ISSN 2039-9340 (print)
Mediterranean Journal of Social Sciences MCSER Publishing, Rome-Italy
Vol 5 No 5 April 2014
287
Table 4.8 indicates that in Mwerua zone, 100% subject allocation and duties are openly shared in staff meetings. In Kiine zone 33.33% allocations are by the headteachers, 16.67% are by through teachers choice and 50% sharing in the staff meeting.
Therefore headteachers in Mwerua zone manage school through team work while in Kiine zone headteachers manage partly by directing and by partial democracy. 4.3.2 Address to School Assembly Despite the school heads in Kiine zone addressing the school assembly daily the schools were doing poorler than those in Mwerua zone. This was translated in wastage of morning lessons leading to poor performance of pupils in Kiine zone. In Mwerua zone morning sessions were utilized for remedial teaching and classes started on time therefore pupils performing better academically. Head teachers in Kiine zone address school assembly more frequent than their counterparts in Mwerua zone. Table 4.9 has the frequencies and percentages Table 4.9: The Number of Times Headteachers Address School in a Week
Address assembly daily Address 2 – 3 every week Address assembly when necessary Total Kiine
3
3
0
6 Frequency Percentage (%) 50% 50% 0% 100%
Mwerua 0
6
0
6 Frequency
Percentage (%) 0% 100% 0% 100%
Figure 4.9: The Number of Times Headteachers Address School in a Week According to table 4.9 50% of the headteachers in Kiine zone address school assembly daily while the other 50% address the assembly twice to thrice per week. Meanwhile, 100% of headteachers in Mwerua zone address school assemblies at the rate of two to three times in a week. 4.3.3 Headteacher’s Rewarding Trend to the Teachers The study also looked into the headteachers rewarding trend to teachers for excellent performance in teaching, measured by pupils results. Table 4.10 has the tabulation. Table 4.10: Headteachers, rewarding patterns to teachers teaching performance
Rewarded this year
Rewarded last year
Rewarded last year but one
Never been rewarded Total
Frequency 9 8 7 12 36 Percentage(%) 25% 22.22% 19.44% 33.33% 100%
01234567
Kiine
Frequen
cy
Percen
tage (%
)
Mwerua
Frequen
cy
Percen
tage (%
)
Address assemblydaily Address 2 – 3 everyweek Address assemblywhen necessary

ISSN 2039-2117 (online) ISSN 2039-9340 (print)
Mediterranean Journal of Social Sciences MCSER Publishing, Rome-Italy
Vol 5 No 5 April 2014
288
Figure 4.10: Headteachers, Rewarding Patterns to Teachers Teaching Performance From table 4.10, 25% of the teachers were rewarded in year 2011, 22.22% were rewarded in year 2010, 19.44% teachers were rewarded two years ago and 33.33% have never been rewarded. The headteachers need to reward teachers more since there is correlation between motivation in teaching performance and rewarding. Table 4.11: Number of Lessons Taught by Headteachers per Day
0-1 lesson per day 2-5 lessons every day 5 and above lessons per day Total Frequency 1 4 7 12
Percentage (%) 8.34% 33.33% 58.33% 100%
Figure 4.11: Number of Lessons Taught by Headteachers per Day From table 4.1l headteachers in Kirinyaga West district responded towards the number of the lesson they taught every day. 58.33%, the majority, taught at least five lesson each day, 33.33% taught between 2 and 5 lesson while only 8.34% of the headteachers taught a single lesson each working day. This means that despite the management role bestowed on headteachers, school heads in this district has a huge teaching workload in their schools. This may force the pupils taught by the headteachers to miss some lessons while the school head attends other managerial duties. 4.3.4 Teachers School Leave Out Headteachers in Kirinyaga west district were requested to respond on how they grant teachers school leave out. According to table 4.12. 50% of Kiine zone school heads grant teachers leave through writing, 16.67% through phone call and 33.33% through verbal permission. In Mwerua zone, 66.67 of teachers get school leave out through verbal consent and 33.33% through written permission. Table 4.12: Teacher’s School Leave Out
Zones Permission by writing Permission by phone call Permission by verbal consent Total Kiine 3 1 2 6 Frequency
Percentage (%) 50% 16.67% 33.33% 100% Mwerua 2 0 4 6 Frequency
Percentage (%) 33.33% 0% 66.67% 100%
9, 25%
8, 22%7, 19%
12, 34%
Rewarded this year
Rewarded last year
Rewarded last yearbut one Never been rewarded
1, 8%
4, 33%7, 59%
0-1 lesson per day
2-5 lessons everyday 5 and above lessonsper day
ISSN 2039-2117 (online) ISSN 2039-9340 (print)
Mediterranean Journal of Social Sciences MCSER Publishing, Rome-Italy
Vol 5 No 5 April 2014
289
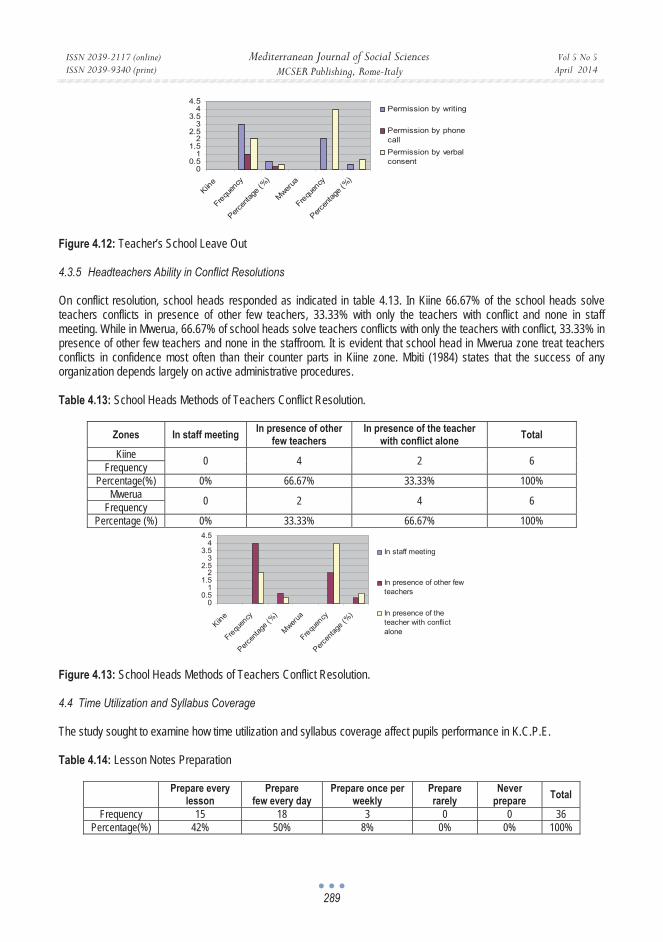
Figure 4.12: Teacher’s School Leave Out 4.3.5 Headteachers Ability in Conflict Resolutions On conflict resolution, school heads responded as indicated in table 4.13. In Kiine 66.67% of the school heads solve teachers conflicts in presence of other few teachers, 33.33% with only the teachers with conflict and none in staff meeting. While in Mwerua, 66.67% of school heads solve teachers conflicts with only the teachers with conflict, 33.33% in presence of other few teachers and none in the staffroom. It is evident that school head in Mwerua zone treat teachers conflicts in confidence most often than their counter parts in Kiine zone. Mbiti (1984) states that the success of any organization depends largely on active administrative procedures. Table 4.13: School Heads Methods of Teachers Conflict Resolution.
Zones In staff meeting In presence of other few teachers
In presence of the teacher with conflict alone Total
Kiine 0 4 2 6 Frequency Percentage(%) 0% 66.67% 33.33% 100%
Mwerua 0 2 4 6 Frequency Percentage (%) 0% 33.33% 66.67% 100%
Figure 4.13: School Heads Methods of Teachers Conflict Resolution. 4.4 Time Utilization and Syllabus Coverage The study sought to examine how time utilization and syllabus coverage affect pupils performance in K.C.P.E. Table 4.14: Lesson Notes Preparation
Prepare every lesson
Preparefew every day
Prepare once per weekly
Prepare rarely
Never prepare Total
Frequency 15 18 3 0 0 36 Percentage(%) 42% 50% 8% 0% 0% 100%
00.5
11.5
22.5
33.5
44.5
Kiine
Frequ
ency
Percen
tage (
%)
Mwerua
Frequ
ency
Percen
tage (%
)
Permission by writing
Permission by phonecallPermission by verbalconsent
00.5
11.5
22.5
33.5
44.5
Kiine
Frequen
cy
Percen
tage (%
)
Mwerua
Frequen
cy
Percen
tage (%
)
In staff meeting
In presence of other fewteachers
In presence of theteacher with conflictalone

ISSN 2039-2117 (online) ISSN 2039-9340 (print)
Mediterranean Journal of Social Sciences MCSER Publishing, Rome-Italy
Vol 5 No 5 April 2014
290
Figure 4.14: Lesson Notes Preparation 4.4.1 Lesson Notes Preparation by Teachers in the District Teachers were asked how frequent they prepare lesson notes. The findings are in the table above. 42% of the teachers in the district prepare lesson notes for every lesson, 50% prepare a few lesson notes daily and 8% prepare once every week. The findings are that 58% of teachers are not adequately prepared for teaching in their classroom lessons. 4.4.2 Medium of Instruction in Schools The study revealed that the medium of instruction for class eight pupils in the district is 61% English and Kiswahili languages used concurrently and 39% Kiswahili language used alone. The findings are that the language policy is not clear. English language is not intensively used as medium of instruction in the district. The findings are shown in the table below. Table 4.15: Medium of Instruction
Use English Use Kiswahili Use both English and Kiswahili Use Vernacular Total Frequency 14 0 22 0 36
Percentage (%) 39% 0% 61% 0% 100%
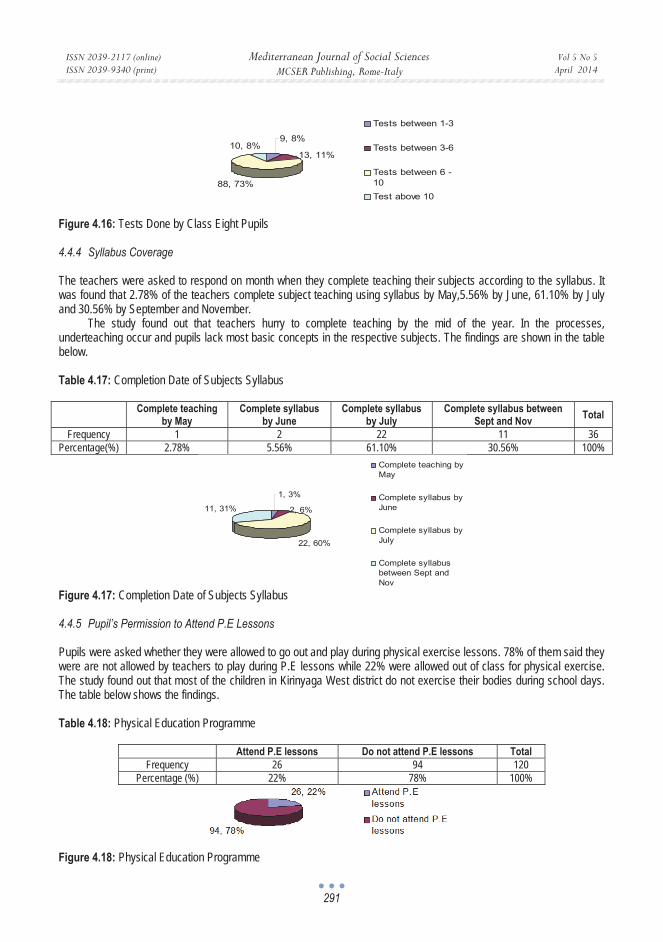
Figure 4.15: Medium of Instruction 4.4.3 Tests Administered to Class 8 Pupils The study also asked class eight pupils the number of tests they had done since joining class eight 7.5% of the pupils said they had been done between 1 and 3 tests, 11% had been done between 3 and 6 tests, 73.33% between 6 and 10 tests while 8% had 10 tests. The study found out there was a lot of testing pupil pupils in expense of teaching. Table 4.16 has the findings. Table 4.16: Tests Done by Class Eight Pupils
Tests between 1-3 Tests between 3-6 Tests between 6 -10 Test above 10 Total Frequency 9 13 88 10 120
Percentage (%) 7.50% 10.83% 73.33% 8.34% 100%
15, 42%
18, 50%
3, 8%
0, 0%
0, 0%
Prepare everylesson Prepare few everyday Prepare once perweekly Prepare rarely
Never prepare
14, 39%
0, 0%22, 61%
0, 0%
Use English
Use Kiswahili
Use both Englishand KiswahiliUse Vernacular
ISSN 2039-2117 (online) ISSN 2039-9340 (print)
Mediterranean Journal of Social Sciences MCSER Publishing, Rome-Italy
Vol 5 No 5 April 2014
291
Figure 4.16: Tests Done by Class Eight Pupils 4.4.4 Syllabus Coverage The teachers were asked to respond on month when they complete teaching their subjects according to the syllabus. It was found that 2.78% of the teachers complete subject teaching using syllabus by May,5.56% by June, 61.10% by July and 30.56% by September and November.
The study found out that teachers hurry to complete teaching by the mid of the year. In the processes, underteaching occur and pupils lack most basic concepts in the respective subjects. The findings are shown in the table below. Table 4.17: Completion Date of Subjects Syllabus
Complete teaching by May
Complete syllabus by June
Complete syllabus by July
Complete syllabus between Sept and Nov Total
Frequency 1 2 22 11 36 Percentage(%) 2.78% 5.56% 61.10% 30.56% 100%
Figure 4.17: Completion Date of Subjects Syllabus 4.4.5 Pupil’s Permission to Attend P.E Lessons Pupils were asked whether they were allowed to go out and play during physical exercise lessons. 78% of them said they were are not allowed by teachers to play during P.E lessons while 22% were allowed out of class for physical exercise. The study found out that most of the children in Kirinyaga West district do not exercise their bodies during school days. The table below shows the findings. Table 4.18: Physical Education Programme
Attend P.E lessons Do not attend P.E lessons Total Frequency 26 94 120
Percentage (%) 22% 78% 100%
Figure 4.18: Physical Education Programme
9, 8%
13, 11%
88, 73%
10, 8%
Tests between 1-3
Tests between 3-6
Tests between 6 -10 Test above 10
1, 3%
2, 6%
22, 60%
11, 31%
Complete teaching byMay
Complete syllabus byJune
Complete syllabus byJuly
Complete syllabusbetween Sept andNov
ISSN 2039-2117 (online) ISSN 2039-9340 (print)
Mediterranean Journal of Social Sciences MCSER Publishing, Rome-Italy
Vol 5 No 5 April 2014
292
4.5 Challenges Faced by Public Primary Schools in Kirinyaga West District The study sought to have insight of challenges facing the primary schools while trying to enhance K.C.P.E performance. 4.5.1 Lack of Enough Teachers. This study found that lack of enough teachers in the schools was a major challenge. All the 12 primary schools visited had at least two teachers employed by school’s management. The population of the 12 schools was 7235 against 192 government employed teachers. On average, there are 75 pupils for every class. However the schools had double streams bringing down the mean number of pupils in each room to 37. This number is still high considering that individual attention to every pupils is required. Sometimes, some classes are combined since some schools cannot be able to employ extra teachers from the community.
Closely related to shortage of teachers, is how to alleviate congestion in the rooms due to shortage of teachers and sometimes in adequate classrooms; More than 60 pupils are required to learn in a single room. The schools also faced with the question of providing enough furniture for the pupils in the respective schools. 4.5.2 Lack of Enough Teaching and Learning Resources Another challenges is pupil’s text book. Pupils from 10 schools out of the 12 visited wished that more text books and writing materials be availed. Balancing of co-culicular activities and classroom study is a challenge to many schools. Pupils from nine schools said that they are occupied with class work the whole day even sometimes not going out for break. Therefore drama or debating clubs and sports are unavailable in the schools and the main emphasis is on passing exams.
Guidance and counselling in the schools has not been given the importance it deserves physical in punishment is the main way of correcting behaviour in most schools visited.
Parents of 8 schools of out the 12 schools visited hoped that the school management would involve them in planning of school activities such as education of their children. 8 parents said that they are only involved in contributing money and not in their children affairs. However school management committee members felt that they were well involved and participate in school affairs. The challenge is to get well educated SMC’s members who have attended school beyond ordinally level. Teachers from at least 8 schools felt that the main challenge in trying to enhance K.C.P.E performance is ignorant parents. They observed that since most parents are illiterate, it is very hard to incorporate them in their children educational matters. Poverty among parents also affect pupils performance in school. Since the school management and teachers have devised a method for remedial teaching on Saturdays, the major challenge is to mobilize financial resource from the poor, ignorant and hostile parents. The great question is how to bring on board all parents and create rapport with the school community.
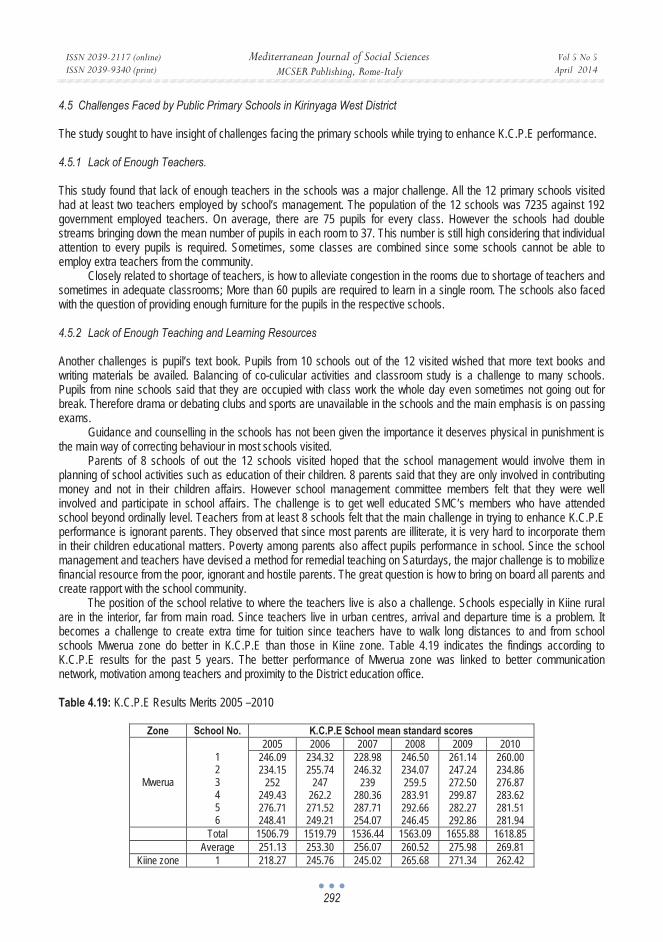
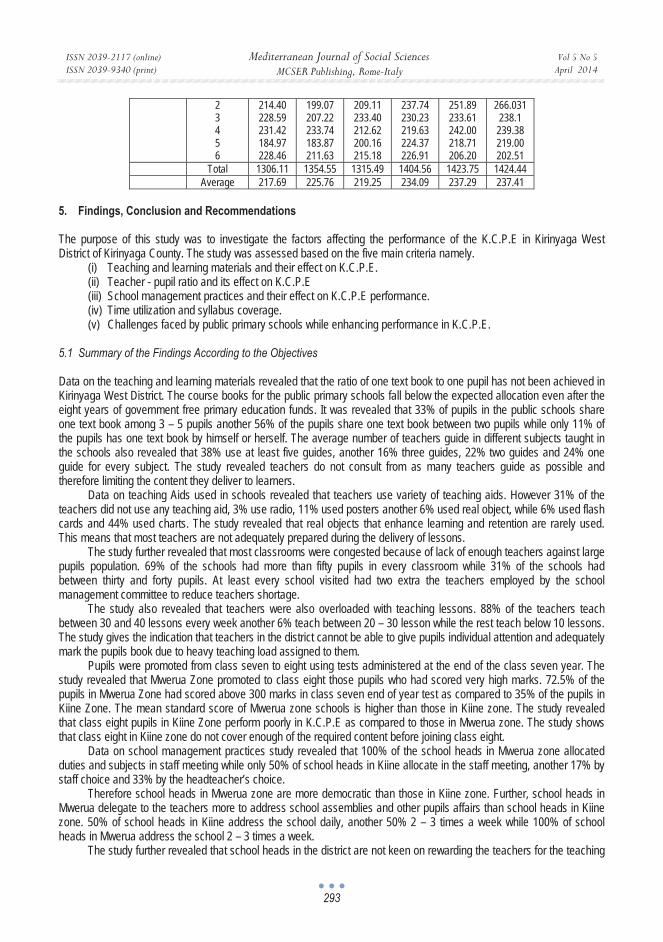
The position of the school relative to where the teachers live is also a challenge. Schools especially in Kiine rural are in the interior, far from main road. Since teachers live in urban centres, arrival and departure time is a problem. It becomes a challenge to create extra time for tuition since teachers have to walk long distances to and from school schools Mwerua zone do better in K.C.P.E than those in Kiine zone. Table 4.19 indicates the findings according to K.C.P.E results for the past 5 years. The better performance of Mwerua zone was linked to better communication network, motivation among teachers and proximity to the District education office. Table 4.19: K.C.P.E Results Merits 2005 –2010
Zone School No. K.C.P.E School mean standard scores
Mwerua
1 2 3 4 5 6
2005 2006 2007 2008 2009 2010 246.09234.15
252 249.43 276.71 248.41
234.32255.74
247 262.2 271.52 249.21
228.98246.32
239 280.36 287.71 254.07
246.50234.07 259.5 283.91 292.66 246.45
261.14247.24 272.50 299.87 282.27 292.86
260.00 234.86 276.87 283.62 281.51 281.94
Total 1506.79 1519.79 1536.44 1563.09 1655.88 1618.85 Average 251.13 253.30 256.07 260.52 275.98 269.81
Kiine zone 1 218.27 245.76 245.02 265.68 271.34 262.42
ISSN 2039-2117 (online) ISSN 2039-9340 (print)
Mediterranean Journal of Social Sciences MCSER Publishing, Rome-Italy
Vol 5 No 5 April 2014
293
23 4 5 6
214.40228.59 231.42 184.97 228.46
199.07207.22 233.74 183.87 211.63
209.11233.40 212.62 200.16 215.18
237.74230.23 219.63 224.37 226.91
251.89233.61 242.00 218.71 206.20
266.031 238.1 239.38 219.00 202.51
Total 1306.11 1354.55 1315.49 1404.56 1423.75 1424.44 Average 217.69 225.76 219.25 234.09 237.29 237.41
5. Findings, Conclusion and Recommendations The purpose of this study was to investigate the factors affecting the performance of the K.C.P.E in Kirinyaga West District of Kirinyaga County. The study was assessed based on the five main criteria namely.
(i) Teaching and learning materials and their effect on K.C.P.E. (ii) Teacher - pupil ratio and its effect on K.C.P.E (iii) School management practices and their effect on K.C.P.E performance. (iv) Time utilization and syllabus coverage. (v) Challenges faced by public primary schools while enhancing performance in K.C.P.E.
5.1 Summary of the Findings According to the Objectives Data on the teaching and learning materials revealed that the ratio of one text book to one pupil has not been achieved in Kirinyaga West District. The course books for the public primary schools fall below the expected allocation even after the eight years of government free primary education funds. It was revealed that 33% of pupils in the public schools share one text book among 3 – 5 pupils another 56% of the pupils share one text book between two pupils while only 11% of the pupils has one text book by himself or herself. The average number of teachers guide in different subjects taught in the schools also revealed that 38% use at least five guides, another 16% three guides, 22% two guides and 24% one guide for every subject. The study revealed teachers do not consult from as many teachers guide as possible and therefore limiting the content they deliver to learners.
Data on teaching Aids used in schools revealed that teachers use variety of teaching aids. However 31% of the teachers did not use any teaching aid, 3% use radio, 11% used posters another 6% used real object, while 6% used flash cards and 44% used charts. The study revealed that real objects that enhance learning and retention are rarely used. This means that most teachers are not adequately prepared during the delivery of lessons.
The study further revealed that most classrooms were congested because of lack of enough teachers against large pupils population. 69% of the schools had more than fifty pupils in every classroom while 31% of the schools had between thirty and forty pupils. At least every school visited had two extra the teachers employed by the school management committee to reduce teachers shortage.
The study also revealed that teachers were also overloaded with teaching lessons. 88% of the teachers teach between 30 and 40 lessons every week another 6% teach between 20 – 30 lesson while the rest teach below 10 lessons. The study gives the indication that teachers in the district cannot be able to give pupils individual attention and adequately mark the pupils book due to heavy teaching load assigned to them.
Pupils were promoted from class seven to eight using tests administered at the end of the class seven year. The study revealed that Mwerua Zone promoted to class eight those pupils who had scored very high marks. 72.5% of the pupils in Mwerua Zone had scored above 300 marks in class seven end of year test as compared to 35% of the pupils in Kiine Zone. The mean standard score of Mwerua zone schools is higher than those in Kiine zone. The study revealed that class eight pupils in Kiine Zone perform poorly in K.C.P.E as compared to those in Mwerua zone. The study shows that class eight in Kiine zone do not cover enough of the required content before joining class eight.
Data on school management practices study revealed that 100% of the school heads in Mwerua zone allocated duties and subjects in staff meeting while only 50% of school heads in Kiine allocate in the staff meeting, another 17% by staff choice and 33% by the headteacher’s choice.
Therefore school heads in Mwerua zone are more democratic than those in Kiine zone. Further, school heads in Mwerua delegate to the teachers more to address school assemblies and other pupils affairs than school heads in Kiine zone. 50% of school heads in Kiine address the school daily, another 50% 2 – 3 times a week while 100% of school heads in Mwerua address the school 2 – 3 times a week.
The study further revealed that school heads in the district are not keen on rewarding the teachers for the teaching
ISSN 2039-2117 (online) ISSN 2039-9340 (print)
Mediterranean Journal of Social Sciences MCSER Publishing, Rome-Italy
Vol 5 No 5 April 2014
294
performance and good pupils results. This year alone, only 25% of teachers have been rewarded, 22% last year, another 19% last year but one and 33% have never been rewarded. Lack of reward mechanism in the schools have led to low motivation among teachers.
Headteachers in the district has a lot of daily teaching lessons. Out of the eight lessons plotted on a daily timetable, 58% of school heads teach more than five lessons everyday. Sometimes the school heads miss lessons when they attend other managerial and administrative duties in and out school. The study further revealed that school heads in Mwerua zone give permission to teachers to be out of school more freely than their counter part in Kiine zone. 67% of school heads in Mwerua zone as compared to 33% of the school heads in Kiine zone permit teachers to be away from school by verbal communication.
In Kiine, the study revealed that 50% of the teachers must write a formal leave out request while in Mwerua zone 33% of the teachers wrote. (join this to the above paragraph).
None of the teachers asked permission to leave school by phone call in Mwerua zone while 17% of teachers do so in Kiine zone. This means that teachers in Mwerua zone are not shy to face and have dialogue with their school heads. Conflict resolution study among school heads revealed that 67% of the school heads in Mwerua zone solve teachers conflict without involving non concerned parties while in Kiine zone 33% of the school heads to so. 67% of school heads in Kiine zone involve non involved teachers while solving conflicts as compared to 33% in Mwerua zone. Guidance and conselling programmes are missing in most school as well as schools heads lacking thorough knowledge of conflict resolution.
Data on syllabus coverage and time utilization studies revealed that teachers do not prepare lesson plans regularly, therefore compromising effective teaching. Furthermore, English as medium of instruction is not given prominence in many schools, since only 39% of the schools use English solely for instruction. The study also revealed that pupils did many tests in any given term therefore affecting time that could have been be used in teaching and learning. From January to June year 2011, 73% the pupils had already sat for 6 – 10 tests administered internally by teachers. It was also revealed that by the month of July, most of the teachers were through with content delivery according to the syllabus irrespective of the time wasted in the administering many continuous assessment tests. However, teachers were not keen to cover the previous classes subject work where a lot seemed to have not been covered thus leading to poor K.C.P.E performance. The study went further to reveal that class eight pupils in Kirinyaga West are hardly allowed to do body exercises or attend the physical education lessons commonly known as P.E lessons. 22% of the pupils attend P.E lessons while another 78% of the pupils do not attend. The study revealed that pupils were in serious need of body exercises if K.C.P.E performance is to be enhanced.
The number of teachers per every school that the study was conducted fell short of the required number. The study revealed that parents are required to contribute some money to hire at least two teachers in every school. Illiteracy and poverty among parents pose a threat to the pupil’s academic performance. Rural schools are the most affected by parents ignorance, incorparativeness and open hostility. Since the free primary education was introduced, most parents belief that they have no role to play in contributing resources towards their children primary education.
The further the schools were from the district office, the poorly they performed. Teachers from the schools in the interior were lowly motivated. The study revealed that there was minimal co-operation between parents and teachers especially in rural areas each blaming the other for poor performances. Basic schools requirements for the pupils such as writing materials were not available in many schools due to delay in remitting free primary education funds. 5.2 Conclusion Based on the findings, it was concluded that the factors that positively affected performance of the K.C.P.E were not adequately provided for in Kirinyaga West District. This is because, teaching and learning resources, and human resources were in short supply. Management skills of the schools heads were also wanting. Syllabus coverage was not thoroughly done plus the myriads of challenges being faced by the public primary schools.
It was also concluded that Mwerua zone public schools performed better than schools in Kiine zone. It was also noted that pupils who joined class eight with already good grades from class seven, do better in K.C.P.E than those with lower grades.
Co-operation between parents and teachers was lacking in many school, the study also concluded. Schools especially in Kiine zone had minimal interaction with the community around the school. This was as a result of illiteracy, poverty and ignorance among the parents. Schools in the rural were mostly affected by poor performance due to low motivation of teachers. The study concluded that the teachers in public primary school were overworked and hence have little time to assist class eight pupils to prepare for K.C.P.E.

ISSN 2039-2117 (online) ISSN 2039-9340 (print)
Mediterranean Journal of Social Sciences MCSER Publishing, Rome-Italy
Vol 5 No 5 April 2014
295
5.3 Recommendations In the light of the findings and conclusions of the study, it is recommended that:
(i) More teaching and learning resources be provided to schools. Monitoring and supervision be thoroughly done to ensure that school funds are properly utilized.
(ii) The government to employ more teachers to reduce shortage to avail more contact hours to learners. (iii) The headtaechers to undergo courses on financial and human resource management. This would increase the
performance of school programmes due to efficient management. (iv) Supervision and inspection of curriculum be enhanced especially in rural schools far from the district
educational head quarters. (v) Children be allowed to play especially during physical exercise lessons. This would energize and enhance
pupils understanding and retention. (vi) Headteachers to check teachers lesson preparation on daily basis to ensure teaching competence. (vii) Integration and participation of parents in school programmes be emphasized.
5.4 Suggestions for Further Research It is suggested that a study to assess other factors affecting performance in Kenya Certificate of Primary Education be carried out. References Benson. The Economics of public Education. London, 1978. Ebrima, S., Gender and Academic Freedom in Africa. Dakar: Codesria, 2000. Eshiwani. G., Education in Kenya since Independence. Nairobi: east African Educational Publishers, 1993. Farrant, J. S., Principles and Practices in Education. Singapore: Longman Publishers Limited, 1980. Gay, L. R.,Educational research competencies for analysis and application.London: Merrill Publishing Company, 1987. Gross, R., Psychology The Science of Mind and Behaviours 5th Ed. Dubai:Hodder and Arnold, 2005. Goggle Organization., How to improve quality teaching in primary schools in Kenya .Nairobi: Kenya, 2009. Gwako, W. A., Social Education and Ethics. Kampala: East African Education Publishers Limited, 1988. Hendrikz, E., An introduction to Educational Psychology; China: Macmillan Publishers limited, 1986. Kothari, C.R., Research Methodology, methods and Techniques (2nd ed) New. Delhi: Wishwa Prakashan, 1990. Lefrancios, G.R., Psychology for teaching Belmont: Wadsworth publishing Company, 1994. Leader, W. G., How to Pass Exams. Cheltenham: Stanley Thornes Publishers Limited, 1990. Mulwa, D., Factors influencing pupils academic performance. Kitui: Kenya, 2004. Mbiti, M. David., Foundations of school administration, Nairobi: Oxford Press, 1984. Mugenda, O.M., and Mugenda, A.G., Research Method. Quantitative and Qualitative Approaches: Nairobi: A.C.E Press, 1999. Ministry of Education., Elimu News. Nairobi; Government of Kenya, 2010. Ngaroga, M. Joseph., Education for Primary Teacher education; Nairobi: East African Educational Publisher’s Limited, 2007. Nacino, R. I., Curriculum and Instruction. Introduction of Methods of Teaching. Malysia: Macmillan Publishers, 1982. Nuttal, D. L., Assessing Educational Achievement. Basingtoke: Taylor & Francis (printers) Limited, 1998. Okumbe J., Educational Management Theory and Practice. Nairobi.: Nairobi University Press, 1989. Oso, W. Y., & Onen, D., A General Guide toWritting Research Proposal and Report. Second Edition. Kampala Makelele: University
Press, 2008. Poverty Eradication Commission., Poverty Alleviation News. Nairobi: Government of Kenya, 2009. Provincial Director of Education., Education Stakeholders Conference. Nyeri: Ministry of education, 2009 and 2010. Quist, D., Primary Teaching Methods. London: Macmillan Education Limited, 2000. Sagimo, D. O., Management Dynamics. Nairobi: East African Educational Publishers Limited, 2002. Thomson, A. R., Education and Development in Africa. London: Macmillan Publishers, 1981. Tum, P. C., Education Trends in Kenya. A vocational perspective. Nairobi: Jomo Kenyatta Foundation, 1996. Wall, W. D., Constructive Education for Children. London: George G. Harrap & Company Limited, 1975.