Embed Size (px)
Citation preview

Factors Affecting Interest Group Contributions to Candidates in State Legislative Elections*
Robert E. Hogan Louisiana State University
Keith E. Hamm Rice University
Rhonda L. Wrzenski Louisiana State University
Abstract
What factors influence the strategies used by interest groups in making campaign contributions? This paper examines this question in an analysis of contributions made by interest groups to state legislative candidates in 15 states. A variety of factors associated with candidates, districts, and states are examined to explain relative levels of funding contributed to incumbents versus challengers by business organizations and labor groups. The findings demonstrate that several candidate-level variables are important predictors of interest group strategies. Political party, seniority, and leadership in the chamber influence both business and labor interest group contributing. A state legislator’s policy voting record affects contributions by labor groups, but not those of business groups. District-level factors that measure the degree of electoral competitiveness have almost no effect on contribution patterns of either type of group. A state-level factor, stringency of a state’s campaign finance laws, is expected to affect the contributions of both types of organizations. In the face of a wide assortment of controls, we find that stringent campaign finance laws reduce incumbent advantages in fundraising among business and labor organizations. Such findings have important implications for our theoretical understanding of interest group behavior as well as for current debates surrounding campaign financing at the state and national levels. *Support for this research was provided by a grant from the National Science Foundation (SES-0215450 and SES-0215604). All interpretations and conclusions are attributed to the authors alone. Paper prepared for presentation at the 2006 Midwestern Political Science Association Meeting, April 20-23, Chicago Illinois.

Introduction
Fundraising is a fundamental feature of modern political campaigns. Candidates running for elective office at nearly all levels of government must raise at least some funding, and for many offices, success at fundraising is a necessary condition for having any chance at being elected. A key set of questions for students of American elections, therefore, involves identifying and measuring factors that lead to differences in candidates’ fundraising. Given the large sums of money contributed by interest groups, much of the literature on this topic centers on explaining the contribution patterns of categories of interest groups. What factors explain why groups give more to some types of candidates than to others? Research over the years has considered a range of factors that influence interest group contribution strategies. Studies have attempted to link such factors as candidate characteristics, positions held within the chamber (party leaders and committee assignments), voting record, and district marginality to differences in interest group funding patterns (e.g., Box-Steffensmeier and Dow 1992, Evans 1988, Gopian 1984, Grenzke 1989, Herndon 1982, Poole and Romer 1985, Wright 1985). However, one condition that has received relatively little attention is that of campaign finance laws. State laws vary dramatically regarding the types of contributions that are permitted (Alexander 1991, Gross and Goidel 2003, Jones 1984, Malbin and Gais 1998, Michaelson 2001, Thompson and Moncrief 1998, Schultz 2002, Witko 2005). For example, in some states corporations and labor unions are permitted to give unlimited amounts of money to political candidates but in other states, such contributions are prohibited or severely restricted. A central question for the present analysis is whether such differences have an effect on the amount of money that candidates raise from various interest groups. Do stringent campaign finance laws provide an advantage to some types of candidates over others? Specifically, given the access-oriented strategy of many interest groups, do we find that more stringent laws reduce disparities in funding between incumbents and challengers? The present study considers these questions by examining patterns of campaign contributions from business and labor organizations to candidates running in 1,245 state legislative elections across 15 states. Unlike many past studies that have examined these patterns in only one or a small number of states (e.g., Box-Steffensmeier and Dow 1992, Jones and Borris 1985, Thompson and Cassie 1992), we utilize many states in a comparative approach in order to better understand the effects of state-level factors such as campaign finance laws. By also controlling for various candidate and district level indicators, we will determine what factors influence the relative amounts of money that incumbents and challengers collect from business and labor organizations. Overall the results demonstrate that several incumbent-level factors have an important influence on an organization’s contributions. But more importantly, the findings demonstrate a strong and consistent influence of campaign finance laws – more restrictive laws lead to a reduced disparity of contributions between incumbents and challengers from both business and labor organizations.
Theoretical Perspective
Most of the research examining contribution strategies has been at the congressional level and examines a wide assortment of explanatory variables ranging from the aspects of the contributing organization (e.g., Wilcox 1989, Wright 1985) to candidate attributes and election conditions (e.g., Evans 1988, Denzau and Munger 1986, Gopian 1984, Grier and Munger 1986 and
2

1993, Pool and Romer 1985, Romer and Snyder 1994). A much smaller number of studies have examined contribution strategies in state legislative elections (e.g., Box-Steffensmeier and Dow 1992, Cassie and Thompson 1998, Jones and Borris 1985, Thompson and Cassie 1992, Thompson et al., 1994). The key question that motivates much of this research has been: why do organizations give more money to some candidates than to others? Much of the interest group literature shows that candidate characteristics and electoral conditions are often the driving forces (e.g., Evans 1988, Grier and Munger 1986, Romer and Snyder 1994). For some organizations, contributing is based upon the degree of power wielded by sitting legislators. For access-oriented organizations, especially corporate and business organizations, campaign contributions are more likely to flow to incumbents, particularly those holding positions of power within the chamber (party leaders and committee chairs). For organizations that tend to pursue an electoral strategy, such as labor unions and single-issue groups, contributing is based more on partisan and ideological considerations.
While candidate characteristics and electoral conditions are clearly important elements affecting an organization’s strategy, few studies consider system-level features such as campaign finance restrictions. The states would seem to be an excellent venue to examine such effects, but past studies have focused less on system-level influences and more on candidate and district level conditions (e.g., Jones and Borris 1985, Thompson, et al. 1994). While studies have given some attention to system-level features such as partisan control and legislative professionalism (Cassie and Thompson 1998, Thompson, et al. 1994) the effects of campaign finance laws on an organization’s contribution strategies have only been indirectly examined (e.g., Box-Steffensmeier and Dow 1992). Yet, it is in the state setting where interest group strategies are most likely to be affected by differences in contribution restrictions.
We contend that campaign finance laws will have an important independent and direct effect on the strategies used by interest groups as they go about making campaign contributions to political candidates. Laws that limit contributions will result in different patterns of campaign contributions. Such an expectation comes in light of the explanatory power of candidate and district conditions in the Box-Steffensmeier and Dow (1992) study in a setting where contributions are unlimited (California in the 1980s). They found that the “removal of constraints on contributions allows investors to target the allocation of their resources,”(p. 624) resulting in an enhanced role for candidate and district-level features. A key question is whether the influence of these factors changes when subjected to a comparative state analysis of states having varying campaign finance laws.
Our major expectation is that the contribution behavior of interest groups will vary based upon the campaign finance laws of a given state. The contribution strategies used by an organization in a state where there are very low limits are likely to be very different than those used by a similar organization in a state where limits are high or nonexistent. Because incumbents are so often the major beneficiaries of money from access-oriented organizations, it seems that low limits will negatively influence the amounts of money that incumbents raise from such groups relative to their challengers. In order to better understand those factors that might condition group contribution strategies, we examine two types of organizations: business groups and labor organizations. These categories of groups are singled out for two reasons. First, within each category there is a high degree of homogeneity of interest – for-profit business organizations are generally supportive of conservative economic and regulatory policies while labor unions are not very supportive. Within
3

categories of other organizations, namely professional associations or single-issue groups, there is no such homogeneity of interest (e.g., this category includes pro-life as well as pro-choice groups, pro-gun and anti-gun groups, etc.). The second reason for using business and labor organizations is that the literature demonstrates that these two types of groups generally use very different strategies in trying to influence the electoral process. Whereas business organizations tend to use an “access” strategy (sometimes referred to in the literature as a “legislative” or “pragmatic” strategy), labor groups are more likely to use an “electoral” strategy (also referred to as an “ideological” strategy) in making campaign contributions. An access strategy is one whereby a group tends to contribute primarily based upon power within the chamber. Groups using this strategy contribute heavily to incumbents. An electoral strategy is manifested by assistance given to candidates who share the organization’s ideology or issue positions. Groups pursuing an electoral strategy tend to give heavily to challengers. By examining the activities of both business and labor organizations, then, we can gain a clearer perspective on the factors that influence interest group strategies. Are the contribution strategies of these organizations influenced by a common set of factors? Most importantly, do campaign finance laws have a similar influence on the strategies of these two types of groups?
Factors Affecting Interest Group Strategies The goal of this analysis is to identify and measure the relative influence of factors believed to affect the flow of interest group money to political candidates. In doing so, we are mindful of the fact that there are a number of ways that organizations may choose to use funding for purposes of influencing the political process. While many organizations make campaign contributions to candidates, other organizations spend relatively little on such activities, choosing instead to use issue advertising or independent spending. Some organizations forgo the elections route altogether and focus their money on lobbying activities. Thus, our focus on just campaign contribution patterns is quite narrow and may not be generalizeable to all types of interest group activities. With this caveat in mind, we will proceed with modeling those factors and conditions that we believe affect interest group contribution patterns. Dependent Variable
The dependent variable is measured as net contributions donated to an incumbent relative to his or her challenger. Calculated for business and labor groups separately, such a measure assumes that donations to the incumbent’s challenger are made in opposition to the incumbent. It is calculated by first subtracting the money given to the challenger from that given to the incumbent. A resulting positive value from this calculation indicates that the incumbent received more money than the challenger while a negative value indicates that the challenger received more than the incumbent. Given the major differences across states in levels of funding, due in large measure to variations in district populations, this value is divided by the number of eligible voters in the legislator’s district. The resulting figure represents the level of contributions to the incumbent relative to the challenger.
Given the theoretical importance of distinguishing between business and labor organizations, it is critical that we be specific about what types of organizations are included in each category. For labor organizations, the types of contributions included are very straightforward – they include money donated directly from labor unions in states where such donations are allowed or from their affiliated PACs. Examples of such organizations include Teamsters, Education
4
Unions, Pipefitters, etc. For business organizations, these donations include any organizational contribution that appears on its face to be a for-profit or money-generating enterprise. This would include direct donations (or donations from their affiliated PACs) from corporations, small businesses (accounting firms, law firms, retailers, etc.), manufacturers, companies involved in resource extraction (forestry, mining, fishing, etc.), and farms. While such businesses represent a range of different activities, most would appear to have a similar set of priorities with regard to governmental policies.
As indicated earlier, a focus on both labor and business contributions will provide an interesting perspective as we go about testing the effects of various independent variables. Past studies indicate that these groups often pursue very different strategies as they make campaign contributions. Given the propensity of labor groups to pursue an “electoral” or “ideological” strategy and business groups to pursue an “access” or “pragmatic” strategy, we anticipate that many of the independent variables will have a differential effect on contributions by these two groups. Such differences are noted in the discussion of each of the independent variables below. Independent Variables Candidate-Level Factors Political Party
Does political party matter for the amount of contributions received from business and labor organizations? Previous studies indicate that business groups are much more likely to contribute to Republicans and labor groups are much more likely to give to Democrats (e.g., Cassie and Thompson 1998). Do we find that this pattern holds, even after controls for a host of candidate, district, and system level factors? Because the importance of such a variable would indicate the presence of an “electoral” or “ideological” strategy, we anticipate that this effect will be greater for labor organizations. A dichotomous indicator is used to assess the influence of political party (1=Democrat, 0=Republican). Majority Party
If groups are interested in pursuing an access-oriented strategy, it seems very likely that they would be more likely to give to legislators who belong to the majority party in the chamber. Majority party members often have a larger say in their committee assignments and have a greater likelihood of seeing their policy preferences realized. Previous studies report that majority party status has such an effect for the most access-oriented types of organizations. In a recent analysis of corporate and labor groups in congressional elections, Rudolph (1999) finds that corporate groups contribute much more to incumbents who are of the majority party. Labor unions, by contrast, do not contribute more based upon majority party status. A dichotomous indicator is used to assess the influence of this factor in the state legislative setting (1=majority party, 0=minority party).1
1Note that prior to 2000, state legislative incumbents in Washington shared chamber control. Therefore, incumbents of neither party are coded as being in the majority.
5
Years of Service
The length of time that a legislator is in office is likely to affect his or her ability to collect campaign funding. Legislators who have served more terms have greater legislative experience and may be particularly targeted by access-oriented interest groups. Past studies at the congressional level have identified a link between seniority and campaign contributions (Grier and Munger 1993, Rudolph 1999). A variable indicating the number of years served prior to the current term is included in the multivariate analyses. A positive and statistically significant coefficient will indicate that longer-serving incumbents receive a larger share of campaign funding. Chamber Party Leadership
Legislators holding important leadership positions in the chamber such as Speaker or Majority Leader are very likely to attract a significant amount of campaign dollars, particularly from access-oriented groups. Such leaders often have the power to set the agenda and make other important procedural decisions that affect the fate of legislation as it moves through the chamber. Past studies indicate very clearly that chamber leaders receive a large amount of campaign money from interest groups (Cassie and Thompson 1998, Clucas 1992), and we expect to uncover a similar finding here. Voting Record
The voting record of a legislator may have a significant effect on the amount of campaign contributions he or she receives from interest groups. Whether or not a legislator votes liberally or conservatively on matters of economic and regulatory policy may profoundly influence the amount of funding they receive from business and labor interest groups. Past studies indicate that voting record has an influence on an organization’s contributions to candidates (e.g., Grier and Munger 1993, Rudolph 1999, although see Box-Steffensmeier and Dow 1992). However, the influence of voting history appears to be less important for access-oriented groups than it is for election-oriented groups. We therefore expect that voting record will have more of an influence on contributing by labor organizations.
Past voting record is measured using a voting score for each legislator obtained from the National Federation of Independent Business (NFIB). This is a national association with affiliated organizations in nearly every state that rates legislators over a two-year period on the percentage of times his or her roll-call votes match the organization’s pro-business position on key issues before the legislature. The scores are similar to those produced by organizations that rate members of Congress such as Americans for Democratic Action (ADA), Chamber of Commerce of the United States (COC) and American Conservative Union (ACU). The NFIB scores range from 0 to 100 with higher scores representing greater support for the conservative position on economic and regulatory policies. These scores are calibrated for use in our comparative state analysis by first subtracting from each legislator’s individual score the average score for the chamber and year. This value is then divided by the standard deviation of the NFIB score in each chamber and year. The resulting measure is an indicator of each legislator’s conservative voting record relative to his or her colleagues.
6

District-Level Factors Past Electoral Competition
Partisan competition in the district may have an effect on the relative levels of funding collected by incumbents and challengers. Groups pursuing an electoral strategy would be particularly sensitive to the degree of district competition. Access-oriented groups, by contrast, are likely to give to incumbents regardless of their competitive situation.
To measure this influence we calculate the past competitiveness of the district. This value is
determined by taking the incumbent’s percentage of the two-party vote in the last election. This figure is subtracted from 100 to create an indicator of district competitiveness. Where an incumbent won by a small margin, say 51%, the competitiveness measure would be 49. For an incumbent who had no opposition in the last election (he or she won with 100% of the two party vote), the competitiveness measure would equal 0.
Demographic Competition The degree of competition in the previous election may be strongly influenced by short-term factors and may not fully capture the underlying competition of the legislative district. To take into account more of the long-term partisan proclivities of voters, we have created a measure of competition that incorporates several important population characteristics of the district. The measure is similar to one developed by Koetzle (1998) for use in congressional elections. Here it is based on 4 key population characteristics where higher values of the variable represent greater support for the incumbent’s party: percent with a college degree, percent white, percent living in urban areas, and percent living in rural areas. The deviation of each characteristic from the national median is calculated so that positive values represent a larger proportion of voters likely to cast ballots for Democrats and negative values represent larger proportions likely to cast ballots for Republicans. These percentages are then totaled and divided by the number of variables (4). Finally, the positive values are all multiplied by –1. The resulting measure represents the competitiveness of the district with higher values representing more competitive districts.2 State-Level Factors Legislative Professionalism
Legislative institutions vary dramatically across states in terms of the resources afforded members and the extent to which members view their positions as full-time jobs. The concept of legislative “professionalism” is often used to describe these differences. More “professional”
2An example will illustrate how this measure is calculated for a particular district. Both the district and national mean for each of the following variables is used: percent holding at least a 2-year college degree (district = 45, nation = 23); percent white population (district = 75, nation = 92); percent living in urban areas (district = 20, nation = 26); and percent living in rural areas (district = 30, nation = 43). The percentage point deviations favoring the Democrats are summed for each of the four variables and then divided by the number of categories [(-22) + (17) + (-6) + (13)] / 4. The resulting value equals 0.5. Because the value is positive it is multiplied by –1 to equal –0.5.
7

legislatures are those where members have higher pay, greater staff support, and are in session for a longer portion of the year. Such differences in legislative institutions might very well affect contribution patterns by organizations. Because incumbents in highly professional legislatures are more likely to be reelected (e.g., Berry, et al. 2000, Carey, et al. 2000), it seems that access-oriented groups would be much more likely to contribute to incumbents in these settings.
To determine if there is such an effect, we use a measure of legislative professionalism developed by Squire (2000). This measure takes into account three critical differences between legislative institutions (length of the legislative session, legislator salary, and staff resources). The values on this scale range from 0 to 1.0 with greater values indicating higher levels of “professionalism.” If access-oriented groups are more likely to contribute to incumbents, the coefficient for this variable should be positive in the multivariate model. Campaign Finance Laws
Some states have strict limits on the amounts that organizations may contribute while other states have very lenient laws that allow nearly unlimited contributions (Alexander 1991, Gross and Goidel 2003, Jones 1984, Malbin and Gais 1998, Michaelson 2001, Thompson and Moncrief 1998, Schultz 2002, Witko 2005). As indicated earlier, we expect these differences to have a major influence on the contribution patterns of interest groups. Given that incumbents are the likely recipients of the overwhelming amount of campaign contributions, it seems that restrictions would have a more negative impact on incumbent fundraising. Thus, challengers would be the beneficiaries in those states where laws put greater restrictions on funding sources.
State laws vary greatly regarding not only whether certain types of contributions are allowed,
but also the amounts that are allowed from each source. While our future efforts will attempt to create a more finely tuned measure, for now we rely on a basic dichotomous indicator that separates those states that allow unlimited contributions from corporations, labor unions, and PACs, and those that either prohibit certain contributions (particularly from corporations and unions) or set rather strict limits. In the 15 states used in the present analysis, only 3 allow nearly unlimited contributions. In the 1998 and 2000 elections, candidates running for the state legislature could accept unlimited contributions from any corporation, labor union or PAC in California, Illinois, and New Mexico. In all the other states, laws either prohibit or restrict these contributions. A dichotomous indicator is used to note the presence of limits (1=limits, 0=no limits). If campaign finance laws in fact reduce the advantages of incumbents, the coefficient in the regression analysis will be negative.
Data
The present analysis focuses on elections to the state legislature in 1998 and 2000 where an incumbent faced a major party challenger in the general election. The fifteen states include in the analysis are: Alaska, California, Colorado, Florida, Georgia, Iowa, Idaho, Illinois, Indiana, Kentucky, Maine, Michigan, Minnesota, Missouri, and New Mexico.3 These states were not randomly selected, however, they do provide variation on important factors such as region and political culture as well
3We have data for both the 1998 and 2000 periods for all 15 states save for three states. We have only one election cycle of data for: Georgia (1998), Idaho (2000), and Minnesota (2000).
8
as on conditions critical to this analysis such as legislative professionalism and campaign finance laws.4
Data on campaign financing of legislative campaigns was obtained from the Institute of
Money in State Politics. This organization tracks campaign contributions for nearly every state in the country and makes the data available through its web site (www.followthemoney.org). These data include, among other things, the name of each contributor, the amount of the contribution, and the recipient of the contribution. The Institute also has a coding scheme in which it places each contribution into one of 147 separate categories. These categories range from accounting firms and transportation unions to political parties and candidate self-financed contributions. While the data may be retrieved for free from the web site, the information can only be downloaded 50 records at a time and must then be properly formatted for use in statistical analyses. For this group of 15 states alone, we downloaded and formatted over 400,000 lines of contribution data.
The nature of our question is one that requires that we examine contributions by groups (or organizations), not contributions by individuals. Unfortunately, the data from the Institute of Money in State Politics does not provide a way to easily separate out individual contributions from group contributions without making this determination through manual inspection on a case-by-case basis. We are currently undertaking this task, but do not yet have a full complement of states ready for analysis. However, we are able to examine many categories of business contributions that mostly contain non-individual contributions. For the labor union contributions, we are fairly confident that these categories include only group contributions. So we are proceeding with this preliminary analysis with a realization that the business contribution summaries will be refined in future analyses. Once we have fully “cleaned this data” of individual contributions, we believe the results will be more accurate and probably stronger.
In addition to the campaign finance data we obtained information on incumbent
characteristics (e.g., terms of service, party leadership, etc.) from various sources such as State Legislative Committees and Staff (1998 and 2000), published by the Council of State Governments (Lexington, KY) and directly from the Secretary of State or Clerk of the House in certain states. Demographic features of districts came from Legislative Elections: Voting Patterns and Demographics (Barone, et al. 1998). We used various editions of Campaign Finance Law (Feigenbaum and Palmer: 1998 and 2000) published by the Federal Election Commission, to obtain the basic information on state campaign finance laws for this paper. Clarification concerning some details of the laws was obtained in a few states directly from the oversight agencies themselves. Election material was obtained either through the web or directly by mail from the relevant state agency (usually the Elections Division of the Secretary of State). Finally, the National Federation of Independent Business (NFIB) interest group scores were obtained directly from the affiliated organizations located in each state.
4We currently are completing the collection of 10 additional states for a total of 25 states in two election cycles. Future analyses will include these additional states and will enable us to draw more generalizeable conclusions.
9

Findings
Descriptive Analyses To gain some sense of the variation across the states, Table 1 provides the average total contributions, contributions from business organizations, and contributions from labor groups for incumbents and challengers pooled for the 1998 and 2000 election cycles. As one can see, there is a large amount of variation across states and candidate types in the amounts of funding received. The total contributions column indicates that the average candidates in some states raise significantly more money than the typical candidates from other states. This contrast cannot be greater than that between California where the typical incumbent raises well over $700,000 while the average incumbent in Maine collects less than $7,000. The other states fall in between these extremes, although contributions are quite high in Illinois and Florida where the average incumbent collects over $100,000 in funding. Funding in Idaho and Minnesota falls at the low end with average incumbent contributions near $15,000 and $24,000 respectively. In addition to the total amounts, Table 1 also provides a perspective on the average amounts raised specifically from business and labor organizations. Among incumbents, the amounts raised from businesses usually far outstrip the amounts raised from labor unions (Minnesota is the only exception to this pattern where the amounts raised from both groups is very similar). Among challengers, the disparity between business and labor is not nearly as great, and in a few states, the average challenger contributions from labor unions surpass those from businesses (Iowa, Illinois, and Michigan). But the general pattern is quite clear -- business contributions usually exceed those of unions by a significant margin. A final pattern to notice is simply that incumbents raise more than challengers among both business and labor groups. Such a finding is not too surprising given all the evidence from so many other studies at both the congressional and state legislative levels that show the same thing. Only in Idaho do we see an exception to this trend where the average challenger receives $1,259 from labor unions while the average incumbent raises only $988. Another perspective on contribution patterns can be obtained by examining the measures used as the dependent variables in the analysis. These measures are calculated by first subtracting challenger contributions from incumbent contributions and then dividing by the total number of eligible district voters. Such a measure enables us to see by how much per eligible voter the typical challenger is out-raised by the incumbent. Given that district populations vary so widely across states, such a calculation is necessary for making cross-state comparisons. Table 2 provides the results of these calculations for the 15 states examined in the analysis. In the total contributions column we find that on a per eligible voter basis, incumbents in Illinois out-raise challengers by the widest margin. Here incumbents on average collect over $3 more per eligible voter than their challengers. Similar disparities are observed in California ($2.19), Alaska ($1.49), and Iowa ($1.22). Much smaller disparities exist in Colorado ($0.33), Idaho ($0.36), and Maine ($0.32). The smallest average difference is in Minnesota where incumbents out-raise challengers by only $0.28 per eligible voter.
10

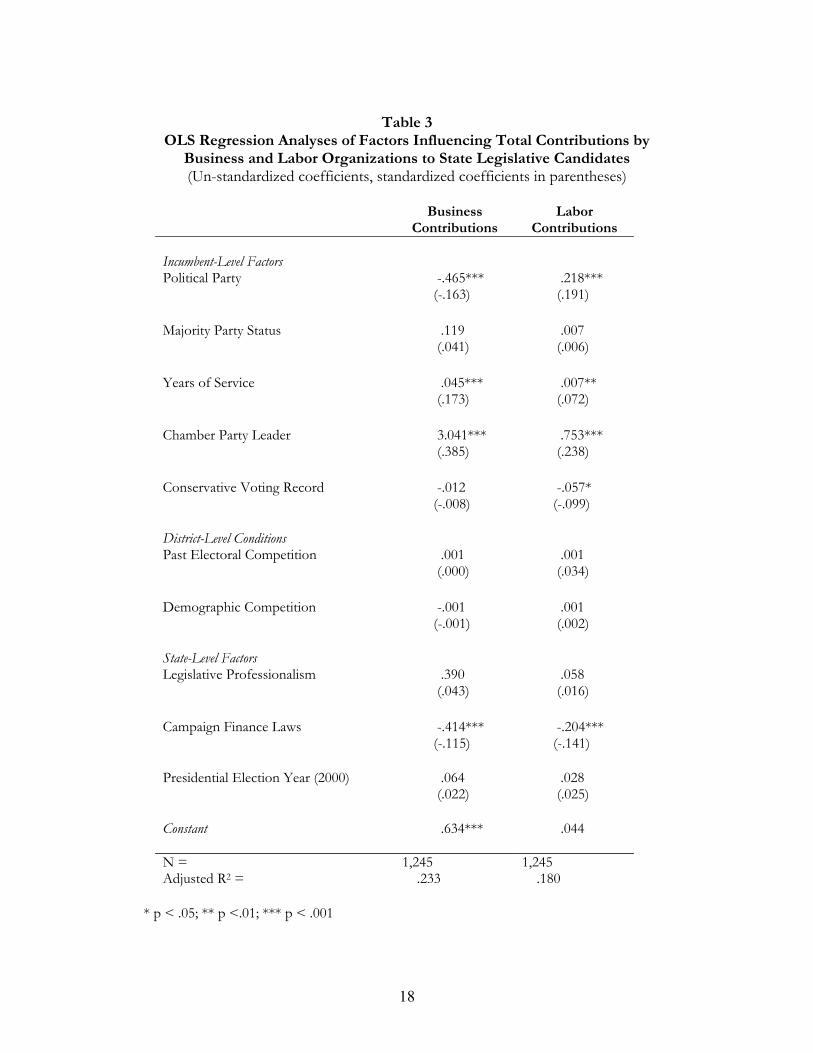
For differences specific to business and labor union contributions we also find major variation across the states. Among business contributions, the differences are highest in Alaska ($1.42) and lowest in Minnesota ($0.02). Among labor groups, the largest disparity is in Illinois ($0.46) and the smallest are in Colorado ($0.01), Iowa ($0.01), Maine ($0.01), and Idaho ($-0.01). The negative value in Idaho indicates that on average, labor union contributions to challengers exceeded those given to incumbents. Overall, the results from Tables 1 and 2 demonstrate there is a large amount of variation across the states in the amounts of money that are contributed to incumbents and to challengers. Our next step to is to determine if we can explain these differences. Multivariate Analyses What are the effects of the various incumbent, district, and state-level factors on the relative amounts of funding provided to incumbent versus challenger candidates? Table 3 provides the result of two OLS regression analyses using business and labor contributions as dependent variables. Beginning with incumbent-level factors we find that political party has a strong and statistically significant influence on relative levels of funding supplied by both business and labor organizations. The dichotomous measure of party indicates business groups give more funding to Republicans while labor groups give more to Democrats. Contrary to our expectations, such an effect is evidence that both business and labor groups contribution patterns exhibit aspects of an electoral strategy. And, contrary to our expectations, it does not appear that labor organizations are more prone to use such a strategy. Does majority party status have an influence on contribution strategies? Such an effect would be clear evidence that an access-oriented approach is being used by these organizations. As the results indicate, the dichotomous indicator does not have a statistically significant effect for either business or labor groups. Such a finding clearly differs from recent findings that show corporate organizations responsive to such an influence in congressional elections (Rudolph 1999). Years of service and chamber party leadership are two variables that tap the propensity of groups to use an access-oriented strategy. As the results clearly show, both of these variables are positive and statistically significant for both labor and business groups. Incumbents with longer service and those who hold leadership roles within the chamber receive much larger levels of funding relative to their challengers than other incumbents. The chamber party leader variable is an especially powerful variable in explaining differences in incumbent contributions. Clearly, for both business and labor organizations, money follows power. As for district conditions, we find that neither past electoral competition nor the competitiveness of the district as measured by population characteristics have an influence on contribution strategies. We strongly suspected that labor unions would be sensitive to these conditions, but the results suggest that contributions by these groups are not influenced by the competition faced by the incumbent. As for the state-level factors, no support was found for legislative professionalism. To the extent that legislators from professional legislatures more easily win re-election, such an effect is apparently due to other conditions beyond their ability to collect money from business and labor
11

organizations. Incumbents in a professional legislature are no better at attracting these contributions than incumbents running in a citizen legislature. The major independent variable of interest in the analysis, however, is campaign financing. Once we have controlled for an assortment of state and district-level variables we find that restrictions on campaign funding have a negative influence on incumbent contributions relative to challenger contributions. This condition has an effect on both labor and business organizations.
Conclusions The present analysis has considered a variety of factors thought to influence the contribution patterns of interest groups to candidates running for the state legislature. Through an examination of giving by labor organizations and business groups across 15 states we find that several incumbent-level factors play an influential role. An incumbent’s political party has a strong influence on the amounts received by particular groups – labor groups give more to Democrats and business groups give more to Republicans. Years of service and chamber leadership are also positively related to giving by both business and labor organizations. The voting records of legislators have an influence only on labor organizations and district characteristics (two different measures of electoral competition) have an influence on neither. Such findings demonstrate that contribution patterns to state legislative candidates are influenced by a number of factors. We expected to find a differential effect for many variables whereby factors representative of electoral strategies would predominate among labor contributions and those indicative of access strategies would be most prevalent among business groups. However, indicators of electoral strategy (political party) had a large role in business contributions and indicators of access strategy (years of service and chamber party leadership) were influential in labor contributions. The anticipated pattern was observed for only one indicator of electoral strategy – past voting record. This factor affected the contribution patterns of labor groups but had no influence on those made by business groups. The overall pattern to emerge from this is that business and labor groups both use a mixed strategy in contributing to state legislative candidates. Probably the most important and interesting finding to emerge from this analysis involves the influence of campaign finance laws. One of the major reasons for undertaking a comparative state analysis is to assess the influence of this important state-level feature. After taking into account candidate and district level features, do laws that set prohibitions and restrictions affect the amounts of money that incumbents and challengers raise? The results indicate very clearly that they do have such an influence and result in a reduced advantage for incumbent legislators relative to their challengers. The amounts of money that flow from both business and labor groups to incumbents are reduced by these limits and the result is a smaller disparity in challenger and incumbent funding.
These findings regarding the effects of campaign finance laws corroborate some of our earlier work showing that more restrictive laws reduce spending disparities between incumbents and challengers (Hogan 2000). These current findings indicate very clearly why this is the case–limits make it easier for challengers to raise money relative to incumbents from both business and labor organizations. Such findings provide a clearer picture of the causal process that results in particular funding patterns. These results may also have important practical implications regarding the role of campaign finance laws. These results strongly suggest that political reformers interested in reducing incumbent financing advantages may want to consider imposing greater limits on campaign
12

contributions. However, such a sweeping conclusion is probably immature until further tests are conducted using more sophisticated measures of campaign finance laws.
13
Bibliography Alexander, Herbert E. 1991. Reform and Reality: The Financing of State and Local Campaigns, New York:
Twentieth Century Fund Press. Barone, Michael, William Lilley, III, and Laurence J. DeFranco. 1998. Sate Legislative Elections: Voting
Patterns and Demographics, Washington, DC: Congressional Quarterly Press. Berry, William D., Michael B. Berkman, and Stuart Schneiderman. 2000. “Legislative Professionalism and
Incumbent Reelection: The Development of Institutional Boundaries,” American Political Science Review 94: 859-74.
Box-Steffensmeier, Janet M., and Jay K. Dow 1992. “Campaign Contributions in an Unregulated Setting: An
Analysis of the 1984 and 1986 California Assembly Elections,” Western Political Quarterly 45: 609-628. Carey, John M., Richard G. Niemi, and Lynda W. Powell. 2000. “Incumbency and the Probability of
Reelection in State Legislative Elections,” Journal of Politics 62: 671-700. Cassie, William E., and Joel A Thompson, 1998. “Patterns of PAC Contributions to State Legislative
Candidates,” in Campaign Finance in State Legislative Elections, eds. Joel A. Thompson and Gary F. Moncrief, Washington, DC: Congressional Quarterly Press.
Clucas, Richard A. 1992. “Legislative Leadership and Campaign Support in California,” Legislative Studies
Quarterly 17: 265-283. Denzau, Arthur, and Michael Munger. 1986. Legislators and Interest Groups: How Organized Interests Get
Represented,” American Political Science Review 80: 89-106. Evans, Diana. 1988. “Oil PACs and Aggressive Contribution Strategies,” Journal of Politics 50: 1047-1056.
Feigenbaum, Edward D., and James A. Palmer. 1998. Campaign Finance Law 1998: A
Summary of State Campaign Finance Laws, Washington, DC: Federal Election Commission. Feigenbaum, Edward D., and James A. Palmer. 2000. Campaign Finance Law 2000: A Summary of State
Campaign Finance Laws, Washington, DC: Federal Election Commission. Gopian, David J. 1984. “What Makes PACs Tick? An Analysis of the Allocation Patterns of Economic
Interest Groups,” American Journal of Political Science 28: 259-81. Grenzke, Janet. 1989. “Candidate Attributes and PAC Contributions,” Western Political Quarterly 42: 245-64. Grier, Kevin, and Michael Munger. 1986. “The Impact of Legislator Attributes on Interest Group Campaign
Contributions,” Journal of Labor Research 7: 349-61. Grier, Kevin, and Michael Munger. 1993. “Comparing Interest Group PAC Contributions to House and
Senate Incumbents, 1980-1986,” Journal of Politics 55: 615-53. Gross, Donald A., and Robert K. Goidel. 2003. The States of Campaign Finance Reform, Columbus: The State
University Press.
Herndon, James F. 1982. “Access, Record, and Competition as Influences on Interest Group Contributions to Congressional Candidates,” Journal of Politics 44: 996-1019.
14

Hogan, Robert E. 2000. “The Costs of Representation in State Legislatures: Explaining Variations in
Campaign Spending” Social Science Quarterly, Vol. 81: 941-956. Koetzle, William. 1998. “The Impact of Constituency Diversity upon the Competitiveness of
U.S. House Elections, 1962-1996,” Legislative Research Quarterly 23:561-573. Jones, Ruth. 1984. “Financing State Elections,” In Money and Politics in the United States: Financing Elections in
the 1980s, Michael J. Malbin (ed.), Chatham, NJ: Chatham House. Jones, Ruth S., and Thomas J. Borris. 1985. “Strategic Contributing in Legislative Campaigns,” Legislative
Studies Quarterly 10 (February): 89-105. Malbin, Michael J., and Thomas L. Gais. 1998. The Day After Reform: Sobering Campaign Finance Lessons from
the American States, New York: Rockefeller Institute Press. Michaelson, Ronald D. 2001. “Campaign Finance Activity in the States: Where the Action Is,” Public Integrity,
Winter: 33-51. Poole, Keith T., and Thomas Romer. 1985. “Patterns of Political Action Committee Contributions to the
1980 Campaigns for the U.S. House of Representatives,” Public Choice 47: 63-112. Romer, Thomas, and James M. Snyder, Jr. 1994. “An Empirical Investigation of the Dynamics of PAC
Contributions,” American Journal of Political Science 38: 745-69. Rudolph, Thomas J. 1999. “Corporate and Labor PAC Contributions in House Elections: Measuring the
Effects of Majority Party Status,” Journal of Politics 61: 195-206. Schultz, David. 2002. Money, Politics, and Campaign Finance Reform Law in the States, Durham, Carolina
Academic Press.
Squire, Peverill. 2000. “Uncontested Seats in State Legislative Elections,” Legislative Studies Quarterly, 25: 131- 146.
Thompson, Joel A., and Gary F. Moncrief. 1998. Campaign Finance in State Legislative Elections, Washington,
DC: Congressional Quarterly Press. Thompson, Joel A., William E. Cassie, and Malcolm E. Jewell. 1994. “A Sacred Cow or Just a Lot of Bull?:
The Impact of PAC and Party Funds in State Legislative Elections,” Political Research Quarterly 47: 223-37.
Thompson, Joel A., and William E. Cassie. 1992. “Party and PAC Contributions to North Carolina State
Legislative Candidates,” Legislative Studies Quarterly 17: 409-416. Wilcox, Clyde. 1989. “Organizational Variables and Contribution Behavior of Large PACs: A Longitudinal
Analysis,” Political Behavior 11: 157-176. Witko, Christopher. 2005. “Measuring the Stringency of State Campaign Finance Regulation,” State Politics
and Policy Quarterly 5: 295-310. Wright, John. 1985. PACs, Contributions, and Roll Calls: An Organizational Perspective, American Political
Science Review 79: 400-14.
15

Table 1
Relative Levels of Total Funding and Contributions from Business and Labor Sources for State Legislative Candidates in 15 States
(Average contributions in dollars for the 1998 and 2000 elections)
Total Contributions
Business Contributions
Labor Contributions
N= Incumbents Challengers Incumbents Challengers Incumbents Challengers Alaska 35 53,881 37,802 21,351 6,122 5,064 1,945 California 91 780,384 116,939 230,428 11,829 98,430 11,150 Colorado 50 27,895 12,251 10,820 1,598 1,349 889 Florida 61 181,092 69,911 105,996 13,132 7,235 4,996 Georgia 48 48,783 25,321 22,395 5,100 1,187 610 Iowa 98 49,632 23,161 20,023 1,581 2,818 2,596 Idaho 26 15,216 6,256 7,409 447 988 1,259 Illinois 94 318,130 86,916 113,366 5,937 42,535 7,377 Indiana 100 74,956 36,710 26,640 9,008 16,445 3,536 Kentucky 62 37,891 14,188 13,530 2,190 3,438 477 Maine 163 6,682 4,650 2,306 885 238 150 Michigan 129 59,816 13,629 22,855 1,224 4,191 1,907 Minnesota 106 23,626 16,294 1,381 845 1,291 482 Missouri 134 38,213 16,754 18,776 2,622 2,725 2,138 New Mexico 56 34,472 21,420 14,928 4,312 1,546 637
16
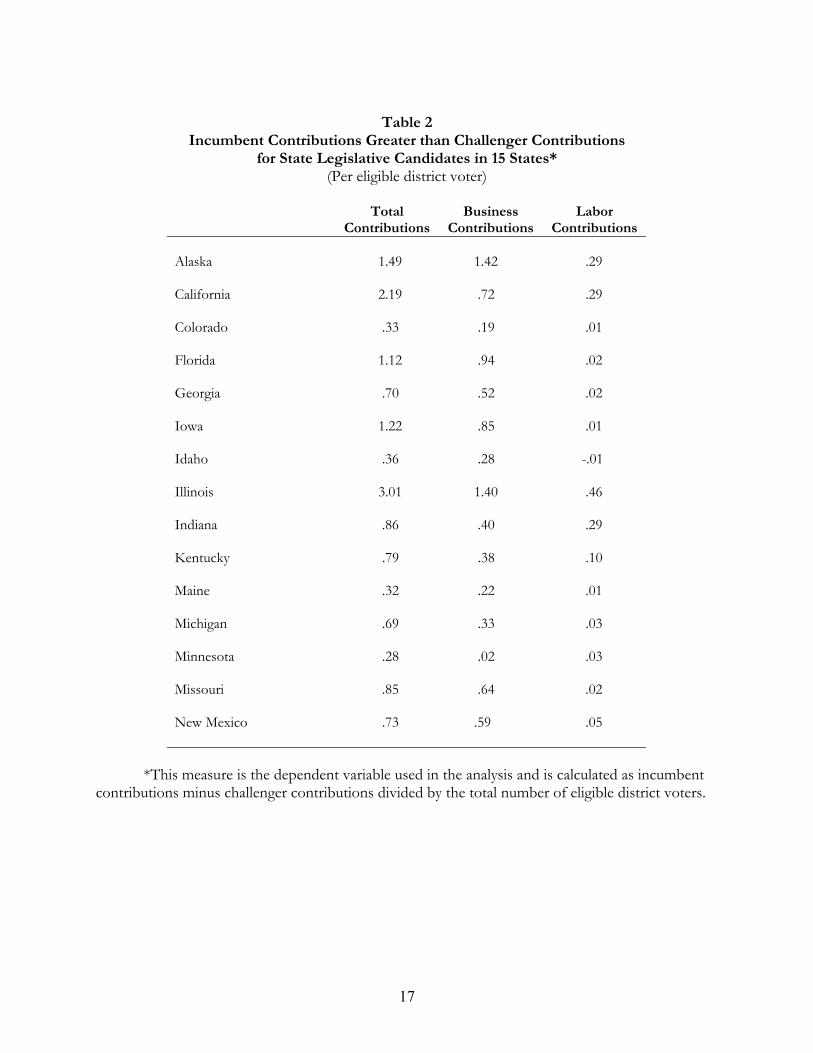
Table 2
Incumbent Contributions Greater than Challenger Contributions for State Legislative Candidates in 15 States*
(Per eligible district voter)
Total Contributions
Business Contributions
Labor Contributions
Alaska 1.49 1.42 .29 California 2.19 .72 .29 Colorado .33 .19 .01 Florida 1.12 .94 .02 Georgia .70 .52 .02 Iowa 1.22 .85 .01 Idaho .36 .28 -.01 Illinois 3.01 1.40 .46 Indiana .86 .40 .29 Kentucky .79 .38 .10 Maine .32 .22 .01 Michigan .69 .33 .03 Minnesota .28 .02 .03 Missouri .85 .64 .02 New Mexico .73 .59 .05
*This measure is the dependent variable used in the analysis and is calculated as incumbent contributions minus challenger contributions divided by the total number of eligible district voters.
17
18
Table 3
OLS Regression Analyses of Factors Influencing Total Contributions by Business and Labor Organizations to State Legislative Candidates (Un-standardized coefficients, standardized coefficients in parentheses)
Business
Contributions Labor
Contributions
Incumbent-Level Factors Political Party
-.465*** (-.163)
.218*** (.191)
Majority Party Status
.119 (.041)
.007 (.006)
Years of Service
.045*** (.173)
.007** (.072)
Chamber Party Leader
3.041*** (.385)
.753*** (.238)
Conservative Voting Record
-.012 (-.008)
-.057* (-.099)
District-Level Conditions Past Electoral Competition
.001 (.000)
.001 (.034)
Demographic Competition
-.001 (-.001)
.001 (.002)
State-Level Factors Legislative Professionalism
.390 (.043)
.058 (.016)
Campaign Finance Laws
-.414*** (-.115)
-.204*** (-.141)
Presidential Election Year (2000)
.064 (.022)
.028 (.025)
Constant .634*** .044 N = 1,245 1,245 Adjusted R2 = .233 .180
* p < .05; ** p <.01; *** p < .001