Embed Size (px)
Citation preview

FACTORS AFFECTING DIFFUSION OF PRODUCT
INNOVATION IN MEDIUM SIZED MANUFACTURING
ENTERPRISES IN KENYA
BY
BETTY MBAYA
UNITED STATES INTERNATIONAL UNIVERSITY -
AFRICA
SUMMER 2017

FACTORS AFFECTING DIFFUSION OF PRODUCT
INNOVATION IN MEDIUM SIZED MANUFACTURING
ENTERPRISES IN KENYA
BY
BETTY MBAYA
A Research Project Report Submitted to the Chandaria School of
Business in Partial Fulfillment of the Requirement for the Degree of
Master in Business Administration (MBA)
UNITED STATES INTERNATIONAL UNIVERSITY -
AFRICA
SUMMER 2017

ii
STUDENT’S DECLARATION
I, the undersigned, declare that this is my original work and has not been submitted to any
other college, institution or university other than the United States International
University - Africa in Nairobi for academic credit.
Signed: ________________________ Date: _____________________
Betty Makena Mbaya (ID No. 625692)
This project has been presented for examination with my approval as the appointed
supervisor.
Signed: ________________________ Date: _____________________
Prof. George O. K’Aol
Signed: _______________________ Date: _____________________
Dean, Chandaria School of Business

iii
COPYRIGHT
© Betty Makena Mbaya (2017). All rights reserved. No part of this project may be copied
or reproduced in any form or by any means of electronic, photocopying or printing
without the prior written consent of the author.
iv
ABSTRACT
The purpose of this study was to identify factors affecting diffusion of product innovation
in medium sized manufacturing enterprises in Kenya. The study was guided by the
following research questions: How does relative advantage affect diffusion of product
innovation in medium sized manufacturing enterprises in Kenya? How does compatibility
affect diffusion of product innovation in medium sized manufacturing enterprises in
Kenya? How does complexity affect diffusion of product innovation in medium sized
manufacturing enterprises in Kenya?
A descriptive correlation research design was used to conduct the study. The population
comprised of 108 top 100 medium sized enterprises in the manufacturing sector between
year 2008 and 2016. Stratified random sampling was adopted to select a sample of 102
manufacturing enterprises from the 108 total population. A questionnaire was used to
collect data. Data was analyzed using descriptive statistical techniques such as mean and
standard deviation whereas inferential techniques used included Spearman’s Rank
Correlation, One way Analysis of Variance (ANOVA) and linear regression. Statistical
Package for the Social Sciences (SPSS) was used as a data analysis tool. Thereafter, the
data was presented in tables and figures.
Findings on the effect of relative advantage on diffusion of product innovation among
medium sized manufacturing enterprises revealed that male respondents who agreed that
relative advantage had an effect on the diffusion of product innovation accounted for 37%
while that of female respondents accounted for 30%. Findings from Spearman Rank
Correlation test indicated that there was a statistically significant positive correlation
between relative advantage and product innovations that are perceived to be more cost
effective diffuse faster among medium sized manufacturing enterprises, r(95) = .188, p <
.05. One Way ANOVA results revealed that there was a statistically significant difference
by gender F(1, 94) = 4.10, p < .05 and the years of enterprise existence F(1, 94) = 5.56, p
< .05. Linear regression analysis indicated that relative advantage explained 67.3% of the
variability on the spread of product innovation among medium sized manufacturing
enterprises, R2= .673 and statistically significantly predicted the spread of product
innovation, F(1, 94) =15.28, p < .05.

v
Findings on the effect of compatibility on diffusion of product innovation among medium
sized manufacturing enterprises, revealed the proportion of female respondents who
strongly agreed that compatibility had an effect on the diffusion of product innovation
accounted for 47% while male respondents accounted for 29%. Spearman Rank
Correlation test showed that compatibility was strongly correlated to technological
innovation, r(95) = .235, p < .05 and lifestyles or cultures, r(95) = .213, p < .05 on the
diffusion of product innovation among medium sized manufacturing enterprises. One
Way ANOVA revealed that there was a statistically significant difference by gender F(1,
95) = 5.67, p < .05. The linear regression analysis indicated that compatibility explained
54.4% of the variability in diffusion of product innovation among medium sized
manufacturing enterprises, R2= 0.54 and statistically significantly predicted the spread of
product innovation among the medium sized manufacturing enterprises, F(1, 94) = 16.12,
p < .05.
Findings on the effect of complexity on diffusion of product innovation among medium
sized manufacturing enterprises revealed that the proportion of female respondents who
agreed that complexity had an effect on the diffusion of product innovation accounted for
37% while male respondents accounted for 30%. Spearman Rank Correlation test showed
that complexity was significantly correlated to clear communication, r(95) = .163, p < .05
on the diffusion of product innovation among medium sized manufacturing enterprises.
The results from One Way ANOVA test indicated that there was a statistically significant
difference by years of enterprise existence F(1, 95) = 4.56, p < .05. The linear regression
analysis indicated that complexity explained 52.2% of the variability in diffusion of
product innovation among medium sized manufacturing enterprises, R2= 0.52 and
statistically significantly predicted the spread of product innovation among medium sized
manufacturing enterprises, F(1, 94) = 13.69, p < .05.
The research concluded that relative advantage based on job effectiveness and
convenience affected diffusion of product innovation. The study recommends
manufacturing enterprises should establish unique and convenient product innovation
strategies to tap in the market as well as perceive ease of use of innovative products as
powerful in explaining satisfaction of customer needs and wants. The study suggests
further research should be conducted to investigate the impact of access to diffusion of
product innovation on the growth of medium sized manufacturing enterprises in Kenya.

vi
ACKNOWLEDGEMENTS
First and foremost, I would like to thank God for the gift of life and good health
throughout the study period. Secondly, I would like to thank my supervisor Prof. George
K’Aol for his guidance and mentorship when conducting this study. Thirdly, I would like
to thank the top 100 Medium Sized Manufacturing Enterprises in Kenya who took time to
respond to my questionnaires. Finally, I thank my family and friends who supported and
encouraged me throughout my studies.

vii
DEDICATION
To my family for their encouragement and support throughout my studies.

viii
TABLE OF CONTENT
STUDENT’S DECLARATION ........................................................................................ ii
COPYRIGHT ....................................................................................................................iii
ABSTRACT ....................................................................................................................... iv
ACKNOWLEDGEMENTS ............................................................................................. vi
DEDICATION.................................................................................................................. vii
LIST OF ABBREVIATIONS ........................................................................................... x
LIST OF TABLES ............................................................................................................ xi
LIST OF FIGURES ........................................................................................................xiii
CHAPTER ONE ................................................................................................................ 1
1.0 INTRODUCTION ........................................................................................................ 1
1.1 Background of the Problem ........................................................................................... 1
1.2 Statement of the Problem ............................................................................................... 3
1.3 Purpose of the Study ...................................................................................................... 5
1.4 Research Questions ........................................................................................................ 5
1.5 Importance of the Study ................................................................................................. 5
1.6 Scope of the Study ......................................................................................................... 6
CHAPTER TWO ............................................................................................................... 9
2.0 LITERATURE REVIEW ........................................................................................... 9
2.1 Introduction .................................................................................................................... 9
2.2 Effects of Relative Advantage on Diffusion of Product Innovation .............................. 9
2.3 Effects of Compatibility on Diffusion of Innovation ................................................... 14
2.4 Effects of complexity on Diffusion of Innovation ....................................................... 19
2.5 Chapter Summary ........................................................................................................ 24
CHAPTER THREE ......................................................................................................... 25
3.0 RESEARCH METHODOLOGY ............................................................................. 25
3.1 Introduction .................................................................................................................. 25
3.2 Research Design........................................................................................................... 25
3.3 Population and Sampling Design ................................................................................. 26
3.4 Data Collection Methods ............................................................................................. 29
3.5 Research Procedures .................................................................................................... 29
3.6 Data Analysis ............................................................................................................... 30
3.7 Chapter Summary ........................................................................................................ 31
ix
CHAPTER FOUR ............................................................................................................ 32
4.0 RESULTS AND FINDINGS ..................................................................................... 32
4.1 Introduction .................................................................................................................. 32
4.2 Demographic Information ............................................................................................ 32
4.3 Effects of Relative Advantage on the Spread of Product Innovation among Medium
Sized Manufacturing Enterprises ....................................................................................... 35
4.4 Effects of Compatibility on the Spread of Product Innovation among Medium Sized
Manufacturing Enterprises ................................................................................................. 41
4.5 Effects of Complexity on the Spread of Product Innovation among Medium Sized
Manufacturing Enterprises ................................................................................................. 47
4.6 Chapter Summary ........................................................................................................ 53
CHAPTER FIVE ............................................................................................................. 55
5.0 SUMMARY, DISCUSSION, CONCLUSIONS AND RECOMMENDATION ... 55
5.1 Introduction .................................................................................................................. 55
5.2 Summary ...................................................................................................................... 55
5.3 Discussion .................................................................................................................... 57
5.4 Conclusions .................................................................................................................. 61
5.5 Recommendations ........................................................................................................ 62
REFERENCES ................................................................................................................. 65
APPENDICES .................................................................................................................. 71
APPENDIX 1: COVER LETTER .................................................................................. 71
APPENDIX 2: QUESTIONNAIRE................................................................................ 72
APPENDIX 3: TOP 100 MEDIUM SIZED MANUFACTURING ENTERPRISES.76

x
LIST OF ABBREVIATIONS
SME Small and Medium Sized Enterprise
SPSS Statistical Package for the Social Sciences
US United States
xi
LIST OF TABLES
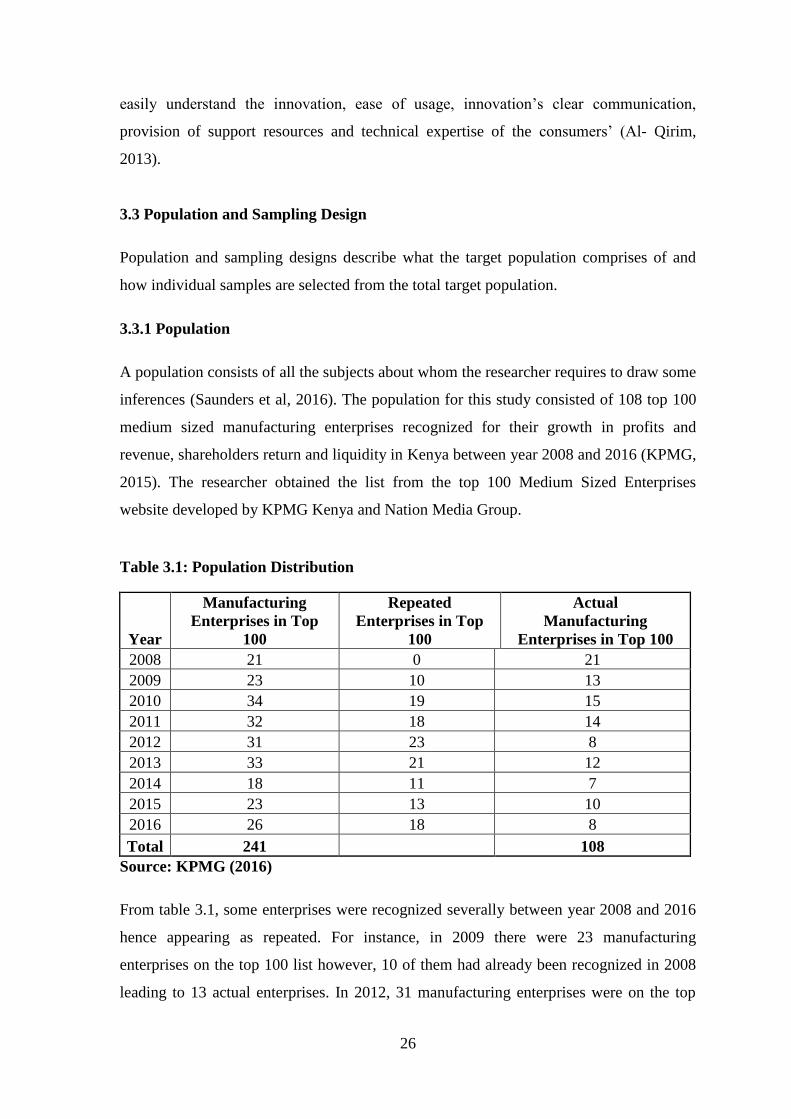
Table 3.1: Population Distribution ..................................................................................... 26
Table 3.2: Sample Size Distribution…………………………………………………….. 29
Table 4.1: Descriptive Statistics for the Effects of Relative Advantage on Diffusion of
Product Innovation among Medium Sized Manufacturing Enterprises………………… 36
Table 4.2: Cross Tabulation of the Effects of Relative Advantage on the Spread of
Product Innovation among Medium Sized Manufacturing Enterprises by Gender…….. 37
Table 4.3: Correlation between Relative Advantage and Product Innovation among
Medium Sized Manufacturing Enterprises……………………………………………… 38
Table 4.4 ANOVA between Effect of Relative Advantage and Product Innovation among
Medium Sized Manufacturing Enterprises by Gender, Designation and Years of
Enterprise Existence........................................................................................................... 39
Table 4.5 (a): Model Summary .......................................................................................... 40
Table 4.5 (b): ANOVA ...................................................................................................... 40
Table 4.5 (c): Coefficient ................................................................................................... 41
Table 4.6: Descriptive Statistics for the Effects of Compatibility on the Spread of Product
Innovation among Medium Sized Manufacturing Enterprises ......................................... 42
Table 4.7: Cross Tabulation of the Effects of Compatibility on the Spread of Product
Innovation among Medium Sized Manufacturing Enterprises .......................................... 43
Table 4.8: Correlation between Compatibility and Product Innovation among Medium
Sized Manufacturing Enterprises ....................................................................................... 44
Table 4.9: ANOVA between Effect of Compatibility and Product Innovation among
Medium Sized Manufacturing Enterprises by Gender, Designation and Years of
Enterprise Existence........................................................................................................... 45
Table 4.10 (a): Model Summary ........................................................................................ 46
Table 4.10 (b): ANOVA .................................................................................................... 46
Table 4.10 (c): Coeffiecient ............................................................................................... 47
Table 4.11 Descriptive Statistics for the Effects of Complexity on the Spread of Product
Innovation among Medium Sized Manufacturing Enterprises .......................................... 48
Table 4.12 Cross Tabulation of the Effect of Complexity on the Spread of Product
Innovation among Medium Sized Manufacturing Enterprises by Gender ........................ 49
Table 4:13 Correlation between Complexity and Product Innovation among Medium
Sized Manufacturing Enterprises ....................................................................................... 50

xii
Table 4.14: ANOVA between Effects of Complexity and Product Innovation among
Medium Sized Manufacturing Enterprises by Gender, Designation and Years of
Enterprise Existence........................................................................................................... 51
Table 4.15 (a): Model Summary ........................................................................................ 52
Table 4.15 (b): ANOVA .................................................................................................... 52
Table 4.15 (c): Coefficient ................................................................................................. 53
xiii
LIST OF FIGURES
Figure 4.1: Distribution of Respondents by Gender .......................................................... 33
Figure 4.2: Distribution of Respondents by Age .............................................................. 33
Figure 4.3: Distribution of Respondents by Designation................................................... 34
Figure 4.4: Distribution of Respondents by Highest Education Level .............................. 34
Figure 4.5: Distribution of Respondents by Years of Enterprise Existence ...................... 35
Figure 4.6: Cross Tabulation for the Effects of Relative Advantage on the Spread of
Product Innovation among Medium Sized Manufacturing Enterprises by Gender ........... 37
Figure 4.7: Cross Tabulation for the Effect of Compatibility on the Spread of Product
Innovation among Medium Sized Manufacturing Enterprises by Gender ........................ 43
Figure 4.8: Cross Tabulation for the Effects of Complexity on the Spread of Product
Innovation among Medium Sized Manufacturing Enterprises by Gender ........................ 49
1
CHAPTER ONE
1.0 INTRODUCTION
1.1 Background of the Problem
The failure rate for a substantial number of new product innovations in the market place
has been on a high rise, causing a major concern among business owners, managers and
market researchers. Specifically, medium sized manufacturing enterprises have been the
most affected yet; the long term survival for these enterprises being dependent on their
new products success (Nejad, Sherrell & Babakus, 2014). According to Barczak, Griffin
and Kahn (2012) new products account to 28% of manufacturing enterprises sales and
profits yet about 41% of the all the new products fail in the market. Innovations play a
critical role in the development of manufacturing enterprises. However, despite, the
widespread recognition of the important roles that product innovations play in most
economies, relatively little research has been focused on the integrated aspects of
developing products in the context of medium sized enterprises and understanding why
innovations fail and succeed (Ansari, Reinecke & Span, 2014).
Medium sized enterprises have been indicated to be the most ambiguous influencing
factors in the diffusion literature (Bulte, 2012). Studies investigating the impact of
business size on the diffusion of product innovations have produced mixed results
influencing factors in the diffusion literature. For the past years, many governments have
developed policies incentives focusing on the important role they play in economic
development in order to enhance effective diffusion of their innovations in the market
place (Hilbert, 2013).
Literature on diffusion indicates there are significant differences in emphasis regarding
the impact of influential factors on the diffusion of innovations with some researchers
giving more attention to the characteristics of the innovation and those of the adopting
firms, including size, whereas other researchers have given relatively more emphasis to
the society, economy, and communication or information flow process (Ashtianiapouri &
Zandhessame, 2015). The type of innovations, interaction between the influencing
factors, importance and the influence of factors responsible for the diffusion of an
innovation keep changing giving added advantage to some innovations that might not

2
have been diffused, and reduce the importance of other innovations associated with a
specific social, economic, geographical and institutional situation within which successful
diffusion would have occurred (Tanev & Frederiksen, 2014).
A number of innovation researchers have maintained that for diffusion to take place
particular factors such as innovation attributes are best predictors of the rate of diffusion
(Rogers 2003; Hassan, Mourad & Tolba, 2013). Research conducted by Straub (2014) to
evaluate the time taken for a product to be adopted in the market, concluded that the rate
of diffusion was influenced by macroeconomics, microeconomics and demographic
factors relating to the product attributes of the innovation. Several other researchers have
studied the diffusion theory and tested it across various countries and industries
concluding innovation attributes are a major predictor of diffusion (Bulte, 2012). A
number of models have been developed to evaluate diffusion and one of the possible
reasons for the failure rates has been inappropriate application of the diffusion model
(Hassan et al, 2013). Clearly, these researches indicate innovation attributes are an
important consideration for diffusion and adoption of product innovations.
This study utilized Rogers (2003) diffusion of innovation theory which focuses on the
process of diffusion after an observation that potential adopters assess innovation
attributes of the products; these attributes include relative advantage, compatibility,
complexity, trial ability, and observe ability. Relative advantage focuses on innovation
additional benefits; compatibility focuses on innovation compliance with customers
existing values; complexity focuses on the ability to understand and use the innovation
whereas trial-ability focuses on the extent of product to be experimented and lastly,
observe-ability focuses on visibility of the innovation results to others (Straub, 2014).
This research focused on relative advantage and complexity which represent the
functional aspect of a product innovation and, compatibility which represent the social
dimension of the product innovation.
There are profound implications that product innovations attributes give competitive
advantage to manufacturing firms in developing countries (Wanyoike, Waititu & Mukulu,
2012). For instance, in the US, the economics of automobile assembly have been
transformed by exploiting diffusion of innovation systems in product development,
engineering, flexible manufacturing, distribution and marketing focusing on relative
advantages such as cost, quality and lead time advantages to increase their diffusion rate.

3
New product innovation advantages over the previous innovation are becoming very
important that industrialized country manufacturers are being forced to adopt these
practices by ensuring the new product benefits surpass the previous innovations to survive
in the market (Flight, Allaway, Kim & D’Souza, 2013).
According to Leoni (2013) mass production which has been a dominant manufacturing
concept in the industrialization of the twentieth century is being replaced by “lean
production” methods, which are highly advantageous, information and communication
intensive, with the future concept being viewed as mass customization. These methods
are spreading among industries and, unevenly, across countries. Regionally, industries
and countries which have adopted these methods, their factor productivity is believed to
have increased as a result of working capital, inventory reductions and increased asset
utilization through flexible and integrated diffusion of innovation hence developing more
innovative products.
It is argued that diffusion of product innovation is influencing the flow of foreign
investments and trade, as it changes both the production and management functions.
Locally, it tends to encourage decentralization and specialization of the production
function, by lowering the minimum efficient size of production units (Wang, 2011).
Simultaneously, it tends to enhance integration and economies of scope, and reduce the
size of the management structure, by reducing the costs of coordination and control.
1.2 Statement of the Problem
Over the years diffusion of innovation researches have produced a number of findings,
which have been summarized by many writers. However, these research summaries have
been programmatic rather than theoretical in nature and lack of theoretical work in these
studies has recognized there exists a real need for more general research related to the
field to be conducted (Rogers, 2003).
Innovation is recognized as a critical component of industrialization in developing
countries and more so in Medium Sized Enterprises (Brunswicker & Vanhaverbeke,
2014). Product Innovation, one of the most important aspects of innovation, is a critical
and vital key to the economic development and ignoring this aspect has led to the failure
of many companies and organizations (Ashtianipouri & Zandhessame, 2015). Globally,

4
according to Zhou and Wu (2014) investigation on diffusion of innovations in various
industries concluded, diffusion of product innovations in manufacturing enterprises was
slow and particularly in developing countries where these enterprises were considered to
be very important in developing the economy by immensely contributing to the country’s
gross domestic product (GDP) and offering employment. From the study, they
recommended more investigation to be carried out in identifying factors that influenced
diffusion and adoption of product innovations in manufacturing enterprises in developing
countries.
Barczak et al. (2012) study on the drivers of new product development accounted the
failure rate of new products in the markets place to be 41%, which was considered high
begging the question why the failure rate is so high. As a result, the research findings
noted a connection between the product characteristics and the new product failure rate.
This research recommended future researches to be conducted on the various factors that
affected new products diffusion in the market and more so what characteristics consumers
considered before purchasing any products.
Regionally, a number of researches have theoretically and emphatically investigated the
influence of lead users on the innovation process towards modifying an existing product
and enhancing its spread (Hassan et al, 2013). It is argued that new product modifications
help enterprises reduce risk of failure in the market. However, there is need to find out the
specific product modifications consumers look out for in enhancing acceptance and
reducing market failure. Additionally, Kalliny and Hausman (2014) study on influence of
lead users on diffusion of innovations noted there are other factors such as
communication, product attributes and cultural factors that influenced diffusion which
future researches should focus on to enhance new products innovation market success.
Mourad and Tolba (2014), study on how culture affected diffusion of innovation in
Egyptian medium enterprises, concluded culture had a major impact on diffusion of
product innovation as users were more likely to adopt innovations that were compatible
with their lifestyles and practices. Additionally, they noted different consumers had
different attribute preferences they were interested in when it came to choosing products
innovation which affected diffusion of innovations. From this study, the researchers
recommended further studies to be carried out on the impact individual cultures had on

5
the product innovation features in order to enhance diffusion and adoption of innovation
by consumers.
Based on the concerns outlined, product innovation attributes are a consideration for
diffusion of innovation Rogers (2003), and there is a need to conduct more studies
focusing on innovation attributes effect on diffusion of product innovation among
medium sized manufacturing enterprises in Kenya. Therefore, this study focused on
establishing what ignited diffusion of product innovation in manufacturing enterprises.
This is because the result of diffusion of their innovations is the overall knowledge of
their capabilities and skills to ensure they remain as the top 100 manufacturing enterprises
in Kenya by producing products that easily spread in the market (Wanyoike et al, 2012).
1.3 Purpose of the Study
The purpose of the study was to determine factors affecting diffusion of product
innovation in medium sized manufacturing enterprises in Kenya.
1.4 Research Questions
The study was guided by the following research questions:
1.4.1 How does relative advantage affect the diffusion of product innovation in medium
sized manufacturing enterprises?
1.4.2 How does compatibility affect the diffusion of product innovation in medium
sized manufacturing enterprises?
1.4.3 How does complexity affect the diffusion of product innovation in medium sized
manufacturing enterprises?
1.5 Importance of the Study
The findings of a research are not only useful to the researcher but also to other group of
stakeholders. This study will be important to the following stakeholders:
1.5.1 Medium Sized Enterprises
The results of the study would provide an incentive for the medium sized enterprises and
shareholders to develop appropriate interventions with the potential to enhance uptake of
innovation in a cost effective manner. It is important for medium sized enterprises to

6
develop products that are going to be successful in the market by ensuring they spread at
a higher rate and be adopted.
1.5.2 Policy Makers and Government
An understanding of the determinants of diffusion of innovation would be critical in
designing policies and interventions that would help providers to deliver appropriate
innovations that would be more attractive to potential consumers. Product innovations are
increasingly being recognized as a key component of growth in the medium sector; hence
policy formulation arising from the results of this study would guide the government,
especially the Ministry of Trade and Ministry of Information, Communication and
Technology in instituting reforms that would make investment in the innovation more
attractive.
1.5.3 Researchers and Academicians
This study finding would provide a theoretical and empirical framework for research in
the area of product diffusion within this key sector of the Kenyan economy. Academics
and students alike will find the study methodology and subsequent results rich enough to
guide future research. Further, the study will act as an impetus to reignite interest in this
critical area of study.
1.6 Scope of the Study
The study focused on medium sized manufacturing enterprises in Kenya. The total
population of the study was 108 Top 100 medium sized enterprises in Kenya. The study
was conducted in 2 weeks’ time in the month of July.
1.7 Definition of the Terms
1.7.1 Diffusion
Diffusion is a type of communication that is concerned with the spread of new ideas. It is
the process by which an innovation is communicated among the members of a social
system through certain channels over time (Rogers, 2003).

7
1.7.2 Adoption
Rogers (2003) defines adoption as the use of an innovation at its best for any actions
available.
1.7.3 Innovation
Schilling (2013) defines innovation as the implementation of an idea into a new process
or device. Innovation can also be defined as an idea or object individuals or other units of
adoption perceived as new (Rogers, 2003).
1.7.4 Technology
It is a branch of knowledge that focuses on development and utilization of technical
means and their interaction with the society, environment and life by drawing upon
subjects such as engineering, applied science, industrial arts and pure science (Smith,
2012).
1.7.5 Medium Sized Enterprise
According to the Government of Kenya Medium Sized Enterprise Act (2015) a Medium
Sized Enterprise is a firm, trade, service, industry or business activity whose annual
turnover is over 150 million and employs between 50 to 99 people.
1.7.6 Relative Advantage
Rogers (2003) defines relative advantage as the extent to which an innovation is
perceived to be better than the ideas it takes over from or the degree to which an
innovation is perceived to be more cost effective, convenient, and efficient or improves
existing applications and practices.
1.7.7 Compatibility
Compatibility is the extent to which an innovation is perceived to be consistent with
potential adopters past experiences, needs and values (Rogers, 2003).

8
1.7.8 Complexity
According to Rogers (2003), complexity is the extent to which an innovation is perceived
as complicated to understand and use.
1.8 Chapter Summary
This chapter introduced the background of the study and the problem statement.
Additionally, it described the scope under which the study was undertaken and stated the
research questions that were used to carry the study on; factors affecting diffusion of
product innovations in medium sized manufacturing enterprises in Kenya. Finally, the
various terminologies used were defined. Chapter two provided a detailed literature on
effects of innovation attributes in relation to diffusion of product innovation in
manufacturing enterprises in Kenya whereas Chapter three presented the detailed
methodology that was utilized in this study. Chapter four presented findings of the
research and interpreted date whereas chapter five analyses and discusses findings
drawing conclusions and recommendations for future studies.

9
CHAPTER TWO
2.0 LITERATURE REVIEW
2.1 Introduction
This chapter presents literature review on the factors that affect diffusion of product
innovation in medium sized manufacturing enterprises in Kenya. The factors are
discussed on the basis of the research questions. Firstly, it discusses effects of relative
advantage on diffusion of product innovation secondly, effects of compatibility on
diffusion of product innovations and thirdly, effects of complexity on diffusion of product
innovations.
2.2 Effects of Relative Advantage on Diffusion of Product Innovation
This section addresses the effects of relative advantage on the diffusion of product
innovation in medium sized manufacturing enterprises in Kenya. The elements discussed
include job effectiveness, economic profitability, time, cost, effort, convenience and
efficiency.
The relative advantage of a product innovation has a direct positive relation with how the
innovation spreads in the market. Zhai (2011) notes that the greater the perceived relative
advantage to the consumers the faster the product innovation spreads in the market. Wang
(2011) adds product innovations with additional relative advantages are easily adopted.
Rogers (2003) suggests innovations that are clearly unambiguous and advantages surpass
previous innovations easily spread in the market and are easily adopted. Wanyoike et al.
(2012) argues if no relative advantage is perceived by a potential consumer in using the
product, it will not diffuse in the market appropriately.
Relative advantage can be measured in economic terms, social prestige, convenience,
satisfaction, saving time and effort, economic profitability, cost reduction, and increased
production. Based on the above advantages it is evident, the most important determinant
of a new product spreading in the market place is its additional benefits over the previous
product. To a great extent this happens where substitute older than the innovation exist
(Matlay & Weathead, 2013).
10
A new product relative advantage is one of the critical factors evaluated by consumers
when acquiring new products and, products that are of better quality and offer better
services have a high rate of spreading in the market (Tanev & Frederiksen, 2014).
According to Hung et al. (2010), manufacturing enterprises can build customers trust and
satisfaction on new products by ensuring all new products have a relative advantage in
order to enhance success in the market.
2.2.1 Job Effectiveness
Manufacturing enterprises can distinguish themselves from competitors by ensuring their
new products have the latest innovations which are considered to positively affect a firm
(Damanpour et al, 2014). A research conducted by Ismail and Mamat (2012) found out
that there was a need for companies to clearly define their product adoption strategies
while developing new products to enhance job effectiveness and ensure successful
diffusion. Sawada, Matsuda and Kimura (2012) add that productivity paradox caused by
poor management of resources, measurement errors and profit redistribution can be
avoided with proper implementation of production strategies in manufacturing
enterprises. Additionally, other scholars provide empirical evidence that product
innovations in the manufacturing industry provide opportunities for companies to increase
job efficiency hence gaining competitive advantage (Leoni, 2013).
According to Paunov (2013) medium sized enterprises are the backbone of modern
market economies and play a key role in driving sustainable economy in developing
countries. Kozak (2011) adds product innovations that are deemed to enhance job
effectiveness are easily diffused in the market place, which ensures medium sized
enterprises grow three times faster and products reach the targeted market at a higher rate.
Hung, Tsai and Jiang (2010) add product innovations that provide better quality solutions
enhancing consumers’ job effectiveness have a higher chance to diffuse in the market
and, trust, commitment and customers’ satisfaction of these quality products can be
maintained by continuous production of competitive products that provide total solutions
to customers and partners.
2.2.2 Economic Profitability
Innovations that are deemed to profit the consumers enhance productivity and economic
growth appear to spread easily (Oliveira & Martins, 2011). Evidence on diffusion by Hall
11
(2011), suggests that products innovation have a significant effect on revenue and
productivity of a firm. Lu, Quan and Cao (2013) add that innovations act as a catalyst for
economic power status because if new innovations are perceived to have additional
benefits to enhance the lives of consumers they spread beyond business environment
expectations at a very high rate.
According to Tanev and Frederiksen (2014) there are many factors that influence success
or failure of manufacturing firms in their attempt to be competitive. Amongst them
product innovations are deemed to have an effective notion playing a significant role in
enhancing the competitiveness of the company. Undoubtedly, the ultimate goal of any
business is to achieve greater profits which can only be possible when they are on the
road to success in competitive situations by offering competitive products (Bulte, 2012).
Identification of the different aspects of competitiveness, on the one hand, and familiarity
with concepts such as product innovation and its many dimensions including spread, on
the other hand can help managers to be more effective in leading the manufacturing
processes thus enhancing firms’ profitability (Ashtianipouri & Zandhessame, 2015).
Globalization has made medium sized enterprises to manufacture products that have
greater relative advantage in order to survive in the competitive world. Relative
advantage has exceeded its role as being just a support tool in helping medium enterprises
gain competitive advantage and being more profitable over their large counterparts
(Ahmed, Shahzad, Umar & Khilji, 2013). With time product innovation diffusions are
increasing as manufacturing enterprises are realizing their value in the market. Migiro
(2016) adds that adoption of medium sized enterprises innovations enable them to
compete in the global market, improve their efficiency and close the relationship gap
between customers and suppliers.
Nejad et al. (2014) argues that an important factor in explaining the slowness of product
innovation spread is the fact that relative advantage of the new products is frequently
rather small and does not profit the consumer in any way when first introduced.
According to Nelson (2012) many authors have emphasized the need for companies to
manufacture products with additional relative advantage because as diffusion proceeds,
learning about benefits of the product takes place, innovation is advanced and adapted in
various enterprises hence making it attractive to various consumers. The implication of
manufacturing products with greater relative advantage is that benefits to adopters

12
increase over time; which will lead to decrease in cost and occurrence of faster diffusion
(Leoni, 2013).
2.2.3 Saving time, Cost and Effort
Development of product innovations with great capabilities using efficient technological
advancements can help organizations to keep prices of their products down hence creating
a competitive leverage and ensuring more consumers are able to save cost (Ashtianipouri
& Zandhessame, 2015). Study by Dixon, Parkin and Collins (2012) found out innovations
that enable the consumer to save more cost get to spread easily in the market. In
concurrence Egbetokun, Adeniyi, Siyanloba and Olamade (2012) adds that reduction of
taxes is likely to achieve the same results.
Adoption of new innovations is considered higher in developing countries and fast
delivery, technical capability, organization flexibility and, convenient after sale services
that save customers’ time and money can improve customers’ perception about the
product which end up improving their market diffusion (Gardner, 2013). The indirect
impact of the above factors can rise the expectations’ of the customers significantly
affecting the culture of manufacturing firms, causing them to innovate more in order to
produce more innovative products.
Relative advantage is an important determinant of product innovation adoption among
various consumers groups (Lu et al, 2013). It is expected that if various consumers
believe the product innovations will improve their job performance and save them cost
they would have a higher intention of adopting the new innovations (Gardner, 2013). The
extent of perception of the characteristics of the product as measures of saving time and
effort has a significant influence on innovation acceptance (Wang, 2011). Cost of the
product innovation is an important influencing factor in the diffusion and adoption of a
product. Additionally, gender plays a key role in diffusion of product innovation as
women tend to adopt products with higher relative advantage and lower cost as compared
to their male counterparts who cost saving is not a major consideration when buying
certain products (Frimpong & Nwankwo, 2012).
A study by Matlay and Weathead (2013), found that the cost of a product is an important
influencing factor in the diffusion and adoption of new innovation in many medium
enterprises. The authors elude that these enterprises innovations are less likely to spread
13
in the market if the initial set up cost is perceived to be high. Medium sized
manufacturing enterprises in Africa often have a great challenge to source financial
support and innovations considered expensive may not diffuse effectively. According to
Paul and Pascale (2013), many medium sized enterprises in Africa face limited financial
resources which are considered a big problem in the formulation and implementation of
new product innovations. Therefore, an innovation that promises to save them cost in
implementation is likely to spread easily. New innovations provide a drive for
manufacturing enterprises to improve the life of consumers by offering product
innovations that get to save consumers time and money and in return gain profits. Apulu
and Lathan (2011), adds there is an assurance for the product innovations to spread if they
are considered to save cost and time. For instance, in Ghana customers access a wide
range of products at lower costs which leads to a higher adoption rate hence improving
manufacturing business process (Frimpong & Nwankwo, 2012).
2.2.4 Convenience and Efficiency
Product innovations that provide greater benefits to consumers are highly considered
convenient and efficient to consumers (Passerini, El Tarabishy & Patten, 2012).
Additionally, innovations that prove to be more convenient are likely to be accepted
faster; for instance in the financial sector – customers are able to perform transactions
whenever they wish using the multipurpose simcards (Gardner, 2013). The introductions
of these multipurpose simcards in the banking sector have led to shorter queues in banks
and improved customers’ convenience of banking. They have also helped banks to reduce
inefficiencies hence improving customer service. A study by Chataway, Hanlin &
Kaplinsky (2013) notes that perceived convenience and efficiency of an innovation has a
positive significant effect on its ease to be accepted.
Egbetokun et al. (2012) study describes convenience as when an innovation contributes to
the business process simplification. For instance, in e-trade, companies recognize
perceived convenience will affect their business processes and consumers. Perceived
convenience attributes of a product lead to faster diffusion and adoption of products. The
greater perceived convenience of an innovation, the greater the drive to try it and
thereafter, undertake continuous adoption. According to Tanev and Frederiksen (2014)
innovations that facilitate the transformation of the healthcare sector through enhanced
service quality and improved operational efficiency, such as radio frequency

14
identification products which offer improved capabilities compared to the traditional
products, motivate the spread and adoption of these new innovations compared to the
previous ones.
2.3 Effects of Compatibility on Diffusion of Innovation
This section addresses the effects of compatibility on the diffusion of product innovation
in medium sized manufacturing enterprises in Kenya. The elements discussed include
technological, environmental, organizational and individual factors.
Innovations that are compatible with the intended adopters' values, norms, and perceived
needs are more likely to diffuse in the market (Rogers, 2003). Lack of innovation
compatibility with potential adopters’ lifestyles makes them lose confidence in the
product which leads to failure of diffusion (Zhai, 2011).
2.3.1 Technological Factors
Cupolas (2013), argues the decision to adopt a product is dependent on what is available
in the market and how new technologies complement those consumers who already
possess them. The major factors that characterize such technologies include compatibility
which is both technical and organizational. According to a study by Huy (2012)
compatibility has been found to be a significant determinant of diffusion and adoption of
new innovations as it deals with perception of the importance of innovation in performing
various tasks both presently and in the future. For example, if products are perceived to
be compatible with the traditional way of performing various tasks, with existing values
and different communication involving day to day operations and future developments, a
higher diffusion rate is likely to occur.
Fu and Gong (2011) study reveals appropriate institutions and policies that are compatible
with the consumers lifestyles are required to guide incentives and facilitate the process of
diffusion. In addition local technological compatibility is required to ensure appropriate
transfer and absorption of new innovations according to the technical and environmental
conditions. The nature of product innovations influence whether the innovation will
spread and rate of diffusion. Low- technical innovations do not require demanding pre-
conditions capacity in terms of skills and capital and therefore, have the potential to

15
diffuse faster as compared to high- technological products that require high tech pre-
conditional capacity to be operated (Zanello, Fu, Mohnen & Ventresca, 2015).
2.3.2 Environmental Factors
There is a positive correction between innovation adoption and the business owners’
perception of the intensity of the competition, industry pressure support, supplier and the
sector in which the business operates (Huy, 2012). Additionally, the industry in which a
firm operates majorly influences how innovations diffuse in the marketplace with
manufacturing industry being one of the key industries in which poor institutional
environments demonstrate a significant relationship through reduction of diffusion rate
and lower return for innovations (Nguyen& Jaramillo, 2014).
Allard, Martinez and Williams (2012) study found out innovations that were compatible
with the national systems in political stable countries were likely to spread easily and less
likely to spread in unstable countries. Arguably, firms that serve broader markets with
greater market scope in politically stable countries are more likely to adopt innovations
because innovations are greatly affected by political environment which direct affect
competition and consumers. Srholec (2011) analysis of 14,000 enterprises in 32
developing countries survey by the World Bank, argued that the way a political system is
organized has indirect powerful effects on development and spread of innovations;
democratic governments are more likely to offer incentives to enhance innovativeness.
Additionally, De Waldemar (2012) analysis of Indian firms by the Enterprise Survey
found out that corruption was a major influence of how innovation diffused in developing
countries. He noted corrupt environments slowed the spread of innovations.
Porter (2013) suggests diffusion of product innovations in a politically stable environment
change the competitive environment in three ways which include; change of the industry
structure, competition rules and businesses new method which help businesses to gain
competitive advantage by ensuring their new products spread in the market easily.
Ensuring fair competition and entry opportunities for market players, particularly in
medium sized enterprises there must be an on-going policy to enhance diffusion of
innovation. Al-Qirim (2013), study found out innovations that are likely to fit in
consumers environments will have a greater impact diffusing, and service innovations are
16
likely to easily diffuse in developing countries compared to product innovations due the
environmental conditions created by these countries.
Nguyen& Jaramillo (2014) adds that potential or existing customers prefer a suitable
environment that allows some sort of interaction when consulting with the supplier
because information intensive products are more complicated and require more
accompanying information which is critical in their spread. Additionally, external
pressure from competitors or customers already used to the products may encourage the
manufacturing firms to consider the environment in which they interact with their
customers in order to enhance diffusion.
2.3.3 Organizational Factors
The culture of an organization can be a powerful driving force for the spread of
innovations. Organizations that support innovativeness and have innovative practices
already in place are likely to manufacture products that diffuse easily in the market (Fu &
Gong, 2011). However, a culture can also prevent a company from meeting competitive
threats or adapting to changing economic and social environment that an innovation is
designed to overcome. Allard et al. (2012) notes other than organizational culture there
are other features of the organization such as structures and systems that affect how
innovations are developed in the organizations and if not taken into consideration can be
very impactful in the failure of innovations spread. Hall (2011) adds that there is need for
organizations to develop capacity for change and allocate operational capabilities that are
in line with product innovativeness in order to sustain long term performance.
A study by Huy (2012), on the significance of organizational determinants as factors of
diffusion and adoption found out that employees knowledge of various innovation trends,
enterprise size and attitudes of the managers and business owners towards innovation
were significantly positive. Another finding by Al – Qirim (2013), confirms that the
positive relationship between managers and employees attitude towards innovation
knowledge had a significant impact on the spread of organizations innovation.
The organization size is an indicator of the level of operational resources of the company
which is positively and significantly related to diffusion of innovation (Lu et al, 2013).
For instance, small organizations may face challenges with manufacturing products that
17
appeal to the market due to the limited human resources they may experience. For
products to spread in the market there are a number of factors considered such as
resources which should be in line with the organization capability. Study by Kaplan
(2012) found out, employees’ experiences at work are a critical factor that influences the
success of product adoption due to the significant relationship between organization
governance, characteristics of the products and the number of products. When employees’
internal systems are innovative and they work in an environment that supports innovation
they are prompted to develop products that will as well appeal to the consumers lifestyles.
Past studies show, organization compatibility has a significant impact on the willingness
of innovation diffusing and consumers adopting the products. Cupolas (2013) found out
there is a need for managements to upgrade their way of operation and how employees
think as institutions that are bureaucratic are believed to actively inhibit diffusion of
innovation. For instance, if an innovation is compatible with the organization culture and
governance, uncertainty is likely to decrease and awareness of the innovation to increase
among employees who are considered great ambassadors of the company products
(Porter, 2013). Employees can only be good ambassadors and consumers of their
company products if their beliefs are in line with their organization values.
Development and diffusion of product innovations is strongly affected by values
difference between organizations and their target audience. For instance there are a
number of issues linked to lack of diffusion for industries in the North West Frontier
province in Pakistan related to values indifference (Bashir, Khan & Malik, 2010). The
target audiences feel that some of the products are manufactured by industries which
values fail to complement theirs. Meagher (2012) adds that industrial developments are
better facilitated if the mechanisms driving them are embedded in the community and
social institutions found in the region.
Organization factors deal mostly with adoption of innovation by organizations and
diffusion of innovation within organizations. Secondly, organizational compatibility in
relation to interactivity of new innovations needs to be consistent with the needs of
existing company practices. Thirdly, perceived benefits of the innovation are critical in
diffusion of innovation that business owners and managers need to put into consideration
Cupolas (2013).
18
2.3.4 Individual Factors
Diffusion is supported by social networks of influences, where the influence process is
carried out by direct contact between individuals in personal networks and social system
trends at micro level (individual), based on the exposure level, the individual
characteristics evolution and on the factors that influence decision making (Mourad &
Tolba, 2014). Issues surrounding individuals are an important aspect of the diffusion of
product innovations and individual factors based on demographics such as age and
genders have an effect on the spread of product innovations. According to Udin (2016) on
the usage and acceptance of wearable products, younger age are more likely to accept
product innovations compared to the older age, in contrast female at older also more
likely to adopt emerging innovations compared to male.
Individual misunderstanding and cultural differences on how negotiations are carried out
can also affect how innovations diffuse in the market. Zanello et al. (2015) argues that
sometimes developing countries innovations do not spread because they do not meet
individual local needs and are not in line with individual lifestyles and, preferences. Fu
and Gong (2011) adds many researchers believe that products that are recently launched
in the market diffuse faster in comparison with the situation several years ago. This fact is
a result of the emergence of different players whose negotiation values are believed to be
in line with the majority.
One of the main players that accelerate the diffusion process is the opinion leader, Rogers
(2003), who proved that opinion leaders have major roles in activating diffusion
networks. Opinion leaders are identified as having greater access to mass media as well as
interpersonal networks in comparison with their followers. In addition, they are perceived
as having higher socio-economic status and tendency to adopt new innovative ideas
before their followers who share same values. It has been empirically proved if the
product is compatible with the opinion leader lifestyles they influence the consumer
decision-making process through spreading positive word of mouth of the product which
later leads to a high rate of diffusion and adoption. In addition, opinion leaders act as role
models to be imitated by various individuals. This relationship was supported by the
diffusion research, which highlighted that opinion leaders influence the evaluation of new
innovation, majority followers and hence affect the rate of diffusion (Dearing, 2012).

19
Finally, in medium sized enterprises, the position of individuals in relation to the new
innovation diffusion matters a lot as they are supposed to be generalist in performing their
functions (Allard et al, 2012). Most enterprises personnel are either in key managerial
positions or are classified in a unit or function that performs a certain task or numerous
tasks. Most are also run by managers who own the organizations (Matlay & Weathead,
2013). It is important that there is a higher appreciation of innovation because higher
level of appreciation of innovations by the owner or key manager will directly influence
considerations for further innovation uptake by consumers who are believed to only adopt
a product if it meets their individual needs and complement their lifestyles.
2.4 Effects of Complexity on Diffusion of Innovation
This section addresses the effects of complexity on diffusion of product innovation in
medium sized manufacturing enterprises in Kenya. The elements discussed include level
of understanding, communication, technical and social skills.
Complexity of product innovation is critical to its acceptance. According to Rogers
(2003) complexity focuses on the degree to which the innovation is perceived as
complicated to understand generally, the more complex the innovation is in terms of
operating, the less rapid its acceptance will be. Studies by Al-Qirim (2013) found out
existence of an inverse relationship between the likelihood of diffusion and perception of
innovation complexity. Furthermore, Rogers (2003) suggests that key players easily take
up innovations that are perceived simple to use.
In manufacturing intensive industries, the pace and complexity of product innovations
changes create many uncertainties for organizations which in turn, force organizations to
innovate continuously to be competitive. Some of these innovations are in the
manufacturing of communication equipment, computers and other electronic equipment.
However, lack of attention on the comparison among different types of equipment in
manufacturing industries may lose the benchmark function, and restrain learning and
communicating between each other which is important in the evaluation of different types
of equipment manufacturing industries (Nakata & Weidner, 2012).
20
2.4.1 Level of Understanding
Innovations that are perceived by key players as simple to use are more easily adopted. If
the innovation can be broken down into more manageable parts, it will be assimilated
more easily (Rogers, 2003). The more complex an innovation is the slower its diffusion.
For instance, the modern day consumers find using electrical products such as computers
as easy to use because they tend to be educated and have sufficient understanding of
computer (Mohd, 2010). The act of adoption of innovations and the process of diffusion
is shaped and influenced by actors’ interaction within a social context and system. Hence
it is critical to understand why and how things happen the way they do, in the course of
innovation and diffusion of systems and electrical products (Cohen, 2012).
Nakata and Weidner (2012) study found out that complexity of product innovations can
be considered a key factor affecting diffusion of innovation in medium sized enterprises.
This is because new ideas that are simpler to understand by members of a social system
are adopted more rapidly than innovations that require the adopter to develop new skills
and understanding. Rogers (2003) theory indicates that the lower the complexity of an
innovation the higher the diffusion rate.
Bahaddad, Chang and Lai (2013) notes that medium sized manufacturing enterprises
differ from large companies as they tend to focus on simple methods to manage their
operations which require less advanced technical expertise. These enterprises follow
simple management form and avoid complex governance and complex innovations that
are difficult to understand. A study by Bulte (2012) adds if product innovations are easy
to understand they have a higher intention of spreading among consumers. The perceived
ease of use of innovative product is powerful in explaining satisfaction of consumer needs
and wants.
2.4.2 Communication
Communication channels are essential vectors of innovations diffusion: potential adopters
will embrace an innovation only if they come across it or hear about it. The channels may
involve transmission of information (Zanello et al, 2015). Issues related to
communication address interactivity of a new product innovation to a certain degree.
Communication issues enclose many different aspects of product interaction, online
communities and user's individual motivation towards a certain innovation and successful

21
market acceptance (Zhou & Wu, 2014). The efficiency of communication depends on the
level of development of infrastructures and on the geographical and cultural distances
between the actors involved in the communication. Developed countries have efficient
transport systems that facilitate the diffusion of knowledge and goods. In many
developing countries the quality and efficiency of infrastructures limit the transport of
goods both from other countries and internally thereby hampering the spread of
innovation (Amendolagine, Boly, Coniglio, Prota & Seric, 2013). Additionally, in order
to access effectively new markets, companies may need to re-think the production and
delivery of goods, often re-engineering products in order to reduce the complexity and
cost of production (Bhatti & Ventresca, 2012).
Diffusion is a specific kind of communication, which can be said to be a social process
that involves interpersonal communication relationships. Thus, interpersonal channels are
more powerful to create or change strong attitudes held by an individual (Rogers, 2003).
For each innovation that is not spread, it is essential to assess whether this is due to a
design fault, missing channels, or lack of local capacities.
Zanello et al. (2015) argues it is important for medium enterprises to communicate
effectively about their new innovations to its audience to enhance new innovations
update. According to Yung and Shin (2013) the two ways in which new information is
communicated to consumers is through epidemic and game-theoric. In epidemic models,
consumers obtain new information and adopt new products when they have contact with
others who already had the new product while in game-theoretic models, a user adopts a
new product only if it maximizes her utility, which increases with the number of
neighbors who adopt the same product.
Further studies by Mutoko (2013) found out that where diffusion of an innovation is
desirable at the beginning of campaigns, innovations penetrate larger geographical
regions with supportive communication policies and sustainable multi-stakeholder
partnerships. This is because cooperation between interested and affected groups is
necessary for better understanding of opportunities and challenges involved in achieving
conversation goals at multiple scales. Seker (2012) adds developing countries weak
national- level institutions can enhance such communication collaborations if they have
access to restricted training skills in marketing and production of their new product thus
encouraging product innovation diffusion. Additionally, Porter (2013) emphasizes the
22
need to communicate effectively about new product as effective campaigns have a
significant effect on diffusion of innovation.
Finally, new innovations and consumer awareness is really critical in the diffusion
process. For instance in Malaysia, in order to create awareness of new products, most
manufacturing enterprises launch online campaigns initially which start providing
information on important characteristic of the product in order to enhance acceptance
(Barczak et al, 2012).
2.4.3 Technical and Social Skills
Product innovations that require a new skill in order to adopt or complicated, will have a
slower rate of adoption than an innovation that is easy to understand and implement by
most members of the social system (Rogers, 2003). Lack of advanced and specific skills,
are factors that hamper both diffusion and adoption of innovation in developed as well as
developing countries (Zanello et al, 2015).
Mahazir and Mohd (2012) found that perceived complexity is a vital factor influencing
the decision to adopt innovation and that the likelihood of diffusion of the innovation is
inversely related to the perceived complexity variable especially amongst the medium
sized enterprises and its consumers. For instance, according to Bhatti and Ventresca
(2012), in Kenya, these enterprises struggle with qualified personnel who can manage
their firms and forget that both resources and capabilities also affect their consumers
because innovation requires creative and innovative re-combination of resources and
skills. Hall (2011) notes that, for every job created there is a lot of unskilled personnel
handling the work. However, work in the medium enterprises is not so attractive because
of low salaries compared to large companies, less attractive work conditions, lack of
career paths, and employment security. As a result, most suffer from high staff turnover
and limited-access to qualified and skilled staff which indirectly affects the quality of
products released to the market.
The introduction of new product innovations might require the employees to develop new
skills in order to use the product as well as the consumers. Rogers (2003) contends that
the new innovation can be intimidating, particularly if it requires change in the existing
businesses practices or acquisition of new skills. The measurement of perceived
complexity or ease of use can be in the context of how innovation can be easily

23
controlled, the degree of flawlessness, reasonableness, and adaptability to changes, user
friendliness, and how easy it is for one to become skilful in using the product.
Altuwaijri (2011) studies found out the major barriers to diffusion of innovated products
include complicated infrastructure, ability to attract expertise, funding resources, and
weak implementation strategies. Mahazir and Mohd (2012) add companies should
provide funds, develop implementation strategies, and address challenges of complicated
product innovations infrastructure, and expertise if they are to experience any market
success with their products. For instance in healthcare, the shortage of skilled health
professionals to promote new innovations affect improvement of Health services. For
these innovations to be adopted health providers need to accommodate elements such as
staffing constraints, system operator skills, training time available and cost limitations
which directly affect how the particular innovation spreads in the market (Sawada et al,
2012).
Technical skills are expensive, and firms cannot afford to implement product innovations
effectively if their employees lack these skills. For instance, in a paper-manufacturing
company in Northern Vietnam, lack of technical skill to develop innovative products was
a major obstacle for the company to overcome compared to financial constraints (Kimura,
2011). Diffusion of innovations in developing countries is a driver for firms’ growth
whereas technical skills are influencers for development of innovations that are easily
accepted in the market (Goedhuys, Janz & Mohnen, 2014).
24
2.5 Chapter Summary
This chapter has reviewed the literature review on studies carried out on factors affecting
diffusion of product innovation in medium sized manufacturing enterprises in Kenya. It
has focused on the three research questions firstly, discussing effects of relative
advantage of diffusion focusing on convenience, cost effectiveness, time saved,
application effectiveness and improvement of the consumers’ activities. Secondly, it has
discussed the effects of compatibility on diffusion of product innovation, focusing on
technological innovation, consumers’ environment, business and government policies,
consumers’ lifestyles and cultures and, industry acceptance. Finally, it has discussed
effects of complexity on diffusion of innovation focusing on the ability to easily
understand the innovation, ease of usage, innovation’s clear communication, and
provision of support resources and technical expertise of the consumers’. The next
chapter discusses the research methodology.

25
CHAPTER THREE
3.0 RESEARCH METHODOLOGY
3.1 Introduction
This chapter discusses the research methodology that was used for the study. It describes
the research design, population and sampling design, data collection methods, research
procedures and data analysis methods.
3.2 Research Design
Copper and Schindler (2014) define research design as the plan used by a researcher to
carry out a research. It provides a framework for generation of evidence suitable for a
certain criteria and the research question a researcher is interested in. There are three
types of research designs namely; exploratory, descriptive and causal. Exploratory
research design is undertaken when a research problem has few or no earlier studies to
refer to; descriptive research design is undertaken to determine and describe variable
characteristics in a situation whereas, causal research design is undertaken to determine
the nature of relationship between cause and effect variables. This study adopted a
descriptive research design. According to Saunders, Lewis and Thornhill (2016) there are
four types of descriptive research design which include; correlation, survey, evaluative
and Meta analysis. Precisely, descriptive correlation research design was used; this
research design is utilized if the data collected is used to describe a person, organizations,
settings and phenomenon (Creswell, 2012). Descriptive correlational design was suitable
for this study because it covers a wide range of variables and enhances understanding of
the relationship between independent and dependent variables of a study (Tavakoli,
2015).
The independent variables for the study were relative advantage, compatibility and
complexity whereas the dependent variable was diffusion of product innovation. Relative
advantage was measured by innovation’s convenience, cost effectiveness, time saved,
application effectiveness and improvement of the consumers’ activities (Passerini, et al,
2012). Compatibility was measured by technological innovation, consumers’
environment, business and government policies, consumers’ lifestyles and cultures, and
industry acceptance (Zanello et al, 2015). Complexity was measured by the ability to
26
easily understand the innovation, ease of usage, innovation’s clear communication,
provision of support resources and technical expertise of the consumers’ (Al- Qirim,
2013).
3.3 Population and Sampling Design
Population and sampling designs describe what the target population comprises of and
how individual samples are selected from the total target population.
3.3.1 Population
A population consists of all the subjects about whom the researcher requires to draw some
inferences (Saunders et al, 2016). The population for this study consisted of 108 top 100
medium sized manufacturing enterprises recognized for their growth in profits and
revenue, shareholders return and liquidity in Kenya between year 2008 and 2016 (KPMG,
2015). The researcher obtained the list from the top 100 Medium Sized Enterprises
website developed by KPMG Kenya and Nation Media Group.
Table 3.1: Population Distribution
Year
Manufacturing
Enterprises in Top
100
Repeated
Enterprises in Top
100
Actual
Manufacturing
Enterprises in Top 100
2008 21 0 21
2009 23 10 13
2010 34 19 15
2011 32 18 14
2012 31 23 8
2013 33 21 12
2014 18 11 7
2015 23 13 10
2016 26 18 8
Total 241 108
Source: KPMG (2016)
From table 3.1, some enterprises were recognized severally between year 2008 and 2016
hence appearing as repeated. For instance, in 2009 there were 23 manufacturing
enterprises on the top 100 list however, 10 of them had already been recognized in 2008
leading to 13 actual enterprises. In 2012, 31 manufacturing enterprises were on the top

27
100 list with 23 enterprises having been recognized in the previous years’ hence 8 actual
enterprises. Finally, in 2016 there were 26 manufacturing enterprises on the top 100 list
with 18 having been recognized in the previous years, accounting to only 8 actual
enterprises in the year.
3.3.2 Sampling Design
The sampling design consists of sampling frame, sampling technique and the sample size
adopted for the study.
3.3.2.1 Sampling Frame
A sampling frame is a list of elements representing the population from which the sample
is derived (Cooper & Schindler, 2014). The sampling frame for this study consisted of
108 Manufacturing Enterprises drawn from the top 100 Medium Sized Enterprises
website, updated annually by KPMG Kenya and Nation Media Group.
3.3.2.2 Sampling Technique
A sampling technique describes the method used to select a sample (Cooper & Schindler,
2014). The selection of the sampling method depends on various theoretical and practical
issues (Hair, 2015). There are two types of sampling techniques; probability sampling and
non-probability sampling. Probability sampling technique is used in quantitative studies
where subjects of the sample are chosen from known probabilities; this technique
includes simple random, stratified random, cluster and systematic random sampling
whereas non-probability sampling is used in qualitative studies where subjects are not
based on random sampling techniques; this technique includes convenience, judgmental,
quota and snowball (Sekaran & Bougie, 2015). This study adopted stratified random
sampling because it takes into consideration different subgroups of individuals in the
population guaranteeing fair representation of the sample specific characteristics
(Saunders et al, 2016). In this study, the sampling procedure involved classifying the top
100 enterprises into 9 strata according to the year in which they were recognized between
2008 and 2016; then, simple random sampling was used to select individual enterprises
from each stratum. This technique ensured that a representative sample from different
years was used in the study.

28
3.3.2.3 Sample Size
A sample size is defined as subjects selected from the population to constitute a sample
(Tavakoli, 2015). According to Saunders et al. (2016) a sample size is determined by
selecting the number of observations to be part of the statistical sample which is the
actual number of intended respondents of a represented population under study.
Appropriate sample size consists of various factors that need to be taken into account
which include elements in target population, type of sample required, time available,
budget and whether findings are to be generalized and at what confidence degree
(Saunders et al, 2016). Yamane (1973) statistical formula was used to determine the
sample size. This formula was suitable for this study because the population was known;
in this case the top 100 manufacturing enterprises. This formula is normally applied when
determining a sample size for a finite population; this is whereby the specific number of
items in the target population is well defined.
n = N
(1 + Ne2)
Where;
n = size of the sample required
N = size of the population
e = maximum percentage of error required. For this study the error allowed was 5%, in
order to give a 95% confidence interval which is equal to 1.96
After substituting the formula, {n = 108 / [1+108 (0.05 * 0.05)] =108 /1.0588 = 102
n = 102
The sample size for this study was 102 medium sized manufacturing enterprises,
distributed based on the population size of individual strata as shown in table 3.2.

29
Table 3.2 Sample Size Distribution
Year Actual Population Sample Size Percentage Sample Size
2008 21 21/ 108 * 100% = 19 20
2009 13 13/ 108 * 100 % = 12 12
2010 15 15/ 108 * 100% = 14 14
2011 14 14 / 108* 100 % = 13 13
2012 8 8 / 108 * 100% = 8 8
2013 12 12 /108 * 100% = 11 11
2014 7 7 / 108 * 100% = 7 7
2015 10 10 / 108*100% = 9 9
2016 8 8 / 108 *100% = 7 8
Total 108 100 102
Source: Author (2017)
3.4 Data Collection Methods
The method used for collecting data should be clearly described. A structured
questionnaire developed by the researcher was used to collect primary data in this study;
this allowed the researcher to learn the intentions, expectations and opinions of the
respondents (Cooper & Schindler, 2014). A five likert - type scale ranking raging from
strongly agree to strongly disagree was adopted. A likert scale was suitable for this study
as it is widely used in most business studies and other related courses in social science
literature (Zikmund, 2012). The questionnaire was divided into 4 sections; section one
focused on demographics such as gender, designation, education and years’ of the
organization existence. Section two focused on relative advantage effects on diffusion of
product innovation. Section three focused on compatibility effects on diffusion of product
innovation and section four focused on complexity effects on diffusion of product
innovation.
3.5 Research Procedures
The research instrument was developed by the researcher and pilot tested among 10
respondents, 10% of the sample to detect weaknesses in design and instrumentation
(Cooper & Schindler, 2014). After the pilot test internal consistency and reliability of the
questions was determined by computing Cronbach’s alpha where anything above 0.7 was

30
considered acceptable. From Cronbach’s alpha results unclear questions were amended.
After amendment of the instrument, an introduction letter was obtained from Chandaria
School of Business, indicating the researcher was a student at the school. Thereafter, the
final instrument was administered to respondents within Nairobi by the Researcher and
Research Assistant, and via email to respondents outside Nairobi. Follow ups were made
weekly through telephone calls and emails. Data was collected in the month of July 2017.
3.6 Data Analysis
Data analysis involves developing summaries, looking for patterns in the collected data
and applying statistical techniques to analyse the data. Descriptive and Inferential
statistical techniques were used to analyze the data. Descriptive statistics involves display
of characteristics of the location, spread and shape of a data array whereas inferential
statistics includes the estimation of population values and testing of statistical hypotheses
(Cooper & Schindler, 2014). Descriptive statistics techniques included the mean and
standard deviation whereas inferential statistics techniques included Spearman’s Rank
correlation analysis, One way Analysis of Variance (ANOVA) and linear regression.
Spearman’s Correlation Coefficient technique was applied because the variables were
monotonically related and they assumed an interval. Spearman’s Correlation Coefficient
is a statistical measure of the strength of a monotonic relationship between paired data.
The index of the association strength between variables, range from zero denoting no
association to +1 denoting perfect association. A high index denotes a strong correlation
between the study variables whereas a low index denotes a weak correlation (Healey,
2011). ANOVA was used to establish the significant differences between the mean
scores. Linear regression technique was used to test the statistical significance on the
relationship between relative advantage, compatibility and complexity on diffusion of
product innovation. Finally, the data was analyzed using the Statistical Package for the
Social Sciences (SPSS) tool and results presented in tables and figures.

31
3.7 Chapter Summary
This chapter described the methodology that was used to carry out the study on factors
affecting diffusion of product innovation in medium sized manufacturing enterprises in
Kenya. It discussed the research design, population, sampling design, data collection,
research procedures and data analysis method. Chapter 4 presents results and findings of
the study.

32
CHAPTER FOUR
4.0 RESULTS AND FINDINGS
4.1 Introduction
The purpose of the study was to determine factors affecting diffusion of product
innovation in medium sized manufacturing enterprises. This chapter presents the results
and findings of the study based on three research questions. Section one presents the
descriptive analysis of demographic information; Section two presents findings on the
effects of relative advantage on diffusion of product innovation among medium sized
manufacturing enterprises; section three presents the findings on the effects of
compatibility on diffusion of product innovation among medium sized manufacturing
enterprises and lastly, section four presents the findings on effects of complexity on the
diffusion of product innovation among medium sized manufacturing enterprises. A
summary of the findings will be presented at the end of the chapter. A total of 102
questionnaires were administered to owners and managers of medium sized
manufacturing enterprises in Kenya, of which 91 were filled and returned, giving a
response rate of 80% which was considered adequate for the analysis.
4.2 Demographic Information
This section, presents results of demographic information which included respondents
gender, age, designation, level of education and the years of enterprise existence.
4.2.1 Distribution of Respondents Gender
The gender distribution of respondents is shown in Figure 4.1. The figure shows that 67%
of the respondents were male and 33% of the respondents were female.
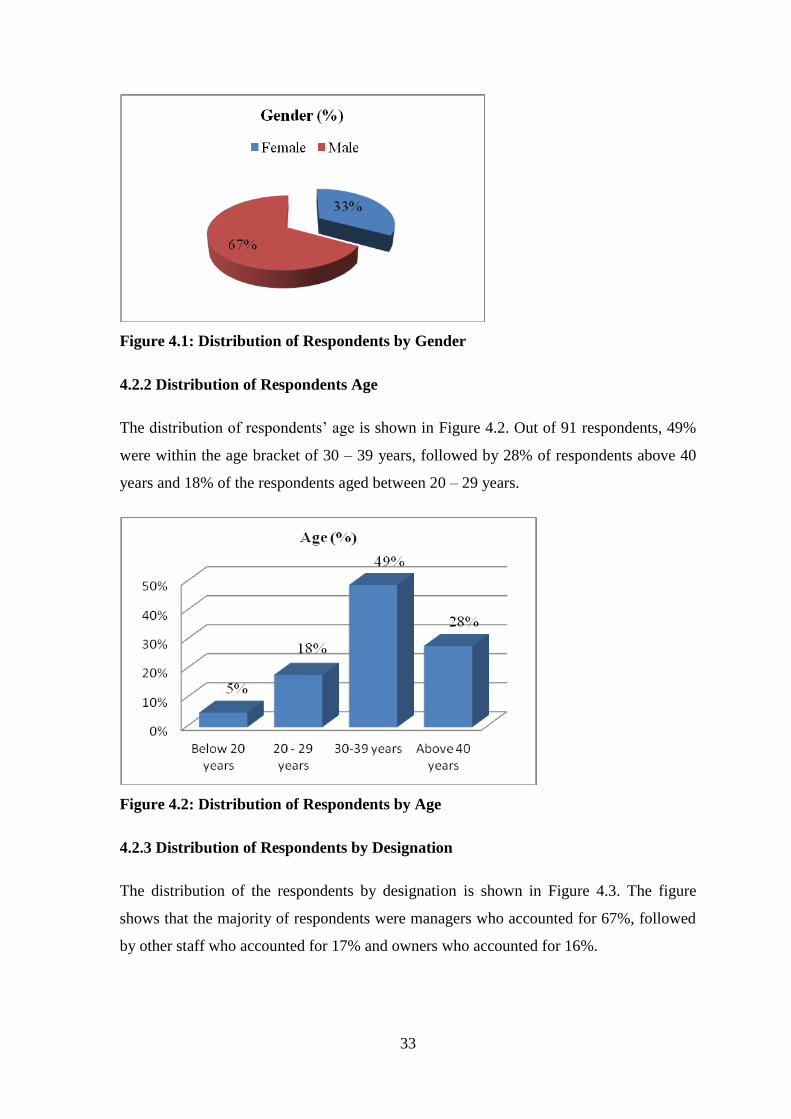
33
Figure 4.1: Distribution of Respondents by Gender
4.2.2 Distribution of Respondents Age
The distribution of respondents’ age is shown in Figure 4.2. Out of 91 respondents, 49%
were within the age bracket of 30 – 39 years, followed by 28% of respondents above 40
years and 18% of the respondents aged between 20 – 29 years.
Figure 4.2: Distribution of Respondents by Age
4.2.3 Distribution of Respondents by Designation
The distribution of the respondents by designation is shown in Figure 4.3. The figure
shows that the majority of respondents were managers who accounted for 67%, followed
by other staff who accounted for 17% and owners who accounted for 16%.
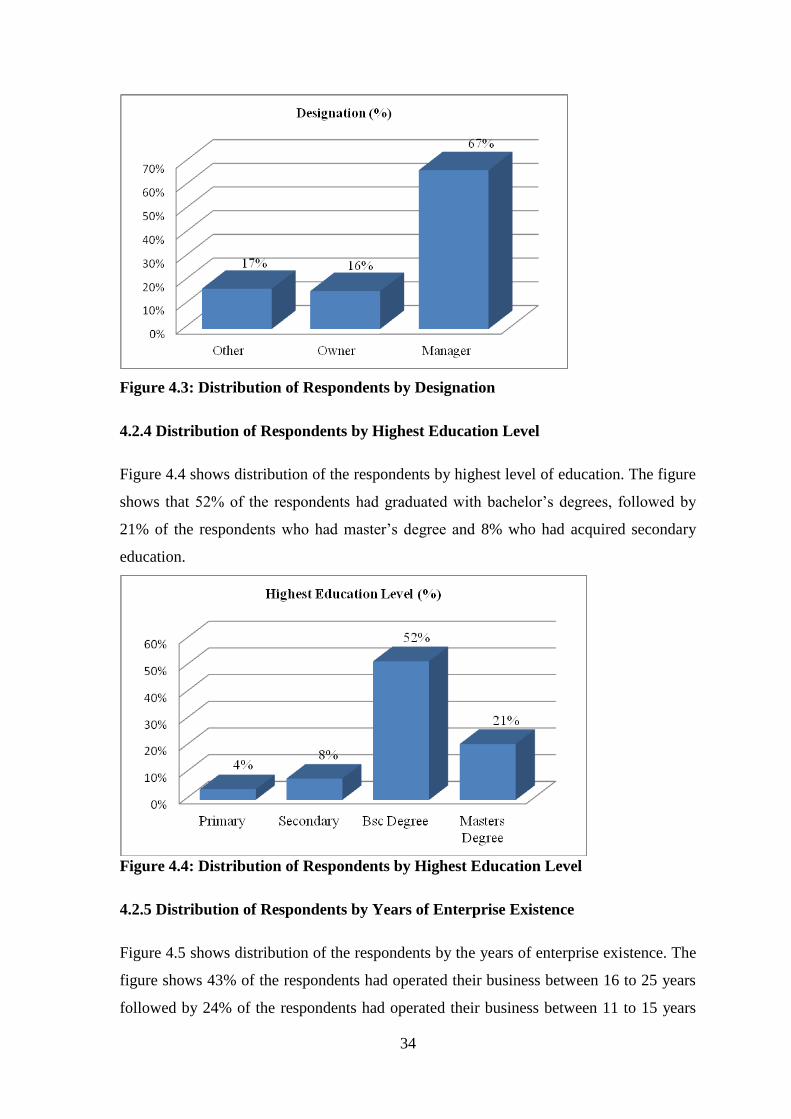
34
Figure 4.3: Distribution of Respondents by Designation
4.2.4 Distribution of Respondents by Highest Education Level
Figure 4.4 shows distribution of the respondents by highest level of education. The figure
shows that 52% of the respondents had graduated with bachelor’s degrees, followed by
21% of the respondents who had master’s degree and 8% who had acquired secondary
education.
Figure 4.4: Distribution of Respondents by Highest Education Level
4.2.5 Distribution of Respondents by Years of Enterprise Existence
Figure 4.5 shows distribution of the respondents by the years of enterprise existence. The
figure shows 43% of the respondents had operated their business between 16 to 25 years
followed by 24% of the respondents had operated their business between 11 to 15 years
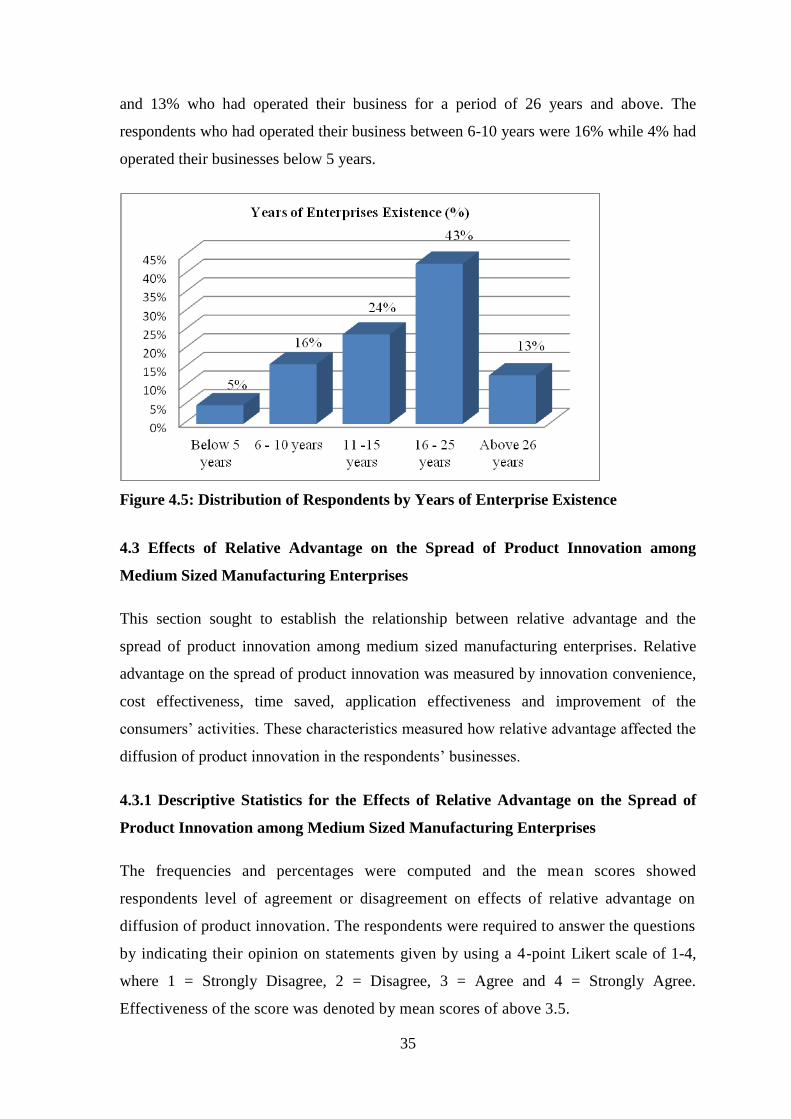
35
and 13% who had operated their business for a period of 26 years and above. The
respondents who had operated their business between 6-10 years were 16% while 4% had
operated their businesses below 5 years.
Figure 4.5: Distribution of Respondents by Years of Enterprise Existence
4.3 Effects of Relative Advantage on the Spread of Product Innovation among
Medium Sized Manufacturing Enterprises
This section sought to establish the relationship between relative advantage and the
spread of product innovation among medium sized manufacturing enterprises. Relative
advantage on the spread of product innovation was measured by innovation convenience,
cost effectiveness, time saved, application effectiveness and improvement of the
consumers’ activities. These characteristics measured how relative advantage affected the
diffusion of product innovation in the respondents’ businesses.
4.3.1 Descriptive Statistics for the Effects of Relative Advantage on the Spread of
Product Innovation among Medium Sized Manufacturing Enterprises
The frequencies and percentages were computed and the mean scores showed
respondents level of agreement or disagreement on effects of relative advantage on
diffusion of product innovation. The respondents were required to answer the questions
by indicating their opinion on statements given by using a 4-point Likert scale of 1-4,
where 1 = Strongly Disagree, 2 = Disagree, 3 = Agree and 4 = Strongly Agree.
Effectiveness of the score was denoted by mean scores of above 3.5.

36
Table 4.1 indicates that 49% of the respondents agreed that product innovation perceived
to lead to convenient application by consumers or customers diffused faster while 11% of
the respondents strongly disagreed with the statement (M= 3.81, SD= 0.65). The
respondents who agreed that product innovations perceived to be more time saving
diffused faster accounted for 65% while 5% of respondents disagreed with the statement
(M= 3.65, SD= 0.85).
Table 4.1: Descriptive Statistics for the Effects of Relative Advantage on Diffusion
of Product Innovation among Medium Sized Manufacturing Enterprises
Effects of Relative Advantage on the
Diffusion of Product Innovation in
Medium Sized Enterprises
%
1 2 3 4 Total M SD
Product innovations that are perceived to
lead to convenient application by
consumers or customers diffuse faster
% 11% 13% 49% 27% 100%
3.81 .653 f 10 12 47 26 95
Product innovations that are perceived to
be more cost effective diffuse faster
% 7% 3% 58% 33% 100% 3.84 .746
f 7 3 55 31 95
Product innovations that are perceived to
be more time saving diffuse faster
% 6% 5% 65% 23% 100% 3.65 .851
f 6 5 62 22 95
Product innovations that are perceived to
be more effective in their application
diffuse faster
% 1% 2% 75% 22% 100%
3.72 1.07 f 1 2 71 21 95
Product innovations that are perceived to
lead to improvement of consumers current
activities diffuse faster
% 5% 5% 59% 31% 100%
3.64 .665 f 5 5 56 29 95
4.3.2 Cross Tabulation of the Effects of Relative Advantage on the Spread of
Product Innovation among Medium Sized Manufacturing Enterprises by Gender
Cross tabulation was used to evaluate the views of the male and female on the effects of
relative advantage on the spread of product innovation among medium sized
manufacturing enterprises. Findings presented in Table 4.2 and Figure 4.6 indicate that
the proportion of male respondents who agreed and strongly agreed that relative
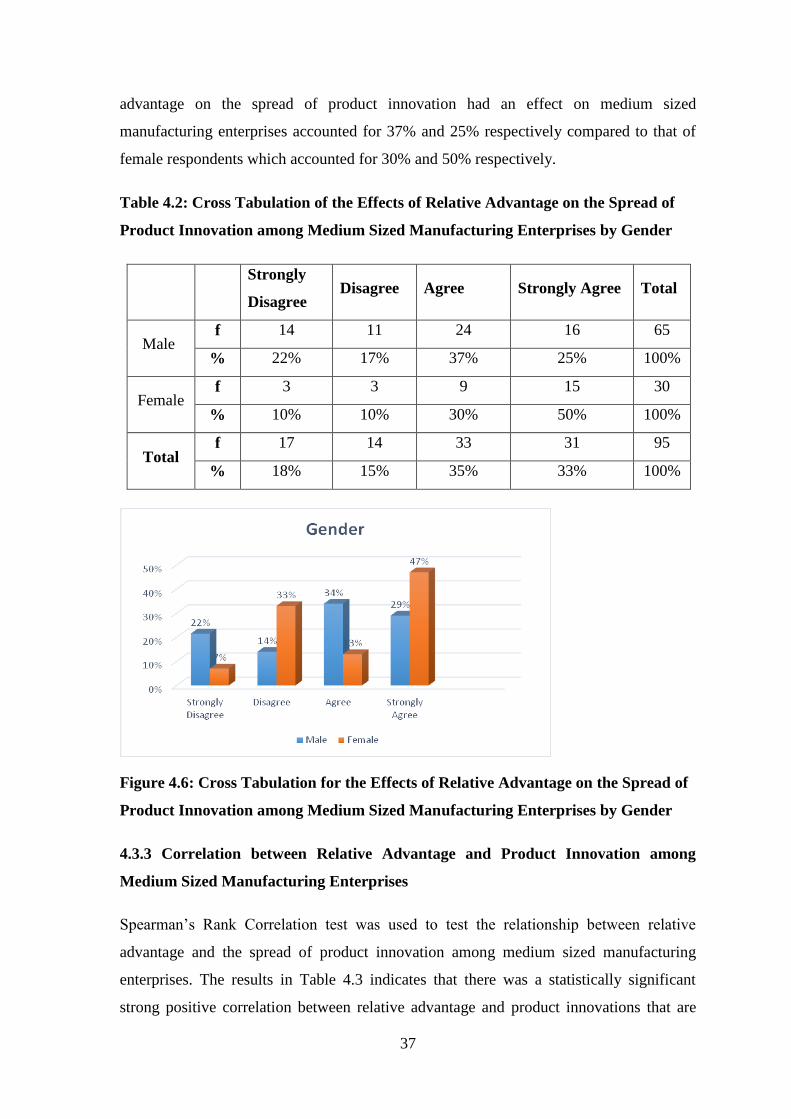
37
advantage on the spread of product innovation had an effect on medium sized
manufacturing enterprises accounted for 37% and 25% respectively compared to that of
female respondents which accounted for 30% and 50% respectively.
Table 4.2: Cross Tabulation of the Effects of Relative Advantage on the Spread of
Product Innovation among Medium Sized Manufacturing Enterprises by Gender
Strongly
Disagree Disagree Agree Strongly Agree Total
Male f 14 11 24 16 65
% 22% 17% 37% 25% 100%
Female f 3 3 9 15 30
% 10% 10% 30% 50% 100%
Total f 17 14 33 31 95
% 18% 15% 35% 33% 100%
Figure 4.6: Cross Tabulation for the Effects of Relative Advantage on the Spread of
Product Innovation among Medium Sized Manufacturing Enterprises by Gender
4.3.3 Correlation between Relative Advantage and Product Innovation among
Medium Sized Manufacturing Enterprises
Spearman’s Rank Correlation test was used to test the relationship between relative
advantage and the spread of product innovation among medium sized manufacturing
enterprises. The results in Table 4.3 indicates that there was a statistically significant
strong positive correlation between relative advantage and product innovations that are

38
perceived to be more cost effective diffuse faster among medium sized manufacturing
enterprises, r(95) = .188, p < .05.
Table 4.3: Correlation between Relative Advantage and Product Innovation among
Medium Sized Manufacturing Enterprises
Effects of Relative Advantage on the Diffusion of Product Innovation in
Medium Sized Enterprises
1 Product innovations that are
perceived to lead to convenient
application by consumers or
customers diffuse faster
Correlation Coefficient 1.000
Sig. (2-tailed) -
N 95
2 Product innovations that are
perceived to be more cost
effective diffuse faster
Correlation Coefficient .098
Sig. (2-tailed) .182
N 95
3 Product innovations that are
perceived to be more time
saving diffuse faster
Correlation Coefficient .188*
Sig. (2-tailed) .023
N 95
4 Product innovations that are
perceived to be more effective
in their application diffuse
faster
Correlation Coefficient .095
Sig. (2-tailed) .210
N 95
5 Product innovations that are
perceived to lead to
improvement of consumers
current activities diffuse faster
Correlation Coefficient .013
Sig. (2-tailed) .854
N 95
*.Correlation is significant at the 0.05 level (2-tailed) ( *p < .05)
4.3.4 A One Way Analysis of Variance (ANOVA) between Relative Advantage and
Product Innovation among Medium Sized Manufacturing Enterprises
One Way Analysis of Variance (ANOVA) test was carried out to establish if there were
significant differences between means in respondents’ perception on the effect of relative
advantage on the spread of product innovation among medium sized manufacturing
enterprises by gender, designation and years of enterprise existence. Table 4.4 presents
ANOVA findings which indicate that there was a statistically significant effect by gender
F(1, 94) = 4.10, p < .05 and the years of enterprise existence F(1, 94) = 5.56, p < .05.
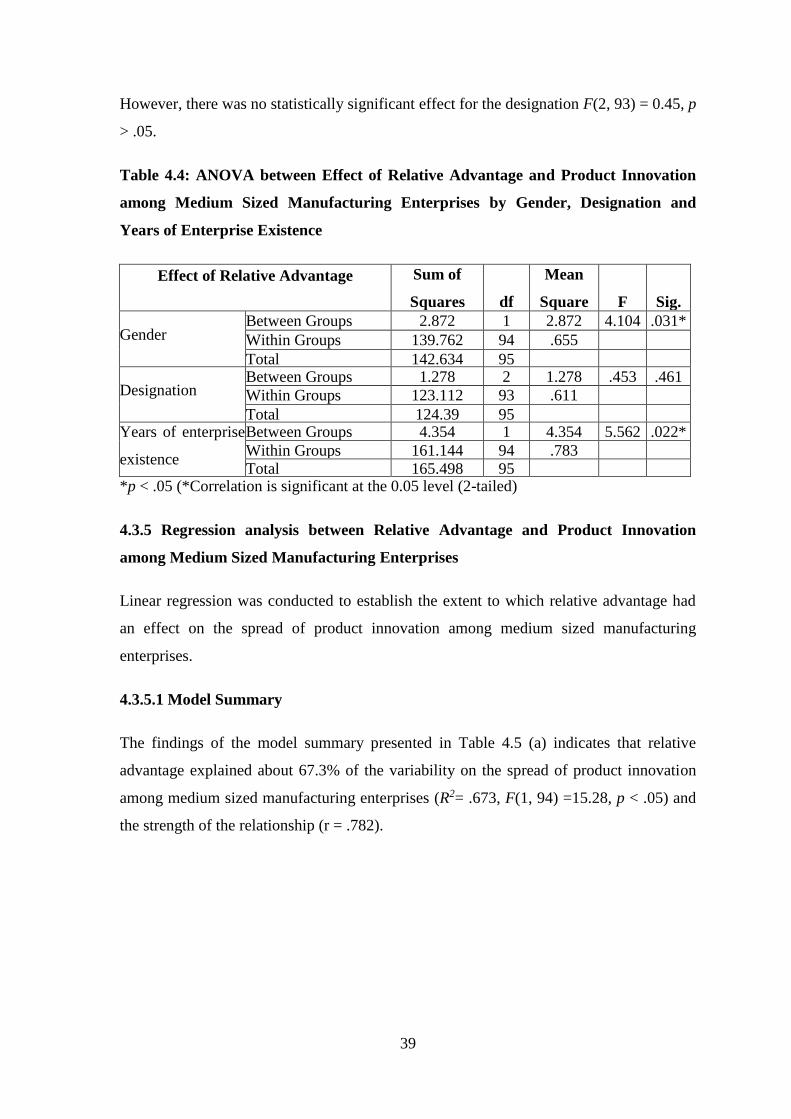
39
However, there was no statistically significant effect for the designation F(2, 93) = 0.45, p
> .05.
Table 4.4: ANOVA between Effect of Relative Advantage and Product Innovation
among Medium Sized Manufacturing Enterprises by Gender, Designation and
Years of Enterprise Existence
Effect of Relative Advantage Sum of
Squares
df
Mean
Square
F
Sig.
Gender Between Groups 2.872 1 2.872 4.104 .031*
Within Groups 139.762 94 .655
Total 142.634 95
Designation Between Groups 1.278 2 1.278 .453 .461
Within Groups 123.112 93 .611
Total 124.39 95 Years of enterprise
existence
Between Groups 4.354 1 4.354 5.562 .022*
Within Groups 161.144 94 .783
Total 165.498 95 *p < .05 (*Correlation is significant at the 0.05 level (2-tailed)
4.3.5 Regression analysis between Relative Advantage and Product Innovation
among Medium Sized Manufacturing Enterprises
Linear regression was conducted to establish the extent to which relative advantage had
an effect on the spread of product innovation among medium sized manufacturing
enterprises.
4.3.5.1 Model Summary
The findings of the model summary presented in Table 4.5 (a) indicates that relative
advantage explained about 67.3% of the variability on the spread of product innovation
among medium sized manufacturing enterprises (R2= .673, F(1, 94) =15.28, p < .05) and
the strength of the relationship (r = .782).
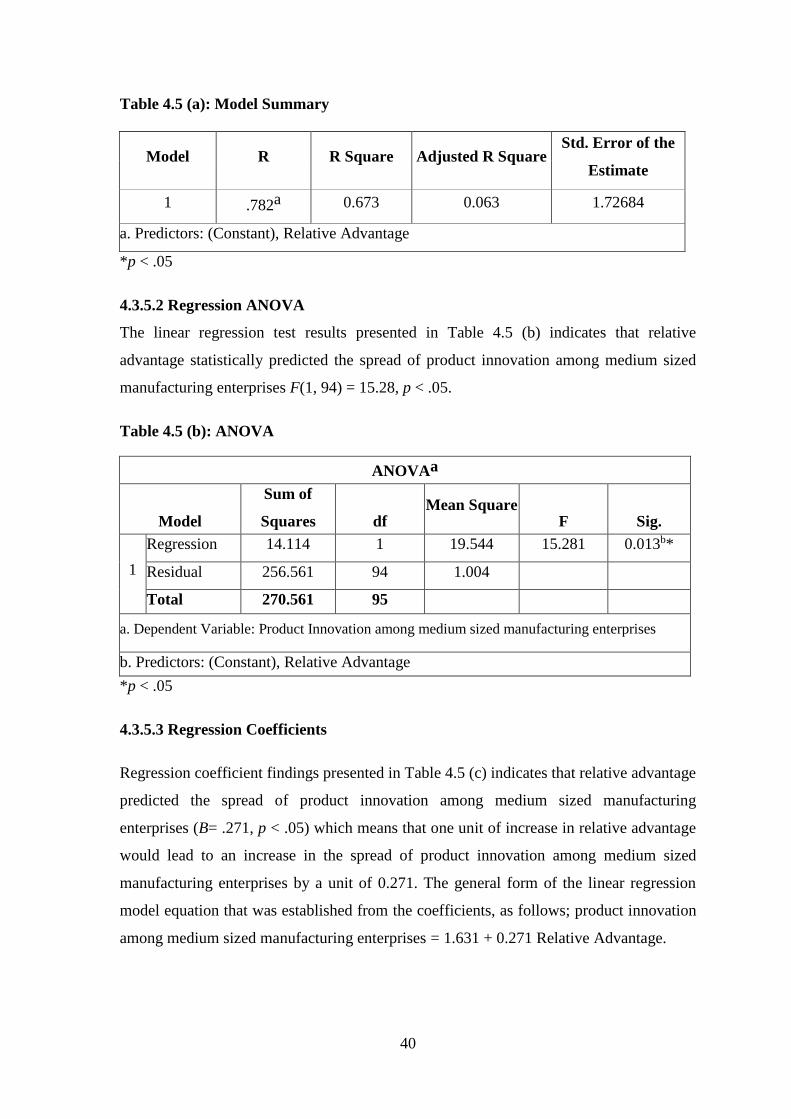
40
Table 4.5 (a): Model Summary
Model R R Square Adjusted R Square Std. Error of the
Estimate
1 .782a 0.673 0.063 1.72684
a. Predictors: (Constant), Relative Advantage
*p < .05
4.3.5.2 Regression ANOVA
The linear regression test results presented in Table 4.5 (b) indicates that relative
advantage statistically predicted the spread of product innovation among medium sized
manufacturing enterprises F(1, 94) = 15.28, p < .05.
Table 4.5 (b): ANOVA
ANOVAa
Model
Sum of
Squares
df Mean Square
F
Sig.
1
Regression 14.114 1 19.544 15.281 0.013b*
Residual 256.561 94 1.004
Total 270.561 95
a. Dependent Variable: Product Innovation among medium sized manufacturing enterprises
b. Predictors: (Constant), Relative Advantage
*p < .05
4.3.5.3 Regression Coefficients
Regression coefficient findings presented in Table 4.5 (c) indicates that relative advantage
predicted the spread of product innovation among medium sized manufacturing
enterprises (B= .271, p < .05) which means that one unit of increase in relative advantage
would lead to an increase in the spread of product innovation among medium sized
manufacturing enterprises by a unit of 0.271. The general form of the linear regression
model equation that was established from the coefficients, as follows; product innovation
among medium sized manufacturing enterprises = 1.631 + 0.271 Relative Advantage.
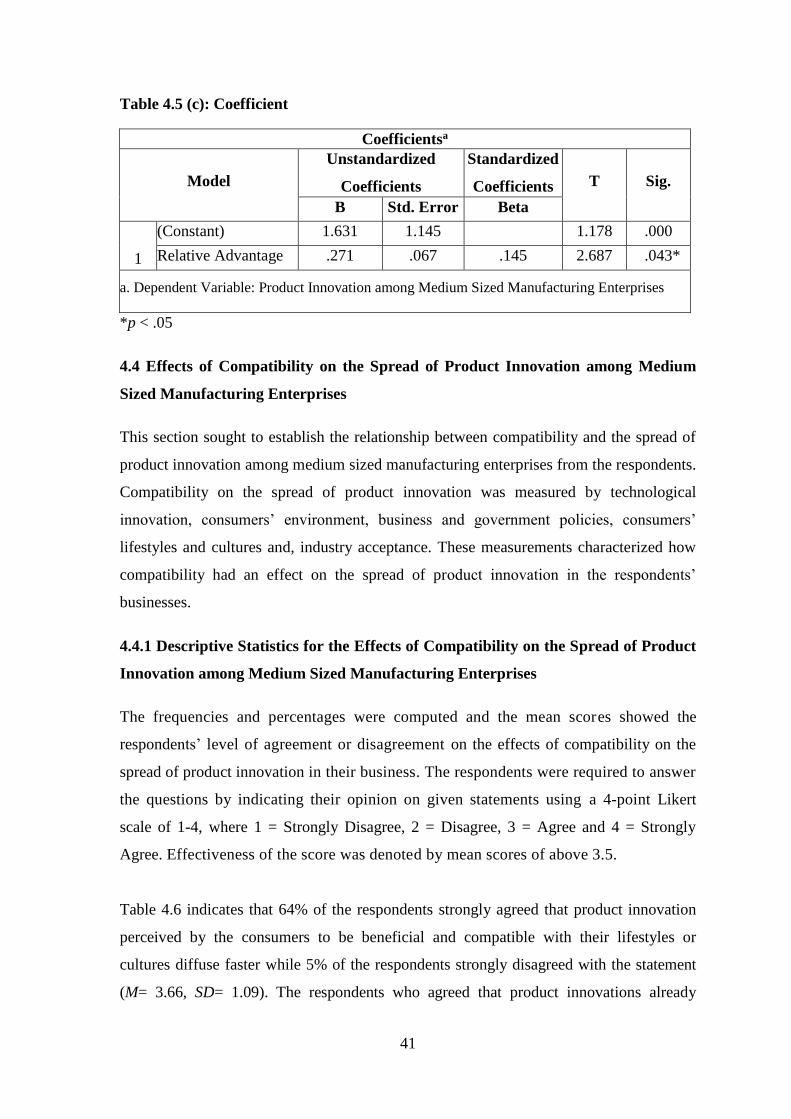
41
Table 4.5 (c): Coefficient
Coefficientsa
Model
Unstandardized
Coefficients
Standardized
Coefficients T Sig.
B Std. Error Beta
1
(Constant) 1.631 1.145 1.178 .000
Relative Advantage .271 .067 .145 2.687 .043*
a. Dependent Variable: Product Innovation among Medium Sized Manufacturing Enterprises
*p < .05
4.4 Effects of Compatibility on the Spread of Product Innovation among Medium
Sized Manufacturing Enterprises
This section sought to establish the relationship between compatibility and the spread of
product innovation among medium sized manufacturing enterprises from the respondents.
Compatibility on the spread of product innovation was measured by technological
innovation, consumers’ environment, business and government policies, consumers’
lifestyles and cultures and, industry acceptance. These measurements characterized how
compatibility had an effect on the spread of product innovation in the respondents’
businesses.
4.4.1 Descriptive Statistics for the Effects of Compatibility on the Spread of Product
Innovation among Medium Sized Manufacturing Enterprises
The frequencies and percentages were computed and the mean scores showed the
respondents’ level of agreement or disagreement on the effects of compatibility on the
spread of product innovation in their business. The respondents were required to answer
the questions by indicating their opinion on given statements using a 4-point Likert
scale of 1-4, where 1 = Strongly Disagree, 2 = Disagree, 3 = Agree and 4 = Strongly
Agree. Effectiveness of the score was denoted by mean scores of above 3.5.
Table 4.6 indicates that 64% of the respondents strongly agreed that product innovation
perceived by the consumers to be beneficial and compatible with their lifestyles or
cultures diffuse faster while 5% of the respondents strongly disagreed with the statement
(M= 3.66, SD= 1.09). The respondents who agreed that product innovations already
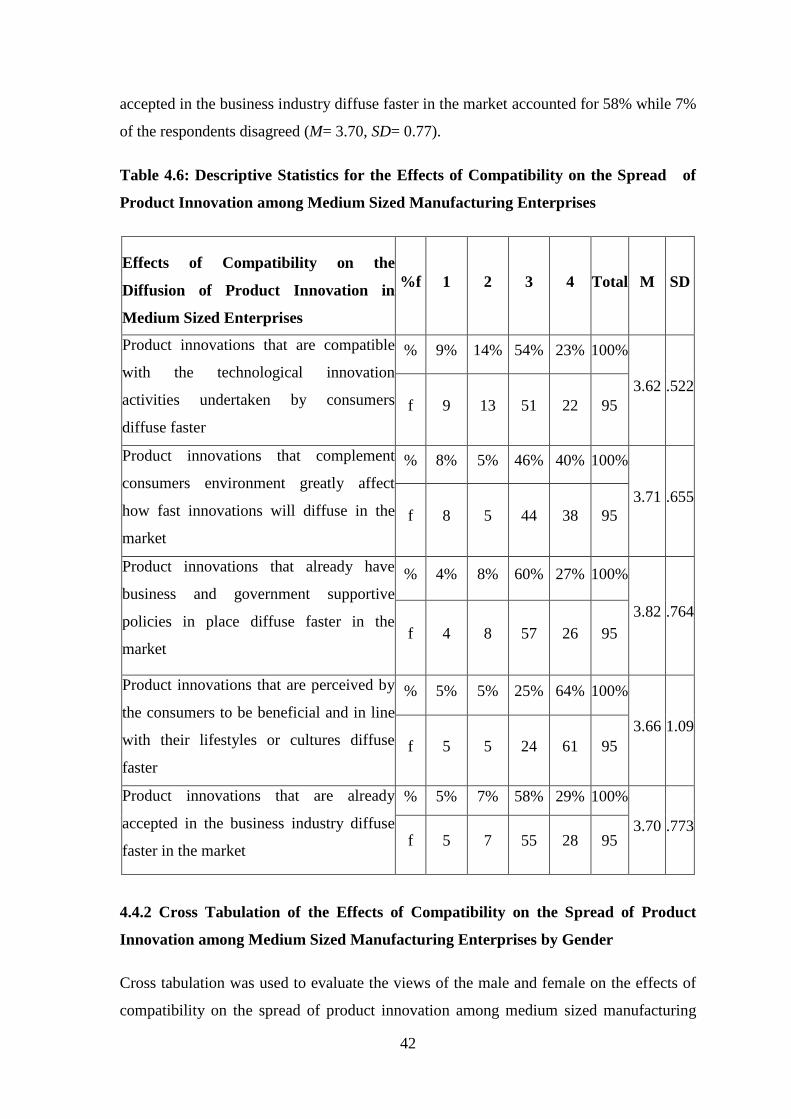
42
accepted in the business industry diffuse faster in the market accounted for 58% while 7%
of the respondents disagreed (M= 3.70, SD= 0.77).
Table 4.6: Descriptive Statistics for the Effects of Compatibility on the Spread of
Product Innovation among Medium Sized Manufacturing Enterprises
Effects of Compatibility on the
Diffusion of Product Innovation in
Medium Sized Enterprises
%f 1 2 3 4 Total M SD
Product innovations that are compatible
with the technological innovation
activities undertaken by consumers
diffuse faster
% 9% 14% 54% 23% 100%
3.62 .522
f 9 13 51 22 95
Product innovations that complement
consumers environment greatly affect
how fast innovations will diffuse in the
market
% 8% 5% 46% 40% 100%
3.71 .655
f 8 5 44 38 95
Product innovations that already have
business and government supportive
policies in place diffuse faster in the
market
% 4% 8% 60% 27% 100%
3.82 .764
f 4 8 57 26 95
Product innovations that are perceived by
the consumers to be beneficial and in line
with their lifestyles or cultures diffuse
faster
% 5% 5% 25% 64% 100%
3.66 1.09
f 5 5 24 61 95
Product innovations that are already
accepted in the business industry diffuse
faster in the market
% 5% 7% 58% 29% 100%
3.70 .773 f 5 7 55 28 95
4.4.2 Cross Tabulation of the Effects of Compatibility on the Spread of Product
Innovation among Medium Sized Manufacturing Enterprises by Gender
Cross tabulation was used to evaluate the views of the male and female on the effects of
compatibility on the spread of product innovation among medium sized manufacturing

43
enterprises. The findings presented in Table 4.7 and Figure 4.7 indicate that the
proportion of male respondents who agreed and strongly agreed that compatibility on the
spread of product innovation had an effect on medium sized manufacturing enterprises
accounted for 34% and 29% respectively compared to that of female respondents which
accounted for 33% and 47% respectively.
Table 4.7: Cross Tabulation of the Effects of Compatibility on the Spread of Product
Innovation among Medium Sized Manufacturing Enterprises by Gender
Strongly
Disagree Disagree Agree Strongly Agree Total
Male f 14 9 22 19 65
% 22% 14% 34% 29% 100%
Female f 2 4 10 14 30
% 7% 13% 33% 47% 100%
Total f 16 32 33 13 95
% 17% 14% 34% 35% 100%
Figure 4.7: Cross Tabulation for the Effects of Compatibility on the Spread of
Product Innovation among Medium Sized Manufacturing Enterprises by Gender
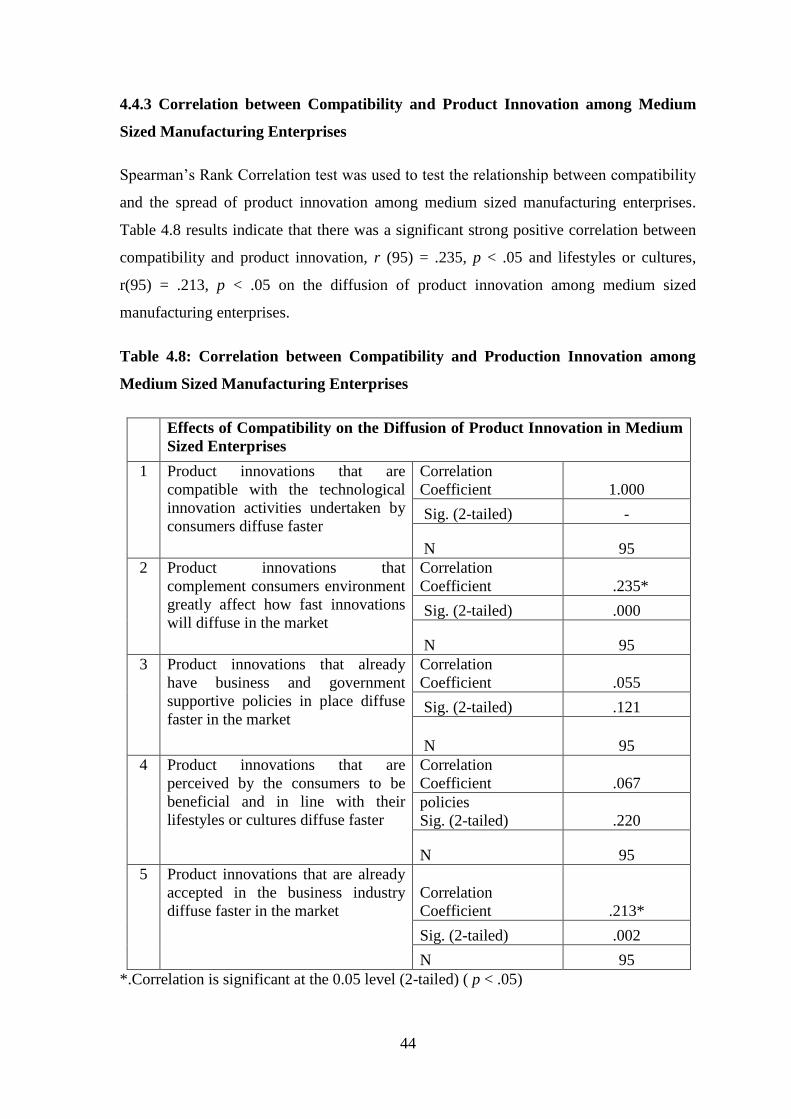
44
4.4.3 Correlation between Compatibility and Product Innovation among Medium
Sized Manufacturing Enterprises
Spearman’s Rank Correlation test was used to test the relationship between compatibility
and the spread of product innovation among medium sized manufacturing enterprises.
Table 4.8 results indicate that there was a significant strong positive correlation between
compatibility and product innovation, r (95) = .235, p < .05 and lifestyles or cultures,
r(95) = .213, p < .05 on the diffusion of product innovation among medium sized
manufacturing enterprises.
Table 4.8: Correlation between Compatibility and Production Innovation among
Medium Sized Manufacturing Enterprises
Effects of Compatibility on the Diffusion of Product Innovation in Medium
Sized Enterprises
1 Product innovations that are
compatible with the technological
innovation activities undertaken by
consumers diffuse faster
Correlation
Coefficient 1.000
Sig. (2-tailed) -
N 95
2 Product innovations that
complement consumers environment
greatly affect how fast innovations
will diffuse in the market
Correlation
Coefficient .235*
Sig. (2-tailed) .000
N 95
3 Product innovations that already
have business and government
supportive policies in place diffuse
faster in the market
Correlation
Coefficient .055
Sig. (2-tailed) .121
N 95
4 Product innovations that are
perceived by the consumers to be
beneficial and in line with their
lifestyles or cultures diffuse faster
Correlation
Coefficient .067
policies
Sig. (2-tailed) .220
N 95
5 Product innovations that are already
accepted in the business industry
diffuse faster in the market
Correlation
Coefficient .213*
Sig. (2-tailed) .002
N 95
*.Correlation is significant at the 0.05 level (2-tailed) ( p < .05)

45
4.4.4 A One Way Analysis of Variance (ANOVA) between Compatibility and
Product Innovation among Medium Sized Manufacturing Enterprises
One Way Analysis of Variance (ANOVA) test was carried out to establish if there were
significant differences between means in respondents’ perception on the effect of
compatibility on the spread of product innovation among medium sized manufacturing
enterprises by gender, designation and years of enterprise existence. Table 4.9 presents
ANOVA findings which indicate that there was a statistically significant difference by
gender F(1, 95) = 5.67, p < .05. However, there was no statistically significant effect by
the years of enterprise existence F(1, 95) = 0.35, p > .05 and the designation F(1, 95) =
0.46, p > .05.
Table 4.9: ANOVA between Effect of Compatibility and Product Innovation among
Medium Sized Manufacturing Enterprises by Gender, Designation and Years of
Enterprise Existence
Effect of Compatibility Sum of
Squares
df
Mean
Square
F
Sig.
Gender
Between Groups 3.116 1 3.116 5.672 .045*
Within Groups 123.889 94 .665
Total 127.005 95
Designation
Between Groups 2.776 1 2.776 1.303 .461
Within Groups 133.909 94 .521
Total 136.685 95
Years of enterprise
existence
Between Groups 3.283 1 3.807 5.562 .352
Within Groups 132.961 94 .976
Total 136.244 95 *p < .05 (Correlation is significant at the 0.05 level (2-tailed).
4.4.5 Regression analysis between Compatibility and Product Innovation among
Medium Sized Manufacturing Enterprises
Linear regression was conducted to establish the extent to which compatibility had an
effect on the spread of product innovation among medium sized manufacturing
enterprises.
4.4.5.1 Model Summary
The findings of the model summary presented in Table 4.10 (a) indicate that compatibility
explained about 54.4% of the variability on the spread of product innovation among

46
medium sized manufacturing enterprises (R2= .544, F(1, 94) =16.12, p < .05) and the
strength of the relationship (r = .594).
Table 4.10 (a): Model Summary
Model R R Square Adjusted R Square Std. Error of the
Estimate
1 .594a 0.544 0.045 1.52340
a. Predictors: (Constant), Compatibility
*p < .05
4.4.5.2 Regression ANOVA
Linear regression ANOVA results presented in Table 4.10 (b) indicates that compatibility
statistically predicted the spread of product innovation among medium sized
manufacturing enterprises F(1, 94) = 16.12, p < .05.
Table 4.10 (b): ANOVA
ANOVAa
Model
Sum of
Squares
df
Mean Square
F
Sig.
1
Regression 13.104 1 16.899 16.124 0.021b*
Residual 247.167 94 1.132
Total 260.271 95
a. Dependent Variable: Product Innovation among medium sized manufacturing enterprises
b. Predictors: (Constant), Compatibility
*p < .05
4.4.5.3. Regression Coefficient
Regressions coefficient findings presented in Table 4.10 (c) indicates that compatibility
predicted the spread of product innovation among medium sized manufacturing
enterprises (B= .354, p < .05) which means that one unit of increase in compatibility
would lead to an increase in the spread of product innovation among medium sized
manufacturing enterprises by a unit of 0.354. The general form from the coefficients of
the linear regression model equation that was established was as follows; product
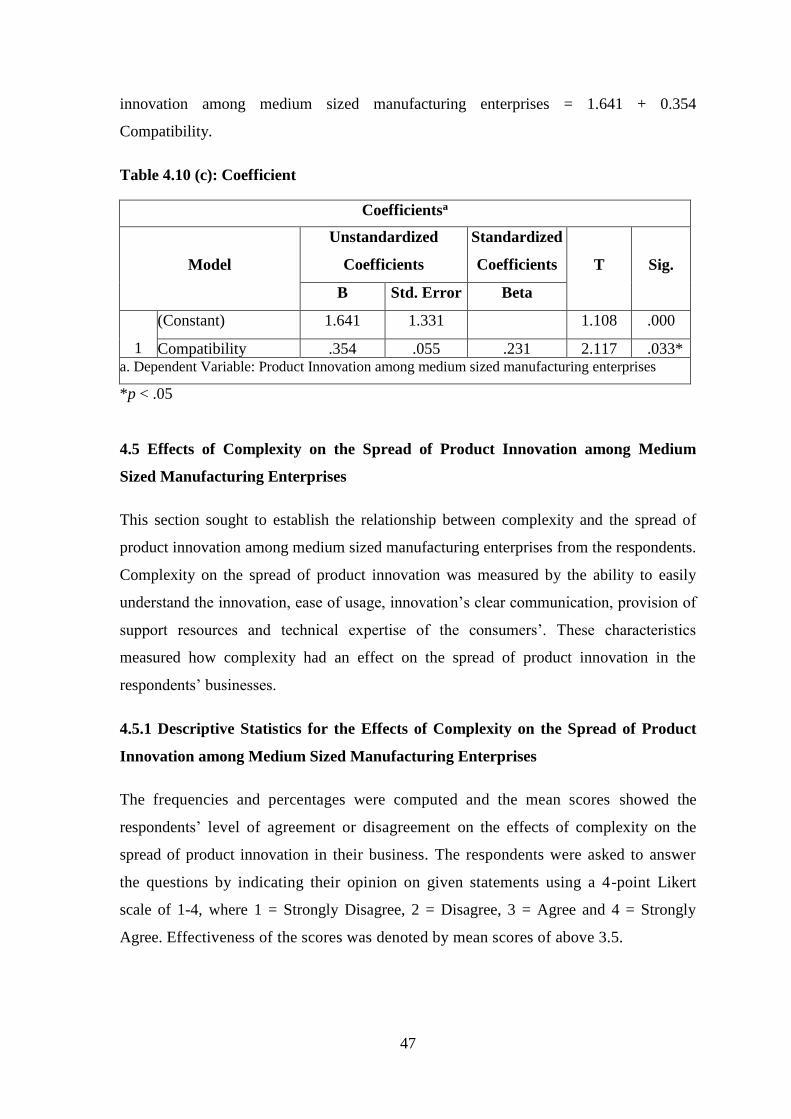
47
innovation among medium sized manufacturing enterprises = 1.641 + 0.354
Compatibility.
Table 4.10 (c): Coefficient
Coefficientsa
Model
Unstandardized
Coefficients
Standardized
Coefficients T Sig.
B Std. Error Beta
1
(Constant) 1.641 1.331 1.108 .000
Compatibility .354 .055 .231 2.117 .033* a. Dependent Variable: Product Innovation among medium sized manufacturing enterprises
*p < .05
4.5 Effects of Complexity on the Spread of Product Innovation among Medium
Sized Manufacturing Enterprises
This section sought to establish the relationship between complexity and the spread of
product innovation among medium sized manufacturing enterprises from the respondents.
Complexity on the spread of product innovation was measured by the ability to easily
understand the innovation, ease of usage, innovation’s clear communication, provision of
support resources and technical expertise of the consumers’. These characteristics
measured how complexity had an effect on the spread of product innovation in the
respondents’ businesses.
4.5.1 Descriptive Statistics for the Effects of Complexity on the Spread of Product
Innovation among Medium Sized Manufacturing Enterprises
The frequencies and percentages were computed and the mean scores showed the
respondents’ level of agreement or disagreement on the effects of complexity on the
spread of product innovation in their business. The respondents were asked to answer
the questions by indicating their opinion on given statements using a 4-point Likert
scale of 1-4, where 1 = Strongly Disagree, 2 = Disagree, 3 = Agree and 4 = Strongly
Agree. Effectiveness of the scores was denoted by mean scores of above 3.5.

48
Table 4.11 results indicate that 51% of the respondents strongly agreed that product
innovations that are perceived easy to understand by consumers diffuse faster while 6% of
the respondents strongly disagreed (M = 3.76, SD = 0.56). The respondents who agreed
that product innovations that have been communicated clearly to the consumers diffuse
faster accounted for 56% while 6% of the respondents disagreed (M = 3.61, SD = 1.12).
Table 4.11: Descriptive Statistics for the Effects of Complexity on the Spread of
Product Innovation among Medium Sized Manufacturing Enterprises
Effects of Complexity on the Diffusion
of Product Innovation in Medium Sized
Enterprises
%f 1 2 3 4 Total M SD
Product innovations that are perceived
easy to understand by consumers diffuse
faster
% 6% 15% 28% 51% 100%
3.76 .561
f 6 14 27 48 95
Product innovations that are simple and
easy to use diffuse faster in the market
% 7% 15% 43% 35% 100% 3.80 .675
f 7 14 41 33 95
Product innovations that have been
communicated clearly to the consumers
diffuse faster
% 5% 6% 56% 33% 100%
3.61 .809
f 5 6 53 31 95
Product innovations that provide
consumers with support resources on
usage diffuse faster
% 4% 12% 63% 21% 100%
3.73 1.12
f 4 11 60 20 95
Product innovations that consumers have
the technical expertise to handle diffuse
faster in the market
% 2% 9% 61% 27% 100%
3.56 .609 f 2 9 58 26 95
4.5.2 Cross Tabulation of the Effects of Complexity on the Spread of Product
Innovation among Medium Sized Manufacturing Enterprises by Gender
Cross tabulation was used to evaluate the views of the male and female on the effects of
complexity on the spread of product innovation among medium sized manufacturing
enterprises. Table 4.12 and Figure 4.8 present findings which indicate that the proportion
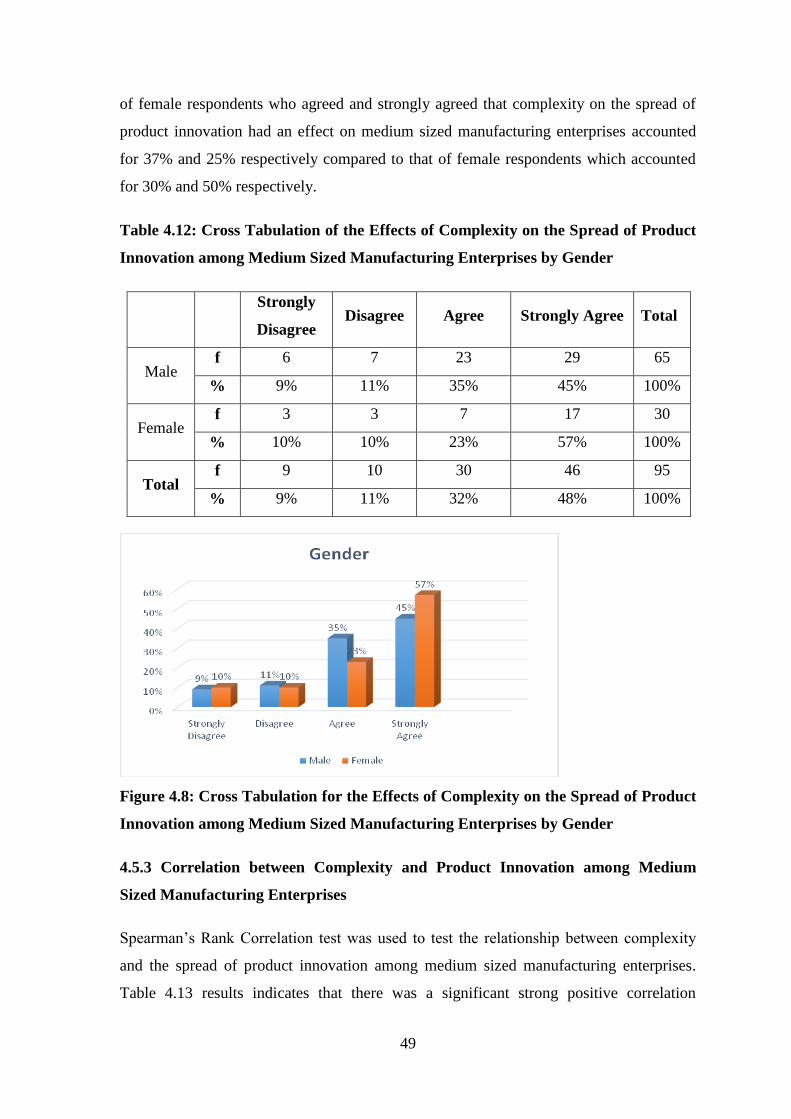
49
of female respondents who agreed and strongly agreed that complexity on the spread of
product innovation had an effect on medium sized manufacturing enterprises accounted
for 37% and 25% respectively compared to that of female respondents which accounted
for 30% and 50% respectively.
Table 4.12: Cross Tabulation of the Effects of Complexity on the Spread of Product
Innovation among Medium Sized Manufacturing Enterprises by Gender
Strongly
Disagree Disagree Agree Strongly Agree Total
Male f 6 7 23 29 65
% 9% 11% 35% 45% 100%
Female f 3 3 7 17 30
% 10% 10% 23% 57% 100%
Total f 9 10 30 46 95
% 9% 11% 32% 48% 100%
Figure 4.8: Cross Tabulation for the Effects of Complexity on the Spread of Product
Innovation among Medium Sized Manufacturing Enterprises by Gender
4.5.3 Correlation between Complexity and Product Innovation among Medium
Sized Manufacturing Enterprises
Spearman’s Rank Correlation test was used to test the relationship between complexity
and the spread of product innovation among medium sized manufacturing enterprises.
Table 4.13 results indicates that there was a significant strong positive correlation

50
between complexity and clear communication, r(95) = .163, p < .05 on the diffusion of
product innovation among medium sized manufacturing enterprises.
Table 4.13: Correlation between Complexity and Production Innovation among
Medium Sized Manufacturing Enterprises
Effects of Complexity on the Diffusion of Product Innovation in Medium
Sized Enterprises
1 Product innovations that are
perceived easy to understand
by consumers diffuse faster
Correlation Coefficient 1.000
Sig. (2-tailed) -
N 95
2 Product innovations that are
simple and easy to use diffuse
faster in the market
Correlation Coefficient .081
Sig. (2-tailed) .461
N 95
3 Product innovations that have
been communicated clearly to
the consumers diffuse faster
Correlation Coefficient .018
Sig. (2-tailed) .123
N 95
4 Product innovations that
provide consumers with
support resources on usage
diffuse faster
Correlation Coefficient .163*
Sig. (2-tailed) .001
N 95
5 Product innovations that
consumers have the technical
expertise to handle diffuse
faster in the market
Correlation Coefficient .013
Sig. (2-tailed) .854
N 95
*.Correlation is significant at the 0.05 level (2-tailed). (p < .05)
4.4.4 A One Way Analysis of Variance (ANOVA) between Complexity and Product
Innovation among Medium Sized Manufacturing Enterprises
One Way Analysis of Variance (ANOVA) test was carried out to establish if there were
significant differences between means in respondents’ perception on the effect of
complexity on the spread of product innovation among medium sized manufacturing
enterprises by gender, designation and years of enterprise existence. Table 4.14 ANOVA
findings presented indicate that there were statistically significant difference by years of
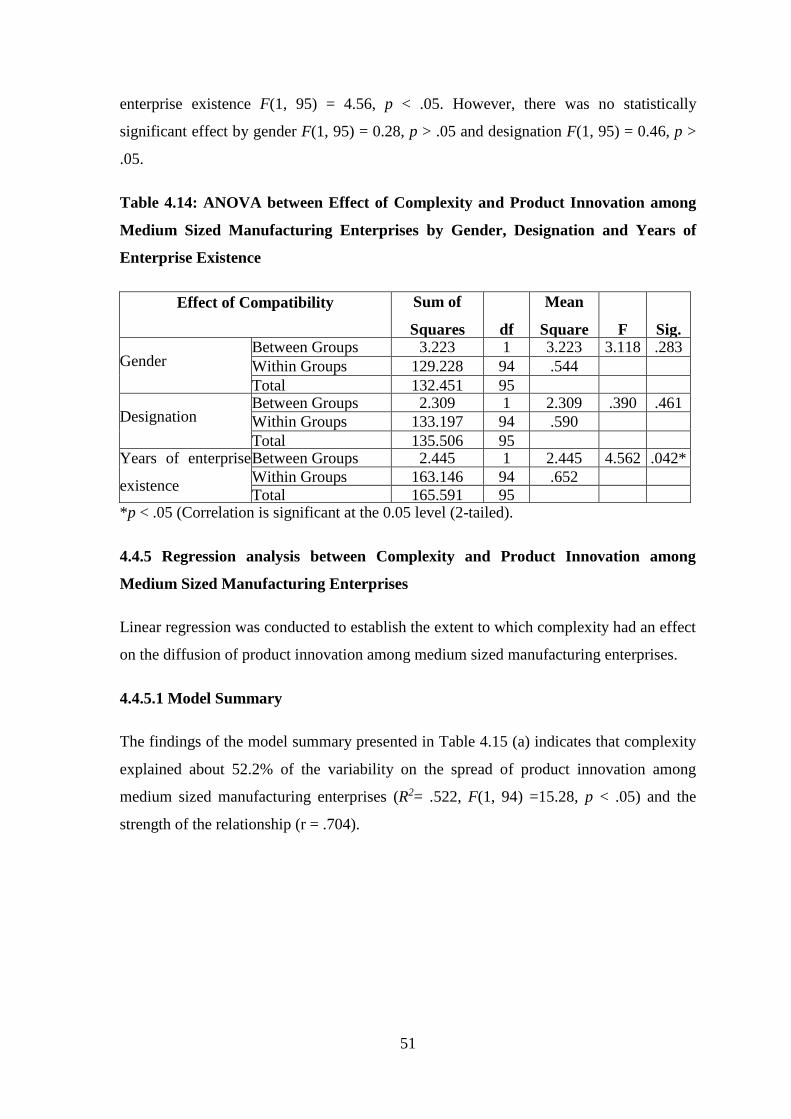
51
enterprise existence F(1, 95) = 4.56, p < .05. However, there was no statistically
significant effect by gender F(1, 95) = 0.28, p > .05 and designation F(1, 95) = 0.46, p >
.05.
Table 4.14: ANOVA between Effect of Complexity and Product Innovation among
Medium Sized Manufacturing Enterprises by Gender, Designation and Years of
Enterprise Existence
Effect of Compatibility Sum of
Squares
df
Mean
Square
F
Sig.
Gender Between Groups 3.223 1 3.223 3.118 .283
Within Groups 129.228 94 .544
Total 132.451 95
Designation Between Groups 2.309 1 2.309 .390 .461
Within Groups 133.197 94 .590
Total 135.506 95 Years of enterprise
existence
Between Groups 2.445 1 2.445 4.562 .042*
Within Groups 163.146 94 .652
Total 165.591 95 *p < .05 (Correlation is significant at the 0.05 level (2-tailed).
4.4.5 Regression analysis between Complexity and Product Innovation among
Medium Sized Manufacturing Enterprises
Linear regression was conducted to establish the extent to which complexity had an effect
on the diffusion of product innovation among medium sized manufacturing enterprises.
4.4.5.1 Model Summary
The findings of the model summary presented in Table 4.15 (a) indicates that complexity
explained about 52.2% of the variability on the spread of product innovation among
medium sized manufacturing enterprises (R2= .522, F(1, 94) =15.28, p < .05) and the
strength of the relationship (r = .704).

52
Table 4.15 (a): Model Summary
Model R R Square Adjusted R Square Std. Error of the
Estimate
1 .704a 0.522 0.063 1.40061
a. Predictors: (Constant), Complexity
*p < .05
4.4.5.2 Regression ANOVA
The linear regression ANOVA results presented in Table 4.5 (b) indicates that complexity
statistically predicted the diffusion of product innovation among medium sized
manufacturing enterprises F(1, 94) = 13.69, p < .05.
Table 4.15 (b): ANOVA
ANOVAa
Model
Sum of
Squares
df Mean Square
F
Sig.
1
Regression 18.109 1 14.303 13.691 0.046b*
Residual 257.502 94 1.223
Total 270.561 95
a. Dependent Variable: Product Innovation among medium sized manufacturing
enterprises b. Predictors: (Constant), Complexity
*p < .05
4.4.5.3 Regression Coefficient
Regressions coefficient findings presented in Table 4.5 (c) indicates that complexity
predicted the diffusion of product innovation among medium sized manufacturing
enterprises (B= .311, p < .05). This means that one unit of increase in complexity would
lead to an increase in diffusion of product innovation among medium sized manufacturing
enterprises by a unit of 0.311. From the coefficients, the general form of the linear
regression model equation that was established was as follows; product innovation among
medium sized manufacturing enterprises = 1.428 + 0.311 Complexity.

53
Table 4.15 (c): Coefficient
Coefficientsa
Model
Unstandardized
Coefficients
Standardized
Coefficients T Sig.
B Std. Error Beta
1
(Constant) 1.428 1.301 1.190 .000
Complexity .311 .081 .301 2.611 .034*
a. Dependent Variable: Product Innovation among medium sized manufacturing enterprises
*p < .05
4.6 Chapter Summary
This chapter presents the summary of the major findings of the research questions. The
finding on the first research question indicates that in terms of the effects of relative
advantage on the diffusion of product innovation among medium sized manufacturing
enterprises, the proportion of male respondents who agreed that relative advantage had an
effect on diffusion of product innovation accounted for 37% while female respondents
accounted for 30%. The results of the Spearman Rank Correlation test indicated that there
was a significant positive correlation between relative advantage and product innovations
that are perceived to be more cost effective diffuse faster among medium sized
manufacturing enterprises, r(95) = .188, p < .05. One Way ANOVA test findings
indicated that there was a significant difference by gender F(1, 94) = 4.10, p < .05 and the
years of enterprise existence F(1, 94) = 5.56, p < .05. Linear regression analysis indicated
that relative advantage explained 67.3% of the variability on the spread of product
innovation among medium sized manufacturing enterprises, R2= .673 and statistically
significantly predicted the spread of product innovation, F(1, 94) =15.28, p < .05.
Relative advantage had a statistically significant effect on diffusion of product innovation
among medium sized manufacturing enterprises; B= 0.271, p < .05.
Concerning effect of compatibility on diffusion of product innovation among medium
sized manufacturing enterprises the findings indicated the proportion of female
respondents who strongly agreed that compatibility had an effect on the diffusion of
product innovation among medium sized manufacturing enterprises accounted for 47%
54
while male respondents were 29%. Spearman Rank Correlation test results showed that
compatibility was strongly correlated to product innovation, r(95) = .235, p < .05 and
lifestyles or cultures, r(95) = .213, p < .05 on the diffusion of product innovation among
medium sized manufacturing enterprises. Results from One Way ANOVA test showed
that there was a statistically significant difference by gender F(1, 95) = 5.67, p < .05. The
linear regression analysis indicated that compatibility explained 54.4% of the variability
in diffusion of product innovation among medium sized manufacturing enterprises, R2=
0.54 and statistically significantly had an effect on diffusion of product innovation among
medium sized manufacturing enterprise F(1, 94) = 16.12, p < .05.
Finally, findings from the third research question on the effects of complexity on
diffusion of product innovation among medium sized manufacturing enterprises
indicated, the proportion of female respondents who agreed that complexity had an effect
on diffusion of product innovation accounted for 37% while that of male respondents was
30%. Spearman Rank Correlation test indicated that complexity was significantly
correlated to clear communication, r(95) = .163, p < .05 on the diffusion of product
innovation among medium sized manufacturing enterprises. One Way ANOVA results
tests indicated that there was a statistically significant difference by years of enterprise
existence F(1, 95) = 4.56, p < .05. The linear regression analysis indicated that
complexity statistically significantly predicted the diffusion of product innovation among
medium sized manufacturing enterprises; R2= 0.52, F(1, 94) = 13.69, p < .05. Finding of
this study are discussed in the next chapter.

55
CHAPTER FIVE
5.0 SUMMARY, DISCUSSION, CONCLUSIONS AND RECOMMENDATION
5.1 Introduction
This chapter presents the summary of the study along, a detailed discussion of the results,
conclusions and the recommendations of the study. The discussion of the results,
conclusions, and recommendations for improvements are presented as per the study
research questions.
5.2 Summary
The purpose of this study was to determine the factors affecting diffusion of product
innovation in medium sized manufacturing enterprises in Kenya. The study was guided
by the following research questions; How does relative advantage affect the diffusion of
product innovation in medium sized manufacturing enterprises in Kenya? How does
compatibility affect the diffusion of product innovation in medium sized manufacturing
enterprises in Kenya? And lastly, how does complexity affect the diffusion of product
innovation in medium sized manufacturing enterprises in Kenya
Descriptive correlational research design was utilized by this study. The population
comprised one hundred and eight (108) medium sized manufacturing enterprises that had
been operating in the last nine years in Kenya at the time of the study. A stratified random
sampling technique was used to select a sample of one hundred and two (102) medium
sized manufacturing enterprises from the total population. A questionnaire was utilized to
collect data in this study. Descriptive and inferential statistics techniques were used to
analyze the data. The descriptive statistical analysis included frequencies and percentage
distributions, mean and standard deviation while the inferential statistical analysis
included Spearman’s Rank Correlation, One Way Aanalysis of Variance (ANOVA) and
Regression analysis. Finally, the data was analyzed through the Statistical Package for
the Social Sciences (SPSS) tool and results presented in tables and figures.
Findings on the first research question concerning the effect of relative advantage on
diffusion of innovation among medium sized manufacturing enterprises revealed that

56
male respondents who agreed that relative advantage had an effect on the diffusion of
product innovation accounted for 37% while that of female respondents accounted for
30%. Findings from Spearman Rank Correlation test indicated that there was a
statistically significant positive correlation between relative advantage and product
innovations that are perceived to be more cost effective diffuse faster among medium
sized manufacturing enterprises, r(95) = .188, p < .05. One Way ANOVA results revealed
that there was a statistically significant difference by gender F(1, 94) = 4.10, p < .05 and
the years of enterprise existence F(1, 94) = 5.56, p < .05. Linear regression analysis
indicated that relative advantage explained 67.3% of the variability on the spread of
product innovation among medium sized manufacturing enterprises, R2= .673 and
statistically significantly predicted the spread of product innovation, F(1, 94) =15.28, p <
.05.
Findings on the second research question concerning the effect of compatibility on
diffusion of product innovation among medium sized manufacturing enterprises, revealed
the proportion of female respondents who strongly agreed that compatibility had an effect
on the diffusion of product innovation accounted for 47% while male respondents were
29%. Spearman Rank Correlation test showed that compatibility was strongly correlated
to technological innovation, r(95) = .235, p < .05 and lifestyles or cultures, r(95) = .213,
p < .05 on the diffusion of product innovation among medium sized manufacturing
enterprises. One Way ANOVA revealed that there was a statistically significant
difference by gender F(1, 95) = 5.67, p < .05. The linear regression analysis indicated that
compatibility explained 54.4% of the variability in diffusion of product innovation among
medium sized manufacturing enterprises, R2= 0.54 and statistically significantly predicted
the spread of product innovation among the medium sized manufacturing enterprises,
F(1, 94) = 16.12, p < .05.
Lastly, findings of the third research question concerning the effect of complexity on
diffusion of product innovation among medium sized manufacturing enterprises, revealed
the proportion of female respondents who agreed that complexity had an effect on the
diffusion of product innovation accounted for 37% while that of male respondents was
30%. Spearman Rank Correlation test showed that complexity was significantly
correlated to clear communication, r(95) = .163, p < .05 on the diffusion of product
innovation among medium sized manufacturing enterprises. The results from One Way

57
ANOVA test indicated that there was a statistically significant difference by years of
enterprise existence F(1, 95) = 4.56, p < .05. The linear regression analysis indicated that
complexity explained 52.2% of the variability in diffusion of product innovation among
medium sized manufacturing enterprises, R2= 0.52 and statistically significantly predicted
the spread of product innovation among medium sized manufacturing enterprises, F(1,
94) = 13.69, p < .05.
5.3 Discussion
This section discusses the results of the study based on the study’s research questions.
The findings of the research are discussed in relation with the literature review.
5.3.1 Effects of Relative Advantage on the Spread of Product Innovation among
Medium Sized Manufacturing Enterprises
The results showed that 65% and 23% of the respondents agreed and strongly agreed
respectively that product innovations that are perceived to be more effective in their
application diffuse faster. This finding agrees with a study by Lu et al, (2013) who
acknowledged relative advantage as important determinant of product innovation
adoption among consumers. It is expected that if medium sized manufacturing enterprises
believe that product characteristics affect how products diffuse in the market, they will be
keen to manufacture products with great and additional benefits.
Spearman Rank Correlation test indicated that there was a statistically significant positive
correlation between relative advantage and product innovations that are perceived to be
more cost effective diffuse faster among medium sized manufacturing enterprises, r(95) =
.188, p < .05. The findings confirmed the findings of a study by Dixon et al. (2012) who
acknowledged that cost of product innovation is an important influencing factor in
diffusion of product innovation among enterprises. Innovations are highly likely to be
adopted if they are considered to save cost.
One Way ANOVA test established that there was a significant effect by gender F(1, 94) =
4.10, p < .05 and the years of enterprise existence F(1, 94) = 5.56, p < .05. The finding
contradicts the results of a study by Frimpong & Nwankwo (2012) which concluded that
gender differences do not play a role in the effect of relative advantage in diffusion of
58
product innovation among medium sized manufacturing enterprises. This variable puts
emphasis on relative advantage by gender on products offered and does not indicate much
difference in the spread of product innovation by gender. The contradiction between the
studies may be explained by potential differences in business situations facing business
owners targeting product innovation based on marketing activities and programs that are
geared towards determining the target market’s perceptions, behavior and buying
processes (Gardner, 2013).
Linear regression analysis showed that relative advantage explained 67.3% of the
variability on the spread of product innovation among medium sized manufacturing
enterprises, R2= .673 and significantly predicted the spread of product innovation among
medium sized manufacturing enterprises (B= 0.271, p < .05. These findings agree with a
study by Matlay and Weathead (2013) which found that the most important determinant
of the benefit derived from adopting a new product is the amount of improvement which
the product innovation offers over any previous product. This is to a great extent
determined by the extent to which there exist substitute older innovations that are fairly
close. New product innovations that provide better quality and solutions than similar
others also have better chance to diffuse in the market. Relative advantage of a new
product is one important factor for a new product to be recognized and ensure the
diffusion in the market and adoption by customers. This can be reinforced by raising
partners’ satisfaction, trust, and commitment, in addition to the effort in creating
competitive products which provide total solutions for partners leading to success of new
products spread (Hung et al, 2010).
5.3.2 Effects of Compatibility on the Spread of Product Innovation among Medium
Sized Manufacturing Enterprises
The findings showed that 54% and 23% of the respondents agreed and strongly agreed
respectively felt that product innovations that are compatible with the technological
innovation activities undertaken by consumers diffuse faster. This finding agrees with the
study by Huy (2012) that the key factor characterizing product innovation includes both
technical and organizational compatibility. Compatibility has been found to be a
significant determinant of diffusion and adoption because it deals with perception of the
importance of the innovation in performing various tasks presently and in future. For
instance, if new products are compatible with the traditional way of performing various

59
activities, with the existing values and mentality of the professionals, and with different
communication parts involving day-today operations and their future development, then a
higher rate of diffusion will occur (Cupolas, 2013).
Spearman Rank Correlation test showed that compatibility was strongly correlated to
lifestyles or cultures, r(95) = .213, p < .05 on the diffusion of product innovation among
medium sized manufacturing enterprises. These results confirm study findings by
Oliveira and Martins (2011) that an organization’s culture can be a major strength when it
is consistent with the succession and thus can be a powerful driving force in
implementation and spread of product innovations. Diffusion is supported, on one hand,
by social networks of influences where the influence process is carried out by direct
contact between individuals in personal networks. On the other hand, it is supported in the
social system trends at micro level (individual), based on the exposure level, the
individual characteristics evolution and on the factors that influence decision making.
Issues surrounding individual persons are an important aspect of the diffusion of product
innovations. Individual factors based on demographics such as age and genders have an
effect on the spread of innovation (Mourad & Tolba, 2014).
The One Way ANOVA test revealed that there was a statistically significant difference by
gender F(1, 95) = 5.67, p < .05. The findings are similar to the study by Al-Qirim (2013)
which established that innovations developed by female managers that are compatible
with the intended adopters' values, norms, and perceived needs are more readily diffuse.
Lack of compatibility not only makes potential adopters lose their confidence to the
product innovation but also leads to the failure of innovation diffusion.
Linear regression analysis showed that compatibility explained 54.4% of the variability in
diffusion of product innovation among medium sized manufacturing enterprises R2= 0.54
and statistically significantly predicted the spread of product innovation among medium
sized manufacturing enterprises. The findings are in support of the research by Rogers
(2003) who emphasized that products that are recently launched in the market diffuse
faster in comparison with the situation several years ago. This fact is a result of the
emergence of different players in the market. One of the main players that accelerate the
diffusion process is the opinion leader. Opinion leaders are identified as having greater
access to mass media as well as interpersonal networks in comparison with their
followers. In addition, they are perceived as having higher socio-economic status and
60
tendency to adopt new innovative ideas before their followers. It has been empirically
proved that opinion leaders influence the consumer decision-making process through
spreading positive word of mouth. This relationship was supported by the diffusion
research, which highlight that opinion leaders influence the evaluation of new innovation
and hence they affect the rate of diffusion (Dearing, 2012).
5.3.3 Effects of Complexity on the Spread of Product Innovation among Medium
Sized Manufacturing Enterprises
The findings showed that 51% and 28% of the respondents strongly agreed and agreed
that product innovations that are perceived easy to understand by consumers diffuse
faster. The findings are in line with a study by Rogers (2003) who found out that new idea
that are simpler to understand by members of a social system diffuse more rapidly than
innovations that require the adopter to develop new skills and understanding. A low level
of complexity leads to higher diffusion rate or complexity increases the rate of rejection.
Medium sized enterprises differ from large companies’; Bahaddad et al. (2013) argued
that they focus on simple methods to manage their operations that require less advanced
technical expertise and a smaller number of professionals who depend on the owner or
executive director for solutions. These enterprises follow simple management form and
avoid complex governance and complex innovations that are difficult to understand.
Spearman Rank Correlation test showed that complexity was significantly correlated to
clear communication, r(95) = .163, p < .05 on the diffusion of product innovation among
medium sized manufacturing enterprises. This is consistent with the findings by Yung
and Shin (2013) that people obtain new information and adopt new technology when they
have just a contact with others who already had the new product while in game-theoretic
models, a user adopts a new product innovation only if the product (behavior) maximizes
her utility, which increases with the number of neighbors who adopt the same innovation.
The One Way ANOVA test revealed that there was a statistically significant difference by
years of enterprise existence F(1, 95) = 4.56, p < .05. The findings are similar to the study
by Oliviera and Martins (2011) that clearly indicated that relationships and coordination
comes about from vast enterprise operational existence between workers in medium sized
enterprises supported the diffusion process. Therefore, diffusion of innovation mandates
joint efforts integrated with years of business existence and expertise from both the
61
organization and its consumers in the market place. Creating platforms for innovation
diffusion and adoption involves funding and commitment.
Linear regression analysis indicated that complexity explained 52.2% of the variability in
diffusion of product innovation among medium sized manufacturing enterprises, R2= 0.52
and statistically significantly predicted the spread of product innovation among medium
sized manufacturing enterprises, F(1, 94) = 13.69, p < .05. These findings are in line with
a study by Mahazir and Mohd (2012) who acknowledged that perceived complexity is a
vital factor influencing the diffusion of innovation and that the likelihood of diffusion of
innovation is inversely related to the perceived complexity variable especially amongst
the medium sized enterprises. The introduction of new product might require the
consumers to develop new skills in order to use the new innovation. The measurement of
perceived complexity or ease of use can be in the context of how innovation can be easily
controlled, the degree of flawlessness, reasonableness, and adaptability to changes, user
friendliness, and how easy it is for one to become skilful in using the product. Al-Qirim
(2013) found an inverse relationship between the likelihood of diffusion and perception of
innovation complexity.
5.4 Conclusions
The following conclusions were made from the major findings discussion:
5.4.1 Effects of Relative Advantage on the Spread of Product Innovation among
Medium Sized Manufacturing Enterprises
Regression analysis revealed that there was a significant positive relationship between
relative advantages on the spread of product innovation among medium sized
manufacturing enterprises. The findings indicated that relative advantage predicted about
67.3% of the variability on the spread of product innovation among medium sized
manufacturing enterprises (R2= .673, F(1, 94) =15.28, p < .05). Based on these findings,
the study concludes that relative advantage based on job effectiveness, economic
profitability, time, cost, effort, convenience and efficiency results in faster diffusion of
product innovation among medium sized manufacturing enterprises.
62
5.4.2 Effects of Compatibility on the Spread of Product Innovation among Medium
Sized Manufacturing Enterprises
Findings from the regression analysis revealed that there was a significant positive
relationship between compatibility on the spread of product innovation among medium
sized manufacturing enterprises. The findings indicated that compatibility predicted about
54.4% of the variability on the spread of product innovation among medium sized
manufacturing enterprises (R2= .544, F(1, 94) =16.12, p < .05). Based on these findings,
the study concludes that technological, environmental, organizational and individual
factors compatible with the intended adopters' values, norms, and perceived needs diffuse
in the market.
5.4.3 Effects of Complexity on the Spread of Product Innovation among Medium
Sized Manufacturing Enterprises
Findings from the regression analysis revealed that there was a significant positive
relationship between complexity on the spread of product innovation among medium
sized manufacturing enterprises. The findings indicated that complexity predicted about
52.2% of the variability on the spread of product innovation among medium sized
manufacturing enterprises (R2= .522, F(1, 94) =15.28, p < .05). In technology-intensive
industries, the pace and complexity of product innovations changes create many
uncertainties for organizations which in turn, force organizations to innovate continuously
to be competitive. Some of these innovations are in the manufacturing of communication
equipment, computers and other electronic equipment. Therefore, the study concludes
that the level of understanding, communication, technical and social skills plays a critical
role towards faster diffusion of product innovation among medium sized manufacturing
enterprises.
5.5 Recommendations
The following are recommendations for the factors affecting diffusion of product
innovation among medium sized manufacturing enterprises in Kenya.

63
5.5.1 Recommendations for Improvement
5.5.1.1 Effects of Relative Advantage on the Spread of Product Innovation among
Medium Sized Manufacturing Enterprises
From the study, it is clear that medium sized manufacturing enterprises have relative
advantage of innovation and its positive relation with diffusion speed hence, the greater
the perceived relative advantage of an innovation the faster its diffusion. The study
recommends that the medium sized manufacturing enterprises should establish a unique
and convenient product innovation strategy to tap into the market as well as identify
alternative methods of promoting innovative products that are easy to use in order to grow
and gain competitive advantage in the long run. This is because the number of potential
adopters will increase over time, expanding the size of the adopting population to a
particular product innovation.
5.5.1.2 Effects of Compatibility on the Spread of Product Innovation among Medium
Sized Manufacturing Enterprises
The study established that innovations that are compatible with the intended adopters'
values, norms, and perceived needs are diffuse easily. Enterprises that serve broader
markets with greater market scope are more likely to have their innovations diffuse
rapidly; the reasonable argument for this observation is that if the innovation directly
affects the competition and consumers, then the adopter will have an incentive to take up
the innovation. Thus, the study recommends that owners and managers of medium sized
manufacturing enterprises should focus on participating in enterprise development
programs that will improve technological, environmental, organizational and individual
factors skills and abilities in order for product innovations to diffuse faster.
5.5.1.3 Effects of Complexity on the Spread of Product Innovation among Medium
Sized Manufacturing Enterprises
The study findings revealed that in order for medium sized manufacturing enterprises
product innovations to diffuse faster, new ideas that are simpler to understand by
members of a social system need to be implemented. Therefore, the study recommends
that owners and managers of medium sized manufacturing enterprises should perceive

64
ease of use of innovative products as powerful in explaining satisfaction of consumer
needs and wants.
5.5.2 Recommendations for Further Studies
This study suggests that further research should be conducted to investigate the impact of
access to diffusion of product innovation on the growth of medium sized manufacturing
enterprises in Kenya due to the study’s limitation on diffusion of product innovation
effects on enterprises development.
65
REFERENCES
Ahmed, I., Shahzad, A., Umar, M., & Khilji, B. (2013). Information technology and
SMEs in Pakistan. International Business Research, 3, 237–240.
Allard, G., Martinez, C. & Williams, C. (2012). Political instability, pro-business market
reforms and their impacts on national systems of innovation. Research Policy 41:
638–651.
Al-Qirim, S. (2013). Micro, small and medium-sized enterprises development in the
Kingdom of Saudi Arabia: Problems and constraints. World Journal of
Entrepreneurship, Management and Sustainable Development, 8, 217–232.
Altuwaijri, M. (2011). Health information technology strategic planning alignment in
Saudi hospitals: A historical perspective. Journal of Health Informatics in
Developing Countries, 5(2), 338–355.
Amendolagine, V., Boly, A., Coniglio, N., Prota, F. & Seric, A. (2013). FDI and local
linkages in developing countries: evidence from sub-Saharan Africa. World
Development 50: 41–56.
Apulu, J. & Lathan, H. (2011). The determinants of the choice of innovation source for
Nigerian firms. International Journal of Technology Management 53: 44–67.
Ansari, S., Reinecke, J. & Span, A. (2014). How are practices made to vary? Managing
practice adaptation in a multinational corporation, Organization Studies, 35(9),
1313-1341.
Ashtianipouri, Z. & Zandhessami. H. (2015). An integrated ISM-DEMATEL model for
evaluation of Technological innovation capabilities' impact on the competitiveness
of Small & Medium Size Enterprises (SMEs). Portland International Conference
on Management of Engineering and Technology (PICMET), 322 – 334.
Bahaddad, W., Chang, M. & Lai, V. (2013). "Prediction of Product Innovation and
Technological Usage at Work: A Test of an Extended Triandis Model. Decision
Support System , 30, 83-100.
Barczak, G., Griffin, K. & Khan, K. (2012). Trends and Drivers of Success in NPD
Practices: Results of the 2010 PDMA Best Practices Study. Journal of Product
Innovation Management, 26 (1), 3–23.
Bashir, T., Khan, K. & Malik, K. (2010). The innovation landscape of Pakistan’s
NorthWest Frontier Province. Science and Public Policy 37: 181–191.
66
Bhatti, Y. & Ventresca, M. (2012). The emerging market for frugal innovation: fad,
fashion, or fit? Available at SSRN: http://ssrn.com/abstract=2005983.
Brunswicker, S. & Vanhaverbeke, S. (2014). Open Innovation in Small and Medium-
Sized Enterprises (SMEs): External Knowledge Sourcing Strategies and Internal
Organizational Facilitators. Journal of Small Business Management. 53(4), 1241–
1263.
Bulte. T. (2012). Managing effective Product transfer: An integrative framework and
some practice implications. Journal of Knowledge Management, 6, 23-30
Chataway, J., Hanlin, R. & Kaplinsky, R. (2013). Inclusive innovation: architecture for
policy development. IKD Working Paper No. 65.
Cohen, W. (2012). Fifty years of empirical studies of innovative activity and
performance. Handbook of the Economics of Innovation 1: 129–213.
Cooper, D. & Schindler, P. (2014). Business Research Methods. Mc-Graw Hill: New
York.
Creswell, J. (2012). Educational research: Planning, conducting, and evaluating
quantitative and qualitative research. Boston: Pearson.
Cupolas, C. (2013). Adding Innovation Diffusion Theory to the Product Acceptance
Model: Supporting employees' intentions. Educational Technology and Society, 14
(4), 124–137.
Damanpour, L. (2014). Diffusion of Technological and Industrial innovations in
developing Countries. World Development 13: 409–422.
Dearing, J. (2012). Diffusion of Innovation Theory to Intervention Development,
Research on Social Work Practice, 19(5), 503-518.
De Waldemar, F. (2012). New products and corruption: evidence from Indian firms.
Developing Economies 50: 268–284.
Dixon, M., Parkin, T. & Collins, N. (2012) Product and Technological Innovations
Strategies: A long-term study of 200 cases (1997-2009). Equine vet. 44, 272-276.
Egbetokun, A., Adeniyi, A., Siyanbola, O. & Olamade, O. (2012). The types and intensity
of innovation in developing country SMEs: Evidences from a Nigerian subsectoral
study. International Journal of Learning and Intellectual Capital 9: 98–112.
Flight, R., Allaway, A., Kim, W. & D’Souza, D. (2013), A Study of Perceived Innovation
Characteristics Across Cultures and Stages of Diffusion, Journal of Marketing
Theory and Practice, 19 (1), 109-125.

67
Frimpong, N. & Nwankwo, S. (2012). Service quality orientation: an approach to
diffusing mindfulness in SMEs, International Journal of Quality & Reliability
Management, 29 (6), 681-698.
Fu, X. & Gong, Y. (2011). Indigenous and foreign innovation efforts and drivers of
technological upgrading: evidence from China. World Development 39: 1213–
1225.
Gardner, E. (2013). Product adoption: Perceptions of managers/Owners of small and
medium sized firms in Chile, Communications of AIS, 81-102.
Goedhuys, M., Janz, N. & Mohnen, P. (2014) Knowledge-based productivity in "low-
tech" industries: evidence from firms in developing countries. Industrial and
Corporate Change 23: 1–23.
Government of Kenya. (2015). Small and Medium Sized Enterprise Act, Nairobi,
Government Printers.
Hall, B. (2011). Innovation and Productivity. NBER Working Paper Series 17178.
Hair, J. (2015). Essentials of Business Research Methods. Armonk, NY: M.E. Sharpe.
Hassan, S., Mourad, M. & Tolba, A. (2013). Conceptualizing the influence of lead users
and opinion leaders on accelerating the rate of innovation diffusion, Int. J.
Technology Marketing, 5(3), 203-218.
Healey, J. (2011). Statistics: A Tool for Social Research. New York, NY: Cengage
Learning.
Hilbert, M. (2013). When is Cheap, Cheap Enough to Bridge the Digital Divide?
Modeling Income Related Structural Challenges of Technology Diffusion in Latin
America. World Development, 38(5), 756 - 770.
Hung, S., Hung, H., Tsai, C. & Jiang, C. (2010). Critical factors of hospital adoption on
CRM system: Organizational and information system perspectives, Decision
Support Systems Journal 48(2010), 592-603.
Huy, L. (2012). An empirical study of determinants of e-commerce adoption in SMEs in
Vietnam: an economy in transition, Journal of Global Information Management,
20(3) 1-35.
Ismail, A., & Mamat, M. (2012). The relationship between information technology,
process innovation and organizational performance. International Journal of
Business and Social Science, 3(2), 268–274.

68
Kalliny, M. & Hausman, A. (2014). The Impact of Cultural and Religious Values on
Consumer’s Adoption of Innovation,” Academy of Marketing Studies, 11(1), 125-
136.
Kaplan, H. (2012). The private funded industrial Innovations in developing countries:
Empirical tests for an industrial research institute in India. World Development 30:
1550–1560.
Kimura, Y. (2011). Knowledge diffusion and modernization of rural industrial clusters: a
paper-manufacturing village in Northern Vietnam. World Development 39: 2105–
2118.
Kozak, M. (2011) The diffusion of product innovations in industrialized and developing
countries: A Case Study of the Manufacturing Industries. World Development 21:
1225–1238.
KPMG Kenya . (2016). Top 100 Medium sized firms in Kenya.
Leoni, R. (2013). Organization of work practices and productivity: an assessment of
research on world - class manufacturing”, in Grandori A. (ed.), Handbook of
Economic Organization. Integrating Economic and Organization Theory, Edward
Elgar, Cheltenham.
Lu, Y., Quan, J. & Cao. X. (2013). The Perceived Attributes of Wi-Fi Technology and the
Diffusion Gap among University Faculty Members: A Case Study.
Communications of the Association for Information Systems. 24: 69-88.
Mahazir, M. & Mohd, N.(2012). An Empirical Study of Factors Affecting product
Adoption among Malaysian Consumers. Journal of Internet Banking and
Commerce , 15(2), 1-11.
Matlay, H. & Weathead, P. (2013). Entrepreneurial assets and mindsets: Benefit from
university entrepreneurship education investment, 55 (8/9), 748-762.
Meagher, K. (2012) Manufacturing disorder: liberalization, informal enterprise and
economic ‘ungovernance’ in African small firm clusters. Development and Change
38: 473–503.
Migiro, N. (2016). Complexity, Trialability and Cultural Factors. Human Systems
Management 11(2), 67–75.
Mohd N. (2010). An Empirical Study of Factors Affecting the Internet Banking Adoption
among Malaysian Consumers. Journal of Internet Banking and Commerce, 15(2),
1-11.
69
Mourad. M. & Tolba, L. (2014). Individual and Cultural Factors affecting Diffusion of
Innovation. Journal of Business & Industrial Marketing 29 (6), 525-545.
Mutoko, S. (2012). Managing Younger Workers: Like it or not, even in the workplace,
things go round and round in circle game as a new generation moves to the
forefront. Wiley, Bognor Regis.
Nakata, C. & Weidner, K. (2012). Enhancing new product adoption at the base of the
pyramid: a contextualized model. Journal of Product Innovation Management 29:
21–32.
Nejad, M. Daniel, L. & Emin, B. (2014). Influentials and Influence Mechanisms in New
Product Diffusion: An Integrative Review, Journal of Marketing Theory and
Practice, 22(2), 185-208.
Nelson, R. (2012). National innovation systems: a retrospective on a study. Industrial and
Corporate Change 1:347–374.
Nguyen, H. & Jaramillo, P.A. (2014). Institutions and Firms’ Return to Innovation:
Evidence from the World Bank Enterprise Survey. Washington, DC: The World
Bank.
Oliveira, T., & Martins, M. F. (2011). Information technology adoption models at firm
level: Review of literature. Journal of Information Systems, 14, 110–121.
Passerini, K, El Tarabishy, A. & Patten, K. (2012). Information Technology for Small
Business Managing Product Innovation. Journal of Global Information
Management, 40(3), 5-15.
Paul, K. & Pascale, A. (2013) .Innovation’s Textile Expose. Harvard Business Review 88:
1–10.
Paunov, C. (2013) .Innovation and Inclusive Development. Paris, France: OECD
Publishing.
Porter, M. (2011). Nations and Competitive Advantage in Creation and Sustaining
Superior Competence: Simon and Schuster Publishers.
Rogers, E. (2003). Diffusion of Innovations, (5th ed.) New York: The Free Press.
Saunders, M., Lewis, P. & Thornhill, A. (2016). Research Methods for Business Students.
Edinburg Prentice Hall.
Sawada, Y., Matsuda, A. and Kimura, H. (2012). On the Role of Technical Cooperation
in International Technology Transfers. Journal of International Development 24:
316–340.

70
Sekaran, U. & Bougie, R. (2015). Research Methods of Business: A skill building
approach. Wiley.
Seker, M. (2012). Importing, exporting, and innovation in developing countries. Review
of International Economics 20: 299–314.
Schilling. A, (2013) Strategic Management of Technological Innovation, McGraw-Hill
Smith, J. A. (2012). Qualitative psychology: a practical guide to research methods.
London: Sage.
Srholec, M. (2011). A multilevel analysis of innovation in developing countries.
Industrial and Corporate Change 20: 1539–1569.
Straub, E. (2014). Understanding Technology Adoption: Theory and Future Directions
for Informal learning, Review of Educational Research, 79(2), 625-649.
Tanev, S. & Frederiksen, M. (2014). Generative Innovation Practices, Customer
Creativity, and the Adoption of New Technology Products. Technology
Innovation Management Review. 5–10.
Tavakoli, H. (2015). A Dictionary of Research Methodology and Statistics in Applied
Linguistics. Tehran: Rahnama Press.
Uddin, A. (2016). The role of diffusion of innovations for incremental development in
small enterprises. Technovation 26: 274–284.
Wang, L. (2011). Planning towards enhanced adaptability in digital manufacturing”
International Journal of Computer Integrated Manufacturing, 24 (5), 378-390.
Wanyoike, M. Waititu, G. & Mukulu, E. (2012). Product Attributes as Determinants of
Product Adoption by Formal Small Enterprises in Urban Kenya, International
Journal of Business and Social Science Vol. 3(23), 17-25.
Yamane, T. (1973). Statistics: Analysis introductory. New York: Harper & Row.
Yung Y. & Shin. M. (2013). Institution-based barriers to innovation in SMEs in China.
Asia Pacific Journal of Management, 29, 1131–1142.
Zanello, G., Fu, X., Mohnen, P., & Ventresca, M. (2015). The Creation and Diffusion of
Innovation in Developing Countries: A Systematic Literature Review. Strategic
Management Journal 36: 969–989.
Zhai, E. (2011). Medium sized firms in developing countries: how well do they do, and
why? Journal of Economic Literature 38: 11–44.
Zhou, K. & Wu, F. (2014). Technological capability, strategic flexibility, and product
innovation. Strategic Management Journal 31(5), 547–561.
Zikmund, W. (2012). Business Research Methods, Florida: The Dryden Press

71
APPENDICES
APPENDIX 1: COVER LETTER
Betty Mbaya,
United States International University-Africa,
P.O. Box 14634 - 00800,
Nairobi, Kenya
Dear Respondent,
RE: REQUEST FOR YOUR PARTICIPATION IN MY RESEARCH PROPOSAL
My name is Betty Mbaya, currently pursuing a course towards completion of Master of
Business Administration from United States International University – Africa. I am
conducting a study on Factors Affecting the Diffusion of Product Innovation in Medium
Sized Manufacturing Enterprises in Kenya which is in partial fulfillment of the
requirements of the award of the degree.
You have been selected to participate in this study by filling in the attached questionnaire.
The findings of the study will provide an incentive for the Medium Sized Enterprises and
stakeholders to develop appropriate interventions with the potential to enhance the uptake
of innovation in a cost effective manner. The findings will also help policy makers in
understanding determinants of diffusion which will be critical in designing policies that
will help providers to deliver appropriate innovations that will be more attractive to
potential consumers.
The information you provide will be treated as confidential, and will only be used for
academic purpose of this research. Kindly spare a few minutes of your time to fill in the
blanks of the attached list of questions to the best of your knowledge. For further
questions you are free to contact me on +254 (0) 722 558 742.
Thank you for your time
Yours faithfully,
Betty Mbaya

72
APPENDIX 2: QUESTIONNAIRE
Introduction
The purpose of this study is to determine the factors that affect the diffusion of Product
Innovation in Medium Sized Manufacturing Enterprises in Kenya. Kindly fill the
questions as accurately as you possible by ticking boxes or writing in the spaces provided.
Your response will be appreciated.
SECTION I: GENERAL INFORMATION
1. Gender: Male Female
2. Age Below 20 years 20- 29 years
30- 39 years Above 40 years
3. What is your designation?
Owner Manager
Others
(specify………………………………………………..)
4. Your highest level of education?
None Primary Secondary
BSc degree Master’s degree PhD
5. How many years has the enterprise been in existence?
Below 5 years 6 – 10 years
11 – 15 years 15 – 25 years
Above 26 years

73
SECTION 2: EFFECTS OF RELATIVE ADVANTAGE ON THE SPREAD OF
PRODUCT INNOVATION AMONG MEDIUM SIZED MANUFACTURING
ENTERPRISES
Diffusion is a type of communication that is concerned with the spread of new ideas. It is
the process by which an innovation is communicated among the members of a social
system through certain channels over time.
Relative advantage is the extent to which an innovation is perceived to be better than the
ideas it takes over from or the degree to which an innovation is perceived to be more cost
effective, convenient, efficient or improves existing applications and practices.
Indicate by ticking (√) the cell which closely reflects the extent to which relative
advantage has influenced diffusion of product innovations in your organization.
Use a scale of 1- 4 where: 1 = Strongly Disagree (SD), 2 = Disagree (D), 3 = Agree (A), 4
= Strongly Agree (SA)
Effects of Relative Advantage on the Diffusion
of Product Innovation in Medium Sized
Enterprises
Str
on
gly
Dis
agre
e
Dis
agre
e
Agre
e
Str
on
gly
Agre
e
(1) (2) (3) (4)
6. Product innovations that are perceived to lead to
convenient application by consumers or
customers diffuse faster
7. Product innovations that are perceived to be more
cost effective diffuse faster
8. Product innovations that are perceived to be more
time saving diffuse faster
9. Product innovations that are perceived to be more
effective in their application diffuse faster
10. Product innovations that are perceived to lead to
improvement of consumers current activities
diffuse faster

74
SECTION 3: EFFECTS OF COMPATIBILITY ON THE SPREAD OF PRODUCT
INNOVATION AMONG MEDIUM SIZED MANUFACTURING ENTERPRISES
Diffusion is a type of communication that is concerned with the spread of new ideas. It is
the process by which an innovation is communicated among the members of a social
system through certain channels over time.
Compatibility is the extent to which an innovation is perceived to be consistent with
potential adopters past experiences, needs and values.
Indicate by ticking (√) the cell which closely reflects the extent to which compatibility
has influenced diffusion of product innovations in your organization.
Use a scale of 1- 4 where: 1 = Strongly Disagree (SD), 2 = Disagree (D), 3 = Agree (A), 4
= Strongly Agree (SA)
Effects of Compatibility on the Diffusion of
Product innovation in Medium Sized
Manufacturing Enterprises S
tron
gly
Dis
agre
e
Dis
agre
e
Agre
e
Str
on
gly
Agre
e
(1) (2) (3) (4)
11. Product innovations that are compatible with the
technological innovation activities undertaken by
consumers diffuse faster
12. Product innovations that complement consumers
environment greatly affect how fast innovations
will diffuse in the market
13. Product innovations that already have business and
government supportive policies in place diffuse
faster in the market
14. Product innovations that are perceived by the
consumers to be beneficial and in line with their
lifestyles or cultures diffuse faster
15. Product innovations that are already accepted in
the business industry diffuse faster in the market
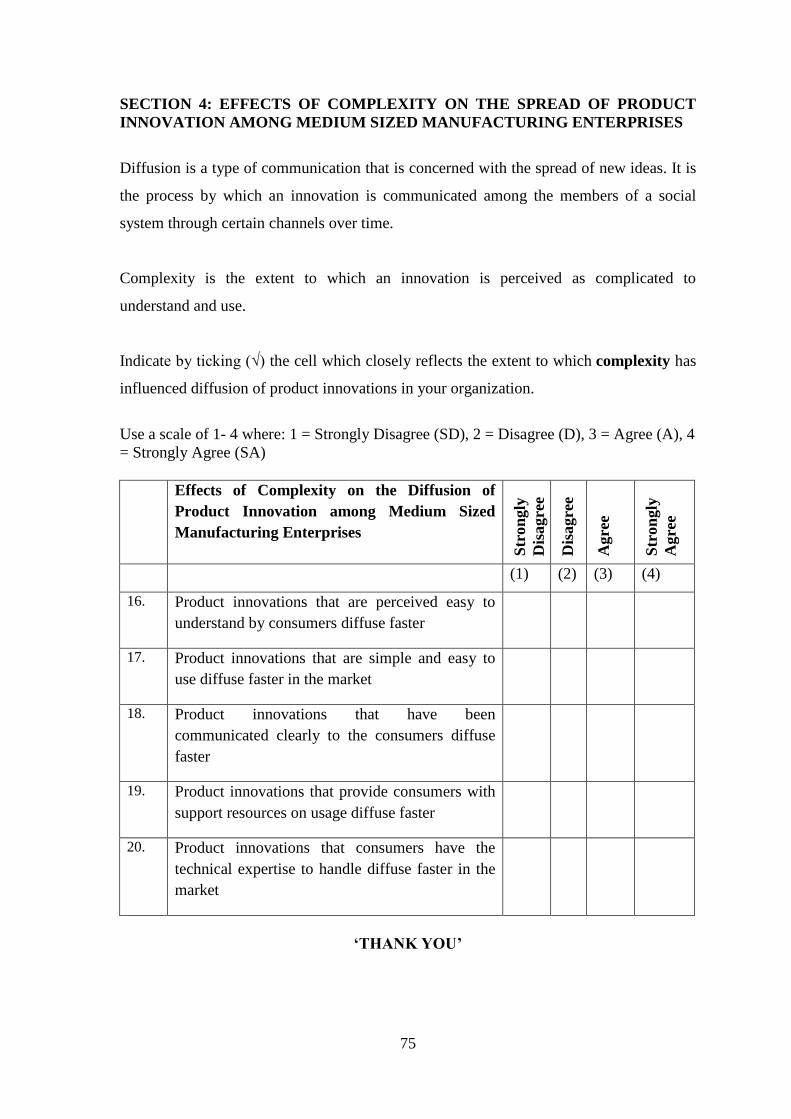
75
SECTION 4: EFFECTS OF COMPLEXITY ON THE SPREAD OF PRODUCT
INNOVATION AMONG MEDIUM SIZED MANUFACTURING ENTERPRISES
Diffusion is a type of communication that is concerned with the spread of new ideas. It is
the process by which an innovation is communicated among the members of a social
system through certain channels over time.
Complexity is the extent to which an innovation is perceived as complicated to
understand and use.
Indicate by ticking (√) the cell which closely reflects the extent to which complexity has
influenced diffusion of product innovations in your organization.
Use a scale of 1- 4 where: 1 = Strongly Disagree (SD), 2 = Disagree (D), 3 = Agree (A), 4
= Strongly Agree (SA)
Effects of Complexity on the Diffusion of
Product Innovation among Medium Sized
Manufacturing Enterprises S
tron
gly
Dis
agre
e
Dis
agre
e
Agre
e
Str
on
gly
Agre
e
(1) (2) (3) (4)
16. Product innovations that are perceived easy to
understand by consumers diffuse faster
17. Product innovations that are simple and easy to
use diffuse faster in the market
18. Product innovations that have been
communicated clearly to the consumers diffuse
faster
19. Product innovations that provide consumers with
support resources on usage diffuse faster
20. Product innovations that consumers have the
technical expertise to handle diffuse faster in the
market
‘THANK YOU’

76
APPENDIX 3: TOP 100 MEDIUM SIZED MANUFACTURING ENTERPRISES
No Organization
1 Alpha Dairy Products Ltd
2 Alpha Fine Foods Ltd
3 Alpha Medical Manufactures Ltd
4 Alpine Coolers Ltd
5 Astral Industries Ltd
6 Axel Engineering and Manufacturing Ltd
7 Bio Food Products Ltd
8 Biodeal Laboratories Ltd
9 Blowplast Ltd
10 Brollo Kenya Ltd
11 Canon Aluminium Fabricators Ltd
12 Canon Chemicals Ltd
13 Chuma Fabricators Limited
14 Complast Industries Ltd
15 Coninx Industries Ltd.
16 Continental Products
17 Crown Foods Ltd
18 Dawa Ltd
19 Deepa Industries Limited
20 Desbro Engineering Ltd
21 Dune Packaging Limited
22 East African Canvas co. Ltd
23 Economic Industries Limited
24 Edcor Kenya Ltd
25 Emmerdale Ltd
26 Eurocon Tiles Products Limited
27 Fayaz Bakers Limited
28 Furniture Rama Ltd
29 General Aluminium Fab Ltd
30 Glacier Products Ltd
31 Hebatullah Brothers Limited
32 Henkel Chemicals E.A
33 Heritage Foods Kenya Ltd
34 Ideal Manufacturing Co. Ltd
35 Impala Glass Industries Ltd
36 Interconsumer Products Ltd

77
37 Iron Art Limited
38 Izmir Enterprises Limited
39 Jungle Macs Epz Ltd
40 Kamili Packers Limited
41 Lema (E.A) Ltd
42 Kenapen Industries Ltd
43 Kenbro Industries Limited
44 Kenwest Cables Ltd
45 Kenya Builders & Concrete Co Ltd
46 Kenya Highland Seed Co Ltd
47 Kenya Suitcase Mfg Ltd
48 Kenya Sweets Ltd
49 Kevian Kenya Ltd
50 Kinpash Enterprises Limited
51 Madhupaper Kenya Ltd
52 Manji Food Industries Ltd
53 maroo polymers limited
54 Master Fabricators Ltd
55 Melvin Marsh International Ltd
56 Millbrook Garment
57 Mombasa Canvas Ltd
58 Mukurweini-Wakulima Dairy Ltd
59 Muringa Holdings Ltd
60 Napro Indutries Ltd
61 Nationwide Electrical Industries Ltd
62 Ndugu Transport Co. Ltd
63 Norda Industries Limited
64 Oasis Ltd
65 Orange Pharma Ltd
66 Orbit Engineering Limited
67 Packaging Manufacturers (1976) Ltd
68 Palmhouse Dairies Ltd
69 Panesars Kenya Limited
70 Pelican Signs Ltd
71 Pharmaken Limited
72 Polytanks Limited

78
73 Premier Industries Ltd
74 Print Fast (K) Ltd
75 Propack Kenya Ltd
76 R & R Plastics Limited
77 Ramco Printing Works Ltd
78 Reliable Concrete Works
79 Shade Systems E.A Ltd
80 Sheffield Steel Systems Limited
81 Sigma Feeds Ltd
82 Sigma Suppliers Ltd
83 Sollatek Electronics (K) Ltd
84 Specialized Aluminum Renovators Limited
85 Spice World Limited
86 Spenomatic Kenya Limited
87 Spry Engineering Co. Ltd
88 Stitch Masters Ltd
89 Sunpower Products Ltd
90 Superfoam Ltd
91 The Breakfast Cereal Company (K) Ltd
92 Thika Cloth Mills Ltd
93 Thika Wax Works Ltd
94 Tiger Brands Kenya Ltd
95 Tissue Kenya Ltd
96 Tononoka Rolling Mills Ltd
97 Tropikal Brands A Ltd
98 Trufoods Ltd
99 Tyremasters Ltd
100 Vajas Manufacturers Ltd
101 Viro Locks Ltd
102 Vitafoam Products Ltd
103 Vivek Investments Ltd
104 Warren Concrete Ltd
105 Warren Enterprise Ltd
106 Wartsila East Africa Ltd
107 Wines of The World Ltd
108 Zaverchand Punja Limited

79