Embed Size (px)
Citation preview
116 TRANSPORTATION RESEARCH RECORD 1344
Factors Affecting Condition of Pavements Owned by Local Governments
A. REED GIBBY AND RYUICHI KITAMURA
In recent years pavement management systems have been made available to local governments. One beneficial feature of a pavement management system has been an increased interest in the condition of pavement sections and those factors that affect it. Consequently, factors affecting the condition of flexible pavements owned by lociil governments are investigated and identified . After a literature review was conducted, several hypotheses were establi hed. Theoretical or functional relationships were formulated, and data files were de cribed. After these files were procured, multivariate analyses were performed on the data and their results were validated. Several factors affecting the condition of pavements owned by local government were identified. They included old (or previous) pavement condition score, age of pavement structure since last major work, soil classification (or type) , classification of roadway drainage (presence or absence of curb and gutter), surface thickness , functional classification, presence or absence of bus service and individual jurisdiction. Another conclusion was that actual pavement management sys~em data files used for the statistfoal modeling with only minimal modification may contain limitations for modeling purposes. They include the need for another time domain in the data files so true time-series analyses can be done . Because local governments do not normally conduct traffic classification counts, the data files did not contain truck count data; such an addition would likely increa e the accuracy of the models.
Most pavements owned by local governments were initially constructed with portland cement concrete, but most local agencies currently use asphalt concrete pavements. Local governments generally have several types of pavement. Many pavement sections have been constructed according to standard sections selected on the basis of average daily traffic (ADT). Some pavement sections were determined by assumed traffic loadings based on functional classification. There are also "evolved" pavement sections consisting of a series of surface treatments, such as several asphalt cement chip seals. Over many years, especially with little truck traffic, age hardening can produce structurally sound pavement sections; these are more likely found in rural counties. Sometimes asphalt concrete surfaces have been placed directly on the natural subgrade, which often results in the reduction of the pavement quality. Some local governments, especially older ones, have portland cement concrete pavements overlaid with asphalt concrete rpixes. There are many miles of unsurfaced, aggregate roads, mostly in rural counties. The unsurfaced roadway is not evaluated in this research effort.
One unique circumstance is the strength of locally available aggregate used for asphalt concrete mix and aggregate base
A. R. Gibby, Department of Civil Engineering, California State University, Chico, Calif. 95929. R. Kitamura, Department of Civil Engineering, University of California, Davis, Calif. 95616.
courses. The strength of the aggregate will probably vary from source to source. Without substantial testing it is difficult to predict the performance of pavement sections that are constructed of material from a particular source.
Finally, local agencies (and state departments of transportation) encounter many streets and roads with poor drainage. When drainage systems allow water to persist in the base material and heavy trucks pass over the pavement section, the water is forced to move. This movement causes migration of the fines in the base or subbase. The fines can actually be "pumped" to the surface, leaving voids. This weakens the structural integrity of the pavement section. This is usually more common with portland cement concrete pavements, but it ·can also be an issue with asphalt cement concrete pavements.
It would be helpful in identifying and programming maintenance-related activities if local governments knew which factors affected the condition of their pavements. These factors have been probed by Gibby in his unpublished dissertation (1). Additionally, some findings discovered with research supported by the California Department of Transportation (Caltrans) have been incorporated into this paper (2).
RESEARCH OBJECTIVES
The primary objective of this research was, through statistical modeling, to investigate and identify factors affecting the condition of street and road pavement sections owned by local governments. The analyses were designed to accommodate local circumstances such as the quality of the subgrade and drainage. Other objectives were also established, namely, to investigate the adequacy of local data files and to determine whether a model developed with data from one jurisdiction can be transferred to another jurisdiction.
RESEARCH APPROACH
Five steps were taken to accomplish the objectives of this research effort. They are (a) establishing hypotheses, (b) formulating theoretical or functional models, (c) acquiring and editing the data files, ( d) applying multivariate analyses to the data files, and (e) interpreting results and evaluating hypotheses.
Relationships between pavement condition and several potential parameters were discovered from the literature review. Thus, the results of the literature review aided in the second part of the research approach-the identification of compre-
Gibby and Kitamura
hensive theoretical or functional relationships for estimating the condition of roadway pavements.
The acquisition of pavement management system (PMS) data files was the third step of the research approach. The data files used came from three distinct PMSs, each with a different pavement condition rating system. These files were readily available without cost. The three methods were systems used by San Francisco (3), the Metropolitan Transportation Commission (MTC) (4), and CHEC Consultants (5). From the Bay Area, the city of San Francisco supplied a copy of its data file and MTC provided a copy of the data file for Alameda County. CHEC Consultants provided copies of data files developed for several clients, namely, the cities of Fairfield and Puyallup and Jackson County. Fairfield, California, is approximately 50 mi northeast of San Francisco, and Puyallup, Washington, is approximately 30 mi south of Seattle. Other jurisdictions were the counties of Jackson in southern Oregon and Alameda in the San Francisco Bay Area. Subgrade soil information was added manually to the San Francisco and Puyallup data files.
The next aspect of the research approach was conducting multivariate analysis on each of the data files. This analysis revealed the most favorable model for each data base. The effort also addressed possible multicollinearity among some independent variables such as functional class and pavement surface thickness. This investigation included the weightedleast-square analysis to determine the validity of the basic regression assumptions-such as, the error term has a uniform variance. Finally, the results were interpreted in light of the objectives and evaluated against the stated hypotheses.
LITERATURE REVIEW
The past three decades have seen substantial effort applied to the evolution of pavement condition analyses, especially during the past 15 years . Generally, these efforts were accomplished with the use of multivariate analysis (modeling) . Materials include national , state, local, and private sources from U.S. and Canadian literature. Most of the investigations were developed for or by state departments of transportation. Two factors affecting the condition of pavements consistently appeared in the literature; namely, age of roadway and frequency of trucks ( 4,6-8). Other factors that appeared often included pavement deflection readings and environment, that is, rainfall and soil type (7,8). Functional classification ( 4,8) was also found to affect pavement condition. In contrast to what has been developed for states, very little pavement condition analysis work has been developed for local governments. The literature did not report on the development of any pavement condition prediction model for a particular local jurisdiction, nor did it reveal any attempt to model jurisdictional uniqueness. In addition, the present models for local governments did not use factors to assess soil type and presence of drainage facilities . Finally, the literature did not model the presence of urban transit bus service.
MAJOR HYPOTHESES
The first step of the research approach was the development of the null hypotheses presented and discussed in the follow-
117
ing. They were designed to use multivariate analyses for the attainment of the research objectives. The alternative hypotheses were the antitheses of these statements.
1. The old or previous condition score does not affect a new condition score. Old condition score will be collected frequently in years to come; consequently, it will be convenient if indeed it is a statistically significant factor affecting a new condition score.
2. The type of subgrade soil does not influence the pavement condition score. This hypothesis will help verify whether the subgrade is a statistically significant factor affecting pavement condition.
3. The drainage facilities do not affect the pavement condition. Pavement condition modeling efforts have not attempted to model whether the existence of drainage facilities affects pavement conditions. For this project, curb and gutter is the parameter used as a surrogate for the drainage issue.
4. Traffic does not contribute to pavement condition scores. This hypothesis will help evaluate whether ADT is a statistically significant parameter. The particular interest in ADT is that it may be an adequate surrogate for axle loadings and frequency of loads usually expressed in equivalent single (18-kip) axle loads (ESALs). If ADT is a significant predictor of condition, local governments may not need to conduct truck counts to include this aspect of causality in pavement condition analysis. Currently, local jurisdictions do not conduct truck counts regularly, and it is not likely they will until these counts can be done much more cheaply.
5. The existence of bus service does not influence the pavement condition score. This hypothesis will help verify whether bus service is a statistically significant factor affecting pavement condition.
6. Data bases containing pertinent information that will estimate the pavement condition score do not exist.
7. A generic model that identifies factors of pavement condition for local governments cannot be derived; that is, a model developed for one jurisdiction cannot be applied to another.
MODEL FORMS
Considering the results of the literature review and the hypotheses being tested, one may theorize that the present condition of a pavement section is dependent on several factors. These factors include
SCRN-New (or estimated) pavement condition score, SCRO-Old (or previous) pavement condition score, AGE-Age of pavement structure since last major work, ADT-Average daily traffic,
Tl-Traffic index (related to ESALs), DEFL-Deflection reading,
FC-Functional classification (arterial; FCA, collector; FCB, local),
SC-Soil classification (clay or nonclay), CG-Roadway drainage classification (presence or ab
sence of curb and gutter),
and
ST-Surface thickness of asphalt concrete layer, BS-Bus service (presence or absence of bus service),
JUR-Jurisdiction.

118
The functional form may be expressed with both linear and nonlinear formulations as follows, with ~O being the intercept and the other ~s being the coefficients of the independent variables.
SCRN = ~O + ~l(SCRO) + ~2(AGE) + ~3(ADT)
+ ~4(TI) + ~5(FC) + ~6(SC) + ~7(CG)
+ ~8(BS) + ~9(JUR) + ~lO(DEFL) + error (1)
SCRN = ~O(SCR0)~1(AGE)~2(ADTW(TI)P4
(FC)P5(SC)P6 (CG)~7(BS)P8(JUR)P9
(DEFL)~ 10[ explmorJ] (2)
These model formulations were calibrated with each of the data bases available to this research effort.
DATA FILES
An important aspect of any model development process is the data base. Without reliable data, the likelihood of developing a valid model is very small. For local governments, the major issue is a sufficient but not excessive data base, because these entities often have limited financial and technical resources. Likewise, the formulation of an accurate pavement condition prediction model is dependent, in part, on pavement management system data bases containing sufficient information.
A pavement management system contains a data base that is organized into records or observations. Records typically include, as a general data file, the following:
1. Record number of street segment , 2. Street name and limits of segment, 3. Functional classification, 4. Old pavement condition rating score and year, and 5. New pavement condition rating score and year.
A pavement condition rating score system typically incorporates such items as extent and severity of cracking (alligator, longitudinal, and transverse), rutting and raveling, and ride quality (comfort). One important point is that pavement condition ratings are subjective in nature and some inconsistency
TRANSPORTATION RESEARCH RECORD 1344
among survey personnel should not be surprising. The variables available for each data file are given in Table 1.
A common feature in the data bases is the use of a dummy variable for variables such as FC. Dummy variables take the value of either 0 or 1 for linear models. For nonlinear formulations the value will be 1or2.72 so that, after logarithmic transformation, the value becomes 0 or 1, respectively. The data analyses were conducted on a personal computer using dBase or Rbase software for data management and editing. In addition, SAS (Statistical Analysis System) was used for statistical modeling (9).
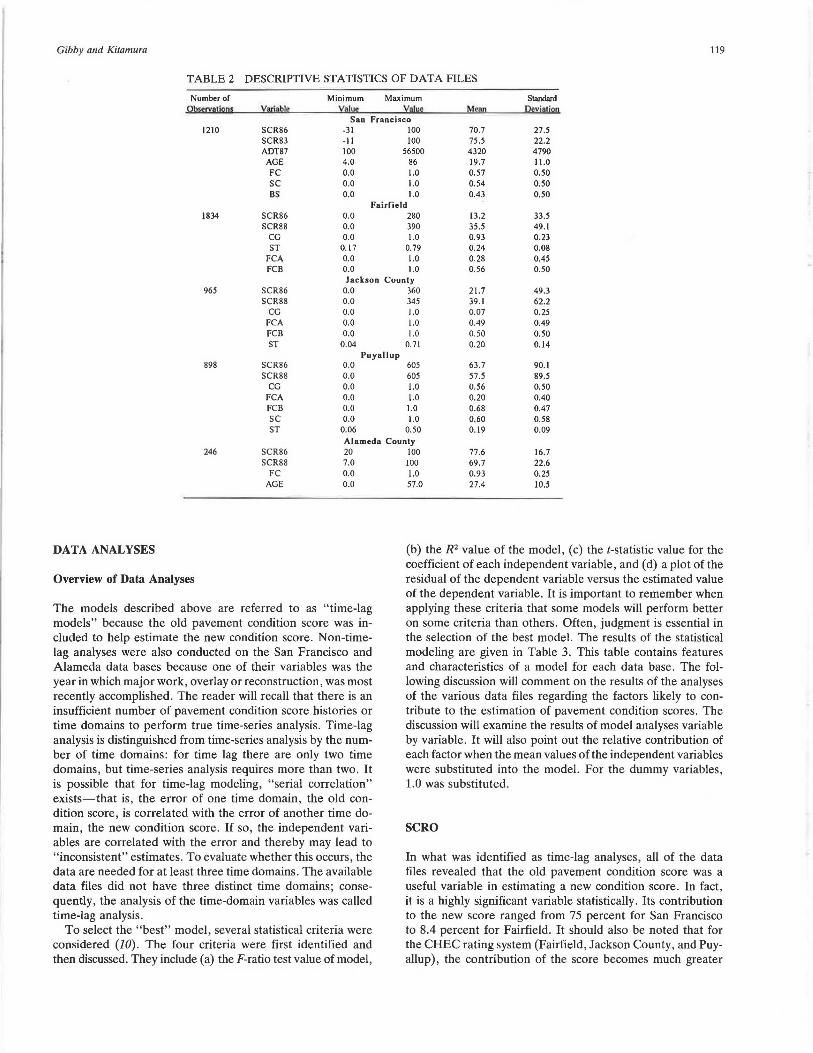
Before the data files could be used for analysis, several types of editing were imperative. First, data files were subject to human coding errors. For example, the San Francisco file had a few duplicate records, and a Fairfield record contained a negative pavement surface thickness. The second type of editing was the modification of the data bases so that they could be used in the modeling analyses. Alpha characters were used for functional classification, and they needed to be converted to numerical form . Another type of editing was the elimination of potential bias in the data. For example, the San Francisco data street segments with cable car service were omitted because those segments have rails set in portland cement concrete. Consequently, those pavement surfaces are not typical. Market Street was also omitted, because the surface street is supported by Bay Area Rapid Transit (BART) tunnel structures. The last form of editing was to delete street segments that were improved between the two time domains, the old and new score. The data files used for linear multivariate analysis possess the descriptive statistics in Table 2.
These files were modified to enable nonlinear analyses to be conducted . So that logarithm transformations could be accomplished, those observations with 0 or negative scores were removed from the data files . Although this data censoring may lead to biased coefficient estimates, the use of more elaborate statistical methods is warranted, because the main objective here is to compare multiplicative models against linear models. For the dummy variables, the values of 0 were changed to 1 and 1 was modified to 2. 72 so that the transformed values would be 0 and 1, respectively.
To improve the modeling results, an outlier removal procedure was used on the CHEC data. As a result , records were removed when the new condition score was greater than the mean at a 1 percent level of significance. This removed extreme values that were believed to be coding errors.
TABLE 1 SUMMARY OF VARIABLES IN DATA BASES
SAN JACKSON ALAMEDA
~ABIAIH,g EBe.kl!:l ~Q:l EAll~F! !;Ul f !.!Y6LL!.!f ~l.!!fD:' ~!.!tfi)'.
SCRN 1986 1988 1988 1988 1988
SCRO 1983 1986 1986 1986 1986
AGE YES NO NO NO YES ADT YES NO NO NO FC YES YES YES YES YES CG NO YES YES YES NO ST NO YES YES YES NO SC YES NO YES YES NO BS YES NO NO NO NO
• Only a few records contained ADT.
Gibby and Kitamura 119
TABLE2 DESCRIPTIVE STATISTICS OF DATA FILES
Number of Minimum Maximum Standard Ol>mv•Uons VA£i~2l~ Valy• Value M!'.l!!I Ocv jntjon
San Francisco J2JO SCR86 -31 JOO 70.7 27.5
SCR83 -JI 100 75.5 22.2 ADT87 100 56500 4320 4790
AGE 4.0 86 19.7 11.0 FC 0.0 1.0 0.57 0.50 SC 0.0 1.0 0.54 0.50 BS 0.0 1.0 0.43 0.50
FairrieJd 1834 SCR86 0.0 280 13.2 33.5
SCR88 0.0 390 35.5 49.I CG 0.0 1.0 0.93 0.23 ST 0. 17 0.79 0.24 0.08
FCA 0.0 1.0 0.28 0.45 FCB 0.0 1.0 0.56 0.50
Jackson County 965 SCR86 0.0 360 21.7 49.3
SCR88 0.0 345 39.1 62.2 CG 0.0 J.O 0.07 0.25 FCA 0.0 1.0 0.49 0.49 FCB 0.0 l.O 0.50 0.50 ST 0.04 0.71 0.20 0.14
Puyallup 898 SCR86 0.0 605 63.7 90. I
SCR88 0.0 605 57.5 89.5 CG 0.0 1.0 0.56 0.50
FCA 0.0 1.0 0.20 0.40 FCB 0.0 1.0 0.68 0.47 SC 0.0 1.0 0.60 0.58 ST 0.06 0.50 0.19 0.09
Alameda County 246 SCR86 20
SCR88 7.0 FC 0.0
AGE 0.0
DATA ANALYSES
Overview of Data Analyses
The models described above are referred to as " time-lag models" because the old pavement condition score was included to help estimate the new condition score. Non-timelag analyses were also conducted on the San Francisco and Alameda data bases because one of their variables was the year in which major work, overlay or reconstruction, was most recently accomplished. The reader will recall that there is an insufficient number of pavement condition score histories or time domains to perform true time-series analysis. Time-lag analysis is distinguished from time-series analysis by the number of time domains: for time lag there are only two time domains, but time-series analysis requires more than two. It is possible that for time-lag modeling, "serial correlation" exists-that is, the error of one time domain, the old condition score, is correlated with the error of another time domain, the new condition score. If so, the independent variables are correlated with the error and thereby may lead to " inconsistent" estimates. To evaluate whether this occurs , the data are needed for at least three time domains . The available data files did not have three distinct time domains; consequently, the analysis of the time-domain variables was called time-lag analysis.
To select the "best" model , several statistical criteria were considered (JO). The four criteria were first identified and then discussed. They include (a) the F-ratio test value of model,
100 77.6 16.7 100 69.7 22.6 1.0 0.93 0.25 57.0 27.4 10.5
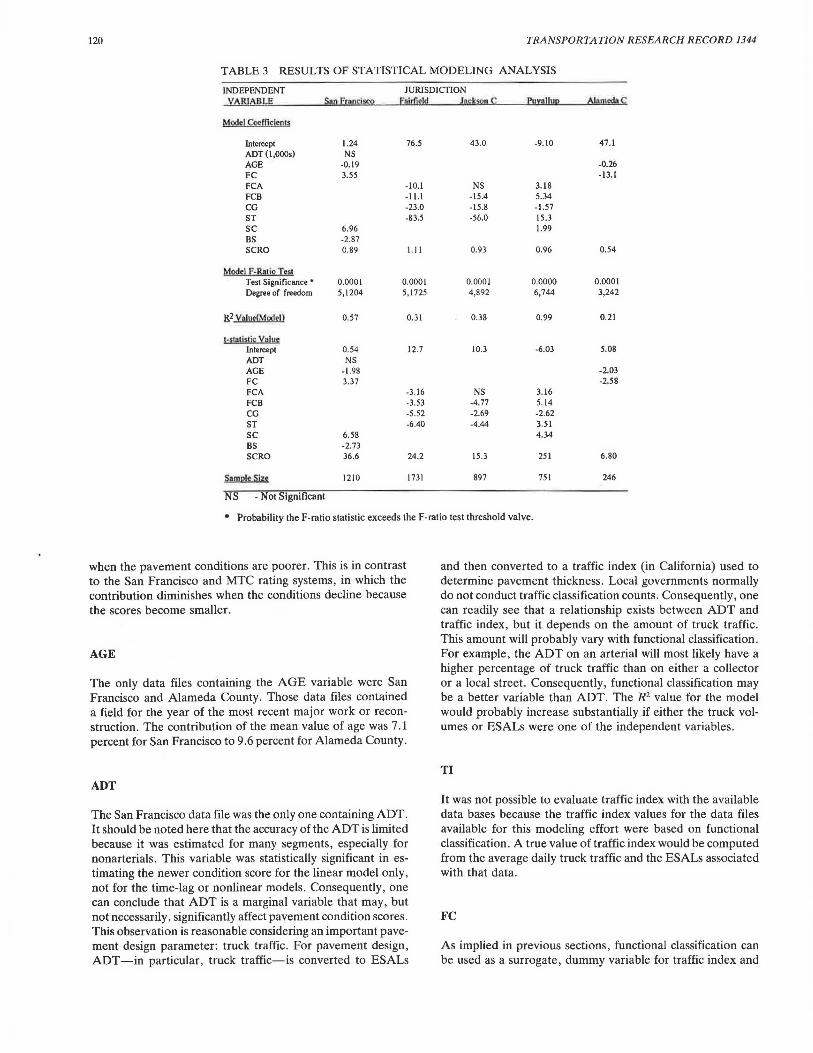
(b) the R2 value of the model, (c) the t-statistic value for the coefficient of each independent variable , and (d) a plot of the residual of the dependent variable versus the estimated value of the dependent variable. It is important to remember when applying these criteria that some models will perform better on some criteria than others . Often, judgment is essential in the selection of the best model. The results of the statistical modeling are given in Table 3. This table contains features and characteristics of a model for each data base. The following discussion will comment on the results of the analyses of the various data files regarding the factors likely to contribute to the estimation of pavement condition scores. The discussion will examine the results of model analyses variable by variable. It will also point out the relative contribution of each factor when the mean values of the independent variables were substituted into the model. For the dummy variables, 1.0 was substituted.
SCRO
In what was identified as time-lag analyses, all of the data files revealed that the old pavement condition score was a useful variable in estimating a new condition score. In fact, it is a highly significant variable statistically. Its contribution to the new score ranged from 75 percent for San Francisco to 8.4 percent for Fairfield. It should also be noted that for the CHEC rating system (Fairfield , Jackson County, and Puyallup) , the contribution of the score becomes much greater
120 TRANSPORTATION RESEARCH RECORD 1344
TABLE 3 RESULTS OF STATISTICAL MODELING ANALYSIS
INDEPENDENT VARIABLE
JURISDICTION
Mode! CoofficJon1s
Intercept ADT (l ,OOOs) AGE FC FCA FCB CG ST SC BS SCRO
Model F-R~1jo Tesl Test Significance • Degree of freedom
&2 Vnluc!Modr!l
t-stntlstje Value Intercept ADT AGE FC FCA FCB CG ST SC BS SCRO
Snmolc Size
NS - Not Significant
1.24 NS
-0.19 3.55
6.96 -2.87 0.89
0.0001 5,1204
0.57
0.54 NS
- l.98 3.37
6.58 -2.73 36.6
1210
Fnirfield
76.5
-IO.I -11.l -23.0 -83.5
I.II
0.0001 5,1725
0.31
12.7
-3.16 -3.53 -5.52 -6.40
24.2
1731
Jnc.kson C
43.0
NS -15.4 -15.8 -56.0
0.93
0.0001 4,892
0.38
10.3
NS -4.77 -2.69 -4.44
15.3
897
Puynlhm
-9.10
3.18 5.34 -1.57 15.3 1.99
0.96
0.0000 6,744
0.99
-6.03
3.16 5.14 -2.62 3.51 4.34
251
751
AlomodpC
47.l
-0.26 -13.I
0.54
0.0001 3,242
0.21
5.08
-2.03 -2.58
6.80
246
• Probability the F-ratio statistic exceeds the F-ratio test threshold valve.
when the pavement conditions are poorer. This is in contrast to the San Francisco and MTC rating systems, in which the contribution diminishes when the conditions decline because the scores become smaller.
AGE
The only data files containing the AGE variable were San Francisco and Alameda County. Those data files contained a field for the year of the most recent major work or reconstruction. The contribution of the mean value of age was 7.1 percent for San Francisco to 9.6 percent for Alameda County.
ADT
The San Francisco data file was the only one containing ADT. It should be noted here that the accuracy of the ADT is limited because it was estimated for many segments, especially for nonarterials. This variable was statistically significant in estimating the newer condition score for the linear model only, not for the time-lag or nonlinear models. Consequently, one can conclude that ADT is a marginal variable that may, but not necessarily, significantly affect pavement condition scores. This observation is reasonable considering an important pavement design parameter: truck traffic. For pavement design, ADT-in particular, truck traffic-is converted to ESALs
and then converted to a traffic index (in California) used to determine pavement thickness. Local governments normally do not conduct traffic classification counts. Consequently, one can readily see that a relationship exists between ADT and traffic index, but it depends on the amount of truck traffic. This amount will probably vary with functional classification. For example, the ADT on an arterial will most likely have a higher percentage of truck traffic than on either a collector or a local street. Consequently, functional classification may be a better variable than ADT. The R2 value for the model would probably increase substantially if either the truck volumes or ESALs were one of the independent variables.
TI
It was not possible to evaluate traffic index with the available data bases because the traffic index values for the data files available for this modeling effort were based on functional classification. A true value of traffic index would be computed from the average daily truck traffic and the ESALs associated with that data.
FC
As implied in previous sections, functional classification can be used as a surrogate, dummy variable for traffic index and
Gibby and Kitamura
ADT. This is because arterials serve the highest traffic volumes and the heaviest vehicles. Consequently, arterials may deteriorate at a higher rate than nonarterial streets. From the analysis on the San Francisco data, this was so. In all formulations of the San Francisco models, functional classification was highly significant. For the data files from Fairfield, Jackson County, Alameda County, and Puyallup, the functional classification differentiated arterial, collector, and local streets. It was significant in all of the models. The contribution of functional classification varies from a low of 4.4 percent for San Francisco to a high of 21 percent for Jackson County.
ST
Another variable in several data files for Fairfield, Jackson County, and Puyallup is that of the pavement surface (asphalt concrete surface) thickness. From pavement design principles this surface thickness is, of course, a function of the traffic index as well as other factors. Subsequently, the surface thickness is expected to be a surrogate for traffic index. Similarly, because the traffic index is determined by functional classification, the surface thickness should be a surrogate for it as well. In all three data bases that contain surface thickness it is a statistically significant predictor of a new condition score. Its contribution ranged from 3.7 to 18.1 percent.
SC
From basic geotechnical engineering and pavement design publications, the strength of the subgrade is important to the structural quality of a pavement system. Consequently, it was not surprising when the models of data files containing soil classification, San Francisco and Puyallup, contained this variable as a significant predictor of pavem'ent condition. For San Francisco soil classification contributed 8.4 percent, for Puyallup, only 2.5 percent.
CG
The variable in several data bases evaluating drainage facilities was the presence or absence of curb and gutter. For Fairfield, on a sensitive clay, the curb-and-gutter variable was statistically significant in estimating the new pavement condition score and contributed 16. 7 percent toward it. Where better soils existed in Jackson County and Puyallup, curb and gutter contributed 1.2 and 2.0 percent, respectively. This is not surprising, because the subgrade in Fairfield is a more sensitive clay than in the other jurisdictions. Puyallup does have some clay pockets, but overall its subgrade is better than Fairfield's.
BS
The San Francisco data base contained a dummy variable for the presence or absence of bus service. It was a significant predictor of pavement condition and contributed approximately 4 percent to the condition score.
121
JUR
To model characteristics that are unique to individual local governments (such as the level of maintenance effort, individual maintenance practices, and local materials), three data files were paired. Files from Fairfield, Jackson County, and Puyallup were paired with each other and a dummy variable, JUR, was inserted. The results indicated that JUR is statistically significant in estimating the new pavement condition score. One concern is whether differences in climate may override the uniqueness. Normal rainfall is nearly 20 in. for both Fairfield and Jackson County and more than 40 in. for Puyallup, so the best comparison is of the first two.
FINDINGS AND CONCLUSIONS
The discussion about the findings of the models developed from the multivariate analyses of the data bases available to this project has been divided into four areas. The first portion summarizes the factors affecting the estimation of the pavement condition. Comments about the results of the hypotheses testing will be discussed second. Next, the attainment of the research objectives will be presented, followed by the major limitations that were discovered.
Significant Factors
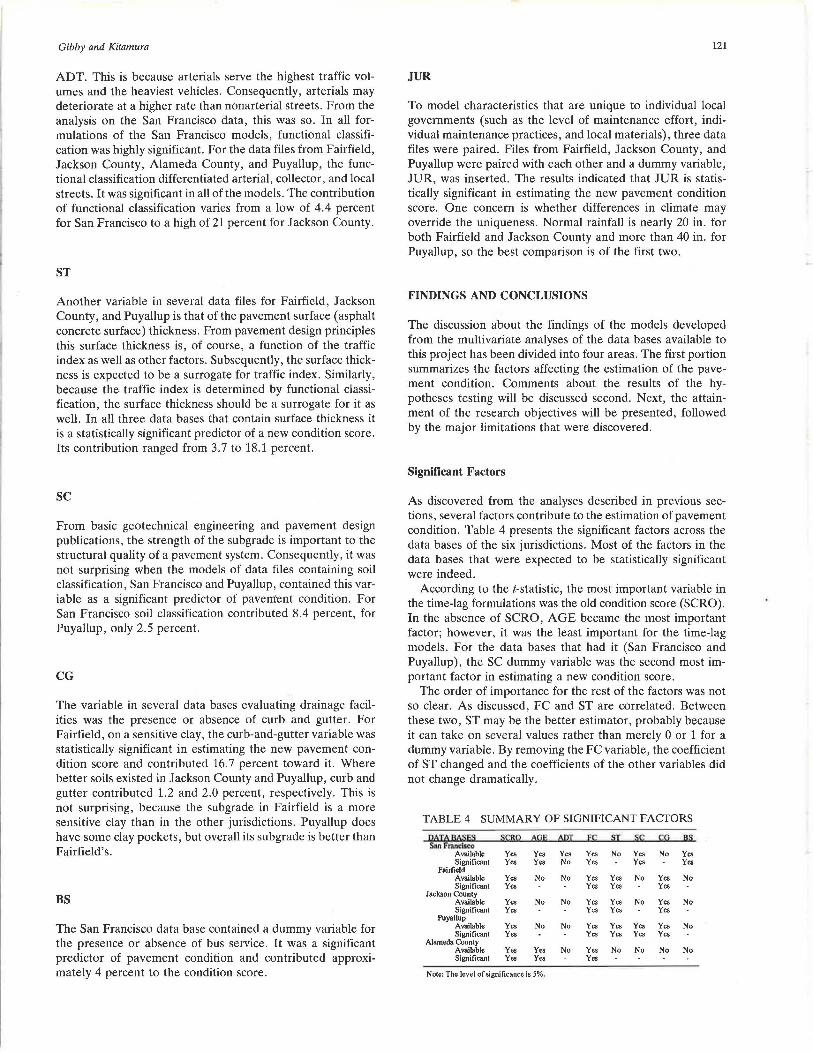
As discovered from the analyses described in previous sections, several factors contribute to the estimation of pavement condition. Table 4 presents the significant factors across the data bases of the six jurisdictions. Most of the factors in the data bases that were expected to be statistically significant were indeed.
According to the !-statistic, the most important variable in the time-lag formulations was the old condition score (SCRO). In the absence of SCRO, AGE became the most important factor; however, it was the least important for the time-lag models. For the data bases that had it (San Francisco and Puyallup), the SC dummy variable was the second most important factor in estimating a new condition score.
The order of importance for the rest of the factors was not so clear. As discussed, FC and ST are correlated. Between these two, ST may be the better estimator, probably because it can take on several values rather than merely 0 or 1 for a dummy variable. By removing the FC variable, the coefficient of ST changed and the coefficients of the other variables did not change dramatically.
TABLE 4 SUMMARY OF SIGNIFICANT FACTORS
lltiill lltiSfll s.c8!2 llQf. ti DI B; SI ~{.; {.;O llS San F111ndKo
Available Yes Yes Yes Yes No Yes No Yes Significant Yes Yes No Yes Yes Yes
Fairfield Available Yes No No Yes Yes No Yes No Significant Yes Yes Yes Yes
Jackson County Available Yes No No Yes Yes No Yes No Significant Yes Yes Yes Yes
Puyallup Available Yes No No Yes Yes Yes Yes No Significant Yes Yes Yes Yes Yes
Alameda County Available Yes Yes No Yes No No No No Significant Yes Yes Yes
Note: The level of significance is 5%.

122
For a community having a sensitive clay for a subgrade, Fairfield, the variable CG was statistically significant. The notion behind this idea is that the presence of curb-and-gutter systems would prevent moisture from affecting sensitive soils in the roadway subgrades. Another significant factor was the existence of urban transit bus service (BS).
An important discovery unique to this effort was the statistical significance of the dummy variable JUR. Consequently, the set of factors describing the pavement condition of one jurisdiction should not be directly transferred to another.
Hypotheses-Testing Results
The first null hypothesis-that SCRO does not affect SCRNwas rejected because every model included the old score whenever it was contained in data bases. Its alternative hypothesis was accepted.
Next to be rejected was the null hypothesis that the type of subgrade soil does not influence the pavement condition rating score. In fact, the alternative hypothesis (that the subgrade type does affect the score) was accepted. This was because the soil classification was included in both of the pavement condition prediction models where it was an issue, that is, San Francisco and Puyallup.
The third null hypothesis was that drainage through the dummy variable CG does not contribute to the pavement condition score. It was rejected because curb and gutter was a statistically significant variable in two out of the three data files that contained it.
The null hypothesis that ADT did not contribute to pavement rating scores was not rejected. The San Francisco data base contained ADT, but it was not a significant estimator of pavement condition. Given the associated limitations, this result is not conclusive. The next hypothesis, about bus service not affecting pavement condition, was rejected; the null hypothesis was accepted, because it did affect the condition.
That sufficient data files to model condition scores did not exist was the sixth null hypothesis, and it needed to be rejected. This rejection was justified because all six data files, with some modification, were sufficient to conduct statistical modeling. Consequently, the alternative hypothesis was accepted. This means that some existing PMSs do contain sufficient data to develop prediction models.
The final null hypothesis was that a generic model for estimating pavement condition scores applicable to several local jurisdictions cannot be derived. This null hypothesis was not rejected because the dummy variable JUR was found to be significant.
Attainment of Objectives
The factors affecting the condition of pavements maintained by local governments were identified, thus fulfilling the pri· mary objective of this research effort. These factors are
1. Old (or previous) pavement condition score, 2. Age of pavement structure since last major work, 3. Soil classification (clay or nonclay),
TRANSPORTATION RESEARCH RECORD 1344
4. Classification of roadway drainage (presence or absence of curb and gutter),
5. Surface thickness, 6. Functional classification, 7. Presence or absence of bus service, and 8. Individual jurisdiction.
Another objective was to investigate the adequacy of data bases maintained by local governments. A major effort was to collect the data required to estimate reasonably the pavement condition score. Even at that, some data used for this research effort were simply not available. Typically, local agencies do not include soil classification in PMS data files . For local jurisdictions having subgrade soils with areas of sensitive clay, the efforts to add soil type to the data base were not excessive. The marginal yfforts for additional data should not be a burden, provided a PMS is in use. One missing datum item was truck traffic counts needed to determine the traffic index. Including truck count data will require significant resources. If this information had been available, the index of determination for the best models could probably have been increased substantially. Overall, this objective was met.
Next, one multivariate analysis was performed on the combination of data files of Fairfield and Jackson County with a new dummy variable for jurisdiction included. This factor was significant; consequently, a model developed to estimate the pavement condition for one jurisdiction should not be transferred to another. Instead, a general model identifying those factors can be asserted, but an analysis unique to each jurisdiction is needed to assess which factors are significant. Consequently, the last objective was met.
Major Limitations
There are major limitations associated with this effort . The first deals with the technique of conducting field surveys to determine the condition rating scores. Another limitation relates to the limited number of time domains. The other limitations include classification counts of traffic and types of pavement. ADT was not evaluated conclusively.
The first limitation statement deals with the field collection of the pavement condition rating data. Actions are needed to ensure that the field work will be done in a manner so as to generate condition rating scores that are consistent from one time domain to another. The actions are the use of the same survey personnel for each time domain and the provision of refresher training to the personnel before each survey.
Local data bases with more than two rating surveys (i.e., two time domains) were not available for this project. There was no assurance that serial correlation does not exist in the time-lag analyses. Several data files with more than two time domains are now probably available, which will enable true time-series analysis to be conducted. It is likely that adding another time domain (rating survey) will make nonlinear models more attractive.
Another limitation existed in the data bases. The ADT data were not complete. Also , there were no traffic classification count data in any of the data files; therefore, ESALs could not be modeled. If these data were available, a variable for

Gibby and Kitamura
truck traffic would most likely be included. The addition of such a variable would probably increase the R2 of the models. Finally, there were types of pavement maintained by local jurisdictions that were not analyzed, such as facilities with evolved pavements or with asphalt concrete mixes placed directly on the subgrade.
ACKNOWLEDGMENTS
The authors take full responsibility for the content of this report, yet many individuals supplied critical information, offered helpful comments, provided valuable assistance, and gave timely encouragement. Without this support this research effort could not have been successfully completed. Helpful comments were provided by C. K. Shen, formerly of University of California, Davis; Carl Monismith of University of California, Berkeley; Joseph Hannon, a supervising materials and research engineer for Caltrans; Alan Curtis, president of CHEC Consultants, Inc.; and Thomas Ferrara of California State University, Chico. Another important contributor was Barbara Allendorfer of CHEC Consultants, who extracted appropriate data from PMS files of several clients. Data from the city of San Francisco PMS were provided by Stephen Wong of the San Francisco Public Works Department. Finally, Paul Sachs of MTC furnished data fn;>m the Alameda PMS. Tom Varga of the city of Chico, California, and Dale Petrasek of Jackson County, Oregon, provided helpful information. Several civil engineering undergraduate students at California State University, Chico, performed routine data editing and analysis for this project: Damin Abdullatiffow, Tom Brannon, William Moore, John O'Brien, Matt Snell, and Frank Pursell.
123
REFERENCES
l. A. R. Gibby. Flexible Pavement Condition Prediction Models for Local Governments. Dissertation. University of California, Davis, June 1991.
2. A . R. Gibby et al. Impact of Single Rear Axle Buses on Local Street Pavements. Civil Engineering Department, California State University, Chico, March 1991.
3. City and County of San Francisco. Pavement Management System. San Francisco, Calif., 1984.
4. MTC Pavement Management System User's Guide. ERES Consultants, Inc., Champaign, Ill.; Metropolitan Transportation Commission, Oakland , Calif., March 1986.
5. Visual Condition Rating Manual for the City of Red Bluff. CHEC Consultants, 1985.
6. J. P. Mahoney et al. Pavement Performance Equations. Washington State Transportation Center, University of Washington, Seattle, March 1988.
7. F. Fin et al. Development of Framework for Pavement Management System for Arizona. Woodward-Clyde Consultants, San Francisco, Calif.; Arizona Department of Transportation, Phoenix, Dec. 1976.
8. Congress of the United States. Toll Financing for U.S. Highways. Congressional Budget Office, Washington, D.C., Dec. 1985.
9. SAS/STAT Guide for Personal Computers (Version 6) SAS Institute, Cary, N.C., 1985.
10. W. Mendenhall and T. Sincich. Statistics for the Engineer and Computer Sciences. Dellen Publishing Co., San Francisco, Calif. , 1988.
Financial support for this efforl was supplied in part by CHEC Consultants, Inc., the state of California through the Institute of Transportation Studies Transporlation Center at Berkeley, and California State University, Chico. The content of this report is the responsibility of the authors and does no/ necessarily represent the policies of the state of California or the ideas or opinions of state employees. Furthermore, it does not necessarily represent the policies of the CHEC Consultants or the ideas or opinions of CHEC employees.
Publication of this paper sponsored by Committee on Pavement Management Systems.


![Impact Sarbanes Oxley Act Security 1344[1]](https://img.pdfslide.us/doc/110x75/577d33c11a28ab3a6b8ba601/impact-sarbanes-oxley-act-security-13441.jpg)