Embed Size (px)
Citation preview
FACTORS AFFECTING BRAND EQUITY OF
CARBONATED SOFT DRINKS INDUSTRY: A STUDY
OF COCA-COLA AND PEPSI FROM MALAYSIAN
YOUTH PERSPECTIVE
BY
RUHI ROWNAK
A dissertation submitted in fulfilment of the requirement for
the degree of Master of Science (Marketing)
Kulliyyah of Economics and Management Sciences
International Islamic University Malaysia
DECEMBER 2019
ii
ABSTRACT
The objective of this research is to identify the factors affecting the brand equity of
carbonated soft drinks from Malaysian youth perspective in two specific cola brands
namely; Coca-Cola and Pepsi. In this ongoing era, soda drinks both carbonated and
non-carbonated have escalated in diverse formations coming from miscellaneous
brands around the globe. However, talking about carbonated soft drinks, Coca-Cola
and Pepsi have been the dominant brands across the world where civilizations exist
including Malaysia where more than one in three Malaysian pupils consume at a
minimum of one can of soft drink in a day. A self-administered primary data were
collected through convenience sampling using questionnaire in universities and
shopping malls. Data were collected from 300 respondents of different gender,
educational level, different monthly income and profession who consume cola drinks
in regular basis. Customer based brand equity model were used as conceptual
framework and the independent and dependent variables are namely; brand loyalty,
brand quality, brand awareness, brand association and brand equity. Data were
analysed using descriptive and inferential analysis through Statistical Package for the
Social Sciences (SPSS). From the findings of the analysis it was found that all the
hypotheses are significant and are supported and accepted. The most effective factor
that influence or affect brand equity was found to be the brand quality followed by
brand loyalty and then brand association and brand awareness. This research will help
the cola brands and the marketing managers to know about their market position and
where they stand now in their consumer‘s mind and how they can compete with the
upcoming changes in the government rules regarding soft drinks and beverages.
iii
خلاصة البحثABSTRACT IN ARABIC
ف انغااة عه حؤثش انخ انعايم ححذذ انبحث زا ي انذف
ف انانض انشباب يظس ي انغاصت نهششباث انخداست انعلايت
انحمبت ز ف. ببغ كلا ككا: ا يحذدح حداسخ علايخ
يخعت حكاث ف انغاصت شغ انغاصت انششباث حصاعذث انغخشة،
عذ انعانى. يع رنك، أحاء خع ف يخعت حداست علاياث ي لاديت
انغاصت، كاج ششكت ككا كلا ببغ ي انششباث ع انحذث
با حضاساث حخذ حث انعانى أحاء خع ف انت انخداست انعلاياث
يانض حلايز ثلاثت كم ي حذا ي أكثش غخهك حث يانضا رنك ف
خع احذ. حى و ف انغاصت انششباث ي احذة عهبت الألم عه
اعخبا باعخخذاو انشاحت ي عاث أخز خلال ي الإداسة راحت أنت بااث
انعت أفشاد ي 033 ي انبااث خع حى. انخغق يشاكض اندايعاث ف
غخهك انز انت انشش انذخم انخعه انغخ اندظ ي
انمائت الأعى رج اعخخذاو حى .يخظى بشكم )كلا( انششباث انغاصت
لاء: انخابعت انغخمهت انخغشاث يفا عم كئطاس انعلاء عه
انخداست، بانعلايت انع انخداست، انعلايت خدة انخداست، انعلايت
انبااث ححهم انخداست. حى انعلايت ف الإصاف انخداست اندعاث
نهعهو الإحصائت انحضيت خلال ي الاعخذلان انصف انخحهم باعخخذاو
انفشضاث خع أ دذ انخحهم، خائح الاخخاعت )إط ب إط إط(. ي
ؤثش انز فاعهت الأكثش انعايم عه انعثس حى. يمبنت يذعيت يت
ه انخداست، انعلايت خدة ف عها ؤثش أ انخداست انعلايت يهكت عه
انخداست. انعلايت سابطت انخداست بانعلايت انع ثى انخداست انعلايت لاء
انخغك يذش انكلا نذش انخداست انعلاياث انبحث زا عغاعذ
أرا ف ا هحخ انز انكا انغق ف ضعى يعشفت ف
انحكيت انماعذ ف انماديت انخغشاث يع انخافظ كى كف انغخهك
.انششباث انغاصت بانششباث انخعهمت
iv
APPROVAL PAGE
I certify that I have supervised and read this study and that in my opinion; it conforms
to acceptable standards of scholarly presentation and is fully adequate, in scope and
quality, as a dissertation for the degree of Master of Science (Marketing).
……………………………………
Muhammad Tahir Jan
Supervisor
I certify that I have read this study and that in my opinion it conforms to acceptable
standards of scholarly presentation and is fully adequate, in scope and quality, as a
dissertation for the degree of Master of Science (Marketing).
……………………………………
Kalthom binti Abdullah
Internal Examiner
……………………………………
Nur Arfifah Abdul Sabian
Internal Examiner
This dissertation was submitted to the Department of Business Administration and is
accepted as a fulfilment of the requirement for the degree of Master of Science
(Marketing).
……………………………………
Noor Hazilah Abd Manaf
Head, Department of Business
Administration
This dissertation was submitted to the Kulliyyah of Economics and Management of
Science and is accepted as a fulfilment of the requirement for the degree of Master of
Science (Marketing).
……………………………………
Hassanuddeen Bin Abd.Aziz
Dean, Kulliyyah of Economics and
Management Sciences
v
DECLARATION
I hereby declare that this dissertation is the result of my own investigations, except
where otherwise stated. I also declare that it has not been previously or concurrently
submitted as a whole for any other degrees at IIUM or other institutions.
Ruhi Rownak
Signature ........................................................... Date .........................................
vi
COPYRIGHT PAGE
INTERNATIONAL ISLAMIC UNIVERSITY MALAYSIA
DECLARATION OF COPYRIGHT AND AFFIRMATION OF
FAIR USE OF UNPUBLISHED RESEARCH
FACTORS AFFECTING BRAND EQUITY OF CARBONATED
SOFT DRINKS INDUSTRY: A STUDY OF COCA-COLA AND
PEPSI FROM MALAYSIAN YOUTH PERSPECTIVE
I declare that the copyright holders of this dissertation are jointly owned by the student
and IIUM.
Copyright © 2019 Ruhi Rownak and International Islamic University Malaysia. All rights reserved.
No part of this unpublished research may be reproduced, stored in a retrieval system,
or transmitted, in any form or by any means, electronic, mechanical, photocopying,
recording or otherwise without prior written permission of the copyright holder
except as provided below
1. Any material contained in or derived from this unpublished research may
only be used by others in their writing with due acknowledgement.
2. IIUM or its library will have the right to make and transmit copies (print
or electronic) for institutional and academic purposes.
3. The IIUM library will have the right to make, store in a retrieved system
and supply copies of this unpublished research if requested by other
universities and research libraries.
By signing this form, I acknowledged that I have read and understand the IIUM
Intellectual Property Right and Commercialization policy.
Affirmed by Ruhi Rownak
……..…………………….. ………………………..
Signature Date
vii
ACKNOWLEDGEMENTS
Alhamdulillah, all praises to Allah, the Almighty, the Most Gracious and Most
Merciful. Alhamdulillah for providing me with the will, ability, and patience to
acquire knowledge and complete my master's degree.
Firstly, it is my utmost pleasure to dedicate this work to my dear parents and
my family, who granted me the gift of their unwavering belief in my ability to
accomplish this goal. Thank you for your support and patience.
Secondly, sincere gratitude and special thanks to my supervisor Dr.
Muhammad Tahir Jan for his continuous support, endless encouragement and
leadership, and for that, I will be forever grateful.
I would like to express my appreciation and thanks to my lecturers in the
department and the faculty of Economics and Management Sciences, classmates and
colleagues and those who helped me with their time, effort and support to complete
this dissertation. To the members of my dissertation committee, thank you for sticking
with me.
viii
TABLE OF CONTENTS
Abstract ........................................................................................................................ ii Abstract in Arabic ........................................................................................................ iii Approval Page .............................................................................................................. iv
Declaration ................................................................................................................... v Copyright Page ............................................................................................................. vi Acknowledgements ...................................................................................................... vii List of Tables ............................................................................................................... xi List of Figures .............................................................................................................. xiii
CHAPTER ONE: INTRODUCTION ...................................................................... 1 1.1 Background of the Study ........................................................................... 1
1.2 Statements of the Problem ........................................................................ 3 1.3 Research Objectives .................................................................................. 7
1.3.1 General Objective ........................................................................... 7 1.3.2 Specific Objectives ......................................................................... 7
1.4 Research Questions ................................................................................... 8 1.5 Significance of the Study .......................................................................... 8
1.5.1 Practical Significance ..................................................................... 9 1.5.2 Theoretical Significance ................................................................. 10
1.6 Definitions of Key Terms.......................................................................... 10
1.7 Outline of the Study .................................................................................. 12 1.8 Chapter Summary...................................................................................... 13
CHAPTER TWO: LITERATURE REVIEW ......................................................... 15 2.1 Introduction ............................................................................................... 15 2.2 Carbonated Soft Drinks Industry Around the World ................................ 15
2.3 Carbonated Soft Drinks Industry in Malaysia ........................................... 19 2.4 Concept of Brand Equity ........................................................................... 23
2.4.1 Definition of Brand Equity ............................................................. 23 2.4.2 Benefits of Brand Equity ................................................................ 28 2.4.3 Measurements of Brand Equity ...................................................... 29
2.5 Customer Based Brand Equity .................................................................. 29 2.5.1 Definition of Customer Based Brand Equity .................................. 29
2.5.2 Benefits of Customer Based Brand Equity ..................................... 31 2.5.3 Measurements of Customer Based Brand Equity ........................... 32
2.6 Brand Loyalty and Brand Equity .............................................................. 32
2.6.1 Definition of Brand Loyalty ........................................................... 32 2.6.2 Benefits of Brand Loyalty .............................................................. 34 2.6.3 Measurements of Brand Loyalty .................................................... 34 2.6.4 Effect of Brand Loyalty on Brand Equity ....................................... 35
2.7 Brand Quality and Brand Equity ............................................................... 36 2.7.1 Definition of Brand Quality ............................................................ 36 2.7.2 Benefits of Brand Quality ............................................................... 37 2.7.3 Measurements of Brand Quality ..................................................... 37 2.7.4 Effects of Brand Quality on Brand Equity ..................................... 38
ix
2.8 Brand Awareness and Brand Equity ......................................................... 39
2.8.1 Definition of Brand Awareness ...................................................... 39 2.8.2 Benefits of Brand Awareness ......................................................... 40
2.8.3 Measurements of Brand Awareness ............................................... 41 2.8.4 Effects of Brand Awareness on Brand Equity ................................ 42
2.9 Brand Association and Brand Equity ........................................................ 42 2.9.1 Definition of Brand Association ..................................................... 42 2.9.2 Benefits of Brand Association ........................................................ 43
2.9.3 Measurements of Brand Association .............................................. 44 2.9.4 Effects of Brand Association on Brand Equity............................... 45
2.10 Summary of Hypotheses .......................................................................... 46 2.11 Conceptual Framework ............................................................................ 46 2.12 Chapter Summary..................................................................................... 47
CHAPTER THREE: RESEARCH METHODOLOGY ........................................ 48 3.1 Introduction ............................................................................................... 48 3.2 Research Design ........................................................................................ 48 3.3 Target Population ...................................................................................... 49 3.4 Sampling Procedure .................................................................................. 50
3.4.1 Sample Area .................................................................................... 50 3.4.2 Sample Size .................................................................................... 50
3.4.3 Sampling Method ............................................................................ 52 3.4.4 Convenience Sampling ................................................................... 52
3.5 Research Instrument .................................................................................. 53
3.6 Questionnaire Development ...................................................................... 54 3.7 Measurement Scale ................................................................................... 55
3.8 Questionnaire Pretesting ........................................................................... 56 3.9 Data Collection Method ............................................................................ 56
3.10 Data Analysis Tools ................................................................................. 57 3.10.1 Descriptive Analysis .................................................................... 57 3.10.2 Reliability Analysis ...................................................................... 58
3.10.3 Data Preparation .......................................................................... 58
3.10.4 Missing Data ................................................................................ 59 3.10.5 Normality ..................................................................................... 60 3.10.6 Validity Analysis ......................................................................... 61 3.10.7 Construct Validity ........................................................................ 61 3.10.8 Convergent Validity ..................................................................... 61
3.10.9 Discriminant Validity .................................................................. 62 3.10.10 Factor Analysis........................................................................... 62 3.10.11 Exploratory Factor Analysis (EFA) ........................................... 63 3.10.12 Pearson Correlation Analysis ..................................................... 64
3.10.13 Multiple Regression Analysis .................................................... 65 3.11 Chapter Summary..................................................................................... 66
CHAPTER FOUR: DISCUSSION OF DATA ANALYSIS AND RESULTS ........... 67 4.1 Introduction ............................................................................................... 67 4.2 Descriptive Analysis ................................................................................. 67
4.2.1 Response Rate ................................................................................. 67 4.2.2 Demographic Profile of Respondents ............................................. 68
x
4.2.3 Descriptive Analysis ....................................................................... 71
4.3 Data Preparation and Data Cleaning ......................................................... 81 4.3.1 Missing Data ................................................................................... 81
4.3.2 Normality ........................................................................................ 81 4.4 Reliability Analysis ................................................................................... 82 4.5 Exploratory Factor Analysis (EFA) .......................................................... 84
4.5.1 Kaiser-Meyer-Olkin (KMO) ........................................................... 84 4.5.2 Factor Loading ................................................................................ 85
4.6 Validity ...................................................................................................... 88 4.6.1 Construct Validity ........................................................................... 88 4.6.2 Convergent Validity ........................................................................ 88 4.6.3 Discriminant Validity ..................................................................... 88
4.7 Correlation Among Constructs ................................................................. 89
4.8 Multiple Regression Analysis ................................................................... 92
4.9 Result of Hypothesis Testing .................................................................... 93
4.10 Hypothesis Testing ................................................................................... 95 4.11 Most Effective Variable on Brand Equity ................................................ 100 4.12 Chapter Summary..................................................................................... 101
CHAPTER FIVE: DISCUSSION AND CONCLUSION ....................................... 102 5.1 Introduction ............................................................................................... 102
5.2 Summary of Findings ................................................................................ 102 5.3 Discussion and Findings ........................................................................... 103 5.4 Implications ............................................................................................... 107
5.4.1 Theoretical Implication ................................................................... 107 5.4.2 Managerial Implication ................................................................... 108
5.4.3 Methodological Implication ............................................................ 108 5.5 Limitations of the Study ............................................................................ 109
5.6 Conclusion ................................................................................................ 109 5.7 Recommendations and Suggestions for Future Research ......................... 110
REFERENCES ........................................................................................................... 112
APPENDIX A: RESEARCH QUESTIONNAIRE ................................................. 122
xi
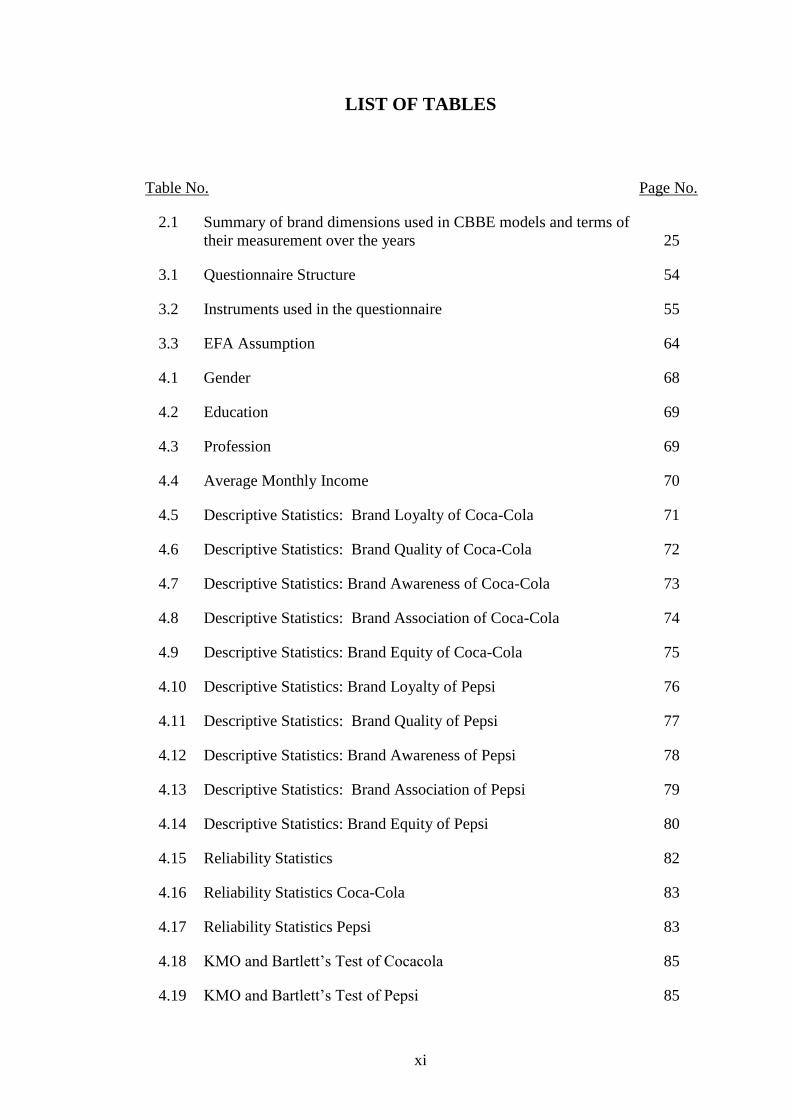
LIST OF TABLES
Table No. Page No.
2.1 Summary of brand dimensions used in CBBE models and terms of
their measurement over the years 25
3.1 Questionnaire Structure 54
3.2 Instruments used in the questionnaire 55
3.3 EFA Assumption 64
4.1 Gender 68
4.2 Education 69
4.3 Profession 69
4.4 Average Monthly Income 70
4.5 Descriptive Statistics: Brand Loyalty of Coca-Cola 71
4.6 Descriptive Statistics: Brand Quality of Coca-Cola 72
4.7 Descriptive Statistics: Brand Awareness of Coca-Cola 73
4.8 Descriptive Statistics: Brand Association of Coca-Cola 74
4.9 Descriptive Statistics: Brand Equity of Coca-Cola 75
4.10 Descriptive Statistics: Brand Loyalty of Pepsi 76
4.11 Descriptive Statistics: Brand Quality of Pepsi 77
4.12 Descriptive Statistics: Brand Awareness of Pepsi 78
4.13 Descriptive Statistics: Brand Association of Pepsi 79
4.14 Descriptive Statistics: Brand Equity of Pepsi 80
4.15 Reliability Statistics 82
4.16 Reliability Statistics Coca-Cola 83
4.17 Reliability Statistics Pepsi 83
4.18 KMO and Bartlett‘s Test of Cocacola 85
4.19 KMO and Bartlett‘s Test of Pepsi 85
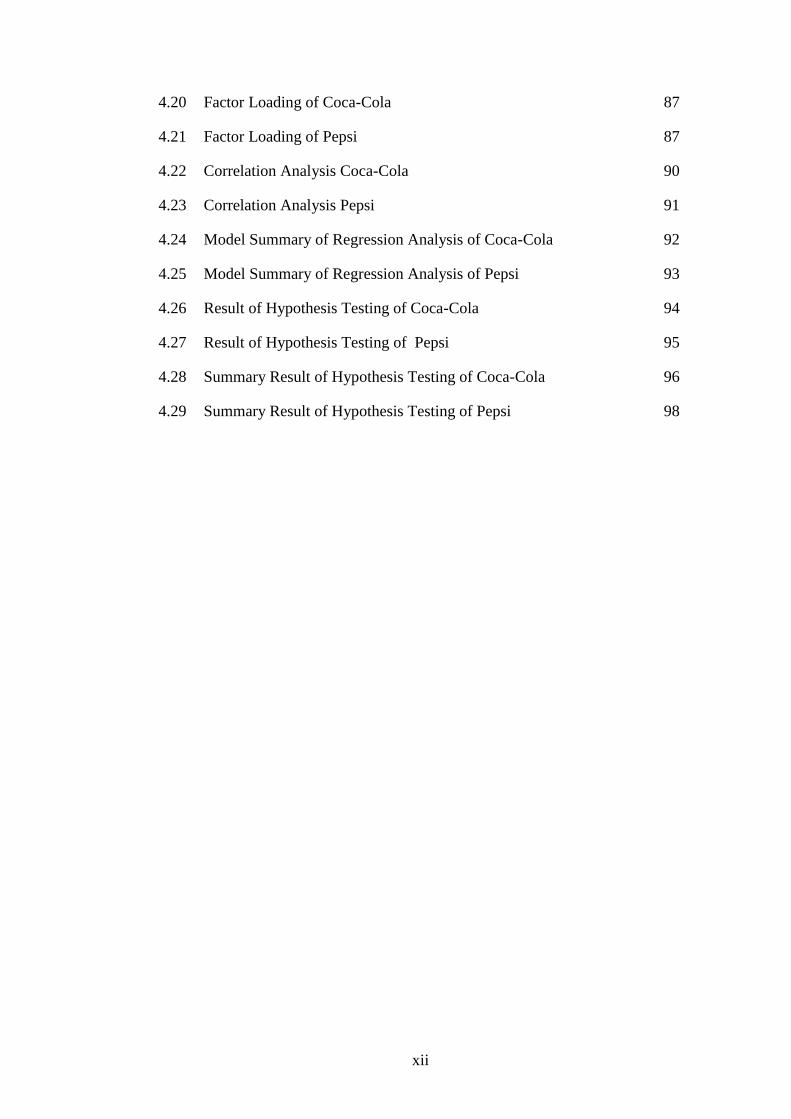
xii
4.20 Factor Loading of Coca-Cola 87
4.21 Factor Loading of Pepsi 87
4.22 Correlation Analysis Coca-Cola 90
4.23 Correlation Analysis Pepsi 91
4.24 Model Summary of Regression Analysis of Coca-Cola 92
4.25 Model Summary of Regression Analysis of Pepsi 93
4.26 Result of Hypothesis Testing of Coca-Cola 94
4.27 Result of Hypothesis Testing of Pepsi 95
4.28 Summary Result of Hypothesis Testing of Coca-Cola 96
4.29 Summary Result of Hypothesis Testing of Pepsi 98
xiii
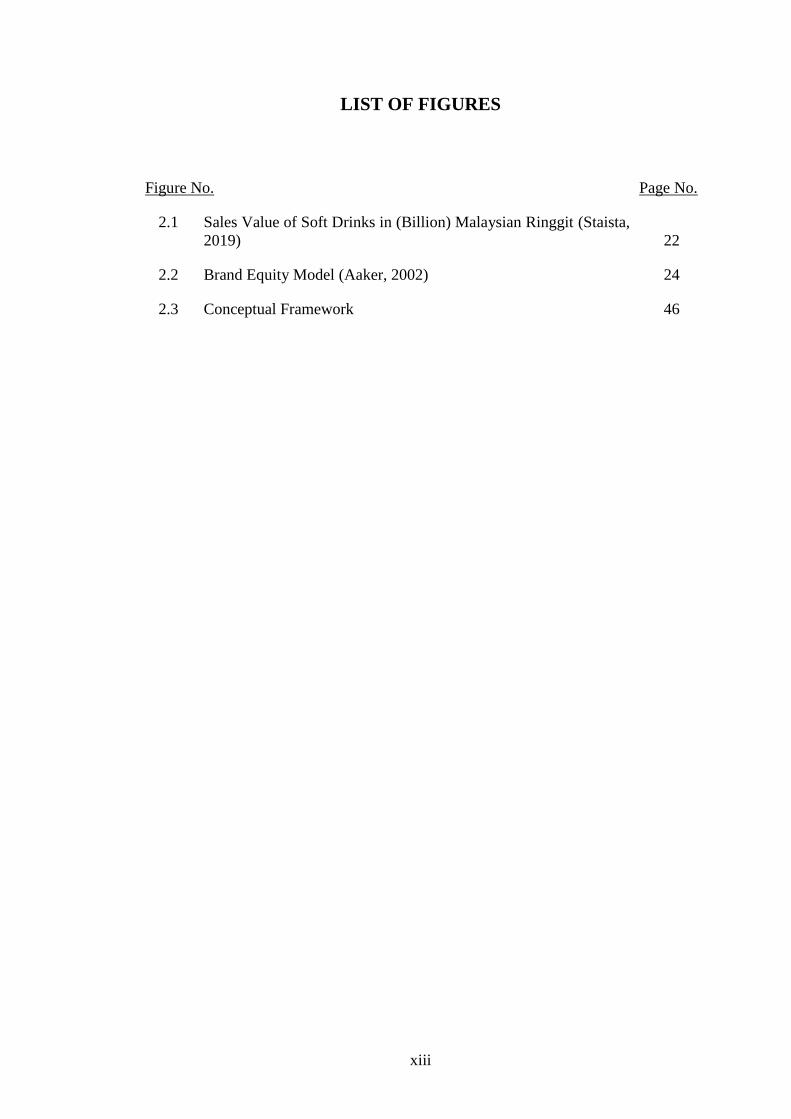
LIST OF FIGURES
Figure No. Page No.
2.1 Sales Value of Soft Drinks in (Billion) Malaysian Ringgit (Staista,
2019) 22
2.2 Brand Equity Model (Aaker, 2002) 24
2.3 Conceptual Framework 46
1
CHAPTER ONE
INTRODUCTION
1.1 BACKGROUND OF THE STUDY
A brand is known as a product, a service or an idea that can be easily identified from
other or different types of products, services or ideas which can also be promoted or
marketed in a convenient method. A brand name is the name of a particular product,
service or idea that makes it stand out among the other similar kinds of products,
services or ideas (adapted from Aaker, 1991; Kotler, 1996). All organisations,
regardless of span, size or sector, want to build or create a strong brand name in order
to keep their product‘s name in the mind of the consumers. Out of many possibilities,
a brand name can be used as a corporate identity as well as an individual product. For
every brand that is created to achieve a mass demand in order to sustain in a
competitive environment, it is mandatory to know how much value that the brand
should have. According to Falkenberg (1996), ―Developing the brand value is a key
goal to be accomplished by increasing more great affiliations and sentiments of target
shoppers‖. Thus, it is crucial to understand the procedure and application of how to
measure the brand value not only within the local boundary but also across
boundaries. For the past couple of decades, brand value has been playing a vital role
and it has become a critical firm resource for both the management and advisors.
In the many debates that have been held on brands, the two frequently asked
questions are ―What makes a brand strong?‖ and ―How do you build a strong brand?‖
Many researchers have attempted to answer these questions in different profound
ways; however, the most prevalent is the customer-based brand equity (CBBE) model.
This independent model particularly incorporates theoretical advances and managerial
2
practices in understanding and influencing consumer behaviour. The customer-based
brand equity model portrays a unique perspective to elucidate the meaning of brand
equity and the way it should be constructed, evaluated, and organised.
This study is aimed at evaluating the factors that affect the brand equity of the
carbonated soft drinks industry from Malaysian youth perspective. The soft drink
industry faces intense competition coupled with decreasing demand for carbonates.
Prominent brands in the industry are sustaining their position in this adverse scenario
on the strength of the organisation‘s face value, product branding, and publicity
tactics. Conventionally, soft drinks are commonly accepted as non-alcoholic drinks
comprising syrup essence or fruit extract infused with water. Carbonated soft drinks
are currently contemplated as thirst quenchers, sterilized and often indulged during
joyous occasions. Traditionally, carbonated beverages are produced through the
establishment of a licensing business in which the mother company imparts the
formulations, reputation, expertise, and the licensing or bottling operation to the
licensees for the production of the beverages for the market.
Currently, both carbonated and non-carbonated soft drinks have mushroomed
in diverse forms, produced under various brands around the globe. Regarding
carbonated soft drinks, Coca-Cola and Pepsi have been the dominant brands across the
world including in Malaysia (Investopedia, 2019). In Malaysia, the carbonated soft
drinks market has maintained increased demand throughout the years for the various
types of soft drinks sold, as evidenced by the statistics from the National Health and
Morbidity Survey (Adolescent Health Survey ,2017), which stated that one in three
Malaysian pupils consumes at least one can of soft drinks in a day. It indicates that
students, at their young age, are the main consumers of carbonated soft drinks in the
country. Youth below the age of 25 years old formed a large proportion of Malaysia‘s
3
population at 45% in 2015, as shown in the Food and Beverage Sector (2017/2018)
report published by British Malaysian Chamber of Commerce (BMCC). It could be
the primary reason for the dominance of carbonated soft drinks as the main soft drinks
consumed in the country. According to the Food and Beverage Sector Report, this
sector has a market size of US$6 billion globally with a growth rate of 7 percent to 10
percent in the year 2017/2018, and thereafter, the rate will remain consistent at 7
percent. There are many main manufacturers and distributors of soft drinks in
Malaysia including F&N, which is a renowned processing and bottling company that
distributes popular brands such as Coca-Cola, F&N Fun Flavors, 100PLUS, and
Seasons & Fruit Trees. Yeo Hiap Seng is the second largest manufacturer and
distributor of soft drinks in Malaysia, selling Yeo‘s Fizzi and Soy Rich in the soft
drinks segment. Despite the presence of several local brands, Coca-Cola and Pepsi
remain the leaders in the carbonated soft drinks industry.
The decision making regarding the drinks depends on various aspects. Brand
equity plays an important role in purchasing soft drinks. Popular brands‘ face value
pushes patrons towards making the final purchase decision and consumption of a
particular product. This research portrays that the brand is a possible determinant of
consumers‘ selection of soft drinks.
1.2 STATEMENTS OF THE PROBLEM
For decades, organisations have aimed to establish strong brands that will help them
maintain a competitive position in the market. A firm owning a strong brand with
unshaken brand equity has a huge advantage in terms of having greater customer
loyalty, lower competition, critical marketing actions, higher profit margins with
positive responses from consumers towards price increases or decreases, huge mutual
4
support from trade associates or intermediaries, as well as greater efficacy of
marketing communication, licensing and brand extension opportunity. In the past
fifteen years, brand equity has become an intangible firm resource due to its
advantages and increasing importance to managers and marketing researchers. Brands
that hold a strong equity with a high level of recognition and a strong position in
consumers‘ minds can facilitate firms in attaining excellent performance which
includes greater market share, high price premiums, inelastic price sensitivity, new
business expansion, higher profitability, flexible cost structures, and greater
competitive advantages (Keller & Lehmann, 2003; Vazquez et al. 2002).
For companies, the main targets are to increase their sales and generate growth
opportunities, and their product is the key in fulfilling these aims. A product is
manufactured and marketed to fulfil consumers‘ needs and wants and to satisfy their
expectation. A brand is a specific product under the company‘s name, and a strong
brand is the key to increasing the value of the company (Cravens & Piercy, 2009).
Recently, beverage companies like Coca-Cola and Pepsi have been triumphant in their
strategic brand management. Companies are now under tremendous pressure to
maintain their brand value in the market. Building brand loyalty has become a focus
point to gain market share in the competitive market in the same industry. In
Malaysia, the soft drinks industry is ruled by the local brands rather than the renowned
international brands. Thus, it is crucial for Coca-Cola and PepsiCo to ascertain the key
factors that affect their brand equity and how they can rule over the local brands. As
stated in Fraser and Neave‘s Annual Report (2014), in the isotonic drinks category,
100PLUS is dominating the market with 90% of the market share, and its sales
surpasses leading global brands such as Coca-Cola and Pepsi in the soft drinks
segment. Thus this indicates the first problem to be solved by this study that is, how
5
two leading brands namely, Coca-Cola and Pepsi can compete to increase their brand
equity against the local brands.
According to Reynolds and Phillips (2005), ―Over the last 15 years, brand
equity has become more important as the key to understanding the objectives,
mechanisms and net impact of the holistic impact of marketing‖. Thus, it can be said
that brand equity measures have now become crucial criteria for examining marketing
performances (Ambler, 2003). Despite the numerous studies conducted in this area, no
conclusion has been reached on brand equity (Berthon et al., 2001). Studies have been
conducted to measure and examine the impact of brand equity dimensions on the
overall brand equity in different sectors and different industries. Yoo and Donthu
(2001) carried out a study to determine the relationship between brand equity
dimensions and the construct‘s invariances in product brands for films, jeans and
athletic shoes among different cultures where they found out that brand awareness and
association fell into same dimension. Subsequently, Christodoulides et al. (2006)
measured brand equity dimensions for an online platform via expert interviews, and
the dimensions he discovered are emotional connection, online experience, responsive
nature, trust, and fulfillment where the most effective dimension was emotional
connections.
Vadivelu Thusyanthy (2018) researched the impact of health consciousness on
customer-based brand equity in the carbonated soft drinks industry in Sri Lanka by
using health belief model theory where the result shows that, the degree of health
consciousness and customer based brand equity are in low level and moderate level on
the other hand health consciousness has significant positive impact on customer based
brand equity.
6
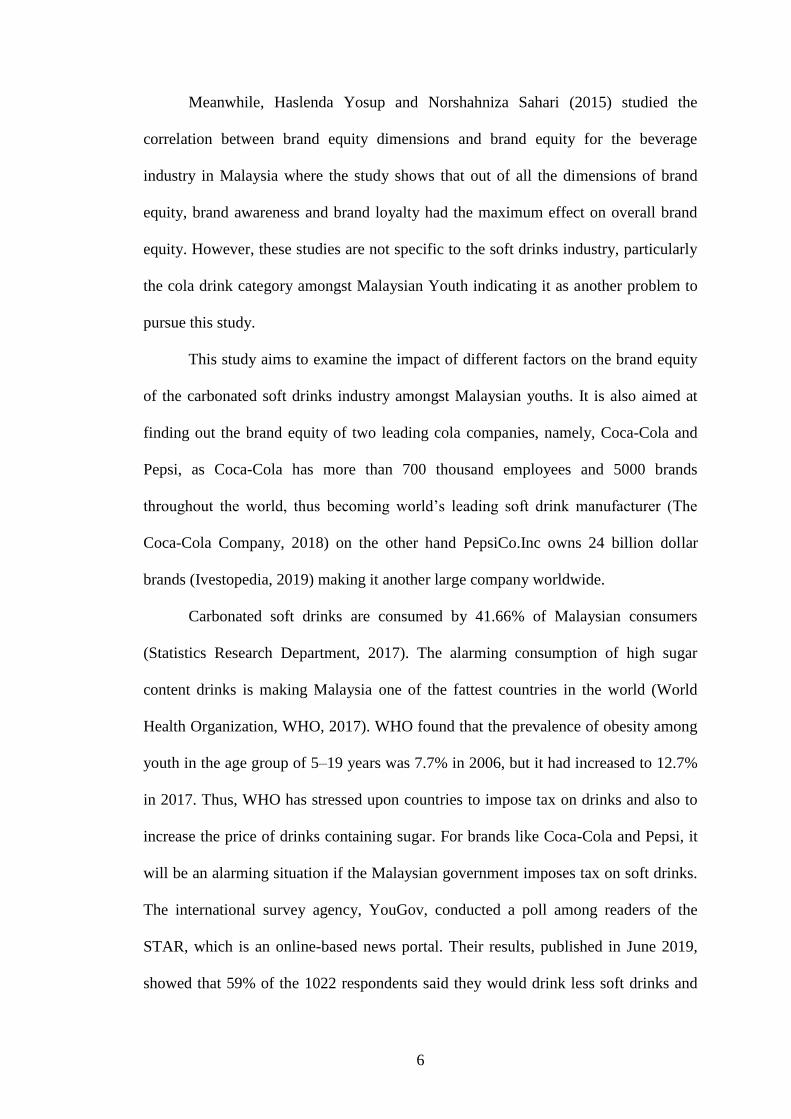
Meanwhile, Haslenda Yosup and Norshahniza Sahari (2015) studied the
correlation between brand equity dimensions and brand equity for the beverage
industry in Malaysia where the study shows that out of all the dimensions of brand
equity, brand awareness and brand loyalty had the maximum effect on overall brand
equity. However, these studies are not specific to the soft drinks industry, particularly
the cola drink category amongst Malaysian Youth indicating it as another problem to
pursue this study.
This study aims to examine the impact of different factors on the brand equity
of the carbonated soft drinks industry amongst Malaysian youths. It is also aimed at
finding out the brand equity of two leading cola companies, namely, Coca-Cola and
Pepsi, as Coca-Cola has more than 700 thousand employees and 5000 brands
throughout the world, thus becoming world‘s leading soft drink manufacturer (The
Coca-Cola Company, 2018) on the other hand PepsiCo.Inc owns 24 billion dollar
brands (Ivestopedia, 2019) making it another large company worldwide.
Carbonated soft drinks are consumed by 41.66% of Malaysian consumers
(Statistics Research Department, 2017). The alarming consumption of high sugar
content drinks is making Malaysia one of the fattest countries in the world (World
Health Organization, WHO, 2017). WHO found that the prevalence of obesity among
youth in the age group of 5–19 years was 7.7% in 2006, but it had increased to 12.7%
in 2017. Thus, WHO has stressed upon countries to impose tax on drinks and also to
increase the price of drinks containing sugar. For brands like Coca-Cola and Pepsi, it
will be an alarming situation if the Malaysian government imposes tax on soft drinks.
The international survey agency, YouGov, conducted a poll among readers of the
STAR, which is an online-based news portal. Their results, published in June 2019,
showed that 59% of the 1022 respondents said they would drink less soft drinks and
7
13% said they would stop drinking sugary beverages. Among them, 25% said it will
be a beneficial movement by the government to impose sugar tax on soft drinks, while
35% said imposing sugar tax will have a huge negative impact on businesses,
especially the soft drinks industry. Thus, brands like Coca-Cola and Pepsi might be
facing a huge obstacle to secure their business in Malaysia if the sugar tax is imposed.
Therefore, these organisations need to know the factors affecting their brand equity in
order to continue their business and to formulate new strategies to improve their brand
value even after the implementation of the sugar tax stipulating another problem to be
solved through this study. This study might provide useful information to these two
organisations in addressing the potential problem by giving them insights about their
own brand‘s brand equity dimensions.
1.3 RESEARCH OBJECTIVES
1.3.1 General Objective
The general objective of this study is to examine the effect of various factors of
consumer-based brand equity — CBBE (brand loyalty, brand quality, brand
awareness, and brand association) on brand equity.
1.3.2 Specific Objectives
The following specific objectives are pursued in this study:
1. To examine the impact of brand loyalty on brand equity.
2. To examine the impact of brand quality on brand equity.
3. To examine the impact of brand awareness on brand equity.
4. To examine the impact of brand association on brand equity.
5. To examine which independent variable has more effect on brand equity.
8
1.4 RESEARCH QUESTIONS
With these objectives in mind, this study is aimed at answering the following
questions:
1. What is the impact of brand loyalty on brand equity?
2. What is the impact of brand quality on brand equity?
3. What is the impact of brand awareness on brand equity?
4. What is the impact of brand association on brand equity?
5. Which of independent variable has more effect on brand equity?
1.5 SIGNIFICANCE OF THE STUDY
Throughout the centuries, the concept of brand equity started to be used widely by
advertising practitioners. They have conducted many studies in this area because of
their interest in the brand equity concept. Many approaches have been used to measure
the customer-based brand equity for different industries. The reason behind the
measurement is the increasing demand of today‘s market place to gain competitive
advantage by developing, maintaining, and utilising product branding. Several
academicians and researchers have contributed to the field of brand equity and
explored the dimensions and measures, such as Aaker (1991), Srivastava and Shocker
(1991), Kaperer (1992), and Keller (1993, 1998). However, researchers are still
struggling to define the brand equity concept, meaning, and the measurement
techniques (Washburn, 2002). Previously, different financial techniques were used to
measure the brand equity (Farquhar et al., 1991; Simon & Sullivan, 1990; Kapferer,
1997). In recent years, researchers are focusing not only on the financial perspective
of brand equity but also on the customer-based perspective with attention given to the
9
impact of brand preferences, purchase intention, purchasing behaviour, and purchase
alliances (Alba, 2000; Cobb-Walgren et al., 1995).
Renowned and more established brands have a huge advantage of a high
market share because they can utilise the distribution channels well. Usually, strong,
well established brands have an advantage in terms of the shelf space for fast moving
consumer goods (FMCG) where the competition is high, especially for beverages and
the likes. For such brands, consumer demand will always be high, which in turn will
influence the distributors, wholesalers, and retailers to carry those brands. They will
partner with such strong brands even if the products are not purchased frequently or
have a low market share because they know that the products will be sold because of
the brand name. Thus, all of these factors indicate the advantages of establishing a
strong brand, and the opportunity to build a competitive advantage has motivated
marketers to focus their attention to the idea of brand equity.
1.5.1 Practical Significance
Malaysians are now concerned about their health, as confirmed by the survey done by
YouGov (published in June 2019). From the survey, it can be seen that 64% of the
respondents are well aware of the tax that will be imposed on sweetened beverages, as
announced by Finance Minister Lim Guan Eng in the 2019 Budget. The survey found
that 20% of the respondents consume soft drinks several times in a week or month,
6% consume them several times a day, and 8% consume them at least once a day.
These low percentages could be a cause for concern for beverage companies like
Coca-Cola and Pepsi. This study is aimed at helping these two companies in terms of
knowing their current brand equity and the factors affecting their brand equity so that
they can make insightful decision to strengthen their position among the local brands
10
as well as ensuring their business will sustain even after the imposition of the sugar
tax by the government.
1.5.2 Theoretical Significance
Thus study aims to determine the direct effects of different factors on the brand equity
in the soft drinks industry context and figure out whether the outcome of the
customer-based brand equity scale derived from Aaker‘s (2000) brand equity model is
consistent in the case of the soft drinks industry from Malaysian youth perspective.
From the managerial point of view, the current study facilitates researchers,
wholesalers, retailers, and marketers in keeping on track and targeting their customers
based on who they are, and it will help them in identifying the factors that build a
strong brand and what triggers the customers to be loyal to a particular brand.
Focusing on different strategies to build a brand could be a waste of money and time;
rather, this study aims to guide them on how to develop strategies to strengthen their
brand in consumers‘ mind.
1.6 DEFINITIONS OF KEY TERMS
The key terms that are used throughout the study are defined and described in order to
recognize and comprehend the relevant concepts and terms utilized in the current
study for better understanding. Below is the list of key terms:
Brand Equity
According to Aaker (1991), brand equity is ―a set of brand assets and liabilities linked
to a brand, its name and symbol that add to or subtract from the value provided by a
product or service to a firm and/or to that firms‘ customers‖.
11
Customer Based Brand Equity
According to Washburd and Plank (2002), ―Customer-based brand equity is defined
from the perspective of the customer and is based on consumer knowledge, familiarity
and associations with respect to the brand‖.
Brand Loyalty
According to Solomo Marshall and Stuart (2012), ―Brand loyalty is a pattern of repeat
product purchases, accompanied by an underlying positive attitude towards the brand,
based on the belief that the brand makes products superior to those of its competition.‖
Brand Quality
A brand‘s perceived quality can be defined as ―The customer‘s judgement about a
product‘s overall excellence or superiority in comparison to an alternative brand and
the overall superiority that ultimately motivates the customer to purchase the product‖
(Aaker & Johnson, 1994).
Brand Awareness
Brand awareness is known to be a crucial determinant of brand equity that helps an
individual to recall and recognise a brand (Aaker 1996; Keller 2003; Yoo & Donthu,
2001).
Brand Association
According to Aaker (1991), ―Brand associations create value for the firm and its
customers by helping to process/retrieve information, differentiate the brand, create
positive attitudes or feelings, provide a reason to buy, and basis for extensions.‖