Embed Size (px)
Citation preview

903
Factors Affecting Blood Glucose Monitoring:Sources of Errors in Measurement
Barry H. Ginsberg, M.D., Ph.D.
Author Affiliation: Diabetes Technology Consultants, Wyckoff, New Jersey
Abbreviations: (ADA) American Diabetes Association, (FDA) Food and Drug Administration, (ISO) International Standards Organization, (MARE) mean absolute relative error, (SMBG) self-monitoring of blood glucose Keywords: coding, glucose, inaccuracy, meter, self-monitoring of blood glucose, SMBG
Corresponding Author: Barry H. Ginsberg, M.D., Ph.D., President, Diabetes Technology Consultants, 501 Lydia Lane, Wyckoff, NJ 07481; email address [email protected]
Journal of Diabetes Science and Technology Volume 3, Issue 4, July 2009 © Diabetes Technology Society
AbstractGlucose monitoring has become an integral part of diabetes care but has some limitations in accuracy. Accuracy may be limited due to strip manufacturing variances, strip storage, and aging. They may also be due to limitations on the environment such as temperature or altitude or to patient factors such as improper coding, incorrect hand washing, altered hematocrit, or naturally occurring interfering substances. Finally, exogenous interfering substances may contribute errors to the system evaluation of blood glucose.
In this review, I discuss the measurement of error in blood glucose, the sources of error, and their mechanism and potential solutions to improve accuracy in the hands of the patient. I also discuss the clinical measurement of system accuracy and methods of judging the suitability of clinical trials and finally some methods of overcoming the inaccuracies. I have included comments about additional information or education that could be done today by manufacturers in the appropriate sections. Areas that require additional work are discussed in the final section.
J Diabetes Sci Technol 2009;3(4):903-913
REVIEW ARTICLE
Introduction
Blood glucose monitoring, an integral part of standard diabetes care,1 often has significant errors that are often poorly understood by patients and providers.2 By understanding the source of the error and methods of prevention and correction, health care providers can help their patients use the systems more effectively. In this review, I discuss how we measure inaccuracy, the source of errors in self-monitoring of blood glucose (SMBG), clinical testing of the systems, and how some of these errors can be minimized or eliminated.
Measuring Accuracy
Accuracy of a blood glucose meter is a measure of how closely the average of a series of values reflects the reference value. As seen in Figure 1 (left), the average of a series of values can be perfectly accurate, although none of the individual values is representative of the reference. Precision describes the reproducibility of a series of values, independent of the closeness of any of the values to the reference. Again, as seen in
904
Factors Affecting Blood Glucose Monitoring: Sources of Errors in Measurement Ginsberg
www.journalofdst.orgJ Diabetes Sci Technol Vol 3, Issue 4, July 2009
Figure 1 (center), a series of values can be highly precise, although none of the individual values is representative of the reference. Only when a series of values is both accurate and precise (Figure 1, right) do the individual values actually reflect the reference value.
Figure 2 shows these same definitions applied to SMBG. The green line defines perfect accuracy. As seen on the left, a series of measurements, half of which are high by 100 mg/dl and half low by 100 mg/dl, would be considered perfectly accurate as a set since the high values and the low values would average to the true value. Conversely, as seen in the center of Figure 2, a series of measurements, each of which is high by 100 mg/dl, would be considered perfectly precise although biased. As seen on the right in Figure 2, only when a series of values are both accurate and precise do all of the values fall exactly on the green line of accuracy.
The best single measure of both accuracy and precision is the mean absolute relative error (MARE) (also called mean absolute relative deviation or MARD and mean absolute error or MAE). Mean absolute relative error is calculated by taking the average for the set of individual absolute errors relative to its reference value (Figure 3). So, for example, with a reference value of 100 mg/dl, measured values of both 90 and 110 are in error by 10%.
Figure 2. The left panel is a set of measured glucose values shown in yellow circles and compared to the line of identity (reference) shown in green. The set of values is accurate since half of the values are high by 100 and half are low by 100, but none of the values represents the reference values. In the center panel, all measured values are high by 100. The set of values is very precise and reproducible but not representative of the reference values. On the right, the set of values is both accurate and precise, and under these conditions, the individual values must all be similar to the reference values.
Figure 1. In each panel, the center of the crosshairs represents the reference value. In the left panel, the individual values, shown in yellow, have a mean value that is the same as the reference value, thus the set of values is accurate, although no individual value is similar to the reference. In the center panel, all values are nearly identical, thus the set of values is very precise and reproducible, although no individual value is similar to the reference. In the right panel, the set of values is both accurate and precise.
Figure 3. Mean absolute relative deviation is created by taking the absolute value of the deviation from the reference value. Thus a value that is 100 points too high has a deviation of +100 and a value that is 100 points too low is also +100. Each value is calculated as a percent of the reference and then averaged. On the right, if the reference values are 100, 200, 300, and 400mg/dl, the individual errors would be 100%, 50%, 33%, and 25%, respectively, making the MARE 53.3% (the sum, 213, divided by 4, the number of values).
A few years ago, the International Standards Organization (ISO), in conjunction with international regulatory authorities, health care providers, and device manufacturers in many countries, established a standard for evaluating the accuracy of blood glucose meters. Called ISO 15197, the standard calls for a minimum accuracy. Ninety five percent of all measured values should fall within
20% of glucose values above 75 mg/dl
15 mg of glucose values below 75 mg/dl.3
Independent Notified Bodies in Europe generally do the studies, but more clinical studies are now being done using this protocol or slight modifications thereof. The standard also allows manufacturers to report the percent of the values that fall within 15%, 10%, and the American Diabetes Association (ADA)-desirable 5% (expressed in concentration units [mg/dl] for glucose values below 75 mg/dl). Table 1 shows an example of
•
•

905
Factors Affecting Blood Glucose Monitoring: Sources of Errors in Measurement Ginsberg
www.journalofdst.orgJ Diabetes Sci Technol Vol 3, Issue 4, July 2009
this evaluation of accuracy. The ADA has suggested that meter systems should have an inaccuracy of less than 5% (I have assumed this to be for 95% of values, similar to ISO 15197).4 Boyd and Bruns, clinical pathologists, have suggested the need for even greater accuracy. Based on a hypothetical insulin dosing study, they have suggested that SMBG needs to have an inaccuracy of less than 2% to avoid excessive hypo- and hyperglycemia.5 My estimate of the accuracy of the average meter is shown in Table 1. Although most meet the ISO standard at 20% inaccuracy, none approach to the ADA standard nor the Bruns expectation. According to the data currently available to me, at 5% inaccuracy, the most accurate meter today has only 63% acceptable values. The average meter has less than half of the values in this highly accurate range.
Currently, it is very difficult for health care providers (and patients) to assess the relative accuracy of various blood glucose monitoring systems. Health care providers can ask for the values from the blood glucose systems manufacturers. Generally, the manufacturer knows the MARE value and has data on all the values from an ISO 15197 study, as shown in Table 1. A standard label, similar to a nutrition label, would help people make informed decisions about their devices. Figure 4 shows
Table 1.Percent of Values Below Error Levela
Meter/standard <5% <10% <15% <20%
ADA-desired 95% NA NA NA
Boyd and Bruns 99% 100% 100% 100%
Average meter (my estimate)
30% 50% 75% 96%
Best meterb 63% 92% 98% 99%
a The ADA has suggested that systems that measure blood glucose should have an inaccuracy of less than 5%.4 Although they provide no statistical measure, I have taken this to mean that the 95% confidence limit should be an inaccuracy below 5%. Boyd and Bruns did a thought experiment looking at the effect of inaccuracy of blood glucose measurement on insulin dose and subsequent hypo- and hyperglycemia.5 They came to the conclusion that systems had to be very accurate, with 99% confidence limits of an inaccuracy of less than 5%. No system today meets that standard. Based on my extensive experience testing blood glucose systems in clinical trials, my belief is that many just meet the ISO 15197 standard, with a 95% confidence limit of an error less than 20%, and usually will not have an inaccuracy less than 5%. There are a few systems today with high accuracy. The results for the best system I know of is listed in the table.
b This is the best meter of the data that I have seen and that has been made public. It is possible that another meter is more accurate.
Figure 4. Example of a hypothetical label for blood glucose strips that would give meaningful data about the accuracy of the system and allow consumers to compare the value of systems.
such a hypothetical label. By showing the MARE and the percent of values having inaccuracies of less than 20, 15, 10, and 5%, patients could select the meter with the proper accuracy and other features that are best for them.
Sources of Glucose Monitoring InaccuracyThe inaccuracy of glucose monitoring systems comes from four sources: strip factors, physical factors, patient factors, and pharmacological factors.
Strip FactorsAs with any manufactured product, there is a small amount of strip-to-strip variation, which will therefore lead to some inaccuracy in blood glucose readings. In some types of glucose strips, the individual reaction wells (the sample chambers) of strips are small (2–3 mm) and a well-size variation of 50 μm will lead to 3% error. Changes in enzyme coverage may also influence accuracy. Generally, excess enzyme is used in strips, thus small decreases in enzyme amount do not alter glucose values (Figure 5, left). On the other hand, changes in the proportion of the well covered by enzyme directly correlates with the reading (Figure 5, right). Thus, a thinning of the enzyme will not cause an error, but loss of enzyme coverage, with bare spots, will lead to underestimation of the glucose values.

906
Factors Affecting Blood Glucose Monitoring: Sources of Errors in Measurement Ginsberg
www.journalofdst.orgJ Diabetes Sci Technol Vol 3, Issue 4, July 2009
reaction, different brands of glucose strips fail differently. When a failure occurs, some brands underestimate the glucose value, whereas others will overestimate it. In both cases, the error can be large, and usually meters are unable to detect a problem with the bad strip. Although it is beyond the manufacturer’s Food and Drug Administration (FDA) claims to state what may or may not occur if the consumer cannot follow storage instructions, for patient safety, the strip manufacturer
Figure 5. Effect of enzyme/mediator on strip accuracy. The current produced by a strip is dependent on the amount of reaction (amount of enzyme/mediator and amount of glucose) and the interaction with the electrode. As seen on the left, strips normally have excess enzyme and mediator, and moderate loss of these components does not significantly affect the reading. In contrast, the area of interaction with the electrode is limited, and loss of coverage of the electrode by even a small amount lowers the reading.
Reduction of the mediator can cause problems with the accuracy of electrochemical blood glucose strips. Figure 6 shows how glucose oxidase normally works (upper) and how an electrochemical glucose oxidase strip works (lower). Normally, glucose interacts with the enzyme glucose oxidase, moving electrons from the glucose to the enzyme and forming gluconic acid. The glucose oxidase then interacts with water and oxygen, pushing electrons to the oxygen and forming hydrogen peroxide.
On a strip, the first step is identical, but in the second step, the glucose oxidase pushes electrons to the oxidized mediator, reducing it, rather than oxygen plus water, forming hydrogen peroxide. The electrode oxidizes the mediator, generating the glucose signal. The oxidized mediator, however, is somewhat unstable and can be reduced, particularly at high temperature.6 In some meter systems, the reduced mediator is falsely reported as a higher glucose. Figure 7 shows what might happen with mediator reduction when strips are exposed to 40 °C (104° Fahrenheit) for long periods of time. Glucose samples at approximately 110 mg/dl have been reported as having higher values, even as high as 300 mg/dl after 9 months at this temperature.
Blood glucose strips undergo complex biochemical reactions. Strips have a finite lifetime, usually about 2 years under ideal storage circumstances. Storing strips at high temperature or high humidity or with an open vial (allowing the humidity to get to the strips) can shorten the life of the strips. Because of the complexity of the
Figure 7. Effect of temperature on strip accuracy. Glucose strips are fragile and must be stored for limited time under specific conditions. Shown here is the effect of storing strips at 40 °C (104° Fahrenheit) for an extended time.
Figure 6. Mechanism of action of a glucose strip. Glucose oxidase interacts with glucose, taking an electron and forming gluconic acid. The enzyme then passes the electron to water and oxygen, regenerating the enzyme and forming hydrogen peroxide. On glucose strips, a mediator replaces oxygen, accepting the electron and passing it to an electrode to generate the current that is reported as the glucose concentration.

907
Factors Affecting Blood Glucose Monitoring: Sources of Errors in Measurement Ginsberg
www.journalofdst.orgJ Diabetes Sci Technol Vol 3, Issue 4, July 2009
should publicly identify what will happen with out-of- date strips or strips that have failed due to temperature or humidity.
Physical FactorsThere are a number of physical factors that can influence the accuracy of blood glucose strips. The most common influencers are altitude and temperature. All glucose monitoring systems are studied by the manufacturer for the influence of temperature and altitude on accuracy, but there is some clinical data on what happens to accuracy under extreme conditions.
Glucose oxidase biosensor strips are often sensitive to oxygen concentration. The mediator and oxygen can both compete to take electrons from the reduced form of the glucose oxidase enzyme. Since the electrode will only pick up mediator, if the oxygen content of the sample is high, the active mediator will be lower and the value underestimated. Similarly, if the oxygen is low, the meter may report a value higher than the true value. Consequently, glucose oxidase biosensor strips are generally calibrated with capillary blood and are most accurate when used with capillary blood. Strips that use glucose dehydrogenase as the enzyme are less affected by oxygen, but this enzyme presents other limitations.
Figure 8 shows the effect of altitude when mountain climbers checked their blood glucose at 13,500 ft.7 As expected, the electrochemical glucose oxidase meters (One Touch® Ultra® and Precision® X-tra®) overestimate the glucose by 6% to 15%, whereas the glucose dehydrogenase meters (Ascensia® Contour, AccuChek®
Complete®, and Abbott® Freestyle®) were all within 5%.
The influence of temperature is less predictable. Most meters have a temperature sensor and will report errors at extreme temperatures. The same mountain climbers also tested the influence of temperature, measuring glucose at 8 °C (Figure 9). The results were brand specific, not technology dependent. The errors were 5–7% but could be either positive or negative.
Altered temperatures can also influence blood glucose readings in other ways. Low temperature diminishes circulation to the skin. This does not dramatically influence glucose taken from a fingertip since the arteriovenous shunts of the fingers stay open, but the blood flow to the skin of the forearm is dramatically decreased. Alternative site testing, which normally has a lag of 15–30 min, can have a lag of up to an hour when the arm is cooled.8
Figure 9. The same group of mountain climbers measured the effect of the ambient temperature of 8 °C on accuracy, reported here.
Patient FactorsThe ability of a patient to use their meter properly can have great influence on the accuracy of a blood glucose meter. Most blood glucose meters need to be coded, although some of the new meters avoid coding. Coding determines the relationship between the electrical signal produced by the strip and the reported blood glucose. Although most manufacturers do not disclose the error caused by miscoding, my estimate is that the error for at least some meters is approximately 1–3% per miscode level. The effect of miscoding may not be uniform across all blood glucose levels.
Figure 8. A group of mountain climbers tested blood glucose systems atop a 3000 m mountain to measure the effect of altitude and temperature (Figure 9). The glucose-oxidase-based meters overestimated the glucose by 6–15%. The glucose-dehydrogenase-based meters were more accurate at high altitude.
908
Factors Affecting Blood Glucose Monitoring: Sources of Errors in Measurement Ginsberg
www.journalofdst.orgJ Diabetes Sci Technol Vol 3, Issue 4, July 2009
Patient technique can play a significant role in the accuracy of blood glucose monitoring systems, but modern meters make it far easier for patients to get accurate results. In a study from 1989 to 1999, Böhme and colleagues concluded that blood glucose meters did not get much more accurate over the decade.13 In their study of over 20,000 glucose values, diabetes nurses determined the accuracy of the meter on each patient visit. Over that period of time, the inaccuracy of the preprandial values fell from 11.8% to 9.9% (p < .05), but the inaccuracy of the postprandial values only changed from 10.3 to 10.2, and the overall inaccuracy was hardly changed (Figure 13).
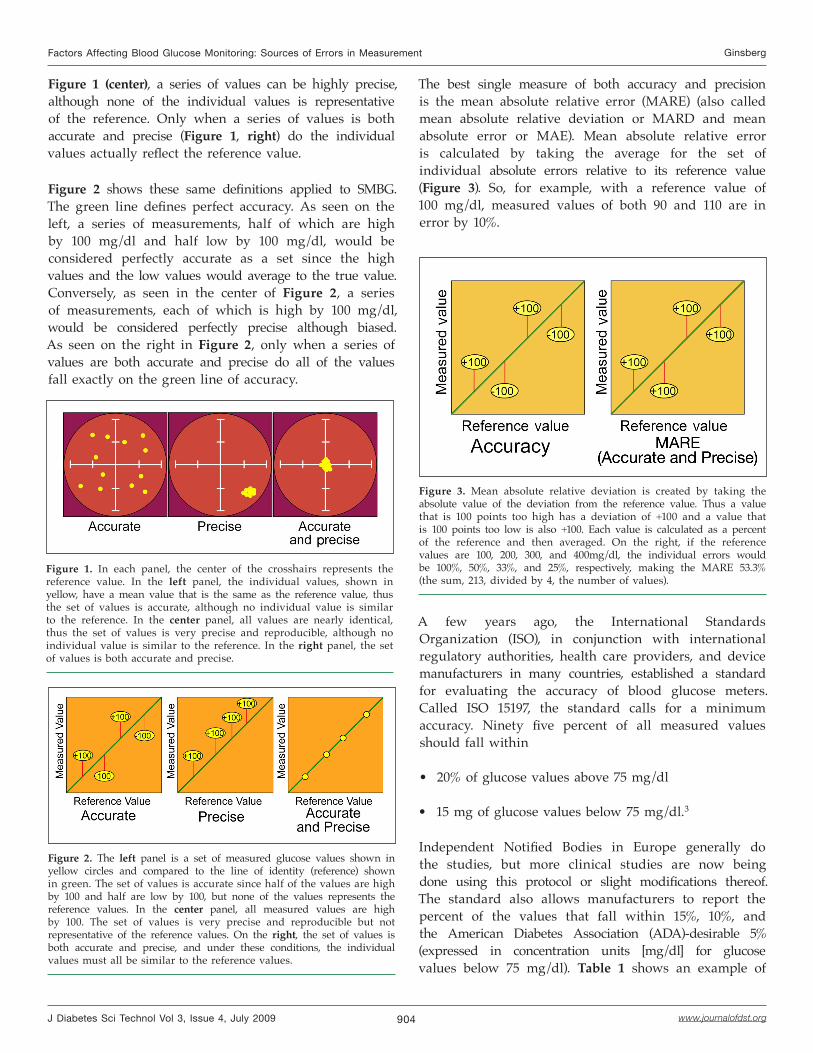
Studies of miscoding suggest that approximately 16% of patients in a typical endocrinology practice have miscoded their meters. This can lead to errors of average errors -37% to +29% (95% confidence limits of ~-92% to +73%).9 Meters that do not require coding avoid this error and so are often more accurate in use by patients (Figure 10).
Figure 10. Raine and coworkers intentionally miscoded meters and allowed patients to measure glucose with them.9 Substantial errors occurred.
Variation in hematocrit can cause serious errors in blood glucose when measured by SMBG. Blood is composed of plasma and cells, and the percentage of red cells is the hematocrit. The red cells, however, are unusual among cells of the body in that they contain significant amounts of intracellular glucose.10 As seen in Figure 11, at a plasma glucose value of 100 mg/dl, the glucose in the red cells is approximately 70 mg/dl. The whole blood glucose at a hematocrit of 44 is approximately 88 mg/dl, but the value at a hematocrit of 66 would be 80 mg/dl and at a hematocrit of 22 would be 94 mg/dl. This variation is due solely to the altered contribution of the red cells to the whole blood value.11
Most SMBG systems measure neither whole blood glucose nor plasma glucose, but rather a complex mixture, which is then calibrated against plasma glucose. Many meters use intricate systems to evaluate hematocrit and correct for it, but the effect of hematocrit is complex. Not only do the cells contain glucose at a different concentration than plasma, but the cells can block the electrode or the enzyme or alter the reading by a variety of other mechanisms. Indeed, in one study (Figure 12), one meter, shown in red, had errors as large as 40% at very low hematocrit.12
Figure 11. Glucose in erythrocytes is in equilibrium with plasma glucose but at lower levels. The total blood glucose, therefore, is dependent on the hematocrit.
Figure 12. Some meters, such as brand 2, in black, compensate well for changes in hematocrit or are not affected. Others, such as brand 1, shown in red, have excessive errors at low and high hematocrit levels.

909
Factors Affecting Blood Glucose Monitoring: Sources of Errors in Measurement Ginsberg
www.journalofdst.orgJ Diabetes Sci Technol Vol 3, Issue 4, July 2009
In contrast, accuracy by the patient has improved significantly. In 1993, the accuracy of systems by patients using their own meters (a wide variety), and by nurses, who had cleaned and calibrated the meters prior to taking a capillary sample from the patient, was evaluated.14 As seen in Figure 14, in 1993, patients (orange bars) using mostly optical systems had a mean error of approximately 13.5%. By 2004, most patients were using biosensors with a capillary fill, and the average inaccuracy was approximately 7.2%. In contrast, there was virtually no difference in the accuracy of the nurses and technicians between 1993 and 2004 (yellow bars). It appears that the systems did not necessarily become more accurate, but rather easier for patients to use appropriately.
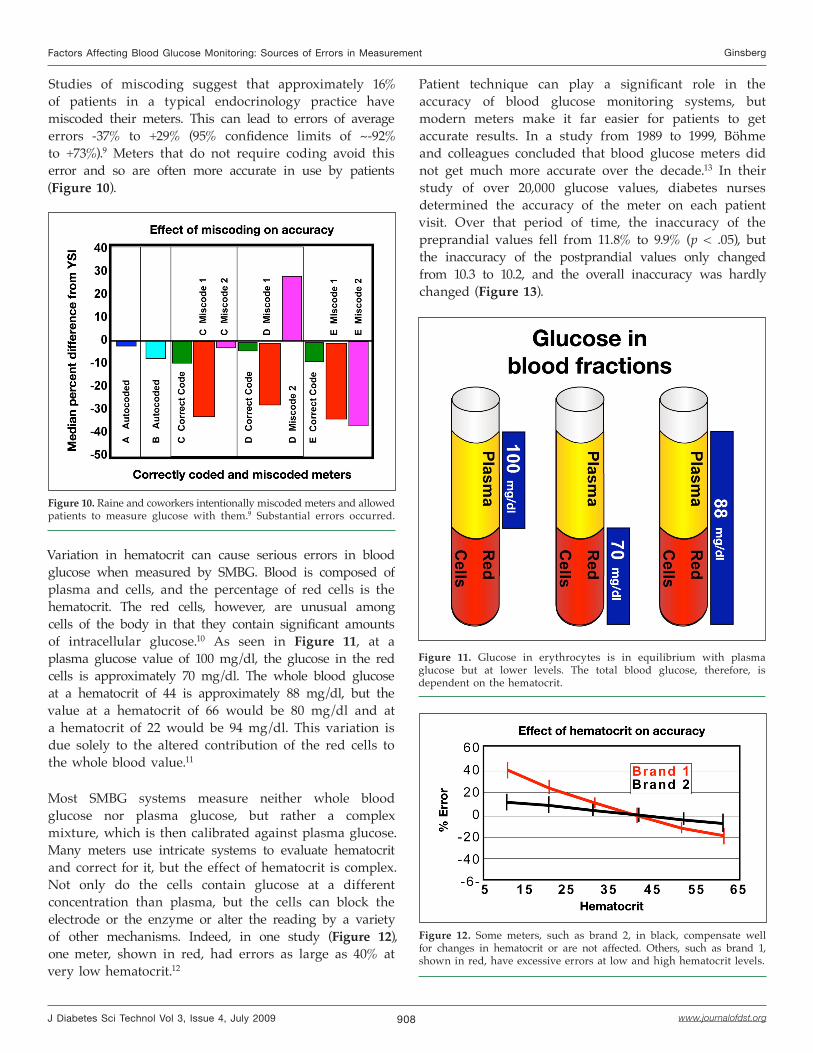
Hand washing has always been a problem, but now, with microsample meters, the smallest amount of contaminant can significantly raise the blood glucose. With a sample of 0.3 μl, 1 μg of glucose (the weight of a dust particle) will increase the blood glucose by 300 mg/dl. For example, one day when I came into work, the laboratory director met me at the door. She was very upset and complaining that our blood glucose meter must be inaccurate. She did not have diabetes, but when she checked herself, the meter reported a value over 300 mg/dl. We went to her office, where there was a banana peel sitting on her desk. She had eaten the banana and then tested herself, without washing her hands. I had her wash her hands and test again. The next 10 values were 80–83 mg/dl. After retouching the banana peel, she tested from the touched area and found a value of about 350 mg/dl. Based on that episode, we performed a laboratory analysis in which we painted pigskin with a 5% and 25% solution of various materials, let them dry overnight, put a drop of blood on the pigskin, and tested it for glucose using a glucose oxidase system.15 As seen in Figure 15, Chips Ahoy cookies (and many other candies and cookies) raised the value significantly. Keri lotion lowered the value slightly, and Ivory soap had no effect. Since patients generally do not wash their hands, this contamination can be a major source of inaccuracy.
Some substances that occur naturally in the body can affect the accuracy of blood glucose monitoring. These substances are often present during certain disease states. Figure 6 shows the reaction that occurs on the SMBG strip. In electrochemical sensors, there are three locations that can be affected by both naturally occurring substances and by medications (next section): (1) the interaction of glucose with the enzyme, (2) the transfer of electrons to the mediator from the enzyme, and (3) interactions at the electrode.
Figure 13. Over the decade of the 1990s, meter accuracy did not improve when tested by highly trained nurses.
Figure 14. As seen in Figure 13, when tested by nurses (orange), meter accuracy did not improve substantially from 1993 to 2004. In contrast, accuracy did improve dramatically when tested by patients (yellow).
Three naturally occurring substances interfere with electrochemical glucose oxidase based strips: triglycerides, oxygen, and uric acid. Triglycerides, usually at very high levels, cause meters to be inaccurate because they take up volume, decreasing the amount of glucose in the capillary volume. Thus they cause values to be low. Oxygen, acting at location 2, competes with mediator to take electrons from the enzyme. Since strips are generally calibrated for capillary oxygen concentrations, high oxygen values, such as those found in arterial
910
Factors Affecting Blood Glucose Monitoring: Sources of Errors in Measurement Ginsberg
www.journalofdst.orgJ Diabetes Sci Technol Vol 3, Issue 4, July 2009
Figure 15. Sugary substances such as cookies (Chips Ahoy) raised glucose readings substantially. Lotions had only a minor effect and soap had almost none.
samples or in patients utilizing oxygen, will cause falsely lower values.16 Low oxygen levels, such as those found in venous samples or in patients with severe chronic obstructive pulmonary disease may cause falsely high values. Finally, uric acid, though only at very high values, can be oxidized by the electrode (location 3), giving falsely high values. Uric acid is seldom a problem, except in patients with values that would lead to severe gout.18
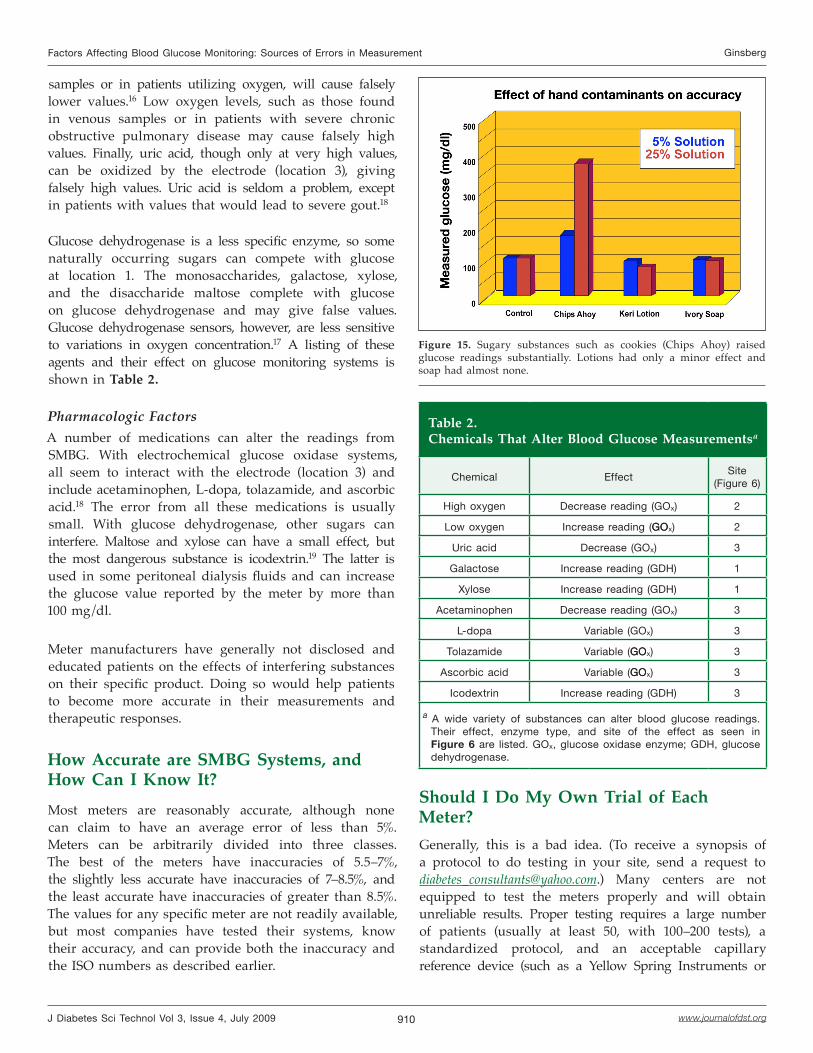
Glucose dehydrogenase is a less specific enzyme, so some naturally occurring sugars can compete with glucose at location 1. The monosaccharides, galactose, xylose, and the disaccharide maltose complete with glucose on glucose dehydrogenase and may give false values. Glucose dehydrogenase sensors, however, are less sensitive to variations in oxygen concentration.17 A listing of these agents and their effect on glucose monitoring systems is shown in Table 2.
Pharmacologic FactorsA number of medications can alter the readings from SMBG. With electrochemical glucose oxidase systems, all seem to interact with the electrode (location 3) and include acetaminophen, L-dopa, tolazamide, and ascorbic acid.18 The error from all these medications is usually small. With glucose dehydrogenase, other sugars can interfere. Maltose and xylose can have a small effect, but the most dangerous substance is icodextrin.19 The latter is used in some peritoneal dialysis fluids and can increase the glucose value reported by the meter by more than 100 mg/dl.
Meter manufacturers have generally not disclosed and educated patients on the effects of interfering substances on their specific product. Doing so would help patients to become more accurate in their measurements and therapeutic responses.
How Accurate are SMBG Systems, and How Can I Know It?Most meters are reasonably accurate, although none can claim to have an average error of less than 5%. Meters can be arbitrarily divided into three classes. The best of the meters have inaccuracies of 5.5–7%, the slightly less accurate have inaccuracies of 7–8.5%, and the least accurate have inaccuracies of greater than 8.5%. The values for any specific meter are not readily available, but most companies have tested their systems, know their accuracy, and can provide both the inaccuracy and the ISO numbers as described earlier.
Table 2.Chemicals That Alter Blood Glucose Measurementsa
Chemical EffectSite
(Figure 6)
High oxygen Decrease reading (GOx) 2
Low oxygen Increase reading (GOGOx) 2
Uric acid Decrease (GOx) 3
Galactose Increase reading (GDH) 1
Xylose Increase reading (GDH) 1
Acetaminophen Decrease reading (GOx) 3
L-dopa Variable (GOx) 3
Tolazamide Variable (GOGOx) 3
Ascorbic acid Variable (GOGOx) 3
Icodextrin Increase reading (GDH) 3
a A wide variety of substances can alter blood glucose readings. Their effect, enzyme type, and site of the effect as seen in Figure 6 are listed. GOx, glucose oxidase enzyme; GDH, glucose dehydrogenase.
Should I Do My Own Trial of Each Meter?Generally, this is a bad idea. (To receive a synopsis of a protocol to do testing in your site, send a request to [email protected].) Many centers are not equipped to test the meters properly and will obtain unreliable results. Proper testing requires a large number of patients (usually at least 50, with 100–200 tests), a standardized protocol, and an acceptable capillary reference device (such as a Yellow Spring Instruments or

911
Factors Affecting Blood Glucose Monitoring: Sources of Errors in Measurement Ginsberg
www.journalofdst.orgJ Diabetes Sci Technol Vol 3, Issue 4, July 2009
Beckman analyzer). Comparing one meter to another is not acceptable. If the new meter was more accurate, how would you know? Suppose the old meter was always 10% high and the new meter always correct. If you compared them, assuming the old meter was your reference, you would assume the new meter was always 10% low.
All companies test their products extensively. The FDA regulates clinical trials done by a medical department of companies. When these trials are done properly, they provide excellent data on which to base decisions regarding accuracy. You need, however, to be sure the trials are unbiased, independent, and representative. Some characteristics of trials done properly are listed in Table 3.
The testing site should be independent of the manufacturer. Ideally, it should be an academic or well-established clinical testing site. European Notified Bodies, such as TÜV in Germany or TNO in the Netherlands, are also excellent sites. The study should have at least 200 data points per testing segment (individual meter or strip type) and, to ensure accuracy in use, should be performed by people with diabetes. The range of values should encompass the entire testing range, and specifically, there should be 10–15% of the values below 70 mg/dl and above 300 mg/dl.
Generally, patients should be fasting, since in the post-prandial state, venous reference values may be 20 mg/dl lower than capillary values. Patients should do the testing themselves using a capillary blood sample. Ideally, the reference value should also be a capillary method, such as a YSI 2300 (Yellow Spring Instruments, Yellow Springs, OH), but if the patients are truly fasting (4 h or more), a venous sample sent to the clinical laboratory and tested or at least centrifuged within 30 min is acceptable. There needs to be a method to ensure data integrity. For example, the patient can sign the data form to indicate that the collected data were correct. To avoid
“cherry picking,” the tested meters and strips should be randomly selected commercial products and the strips should come from at least three lots.
In evaluating clinical trials, you need to be sure that the study was not rigged to ensure that one product will prove superior. All devices should be used according to the approved (or pending) label instructions. Failure to do so invalidates the trial. As an example, one trial compared an electrochemical glucose oxidase meter to a glucose dehydrogenase meter using venous blood.
Electrochemical glucose oxidase meters are generally not approved for use with venous blood and will generally be high due to the low oxygen concentration of venous blood.
Improving AccuracyAs insulin delivery improves, the need for more accurate measurement of glucose becomes more important.4 Table 4 lists the factors previously discussed in the manuscript and possible solutions to the factor.
Differences in physical configuration, such as variation in well size, can be overcome with better quality control, but to routinely (>99% of the time) have an effect on MARE of less than 1%, the average error in the well must be less than 4 μm (approximately 0.00015 in.), a very tight standard. Another method to compensate for this
Table 3. Quality Factors in SMBG Testing
Physical factors
Independent clinical siteNumber of patients Range and distribution of valuesWho did the testingFasting statusTested sampleReference methodMethods of ensuring data integrity
••••••••
Product factors
Commercial productAt least 3 independent lots
••
Table 4.Possible Solutions to Inaccuracy
Source of inaccuracy Solutions
Physical variation in strips QCa, WaveSense Technology
Enzyme failureDestroy outdated strips.store properly, code chip
Enzyme coverage QCa, solubilize enzyme
Mediator reductionDestroy outdated strips. Store properly
Coding No-code meters
Hematocrit WaveSense technology, ACa signal
Hand washing Education
Technique Education
Interfering substance Coatings, education
a QC, quality control; AC, alternating current.

912
Factors Affecting Blood Glucose Monitoring: Sources of Errors in Measurement Ginsberg
www.journalofdst.orgJ Diabetes Sci Technol Vol 3, Issue 4, July 2009
source of inaccuracy is for the meter to measure strip geometry properties, such as the well size, electronically and correct for it, thereby reducing error in the reading.
An example of this method is WaveSense technology, where the meter generates a voltage that varies over time, resulting in a time-dependent signal from the sample. This signal contains “fingerprint” information about strip geometry. The fingerprint from the signal is then correlated with physical variations in the strip. By analyzing these fingerprints, the meter can adjust the glucose reading on a test-by-test basis to correct for this source of inaccuracy.20
Because there is usually a great excess of enzyme, lack of enzyme or enzyme failure is a cause of inaccuracy only in outdated or mistreated strips. Lack of coverage of the entire well will cause inaccuracy. Enzymes that dissolve in the blood in a second or two solve this problem, but for some strips, patients should look at their strip before using to be sure there are no “bubbles” in the well. Meters that use a code chip and automatically detect the expiration date, such as AccuChek Aviva®, are also helpful to patients by alerting them to expired strips.
Mediator reduction is a common problem in outdated or improperly stored strips.6 Since reduction of the mediator is part of the mechanism of detection of glucose, reduced mediator may be improperly determined to be glucose, and the system may significantly overestimate the glucose level. Strips should be used in a timely fashion and stored properly. Manufacturers should indicate the effect of improper storage or use after dating on glucose levels.
Although coding of the meter is needed infrequently, it is often not done properly by patients.9 Several manufacturers have meters that do not require coding by the patients and are therefore often more accurate in clinical practice, such as the Ascenia Contour, the first broadly available no-code meter. Monitoring-system selection should always be made on the basis of all of the factors that will affect frequency of testing and accuracy by the individual patient, but for many patients, elimination of coding is a major consideration.
Most people with diabetes will have normal hematocrit, but certain groups such as patients who live at different altitudes, smokers, patients with renal failure, and others may have significant hematocrit alterations. In addition, the normal hematocrit between men and women can
even differ by 8–10%. For these types of patients, meters that use glucose dehydrogenase pyrroloquinolinequinone or that have specific hematocrit correction technology, such as WaveSense and some of the Roche meters, are appropriate.
The lack of appropriate hand washing by patients can only be treated with education. Many believe that it is a minor problem, but with the new, smaller-volume meters, clinically significant errors occur. One possible solution might be the development of special wipes that do not interfere with the reading. A thin oil coating could remain at the site and make it easier to get a bead of blood.
Errors due to patient technique have become much less frequent but still occur. There are systems in development that will lance the site and deliver the blood to a strip in a single step. These devices are likely to decrease the already low rate of technical problems.
Errors due to interfering substances, both intrinsic and therapy related, continue to plague some patients. These can be resolved by an extensive education program, particularly to health care providers, describing the interfering substances, the rationale for the interference, and the probability for results of the interference.
Clearly, clinical use of blood glucose monitoring has improved over the years and is likely to improve in the future. Average inaccuracies of only 5–6% are common in the best meters now and are likely to fall significantly with newer technologies. Understanding the cause of many of the common errors can lead to more accurate monitoring now.
Funding:
Educational honoraria was provided by Bayer DiabetesCare and Agamatrix, makers of WaveSense products, to support the development of the review and writing.
Disclosure:
The author is a consultant for Bayer DiabetesCare, Agamatrix, and the Juvenile Diabetes Research Foundation.

913
Factors Affecting Blood Glucose Monitoring: Sources of Errors in Measurement Ginsberg
www.journalofdst.orgJ Diabetes Sci Technol Vol 3, Issue 4, July 2009
References:
Bergenstal RM, Gavin JR III, Global Consensus Conference on Glucose Monitoring Panel. The role of self-monitoring of blood glucose in the care of people with diabetes: report of a global consensus conference. Am J Med. 2005;118(Suppl 9A):1S–6S.
Hirsch, IB, Bode BW, Childs BP, Close KL, Fisher WA, Gavin JR, Ginsberg BH, Raine CH, Verderese CA. Self-monitoring of blood glucose (SMBG) in insulin- and non-insulin-using adults with diabetes: consensus recommendations for improving SMBG accuracy, utilization, and research. Diabetes Technol Ther. 2008;10(6):419–39.
International Organization for Standardization. In vitro diagnostic test systems. Requirements for blood-glucose monitoring system for self-testing in managing diabetes mellitus. Reference number ISO 15197:2003 (E). Geneva: International Organization for Standardization; 2003.
American Diabetes Association. Standards of medical care in diabetes—2008. Diabetes Care. 2008;31 Suppl 1:S12–54.
Boyd JC, Bruns DE. Quality specifications for glucose meters: assessment by simulation modeling of errors in insulin dose. Clin Chem. 2001;47(2):209–14.
Bamberg R, Schulman K, MacKenzie M, Moore J, Olchesky S. Effect of adverse storage conditions on performance of glucometer test strips. Clin Lab Sci. 2005;18(4):203–9.
Öberg D, Östensen CG. Performance of glucose dehydrogenase and glucose oxidase based blood glucose meters at high altitude and low temperature. Diabetes Care. 2005;28(5):1261.
Haupt A, Berg B, Paschen P, Dreyer M, Häring HU, Smedegaard J, Matthaei S. The effects of skin temperature and testing site on blood glucose measurements taken by a modern blood glucose monitoring device. Diabetes Technol Ther. 2005;7(4):597–601.
Raine CH III, Schrock LE, Edelman SV, Mudaliar SRD, Zhong W, Proud LJ, Parkes JL. Significant insulin dose errors may occur if blood glucose results are obtained from miscoded meters. J Diabetes Sci Technol. 2007;1(2):205–10.
Somogyi M. The distribution of sugar in blood. J Biol Chem. 1928;117–27.
Barreau PB, Buttery JE. Effect of hematocrit concentration on blood glucose value determined on Glucometer II. Diabetes Care. 1988;11(2):116–8.
Wiener K. The effect of haematocrit on reagent strip tests for glucose. Diabet Med. 1991;8(2):172–5.
Böhme P, Floriot M, Sirveaux MA, Durain D, Ziegler O, Drouin P, Guerci B. Evolution of analytical performance in portable glucose meters in the last decade. Diabetes Care. 2003;26(4):1170–5.
Parkes JL, McGonigle J, Ginsberg BH. Accuracy of blood glucose meters by patients, technicians and nurses. 2004. Data on file at Becton Dickinson and Co.
Ginsberg BH, Nix K. Common food and lotion interferingCommon food and lotion interfering substances. 2006. Data on file at Becton Dickinson and Co.
Ervin KR, Kiser EJ. Issues and implications in the selection of blood glucose monitoring technologies. Diabetes Technol Ther. 1999;1(1):3–11.
Kost GJ, Vu HT, Lee JH, Bourgeois P, Kiechle FL, Martin C, Miller SS, Okorodudu AO, Podczasy JJ, Webster R, Whitlow KJ. Multicenter study of oxygen-insensitive handheld glucose point- of-care testing in critical care/hospital/ambulatory patients in the United States and Canada. Crit Care Med. 1998;26(3):581–90.
Bishop ML, Fody EP, Schoeff LE. Clinical chemistry: principles, procedures, correlations. 5th ed. Baltimore: Lippincott Williams & Wilkins; 2005. p. 275.
1.
2.
3.
4.
5.
6.
7.
8.
9.
10.
11.
12.
13.
14.
15.
16.
17.
18.
Schleis TG. Interference of maltose, icodextrin, galactose, or xylose with some blood glucose monitoring systems. Pharmacotherapy. 2007;27(9):1313–21.
AgaMatrix, Inc. Performance of the WaveSense KeyNote blood glucose monitoring system across 23 lots of strips. http://www.wavesense.info/uploads/pdf/23lotstudyKeyNote.pdf.
19.
20.