Embed Size (px)
Citation preview

Factors affecting agricultural land prices B. Delworth Gardner
Carole Frank Nuckton
The 1970’s brought such rapid increases in land prices that one is compelled to look for forces that have had special impact.
n the twenty years that preceded 1920 I there was a 245 percent increase in the average per-acre price of farmland (includ- ing improvements) before land values fell sharply. Today’s escalation in land values-364 percent between 1957 and 1977-prompts some pointed questions: Have land prices reached their peak? If not, when will they plateau, if ever? Will they then decline and, if so, will the descent be sudden or gradual? Answers are not ob- vious, but some parts of the puzzle are identifiable.
Comparing the most precipitous seg- ments of the two climbs makes the perti- nence of these questions even more appar- ent, for values increased nearly 21 percent in just one year between 1919 and 1920, and over 25 percent between 1973 and 1974. Since 1974, average farm real estate values so far have continued t o increase, al- beit at a slightly slower annual rate.
The similarity in the twenty-year ascents of the two curves, 1900-20 and 1957-77, can be seen in figs. 1 and 2. Both have a sig- nificant amount of inflation as part of the value increases-especially in the steepest segments. Correcting for inflation (divid- ing nominal values by the GNP implicit price deflator) tempers the recent profile (fig. 2) considerably; still, the 1970’s show a 49 percent increase in real values of farm real estate.
Clearly the 1970’s are not the 1920’s. The federal government is much more power-
ful, richer, and more thoroughly involved in the economy. Private financial institu- tions are much stronger and better protect- ed by federal insurance. A descent from to- day’s summit would probably be quite dif- ferent from that of the 1920’s, but disturb- ing, even so.
The rise in land prices began during World War I1 and continued steadily through the 1950’s and 1960’s, apparently based on a foundation of income derived from the land, increasing productivity of the farm operation, government develop- mental and income-support policies, and population pressures. The 1970’s brought such rapid increases in land prices that one is compelled t o look for forces other than these basic four which might have had spe- cial impact in the 1970’s.
Net farm income Capitalization theory suggests that the
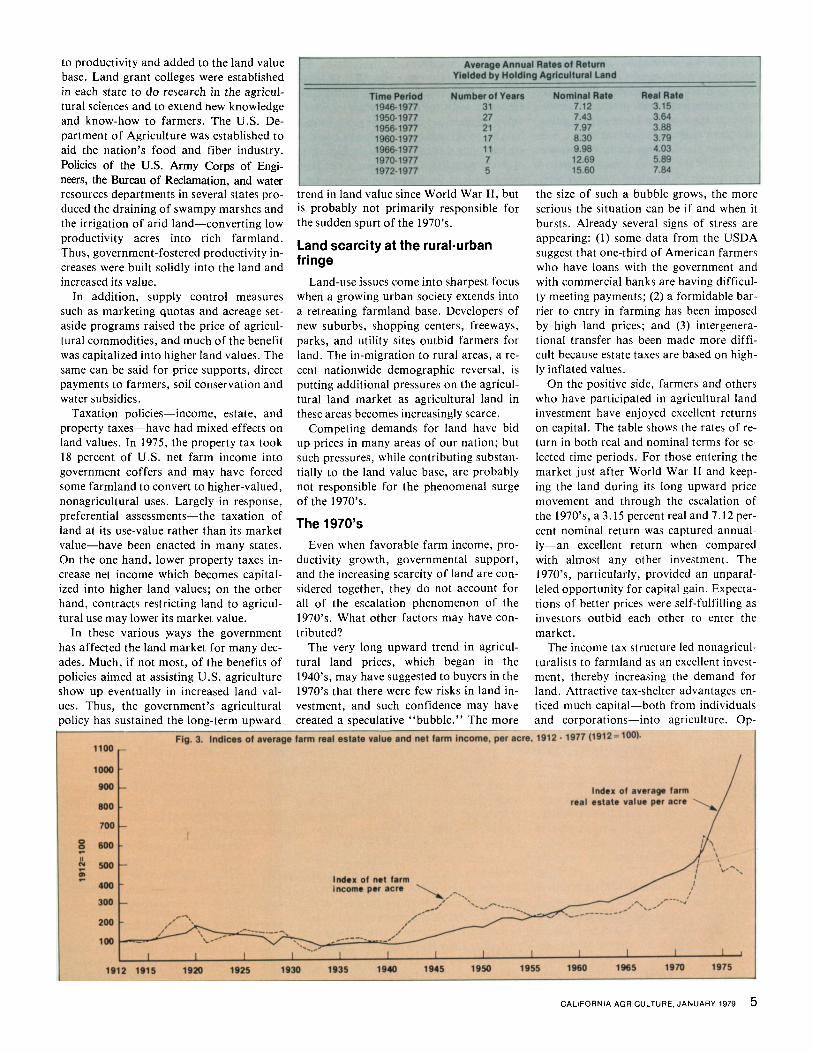
value of a capital asset is determined by its earnings potential. In economic jargon, the price of a n asset is determined by the dis- counted present value of the future stream of net income generated by the investment. For farmland this means that market price movements theoretically should be tied closely t o changes in expected net farm in- come. Figure 3 reveals that before -World War I1 this was the case, for the correlation between the two was quite close. The war years disrupted the pattern as income rose much faster than land values. By the mid-
1950’s, however, land values caught up with and passed income changes, rising consistently more rapidly through the 1960’s. Although factors other than in- come obviously were behind these land val- ue increases, income change was still ex- tremely important, as evidenced by the rap- id translation into land value of the ex- traordinary income year, 1973. The abrupt separation of the two components after 1973 may cause concern because the value of land is being inflated far beyond its in- come-generating capacity.
Productivity Although the cropland base area has re-
mained relatively constant since World War 11, it has become much more produc- tive. The primary source of this productivi- ty increase is technological advance: substi- tuting more productive for less productive inputs, using more capital inputs-me- chanical power and machinery-and less labor, and utilizing agricultural chemicals, higher yielding crop varieties, and more ef- ficient animal types. The productivity in- dex (1967 = 100) stood at 71 in 1946,80 in 1956, 97 in 1966, and 116 in 1976. Such gains have gradually, but continuously, added value to U.S. farmland and support the general upward trend.
The government’s role There is little doubt that actions of feder-
al and state governments have contributed
4 CALIFORNIA AGRICULTURE, JANUARY 1979
to productivity and added t o the land value base. Land grant colleges were established in each state to do research in the agricul- tural sciences and to extend new knowledge and know-how t o farmers. The U.S. De- partment of Agriculture was established to aid the nation’s food and fiber industry. Policies of the U.S. Army Corps of Engi- neers, the Bureau of Reclamation, and water resources departments in several states pro- duced the draining of swampy marshes and the irrigation of arid land-converting low productivity acres into rich farmland. Thus, government-fostered productivity in- creases were built solidly into the land and increased its value.
In addition, supply control measures such as marketing quotas and acreage set- aside programs raised the price of agricul- tural commodities, and much of the benefit was capitalized into higher land values. The same can be said for price supports, direct payments to farmers, soil conservation and water subsidies.
Taxation policies-income, estate, and property taxes-have had mixed effects on land values. In 1975, the property tax took 18 percent of U.S. net farm income into government coffers and may have forced some farmland to convert to higher-valued, nonagricultural uses. Largely in response, preferential assessments-the taxation of land at its use-value rather than its market value-have been enacted in many states. On the one hand, lower property taxes in- crease net income which becomes capital- ized into higher land values; on the other hand, contracts restricting land to agricul- tural use may lower its market value.
In these various ways the government has affected the land market for many dec- ades. Much, if not most, of the benefits of policies aimed at assisting U.S. agriculture show up eventually in increased land val- ues. Thus, the government’s agricultural policy has sustained the long-term upward
trend in land value since World War 11, but is probably not primarily responsible for the sudden spurt of the 1970’s.
Land scarcity at the rural-urban fringe
Land-use issues come into sharpest focus when a growing urban society extends into a retreating farmland base. Developers of new suburbs, shopping centers, freeways, parks, and utility sites outbid farmers for land. The in-migration to rural areas, a re- cent nationwide demographic reversal, is putting additional pressures on the agricul- tural land market as agricultural land in these areas becomes increasingly scarce.
Competing demands for land have bid up prices in many areas of our nation; but such pressures, while contributing substan- tially to the land value base, are probably not responsible for the phenomenal surge of the 1970’s.
The 1970’s Even when favorable farm income, pro-
ductivity growth, governmental support, and the increasing scarcity of land are con- sidered together, they d o not account for all of the escalation phenomenon of the 1970’s. What other factors may have con- tributed?
The very long upward trend in agricul- tural land prices, which began in the 1940’s, may have suggested to buyers in the 1970’s that there were few risks in land in- vestment, and such confidence may have created a speculative “bubble.” The more
the size of such a bubble grows, the more serious the situation can be if and when it bursts. Already several signs of stress are appearing: (1) some data from the USDA suggest that one-third of American farmers who have loans with the government and with commercial banks are having difficul- ty meeting payments; (2) a formidable bar- rier to entry in farming has been imposed by high land prices; and (3) intergenera- tional transfer has been made more diffi- cult because estate taxes are based on high- ly inflated values.
On the positive side, farmers and others who have participated in agricultural land investment have enjoyed excellent returns on capital. The table shows the rates of re- turn in both real and nominal terms for se- lected time periods. For those entering the market just after World War I1 and keep- ing the land during its long upward price movement and through the escalation of the 1970’s, a 3.15 percent real and 7.12 per- cent nominal return was captured annual- ly-an excellent return when compared with almost any other investment. The 1970’s, particularly, provided an unparal- leled opportunity for capital gain. Expecta- tions of better prices were self-fulfilling as investors outbid each other to enter the market.
The income tax structure led nonagricul- turalists to farmland as an excellent invest- ment, thereby increasing the demand for land. Attractive tax-shelter advantages en- ticed much capital-both from individuals and corporations-into agriculture. Op-
Fig. 3. Indices of average farm real estate value and net farm income, per acre, 1912.1977 (1912=100). 1100 - lo00 -
Index of average farm real estate value per acre
900 - 800 - 700 -
: m- E Index of net farm
Income per acre 400- 300 -
1912 1915 1920 1925 1930 1935 1940 1945 1950 1955 1960 1965 1970 1975
CALIFORNIA AGRICULTURE, JANUARY 1979 5
portunities for investment diversification were provided to persons and companies whose incomes were not primarily derived from farming, and gains realized upon re- sale were taxed at the lower capital gains rather than ordinary income tax rate.
Inflation itself seems to have been the most significant magnet attracting invest- ors to America’s farmland. Investors who entered the market seeking a good inflation hedge were rewarded handsomely, for the land market has yielded returns far exceed- ing the inflation rate. Over the period from 1972 to 1977, per-acre values rose 15.6 per- cent per year compared with an average an- nual general price increase of 7.1 percent. As soon as the news of a good inflation hedge is out, it becomes an even better hedge, for prices are bid up in the scramble for shares.
Foreign investors too have been attracted to America’s land boom. There is as yet, however, little solid information on the ex- tent of their contribution to higher land prices.
Thus, land fever, caught in the 1970’s by investors of all types, has helped cause the surge in land prices. It may be that a cooling off, catching up period must follow.
The major demand for farmland, how- ever, is not from nonagricultural investors but from farmers who seek to expand their
operations. According to the USDA, 63 percent of all farm-tract purchases in 1976 were for farm expansion. The pressure to expand in order to take advantage of econ- omies of scale has been an ongoing force, internal to agriculture. For example, farm- ers have long sought to spread the high cost of modern equipment over more acres. De- mand for land for expansion purposes has become even more intense in recent years. High commodity prices in 1973 and 1974 gave farmers ready cash to purchase addi- tional parcels as well as the incentive to do so. Escalating land values greatly increased their net worth and borrowing capabilities to obtain still more land.
A final clue to the escalation phenome- non is that the largest gains between 1972 and 1977 were in the Midwest grain states. North Dakota, Minnesota, Iowa, Illinois, Indiana, and Ohio all experienced increases of over 160 percent. The leader was Iowa at 225 percent, followed by Illinois at 204. By February 1978, Iowa’s percentage increase since 1972 was up to 239. Some Iowa corn land now sells for over $3500 an acre. Such high land values must be closely connected with expanded world markets for our ma- jor agricultural exports-feed grains, cere- als, and soybeans.
The world food crisis of 1972 and 1973 and the growth of foreign markets resulted
in extremely favorable commodity prices in 1973 and 1974. The world was open to commodity traffic in many directions, and North America has a comparative advan- tage in agricultural products. The increased demand coincided with a low volume of stocks in storage, producing rapid increases in prices. Farmers’ hopes for the perma- nence of these favorable prices further stimulated their desire to expand, and exag- gerated commodity price expectations be- came capitalized into the value of the land.
Conclusion
The price of American farmland has been propelled sky-high by forces both in- ternal and external to agriculture. Income- generating potential remains a basic land- value determinant, but that income is buf- feted by world-wide happenings-climatic, political, and monetary. The impact of in- flation has been to accelerate land values far beyond inflation itself. Many other fac- tors-farm expansion, urbanization, rural parcelization, foreign investments in U.S. land, conglomerate corporations entering agriculture, vertical integration in the food system, and so on-have all made their contributions, adding fuel to the fire. B. Delworth Gardner is Professor of Agricultural Eco-
nomics, Davis, and Director of the Giannini Founda- lion; Carole Frank Nuckton is Research Associate. agricultural economics, UC, Davis.
Warp reduction in young-growth ponderosa
pine studs Donald G. Arganbright 0 James A. Venturino 0 Michael R. Gorvad
Conventional kiln-drying under restraint with an initial plasticiza- tion treatment reduced fall-do wn from 51.0 percent to 34.4 percent.
ncreasing amounts of lumber are being I cut each year from young, small-diame- ter ponderosa pine trees. Unfortunately, this material tends to warp severely when it is dried. Downgrading as a result of warp for commercial operations has been as high as 60 percent.
Investigations aimed at finding practical methods for reducing warp in softwood construction lumber fall into three general areas: alternate drying schedules, altered sawing patterns, and drying under re- straint.
Except for the first, each of these tech-
6 CALIFORNIA AGRICULTURE, JANUARY 1979
niques has led to significant reductions in warp. Drying under top-load restraint ap- pears more practical than other methods because it is either less expensive or easier to integrate into a production system.
The most promising of these techniques is high-temperature drying under restraint. Unfortunately, it has never been tried on ponderosa pine. High-temperature drying without restraint is frequently said to lead to less warp, but there is little data to con- firm this. There is, on the other hand, con- siderable data for radiata pine showing the effectiveness of top-load restraint.
This study was initiated on the premise that top-load restraint was the simplest, most practical method for reducing warp in ponderosa pine. The study: (1) established which form of warp is most prevalent; and (2) compared the effectiveness of a 200 Ib/ft2 top-load restraint when studs are air dried, kiln dried at conventional temper- atures, or high temperature dried.
Materials and preparation Each test unit was 3 feet wide by 8 feet
long by 38 inches high. This resulted in ap- proximately 150 boards or about 800 board