Embed Size (px)
Citation preview
RSC Advances
PAPER
Ope
n A
cces
s A
rtic
le. P
ublis
hed
on 0
5 Ju
ly 2
018.
Dow
nloa
ded
on 1
2/6/
2021
12:
33:2
6 A
M.
Thi
s ar
ticle
is li
cens
ed u
nder
a C
reat
ive
Com
mon
s A
ttrib
utio
n-N
onC
omm
erci
al 3
.0 U
npor
ted
Lic
ence
.
View Article OnlineView Journal | View Issue
Factorial design
aCenter of Excellence in Catalysis and Catal
Chemical Engineering, Faculty of Engineer
Thailand, 10330bFuels Research Center, Department of Ch
Chulalongkorn University, Bangkok, Thaila
ac.thcCenter of Excellence on Petrochemical an
University, Bangkok, Thailand, 10330dAdvanced Computational Fluid Dynamics R
Bangkok, Thailand, 10330eDepartment of Mechanical Engineering,
University, Bangkok, Thailand, 10330
† Electronic supplementary informa10.1039/c8ra03901a
Cite this: RSC Adv., 2018, 8, 24209
Received 7th May 2018Accepted 15th June 2018
DOI: 10.1039/c8ra03901a
rsc.li/rsc-advances
This journal is © The Royal Society of C
analysis of parameters for thesorption-enhanced steam reforming of ethanol ina circulating fluidized bed riser using CFD†
Kiattikhoon Phuakpunk,a Benjapon Chalermsinsuwan, *bcd
Sompong Putivisutisakde and Suttichai Assabumrungrat ad
The sorption-enhanced steam reforming of ethanol (SESRE) has recently been reported as a novel process for
hydrogen (H2) production. SESRE can operate well on a Ni-based catalyst with dolomite as a sorbent in
packed-bed reactors. In this study, the circulating fluidized bed (CFB) concept was proposed to obtain
higher productivity and continuous operation of SESRE. Particular focus was directed to the design and
selection of suitable operating conditions of the CFB riser. Two-dimensional transient models using the
Euler–Euler approach and the kinetic theory of granular flows were applied to investigate the H2
production performance from a pilot-scale riser. The 2k full factorial design method was utilized to
examine the significances of five specific parameters, namely, the riser diameter, inlet temperature,
catalyst-to-sorbent ratio, solid flux, and inlet gas velocity on two response variables, namely, H2 purity and
H2 flux. From the ANOVA results, either the main effect or the interactions of each parameter were shown
to be significant on both the H2 purity and the H2 flux, particularly the riser diameter and the solid flux. For
optimizing the operation and reaction parameters, the best case was the system with riser diameter of 0.2
m, inlet temperature of 600 �C, catalyst-to-sorbent ratio of 2.54 kg kg�1, solid flux of 200 kg m�2 s�1, and
gas velocity of 3 m s�1, obtaining H2 purity of 91.30% on a dry basis with a significantly high H2 flux of
0.147 kg m�2 s�1. The hydrodynamics showed that SESRE reached breakthrough within the bottom dense
zone. However, incomplete conversion occurred in the core of the riser because of the very dilute bed.
1. Introduction
Nowadays, global fossil-fuel reservoirs are drastically depleting,while the world's energy-consumption tendency is constantlyincreasing. Hydrogen fuel is a promising alternative source andhas drawn widespread attention because it is a clean energysource and can be derived from renewable energy sources. Atthe end use, when hydrogen (H2) is combusted in internalengines or fed into fuel cells, only water is the end productwithout the emission of carbon dioxide (CO2), a major cause of
ytic Reaction Engineering, Department of
ing, Chulalongkorn University, Bangkok,
emical Technology, Faculty of Science,
nd, 10330. E-mail: Benjapon.C@chula.
d Materials Technology, Chulalongkorn
esearch Unit, Chulalongkorn University,
Faculty of Engineering, Chulalongkorn
tion (ESI) available. See DOI:
hemistry 2018
global warming.1 However, hydrogen cannot yet be claimed tobe totally renewable or green because its large-scale sources andproduction currently come from petroleum industries.
Hydrogen is the third most abundant element on Earth.Most natural hydrogen does not exist in the form of H2 gas, butis found in organic compounds. There are many organiccompounds that can be converted into H2 via many processes,e.g., dehydrogenation, gasication, and steam reforming. Steamreforming is the most effective process to produce H2 on a largescale. Conventional industrial-level hydrogen production typi-cally uses methane (CH4), in natural gas or in tail gas from therenery process, as a raw material via the steam methanereforming (SMR) process.
Ethanol (EtOH) is another excellent feedstock for hydrogenproduction via the steam reforming process. Ethanol isa renewable organic compound that can be derived from thefermentation of biomasses. Thus, ethanol can potentiallyreplace methane from petroleum industries for H2 production.The pathways for the steam reforming of ethanol (SRE) aredependent on the types of catalyst (e.g., Ni-, Pt-, Pd-, or Co-basedcatalysts) and their operation conditions.2–8 Through thepathway of ethanol reforming using the Ni-based catalyst, EtOHis rst converted to acetaldehyde (CH3CHO) through an ethanoldehydrogenation (ETD) reaction, as expressed in reaction (1).
RSC Adv., 2018, 8, 24209–24230 | 24209
RSC Advances Paper
Ope
n A
cces
s A
rtic
le. P
ublis
hed
on 0
5 Ju
ly 2
018.
Dow
nloa
ded
on 1
2/6/
2021
12:
33:2
6 A
M.
Thi
s ar
ticle
is li
cens
ed u
nder
a C
reat
ive
Com
mon
s A
ttrib
utio
n-N
onC
omm
erci
al 3
.0 U
npor
ted
Lic
ence
.View Article Online
Then, CH3CHO is converted to CH4 through an acetaldehydedecomposition (ACD) reaction, as expressed in reaction (2).9–13
C2H5OH # CH3CHOþH2 DH�298 ¼ þ68:4 kJ mol�1 (1)
CH3CHO # CH4 þ CO DH�298 ¼ �18:8 kJ mol�1 (2)
In practice, CH3CHO is an unstable intermediate and almosttotally converted to CH4. Thus, ethanol reforming with excesssteam obtains an EtOH conversion of about 100%.8,12–14 In addi-tion, the ETD and ACD reactions can be combined in the ethanoldecomposition (EDC) reaction, in which EtOH is directly con-verted to CH4, CO, and H2, as shown in reaction (3).15,16
C2H5OH / CH4 þ COþH2 DH�298 ¼ þ49:6 kJ mol�1 (3)
Furthermore, steam can react directly with EtOH in anotherpathway to obtain CH4, similar to the EDC reaction. This reac-tion is called ethanol decomposition with steam (EDC/S), asexpressed in reaction (4).17
C2H5OHþH2O / CH4 þ CO2 þ 2H2 DH�298 ¼ þ8:4 kJ mol�1
(4)
Aer ethanol is nearly completely converted to methane,methane could be further reformed with steam, similar to theconventional SMR process, via three reversible reactions: twoinvolving steam methane reforming reactions (eqn (5) and (6))and a water-gas shi (WGS) reaction (eqn (7)).
CH4 þH2O # COþ 3H2 DH�298 ¼ þ206:2 kJ mol�1 (5)
CH4 þ 2H2O # CO2 þ 4H2 DH�298 ¼ þ165:0 kJ mol�1 (6)
COþH2O # CO2 þH2 DH�298 ¼ �41:2 kJ mol�1 (7)
Overall, EtOH is converted to mainly CO2 and H2 (with minoramounts of CO and unreacted CH4) in the pathway involving theNi-based catalyst. Notably, the main reactions of SRE can besummarized as the “overall reaction of SRE,” as shown inreaction (8).
C2H5OH þ 3H2O # 2CO2 þ 6H2 DH�298 ¼ þ173:4 kJ mol�1
(8)
The overall reforming reactions of both ethanol andmethane are strongly endothermic. Hence, the reactor systemmust be operated at high temperature. By considering ther-modynamic equilibrium at 750 �C, 1 atm, and a steam/ethanolmolar ratio (S/E) of 6, the maximum H2 production canapproximately be only 70% H2 on a dry basis at 100% conver-sion of EtOH. The other produced gases consist of 19% CO2, 8%CO, and 3% CH4.18 To further purify H2, the effluent gas mustpass through additional separation units, such as a pressureswing adsorption (PSA) unit or amine scrubbing unit.19,20
24210 | RSC Adv., 2018, 8, 24209–24230
On integrating sorbents in the reformers, the produced CO2
from reforming can be adsorbed, shiing forward the equilib-rium of the reforming reactions, as shown in reactions (5)–(7).The rst advantage of this sorption enhancement is an increasein conversion of CH4 (completely converting both EtOH andCH4) and the production of more H2. Second, capturing CO2
from the effluent gas can afford high purity H2, reaching 99%on a dry basis.14,19,21–23 Thus, the separation units are unneces-sary in SESRE processes. Other advantages are the use of loweroperation temperature and lower energy consumption forexothermic adsorption and shiing of the reforming reactions.The reforming of EtOH with CO2 sorption is called the sorption-enhanced steam reforming of ethanol (SESRE). However,a limitation of SESRE is the discontinuous performance whenthe sorbent is almost full of captured CO2. The sorbent then hasto release CO2 before it can be used in reprocessing in SESRE.
Several types of sorbent have been used and developed forCO2 capture, e.g., natural or pure metal oxides (e.g., CaO),synthesis metal oxides (e.g., CaxAlyOz and CaO nanoparticles),alkali mixed metal oxides (e.g., Li4SiO4), hydrotalcite-likematerials (HTCls), and modied sorbents (e.g., Ni–CaO–Al2O3
multifunctional catalyst/sorbent). The CO2 capacity, rate of CO2
caption, and stability of these sorbents are important propertiesto increase the performance of SESRE.3,9,11,13,19,24–27 The advan-tages of natural CaO sorbents, such as dolomite and limestone,are that they are inexpensive, easy to nd, and have higher CO2
capacity than other sorbents. However, CaO sorbents have lowerthermal cyclic stability than the other sorbents. The reversiblereaction involving CO2 capture by CaO (carbonation) and thereverse reaction (decarbonation) is shown in reaction (9).
CaOþ CO2 # CaCO3 DH�298 ¼ �178 kJ mol�1 (9)
Limestone consists mostly of CaO, while dolomite containsmainly CaO and MgO. MgO reduces the sintering of CaO andendows dolomite higher stability for CO2 capture, althoughdecreasing the amount of CaO reduces the CO2 capacity ofdolomite more than that of limestone.18,28 Thus, dolomite ischosen for the SESRE processes, which require a regenerationstep to remove captured CO2. Even though SESRE requiresenergy for sorbent regeneration, it has higher thermal efficiency(ratio of hydrogen energy to the summation of energy input plusethanol energy) (about 0.45–0.82) than that of SRE (about 0.33–0.61).11,29 Wu et al.10 reported the energy consumption per H2
mole of SESRE of about 169 kJ molH2
�1 and thermal efficiencyequal to 0.57 in a process without energy recovery operated at500 �C and at an S/E of 8.
In SESMR/SESRE experiments, bubbling bed reactors as wellas the xed bed reactors could produce high purity H2.30–35
However, the bubbling bed reactor had lower pressure drop andbetter reaction distribution throughout the bed than the xedbed. However, SESRE operating in the bubbling bed reactor stillneeds to stop the process to perform a regeneration step whenthe SESRE reaches breakthrough by reaching the CO2 capturelimit in the sorbent.
This journal is © The Royal Society of Chemistry 2018
Paper RSC Advances
Ope
n A
cces
s A
rtic
le. P
ublis
hed
on 0
5 Ju
ly 2
018.
Dow
nloa
ded
on 1
2/6/
2021
12:
33:2
6 A
M.
Thi
s ar
ticle
is li
cens
ed u
nder
a C
reat
ive
Com
mon
s A
ttrib
utio
n-N
onC
omm
erci
al 3
.0 U
npor
ted
Lic
ence
.View Article Online
Recently, a circulating uidized bed reactor (CFBR) wasdeveloped and expected to be useful as a reactor for large-scalehydrogen production because of its capability to be used withhigher gas velocity and to simultaneously enable regenerationinside the reactor.36 Furthermore, CFBR could provide higherH2 productivity and lower pressure drop than the bubbling bedreactor.37 A general CFBR system consists of four main parts38 asfollows:
(1) Riser: gas and solids come enter at the riser bottom. Solidparticles are blown upward and removed off with the gas at theriser top.
(2) Cyclone: solid particles are separated from the gas andfall out at the cyclone bottom.
(3) Downer: solid particles from the cyclone fall and moveout at the downer bottom. This unit could act as anotherreactor.
(4) Solid return system: solid particles return to the riserbottom.
Because SESRE is a very fast reaction, an increase in the feed(i.e., operating with a higher velocity of gas) can enable greaterH2 production. The reformer is able to operate in the risersection, whereas the regenerator needs sufficient residencetime to complete decarbornation and remove the undesiredCO2. Thus, the downer section should act as a bubbling bedreactor for sorbent regeneration. The performance of H2
production in this CFBR system depends on the operation inthe riser that performs the SESRE. However, the riser consists ofa dilute zone and dense zone, which might lead to an incom-plete SESRE. The CFBR efficiency for SESRE still has not beenunveiled; thus, the riser design for SESRE will be furtherstudied.39–41
As the CFBR system must be experimented at least on a pilotscale with appropriate design and operation, each trial of theexperiments can waste expensive resources, particularlyexpensive materials such as the Ni-based catalyst. Conse-quently, computational uid dynamics (CFD) have been utilizedfor the initial design of an optimal system before testing in realoperations. The CFD simulations with appropriate models cangive high accuracy and detailed results and can reduce the timeand resources needed for the experiments. The hydrodynamicsmodel combined with the kinetic models of SESRE can besimulated either in a 2D or 3D system. Even though the resultsfrom a 3D model are more accurate than those from a 2Dmodel, the 3D model has much more computational demandand takes more time than the 2D model, particularly for tran-sient simulations. In addition, in many cases, particularly witha cylindrical geometry, such as the riser, the 2D model providesresults with sufficient accuracy.9,10,42–45
The main purpose of this study was to investigate the feasi-bility of SESRE for hydrogen production in a pilot-scale CFBRsystem using computations to reduce the costs from furtherexperiments. In this study, the 2D geometry of the riser wasutilized to design a suitable pilot-scale riser for hydrogenproduction via SESRE by studying the expected design andreaction parameters, including the riser diameter (id), inlettemperature (Tin), catalyst-to-sorbent ratio (Cat/Sb), solid ux(Gs), and gas velocity (U). All the simulations were solved by
This journal is © The Royal Society of Chemistry 2018
a commercial CFD program, ANSYS® Fluent® 15.0.7. The H2
ux and H2 purity of the effluent gas from the simulations wereused as response variables in a 2k full factorial design analysis.The optimum case would then be predicted and chosen toanalyze the hydrodynamics in that system.
2 Methodology2.1 Computational uid dynamics
Computational uid dynamics (CFD) is a modern branch ofhydrodynamics using algorithms and numerical methods, suchas discretization methods, to solve complex uid problems.CFD is an art of considering models of conservation combinedwith correlation equations (constitutive equations) and othermodels, such as chemical kinetic models.
Fluidization is a gas–solid contacting phenomenon. Thereare two main approaches for uid-particle multiphase owmodeling: the Euler–Euler approach and the Euler–Lagrangeapproach.46,47 The Euler–Euler model is also called the granularow model (GFM) in a gas–solid ow. The Eulerian frameworkis considered for all phases and treats solid particles like a uid.The kinetic theory of granular ow (KTGF) that representskinetic energy oscillation must be applied for any solid particlephase.48 This Euler–Euler model with KTGF is suitable andwidely used for uidization systems that have a large amount ofsolid particles.30,31,38,40,42,43,49–55
There are many research studies that used the Euler–Eulerapproach with KTGF for the simulations of uidization eitherwithout a reaction (cold ow)50,56–58 or with a reaction (hotow).30,31,40,42,43,49,51–54,59–61 The cold ow validations were pre-sented in some studies to prove the suitability of the modelsusing the Euler–Euler approach with KTGF and were used asa base case for further hot ow simulations. All of the cold owvalidations showed good agreement with the experiments.56–58
The SMR kinetics developed by Xu and Froment62 and thecarbonation kinetics developed by Sun et al.64 were validated inhot ow uidization with good results.57 Then, these werecontinuously applied in almost all publications from the NTNUresearch group.30,31,40,42,49,51–54,59 In addition, this SMR kineticsapproach was also validated in other studies with very goodresults. Such as showing that the percentage of H2 in effluentgas had a deviation of less than 0.5%, as reported by Johnsenet al.33 and a deviation of about 3.5% for SMR and 1% forSESMR, as reported by Chen et al.61 This might prove that bothkinetic models were suitable for the future studies of uidiza-tion with SESMR using a Ni-based catalyst and dolomite. Severalkinetic models of SRE on a Ni-based catalyst were applied bysome researchers,9–12,15,17 but unfortunately there was no appli-cation with uidization. The only kinetics approach for SREapplied on a typical Ni-based catalyst, such as Ni–Al2O3,15,17 isdescribed next. The concerning conservation equations and theconstitutive equations of the Euler–Euler model with KTGFchosen in this study are summarized in Tables S1 and S2,†respectively.
2.1.1 Kinetics of SRE. Two kinetic models of SRE ona typical Ni-based catalyst (Ni–Al2O3) were chosen in this study.The rst SRE kinetics was the one applied in a study by De-
RSC Adv., 2018, 8, 24209–24230 | 24211
RSC Advances Paper
Ope
n A
cces
s A
rtic
le. P
ublis
hed
on 0
5 Ju
ly 2
018.
Dow
nloa
ded
on 1
2/6/
2021
12:
33:2
6 A
M.
Thi
s ar
ticle
is li
cens
ed u
nder
a C
reat
ive
Com
mon
s A
ttrib
utio
n-N
onC
omm
erci
al 3
.0 U
npor
ted
Lic
ence
.View Article Online
Souza et al.,15 while the other was that modeled from a kineticstudy by Mas et al.17
Model A. De-Souza et al.15 studied simulations of SRE usingthe favorable kinetic models of the SMR reactions (reactions(11)–(13)) together with the kinetic model of the EDC reaction(reaction (10)). Thus, this SRE approach included four reactionsas follows.
EDC: C2H5OH / CH4 + CO + H2 (10)
bSMR: CH4 + H2O # CO + 3H2 (11)
gSMR: CH4 + 2H2O # CO2 + 4H2 (12)
WGS: CO + H2O # CO2 + H2 (13)
The power law kinetic rate of EDC is an irreversible rstorder rate derived by Sun et al.16 as follows.
rEDC ¼ kEDCpEtOH (14)
where the rate constant of EDC is dened as follows.
kEDC ¼ 4:55� 10�5
Texp
��2030T
�;�kmol Pa�1 kgcat
�1 s�1�
(15)
The kinetic models of the SMR reactions widely applied inmany research studies were developed by Xu and Froment.62
These reaction rates are reversible and non-linear as follows:
rbSMR ¼ kbSMR
pH22:5
pCH4
pH2O � pH2
3pCO
KbSMR
!1
DEN2(16)
rgSMR ¼ kgSMR
pH23:5
pCH4
pH2O2 � pH2
4pCO2
KgSMR
!1
DEN2(17)
rWGS ¼ kWGS
pH2
�pCOpH2O � pH2
pCO2
KWGS
�1
DEN2(18)
DEN ¼ 1þ KCOpCO þ KH2pH2
þ KCH4pCH4
þ KH2OpH2O
pH2
(19)
where the rate constants of reaction i are dened as follows:
kbSMR ¼ 9:708� 10�4 exp
��240 100
R
�1
T� 1
648
��;
�kmol Pa0:5 kgcat
�1 s�1�
(20)
kgSMR ¼ 1:156� 10�4 exp
��243 900
R
�1
T� 1
648
��;
�kmol Pa0:5 kgcat
�1 s�1�
(21)
kWGS ¼ 1:2597� 10�6 exp
��67 130
R
�1
T� 1
648
��;
�kmol kgcat
�1 Pa�1 s�1�
(22)
24212 | RSC Adv., 2018, 8, 24209–24230
Also, the adsorption equilibrium constants of species k areexpressed as follows.
KCH4¼ 1:791� 10�6 exp
�38 280
R
�1
T� 1
823
��;�Pa�1
�(23)
KH2O ¼ 0:4152 exp
��88 680
R
�1
T� 1
823
��; ½ ��� � (24)
KCO ¼ 4:091� 10�4 exp
�70 650
R
�1
T� 1
648
��;�Pa�1
�(25)
KH2¼ 2:960� 10�7 exp
�82 900
R
�1
T� 1
648
��;�Pa�1
�(26)
herein, the equilibrium constants of reaction i can be expressedaccording to the equations developed by Xiu et al.63
KbSMR ¼101 3252
expð0:2513Z4 � 0:3665Z3 � 0:58101Z2 þ 27:1337Z � 3:277Þ ;
�Pa2�
(27)
KgSMR ¼ KbSMRKWGS, [Pa2] (28)
KWGS ¼ exp(�0.29353Z3 + 0.63508Z2 + 4.1778Z + 0.31688),
[—] (29)
Z ¼ 1000
T� 1 ; ½ ��� � (30)
Although this SRE kinetics model is a combination ofdifferent experiments, both were investigated on Ni-basedcatalysts and the results in the study of De-Souza et al.15 satis-ed these models.
Model B. This alternative model was developed by Mas et al.17,who studied the kinetics of SRE and derived their own kineticmodel. Their model involved four reactions, as follows.
EDC: C2H5OH / CH4 + CO + H2 (31)
EDC/S: C2H5OH + H2O / CH4 + CO2 + 2H2 (32)
bSMR: CH4 + H2O # CO + 3H2 (33)
gSMR: CH4 + 2H2O # CO2 + 4H2 (34)
The reaction rates of these SRE reactions are expressed asfollows.
rEDC ¼ kEDCKEtOHpEtOH
1
DEN(35)
rEDC=S ¼ kEDC=SKEtOHKH2OpEtOHpH2O
1
DEN2(36)
rbSMR ¼ kbSMRKCH4KH2O
pCH4
pH2O � pH2
3pCO
KbSMR
!1
DEN2(37)
This journal is © The Royal Society of Chemistry 2018
Paper RSC Advances
Ope
n A
cces
s A
rtic
le. P
ublis
hed
on 0
5 Ju
ly 2
018.
Dow
nloa
ded
on 1
2/6/
2021
12:
33:2
6 A
M.
Thi
s ar
ticle
is li
cens
ed u
nder
a C
reat
ive
Com
mon
s A
ttrib
utio
n-N
onC
omm
erci
al 3
.0 U
npor
ted
Lic
ence
.View Article Online
rgSMR ¼ kgSMRKCH4KH2O
KH2OpCH4
pH2O2 � pH2
4pCO2
KgSMR
!1
DEN3
(38)
DEN ¼ 1 + KEtOHpEtOH + KH2OpH2O
+ KCH4pCH4
(39)
The rate constants of reaction i are dened as follows.
kEDC ¼ 4:833� 10�4 exp
��278 740
R
�1
T� 1
873
��;
�kmol kgcat
�1 s�1�
(40)
kEDC=S ¼ 5:167� 10�3 exp
��235 060
R
�1
T� 1
873
��;
�kmol kgcat
�1 s�1�
(41)
kbSMR ¼ 1:667� 10�3 exp
��123 500
R
�1
T� 1
873
��;
�kmol kgcat
�1 s�1�
(42)
kgSMR ¼ 4:000� 10�3 exp
��213 900
R
�1
T� 1
873
��;
�kmol kgcat
�1 s�1�
(43)
Also, the adsorption equilibrium constants of species k areexpressed as follows.
KH2O ¼ 3:691� 10�4 exp
�92 400
R
�1
T� 1
873
��;�Pa�1
�(44)
KEtOH ¼ 6:089� 10�4 exp
�199 700
R
�1
T� 1
873
��;�Pa�1
�(45)
KCH4¼ 1:120� 10�2 exp
�124 700
R
�1
T� 1
873
��;�Pa�1
�(46)
Lastly, the equilibrium constants of reactions, KbSMR andKgSMR could be determined according to eqn (27) and (28),respectively.
2.1.2 Kinetics of sorption enhancement (SE). Sorptionenhancement by carbonation or CO2 capture reaction isprovided to SRE reactions by adding a solid sorbent. Herein,dolomite was chosen as the sorbent. The kinetics of carbon-ation on dolomite, as dened by Sun et al.64, was added to themodels as follows:
rcarb ¼ kcarb(pCO2� pCO2,eq
)nS0(1 � XCaO) (47)
where the equilibrium pressure of CO2 (pCO2,eq) has two rangesas follows:
(1) For T > 1173.15 K (Abanades et al.65)
This journal is © The Royal Society of Chemistry 2018
pCO2 ;eq ¼ 1:216� 1012 exp
��19 130
T
�(48)
(2) For T # 1173.15 K (Johnsen et al.32)
pCO2 ;eq ¼ 4:1918� 1012 exp
��20 474
T
�(49)
The rate constant of carbonation (kcarb) and the degree ofpartial pressure (n) depend on the amounts of CO2 as follows.
(1) For (pCO2� pCO2,eq) > 10 000 Pa
kcarb ¼ 1:04� 10�6 exp
��20 400
RT
�;�kmol m�2 s�1
�(50)
n ¼ 0(2) For 0 < (pCO2
� pCO2,eq) # 10 000 Pa
kcarb ¼ 1:04� 10�10 exp
��20 400
RT
�;�kmol m�2 Pa�1 s�1
�(51)
n ¼ 1If (pCO2
� pCO2,eq) # 0 Pa, CO2 is released via decarbonation.
2.2 System and properties
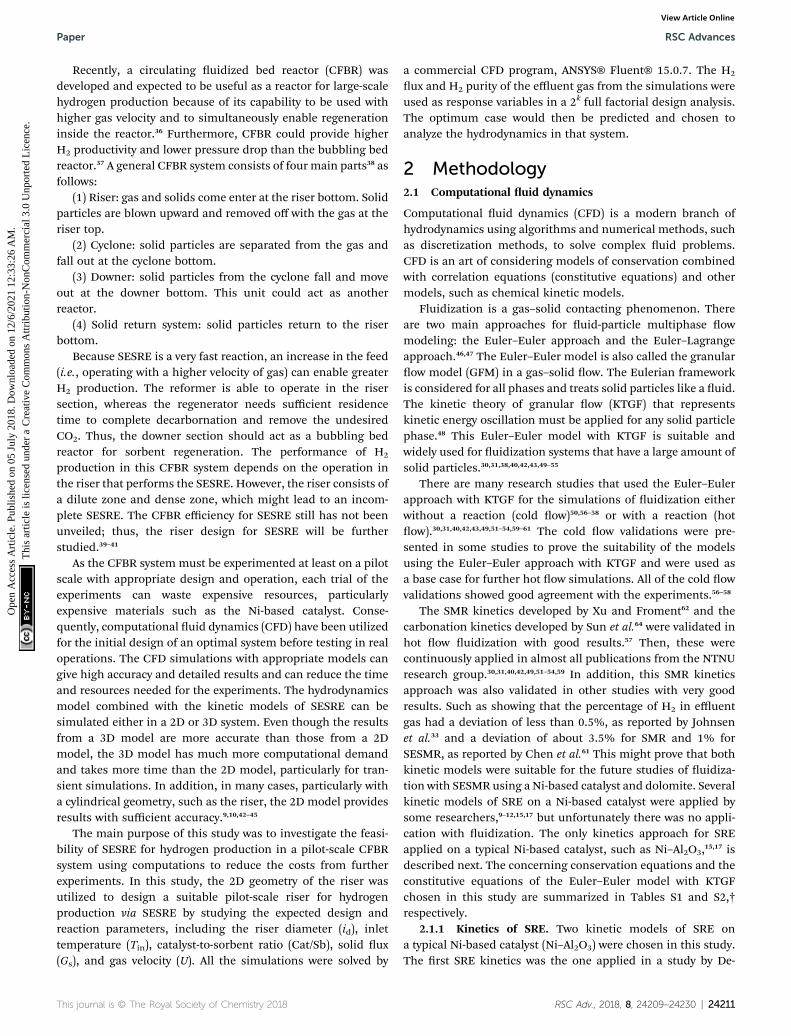
Fig. 1 shows a typical design of the riser according to Kunii andLevenspiel.36 The riser had an inlet of feed gas at the bottomsection, a 0.05 m diameter channel for the inlet solid at theright, and an outlet for the mixture at the top. The channel ofthe inlet solid was 0.075 m above the bottom. The feed gasincluded EtOH and steam, while the inlet solid included twoindividual phases, namely, catalyst phase and sorbent phase.The SRE was performed with the catalyst phase, while thecarbonation was performed with the sorbent phase. For thecatalyst phase, the Ni-based catalyst properties were set andassumed to have uniform size and density. For the sorbentphase, the feed sorbent was fresh dolomite, whose propertieswere set and assumed to be uniform. The fresh dolomite wasassumed to contain 60% CaO and 40% of MgO by weight. Theproperties for each solid phase are presented in Table S3.†
SESRE would benet from operating in this CFBR system ifthe results from the chosen system satised these constraints/goals: (1) no solid accumulation in the riser; (2) the effluentgas should contain high H2 purity (about 94–96%) on a dry basisas a packed-bed reactor and achieve equilibrium,18 while the H2
ux should be as high as possible; and (3) CaO conversion(XCaO) at the solid outlet should be lower than 28%, which is thestable maximum capacity of dolomite aer steady re-cycling.32
2.3 Simulation method and analysis
The 2D geometry of the riser and its different computationaldomains, as shown in Fig. 1, was drawn by ANSYS® Design-Modeler™. The domains were meshed uniformly by ANSYS®Meshing™ with four different cell sizes for mesh renement.Then, the models were calculated in the domains via ANSYS®Fluent®. The kinetic rates of SRE and carbonation were derivedto be compatible in Fluent® by writing in C-language user
RSC Adv., 2018, 8, 24209–24230 | 24213
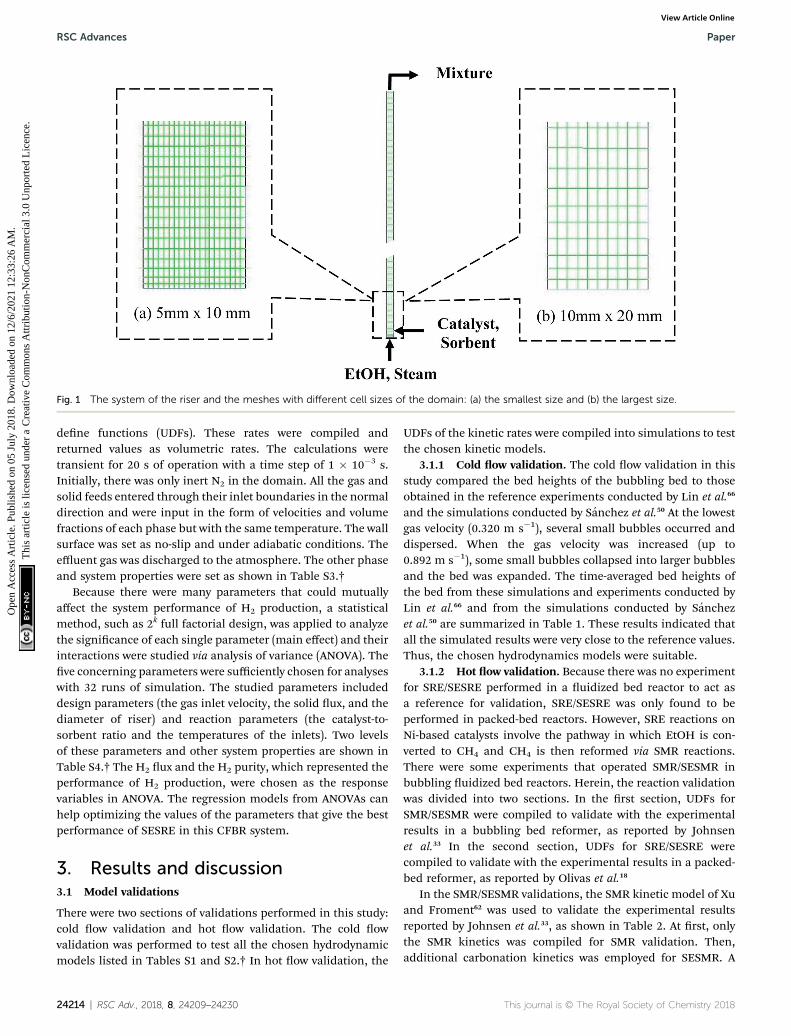
Fig. 1 The system of the riser and the meshes with different cell sizes of the domain: (a) the smallest size and (b) the largest size.
RSC Advances Paper
Ope
n A
cces
s A
rtic
le. P
ublis
hed
on 0
5 Ju
ly 2
018.
Dow
nloa
ded
on 1
2/6/
2021
12:
33:2
6 A
M.
Thi
s ar
ticle
is li
cens
ed u
nder
a C
reat
ive
Com
mon
s A
ttrib
utio
n-N
onC
omm
erci
al 3
.0 U
npor
ted
Lic
ence
.View Article Online
dene functions (UDFs). These rates were compiled andreturned values as volumetric rates. The calculations weretransient for 20 s of operation with a time step of 1 � 10�3 s.Initially, there was only inert N2 in the domain. All the gas andsolid feeds entered through their inlet boundaries in the normaldirection and were input in the form of velocities and volumefractions of each phase but with the same temperature. The wallsurface was set as no-slip and under adiabatic conditions. Theeffluent gas was discharged to the atmosphere. The other phaseand system properties were set as shown in Table S3.†
Because there were many parameters that could mutuallyaffect the system performance of H2 production, a statisticalmethod, such as 2k full factorial design, was applied to analyzethe signicance of each single parameter (main effect) and theirinteractions were studied via analysis of variance (ANOVA). Theve concerning parameters were sufficiently chosen for analyseswith 32 runs of simulation. The studied parameters includeddesign parameters (the gas inlet velocity, the solid ux, and thediameter of riser) and reaction parameters (the catalyst-to-sorbent ratio and the temperatures of the inlets). Two levelsof these parameters and other system properties are shown inTable S4.† The H2 ux and the H2 purity, which represented theperformance of H2 production, were chosen as the responsevariables in ANOVA. The regression models from ANOVAs canhelp optimizing the values of the parameters that give the bestperformance of SESRE in this CFBR system.
3. Results and discussion3.1 Model validations
There were two sections of validations performed in this study:cold ow validation and hot ow validation. The cold owvalidation was performed to test all the chosen hydrodynamicmodels listed in Tables S1 and S2.† In hot ow validation, the
24214 | RSC Adv., 2018, 8, 24209–24230
UDFs of the kinetic rates were compiled into simulations to testthe chosen kinetic models.
3.1.1 Cold ow validation. The cold ow validation in thisstudy compared the bed heights of the bubbling bed to thoseobtained in the reference experiments conducted by Lin et al.66
and the simulations conducted by Sanchez et al.50 At the lowestgas velocity (0.320 m s�1), several small bubbles occurred anddispersed. When the gas velocity was increased (up to0.892 m s�1), some small bubbles collapsed into larger bubblesand the bed was expanded. The time-averaged bed heights ofthe bed from these simulations and experiments conducted byLin et al.66 and from the simulations conducted by Sanchezet al.50 are summarized in Table 1. These results indicated thatall the simulated results were very close to the reference values.Thus, the chosen hydrodynamics models were suitable.
3.1.2 Hot ow validation. Because there was no experimentfor SRE/SESRE performed in a uidized bed reactor to act asa reference for validation, SRE/SESRE was only found to beperformed in packed-bed reactors. However, SRE reactions onNi-based catalysts involve the pathway in which EtOH is con-verted to CH4 and CH4 is then reformed via SMR reactions.There were some experiments that operated SMR/SESMR inbubbling uidized bed reactors. Herein, the reaction validationwas divided into two sections. In the rst section, UDFs forSMR/SESMR were compiled to validate with the experimentalresults in a bubbling bed reformer, as reported by Johnsenet al.33 In the second section, UDFs for SRE/SESRE werecompiled to validate with the experimental results in a packed-bed reformer, as reported by Olivas et al.18
In the SMR/SESMR validations, the SMR kinetic model of Xuand Froment62 was used to validate the experimental resultsreported by Johnsen et al.33, as shown in Table 2. At rst, onlythe SMR kinetics was compiled for SMR validation. Then,additional carbonation kinetics was employed for SESMR. A
This journal is © The Royal Society of Chemistry 2018
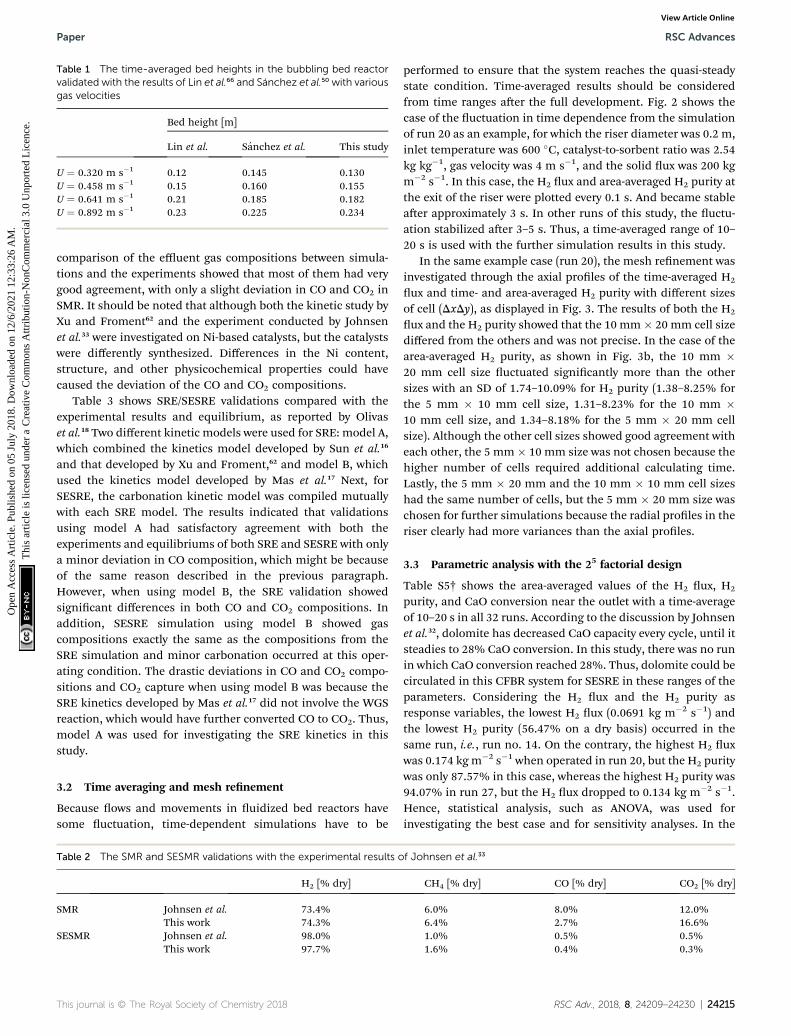
Table 1 The time-averaged bed heights in the bubbling bed reactorvalidated with the results of Lin et al.66 and Sanchez et al.50 with variousgas velocities
Bed height [m]
Lin et al. Sanchez et al. This study
U ¼ 0.320 m s�1 0.12 0.145 0.130U ¼ 0.458 m s�1 0.15 0.160 0.155U ¼ 0.641 m s�1 0.21 0.185 0.182U ¼ 0.892 m s�1 0.23 0.225 0.234
Paper RSC Advances
Ope
n A
cces
s A
rtic
le. P
ublis
hed
on 0
5 Ju
ly 2
018.
Dow
nloa
ded
on 1
2/6/
2021
12:
33:2
6 A
M.
Thi
s ar
ticle
is li
cens
ed u
nder
a C
reat
ive
Com
mon
s A
ttrib
utio
n-N
onC
omm
erci
al 3
.0 U
npor
ted
Lic
ence
.View Article Online
comparison of the effluent gas compositions between simula-tions and the experiments showed that most of them had verygood agreement, with only a slight deviation in CO and CO2 inSMR. It should be noted that although both the kinetic study byXu and Froment62 and the experiment conducted by Johnsenet al.33 were investigated on Ni-based catalysts, but the catalystswere differently synthesized. Differences in the Ni content,structure, and other physicochemical properties could havecaused the deviation of the CO and CO2 compositions.
Table 3 shows SRE/SESRE validations compared with theexperimental results and equilibrium, as reported by Olivaset al.18 Two different kinetic models were used for SRE: model A,which combined the kinetics model developed by Sun et al.16
and that developed by Xu and Froment,62 and model B, whichused the kinetics model developed by Mas et al.17 Next, forSESRE, the carbonation kinetic model was compiled mutuallywith each SRE model. The results indicated that validationsusing model A had satisfactory agreement with both theexperiments and equilibriums of both SRE and SESRE with onlya minor deviation in CO composition, which might be becauseof the same reason described in the previous paragraph.However, when using model B, the SRE validation showedsignicant differences in both CO and CO2 compositions. Inaddition, SESRE simulation using model B showed gascompositions exactly the same as the compositions from theSRE simulation and minor carbonation occurred at this oper-ating condition. The drastic deviations in CO and CO2 compo-sitions and CO2 capture when using model B was because theSRE kinetics developed by Mas et al.17 did not involve the WGSreaction, which would have further converted CO to CO2. Thus,model A was used for investigating the SRE kinetics in thisstudy.
3.2 Time averaging and mesh renement
Because ows and movements in uidized bed reactors havesome uctuation, time-dependent simulations have to be
Table 2 The SMR and SESMR validations with the experimental results o
H2 [% dry]
SMR Johnsen et al. 73.4%This work 74.3%
SESMR Johnsen et al. 98.0%This work 97.7%
This journal is © The Royal Society of Chemistry 2018
performed to ensure that the system reaches the quasi-steadystate condition. Time-averaged results should be consideredfrom time ranges aer the full development. Fig. 2 shows thecase of the uctuation in time dependence from the simulationof run 20 as an example, for which the riser diameter was 0.2 m,inlet temperature was 600 �C, catalyst-to-sorbent ratio was 2.54kg kg�1, gas velocity was 4 m s�1, and the solid ux was 200 kgm�2 s�1. In this case, the H2 ux and area-averaged H2 purity atthe exit of the riser were plotted every 0.1 s. And became stableaer approximately 3 s. In other runs of this study, the uctu-ation stabilized aer 3–5 s. Thus, a time-averaged range of 10–20 s is used with the further simulation results in this study.
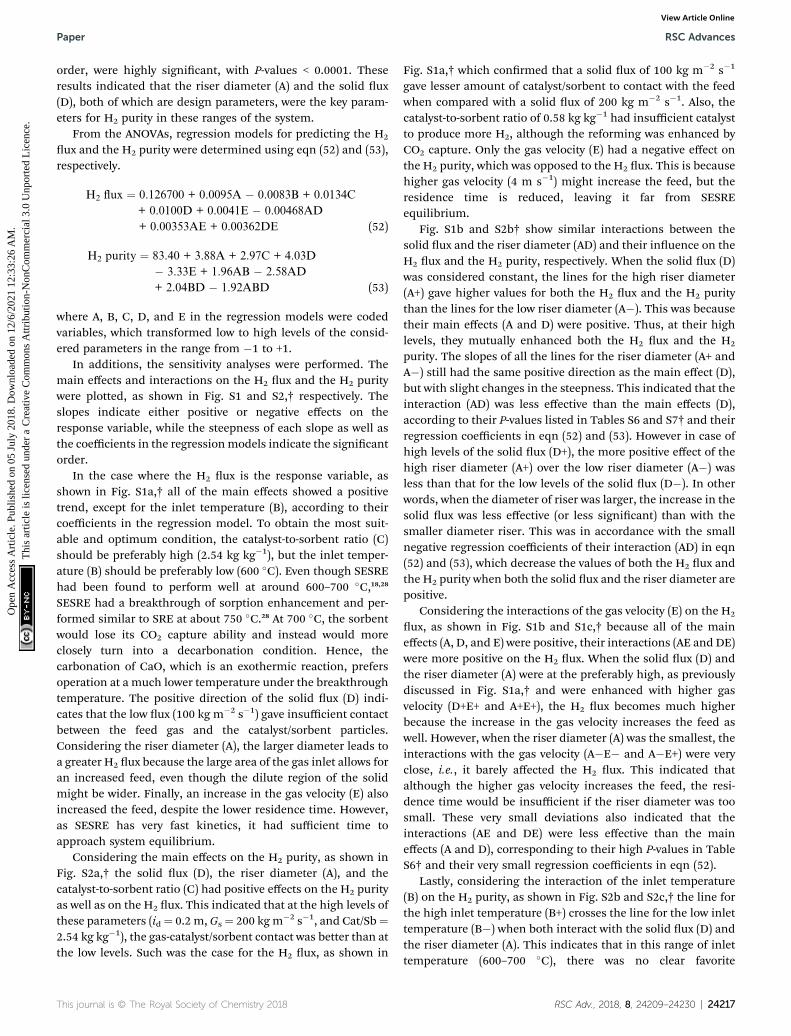
In the same example case (run 20), the mesh renement wasinvestigated through the axial proles of the time-averaged H2
ux and time- and area-averaged H2 purity with different sizesof cell (DxDy), as displayed in Fig. 3. The results of both the H2
ux and the H2 purity showed that the 10 mm� 20 mm cell sizediffered from the others and was not precise. In the case of thearea-averaged H2 purity, as shown in Fig. 3b, the 10 mm �20 mm cell size uctuated signicantly more than the othersizes with an SD of 1.74–10.09% for H2 purity (1.38–8.25% forthe 5 mm � 10 mm cell size, 1.31–8.23% for the 10 mm �10 mm cell size, and 1.34–8.18% for the 5 mm � 20 mm cellsize). Although the other cell sizes showed good agreement witheach other, the 5 mm � 10 mm size was not chosen because thehigher number of cells required additional calculating time.Lastly, the 5 mm � 20 mm and the 10 mm � 10 mm cell sizeshad the same number of cells, but the 5 mm � 20 mm size waschosen for further simulations because the radial proles in theriser clearly had more variances than the axial proles.
3.3 Parametric analysis with the 25 factorial design
Table S5† shows the area-averaged values of the H2 ux, H2
purity, and CaO conversion near the outlet with a time-averageof 10–20 s in all 32 runs. According to the discussion by Johnsenet al.32, dolomite has decreased CaO capacity every cycle, until itsteadies to 28% CaO conversion. In this study, there was no runin which CaO conversion reached 28%. Thus, dolomite could becirculated in this CFBR system for SESRE in these ranges of theparameters. Considering the H2 ux and the H2 purity asresponse variables, the lowest H2 ux (0.0691 kg m�2 s�1) andthe lowest H2 purity (56.47% on a dry basis) occurred in thesame run, i.e., run no. 14. On the contrary, the highest H2 uxwas 0.174 kg m�2 s�1 when operated in run 20, but the H2 puritywas only 87.57% in this case, whereas the highest H2 purity was94.07% in run 27, but the H2 ux dropped to 0.134 kg m�2 s�1.Hence, statistical analysis, such as ANOVA, was used forinvestigating the best case and for sensitivity analyses. In the
f Johnsen et al.33
CH4 [% dry] CO [% dry] CO2 [% dry]
6.0% 8.0% 12.0%6.4% 2.7% 16.6%1.0% 0.5% 0.5%1.6% 0.4% 0.3%
RSC Adv., 2018, 8, 24209–24230 | 24215
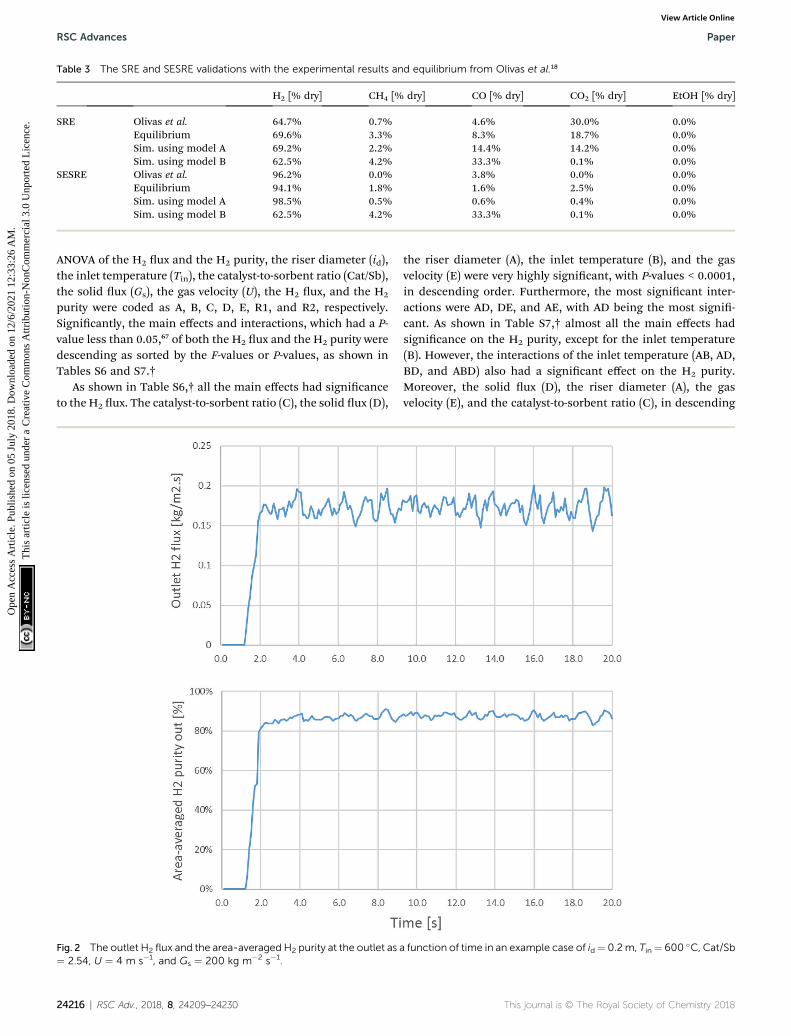
Table 3 The SRE and SESRE validations with the experimental results and equilibrium from Olivas et al.18
H2 [% dry] CH4 [% dry] CO [% dry] CO2 [% dry] EtOH [% dry]
SRE Olivas et al. 64.7% 0.7% 4.6% 30.0% 0.0%Equilibrium 69.6% 3.3% 8.3% 18.7% 0.0%Sim. using model A 69.2% 2.2% 14.4% 14.2% 0.0%Sim. using model B 62.5% 4.2% 33.3% 0.1% 0.0%
SESRE Olivas et al. 96.2% 0.0% 3.8% 0.0% 0.0%Equilibrium 94.1% 1.8% 1.6% 2.5% 0.0%Sim. using model A 98.5% 0.5% 0.6% 0.4% 0.0%Sim. using model B 62.5% 4.2% 33.3% 0.1% 0.0%
RSC Advances Paper
Ope
n A
cces
s A
rtic
le. P
ublis
hed
on 0
5 Ju
ly 2
018.
Dow
nloa
ded
on 1
2/6/
2021
12:
33:2
6 A
M.
Thi
s ar
ticle
is li
cens
ed u
nder
a C
reat
ive
Com
mon
s A
ttrib
utio
n-N
onC
omm
erci
al 3
.0 U
npor
ted
Lic
ence
.View Article Online
ANOVA of the H2 ux and the H2 purity, the riser diameter (id),the inlet temperature (Tin), the catalyst-to-sorbent ratio (Cat/Sb),the solid ux (Gs), the gas velocity (U), the H2 ux, and the H2
purity were coded as A, B, C, D, E, R1, and R2, respectively.Signicantly, the main effects and interactions, which had a P-value less than 0.05,67 of both the H2 ux and the H2 purity weredescending as sorted by the F-values or P-values, as shown inTables S6 and S7.†
As shown in Table S6,† all the main effects had signicanceto the H2 ux. The catalyst-to-sorbent ratio (C), the solid ux (D),
Fig. 2 The outlet H2 flux and the area-averaged H2 purity at the outlet as¼ 2.54, U ¼ 4 m s�1, and Gs ¼ 200 kg m�2 s�1.
24216 | RSC Adv., 2018, 8, 24209–24230
the riser diameter (A), the inlet temperature (B), and the gasvelocity (E) were very highly signicant, with P-values < 0.0001,in descending order. Furthermore, the most signicant inter-actions were AD, DE, and AE, with AD being the most signi-cant. As shown in Table S7,† almost all the main effects hadsignicance on the H2 purity, except for the inlet temperature(B). However, the interactions of the inlet temperature (AB, AD,BD, and ABD) also had a signicant effect on the H2 purity.Moreover, the solid ux (D), the riser diameter (A), the gasvelocity (E), and the catalyst-to-sorbent ratio (C), in descending
a function of time in an example case of id¼ 0.2m, Tin¼ 600 �C, Cat/Sb
This journal is © The Royal Society of Chemistry 2018
Paper RSC Advances
Ope
n A
cces
s A
rtic
le. P
ublis
hed
on 0
5 Ju
ly 2
018.
Dow
nloa
ded
on 1
2/6/
2021
12:
33:2
6 A
M.
Thi
s ar
ticle
is li
cens
ed u
nder
a C
reat
ive
Com
mon
s A
ttrib
utio
n-N
onC
omm
erci
al 3
.0 U
npor
ted
Lic
ence
.View Article Online
order, were highly signicant, with P-values < 0.0001. Theseresults indicated that the riser diameter (A) and the solid ux(D), both of which are design parameters, were the key param-eters for H2 purity in these ranges of the system.
From the ANOVAs, regression models for predicting the H2
ux and the H2 purity were determined using eqn (52) and (53),respectively.
H2 flux ¼ 0.126700 + 0.0095A � 0.0083B + 0.0134C
+ 0.0100D + 0.0041E � 0.00468AD
+ 0.00353AE + 0.00362DE (52)
H2 purity ¼ 83.40 + 3.88A + 2.97C + 4.03D
� 3.33E + 1.96AB � 2.58AD
+ 2.04BD � 1.92ABD (53)
where A, B, C, D, and E in the regression models were codedvariables, which transformed low to high levels of the consid-ered parameters in the range from �1 to +1.
In additions, the sensitivity analyses were performed. Themain effects and interactions on the H2 ux and the H2 puritywere plotted, as shown in Fig. S1 and S2,† respectively. Theslopes indicate either positive or negative effects on theresponse variable, while the steepness of each slope as well asthe coefficients in the regressionmodels indicate the signicantorder.
In the case where the H2 ux is the response variable, asshown in Fig. S1a,† all of the main effects showed a positivetrend, except for the inlet temperature (B), according to theircoefficients in the regression model. To obtain the most suit-able and optimum condition, the catalyst-to-sorbent ratio (C)should be preferably high (2.54 kg kg�1), but the inlet temper-ature (B) should be preferably low (600 �C). Even though SESREhad been found to perform well at around 600–700 �C,18,28
SESRE had a breakthrough of sorption enhancement and per-formed similar to SRE at about 750 �C.28 At 700 �C, the sorbentwould lose its CO2 capture ability and instead would moreclosely turn into a decarbonation condition. Hence, thecarbonation of CaO, which is an exothermic reaction, prefersoperation at a much lower temperature under the breakthroughtemperature. The positive direction of the solid ux (D) indi-cates that the low ux (100 kg m�2 s�1) gave insufficient contactbetween the feed gas and the catalyst/sorbent particles.Considering the riser diameter (A), the larger diameter leads toa greater H2 ux because the large area of the gas inlet allows foran increased feed, even though the dilute region of the solidmight be wider. Finally, an increase in the gas velocity (E) alsoincreased the feed, despite the lower residence time. However,as SESRE has very fast kinetics, it had sufficient time toapproach system equilibrium.
Considering the main effects on the H2 purity, as shown inFig. S2a,† the solid ux (D), the riser diameter (A), and thecatalyst-to-sorbent ratio (C) had positive effects on the H2 purityas well as on the H2 ux. This indicated that at the high levels ofthese parameters (id¼ 0.2 m, Gs¼ 200 kg m�2 s�1, and Cat/Sb¼2.54 kg kg�1), the gas-catalyst/sorbent contact was better than atthe low levels. Such was the case for the H2 ux, as shown in
This journal is © The Royal Society of Chemistry 2018
Fig. S1a,† which conrmed that a solid ux of 100 kg m�2 s�1
gave lesser amount of catalyst/sorbent to contact with the feedwhen compared with a solid ux of 200 kg m�2 s�1. Also, thecatalyst-to-sorbent ratio of 0.58 kg kg�1 had insufficient catalystto produce more H2, although the reforming was enhanced byCO2 capture. Only the gas velocity (E) had a negative effect onthe H2 purity, which was opposed to the H2 ux. This is becausehigher gas velocity (4 m s�1) might increase the feed, but theresidence time is reduced, leaving it far from SESREequilibrium.
Fig. S1b and S2b† show similar interactions between thesolid ux and the riser diameter (AD) and their inuence on theH2 ux and the H2 purity, respectively. When the solid ux (D)was considered constant, the lines for the high riser diameter(A+) gave higher values for both the H2 ux and the H2 puritythan the lines for the low riser diameter (A�). This was becausetheir main effects (A and D) were positive. Thus, at their highlevels, they mutually enhanced both the H2 ux and the H2
purity. The slopes of all the lines for the riser diameter (A+ andA�) still had the same positive direction as the main effect (D),but with slight changes in the steepness. This indicated that theinteraction (AD) was less effective than the main effects (D),according to their P-values listed in Tables S6 and S7† and theirregression coefficients in eqn (52) and (53). However in case ofhigh levels of the solid ux (D+), the more positive effect of thehigh riser diameter (A+) over the low riser diameter (A�) wasless than that for the low levels of the solid ux (D�). In otherwords, when the diameter of riser was larger, the increase in thesolid ux was less effective (or less signicant) than with thesmaller diameter riser. This was in accordance with the smallnegative regression coefficients of their interaction (AD) in eqn(52) and (53), which decrease the values of both the H2 ux andthe H2 purity when both the solid ux and the riser diameter arepositive.
Considering the interactions of the gas velocity (E) on the H2
ux, as shown in Fig. S1b and S1c,† because all of the maineffects (A, D, and E) were positive, their interactions (AE and DE)were more positive on the H2 ux. When the solid ux (D) andthe riser diameter (A) were at the preferably high, as previouslydiscussed in Fig. S1a,† and were enhanced with higher gasvelocity (D+E+ and A+E+), the H2 ux becomes much higherbecause the increase in the gas velocity increases the feed aswell. However, when the riser diameter (A) was the smallest, theinteractions with the gas velocity (A�E� and A�E+) were veryclose, i.e., it barely affected the H2 ux. This indicated thatalthough the higher gas velocity increases the feed, the resi-dence time would be insufficient if the riser diameter was toosmall. These very small deviations also indicated that theinteractions (AE and DE) were less effective than the maineffects (A and D), corresponding to their high P-values in TableS6† and their very small regression coefficients in eqn (52).
Lastly, considering the interaction of the inlet temperature(B) on the H2 purity, as shown in Fig. S2b and S2c,† the line forthe high inlet temperature (B+) crosses the line for the low inlettemperature (B�) when both interact with the solid ux (D) andthe riser diameter (A). This indicates that in this range of inlettemperature (600–700 �C), there was no clear favorite
RSC Adv., 2018, 8, 24209–24230 | 24217
Fig. 3 The axial profiles of: (a) time-averaged H2 flux and (b) the time- and area-averaged H2 purity with different cell sizes in an example case ofid ¼ 0.2 m, Tin ¼ 600 �C, Cat/Sb ¼ 2.54, U ¼ 4 m s�1, and Gs ¼ 200 kg m�2 s�1.
RSC Advances Paper
Ope
n A
cces
s A
rtic
le. P
ublis
hed
on 0
5 Ju
ly 2
018.
Dow
nloa
ded
on 1
2/6/
2021
12:
33:2
6 A
M.
Thi
s ar
ticle
is li
cens
ed u
nder
a C
reat
ive
Com
mon
s A
ttrib
utio
n-N
onC
omm
erci
al 3
.0 U
npor
ted
Lic
ence
.View Article Online
temperature for obtaining higher H2 purity. Moreover, theminor deviations in the steepness of the interactions (AD, BD,and AB) indicated that these interactions were less effectivethan themain effects (A and D), consistent with their P-values inTable S7† and their regression coefficients in eqn (53).
Table 4 shows optimization of the H2 ux from the regres-sion models in eqn (52) prior to optimizing the H2 purity fromeqn (53). The maximum H2 purity was predicted to be only86.53% on a dry basis, while the H2 ux reached 0.174 kg m�2
s�1 in the riser with 0.2 m diameter, inlet temperature of 600 �C,catalyst-to-sorbent ratio of 2.54 kg kg�1, solid ux of 200 kg m�2
s�1, and gas velocity of 4 m s�1. These results from theprediction conformed very well to the results from the simula-tion with these values of parameters, i.e., run 20, where the H2
purity and the H2 ux were 87.57% on a dry basis and 0.174 kgm�2 s�1, respectively.
In the case of optimizing the H2 purity prior to optimizingthe H2 ux, as shown in Table 5, the maximum H2 purity waspredicted to be up to 94.07% on a dry basis, while the H2 uxdropped to 0.147 kg m�2 s�1 in the riser with diameter of 0.2 m,inlet temperature of 627 �C, catalyst-to-sorbent ratio of 2.54 kgkg�1, solid ux of 200 kg m�2 s�1, and gas velocity of 3 m s�1. Toconrm the results from the prediction, another case with thosevalues of parameters was simulated in run 33. However, the
Table 4 The maximum H2 flux from the regression models and a simul
Factor1
A B C D
id [m] Tin [�C] Cat/Sb [kg kg�1] Gs [kg m
Optimizing R1prior to R2
0.200 600.00 2.539 199.86
Run 20 0.200 600.00 2.540 200.00
24218 | RSC Adv., 2018, 8, 24209–24230
predicted H2 purity (94.07% on a dry basis) did not conform tothe H2 purity from the simulation of run 33 (only 88.62% ona dry basis). Thus, the case of run 33 could not be the optimumcase for the H2 purity. In this case, the inlet temperature waspredicted to be 627 �C, while the other parameters (the riserdiameter, the catalyst-to-sorbent ratio, the solid ux, and thegas velocity) were predicted at their limit. According to theprevious discussion about unclear preferred inlet temperature,as shown in Fig. S2b and S2c,† additional prediction cases weredetermined for the best case instead of run 33 by changing theinlet temperature to its limits at 600 �C and 700 �C; both casesmatch the simulations of run 19 and run 27, respectively, asshown in Table 6.
According to the results shown in Table 6, there was a devi-ation in the H2 purity in run 27, which was predicted to be97.11%, but simulated as 94.07% on a dry basis. However, asper the previous point in Table S5,† where run 27 obtained thehighest H2 purity among all 32 runs of the simulation, thesimulation of run 27 also obtained H2 purity higher than thatsimulated in run 33 (88.62% on a dry basis), while the H2 ux(0.134 kg m�2 s�1) was less than that in run 33 (0.146 kg m�2
s�1). However, in the case of run 19, both the predicted H2 uxand the predicted H2 purity well-conformed to the results fromthe simulation. Furthermore, in case of the simulation of run
ation
E R1 R2
�2 s�1] U [m s�1] H2 ux [kg m�2 s�1] H2 purity [% dry]
3.96 0.173570 86.53
4.00 0.173570 87.57
This journal is © The Royal Society of Chemistry 2018
Table 5 The maximum H2 purity from the regression models and a simulation
Factor
A B C D E R1 R2
id [m] Tin [�C] Cat/Sb [kg kg�1] Gs [kg m�2 s�1] U [m s�1] H2 ux [kg m�2 s�1] H2 purity [% dry]
Optimizing R2prior to R1
0.200 627.11 2.540 199.94 3.00 0.147427 94.07
Simulation (run 33) 0.200 627.00 2.540 200.00 3.00 0.145503 88.62
Table 6 The optimum cases from the regression models and simulations
Factor
A B C D E R1 R2
id [m] Tin [�C] Cat/Sb [kg kg�1] Gs [kg m�2 s�1] U [m s�1] H2 ux [kg m�2 s�1] H2 purity [% dry]
Run 27: prediction 0.200 700.00 2.540 200.00 3.00 0.135370 97.11Run 27: simulation 0.200 700.00 2.540 200.00 3.00 0.133745 94.07Run 19: prediction 0.200 600.00 2.540 200.00 3.00 0.151970 92.95Run 19: simulation 0.200 600.00 2.540 200.00 3.00 0.146765 91.30
Paper RSC Advances
Ope
n A
cces
s A
rtic
le. P
ublis
hed
on 0
5 Ju
ly 2
018.
Dow
nloa
ded
on 1
2/6/
2021
12:
33:2
6 A
M.
Thi
s ar
ticle
is li
cens
ed u
nder
a C
reat
ive
Com
mon
s A
ttrib
utio
n-N
onC
omm
erci
al 3
.0 U
npor
ted
Lic
ence
.View Article Online
19, both the H2 purity and H2 ux (91.30% on a dry basis and0.147 kg m�2 s�1, respectively) were higher than those simu-lated in run 33 (88.62% on a dry basis and 0.146 kg m�2 s�1,respectively). Thus, run 19 might be another candidate for theoptimum case in this system.
In an additional consideration, the composition of theeffluent gas in the simulations of run 27 and run 19 are shownin Table 7. Here, even the H2 purity of run 27 (which was thehighest among all the runs) seemed to reach equilibrium, whileEtOH still had not been converted completely compared withthe experimental result and the validated result in Table 3, fromwhich the EtOH content should be approximately 0.0% on a drybasis. This indicated that SESRE could not be performedperfectly in this CFBR system with these ranges of parameters.Moreover, the CH4 content was still high in run 27, while the COwas still high in run 19. These ndings indicated that thereforming reactions of CH4 (SMRs) had not yet reached equi-librium in run 27, while the shi reaction of CO (WGS) had notyet reached equilibrium in run 19. This was because run 19achieved both a H2 ux and H2 purity higher than run 33.Moreover, an additional shi reactor would likely be preferablethan applying other effluent gas separation units to purify H2
due to the higher production of H2 in the same time. Thus, run19 was chosen to be the best case for SESRE operated in thissystem with these ranges of the parameters.
3.4 Hydrodynamics in the riser
With regards to the imperfect performance of SESRE in all casesof the system, considering the hydrodynamics of the best case
Table 7 The compositions of effluent gas from simulations in the optim
H2 [% dry] CH4 [% dry]
Run 27 94.07% 3.87%Run 19 91.30% 0.37%
This journal is © The Royal Society of Chemistry 2018
(run 19) compared with the worst case (run 14) could explain thecauses of imperfection more clearly than considering thehydrodynamics of only the best case.
Fig. 4 displays the instantaneous contour plots of the volumefraction of each solid phase (catalyst and sorbent) and gas phaseat 10, 15, and 20 s in run 14 and run 19. The gradient shades ofcolors from blue to red represent the low volume fraction tohigh volume fraction of each phase. The contour plots showthat both the catalyst and the sorbent particles were in denseclusters in the lower zone (below 2.5 m height in run 19 and 0.5m height in run 14, approximately) of the riser. In the rest of theupper zone of the riser, the solid particles were dense only nearthe wall and were dilute in the center line (core) of riser in run19, whereas the solid particles were very dilute in run 14. Thecontours of the volume fraction of the solids could explain howin the lower zone of both runs, the bed seemed to be ina turbulent uidization regime. In contrast, in the upper zone,the bed appeared to be in fast uidization in run 19 and dilutetransportation in run 14. However, the visual similarity of thevolume fraction of the catalyst phase and the sorbent phaseindicated good mixing of the catalyst and the sorbent in bothruns.
Fig. 5 displays the instantaneous contour plots of the molefraction of H2, EtOH, and CO2 in the gas phase at 10, 15, and20 s in both run 14 and run 19. The contour plots in run 19 showthat the mole fraction of each component in the gas phaseseemed to approach full development from a 2.0 m height of theriser, which was still located in the dense zone of the bed.However, above this zone to the exit, H2 did not reach
um cases
CO [% dry] CO2 [% dry] EtOH [% dry]
1.21% 0.36% 0.49%7.42% 0.61% 0.31%
RSC Adv., 2018, 8, 24209–24230 | 24219
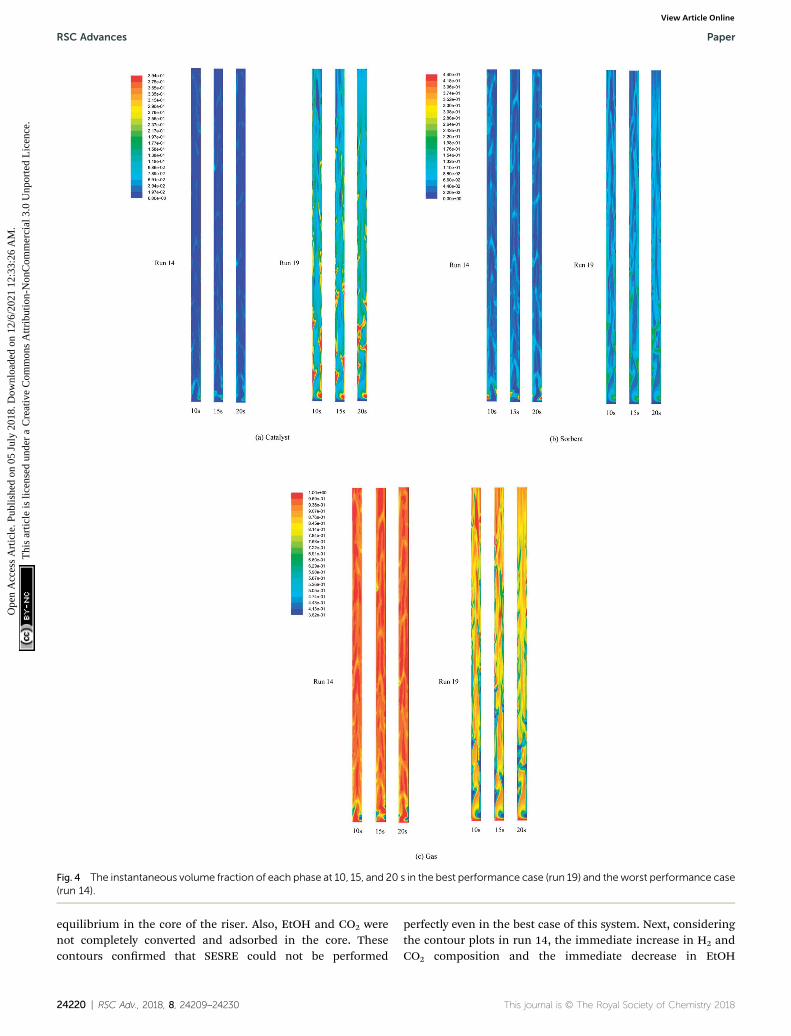
Fig. 4 The instantaneous volume fraction of each phase at 10, 15, and 20 s in the best performance case (run 19) and theworst performance case(run 14).
RSC Advances Paper
Ope
n A
cces
s A
rtic
le. P
ublis
hed
on 0
5 Ju
ly 2
018.
Dow
nloa
ded
on 1
2/6/
2021
12:
33:2
6 A
M.
Thi
s ar
ticle
is li
cens
ed u
nder
a C
reat
ive
Com
mon
s A
ttrib
utio
n-N
onC
omm
erci
al 3
.0 U
npor
ted
Lic
ence
.View Article Online
equilibrium in the core of the riser. Also, EtOH and CO2 werenot completely converted and adsorbed in the core. Thesecontours conrmed that SESRE could not be performed
24220 | RSC Adv., 2018, 8, 24209–24230
perfectly even in the best case of this system. Next, consideringthe contour plots in run 14, the immediate increase in H2 andCO2 composition and the immediate decrease in EtOH
This journal is © The Royal Society of Chemistry 2018
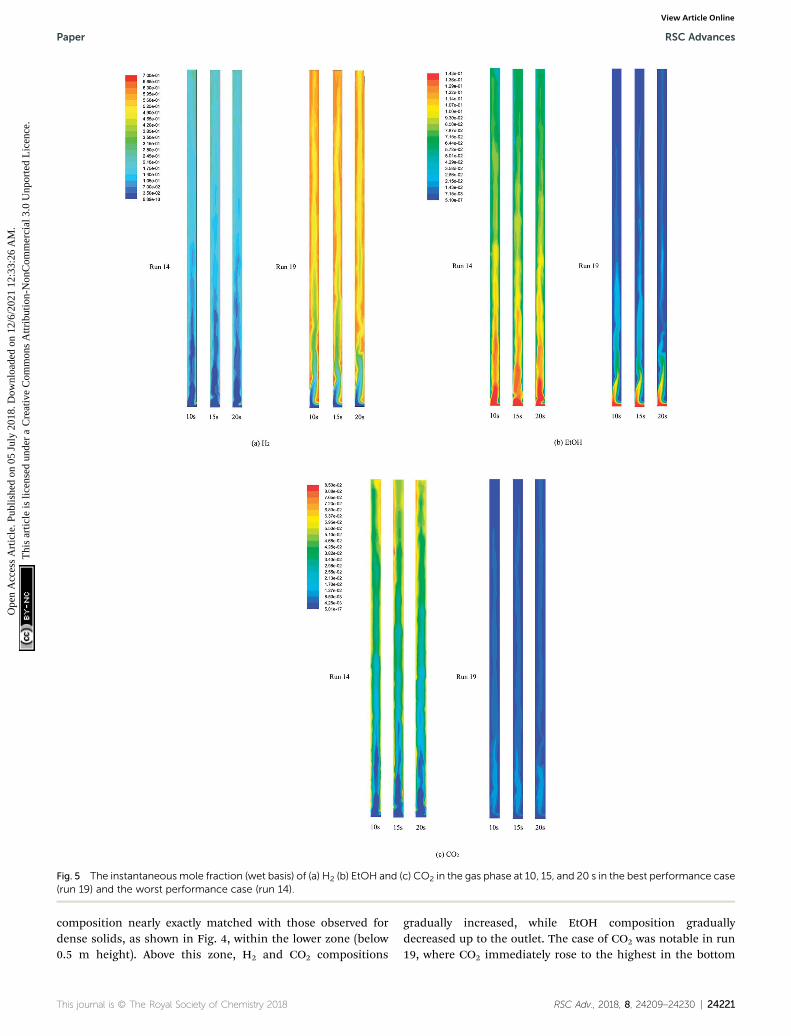
Fig. 5 The instantaneousmole fraction (wet basis) of (a) H2 (b) EtOH and (c) CO2 in the gas phase at 10, 15, and 20 s in the best performance case(run 19) and the worst performance case (run 14).
Paper RSC Advances
Ope
n A
cces
s A
rtic
le. P
ublis
hed
on 0
5 Ju
ly 2
018.
Dow
nloa
ded
on 1
2/6/
2021
12:
33:2
6 A
M.
Thi
s ar
ticle
is li
cens
ed u
nder
a C
reat
ive
Com
mon
s A
ttrib
utio
n-N
onC
omm
erci
al 3
.0 U
npor
ted
Lic
ence
.View Article Online
composition nearly exactly matched with those observed fordense solids, as shown in Fig. 4, within the lower zone (below0.5 m height). Above this zone, H2 and CO2 compositions
This journal is © The Royal Society of Chemistry 2018
gradually increased, while EtOH composition graduallydecreased up to the outlet. The case of CO2 was notable in run19, where CO2 immediately rose to the highest in the bottom
RSC Adv., 2018, 8, 24209–24230 | 24221
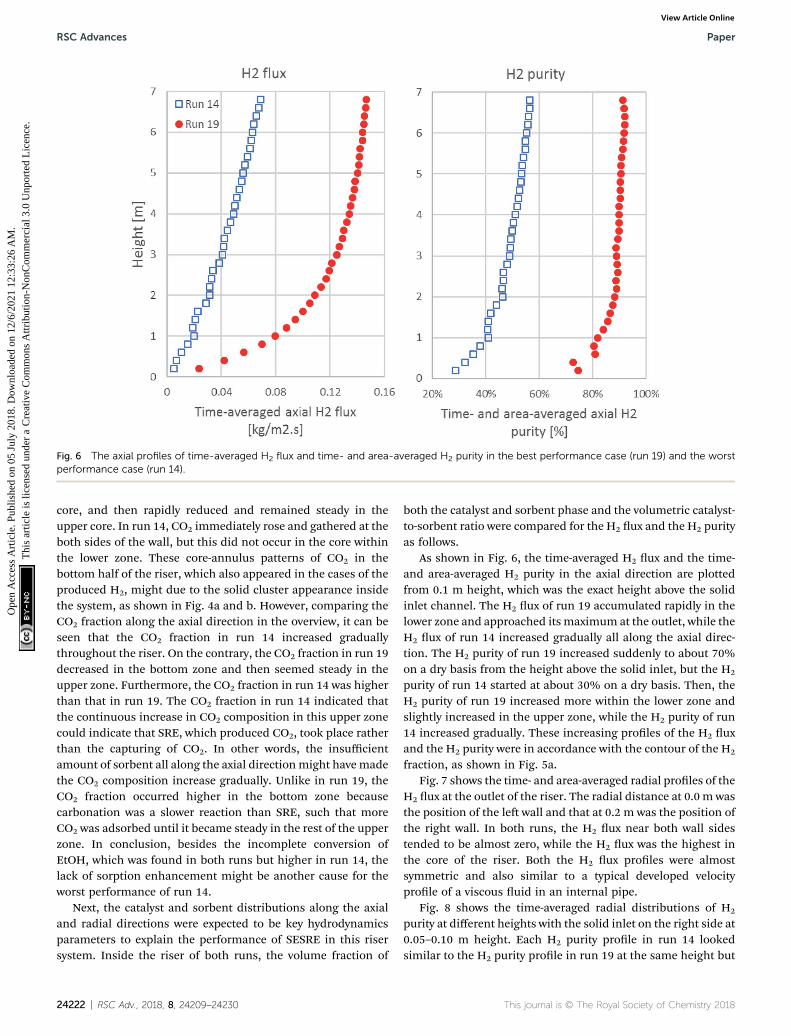
Fig. 6 The axial profiles of time-averaged H2 flux and time- and area-averaged H2 purity in the best performance case (run 19) and the worstperformance case (run 14).
RSC Advances Paper
Ope
n A
cces
s A
rtic
le. P
ublis
hed
on 0
5 Ju
ly 2
018.
Dow
nloa
ded
on 1
2/6/
2021
12:
33:2
6 A
M.
Thi
s ar
ticle
is li
cens
ed u
nder
a C
reat
ive
Com
mon
s A
ttrib
utio
n-N
onC
omm
erci
al 3
.0 U
npor
ted
Lic
ence
.View Article Online
core, and then rapidly reduced and remained steady in theupper core. In run 14, CO2 immediately rose and gathered at theboth sides of the wall, but this did not occur in the core withinthe lower zone. These core-annulus patterns of CO2 in thebottom half of the riser, which also appeared in the cases of theproduced H2, might due to the solid cluster appearance insidethe system, as shown in Fig. 4a and b. However, comparing theCO2 fraction along the axial direction in the overview, it can beseen that the CO2 fraction in run 14 increased graduallythroughout the riser. On the contrary, the CO2 fraction in run 19decreased in the bottom zone and then seemed steady in theupper zone. Furthermore, the CO2 fraction in run 14 was higherthan that in run 19. The CO2 fraction in run 14 indicated thatthe continuous increase in CO2 composition in this upper zonecould indicate that SRE, which produced CO2, took place ratherthan the capturing of CO2. In other words, the insufficientamount of sorbent all along the axial directionmight havemadethe CO2 composition increase gradually. Unlike in run 19, theCO2 fraction occurred higher in the bottom zone becausecarbonation was a slower reaction than SRE, such that moreCO2 was adsorbed until it became steady in the rest of the upperzone. In conclusion, besides the incomplete conversion ofEtOH, which was found in both runs but higher in run 14, thelack of sorption enhancement might be another cause for theworst performance of run 14.
Next, the catalyst and sorbent distributions along the axialand radial directions were expected to be key hydrodynamicsparameters to explain the performance of SESRE in this risersystem. Inside the riser of both runs, the volume fraction of
24222 | RSC Adv., 2018, 8, 24209–24230
both the catalyst and sorbent phase and the volumetric catalyst-to-sorbent ratio were compared for the H2 ux and the H2 purityas follows.
As shown in Fig. 6, the time-averaged H2 ux and the time-and area-averaged H2 purity in the axial direction are plottedfrom 0.1 m height, which was the exact height above the solidinlet channel. The H2 ux of run 19 accumulated rapidly in thelower zone and approached its maximum at the outlet, while theH2 ux of run 14 increased gradually all along the axial direc-tion. The H2 purity of run 19 increased suddenly to about 70%on a dry basis from the height above the solid inlet, but the H2
purity of run 14 started at about 30% on a dry basis. Then, theH2 purity of run 19 increased more within the lower zone andslightly increased in the upper zone, while the H2 purity of run14 increased gradually. These increasing proles of the H2 uxand the H2 purity were in accordance with the contour of the H2
fraction, as shown in Fig. 5a.Fig. 7 shows the time- and area-averaged radial proles of the
H2 ux at the outlet of the riser. The radial distance at 0.0 m wasthe position of the le wall and that at 0.2 m was the position ofthe right wall. In both runs, the H2 ux near both wall sidestended to be almost zero, while the H2 ux was the highest inthe core of the riser. Both the H2 ux proles were almostsymmetric and also similar to a typical developed velocityprole of a viscous uid in an internal pipe.
Fig. 8 shows the time-averaged radial distributions of H2
purity at different heights with the solid inlet on the right side at0.05–0.10 m height. Each H2 purity prole in run 14 lookedsimilar to the H2 purity prole in run 19 at the same height but
This journal is © The Royal Society of Chemistry 2018
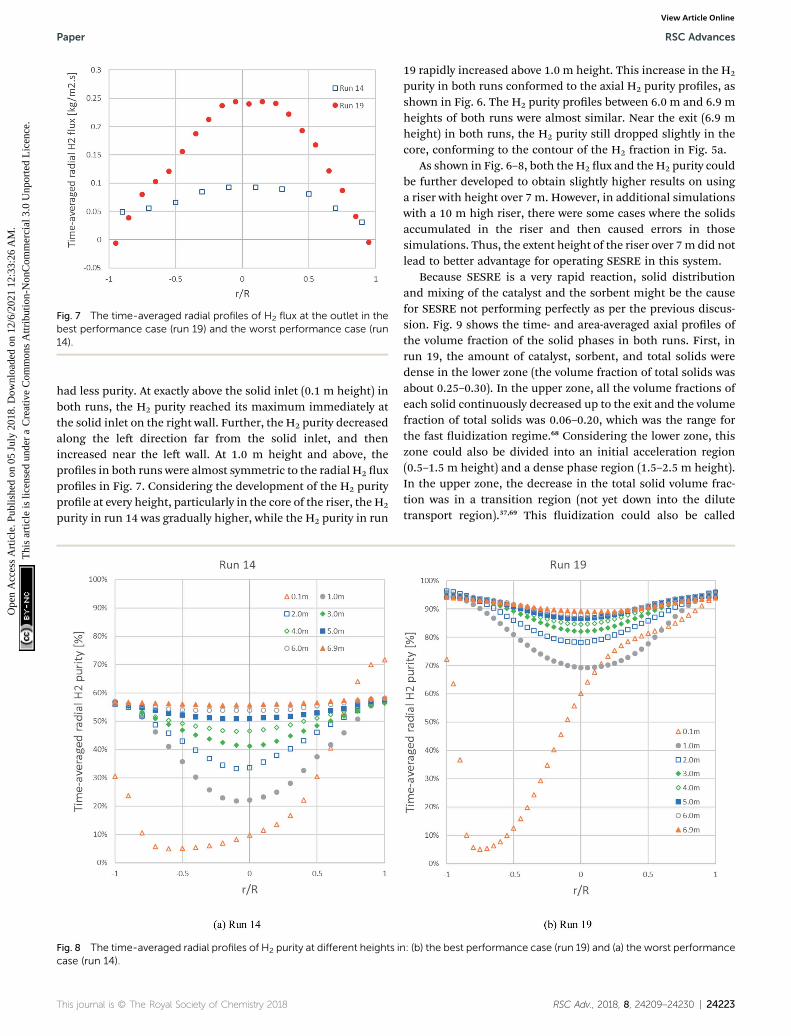
Fig. 7 The time-averaged radial profiles of H2 flux at the outlet in thebest performance case (run 19) and the worst performance case (run14).
Paper RSC Advances
Ope
n A
cces
s A
rtic
le. P
ublis
hed
on 0
5 Ju
ly 2
018.
Dow
nloa
ded
on 1
2/6/
2021
12:
33:2
6 A
M.
Thi
s ar
ticle
is li
cens
ed u
nder
a C
reat
ive
Com
mon
s A
ttrib
utio
n-N
onC
omm
erci
al 3
.0 U
npor
ted
Lic
ence
.View Article Online
had less purity. At exactly above the solid inlet (0.1 m height) inboth runs, the H2 purity reached its maximum immediately atthe solid inlet on the right wall. Further, the H2 purity decreasedalong the le direction far from the solid inlet, and thenincreased near the le wall. At 1.0 m height and above, theproles in both runs were almost symmetric to the radial H2 uxproles in Fig. 7. Considering the development of the H2 purityprole at every height, particularly in the core of the riser, the H2
purity in run 14 was gradually higher, while the H2 purity in run
Fig. 8 The time-averaged radial profiles of H2 purity at different heights icase (run 14).
This journal is © The Royal Society of Chemistry 2018
19 rapidly increased above 1.0 m height. This increase in the H2
purity in both runs conformed to the axial H2 purity proles, asshown in Fig. 6. The H2 purity proles between 6.0 m and 6.9 mheights of both runs were almost similar. Near the exit (6.9 mheight) in both runs, the H2 purity still dropped slightly in thecore, conforming to the contour of the H2 fraction in Fig. 5a.
As shown in Fig. 6–8, both the H2 ux and the H2 purity couldbe further developed to obtain slightly higher results on usinga riser with height over 7 m. However, in additional simulationswith a 10 m high riser, there were some cases where the solidsaccumulated in the riser and then caused errors in thosesimulations. Thus, the extent height of the riser over 7m did notlead to better advantage for operating SESRE in this system.
Because SESRE is a very rapid reaction, solid distributionand mixing of the catalyst and the sorbent might be the causefor SESRE not performing perfectly as per the previous discus-sion. Fig. 9 shows the time- and area-averaged axial proles ofthe volume fraction of the solid phases in both runs. First, inrun 19, the amount of catalyst, sorbent, and total solids weredense in the lower zone (the volume fraction of total solids wasabout 0.25–0.30). In the upper zone, all the volume fractions ofeach solid continuously decreased up to the exit and the volumefraction of total solids was 0.06–0.20, which was the range forthe fast uidization regime.68 Considering the lower zone, thiszone could also be divided into an initial acceleration region(0.5–1.5 m height) and a dense phase region (1.5–2.5 m height).In the upper zone, the decrease in the total solid volume frac-tion was in a transition region (not yet down into the dilutetransport region).37,69 This uidization could also be called
n: (b) the best performance case (run 19) and (a) the worst performance
RSC Adv., 2018, 8, 24209–24230 | 24223
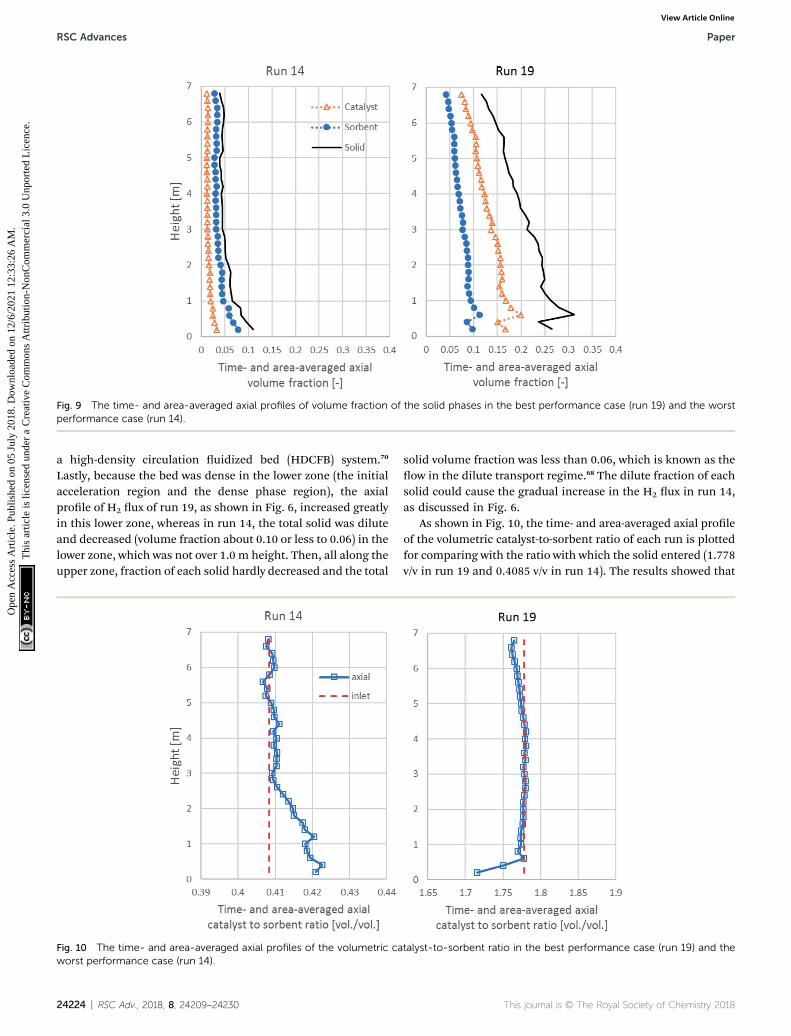
Fig. 9 The time- and area-averaged axial profiles of volume fraction of the solid phases in the best performance case (run 19) and the worstperformance case (run 14).
RSC Advances Paper
Ope
n A
cces
s A
rtic
le. P
ublis
hed
on 0
5 Ju
ly 2
018.
Dow
nloa
ded
on 1
2/6/
2021
12:
33:2
6 A
M.
Thi
s ar
ticle
is li
cens
ed u
nder
a C
reat
ive
Com
mon
s A
ttrib
utio
n-N
onC
omm
erci
al 3
.0 U
npor
ted
Lic
ence
.View Article Online
a high-density circulation uidized bed (HDCFB) system.70
Lastly, because the bed was dense in the lower zone (the initialacceleration region and the dense phase region), the axialprole of H2 ux of run 19, as shown in Fig. 6, increased greatlyin this lower zone, whereas in run 14, the total solid was diluteand decreased (volume fraction about 0.10 or less to 0.06) in thelower zone, which was not over 1.0 m height. Then, all along theupper zone, fraction of each solid hardly decreased and the total
Fig. 10 The time- and area-averaged axial profiles of the volumetric caworst performance case (run 14).
24224 | RSC Adv., 2018, 8, 24209–24230
solid volume fraction was less than 0.06, which is known as theow in the dilute transport regime.68 The dilute fraction of eachsolid could cause the gradual increase in the H2 ux in run 14,as discussed in Fig. 6.
As shown in Fig. 10, the time- and area-averaged axial proleof the volumetric catalyst-to-sorbent ratio of each run is plottedfor comparing with the ratio with which the solid entered (1.778v/v in run 19 and 0.4085 v/v in run 14). The results showed that
talyst-to-sorbent ratio in the best performance case (run 19) and the
This journal is © The Royal Society of Chemistry 2018
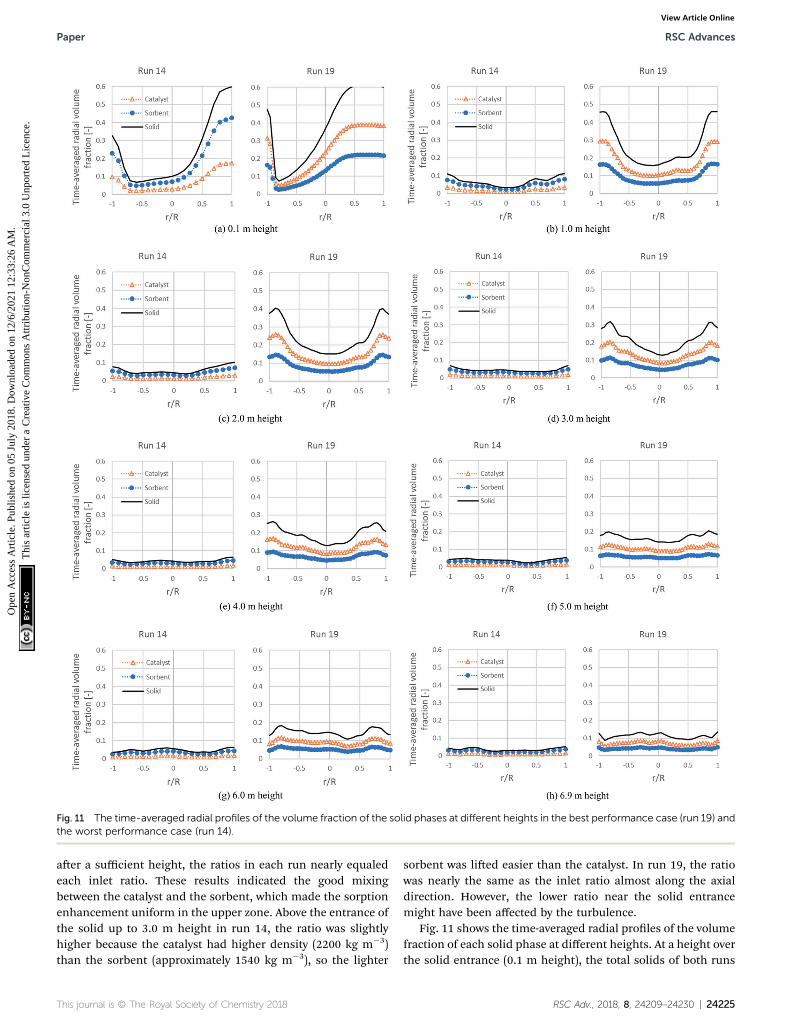
Fig. 11 The time-averaged radial profiles of the volume fraction of the solid phases at different heights in the best performance case (run 19) andthe worst performance case (run 14).
Paper RSC Advances
Ope
n A
cces
s A
rtic
le. P
ublis
hed
on 0
5 Ju
ly 2
018.
Dow
nloa
ded
on 1
2/6/
2021
12:
33:2
6 A
M.
Thi
s ar
ticle
is li
cens
ed u
nder
a C
reat
ive
Com
mon
s A
ttrib
utio
n-N
onC
omm
erci
al 3
.0 U
npor
ted
Lic
ence
.View Article Online
aer a sufficient height, the ratios in each run nearly equaledeach inlet ratio. These results indicated the good mixingbetween the catalyst and the sorbent, which made the sorptionenhancement uniform in the upper zone. Above the entrance ofthe solid up to 3.0 m height in run 14, the ratio was slightlyhigher because the catalyst had higher density (2200 kg m�3)than the sorbent (approximately 1540 kg m�3), so the lighter
This journal is © The Royal Society of Chemistry 2018
sorbent was lied easier than the catalyst. In run 19, the ratiowas nearly the same as the inlet ratio almost along the axialdirection. However, the lower ratio near the solid entrancemight have been affected by the turbulence.
Fig. 11 shows the time-averaged radial proles of the volumefraction of each solid phase at different heights. At a height overthe solid entrance (0.1 m height), the total solids of both runs
RSC Adv., 2018, 8, 24209–24230 | 24225
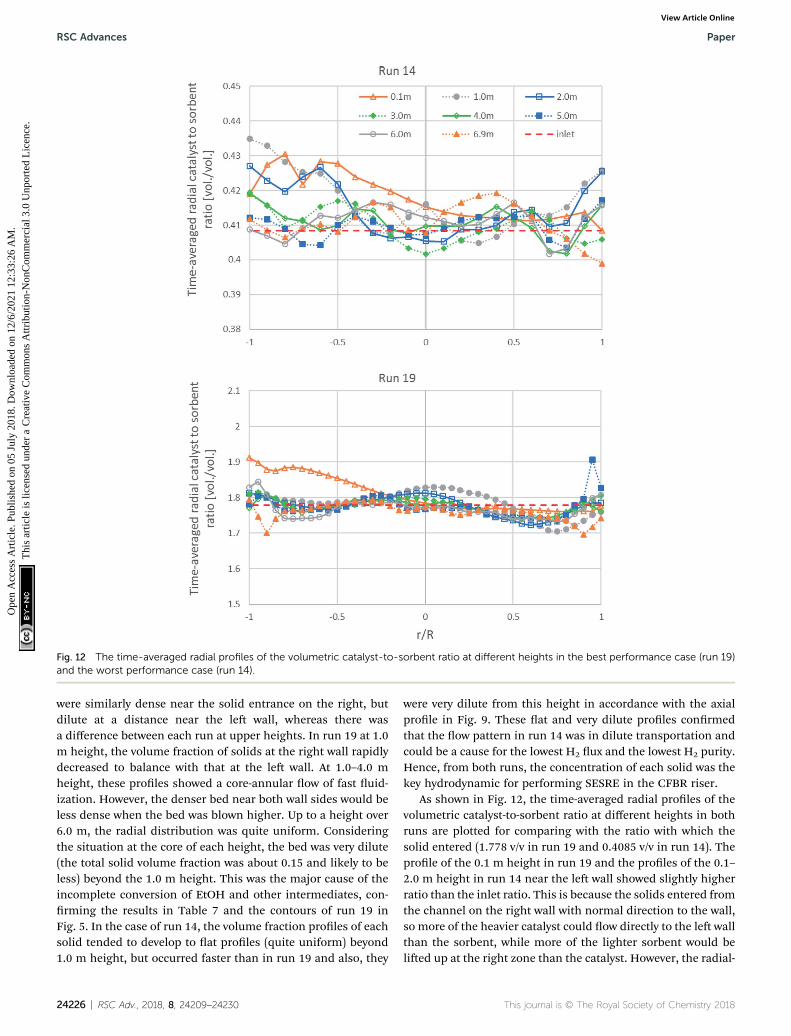
Fig. 12 The time-averaged radial profiles of the volumetric catalyst-to-sorbent ratio at different heights in the best performance case (run 19)and the worst performance case (run 14).
RSC Advances Paper
Ope
n A
cces
s A
rtic
le. P
ublis
hed
on 0
5 Ju
ly 2
018.
Dow
nloa
ded
on 1
2/6/
2021
12:
33:2
6 A
M.
Thi
s ar
ticle
is li
cens
ed u
nder
a C
reat
ive
Com
mon
s A
ttrib
utio
n-N
onC
omm
erci
al 3
.0 U
npor
ted
Lic
ence
.View Article Online
were similarly dense near the solid entrance on the right, butdilute at a distance near the le wall, whereas there wasa difference between each run at upper heights. In run 19 at 1.0m height, the volume fraction of solids at the right wall rapidlydecreased to balance with that at the le wall. At 1.0–4.0 mheight, these proles showed a core-annular ow of fast uid-ization. However, the denser bed near both wall sides would beless dense when the bed was blown higher. Up to a height over6.0 m, the radial distribution was quite uniform. Consideringthe situation at the core of each height, the bed was very dilute(the total solid volume fraction was about 0.15 and likely to beless) beyond the 1.0 m height. This was the major cause of theincomplete conversion of EtOH and other intermediates, con-rming the results in Table 7 and the contours of run 19 inFig. 5. In the case of run 14, the volume fraction proles of eachsolid tended to develop to at proles (quite uniform) beyond1.0 m height, but occurred faster than in run 19 and also, they
24226 | RSC Adv., 2018, 8, 24209–24230
were very dilute from this height in accordance with the axialprole in Fig. 9. These at and very dilute proles conrmedthat the ow pattern in run 14 was in dilute transportation andcould be a cause for the lowest H2 ux and the lowest H2 purity.Hence, from both runs, the concentration of each solid was thekey hydrodynamic for performing SESRE in the CFBR riser.
As shown in Fig. 12, the time-averaged radial proles of thevolumetric catalyst-to-sorbent ratio at different heights in bothruns are plotted for comparing with the ratio with which thesolid entered (1.778 v/v in run 19 and 0.4085 v/v in run 14). Theprole of the 0.1 m height in run 19 and the proles of the 0.1–2.0 m height in run 14 near the le wall showed slightly higherratio than the inlet ratio. This is because the solids entered fromthe channel on the right wall with normal direction to the wall,so more of the heavier catalyst could ow directly to the le wallthan the sorbent, while more of the lighter sorbent would belied up at the right zone than the catalyst. However, the radial-
This journal is © The Royal Society of Chemistry 2018
Paper RSC Advances
Ope
n A
cces
s A
rtic
le. P
ublis
hed
on 0
5 Ju
ly 2
018.
Dow
nloa
ded
on 1
2/6/
2021
12:
33:2
6 A
M.
Thi
s ar
ticle
is li
cens
ed u
nder
a C
reat
ive
Com
mon
s A
ttrib
utio
n-N
onC
omm
erci
al 3
.0 U
npor
ted
Lic
ence
.View Article Online
averaged ratio of each height was nearly equal that with whichthe solids entered. Thus, the segregation between the catalystand the sorbent in the radial direction did not severely affectSESRE, consistent with the axial prole of the volumetriccatalyst-to-sorbent ratio discussed previously in Fig. 9, thesegregation between the catalyst and the sorbent did not causethe incomplete performance of SESRE in this system.
Overall, the major cause of the incomplete operations ofSESRE in the CFBR system with these ranges of parameters wasthe dilute region in the core of the riser, which led to aninsufficient gas-solids contact before the gas le the riser. Eventhough the CFBR system with the best case still did not achievethe perfect SESRE performance, the H2 purity could be raisedhighly up to 91.30% on a dry basis by sorption enhancement.Compared to the packed-bed reactor, in which the gas andsolids have sufficient contact time, SESRE could be performedperfectly with H2 purity 96.2% on a dry basis in the experimentof Olivas et al.18 and 98.5% in the validating simulation, asshown in Table 3. Thus, the CFB riser with better modicationsof design and/or operation might enable a better gas–solidcontact for perfect SESRE performance. However, verifyingexperiments are suggested to conrm this system design.
4. Conclusion
In the present study, 2D transient models for gas–solid owsusing a Euler–Euler approach accompanied with the KTGFtheory and kinetic models of SRE on a Ni-based catalyst andcarbonation on the dolomite sorbent were applied for simu-lating SESRE in a CFB riser. The pilot-scale riser design andoperation were determined for the best performance of H2
production by studying the ve most effective parametersinvolving the design parameters (the riser diameter, the gasvelocity, and the solid ux) and the reaction parameters (theinlet temperature and the catalyst-to-sorbent ratio). The 25 fullfactorial design method was utilized to investigate the effects ofeach parameter on the H2 ux and the H2 purity, and to predictthe optimum case of both the H2 ux and the H2 purity. Manycases of the 32 runs indicated that SESRE could perform well inthe system, even though neither of them achieved the extremelevel as determined in theoretical equilibrium or in the packed-bed rector. The CaO conversion was not over 28% of the circu-lating limitation in every case. Thus, SESRE could possibly beoperated in the CFBR system.
According to the results of the ANOVAs, either the maineffect or its interaction with each parameter occurred and wassignicant with the H2 ux or the H2 purity. In descendingorder, the catalyst-to-sorbent ratio, the solid ux, the riserdiameter, the inlet temperature, and the gas velocity had highlysignicant effects on the H2 ux. Moreover, the solid ux, theriser diameter, the gas velocity, and the catalyst-to-sorbent ratiohad highly signicant effects on the H2 purity. Remarkably, themain effects of the riser diameter and the solid ux and theirinteractions were signicant to both the H2 ux and the H2
purity. Therefore, the riser diameter and the solid ux, whichare both design parameters, were the key parameters for H2
production performance in this system. Moreover, most of the
This journal is © The Royal Society of Chemistry 2018
main effects and interactions positively affected both the H2 uxand the H2 purity; whereas the inlet temperature had a negativeeffect on the H2 ux and the gas velocity was negative to the H2
purity.From predictions using regression models, the best case of
SESRE in this CFB riser was simulated with riser diameter of 0.2m, inlet temperature of 600 �C, catalyst-to-sorbent ratio of 2.54kg kg�1, solid ux of 200 kg m�2 s�1, and gas velocity of 3 m s�1
to possibly achieve the highest H2 purity of 91.30% on a drybasis with a maximum H2 ux of 0.147 kg m�2 s�1.
Considering the hydrodynamics inside the riser for the bestcase, rst of all, the solid ow was a core-annular pattern of fastuidization, in which the bed was denser in the lower zone, asmight be called a high-dense circulation uidized bed (HDCFB).Thus, the performance of SESRE reached breakthrough in thisdense zone. Next, the good mixing of the catalyst and thesorbent all along both the axial and radial directions indicatedthat the segregation between the catalyst and the sorbent wasnot the cause of the incomplete performance. The bed in thecore of the riser was very dilute almost along the entire axialdirection, and this was the actual cause for the incompletion ofSESRE in this system, even in the best case.
Conflicts of interest
There are no conicts to declare.
Nomenclature
CD
Drag coefficient, [—] Cfr,ls Friction coefficient between solid phases, [—] Cat/Sb Catalyst-to-sorbent ratio, [kg kg�1] ds Particle diameter of the solid phase, [m] ess h els Restitution coefficient for solid–solid collisions, [—] Gs Solid ux, [kg m�2 s�1] g.Gravity force, [m s�2]
g0,ls Radial distribution coefficient of mutual solid phases,[—]
g0,ss Radial distribution coefficient of single solid phase,[—]
H Height of the riser, [m] Hg Specic enthalpy of the gas phase, [m2 s�2, J kg�1] hsg hhgsGas–solid interphase heat exchange coefficient, [m2
s�2, J kg�1]
�I Unit tensor, [–] id.q Diameter of the riser, [m] J k Mass ux of species k into phase q, [kg m�2 s�1] Ki Equilibrium constants of reaction i Kk Adsorption equilibrium constants of species k Kls hKslSolid–solid interphase momentum exchangecoefficient, [kg m�3 s�1]
Ksg hKgs
Gas–solid interphase momentum exchangecoefficient, [kg m�3 s�1]
kcarb
Rate constants of carbonation kg Thermal conductivity of the gas phase, [W m�1 K�1] ki Rate constants of reaction i kQsDiffusion coefficient, [m2 s�1]
RSC Adv., 2018, 8, 24209–24230 | 24227
RSC Advances Paper
Ope
n A
cces
s A
rtic
le. P
ublis
hed
on 0
5 Ju
ly 2
018.
Dow
nloa
ded
on 1
2/6/
2021
12:
33:2
6 A
M.
Thi
s ar
ticle
is li
cens
ed u
nder
a C
reat
ive
Com
mon
s A
ttrib
utio
n-N
onC
omm
erci
al 3
.0 U
npor
ted
Lic
ence
.View Article Online
_mpq
24228 | RS
Mass transfer from phase p to phase q, [kg m�3 s�1]
Nus Nusselt number of the solid phase, [—] n Degree of partial pressure, [—] Pr Prandtl number of the gas phase, [—] p Static pressure, [Pa] pCO2Partial pressure of CO2, [Pa]
pCO2,eq Equilibrium pressures of CO2, [Pa] pg Static pressure of the gas phase, [Pa] pk Partial pressures of species k, [Pa] ps Solid pressure, [Pa] Qsg Intensity of heat exchange between the solid phaseand gas phase, [W m�3]
q.g
Heat ux of the gas phase, [W m�2] Rqk Net rate of species k produced by homogeneousreactions inside phase q, [kg m�3 s�1]
Res Particle Reynolds number of the solid phase, [—] rcarb Rate of carbonation, [kmol kgsorb�1 s�1]
ri Rates of reaction i, [kmol kgcat�1 s�1]
Sh,g Heat source of the gas phase, [W m�3] Sqk Rate of creation of species k by addition from thedispersed phase and other sources in phase q, [kgm�3 s�1]
Sm,q
Mass source of phase q, [kg m�3 s�1] S0 Initial specic surface area of CaO, [m2 kgsorb�1]
S/E Steam/ethanol molar ratio, [mol mol�1] Tin Temperature of the inlets, [�C] U Gas inlet velocity, [m s�1] n.1s
Interphase velocity from phase l (solid or gas) to thesolid phase, [m s�1]n.
q
Velocity of phase q, [m s�1] n.sg
Interphase velocity from the solid phase to gas phase,[m s�1]XCaO
Conversion of CaO, [—] Yqk Mass fraction of species k in phase q, [—] gQsCollisional dissipation of energy, [W m�3]
3q Volume fraction of phase q, [—] 3s,max Maximum packing of the solid phase, [—] Qs Granular temperature, [m2 s�2, J kg�1] lq Bulk viscosity of phase q, [Pa s] ls Solid bulk viscosity, [Pa s] mq Shear viscosity of phase q, [Pa s] ms Solid shear viscosity, [Pa s] ms,col Collisional viscosity of the solid phase, [Pa s] ms,fr Friction viscosity of the solid phase, [Pa s] ms,kin Kinetic viscosity of the solid phase, [Pa s] rq Physical density of phase q, [kg m�3] s�q Stress tensor of phase q, [Pa] ss Particulate relaxation time in the solid phase, [s] fls Kinetic energy exchange between phase l (solid or gas)and the solid phase, [W m�3]
Acknowledgements
The authors would like to acknowledge the support from theRatchadapisek Sompoch Endowment Fund (2016), Chula-longkorn University (CU-59-003-IC). B. Chalermsinsuwan alsowould like to thank the support from the Thailand Research
C Adv., 2018, 8, 24209–24230
Fund (RSA5980052). S. Assabumrungrat and S. Putivisutisakalso acknowledge the NSTDA Chair Professor Grant (No. 5)funded by the Crown Property Bureau of Thailand and NationalScience and Technology Development Agency.
References
1 F. Joensen and J. R. Rostrup-Nielsen, Conversion ofhydrocarbons and alcohols for fuel cells, J. Power Sources,2002, 105, 195–201.
2 J. L. Contreras, J. Salmones, J. A. Colın-Luna, L. Nuno,B. Quintana, I. Cordova, B. Zeifert, C. Tapia andG. A. Fuentes, Catalysts for H2 production using theethanol steam reforming (a review), Int. J. Hydrogen Energy,2014, 39, 18835–18853.
3 G. Wu, C. Zhang, S. Li, Z. Huang, S. Yan, S. Wang, X. Ma andJ. Gong, Sorption enhanced steam reforming of ethanol onNi–CaO–Al2O3 multifunctional catalysts derived fromhydrotalcite-like compounds, Energy Environ. Sci., 2012, 5,8942–8949.
4 M. A. Ebiad, D. R. Abd El-Haz, R. A. Elsalamony andL. S. Mohamed, Ni supported high surface area CeO2–ZrO2
catalysts for hydrogen production from ethanol steamreforming, RSC Adv., 2012, 2, 8145–8156.
5 A. Rautio, P. K. Seelam, P. Maki-Arvela, O. Pitkanen,M. Huuhtanen, R. L. Keiski and K. Kordasa, Carbonsupported catalysts in low temperature steam reforming ofethanol: study of catalyst performance, RSC Adv., 2015, 5,49487–49492.
6 F. Liu, Y. Qu, Y. Yue, G. Liu and Y. Liu, Nano bimetallic alloyof Ni–Co obtained from LaCoxNi1�xO3 and its catalyticperformance for steam reforming of ethanol, RSC Adv.,2015, 5, 16837–16846.
7 Z. Zhao, P. Ren and W. Li, Supported Ni catalyst on a naturalhalloysite derived silica-alumina composite oxide withunexpected coke-resistant stability for steam-CO2 dualreforming of methane, RSC Adv., 2016, 6, 49487–49496.
8 P. Vaidya and A. E. Rodrigues, Insight into steam reformingof ethanol to produce hydrogen for fuel cells: a review, Chem.Eng. J., 2006, 117, 39–49.
9 Y. J. Wu, P. Li, J. G. Yu, A. F. Cunha and A. E. Rodrigues,Sorption-enhanced steam reforming of ethanol on NiMgAlmultifunctional materials: Experimental and numericalinvestigation, Chem. Eng. J., 2013, 231, 36–48.
10 Y. J. Wu, P. Li, J. G. Yu, A. F. Cunha and A. E. Rodrigues,Sorption-enhanced steam reforming of ethanol forcontinuous high-purity hydrogen production: 2Dadsorptive reactor dynamics and process design, Chem.Eng. Sci., 2014, 118, 83–93.
11 Y. J. Wu, P. Li, J. G. Yu, A. F. Cunha and A. E. Rodrigues,High-purity hydrogen production by sorption-enhancedsteam reforming of ethanol: a cyclic operation simulationstudy, Ind. Eng. Chem. Res., 2014, 53, 8515–8527.
12 Y. J. Wu, J. C. Santos, P. Li, J. G. Yu, A. F. Cunha andA. E. Rodrigues, Simplied kinetic model for steamreforming of ethanol on a Ni/Al2O3 catalyst, Can. J. Chem.Eng., 2014, 92, 116–130.
This journal is © The Royal Society of Chemistry 2018
Paper RSC Advances
Ope
n A
cces
s A
rtic
le. P
ublis
hed
on 0
5 Ju
ly 2
018.
Dow
nloa
ded
on 1
2/6/
2021
12:
33:2
6 A
M.
Thi
s ar
ticle
is li
cens
ed u
nder
a C
reat
ive
Com
mon
s A
ttrib
utio
n-N
onC
omm
erci
al 3
.0 U
npor
ted
Lic
ence
.View Article Online
13 A. F. Cunha, Y. J. Wu, F. A. Diaz Alvarado, J. C. Santos,P. D. Vaidya and A. E. Rodrigues, Steam reforming ofethanol on a Ni/Al2O3 catalyst coupled with a hydrotalcite-like sorbent in a multilayer pattern for CO2 uptake, Can. J.Chem. Eng., 2012, 90, 1514–1526.
14 A. Haryanto, S. Fernando, N. Murali and S. Adhikari, Currentstatus of hydrogen production techniques by steamreforming of ethanol: A review, Energy Fuels, 2005, 19,2098–2106.
15 M. De-Souza, G. M. Zanin and F. F. Moraes, Parametric studyof hydrogen production from ethanol steam reforming ina membrane microreactor, Braz. J. Chem. Eng., 2013, 30,355–367.
16 J. Sun, X. Qiu, F. Wu and W. Zhu, H2 from steam reformingof ethanol at low temperature over Ni–Y2O3, Ni–La2O3 andNi–Al2O3 catalysts for fuel-cell application, Int. J. HydrogenEnergy, 2005, 30, 437–445.
17 V. Mas, M. L. Bergamini, G. Baronetti, N. Amadeo andM. Laborde, A kinetic study of ethanol steam reformingusing a nickel based catalyst, Top. Catal., 2008, 51, 39–48.
18 D. Y. Aceves Olivas, M. R. Baray Guerrero, M. A. EscobedoBretado, M. Marques da Silva Paula, J. Salinas Gutierrez,V. Guzman Velderrain, A. Lopez Ortiz and V. Collins-Martınez, Enhanced ethanol steam reforming by CO2
absorption using CaO, CaO*MgO or Na2ZrO3, Int. J.Hydrogen Energy, 2014, 39, 16595–16607.
19 L. Barelli, G. Bidini, F. Gallorini and S. Servili, Hydrogenproduction through sorption-enhanced steam methanereforming and membrane technology: a review, Energy,2008, 33, 554–570.
20 S. D. Kenarsari, D. Yang, G. Jiang, S. Zhang, J. Wang,A. G. Russell, Q. Wei and M. Fan, Review of recentadvances in carbon dioxide separation and capture, RSCAdv., 2013, 3, 22739–22773.
21 D. P. Harrison, Sorption-enhanced hydrogen production:a review, Ind. Eng. Chem. Res., 2008, 47, 6486–6501.
22 A. Cotton, K. Patchigolla and J. E. Oakey, Overview of, andexperimental methodology for sorption enhancedhydrogen production, Energy Procedia, 2013, 37, 2232–2244.
23 A. E. Rodrigues, Y. J. Wu, R. Faria and L. M. Madeira,Sorption Enhanced Reaction Processes, World ScienticPublishing, USA, 2017.
24 R. Singh, M. K. Ram Reddy, S. Wilson, K. Joshi, J. C. Diniz daCosta and P. Webley, High temperature materials for CO2
capture, Energy Procedia, 2009, 1, 623–630.25 M. Sayyah, B. R. Ito, M. Rostam-Abadi, Y. Lu and
K. S. Suslick, CaO-based sorbents for CO2 capture preparedby ultrasonic spray pyrolysis, RSC Adv., 2013, 3, 19872–19875.
26 A. Islam, S. H. Teo, E. S. Chan and Y. H. Tauq-Yap,Enhancing the sorption performance of surfactant-assistedCaO nanoparticles, RSC Adv., 2014, 4, 65127–65136.
27 H. Ping and S. Wu, Preparation of cage-like nano-CaCO3
hollow spheres for enhanced CO2 sorption, RSC Adv., 2015,5, 65052–65057.
This journal is © The Royal Society of Chemistry 2018
28 J. Comas, M. Laborde and N. Amadeo, Thermodynamicanalysis of hydrogen production from ethanol using CaOas a CO2 sorbent, J. Power Sources, 2004, 138, 61–67.
29 A. L. da Silva and I. L. Muller, Hydrogen production bysorption enhanced steam reforming of oxygenatedhydrocarbons (ethanol, glycerol, n-butanol and methanol):thermodynamic modelling, Int. J. Hydrogen Energy, 2011,36, 2057–2075.
30 Z. Chao, Y. Wang, J. P. Jakobsen, M. Fernandino andH. A. Jakobsen, Numerical investigation of the sorptionenhanced steam methane reforming in a uidized bedreactor, Energy Procedia, 2012, 26, 15–21.
31 Y. Wang, Z. Chao and H. A. Jakobsen, 3D Simulation ofbubbling uidized bed reactors for sorption enhancedsteam methane reforming processes, J. Nat. Gas Sci. Eng.,2010, 2, 105–113.
32 K. Johnsen, J. R. Grace, S. S. E. H. Elnashaie, L. Kolbeinsenand D. Eriksen, Modeling of sorption-enhanced steamreforming in a dual uidized bubbling bed reactor, Ind.Eng. Chem. Res., 2006, 45, 4133–4144.
33 K. Johnsen, H. J. Ryu, J. R. Grace and C. J. Lim, Sorption-enhanced steam reforming of methane in a uidized bedreactor with dolomite as CO2-acceptor, Chem. Eng. Sci.,2006, 61, 1195–1202.
34 A. G. Gayubo, J. Vicente, J. Erena, C. Montero, M. Olazar andJ. Bilbao, Comparison of Ni and Co catalysts for ethanolsteam reforming in a uidized bed reactor, Catal. Lett.,2014, 144, 1134–1143.
35 J. Vicente, C. Montero, J. Erena, M. J. Azkoiti, J. Bilbao andA. G. Gayubo, Coke deactivation of Ni and Co catalysts inethanol steam reforming at mild temperatures ina uidized bed reactor, Int. J. Hydrogen Energy, 2014, 39,21586–21596.
36 D. Kunii and O. Levenspiel, Fluidization engineering,Butterworth-Heinemann, USA, 1991.
37 M. B. M. Mousa, S. E. K. Fateen and E. A. Ibrahim,Hydrodynamics of a novel design circulating uidized bedsteam reformer operating in the dense suspension upowregime, ISRN Chem. Eng., 2014, 2014, 1–13.
38 Y. Prajongkan, Three-dimensional simulation ofhydrodynamics in riser of circulating uidized bed reactor,Thesis of the degree of Master of Science, ChulalongkornUniversity, 2011.
39 B. Arstad, J. Prostak and R. Blom, Continuous hydrogenproduction by sorption enhanced steam methanereforming (SE-SMR) in a circulating uidized bed reactor:Sorbent to catalyst ratio dependencies, Chem. Eng. J., 2012,189–190, 413–421.
40 Y. Wang, Z. Chao, D. Chen and H. A. Jakobsen, SE-SMRprocess performance in CFB reactors: Simulation of theCO2 adsorption/desorption processes with CaO basedsorbents, Int. J. Greenhouse Gas Control, 2011, 5, 489–497.
41 N. Rodrıguez, M. Alonso and J. C. Abanades, Experimentalinvestigation of a circulating uidized-bed reactor tocapture CO2 with CaO, AIChE J., 2011, 57, 1356–1366.
RSC Adv., 2018, 8, 24209–24230 | 24229
RSC Advances Paper
Ope
n A
cces
s A
rtic
le. P
ublis
hed
on 0
5 Ju
ly 2
018.
Dow
nloa
ded
on 1
2/6/
2021
12:
33:2
6 A
M.
Thi
s ar
ticle
is li
cens
ed u
nder
a C
reat
ive
Com
mon
s A
ttrib
utio
n-N
onC
omm
erci
al 3
.0 U
npor
ted
Lic
ence
.View Article Online
42 J. Wang, Y. Wang and H. A. Jakobsen, The modeling ofcirculating uidized bed reactors for SE-SMR process andsorbent regeneration, Chem. Eng. Sci., 2014, 108, 57–65.
43 A. Di Carlo, E. Bocci, F. Zuccari and A. Dell'Era, Numericalinvestigation of sorption enhanced steam methanereforming process using computational uid dynamicsEulerian-Eulerian code, Ind. Eng. Chem. Res., 2010, 49,1561–1576.
44 T. Samruamphianskun, P. Piumsomboon andB. Chalermsinsuwan, Effect of ring baffle congurations ina circulating uidized bed riser using CFD simulation andexperimental design analysis, Chem. Eng. J., 2012, 210,237–251.
45 B. Chalermsinsuwan, T. Samruamphianskun andP. Piumsomboon, Effect of operating parameters insidecirculating uidized bed reactor riser with ring bafflesusing CFD simulation and experimental design analysis,Chem. Eng. Res. Des., 2014, 92, 2479–2492.
46 V. V. Ranade, Computational ow modeling for chemicalreactor engineering, Academic Press, UK, 2002.
47 G. H. Yeoh and J. Tu, Computational techniques for multi-phase ows, Elsevier Ltd, UK, 2010.
48 D. Gidaspow, Multiphase Flow and Fluidization: Continuumand Kinetic Theory Description, Academic Press, UK, 1994.
49 R. A. Sanchez, Z. Chao, J. Solsvik and H. A. Jakobsen, Onedimensional two-uid model simulations of the SE-SMRprocess operated in a circulating uidized bed reactor,Procedia Eng., 2012, 42, 1282–1291.
50 R. A. Sanchez, J. Solsvik and H. A. Jakobsen, Modeling andsimulation of cold ow uidized bed reactors, EnergyProcedia, 2012, 26, 22–30.
51 R. A. Sanchez, Z. Chao, J. Solsvik and H. A. Jakobsen, Aninvestigation of the heat integration between the two riserunits constituting a circulating uidized bed reactor forthe SE-SMR process, Energy Procedia, 2013, 37, 1218–1227.
52 J. Solsvik, Z. Chao and H. A. Jakobsen, A one-dimensionaltwo-uid gas–solid model applied to uidized bed reactors:The SMR and SE-SMR processes, Procedia Eng., 2012, 42,283–294.
53 J. Solsvik, Z. Chao, R. A. Sanchez and H. A. Jakobsen,Numerical investigation of steam methane reforming withCO2-capture in bubbling uidized bed reactors, FuelProcess. Technol., 2014, 125, 290–300.
54 Y. Wang, Z. Chao and H. A. Jakobsen, CFD modelling of CO2
capture in the SE-SMR process in the uidized bed reactors,Chem. Eng. Trans., 2010, 21, 601–606.
55 S. Song, Z. Hao, L. Dong, J. Li and Y. Fang, A bubble-basedEMMS model for pressurized uidization and itsvalidation with data from a jetting uidized bed, RSC Adv.,2016, 6, 111041–111051.
56 Z. Chao, Y. Wang, J. P. Jakobsen, M. Fernandino andH. A. Jakobsen, Derivation and validation of a binary
24230 | RSC Adv., 2018, 8, 24209–24230
multi-uid Eulerian model for uidized beds, Chem. Eng.Sci., 2011, 66, 3605–3616.
57 H. Lindborg, M. Lysberg and H. A. Jakobsen, Practicalvalidation of the two-uid model applied to dense gas–solid ows in uidized beds, Chem. Eng. Sci., 2007, 62,5854–5869.
58 M. J. Hodapp, J. J. Ramirez-Behainne, M. Mori andL. Goldstein Jr, Numerical studies of the gas–solidhydrodynamics at high temperature in the riser ofa bench-scale circulating uidized bed, Int. J. Chem. Eng.,2012, 2012, 786982.
59 R. A. Sanchez and H. A. Jakobsen, Simulation of sorptionenhanced steam methane reforming and chemical loopingreforming in a circulating uidized bed reactor, NinthInternational Conference on CFD in the Minerals and ProcessIndustries, CSIRO, Melbourne, Australia, 2012, pp. 1–6.
60 J. Solsvik, R. A. Sanchez, Z. Chao and H. A. Jakobsen,Simulations of steam methane reforming/sorption-enhanced steam methane reforming bubbling uidizedbed reactors by a dynamic one-dimensional two-uidmodel: Implementation issues and model validation, Ind.Eng. Chem. Res., 2013, 52, 4202–4220.
61 Y. Chen, Y. Zhao, C. Zheng and J. Zhang, Numerical study ofhydrogen production via sorption-enhanced steam methanereforming in a uidized bed reactor at relatively lowtemperature, Chem. Eng. Sci., 2013, 92, 67–80.
62 J. Xu and G. F. Froment, Methane steam reforming,methanation and water-gas shi: I.Intrinsic kinetics, AIChEJ., 1989, 35, 88–96.
63 G. Xiu, P. Li and A. E. Rodrigues, Sorption-enhanced reactionprocess with reactive regeneration, Chem. Eng. Sci., 2002, 57,3893–3908.
64 P. Sun, J. R. Grace, C. J. Lim and E. J. Anthony,Determination of intrinsic rate constants of the CaO–CO2
reaction, Chem. Eng. Sci., 2008, 63, 47–56.65 J. C. Abanades, E. J. Anthony, D. Y. Lu, C. Salvador and
D. Alvarez, Capture of CO2 from combustion gases ina uidized bed of CaO, AIChE J., 2004, 50, 1614–1622.
66 J. S. Lin, M. M. Chen and B. T. Chao, A novel radioactiveparticle tracking facility for measurement of solids motionin gas uidized beds, AIChE J., 1985, 31, 465–473.
67 D. C. Montgomery, Design and Analysis of Experiments, JohnWiley and Sons, USA, 2012.
68 D. Kunii and O. Levenspiel, Circulating uidized-bedreactors, Chem. Eng. Sci., 1997, 52, 2471–2482.
69 S. Mahmoudi, C. W. Chan, A. Brems, J. Seville andJ. Baeyens, Solids ow diagram of a CFB riser usingGeldart B-type powders, Particuology, 2012, 10, 51–61.
70 J. Zhu, Circulating turbulent uidization-A new uidizationregime or just a transitional phenomenon, Particuology,2010, 8, 640–644.
This journal is © The Royal Society of Chemistry 2018