Embed Size (px)
Citation preview

Academic Affairs Division
Lynold K. McGhee Assistant Provost for
Research and Planning
Factbook Fall 2009

Table o
f Conten
ts
3
Section 1. Overview
University Administration Officers ......................................................................................... 5
Affirmative Action Policy ........................................................................................................ 5
Fee Schedule .......................................................................................................................... 6
Profile: Admissions, Enrollment, Ethnicity, Gender, Age ....................................................... 7
Degree Programs Offered ...................................................................................................... 8
Most Popular Majors .............................................................................................................. 9
Enrollment Credit Hours and Full‐time Equivalent (FTE) ....................................................... 9
Physical Facilities .................................................................................................................. 10
Degrees Awarded 2008‐2009 ............................................................................................... 12
Employee Statistics .............................................................................................................. 12
Official Fall Freeze Dates ...................................................................................................... 12
Housing................................................................................................................................. 12
Operating Budget ................................................................................................................. 13
Rohrbach Library .................................................................................................................. 13
Accreditations and Approvals .............................................................................................. 13
Section 2. Admissions
First‐time Degree Seeking Freshmen by College .................................................................. 14
First‐time Degree Seeking Freshmen by Ethnicity ............................................................... 15
First‐time Degree Seeking Transfers by Ethnicity ................................................................ 16
First‐time Freshmen and Transfer Applicants by College and Major ................................... 17
Profile of Enrolled First‐time, Full‐time Degree Seeking Freshmen (SATs) .......................... 21
Section 3. Enrollment
Fall Enrollment Credit Hours and FTE .................................................................................. 22
Spring Enrollment Credit Hours and FTE .............................................................................. 23
Fall Undergraduate Enrollment by Status ............................................................................ 24
Spring Undergraduate Enrollment by Status ....................................................................... 25
Fall Enrollment by Class ........................................................................................................ 26
Spring Enrollment by Class ................................................................................................... 27
Fall Enrollment by College and Major .................................................................................. 28
Fall Enrollment by Ethnicity – Females ................................................................................ 35
Fall Enrollment by Ethnicity – Males .................................................................................... 36
Fall Enrollment by Ethnicity – All Students .......................................................................... 37
Fall Undergraduate Enrollment by Age and Gender ............................................................ 38
Fall Graduate and Instructional Certification Enrollment by Age and Gender .................... 39
Fall Enrollment – Mean and Median Age ............................................................................. 40
Fall Undergraduate Enrollment by County ........................................................................... 41
Fall Undergraduate Enrollment by State .............................................................................. 43
Fall Undergraduate Enrollment by Country ......................................................................... 44
Fall Graduate and Instructional Certification Enrollment by County ................................... 46
Fall Graduate and Instructional Certification Enrollment by State and Country ................. 47
Table of Contents
4
Section 4. Degrees Awarded
Degrees Awarded by College and Major .............................................................................. 48
Graduated Students by Ethnicity – Females ........................................................................ 53
Graduated Students by Ethnicity – Males ............................................................................ 54
Graduated Students by Ethnicity – All Students .................................................................. 55
Section 5. Staff Statistics
FTE of Active Staff by EEO6 Code within Division/Department ........................................... 56
Staff Ethnicity within Division/Department ......................................................................... 60
Staff by Gender and Ethnicity within EEO6 Code ................................................................. 63
Staff by Gender and Highest Degree within EEO6 Code ...................................................... 64
Faculty by Gender and Tenure Track within Rank ................................................................ 65
Faculty by Gender and Tenure Track within Highest Degree ............................................... 66
Faculty by Gender and Ethnicity within Tenure Track Status............................................... 66
Section 6. Financial Information
Revenue and Expenditures ................................................................................................... 67
Overview
5
Kutztown University of Pennsylvania Vision
Kutztown University will serve the Commonwealth as a dynamic, technologically advanced,
collaborative, learning‐centered public university. Kutztown University will be accessible to
Pennsylvanians and others, sensitive to the need for diverse backgrounds in its faculty,
staff, students, and community, accountable to its many constituencies, and actively
engaged in the continuous improvement of its programs and services. Above all, Kutztown
University will prepare graduates to succeed in a global economy, to contribute to the
economic and social well being of the state and nation, to assume active roles in their
communities and to lead productive and meaningful lives.
University History
Kutztown University of Pennsylvania began as Keystone State Normal School on September
7, 1866. Since then the school has changed names with its changing responsibilities. On
May 29, 1928 the name changed to Kutztown State Teachers College to celebrate its status
as a leading trainer of teachers, and in January of 1960 when its curriculum was updated to
include wider liberal arts programs, its name was changed to Kutztown State College. On
July 1, 1983 the State System of Higher Education was formed with the thirteen other state
colleges, and the school's name changed to Kutztown University of Pennsylvania.
Location
The borough of Kutztown is located in Berks County in southeastern Pennsylvania.
Kutztown is midway between Reading and Allentown. The town is approximately 2 hours
from New York City, 1.5 hours from Philadelphia and Harrisburg, and 3 hours from
Baltimore/ Washington, DC.
Kutztown University of Pennsylvania—Officers of Administration
Cabinet
Dr. F. Javier Cevallos, President
Dr. Carlos Vargas‐Aburto, Provost and Vice President for Academic Affairs
Mr. Gerald L. Silberman, Vice President for Administration and Finance
Dr. Prudence S. Precourt, Vice President for University Advancement
Dr. Charles J. Woodard, Vice President for Student Services and Campus Life
Ms. Barbara M. Taliaferro, Associate Vice President for Diversity and Inclusion
Mr. Matthew Santos, Interim Director, University Relations
Mr. Jesús A. Peña, Esq., Associate Vice President for Equity and Compliance
Affirmative Action Policy
Kutztown University is committed to providing equal education and employment
opportunities for all persons without regard to race, ethnicity, gender, age, national origin,
religion, sexual orientation, disability, and veteran status. The University is committed to a
policy of affirmative action as an affirmation of the role of higher education in bringing
about positive social change, enhancing diversity, and inclusivity.
Fee Sched
ule
6
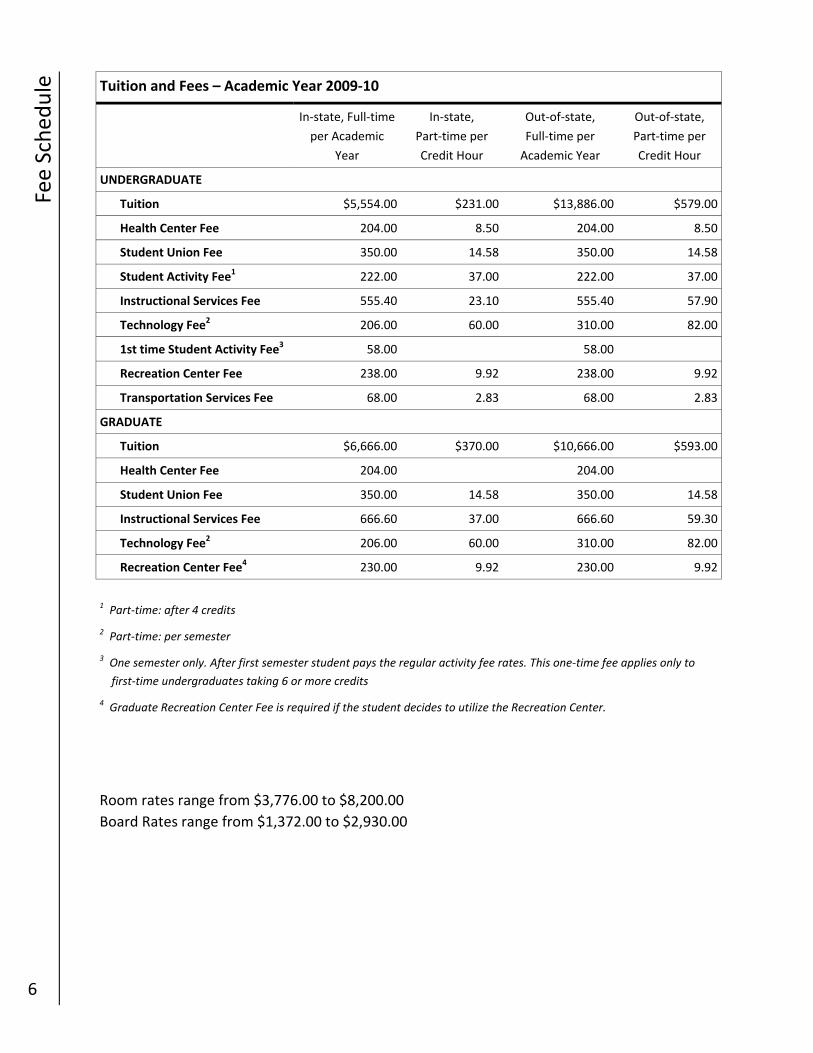
1 Part‐time: after 4 credits
2 Part‐time: per semester
3 One semester only. After first semester student pays the regular activity fee rates. This one‐time fee applies only to
first‐time undergraduates taking 6 or more credits
4 Graduate Recreation Center Fee is required if the student decides to utilize the Recreation Center.
Room rates range from $3,776.00 to $8,200.00
Board Rates range from $1,372.00 to $2,930.00
In‐state, Full‐time
per Academic
Year
In‐state,
Part‐time per
Credit Hour
Out‐of‐state,
Full‐time per
Academic Year
Out‐of‐state,
Part‐time per
Credit Hour
UNDERGRADUATE
Tuition $5,554.00 $231.00 $13,886.00 $579.00
Health Center Fee 204.00 8.50 204.00 8.50
Student Union Fee 350.00 14.58 350.00 14.58
Student Activity Fee1 222.00 37.00 222.00 37.00
Instructional Services Fee 555.40 23.10 555.40 57.90
Technology Fee2 206.00 60.00 310.00 82.00
1st time Student Activity Fee3 58.00 58.00
Recreation Center Fee 238.00 9.92 238.00 9.92
Transportation Services Fee 68.00 2.83 68.00 2.83
GRADUATE
Tuition $6,666.00 $370.00 $10,666.00 $593.00
Student Union Fee 350.00 14.58 350.00 14.58
Instructional Services Fee 666.60 37.00 666.60 59.30
Technology Fee2 206.00 60.00 310.00 82.00
Tuition and Fees – Academic Year 2009‐10
Health Center Fee 204.00 204.00
Recreation Center Fee4 230.00 9.92 230.00 9.92
Studen
t Profile
7
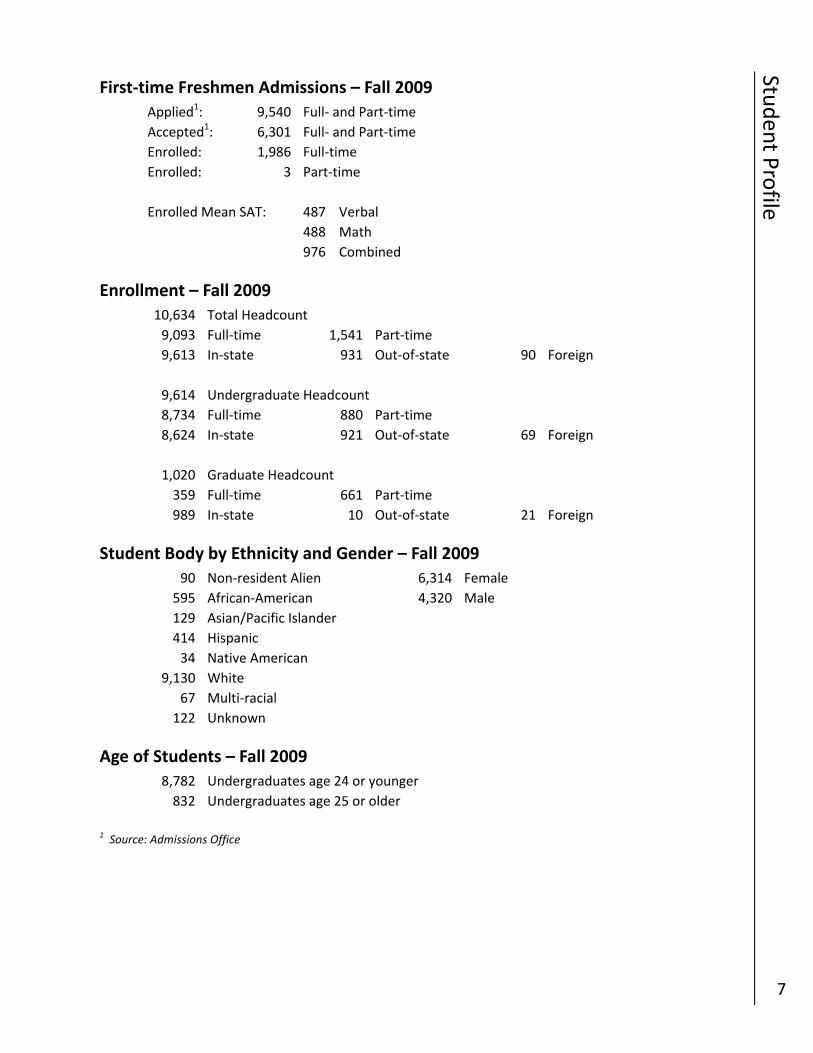
First‐time Freshmen Admissions – Fall 2009
Applied1: 9,540 Full‐ and Part‐time
Accepted1: 6,301 Full‐ and Part‐time
Enrolled: 1,986 Full‐time
Enrolled: 3 Part‐time
Enrolled Mean SAT: 487 Verbal
488 Math
976 Combined
Enrollment – Fall 2009
10,634 Total Headcount
9,093 Full‐time 1,541 Part‐time
9,613 In‐state 931 Out‐of‐state 90 Foreign
9,614 Undergraduate Headcount
8,734 Full‐time 880 Part‐time
8,624 In‐state 921 Out‐of‐state 69 Foreign
1,020 Graduate Headcount
359 Full‐time 661 Part‐time
989 In‐state 10 Out‐of‐state 21 Foreign
Student Body by Ethnicity and Gender – Fall 2009
90 Non‐resident Alien 6,314 Female
595 African‐American 4,320 Male
129 Asian/Pacific Islander
414 Hispanic
34 Native American
9,130 White
67 Multi‐racial
122 Unknown
Age of Students – Fall 2009
8,782 Undergraduates age 24 or younger
832 Undergraduates age 25 or older
1 Source: Admissions Office
Degree Program
s
8
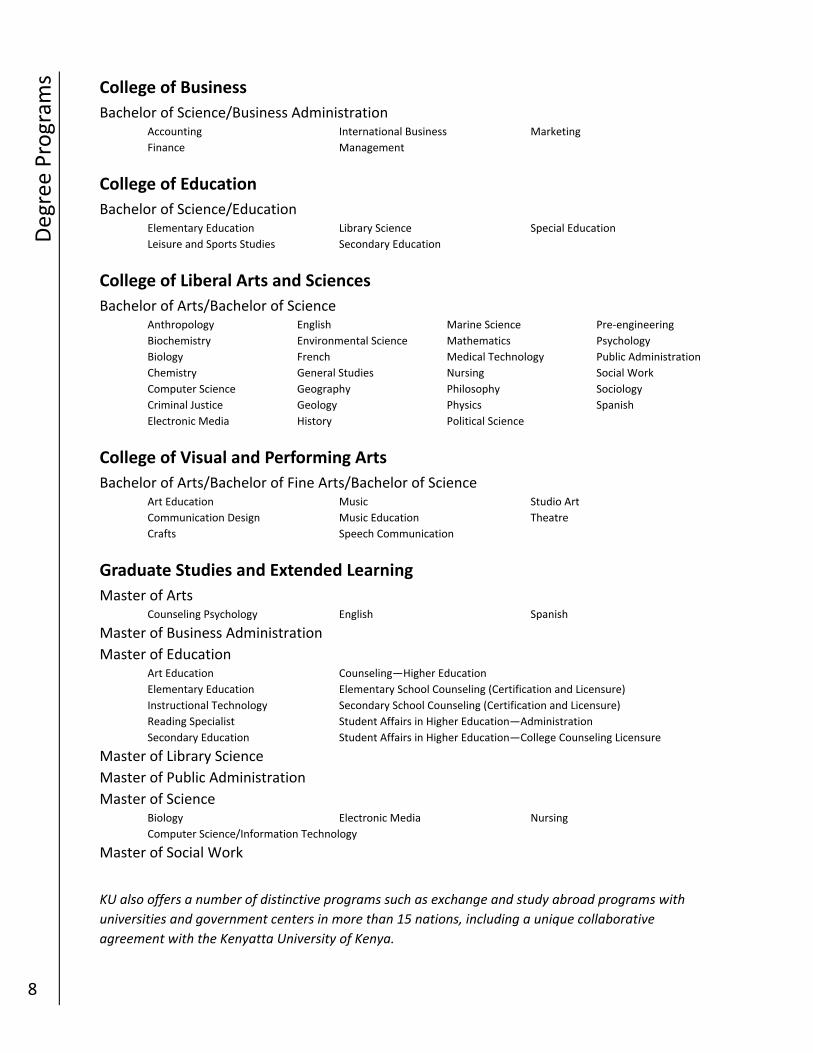
College of Business
Bachelor of Science/Business Administration Accounting International Business Marketing
Finance Management
College of Education
Bachelor of Science/Education Elementary Education Library Science Special Education
Leisure and Sports Studies Secondary Education
College of Liberal Arts and Sciences
Bachelor of Arts/Bachelor of Science Anthropology English Marine Science Pre‐engineering
Biochemistry Environmental Science Mathematics Psychology
Biology French Medical Technology Public Administration
Chemistry General Studies Nursing Social Work
Computer Science Geography Philosophy Sociology
Criminal Justice Geology Physics Spanish
Electronic Media History Political Science
College of Visual and Performing Arts
Bachelor of Arts/Bachelor of Fine Arts/Bachelor of Science Art Education Music Studio Art
Communication Design Music Education Theatre
Crafts Speech Communication
Graduate Studies and Extended Learning
Master of Arts Counseling Psychology English Spanish
Master of Business Administration
Master of Education Art Education Counseling—Higher Education
Elementary Education Elementary School Counseling (Certification and Licensure)
Instructional Technology Secondary School Counseling (Certification and Licensure)
Reading Specialist Student Affairs in Higher Education—Administration
Secondary Education Student Affairs in Higher Education—College Counseling Licensure
Master of Library Science
Master of Public Administration
Master of Science Biology Electronic Media Nursing
Computer Science/Information Technology
Master of Social Work
KU also offers a number of distinctive programs such as exchange and study abroad programs with
universities and government centers in more than 15 nations, including a unique collaborative
agreement with the Kenyatta University of Kenya.
Popular M
ajors
9
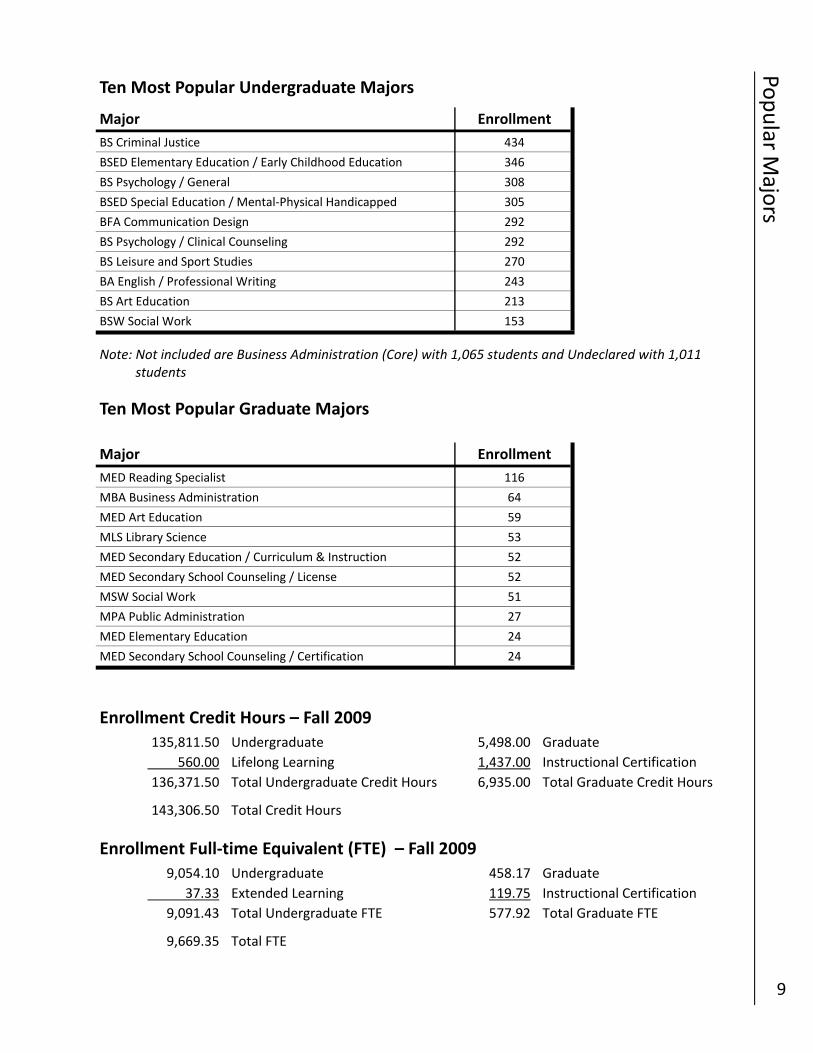
Ten Most Popular Undergraduate Majors
Note: Not included are Business Administration (Core) with 1,065 students and Undeclared with 1,011 students
Ten Most Popular Graduate Majors
Enrollment Credit Hours – Fall 2009
135,811.50 Undergraduate 5,498.00 Graduate
560.00 Lifelong Learning 1,437.00 Instructional Certification
136,371.50 Total Undergraduate Credit Hours 6,935.00 Total Graduate Credit Hours
143,306.50 Total Credit Hours
Enrollment Full‐time Equivalent (FTE) – Fall 2009
9,054.10 Undergraduate 458.17 Graduate
37.33 Extended Learning 119.75 Instructional Certification
9,091.43 Total Undergraduate FTE 577.92 Total Graduate FTE
9,669.35 Total FTE
Major Enrollment
BS Criminal Justice 434
BSED Elementary Education / Early Childhood Education 346
BS Psychology / General 308
BSED Special Education / Mental‐Physical Handicapped 305
BFA Communication Design 292
BS Psychology / Clinical Counseling 292
BS Leisure and Sport Studies 270
BA English / Professional Writing 243
BS Art Education 213
BSW Social Work 153
Major Enrollment
MED Reading Specialist 116
MBA Business Administration 64
MED Art Education 59
MLS Library Science 53
MED Secondary Education / Curriculum & Instruction 52
MED Secondary School Counseling / License 52
MSW Social Work 51
MPA Public Administration 27
MED Elementary Education 24
MED Secondary School Counseling / Certification 24
Physical Facilities
10
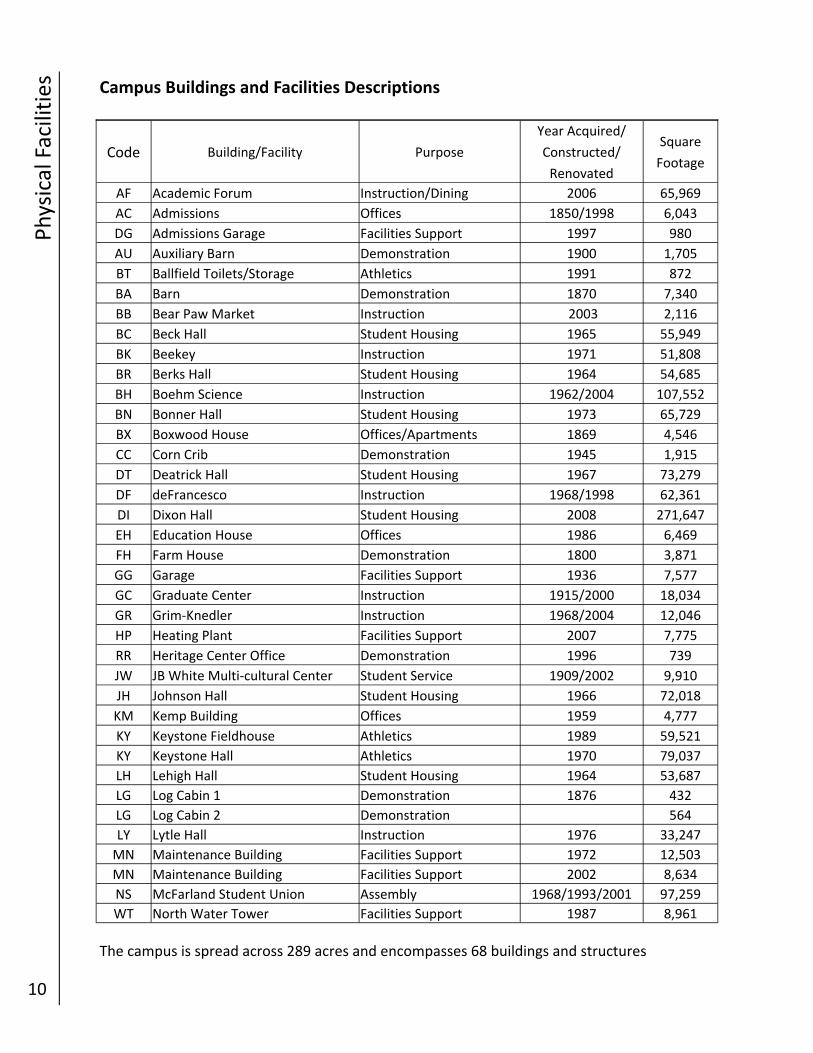
Campus Buildings and Facilities Descriptions
The campus is spread across 289 acres and encompasses 68 buildings and structures
Code Building/Facility Purpose
Year Acquired/
Constructed/
Renovated
Square
Footage
AF Academic Forum Instruction/Dining 2006 65,969
AC Admissions Offices 1850/1998 6,043
DG Admissions Garage Facilities Support 1997 980
AU Auxiliary Barn Demonstration 1900 1,705
BT Ballfield Toilets/Storage Athletics 1991 872
BA Barn Demonstration 1870 7,340
BB Bear Paw Market Instruction 2003 2,116
BC Beck Hall Student Housing 1965 55,949
BK Beekey Instruction 1971 51,808
BR Berks Hall Student Housing 1964 54,685
BH Boehm Science Instruction 1962/2004 107,552
BN Bonner Hall Student Housing 1973 65,729
BX Boxwood House Offices/Apartments 1869 4,546
CC Corn Crib Demonstration 1945 1,915
DT Deatrick Hall Student Housing 1967 73,279
DF deFrancesco Instruction 1968/1998 62,361
DI Dixon Hall Student Housing 2008 271,647
EH Education House Offices 1986 6,469
FH Farm House Demonstration 1800 3,871
GG Garage Facilities Support 1936 7,577
GC Graduate Center Instruction 1915/2000 18,034
GR Grim‐Knedler Instruction 1968/2004 12,046
HP Heating Plant Facilities Support 2007 7,775
RR Heritage Center Office Demonstration 1996 739
JW JB White Multi‐cultural Center Student Service 1909/2002 9,910
JH Johnson Hall Student Housing 1966 72,018
KM Kemp Building Offices 1959 4,777
KY Keystone Fieldhouse Athletics 1989 59,521
KY Keystone Hall Athletics 1970 79,037
LH Lehigh Hall Student Housing 1964 53,687
LG Log Cabin 1 Demonstration 1876 432
LG Log Cabin 2 Demonstration 564
LY Lytle Hall Instruction 1976 33,247
MN Maintenance Building Facilities Support 1972 12,503
MN Maintenance Building Facilities Support 2002 8,634
NS McFarland Student Union Assembly 1968/1993/2001 97,259
WT North Water Tower Facilities Support 1987 8,961
Physical Facilities
11
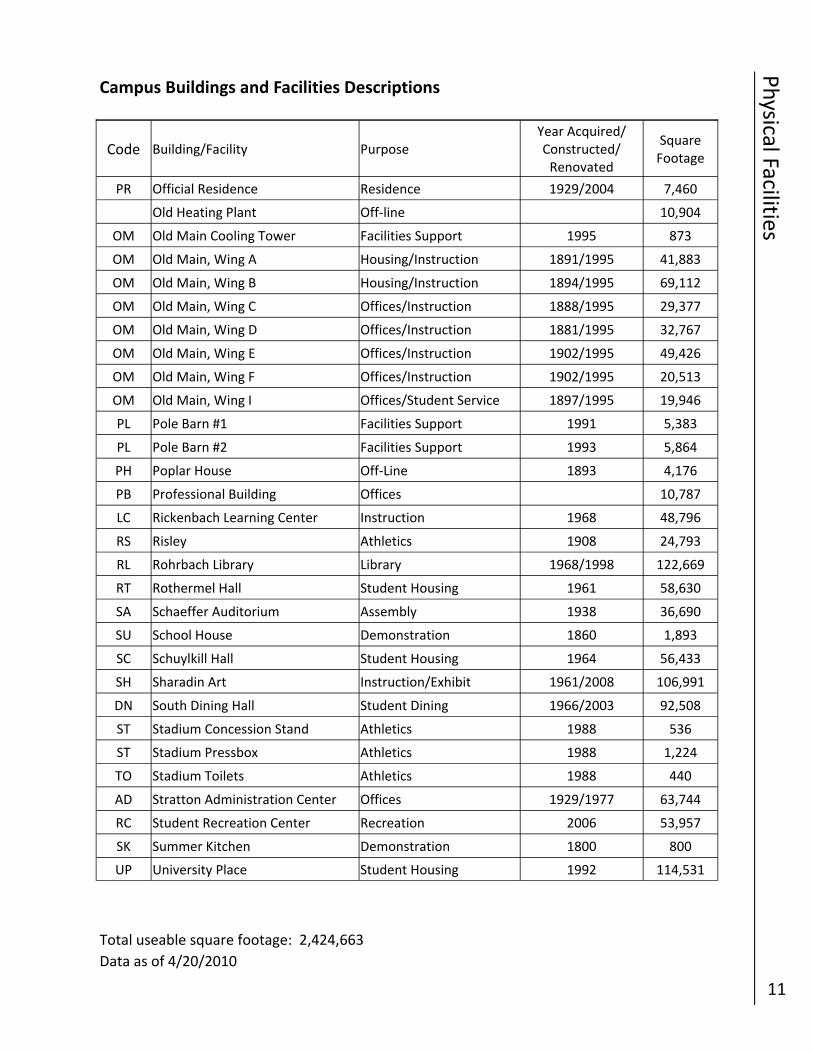
Campus Buildings and Facilities Descriptions
Total useable square footage: 2,424,663
Data as of 4/20/2010
Code Building/Facility Purpose Year Acquired/Constructed/Renovated
Square Footage
Old Heating Plant Off‐line 10,904
OM Old Main Cooling Tower Facilities Support 1995 873
OM Old Main, Wing A Housing/Instruction 1891/1995 41,883
OM Old Main, Wing B Housing/Instruction 1894/1995 69,112
OM Old Main, Wing C Offices/Instruction 1888/1995 29,377
OM Old Main, Wing D Offices/Instruction 1881/1995 32,767
OM Old Main, Wing E Offices/Instruction 1902/1995 49,426
OM Old Main, Wing F Offices/Instruction 1902/1995 20,513
OM Old Main, Wing I Offices/Student Service 1897/1995 19,946
PL Pole Barn #1 Facilities Support 1991 5,383
PL Pole Barn #2 Facilities Support 1993 5,864
PH Poplar House Off‐Line 1893 4,176
PB Professional Building Offices 10,787
LC Rickenbach Learning Center Instruction 1968 48,796
RS Risley Athletics 1908 24,793
RL Rohrbach Library Library 1968/1998 122,669
RT Rothermel Hall Student Housing 1961 58,630
SA Schaeffer Auditorium Assembly 1938 36,690
SU School House Demonstration 1860 1,893
SC Schuylkill Hall Student Housing 1964 56,433
SH Sharadin Art Instruction/Exhibit 1961/2008 106,991
DN South Dining Hall Student Dining 1966/2003 92,508
ST Stadium Concession Stand Athletics 1988 536
ST Stadium Pressbox Athletics 1988 1,224
TO Stadium Toilets Athletics 1988 440
AD Stratton Administration Center Offices 1929/1977 63,744
RC Student Recreation Center Recreation 2006 53,957
SK Summer Kitchen Demonstration 1800 800
UP University Place Student Housing 1992 114,531
PR Official Residence Residence 1929/2004 7,460
Overview
12
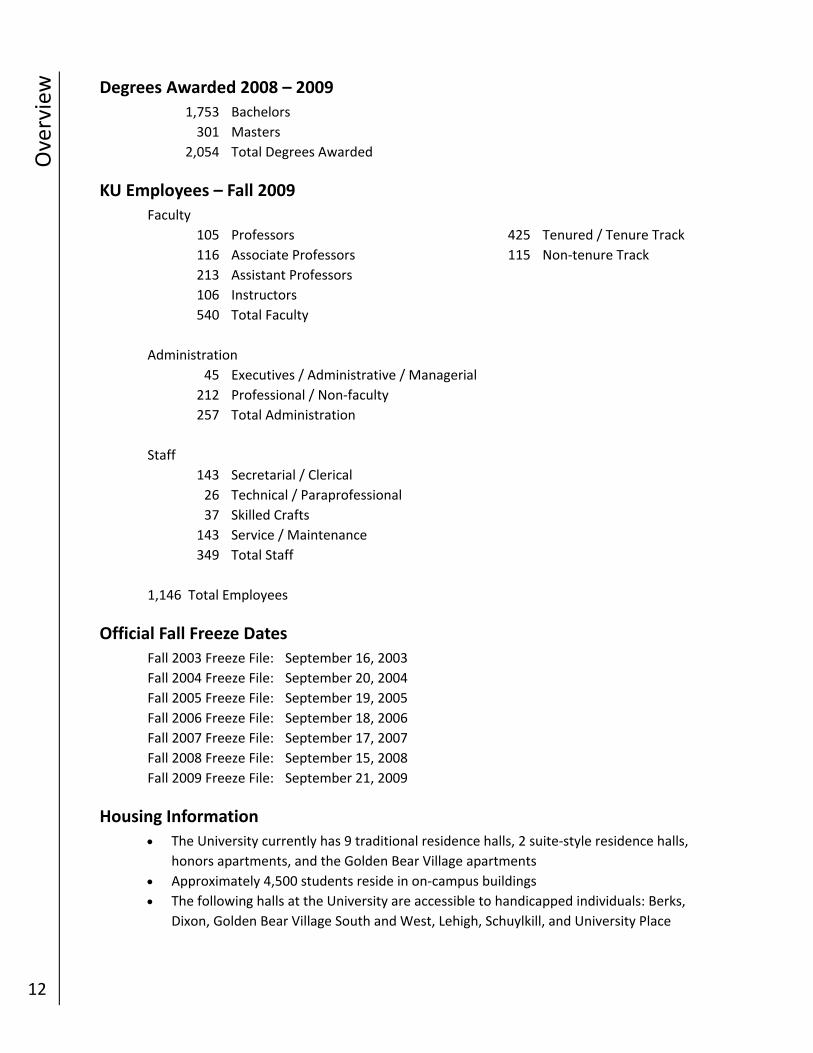
Degrees Awarded 2008 – 2009
1,753 Bachelors
301 Masters
2,054 Total Degrees Awarded
KU Employees – Fall 2009
Faculty
105 Professors 425 Tenured / Tenure Track
116 Associate Professors 115 Non‐tenure Track
213 Assistant Professors
106 Instructors
540 Total Faculty
Administration
45 Executives / Administrative / Managerial
212 Professional / Non‐faculty
257 Total Administration
Staff
143 Secretarial / Clerical
26 Technical / Paraprofessional
37 Skilled Crafts
143 Service / Maintenance
349 Total Staff
1,146 Total Employees
Official Fall Freeze Dates
Fall 2003 Freeze File: September 16, 2003
Fall 2004 Freeze File: September 20, 2004
Fall 2005 Freeze File: September 19, 2005
Fall 2006 Freeze File: September 18, 2006
Fall 2007 Freeze File: September 17, 2007
Fall 2008 Freeze File: September 15, 2008
Fall 2009 Freeze File: September 21, 2009
Housing Information
The University currently has 9 traditional residence halls, 2 suite‐style residence halls,
honors apartments, and the Golden Bear Village apartments
Approximately 4,500 students reside in on‐campus buildings
The following halls at the University are accessible to handicapped individuals: Berks,
Dixon, Golden Bear Village South and West, Lehigh, Schuylkill, and University Place
Overview
13
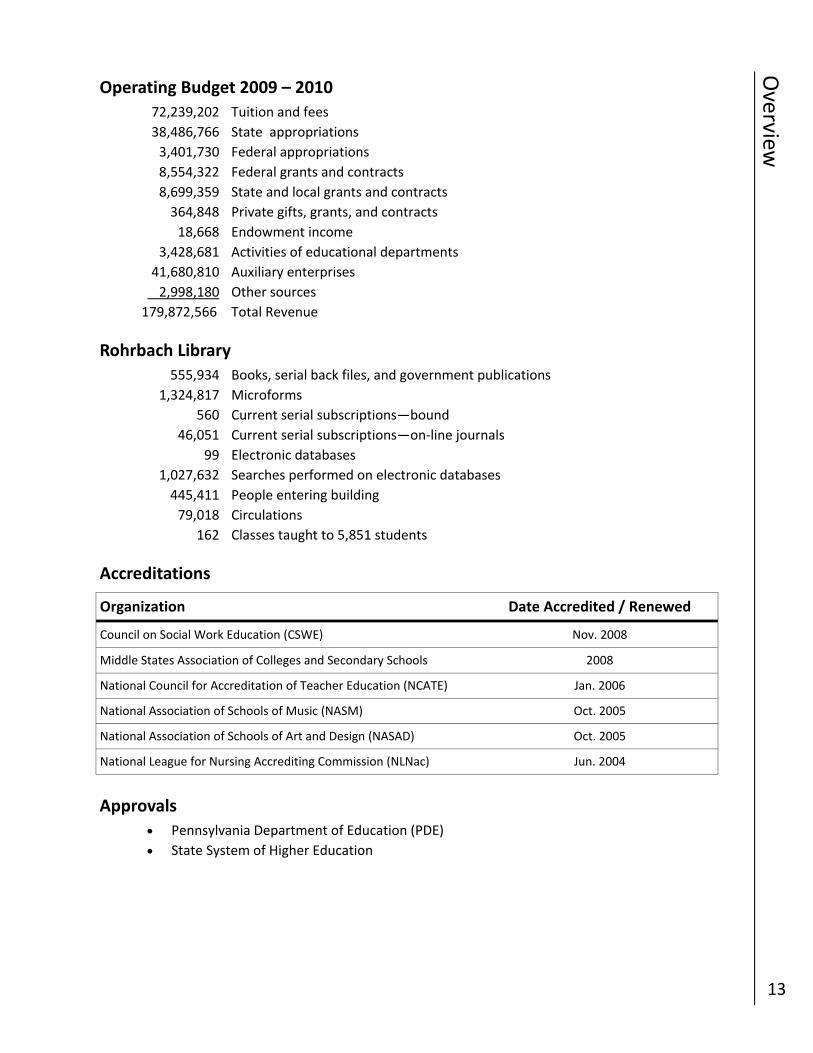
Operating Budget 2009 – 2010
72,239,202 Tuition and fees
38,486,766 State appropriations
3,401,730 Federal appropriations
8,554,322 Federal grants and contracts
8,699,359 State and local grants and contracts
364,848 Private gifts, grants, and contracts
18,668 Endowment income
3,428,681 Activities of educational departments
41,680,810 Auxiliary enterprises
2,998,180 Other sources
179,872,566 Total Revenue
Rohrbach Library
555,934 Books, serial back files, and government publications
1,324,817 Microforms
560 Current serial subscriptions—bound
46,051 Current serial subscriptions—on‐line journals
99 Electronic databases
1,027,632 Searches performed on electronic databases
445,411 People entering building
79,018 Circulations
162 Classes taught to 5,851 students
Accreditations
Approvals
Pennsylvania Department of Education (PDE)
State System of Higher Education
Organization Date Accredited / Renewed
Council on Social Work Education (CSWE) Nov. 2008
Middle States Association of Colleges and Secondary Schools 2008
National Council for Accreditation of Teacher Education (NCATE) Jan. 2006
National Association of Schools of Music (NASM) Oct. 2005
National Association of Schools of Art and Design (NASAD) Oct. 2005
National League for Nursing Accrediting Commission (NLNac) Jun. 2004
Admissions
14
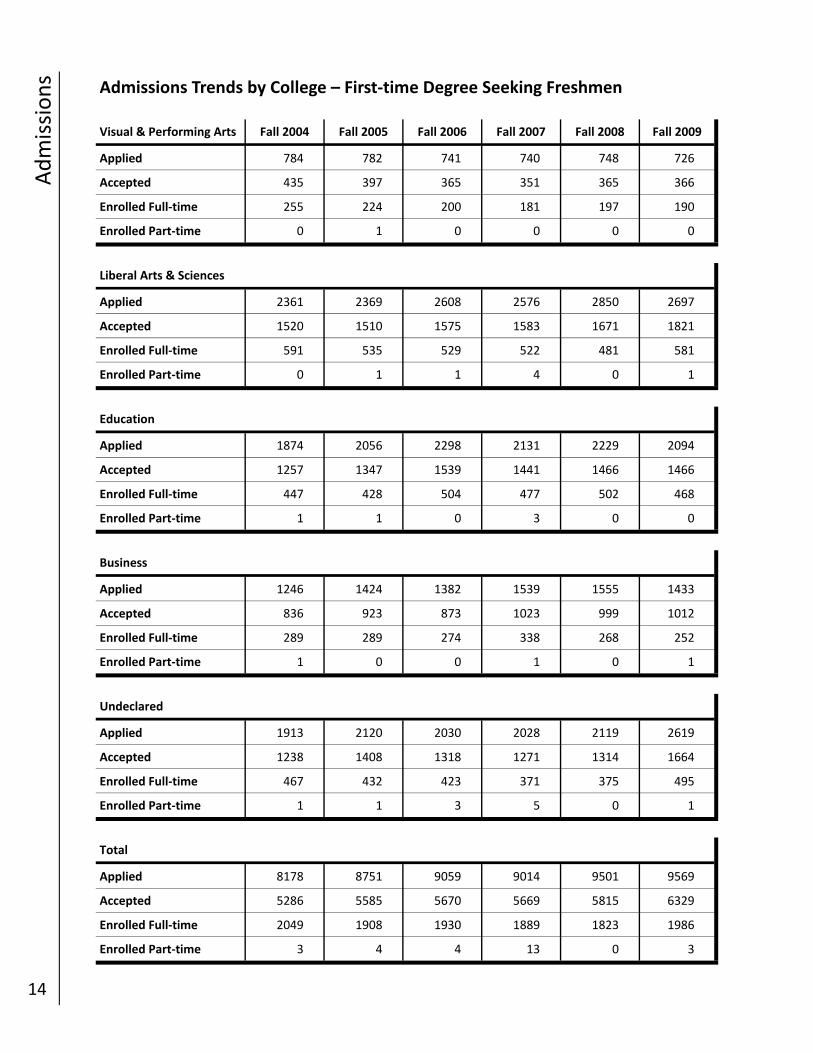
Admissions Trends by College – First‐time Degree Seeking Freshmen
Applied 2361 2369 2608 2576 2850 2697
Accepted 1520 1510 1575 1583 1671 1821
Enrolled Full‐time 591 535 529 522 481 581
Enrolled Part‐time 0 1 1 4 0 1
Liberal Arts & Sciences
Applied 1874 2056 2298 2131 2229 2094
Accepted 1257 1347 1539 1441 1466 1466
Enrolled Full‐time 447 428 504 477 502 468
Enrolled Part‐time 1 1 0 3 0 0
Education
Applied 1246 1424 1382 1539 1555 1433
Accepted 836 923 873 1023 999 1012
Enrolled Full‐time 289 289 274 338 268 252
Enrolled Part‐time 1 0 0 1 0 1
Business
Applied 1913 2120 2030 2028 2119 2619
Accepted 1238 1408 1318 1271 1314 1664
Enrolled Full‐time 467 432 423 371 375 495
Enrolled Part‐time 1 1 3 5 0 1
Undeclared
Applied 8178 8751 9059 9014 9501 9569
Accepted 5286 5585 5670 5669 5815 6329
Enrolled Full‐time 2049 1908 1930 1889 1823 1986
Enrolled Part‐time 3 4 4 13 0 3
Total
Visual & Performing Arts Fall 2004 Fall 2005 Fall 2006 Fall 2007 Fall 2008 Fall 2009
Applied 784 782 741 740 748 726
Accepted 435 397 365 351 365 366
Enrolled Full‐time 255 224 200 181 197 190
Enrolled Part‐time 0 1 0 0 0 0
Admissio
ns
15
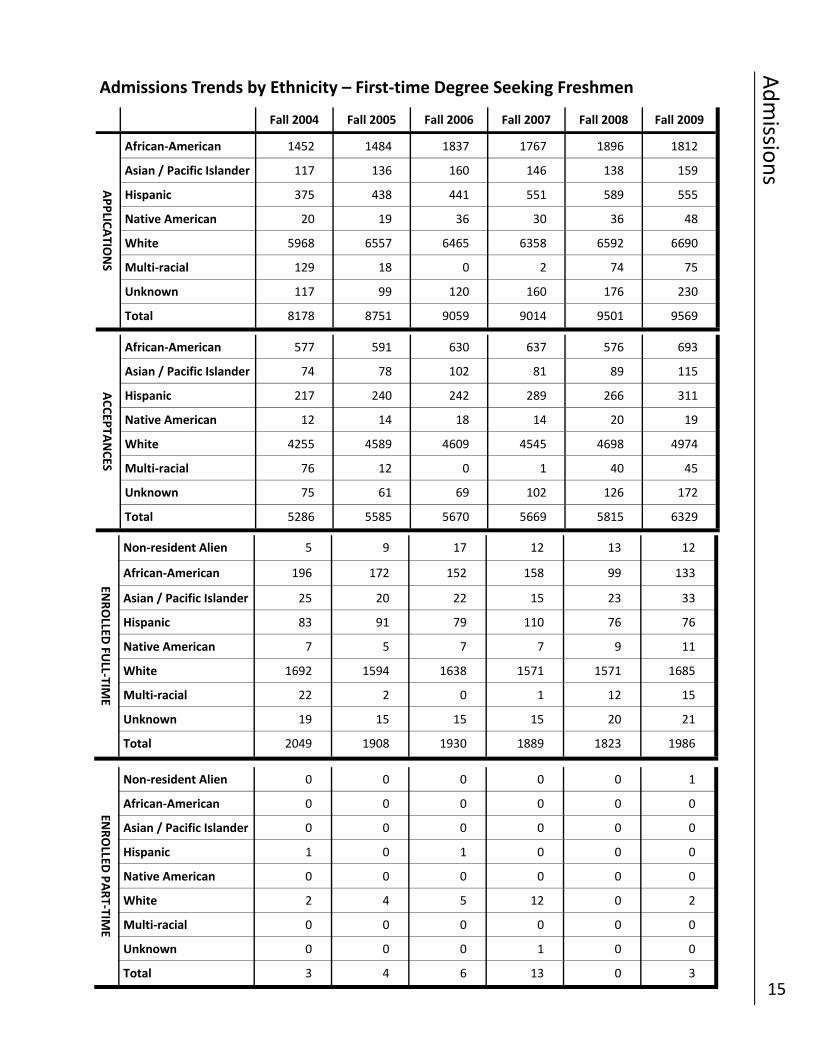
Admissions Trends by Ethnicity – First‐time Degree Seeking Freshmen
Fall 2004 Fall 2005 Fall 2006 Fall 2007 Fall 2008 Fall 2009
African‐American 1452 1484 1837 1767 1896 1812
Asian / Pacific Islander 117 136 160 146 138 159
Hispanic 375 438 441 551 589 555
Native American 20 19 36 30 36 48
White 5968 6557 6465 6358 6592 6690
Multi‐racial 129 18 0 2 74 75
Unknown 117 99 120 160 176 230
Total 8178 8751 9059 9014 9501 9569
APPLIC
ATIO
NS
African‐American 577 591 630 637 576 693
Asian / Pacific Islander 74 78 102 81 89 115
Hispanic 217 240 242 289 266 311
Native American 12 14 18 14 20 19
White 4255 4589 4609 4545 4698 4974
Multi‐racial 76 12 0 1 40 45
Unknown 75 61 69 102 126 172
Total 5286 5585 5670 5669 5815 6329
ACCEP
TANCES
African‐American 196 172 152 158 99 133
Asian / Pacific Islander 25 20 22 15 23 33
Hispanic 83 91 79 110 76 76
Native American 7 5 7 7 9 11
White 1692 1594 1638 1571 1571 1685
Multi‐racial 22 2 0 1 12 15
Unknown 19 15 15 15 20 21
Total 2049 1908 1930 1889 1823 1986
ENROLLED
FULL‐TIM
E
Non‐resident Alien 5 9 17 12 13 12
African‐American 0 0 0 0 0 0
Asian / Pacific Islander 0 0 0 0 0 0
Hispanic 1 0 1 0 0 0
Native American 0 0 0 0 0 0
White 2 4 5 12 0 2
Multi‐racial 0 0 0 0 0 0
Unknown 0 0 0 1 0 0
Total 3 4 6 13 0 3
ENROLLED
PART‐TIM
E
Non‐resident Alien 0 0 0 0 0 1
Admissions
16
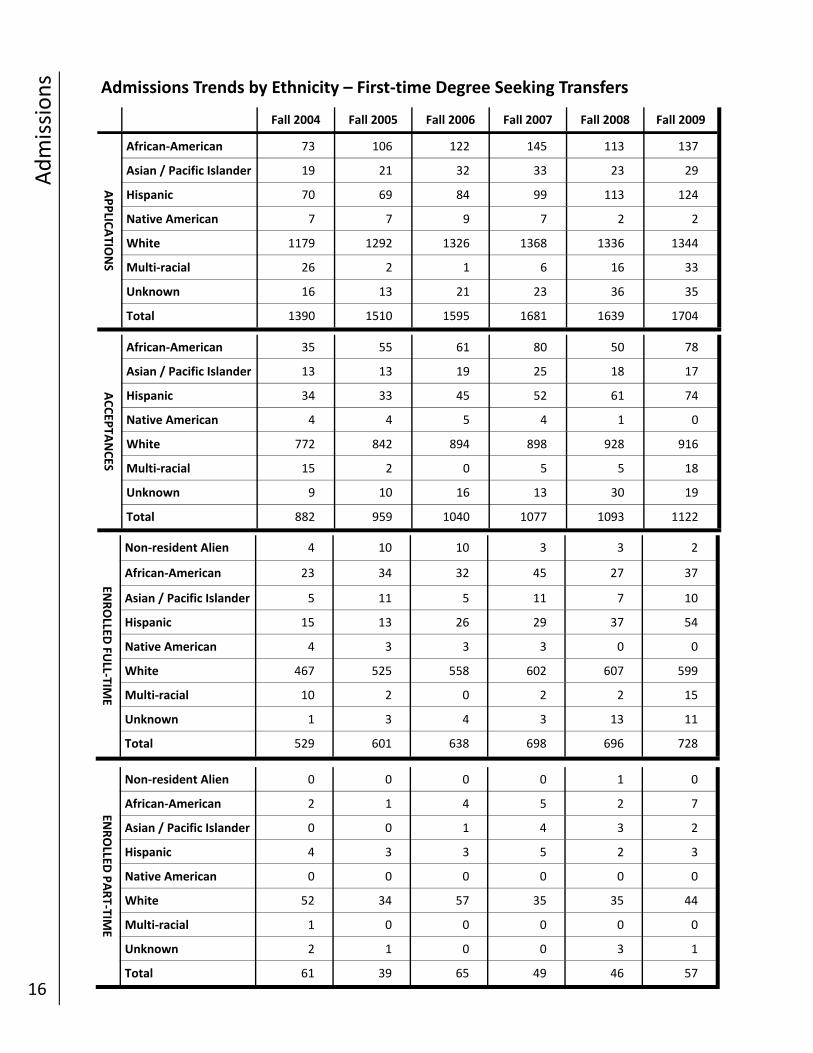
Admissions Trends by Ethnicity – First‐time Degree Seeking Transfers
Fall 2004 Fall 2005 Fall 2006 Fall 2007 Fall 2008 Fall 2009
African‐American 73 106 122 145 113 137
Asian / Pacific Islander 19 21 32 33 23 29
Hispanic 70 69 84 99 113 124
Native American 7 7 9 7 2 2
White 1179 1292 1326 1368 1336 1344
Multi‐racial 26 2 1 6 16 33
Unknown 16 13 21 23 36 35
Total 1390 1510 1595 1681 1639 1704
APPLIC
ATIO
NS
African‐American 35 55 61 80 50 78
Asian / Pacific Islander 13 13 19 25 18 17
Hispanic 34 33 45 52 61 74
Native American 4 4 5 4 1 0
White 772 842 894 898 928 916
Multi‐racial 15 2 0 5 5 18
Unknown 9 10 16 13 30 19
Total 882 959 1040 1077 1093 1122
ACCEP
TANCES
African‐American 23 34 32 45 27 37
Asian / Pacific Islander 5 11 5 11 7 10
Hispanic 15 13 26 29 37 54
Native American 4 3 3 3 0 0
White 467 525 558 602 607 599
Multi‐racial 10 2 0 2 2 15
Unknown 1 3 4 3 13 11
Total 529 601 638 698 696 728
ENROLLED
FULL‐TIM
E
Non‐resident Alien 4 10 10 3 3 2
African‐American 2 1 4 5 2 7
Asian / Pacific Islander 0 0 1 4 3 2
Hispanic 4 3 3 5 2 3
Native American 0 0 0 0 0 0
White 52 34 57 35 35 44
Multi‐racial 1 0 0 0 0 0
Unknown 2 1 0 0 3 1
Total 61 39 65 49 46 57
ENROLLED
PART‐TIM
E
Non‐resident Alien 0 0 0 0 1 0
Admissio
ns
17
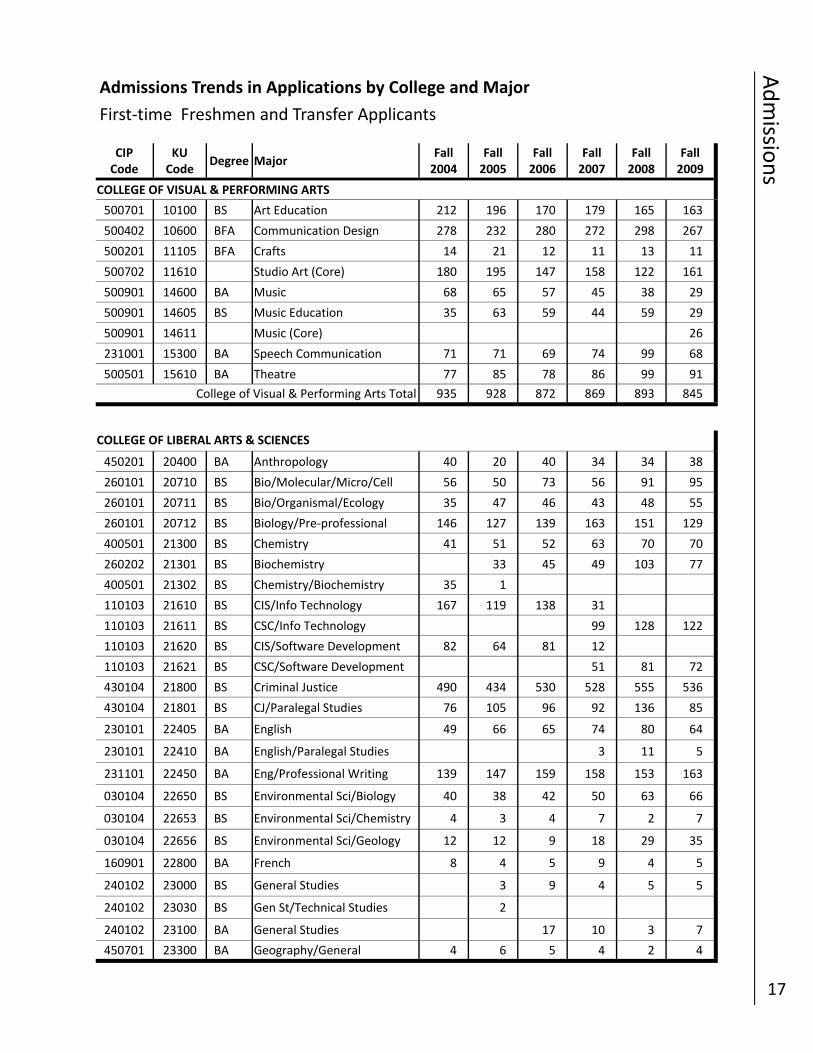
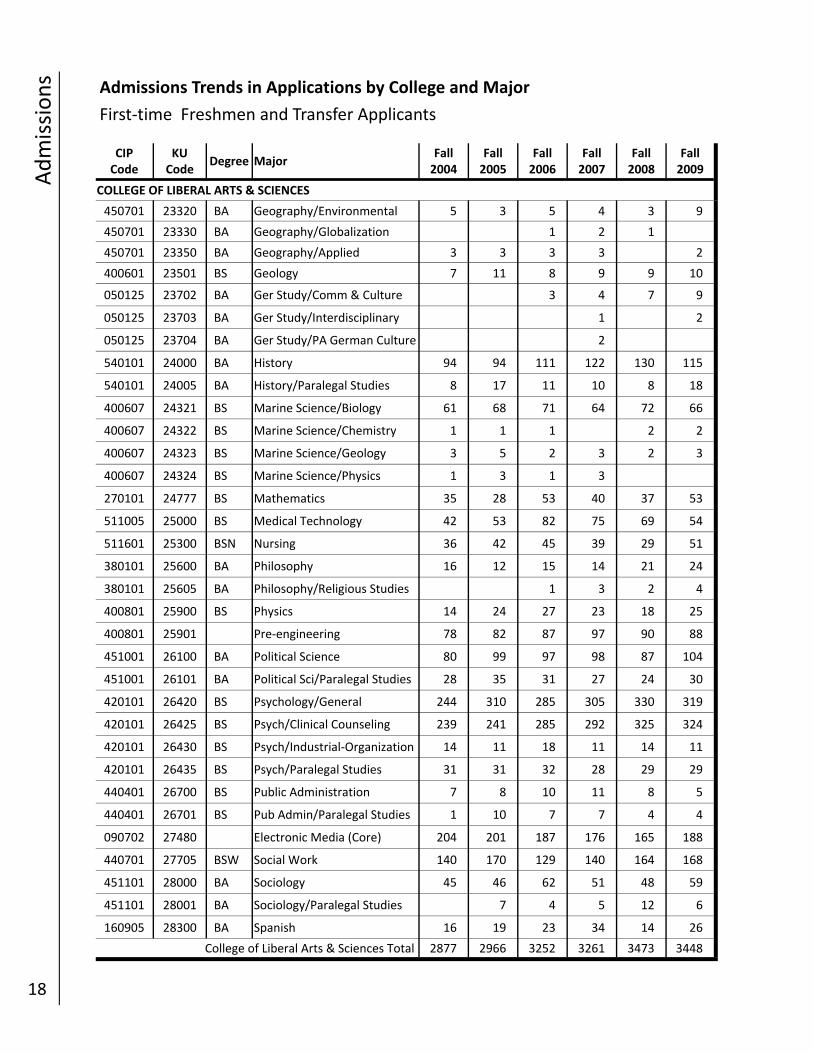
Admissions Trends in Applications by College and Major
First‐time Freshmen and Transfer Applicants
CIP Code
KU Code
Degree Major Fall 2004
Fall 2005
Fall 2006
Fall 2007
Fall 2008
Fall 2009
500701 10100 BS Art Education 212 196 170 179 165 163
500402 10600 BFA Communication Design 278 232 280 272 298 267
500201 11105 BFA Crafts 14 21 12 11 13 11
500702 11610 Studio Art (Core) 180 195 147 158 122 161
500901 14600 BA Music 68 65 57 45 38 29
500901 14605 BS Music Education 35 63 59 44 59 29
500901 14611 Music (Core) 26
231001 15300 BA Speech Communication 71 71 69 74 99 68
500501 15610 BA Theatre 77 85 78 86 99 91
College of Visual & Performing Arts Total 935 928 872 869 893 845
COLLEGE OF VISUAL & PERFORMING ARTS
COLLEGE OF LIBERAL ARTS & SCIENCES
450201 20400 BA Anthropology 40 20 40 34 34 38
260101 20710 BS Bio/Molecular/Micro/Cell 56 50 73 56 91 95
260101 20711 BS Bio/Organismal/Ecology 35 47 46 43 48 55
260101 20712 BS Biology/Pre‐professional 146 127 139 163 151 129
400501 21300 BS Chemistry 41 51 52 63 70 70
260202 21301 BS Biochemistry 33 45 49 103 77
400501 21302 BS Chemistry/Biochemistry 35 1
110103 21610 BS CIS/Info Technology 167 119 138 31
110103 21611 BS CSC/Info Technology 99 128 122
110103 21620 BS CIS/Software Development 82 64 81 12
110103 21621 BS CSC/Software Development 51 81 72
430104 21800 BS Criminal Justice 490 434 530 528 555 536
430104 21801 BS CJ/Paralegal Studies 76 105 96 92 136 85
230101 22405 BA English 49 66 65 74 80 64
230101 22410 BA English/Paralegal Studies 3 11 5
231101 22450 BA Eng/Professional Writing 139 147 159 158 153 163
030104 22650 BS Environmental Sci/Biology 40 38 42 50 63 66
030104 22653 BS Environmental Sci/Chemistry 4 3 4 7 2 7
030104 22656 BS Environmental Sci/Geology 12 12 9 18 29 35
160901 22800 BA French 8 4 5 9 4 5
240102 23000 BS General Studies 3 9 4 5 5
240102 23030 BS Gen St/Technical Studies 2
240102 23100 BA General Studies 17 10 3 7
450701 23300 BA Geography/General 4 6 5 4 2 4
Admissions
18
Admissions Trends in Applications by College and Major
First‐time Freshmen and Transfer Applicants
CIP Code
KU Code
Degree Major Fall 2004
Fall 2005
Fall 2006
Fall 2007
Fall 2008
Fall 2009
COLLEGE OF LIBERAL ARTS & SCIENCES
450701 23320 BA Geography/Environmental 5 3 5 4 3 9
450701 23330 BA Geography/Globalization 1 2 1
450701 23350 BA Geography/Applied 3 3 3 3 2
400601 23501 BS Geology 7 11 8 9 9 10
050125 23702 BA Ger Study/Comm & Culture 3 4 7 9
050125 23703 BA Ger Study/Interdisciplinary 1 2
050125 23704 BA Ger Study/PA German Culture 2
540101 24000 BA History 94 94 111 122 130 115
540101 24005 BA History/Paralegal Studies 8 17 11 10 8 18
400607 24321 BS Marine Science/Biology 61 68 71 64 72 66
400607 24322 BS Marine Science/Chemistry 1 1 1 2 2
400607 24323 BS Marine Science/Geology 3 5 2 3 2 3
400607 24324 BS Marine Science/Physics 1 3 1 3
270101 24777 BS Mathematics 35 28 53 40 37 53
511005 25000 BS Medical Technology 42 53 82 75 69 54
511601 25300 BSN Nursing 36 42 45 39 29 51
380101 25600 BA Philosophy 16 12 15 14 21 24
380101 25605 BA Philosophy/Religious Studies 1 3 2 4
400801 25900 BS Physics 14 24 27 23 18 25
400801 25901 Pre‐engineering 78 82 87 97 90 88
451001 26100 BA Political Science 80 99 97 98 87 104
451001 26101 BA Political Sci/Paralegal Studies 28 35 31 27 24 30
420101 26420 BS Psychology/General 244 310 285 305 330 319
420101 26425 BS Psych/Clinical Counseling 239 241 285 292 325 324
420101 26430 BS Psych/Industrial‐Organization 14 11 18 11 14 11
420101 26435 BS Psych/Paralegal Studies 31 31 32 28 29 29
440401 26700 BS Public Administration 7 8 10 11 8 5
440401 26701 BS Pub Admin/Paralegal Studies 1 10 7 7 4 4
090702 27480 Electronic Media (Core) 204 201 187 176 165 188
440701 27705 BSW Social Work 140 170 129 140 164 168
451101 28000 BA Sociology 45 46 62 51 48 59
451101 28001 BA Sociology/Paralegal Studies 7 4 5 12 6
160905 28300 BA Spanish 16 19 23 34 14 26
College of Liberal Arts & Sciences Total 2877 2966 3252 3261 3473 3448
Admissio
ns
19
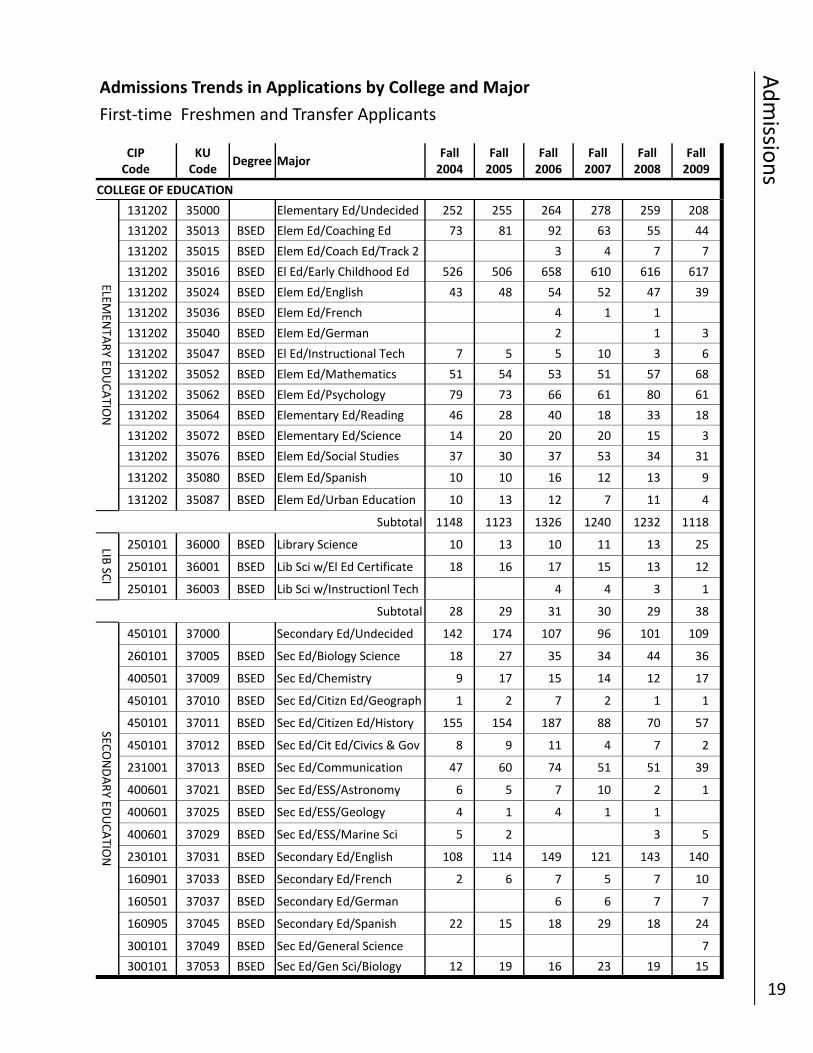
Admissions Trends in Applications by College and Major
First‐time Freshmen and Transfer Applicants
CIP Code
KU Code
Degree Major Fall 2004
Fall 2005
Fall 2006
Fall 2007
Fall 2008
Fall 2009
COLLEGE OF EDUCATION
ELEMEN
TARY ED
UCATIO
N
131202 35000 Elementary Ed/Undecided 252 255 264 278 259 208
131202 35013 BSED Elem Ed/Coaching Ed 73 81 92 63 55 44
131202 35015 BSED Elem Ed/Coach Ed/Track 2 3 4 7 7
131202 35016 BSED El Ed/Early Childhood Ed 526 506 658 610 616 617
131202 35024 BSED Elem Ed/English 43 48 54 52 47 39
131202 35036 BSED Elem Ed/French 4 1 1
131202 35040 BSED Elem Ed/German 2 1 3
131202 35047 BSED El Ed/Instructional Tech 7 5 5 10 3 6
131202 35052 BSED Elem Ed/Mathematics 51 54 53 51 57 68
131202 35062 BSED Elem Ed/Psychology 79 73 66 61 80 61
131202 35064 BSED Elementary Ed/Reading 46 28 40 18 33 18
131202 35072 BSED Elementary Ed/Science 14 20 20 20 15 3
131202 35076 BSED Elem Ed/Social Studies 37 30 37 53 34 31
131202 35080 BSED Elem Ed/Spanish 10 10 16 12 13 9
131202 35087 BSED Elem Ed/Urban Education 10 13 12 7 11 4
Subtotal 1148 1123 1326 1240 1232 1118
LIB SC
I
250101 36000 BSED Library Science 10 13 10 11 13 25
250101 36001 BSED Lib Sci w/El Ed Certificate 18 16 17 15 13 12
250101 36003 BSED Lib Sci w/Instructionl Tech 4 4 3 1
Subtotal 28 29 31 30 29 38
SECONDARY ED
UCATIO
N
450101 37000 Secondary Ed/Undecided 142 174 107 96 101 109
260101 37005 BSED Sec Ed/Biology Science 18 27 35 34 44 36
400501 37009 BSED Sec Ed/Chemistry 9 17 15 14 12 17
450101 37010 BSED Sec Ed/Citizn Ed/Geograph 1 2 7 2 1 1
450101 37011 BSED Sec Ed/Citizen Ed/History 155 154 187 88 70 57
450101 37012 BSED Sec Ed/Cit Ed/Civics & Gov 8 9 11 4 7 2
231001 37013 BSED Sec Ed/Communication 47 60 74 51 51 39
400601 37021 BSED Sec Ed/ESS/Astronomy 6 5 7 10 2 1
400601 37025 BSED Sec Ed/ESS/Geology 4 1 4 1 1
400601 37029 BSED Sec Ed/ESS/Marine Sci 5 2 3 5
230101 37031 BSED Secondary Ed/English 108 114 149 121 143 140
160901 37033 BSED Secondary Ed/French 2 6 7 5 7 10
160501 37037 BSED Secondary Ed/German 6 6 7 7
160905 37045 BSED Secondary Ed/Spanish 22 15 18 29 18 24
300101 37049 BSED Sec Ed/General Science 7
300101 37053 BSED Sec Ed/Gen Sci/Biology 12 19 16 23 19 15
Admissions
20
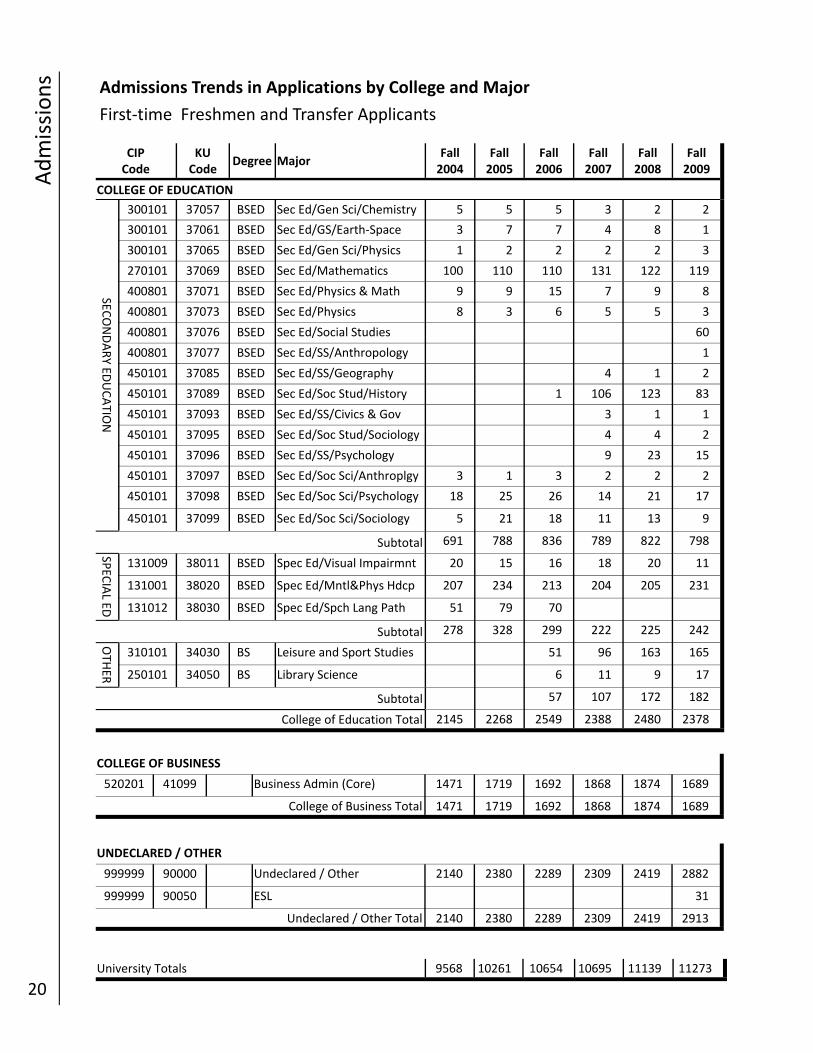
Admissions Trends in Applications by College and Major
First‐time Freshmen and Transfer Applicants
CIP Code
KU Code
Degree Major Fall 2004
Fall 2005
Fall 2006
Fall 2007
Fall 2008
Fall 2009
COLLEGE OF EDUCATION
SECONDARY ED
UCATIO
N
300101 37057 BSED Sec Ed/Gen Sci/Chemistry 5 5 5 3 2 2
300101 37061 BSED Sec Ed/GS/Earth‐Space 3 7 7 4 8 1
300101 37065 BSED Sec Ed/Gen Sci/Physics 1 2 2 2 2 3
270101 37069 BSED Sec Ed/Mathematics 100 110 110 131 122 119
400801 37071 BSED Sec Ed/Physics & Math 9 9 15 7 9 8
400801 37073 BSED Sec Ed/Physics 8 3 6 5 5 3
400801 37076 BSED Sec Ed/Social Studies 60
400801 37077 BSED Sec Ed/SS/Anthropology 1
450101 37085 BSED Sec Ed/SS/Geography 4 1 2
450101 37089 BSED Sec Ed/Soc Stud/History 1 106 123 83
450101 37093 BSED Sec Ed/SS/Civics & Gov 3 1 1
450101 37095 BSED Sec Ed/Soc Stud/Sociology 4 4 2
450101 37096 BSED Sec Ed/SS/Psychology 9 23 15
450101 37097 BSED Sec Ed/Soc Sci/Anthroplgy 3 1 3 2 2 2
450101 37098 BSED Sec Ed/Soc Sci/Psychology 18 25 26 14 21 17
450101 37099 BSED Sec Ed/Soc Sci/Sociology 5 21 18 11 13 9
Subtotal 691 788 836 789 822 798
SPEC
IAL ED
131009 38011 BSED Spec Ed/Visual Impairmnt 20 15 16 18 20 11
131001 38020 BSED Spec Ed/Mntl&Phys Hdcp 207 234 213 204 205 231
131012 38030 BSED Spec Ed/Spch Lang Path 51 79 70
Subtotal 278 328 299 222 225 242
OTH
ER
310101 34030 BS Leisure and Sport Studies 51 96 163 165
250101 34050 BS Library Science 6 11 9 17
Subtotal 57 107 172 182
College of Education Total 2145 2268 2549 2388 2480 2378
COLLEGE OF BUSINESS
520201 41099 Business Admin (Core) 1471 1719 1692 1868 1874 1689
1471 1719 1692 1868 1874 1689 College of Business Total
UNDECLARED / OTHER
999999 90000 Undeclared / Other 2140 2380 2289 2309 2419 2882
2140 2380 2289 2309 2419 2913 Undeclared / Other Total
999999 90050 ESL 31
9568 10261 10654 10695 11139 11273 University Totals
Admissio
ns
21
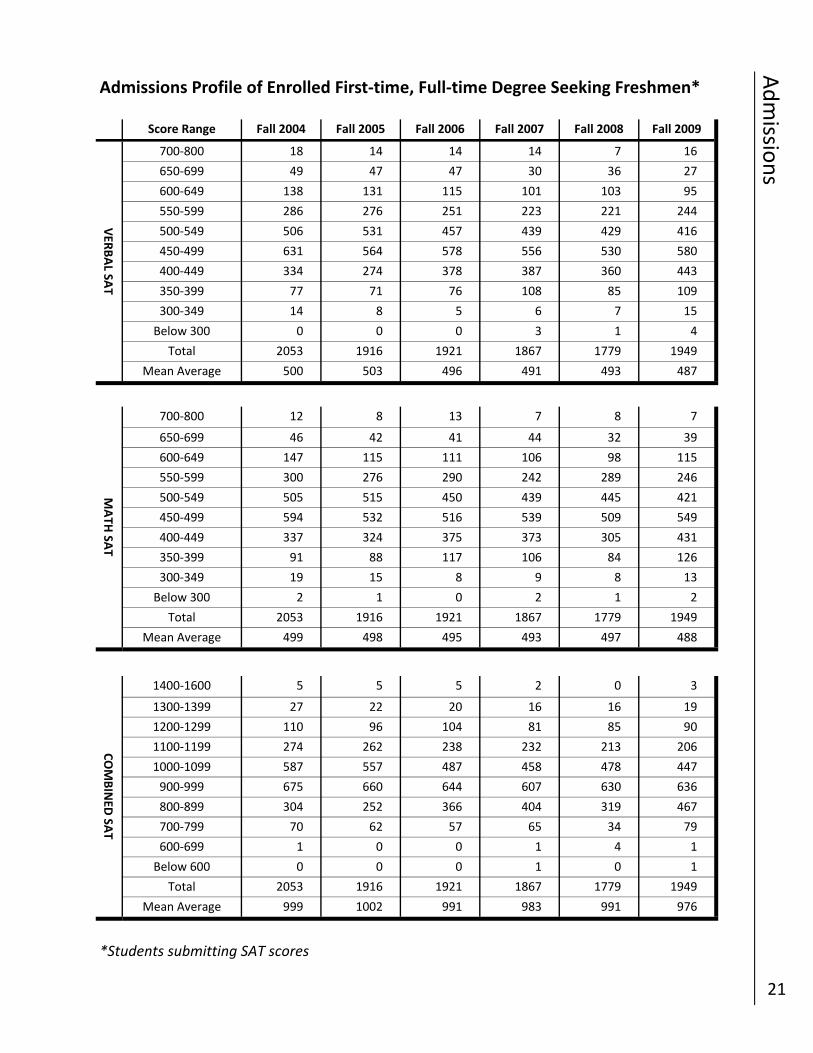
Admissions Profile of Enrolled First‐time, Full‐time Degree Seeking Freshmen*
*Students submitting SAT scores
Score Range Fall 2004 Fall 2005 Fall 2006 Fall 2007 Fall 2008 Fall 2009
700‐800 18 14 14 14 7 16
650‐699 49 47 47 30 36 27
600‐649 138 131 115 101 103 95
550‐599 286 276 251 223 221 244
500‐549 506 531 457 439 429 416
450‐499 631 564 578 556 530 580
400‐449 334 274 378 387 360 443
350‐399 77 71 76 108 85 109
300‐349 14 8 5 6 7 15
Below 300 0 0 0 3 1 4
Total 2053 1916 1921 1867 1779 1949
Mean Average 500 503 496 491 493 487
VER
BAL SA
T MATH
SAT
700‐800 12 8 13 7 8 7
650‐699 46 42 41 44 32 39
600‐649 147 115 111 106 98 115
550‐599 300 276 290 242 289 246
500‐549 505 515 450 439 445 421
450‐499 594 532 516 539 509 549
400‐449 337 324 375 373 305 431
350‐399 91 88 117 106 84 126
300‐349 19 15 8 9 8 13
Below 300 2 1 0 2 1 2
Total 2053 1916 1921 1867 1779 1949
Mean Average 499 498 495 493 497 488
COMBINED
SAT
1400‐1600 5 5 5 2 0 3
1300‐1399 27 22 20 16 16 19
1200‐1299 110 96 104 81 85 90
1100‐1199 274 262 238 232 213 206
1000‐1099 587 557 487 458 478 447
900‐999 675 660 644 607 630 636
800‐899 304 252 366 404 319 467
700‐799 70 62 57 65 34 79
600‐699 1 0 0 1 4 1
Below 600 0 0 0 1 0 1
Total 2053 1916 1921 1867 1779 1949
Mean Average 999 1002 991 983 991 976
Enrollm
ent
22
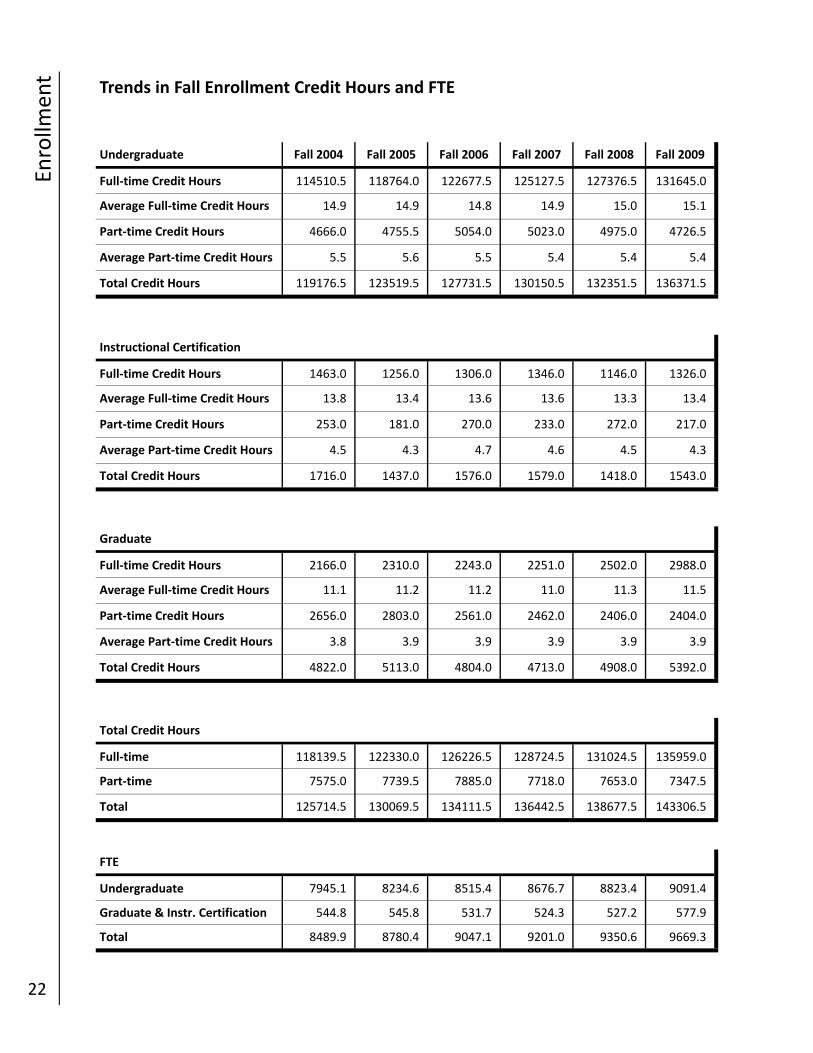
Trends in Fall Enrollment Credit Hours and FTE
Undergraduate Fall 2004 Fall 2005 Fall 2006 Fall 2007 Fall 2008 Fall 2009
Full‐time Credit Hours 114510.5 118764.0 122677.5 125127.5 127376.5 131645.0
Average Full‐time Credit Hours 14.9 14.9 14.8 14.9 15.0 15.1
Total Credit Hours 119176.5 123519.5 127731.5 130150.5 132351.5 136371.5
Part‐time Credit Hours 4666.0 4755.5 5054.0 5023.0 4975.0 4726.5
Average Part‐time Credit Hours 5.5 5.6 5.5 5.4 5.4 5.4
Full‐time Credit Hours 1463.0 1256.0 1306.0 1346.0 1146.0 1326.0
Average Full‐time Credit Hours 13.8 13.4 13.6 13.6 13.3 13.4
Part‐time Credit Hours 253.0 181.0 270.0 233.0 272.0 217.0
Average Part‐time Credit Hours 4.5 4.3 4.7 4.6 4.5 4.3
Total Credit Hours 1716.0 1437.0 1576.0 1579.0 1418.0 1543.0
Instructional Certification
Full‐time Credit Hours 2166.0 2310.0 2243.0 2251.0 2502.0 2988.0
Average Full‐time Credit Hours 11.1 11.2 11.2 11.0 11.3 11.5
Part‐time Credit Hours 2656.0 2803.0 2561.0 2462.0 2406.0 2404.0
Average Part‐time Credit Hours 3.8 3.9 3.9 3.9 3.9 3.9
Total Credit Hours 4822.0 5113.0 4804.0 4713.0 4908.0 5392.0
Graduate
Full‐time 118139.5 122330.0 126226.5 128724.5 131024.5 135959.0
Part‐time 7575.0 7739.5 7885.0 7718.0 7653.0 7347.5
Total 125714.5 130069.5 134111.5 136442.5 138677.5 143306.5
Total Credit Hours
Undergraduate 7945.1 8234.6 8515.4 8676.7 8823.4 9091.4
Graduate & Instr. Certification 544.8 545.8 531.7 524.3 527.2 577.9
Total 8489.9 8780.4 9047.1 9201.0 9350.6 9669.3
FTE
Enrollm
ent
23
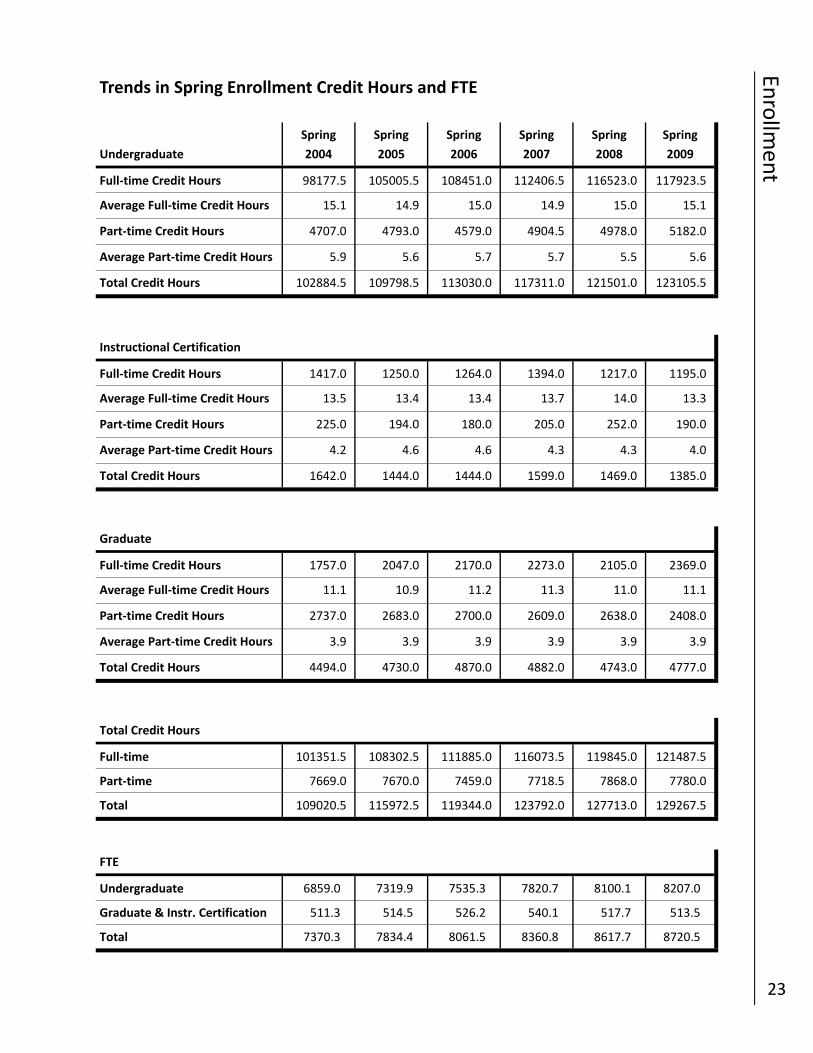
Trends in Spring Enrollment Credit Hours and FTE
Full‐time Credit Hours 1417.0 1250.0 1264.0 1394.0 1217.0 1195.0
Average Full‐time Credit Hours 13.5 13.4 13.4 13.7 14.0 13.3
Part‐time Credit Hours 225.0 194.0 180.0 205.0 252.0 190.0
Average Part‐time Credit Hours 4.2 4.6 4.6 4.3 4.3 4.0
Total Credit Hours 1642.0 1444.0 1444.0 1599.0 1469.0 1385.0
Instructional Certification
Full‐time Credit Hours 1757.0 2047.0 2170.0 2273.0 2105.0 2369.0
Average Full‐time Credit Hours 11.1 10.9 11.2 11.3 11.0 11.1
Part‐time Credit Hours 2737.0 2683.0 2700.0 2609.0 2638.0 2408.0
Average Part‐time Credit Hours 3.9 3.9 3.9 3.9 3.9 3.9
Total Credit Hours 4494.0 4730.0 4870.0 4882.0 4743.0 4777.0
Graduate
Full‐time 101351.5 108302.5 111885.0 116073.5 119845.0 121487.5
Part‐time 7669.0 7670.0 7459.0 7718.5 7868.0 7780.0
Total 109020.5 115972.5 119344.0 123792.0 127713.0 129267.5
Total Credit Hours
Undergraduate
Spring
2004
Spring
2005
Spring
2006
Spring
2007
Spring
2008
Spring
2009
Full‐time Credit Hours 98177.5 105005.5 108451.0 112406.5 116523.0 117923.5
Average Full‐time Credit Hours 15.1 14.9 15.0 14.9 15.0 15.1
Total Credit Hours 102884.5 109798.5 113030.0 117311.0 121501.0 123105.5
Part‐time Credit Hours 4707.0 4793.0 4579.0 4904.5 4978.0 5182.0
Average Part‐time Credit Hours 5.9 5.6 5.7 5.7 5.5 5.6
Undergraduate 6859.0 7319.9 7535.3 7820.7 8100.1 8207.0
Graduate & Instr. Certification 511.3 514.5 526.2 540.1 517.7 513.5
Total 7370.3 7834.4 8061.5 8360.8 8617.7 8720.5
FTE
Enrollm
ent
24
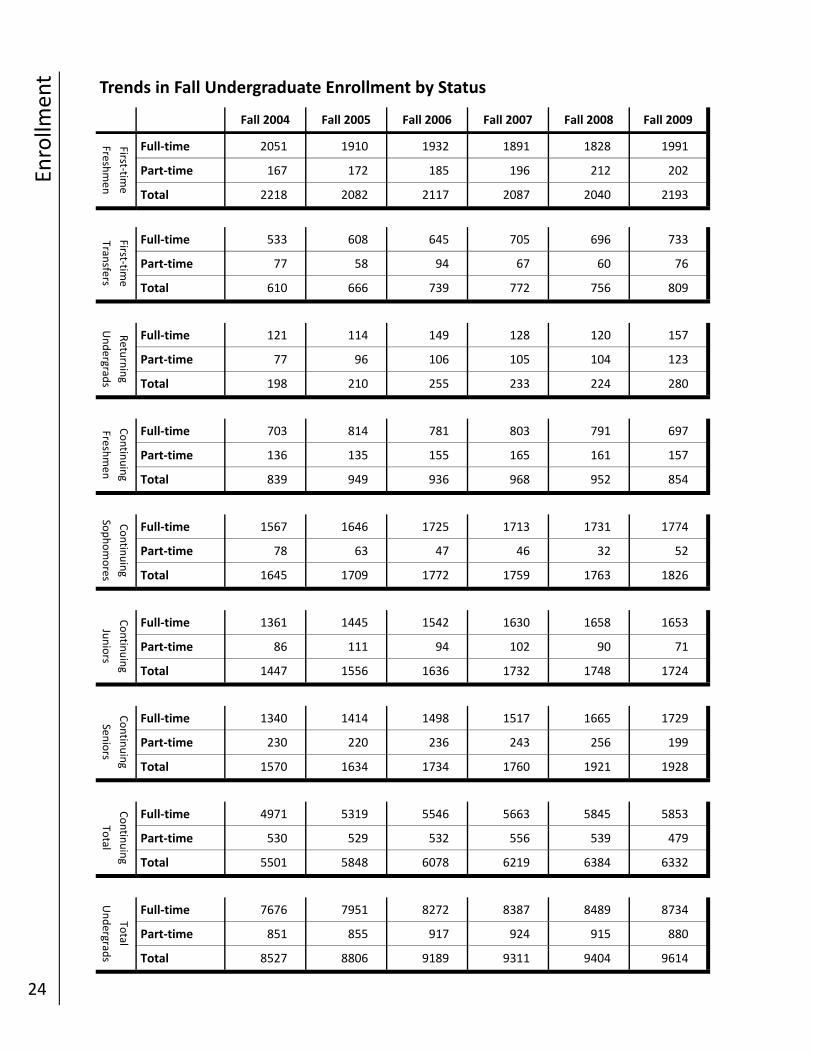
Trends in Fall Undergraduate Enrollment by Status
Fall 2004 Fall 2005 Fall 2006 Fall 2007 Fall 2008 Fall 2009
First‐time
Freshmen
Full‐time 2051 1910 1932 1891 1828 1991
Part‐time 167 172 185 196 212 202
Total 2218 2082 2117 2087 2040 2193
First‐time
Transfers
Full‐time 533 608 645 705 696 733
Part‐time 77 58 94 67 60 76
Total 610 666 739 772 756 809
Returning
Undergrad
s
Full‐time 121 114 149 128 120 157
Part‐time 77 96 106 105 104 123
Total 198 210 255 233 224 280
Contin
uing
Freshmen
Full‐time 703 814 781 803 791 697
Part‐time 136 135 155 165 161 157
Total 839 949 936 968 952 854
Contin
uing
Sophomores
Full‐time 1567 1646 1725 1713 1731 1774
Part‐time 78 63 47 46 32 52
Total 1645 1709 1772 1759 1763 1826
Contin
uing
Juniors
Full‐time 1361 1445 1542 1630 1658 1653
Part‐time 86 111 94 102 90 71
Total 1447 1556 1636 1732 1748 1724
Contin
uing
Seniors
Full‐time 1340 1414 1498 1517 1665 1729
Part‐time 230 220 236 243 256 199
Total 1570 1634 1734 1760 1921 1928
Contin
uing
Total
Full‐time 4971 5319 5546 5663 5845 5853
Part‐time 530 529 532 556 539 479
Total 5501 5848 6078 6219 6384 6332
Total
Undergrad
s
Full‐time 7676 7951 8272 8387 8489 8734
Part‐time 851 855 917 924 915 880
Total 8527 8806 9189 9311 9404 9614
Enrollm
ent
25
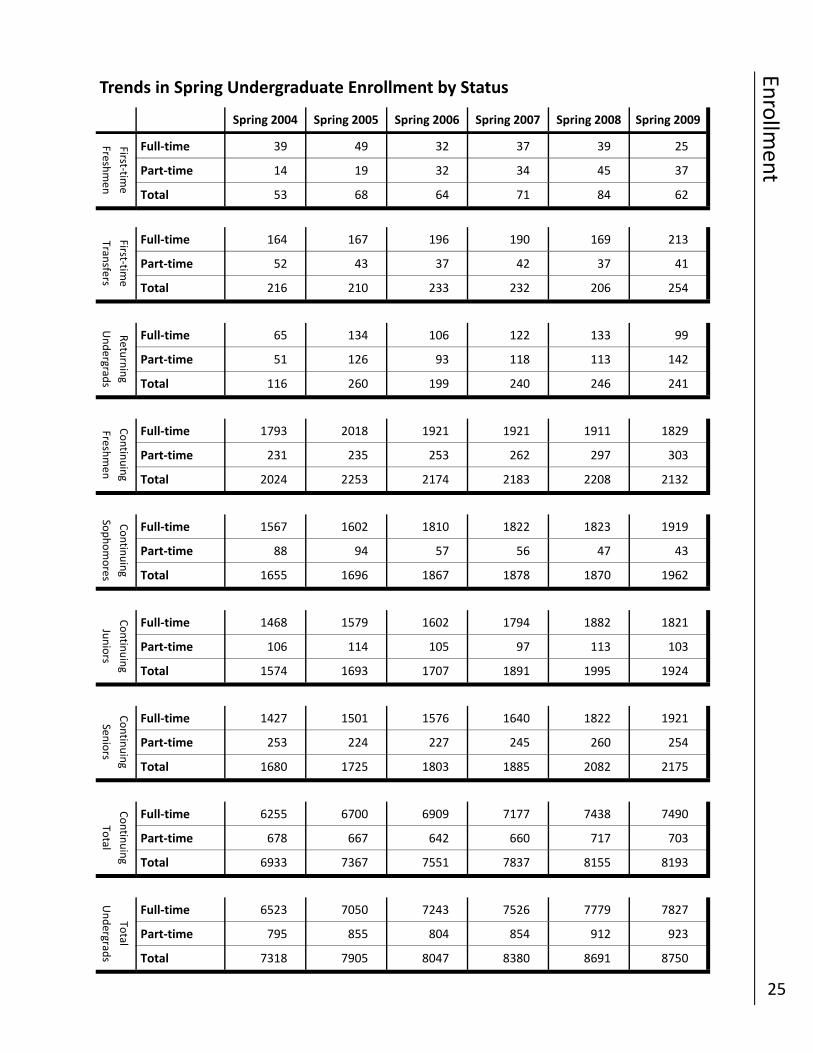
Trends in Spring Undergraduate Enrollment by Status
Spring 2004 Spring 2005 Spring 2006 Spring 2007 Spring 2008 Spring 2009
First‐time
Freshmen
Full‐time 39 49 32 37 39 25
Part‐time 14 19 32 34 45 37
Total 53 68 64 71 84 62
First‐time
Transfers
Full‐time 164 167 196 190 169 213
Part‐time 52 43 37 42 37 41
Total 216 210 233 232 206 254
Returning
Undergrad
s
Full‐time 65 134 106 122 133 99
Part‐time 51 126 93 118 113 142
Total 116 260 199 240 246 241
Contin
uing
Freshmen
Full‐time 1793 2018 1921 1921 1911 1829
Part‐time 231 235 253 262 297 303
Total 2024 2253 2174 2183 2208 2132
Contin
uing
Sophomores
Full‐time 1567 1602 1810 1822 1823 1919
Part‐time 88 94 57 56 47 43
Total 1655 1696 1867 1878 1870 1962
Contin
uing
Juniors
Full‐time 1468 1579 1602 1794 1882 1821
Part‐time 106 114 105 97 113 103
Total 1574 1693 1707 1891 1995 1924
Contin
uing
Seniors
Full‐time 1427 1501 1576 1640 1822 1921
Part‐time 253 224 227 245 260 254
Total 1680 1725 1803 1885 2082 2175
Contin
uing
Total
Full‐time 6255 6700 6909 7177 7438 7490
Part‐time 678 667 642 660 717 703
Total 6933 7367 7551 7837 8155 8193
Total
Undergrad
s
Full‐time 6523 7050 7243 7526 7779 7827
Part‐time 795 855 804 854 912 923
Total 7318 7905 8047 8380 8691 8750
Enrollm
ent
26
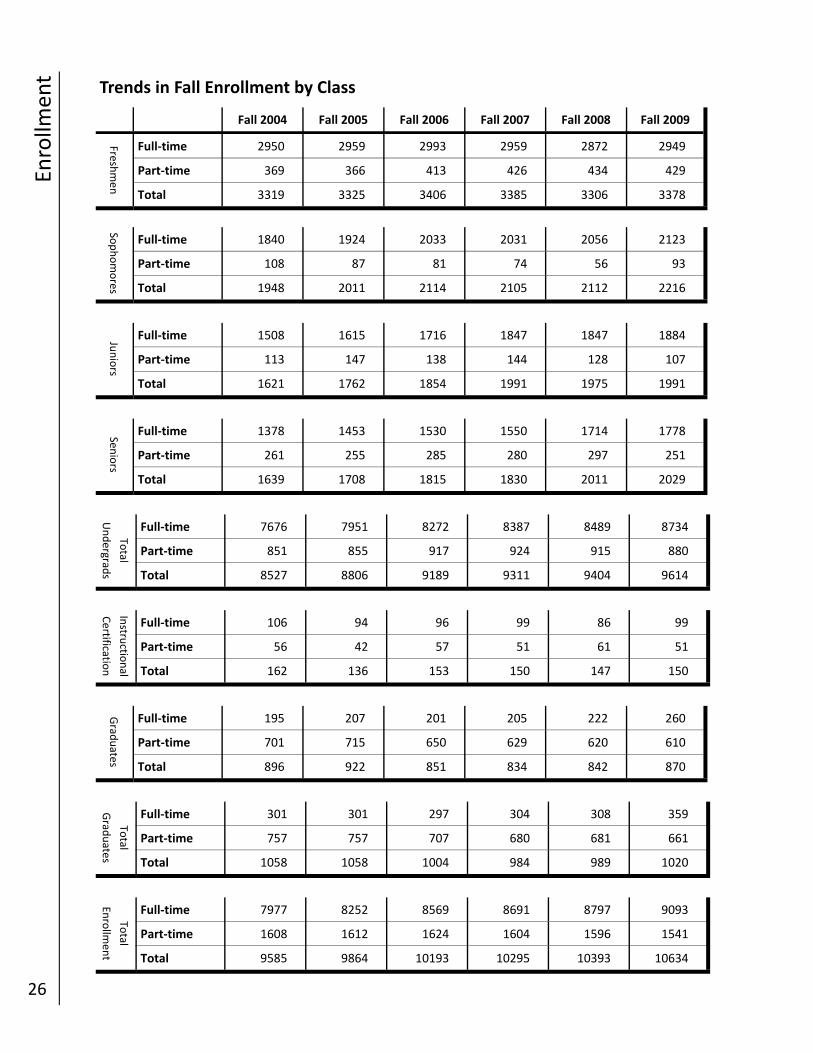
Trends in Fall Enrollment by Class
Fall 2004 Fall 2005 Fall 2006 Fall 2007 Fall 2008 Fall 2009
Freshmen
Full‐time 2950 2959 2993 2959 2872 2949
Part‐time 369 366 413 426 434 429
Total 3319 3325 3406 3385 3306 3378
Sophomores
Full‐time 1840 1924 2033 2031 2056 2123
Part‐time 108 87 81 74 56 93
Total 1948 2011 2114 2105 2112 2216
Juniors
Full‐time 1508 1615 1716 1847 1847 1884
Part‐time 113 147 138 144 128 107
Total 1621 1762 1854 1991 1975 1991
Seniors
Full‐time 1378 1453 1530 1550 1714 1778
Part‐time 261 255 285 280 297 251
Total 1639 1708 1815 1830 2011 2029
Total
Undergrad
s
Full‐time 7676 7951 8272 8387 8489 8734
Part‐time 851 855 917 924 915 880
Total 8527 8806 9189 9311 9404 9614
Instru
ctional
Certificatio
n
Full‐time 106 94 96 99 86 99
Part‐time 56 42 57 51 61 51
Total 162 136 153 150 147 150
Grad
uates
Full‐time 195 207 201 205 222 260
Part‐time 701 715 650 629 620 610
Total 896 922 851 834 842 870
Total
Grad
uates
Full‐time 301 301 297 304 308 359
Part‐time 757 757 707 680 681 661
Total 1058 1058 1004 984 989 1020
Total
Enrollm
ent
Full‐time 7977 8252 8569 8691 8797 9093
Part‐time 1608 1612 1624 1604 1596 1541
Total 9585 9864 10193 10295 10393 10634
Enrollm
ent
27
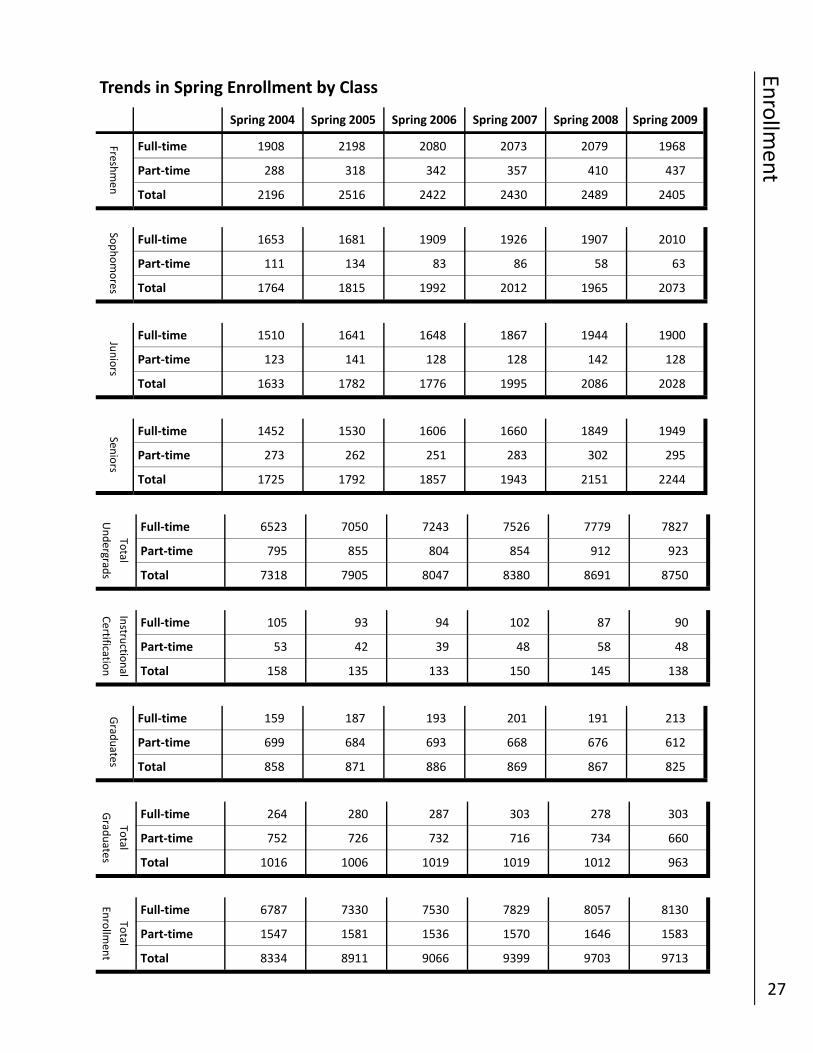
Trends in Spring Enrollment by Class
Spring 2004 Spring 2005 Spring 2006 Spring 2007 Spring 2008 Spring 2009
Freshmen
Full‐time 1908 2198 2080 2073 2079 1968
Part‐time 288 318 342 357 410 437
Total 2196 2516 2422 2430 2489 2405
Sophomores
Full‐time 1653 1681 1909 1926 1907 2010
Part‐time 111 134 83 86 58 63
Total 1764 1815 1992 2012 1965 2073
Juniors
Full‐time 1510 1641 1648 1867 1944 1900
Part‐time 123 141 128 128 142 128
Total 1633 1782 1776 1995 2086 2028
Seniors
Full‐time 1452 1530 1606 1660 1849 1949
Part‐time 273 262 251 283 302 295
Total 1725 1792 1857 1943 2151 2244
Total
Undergrad
s
Full‐time 6523 7050 7243 7526 7779 7827
Part‐time 795 855 804 854 912 923
Total 7318 7905 8047 8380 8691 8750
Instru
ctional
Certificatio
n
Full‐time 105 93 94 102 87 90
Part‐time 53 42 39 48 58 48
Total 158 135 133 150 145 138
Grad
uates
Full‐time 159 187 193 201 191 213
Part‐time 699 684 693 668 676 612
Total 858 871 886 869 867 825
Total
Grad
uates
Full‐time 264 280 287 303 278 303
Part‐time 752 726 732 716 734 660
Total 1016 1006 1019 1019 1012 963
Total
Enrollm
ent
Full‐time 6787 7330 7530 7829 8057 8130
Part‐time 1547 1581 1536 1570 1646 1583
Total 8334 8911 9066 9399 9703 9713
Enrollm
ent
28
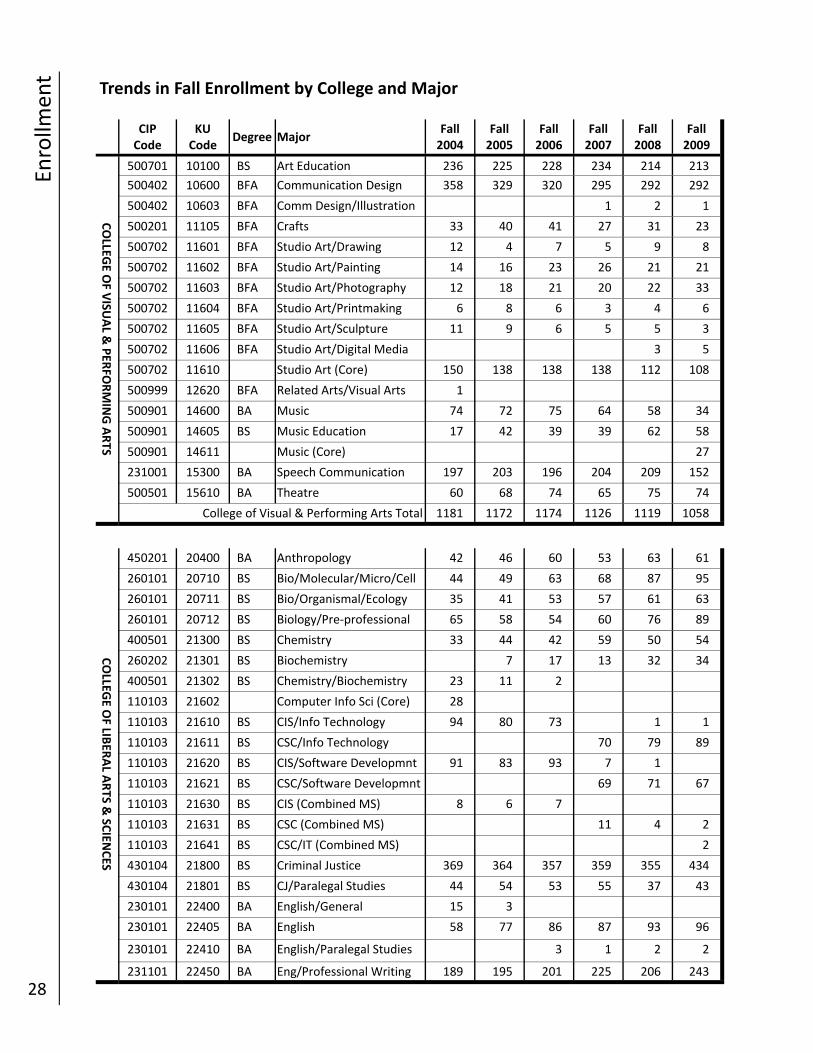
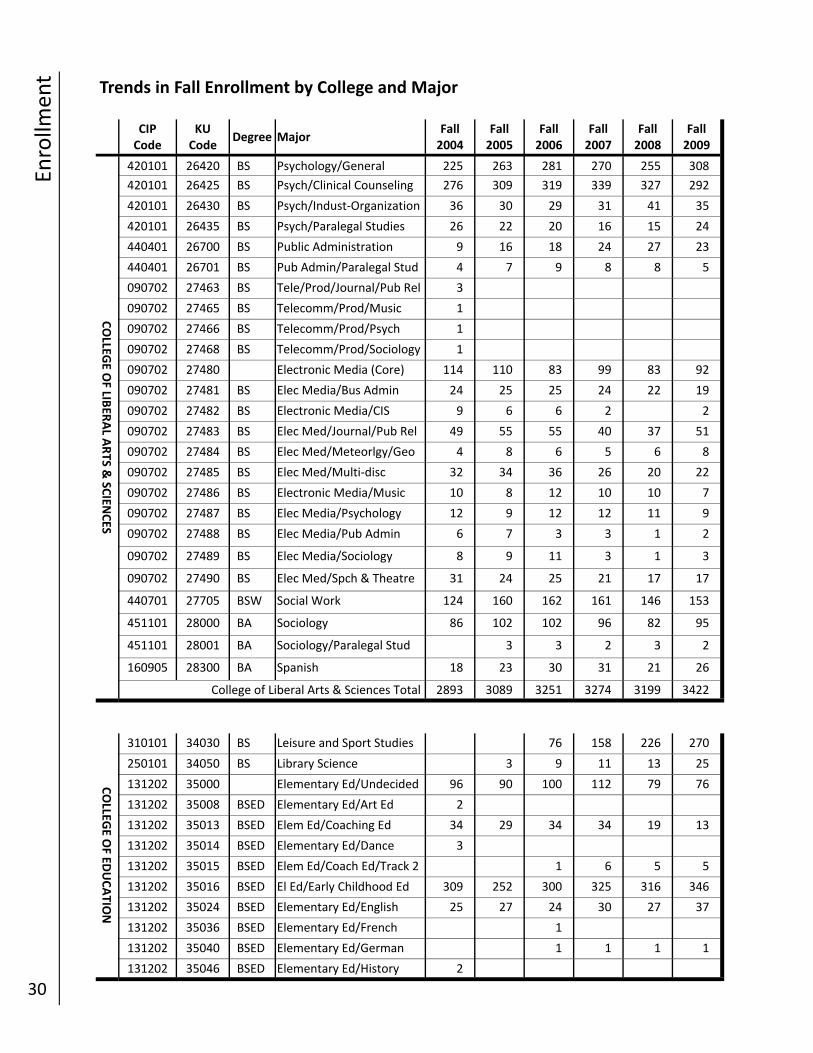
Trends in Fall Enrollment by College and Major
CIP Code
KU Code
Degree Major Fall 2004
Fall 2005
Fall 2006
Fall 2007
Fall 2008
Fall 2009
COLLEG
E OF V
ISUAL &
PER
FORMING ARTS
500701 10100 BS Art Education 236 225 228 234 214 213
500402 10600 BFA Communication Design 358 329 320 295 292 292
500402 10603 BFA Comm Design/Illustration 1 2 1
500201 11105 BFA Crafts 33 40 41 27 31 23
500702 11601 BFA Studio Art/Drawing 12 4 7 5 9 8
500702 11602 BFA Studio Art/Painting 14 16 23 26 21 21
500702 11603 BFA Studio Art/Photography 12 18 21 20 22 33
500702 11604 BFA Studio Art/Printmaking 6 8 6 3 4 6
500702 11605 BFA Studio Art/Sculpture 11 9 6 5 5 3
500702 11606 BFA Studio Art/Digital Media 3 5
500702 11610 Studio Art (Core) 150 138 138 138 112 108
500999 12620 BFA Related Arts/Visual Arts 1
500901 14600 BA Music 74 72 75 64 58 34
500901 14605 BS Music Education 17 42 39 39 62 58
500901 14611 Music (Core) 27
231001 15300 BA Speech Communication 197 203 196 204 209 152
500501 15610 BA Theatre 60 68 74 65 75 74
1181 1172 1174 1126 1119 1058 College of Visual & Performing Arts Total
COLLEG
E OF LIB
ERAL A
RTS &
SCIEN
CES
450201 20400 BA Anthropology 42 46 60 53 63 61
260101 20710 BS Bio/Molecular/Micro/Cell 44 49 63 68 87 95
260101 20711 BS Bio/Organismal/Ecology 35 41 53 57 61 63
260101 20712 BS Biology/Pre‐professional 65 58 54 60 76 89
400501 21300 BS Chemistry 33 44 42 59 50 54
260202 21301 BS Biochemistry 7 17 13 32 34
400501 21302 BS Chemistry/Biochemistry 23 11 2
110103 21602 Computer Info Sci (Core) 28
110103 21610 BS CIS/Info Technology 94 80 73 1 1
110103 21611 BS CSC/Info Technology 70 79 89
110103 21620 BS CIS/Software Developmnt 91 83 93 7 1
110103 21621 BS CSC/Software Developmnt 69 71 67
110103 21630 BS CIS (Combined MS) 8 6 7
110103 21631 BS CSC (Combined MS) 11 4 2
110103 21641 BS CSC/IT (Combined MS) 2
430104 21800 BS Criminal Justice 369 364 357 359 355 434
430104 21801 BS CJ/Paralegal Studies 44 54 53 55 37 43
230101 22400 BA English/General 15 3
230101 22405 BA English 58 77 86 87 93 96
230101 22410 BA English/Paralegal Studies 3 1 2 2
231101 22450 BA Eng/Professional Writing 189 195 201 225 206 243
Enrollm
ent
29
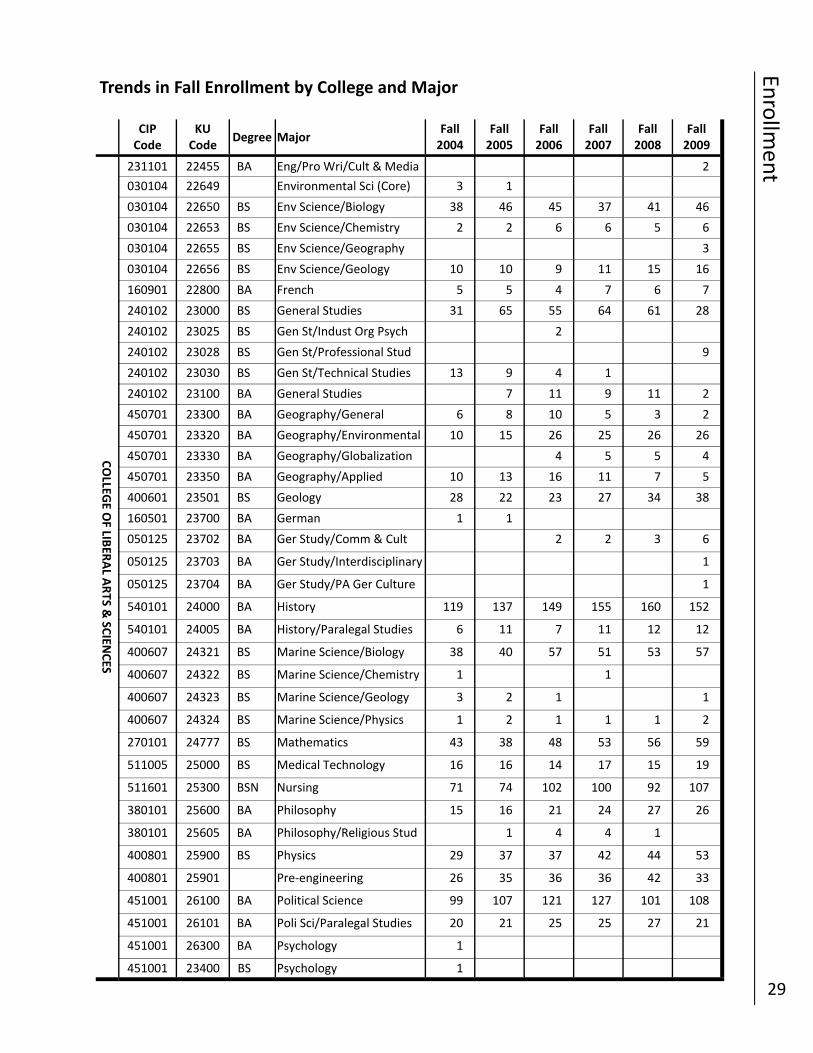
Trends in Fall Enrollment by College and Major
CIP Code
KU Code
Degree Major Fall 2004
Fall 2005
Fall 2006
Fall 2007
Fall 2008
Fall 2009
COLLEG
E OF LIB
ERAL A
RTS &
SCIEN
CES
231101 22455 BA Eng/Pro Wri/Cult & Media 2
030104 22649 Environmental Sci (Core) 3 1
030104 22650 BS Env Science/Biology 38 46 45 37 41 46
030104 22653 BS Env Science/Chemistry 2 2 6 6 5 6
030104 22655 BS Env Science/Geography 3
030104 22656 BS Env Science/Geology 10 10 9 11 15 16
160901 22800 BA French 5 5 4 7 6 7
240102 23000 BS General Studies 31 65 55 64 61 28
240102 23025 BS Gen St/Indust Org Psych 2
240102 23028 BS Gen St/Professional Stud 9
240102 23030 BS Gen St/Technical Studies 13 9 4 1
240102 23100 BA General Studies 7 11 9 11 2
450701 23300 BA Geography/General 6 8 10 5 3 2
450701 23320 BA Geography/Environmental 10 15 26 25 26 26
450701 23330 BA Geography/Globalization 4 5 5 4
450701 23350 BA Geography/Applied 10 13 16 11 7 5
400601 23501 BS Geology 28 22 23 27 34 38
160501 23700 BA German 1 1
050125 23702 BA Ger Study/Comm & Cult 2 2 3 6
050125 23703 BA Ger Study/Interdisciplinary 1
050125 23704 BA Ger Study/PA Ger Culture 1
540101 24000 BA History 119 137 149 155 160 152
540101 24005 BA History/Paralegal Studies 6 11 7 11 12 12
400607 24321 BS Marine Science/Biology 38 40 57 51 53 57
400607 24322 BS Marine Science/Chemistry 1 1
400607 24323 BS Marine Science/Geology 3 2 1 1
400607 24324 BS Marine Science/Physics 1 2 1 1 1 2
270101 24777 BS Mathematics 43 38 48 53 56 59
511005 25000 BS Medical Technology 16 16 14 17 15 19
511601 25300 BSN Nursing 71 74 102 100 92 107
380101 25600 BA Philosophy 15 16 21 24 27 26
380101 25605 BA Philosophy/Religious Stud 1 4 4 1
400801 25900 BS Physics 29 37 37 42 44 53
400801 25901 Pre‐engineering 26 35 36 36 42 33
451001 26100 BA Political Science 99 107 121 127 101 108
451001 26101 BA Poli Sci/Paralegal Studies 20 21 25 25 27 21
451001 26300 BA Psychology 1
451001 23400 BS Psychology 1
Enrollm
ent
30
Trends in Fall Enrollment by College and Major
CIP Code
KU Code
Degree Major Fall 2004
Fall 2005
Fall 2006
Fall 2007
Fall 2008
Fall 2009
COLLEG
E OF LIB
ERAL A
RTS &
SCIEN
CES
420101 26420 BS Psychology/General 225 263 281 270 255 308
420101 26425 BS Psych/Clinical Counseling 276 309 319 339 327 292
420101 26430 BS Psych/Indust‐Organization 36 30 29 31 41 35
420101 26435 BS Psych/Paralegal Studies 26 22 20 16 15 24
440401 26700 BS Public Administration 9 16 18 24 27 23
440401 26701 BS Pub Admin/Paralegal Stud 4 7 9 8 8 5
090702 27463 BS Tele/Prod/Journal/Pub Rel 3
090702 27465 BS Telecomm/Prod/Music 1
090702 27466 BS Telecomm/Prod/Psych 1
090702 27468 BS Telecomm/Prod/Sociology 1
090702 27480 Electronic Media (Core) 114 110 83 99 83 92
090702 27481 BS Elec Media/Bus Admin 24 25 25 24 22 19
090702 27482 BS Electronic Media/CIS 9 6 6 2 2
090702 27483 BS Elec Med/Journal/Pub Rel 49 55 55 40 37 51
090702 27484 BS Elec Med/Meteorlgy/Geo 4 8 6 5 6 8
090702 27485 BS Elec Med/Multi‐disc 32 34 36 26 20 22
090702 27486 BS Electronic Media/Music 10 8 12 10 10 7
090702 27487 BS Elec Media/Psychology 12 9 12 12 11 9
090702 27488 BS Elec Media/Pub Admin 6 7 3 3 1 2
090702 27489 BS Elec Media/Sociology 8 9 11 3 1 3
090702 27490 BS Elec Med/Spch & Theatre 31 24 25 21 17 17
440701 27705 BSW Social Work 124 160 162 161 146 153
451101 28000 BA Sociology 86 102 102 96 82 95
451101 28001 BA Sociology/Paralegal Stud 3 3 2 3 2
160905 28300 BA Spanish 18 23 30 31 21 26
2893 3089 3251 3274 3199 3422 College of Liberal Arts & Sciences Total
COLLEG
E OF ED
UCATIO
N
310101 34030 BS Leisure and Sport Studies 76 158 226 270
250101 34050 BS Library Science 3 9 11 13 25
131202 35000 Elementary Ed/Undecided 96 90 100 112 79 76
131202 35008 BSED Elementary Ed/Art Ed 2
131202 35013 BSED Elem Ed/Coaching Ed 34 29 34 34 19 13
131202 35014 BSED Elementary Ed/Dance 3
131202 35015 BSED Elem Ed/Coach Ed/Track 2 1 6 5 5
131202 35016 BSED El Ed/Early Childhood Ed 309 252 300 325 316 346
131202 35024 BSED Elementary Ed/English 25 27 24 30 27 37
131202 35036 BSED Elementary Ed/French 1
131202 35040 BSED Elementary Ed/German 1 1 1 1
131202 35046 BSED Elementary Ed/History 2
Enrollm
ent
31
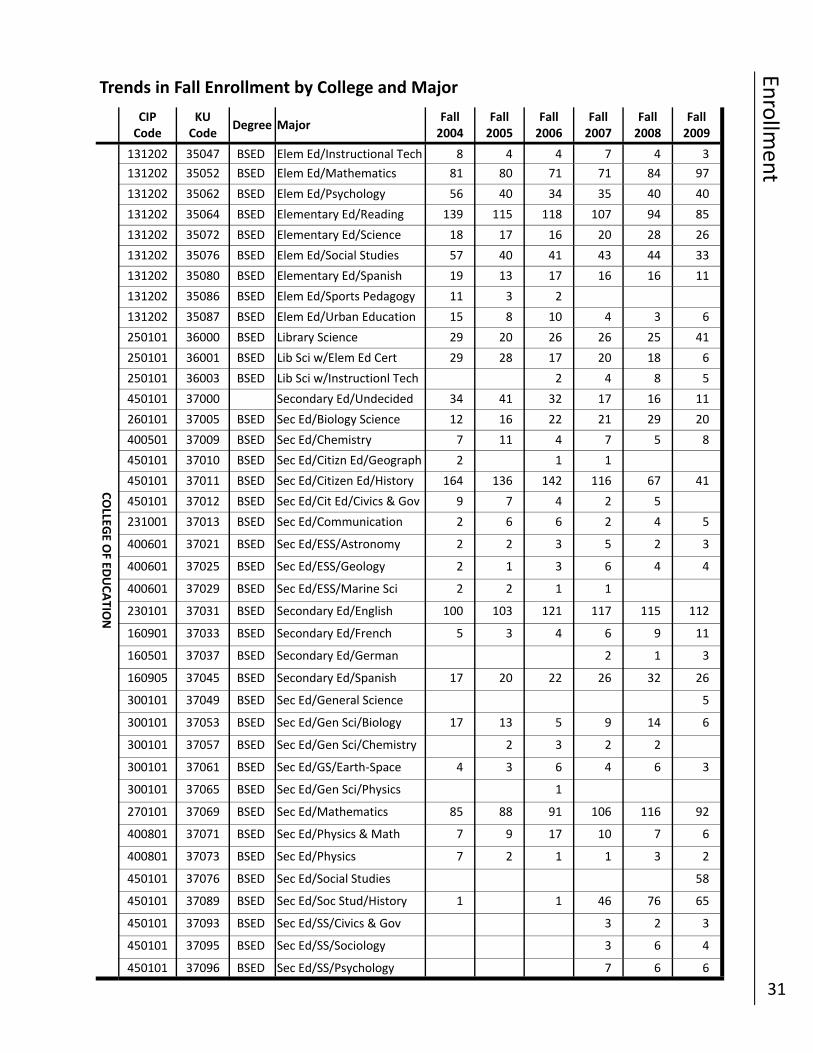
Trends in Fall Enrollment by College and Major
CIP Code
KU Code
Degree Major Fall 2004
Fall 2005
Fall 2006
Fall 2007
Fall 2008
Fall 2009
COLLEG
E OF ED
UCATIO
N
131202 35047 BSED Elem Ed/Instructional Tech 8 4 4 7 4 3
131202 35052 BSED Elem Ed/Mathematics 81 80 71 71 84 97
131202 35062 BSED Elem Ed/Psychology 56 40 34 35 40 40
131202 35064 BSED Elementary Ed/Reading 139 115 118 107 94 85
131202 35072 BSED Elementary Ed/Science 18 17 16 20 28 26
131202 35076 BSED Elem Ed/Social Studies 57 40 41 43 44 33
131202 35080 BSED Elementary Ed/Spanish 19 13 17 16 16 11
131202 35086 BSED Elem Ed/Sports Pedagogy 11 3 2
131202 35087 BSED Elem Ed/Urban Education 15 8 10 4 3 6
250101 36000 BSED Library Science 29 20 26 26 25 41
250101 36001 BSED Lib Sci w/Elem Ed Cert 29 28 17 20 18 6
250101 36003 BSED Lib Sci w/Instructionl Tech 2 4 8 5
450101 37000 Secondary Ed/Undecided 34 41 32 17 16 11
260101 37005 BSED Sec Ed/Biology Science 12 16 22 21 29 20
450101 37011 BSED Sec Ed/Citizen Ed/History 164 136 142 116 67 41
450101 37012 BSED Sec Ed/Cit Ed/Civics & Gov 9 7 4 2 5
450101 37096 BSED Sec Ed/SS/Psychology 7 6 6
450101 37010 BSED Sec Ed/Citizn Ed/Geograph 2 1 1
400501 37009 BSED Sec Ed/Chemistry 7 11 4 7 5 8
231001 37013 BSED Sec Ed/Communication 2 6 6 2 4 5
400601 37021 BSED Sec Ed/ESS/Astronomy 2 2 3 5 2 3
400601 37025 BSED Sec Ed/ESS/Geology 2 1 3 6 4 4
400601 37029 BSED Sec Ed/ESS/Marine Sci 2 2 1 1
230101 37031 BSED Secondary Ed/English 100 103 121 117 115 112
160901 37033 BSED Secondary Ed/French 5 3 4 6 9 11
160501 37037 BSED Secondary Ed/German 2 1 3
160905 37045 BSED Secondary Ed/Spanish 17 20 22 26 32 26
300101 37049 BSED Sec Ed/General Science 5
300101 37053 BSED Sec Ed/Gen Sci/Biology 17 13 5 9 14 6
300101 37057 BSED Sec Ed/Gen Sci/Chemistry 2 3 2 2
300101 37065 BSED Sec Ed/Gen Sci/Physics 1
270101 37069 BSED Sec Ed/Mathematics 85 88 91 106 116 92
400801 37071 BSED Sec Ed/Physics & Math 7 9 17 10 7 6
400801 37073 BSED Sec Ed/Physics 7 2 1 1 3 2
450101 37076 BSED Sec Ed/Social Studies 58
450101 37089 BSED Sec Ed/Soc Stud/History 1 1 46 76 65
450101 37093 BSED Sec Ed/SS/Civics & Gov 3 2 3
450101 37095 BSED Sec Ed/SS/Sociology 3 6 4
300101 37061 BSED Sec Ed/GS/Earth‐Space 4 3 6 4 6 3
Enrollm
ent
32
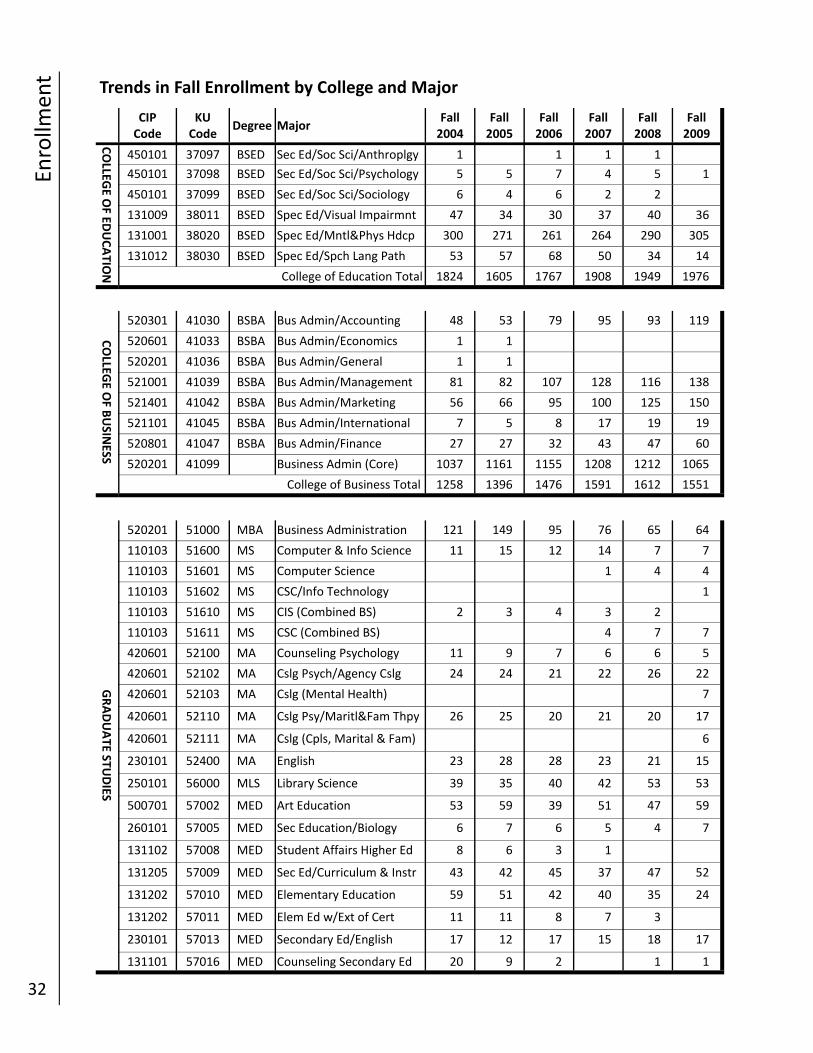
Trends in Fall Enrollment by College and Major
CIP Code
KU Code
Degree Major Fall 2004
Fall 2005
Fall 2006
Fall 2007
Fall 2008
Fall 2009
COLLEG
E OF ED
UCATIO
N
450101 37097 BSED Sec Ed/Soc Sci/Anthroplgy 1 1 1 1
450101 37098 BSED Sec Ed/Soc Sci/Psychology 5 5 7 4 5 1
450101 37099 BSED Sec Ed/Soc Sci/Sociology 6 4 6 2 2
131009 38011 BSED Spec Ed/Visual Impairmnt 47 34 30 37 40 36
131001 38020 BSED Spec Ed/Mntl&Phys Hdcp 300 271 261 264 290 305
131012 38030 BSED Spec Ed/Spch Lang Path 53 57 68 50 34 14
1824 1605 1767 1908 1949 1976 College of Education Total
COLLEG
E OF B
USIN
ESS
520301 41030 BSBA Bus Admin/Accounting 48 53 79 95 93 119
520601 41033 BSBA Bus Admin/Economics 1 1
520201 41036 BSBA Bus Admin/General 1 1
521001 41039 BSBA Bus Admin/Management 81 82 107 128 116 138
521401 41042 BSBA Bus Admin/Marketing 56 66 95 100 125 150
521101 41045 BSBA Bus Admin/International 7 5 8 17 19 19
520801 41047 BSBA Bus Admin/Finance 27 27 32 43 47 60
520201 41099 Business Admin (Core) 1037 1161 1155 1208 1212 1065
1258 1396 1476 1591 1612 1551 College of Business Total
GRADUATE STU
DIES
520201 51000 MBA Business Administration 121 149 95 76 65 64
110103 51600 MS Computer & Info Science 11 15 12 14 7 7
110103 51601 MS Computer Science 1 4 4
110103 51602 MS CSC/Info Technology 1
110103 51610 MS CIS (Combined BS) 2 3 4 3 2
110103 51611 MS CSC (Combined BS) 4 7 7
420601 52100 MA Counseling Psychology 11 9 7 6 6 5
420601 52102 MA Cslg Psych/Agency Cslg 24 24 21 22 26 22
420601 52103 MA Cslg (Mental Health) 7
420601 52110 MA Cslg Psy/Maritl&Fam Thpy 26 25 20 21 20 17
420601 52111 MA Cslg (Cpls, Marital & Fam) 6
230101 52400 MA English 23 28 28 23 21 15
250101 56000 MLS Library Science 39 35 40 42 53 53
500701 57002 MED Art Education 53 59 39 51 47 59
260101 57005 MED Sec Education/Biology 6 7 6 5 4 7
131102 57008 MED Student Affairs Higher Ed 8 6 3 1
131205 57009 MED Sec Ed/Curriculum & Instr 43 42 45 37 47 52
131202 57010 MED Elementary Education 59 51 42 40 35 24
131202 57011 MED Elem Ed w/Ext of Cert 11 11 8 7 3
230101 57013 MED Secondary Ed/English 17 12 17 15 18 17
131101 57016 MED Counseling Secondary Ed 20 9 2 1 1
Enrollm
ent
33
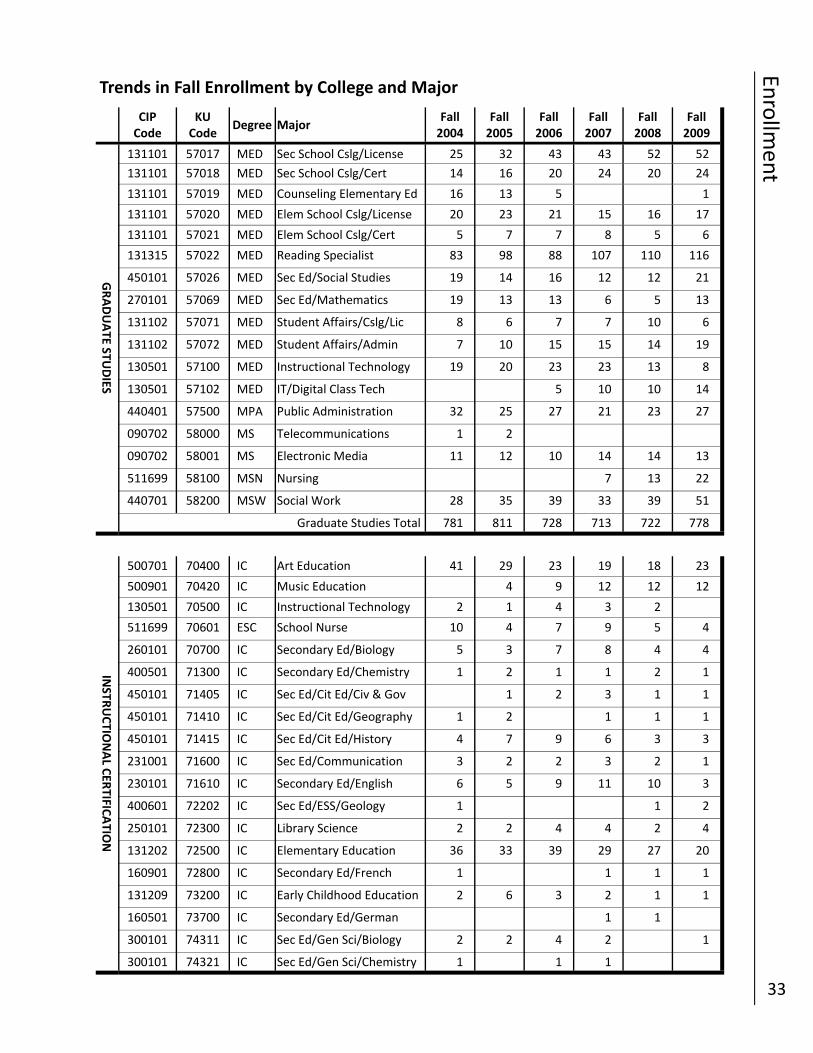
Trends in Fall Enrollment by College and Major
CIP Code
KU Code
Degree Major Fall 2004
Fall 2005
Fall 2006
Fall 2007
Fall 2008
Fall 2009
GRADUATE STU
DIES
131101 57017 MED Sec School Cslg/License 25 32 43 43 52 52
131101 57018 MED Sec School Cslg/Cert 14 16 20 24 20 24
131101 57019 MED Counseling Elementary Ed 16 13 5 1
131101 57020 MED Elem School Cslg/License 20 23 21 15 16 17
131101 57021 MED Elem School Cslg/Cert 5 7 7 8 5 6
131315 57022 MED Reading Specialist 83 98 88 107 110 116
450101 57026 MED Sec Ed/Social Studies 19 14 16 12 12 21
270101 57069 MED Sec Ed/Mathematics 19 13 13 6 5 13
131102 57071 MED Student Affairs/Cslg/Lic 8 6 7 7 10 6
131102 57072 MED Student Affairs/Admin 7 10 15 15 14 19
130501 57100 MED Instructional Technology 19 20 23 23 13 8
130501 57102 MED IT/Digital Class Tech 5 10 10 14
440401 57500 MPA Public Administration 32 25 27 21 23 27
090702 58000 MS Telecommunications 1 2
090702 58001 MS Electronic Media 11 12 10 14 14 13
511699 58100 MSN Nursing 7 13 22
440701 58200 MSW Social Work 28 35 39 33 39 51
781 811 728 713 722 778 Graduate Studies Total
INSTR
UCTIO
NAL C
ERTIFIC
ATIO
N
500701 70400 IC Art Education 41 29 23 19 18 23
500901 70420 IC Music Education 4 9 12 12 12
130501 70500 IC Instructional Technology 2 1 4 3 2
511699 70601 ESC School Nurse 10 4 7 9 5 4
260101 70700 IC Secondary Ed/Biology 5 3 7 8 4 4
400501 71300 IC Secondary Ed/Chemistry 1 2 1 1 2 1
450101 71405 IC Sec Ed/Cit Ed/Civ & Gov 1 2 3 1 1
450101 71410 IC Sec Ed/Cit Ed/Geography 1 2 1 1 1
450101 71415 IC Sec Ed/Cit Ed/History 4 7 9 6 3 3
231001 71600 IC Sec Ed/Communication 3 2 2 3 2 1
230101 71610 IC Secondary Ed/English 6 5 9 11 10 3
400601 72202 IC Sec Ed/ESS/Geology 1 1 2
250101 72300 IC Library Science 2 2 4 4 2 4
131202 72500 IC Elementary Education 36 33 39 29 27 20
160901 72800 IC Secondary Ed/French 1 1 1 1
131209 73200 IC Early Childhood Education 2 6 3 2 1 1
160501 73700 IC Secondary Ed/German 1 1
300101 74311 IC Sec Ed/Gen Sci/Biology 2 2 4 2 1
300101 74321 IC Sec Ed/Gen Sci/Chemistry 1 1 1
Enrollm
ent
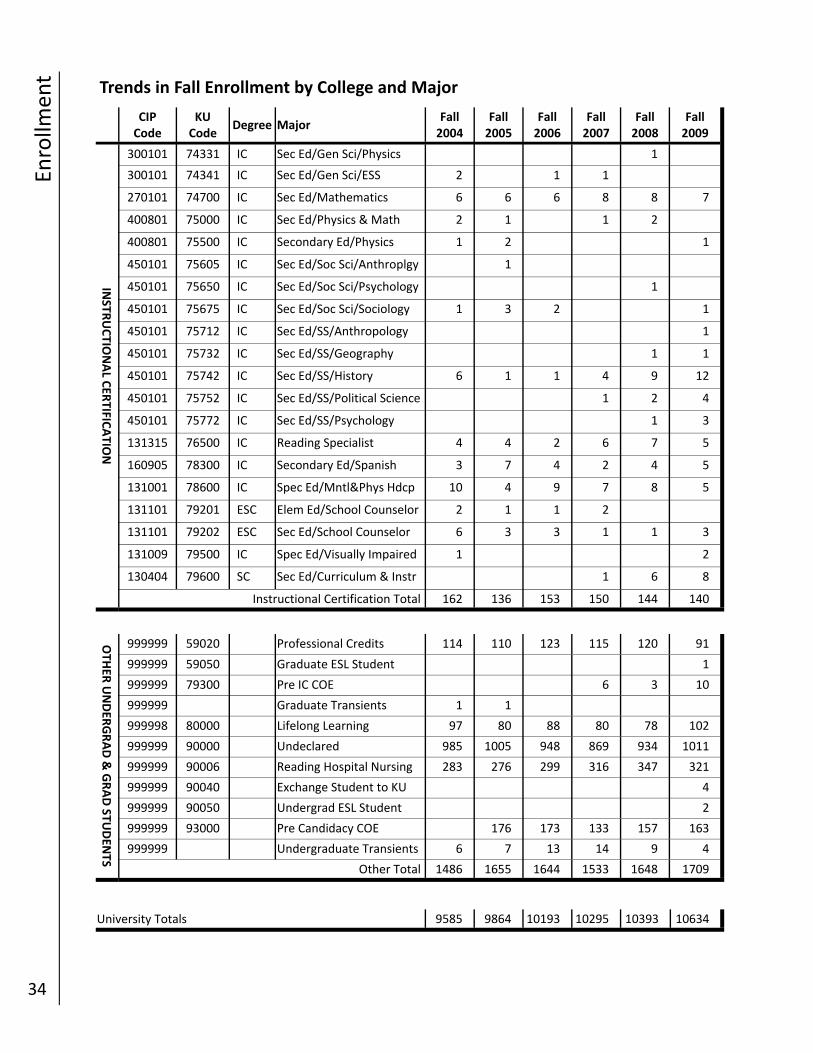
34
Trends in Fall Enrollment by College and Major
CIP Code
KU Code
Degree Major Fall 2004
Fall 2005
Fall 2006
Fall 2007
Fall 2008
Fall 2009
INSTR
UCTIO
NAL C
ERTIFIC
ATIO
N
300101 74331 IC Sec Ed/Gen Sci/Physics 1
300101 74341 IC Sec Ed/Gen Sci/ESS 2 1 1
270101 74700 IC Sec Ed/Mathematics 6 6 6 8 8 7
400801 75000 IC Sec Ed/Physics & Math 2 1 1 2
400801 75500 IC Secondary Ed/Physics 1 2 1
450101 75605 IC Sec Ed/Soc Sci/Anthroplgy 1
450101 75650 IC Sec Ed/Soc Sci/Psychology 1
450101 75675 IC Sec Ed/Soc Sci/Sociology 1 3 2 1
450101 75712 IC Sec Ed/SS/Anthropology 1
450101 75732 IC Sec Ed/SS/Geography 1 1
450101 75742 IC Sec Ed/SS/History 6 1 1 4 9 12
450101 75752 IC Sec Ed/SS/Political Science 1 2 4
450101 75772 IC Sec Ed/SS/Psychology 1 3
131315 76500 IC Reading Specialist 4 4 2 6 7 5
160905 78300 IC Secondary Ed/Spanish 3 7 4 2 4 5
131001 78600 IC Spec Ed/Mntl&Phys Hdcp 10 4 9 7 8 5
131101 79201 ESC Elem Ed/School Counselor 2 1 1 2
131101 79202 ESC Sec Ed/School Counselor 6 3 3 1 1 3
131009 79500 IC Spec Ed/Visually Impaired 1 2
130404 79600 SC Sec Ed/Curriculum & Instr 1 6 8
162 136 153 150 144 140 Instructional Certification Total
OTH
ER UNDER
GRAD & GRAD STU
DEN
TS
999999 59020 Professional Credits 114 110 123 115 120 91
999999 59050 Graduate ESL Student 1
999999 79300 Pre IC COE 6 3 10
999999 Graduate Transients 1 1
999998 80000 Lifelong Learning 97 80 88 80 78 102
999999 90000 Undeclared 985 1005 948 869 934 1011
999999 90006 Reading Hospital Nursing 283 276 299 316 347 321
999999 90040 Exchange Student to KU 4
999999 90050 Undergrad ESL Student 2
999999 93000 Pre Candidacy COE 176 173 133 157 163
999999 Undergraduate Transients 6 7 13 14 9 4
1486 1655 1644 1533 1648 1709 Other Total
9585 9864 10193 10295 10393 10634 University Totals
Enrollm
ent
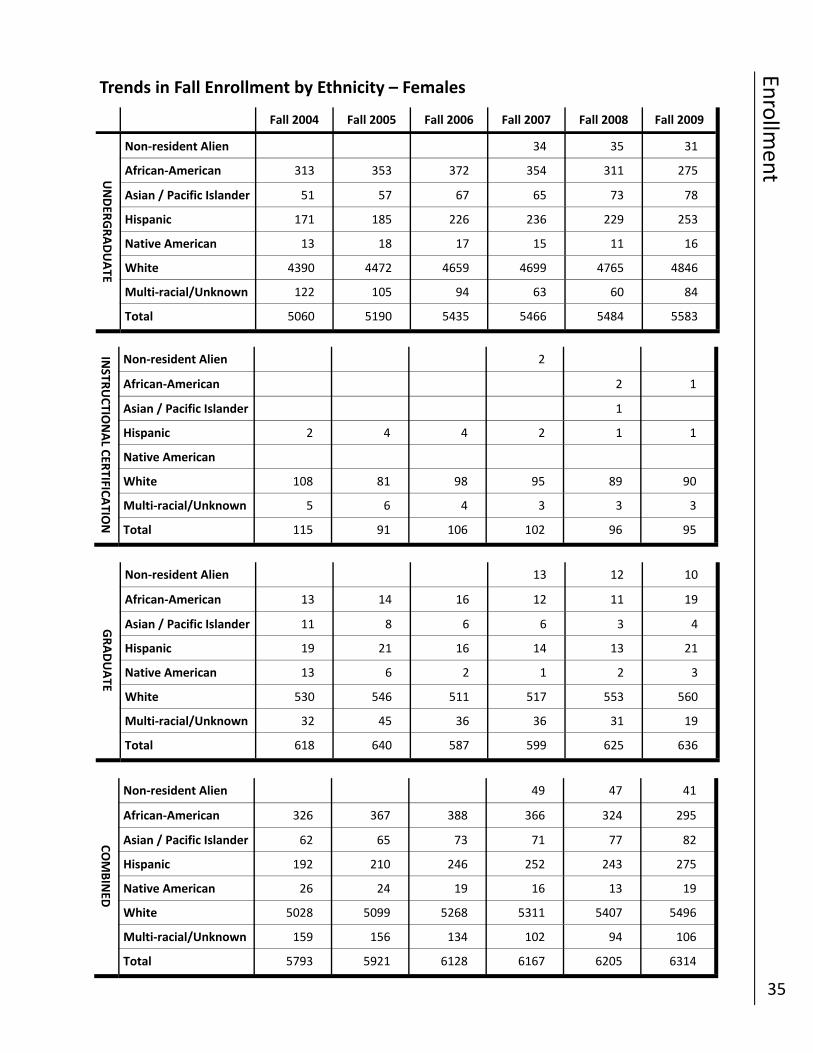
35
Trends in Fall Enrollment by Ethnicity – Females
Fall 2004 Fall 2005 Fall 2006 Fall 2007 Fall 2008 Fall 2009
UNDER
GRADUATE
Non‐resident Alien 34 35 31
African‐American 313 353 372 354 311 275
Asian / Pacific Islander 51 57 67 65 73 78
Hispanic 171 185 226 236 229 253
Native American 13 18 17 15 11 16
White 4390 4472 4659 4699 4765 4846
Multi‐racial/Unknown 122 105 94 63 60 84
Total 5060 5190 5435 5466 5484 5583
INSTR
UCTIO
NAL C
ERTIFIC
ATIO
N
Non‐resident Alien 2
African‐American 2 1
Asian / Pacific Islander 1
Hispanic 2 4 4 2 1 1
Native American
White 108 81 98 95 89 90
Multi‐racial/Unknown 5 6 4 3 3 3
Total 115 91 106 102 96 95
GRADUATE
Non‐resident Alien 13 12 10
African‐American 13 14 16 12 11 19
Asian / Pacific Islander 11 8 6 6 3 4
Hispanic 19 21 16 14 13 21
Native American 13 6 2 1 2 3
White 530 546 511 517 553 560
Multi‐racial/Unknown 32 45 36 36 31 19
Total 618 640 587 599 625 636
COMBINED
Non‐resident Alien 49 47 41
African‐American 326 367 388 366 324 295
Asian / Pacific Islander 62 65 73 71 77 82
Hispanic 192 210 246 252 243 275
Native American 26 24 19 16 13 19
White 5028 5099 5268 5311 5407 5496
Multi‐racial/Unknown 159 156 134 102 94 106
Total 5793 5921 6128 6167 6205 6314
Enrollm
ent
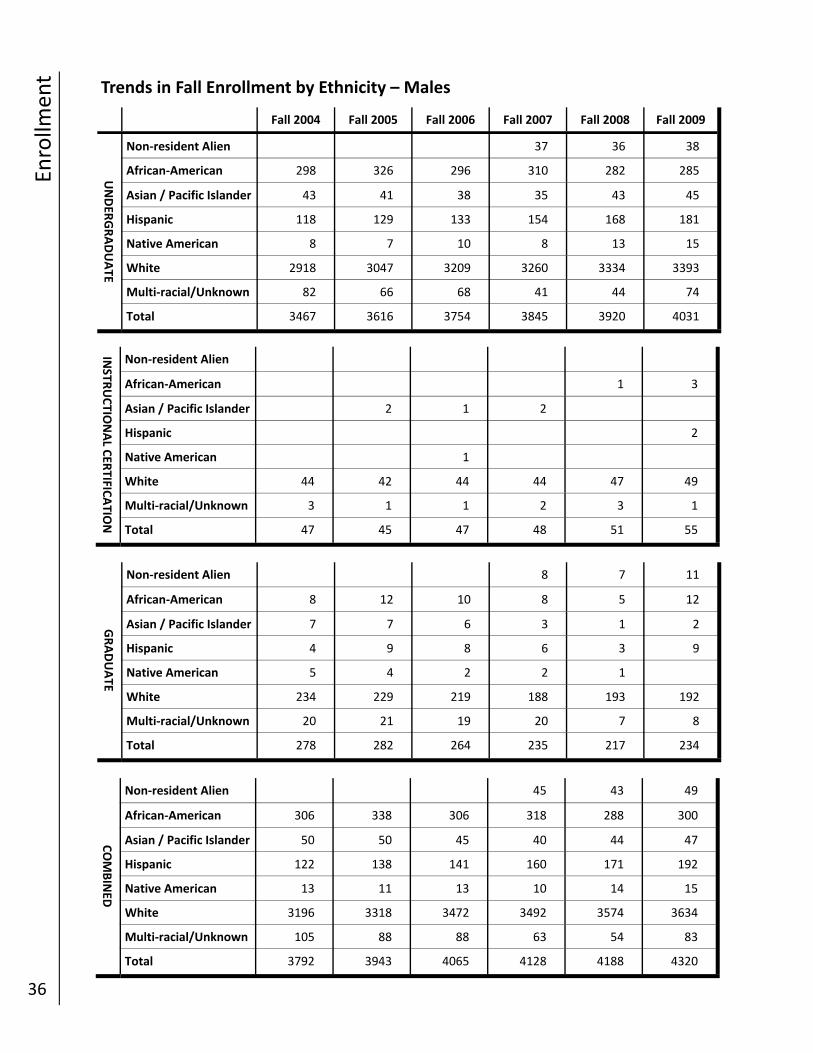
36
Trends in Fall Enrollment by Ethnicity – Males
Fall 2004 Fall 2005 Fall 2006 Fall 2007 Fall 2008 Fall 2009
UNDER
GRADUATE
Non‐resident Alien 37 36 38
African‐American 298 326 296 310 282 285
Asian / Pacific Islander 43 41 38 35 43 45
Hispanic 118 129 133 154 168 181
Native American 8 7 10 8 13 15
White 2918 3047 3209 3260 3334 3393
Multi‐racial/Unknown 82 66 68 41 44 74
Total 3467 3616 3754 3845 3920 4031
INSTR
UCTIO
NAL C
ERTIFIC
ATIO
N
Non‐resident Alien
African‐American 1 3
Asian / Pacific Islander 2 1 2
Hispanic 2
Native American 1
White 44 42 44 44 47 49
Multi‐racial/Unknown 3 1 1 2 3 1
Total 47 45 47 48 51 55
GRADUATE
Non‐resident Alien 8 7 11
African‐American 8 12 10 8 5 12
Asian / Pacific Islander 7 7 6 3 1 2
Hispanic 4 9 8 6 3 9
Native American 5 4 2 2 1
White 234 229 219 188 193 192
Multi‐racial/Unknown 20 21 19 20 7 8
Total 278 282 264 235 217 234
COMBINED
Non‐resident Alien 45 43 49
African‐American 306 338 306 318 288 300
Asian / Pacific Islander 50 50 45 40 44 47
Hispanic 122 138 141 160 171 192
Native American 13 11 13 10 14 15
White 3196 3318 3472 3492 3574 3634
Multi‐racial/Unknown 105 88 88 63 54 83
Total 3792 3943 4065 4128 4188 4320
Enrollm
ent
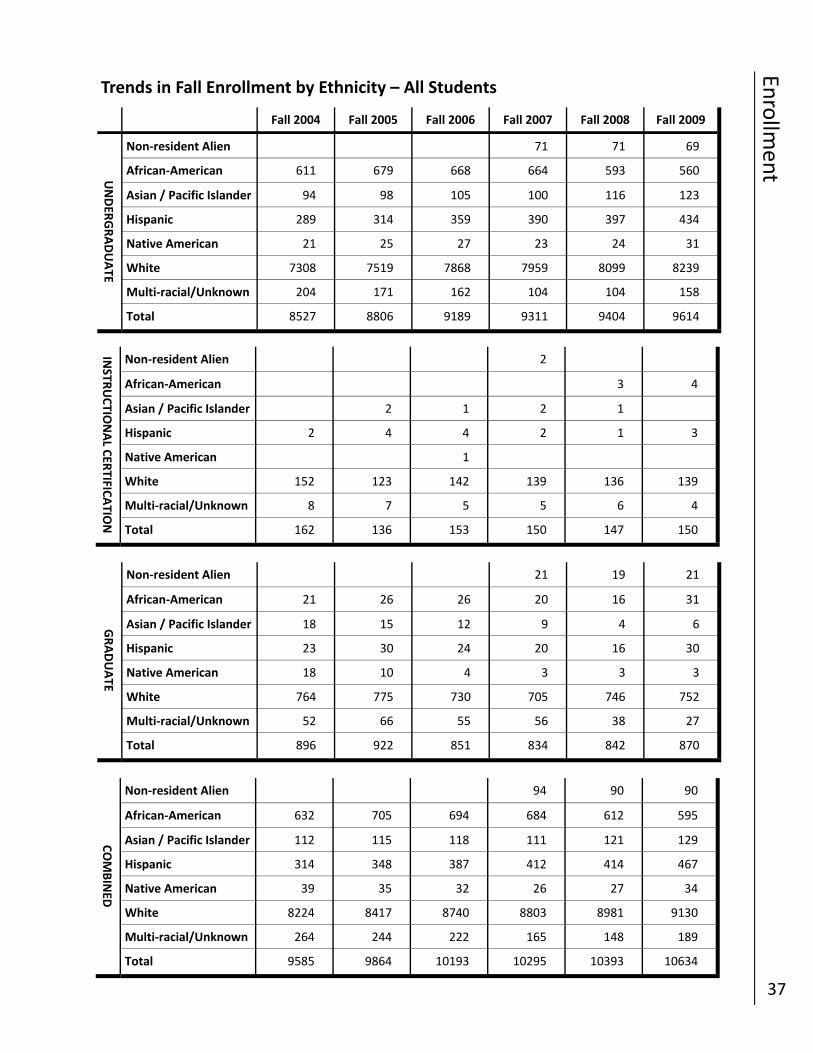
37
Trends in Fall Enrollment by Ethnicity – All Students
Fall 2004 Fall 2005 Fall 2006 Fall 2007 Fall 2008 Fall 2009
UNDER
GRADUATE
Non‐resident Alien 71 71 69
African‐American 611 679 668 664 593 560
Asian / Pacific Islander 94 98 105 100 116 123
Hispanic 289 314 359 390 397 434
Native American 21 25 27 23 24 31
White 7308 7519 7868 7959 8099 8239
Multi‐racial/Unknown 204 171 162 104 104 158
Total 8527 8806 9189 9311 9404 9614
INSTR
UCTIO
NAL C
ERTIFIC
ATIO
N
Non‐resident Alien 2
African‐American 3 4
Asian / Pacific Islander 2 1 2 1
Hispanic 2 4 4 2 1 3
Native American 1
White 152 123 142 139 136 139
Multi‐racial/Unknown 8 7 5 5 6 4
Total 162 136 153 150 147 150
GRADUATE
Non‐resident Alien 21 19 21
African‐American 21 26 26 20 16 31
Asian / Pacific Islander 18 15 12 9 4 6
Hispanic 23 30 24 20 16 30
Native American 18 10 4 3 3 3
White 764 775 730 705 746 752
Multi‐racial/Unknown 52 66 55 56 38 27
Total 896 922 851 834 842 870
COMBINED
Non‐resident Alien 94 90 90
African‐American 632 705 694 684 612 595
Asian / Pacific Islander 112 115 118 111 121 129
Hispanic 314 348 387 412 414 467
Native American 39 35 32 26 27 34
White 8224 8417 8740 8803 8981 9130
Multi‐racial/Unknown 264 244 222 165 148 189
Total 9585 9864 10193 10295 10393 10634
Enrollm
ent
38
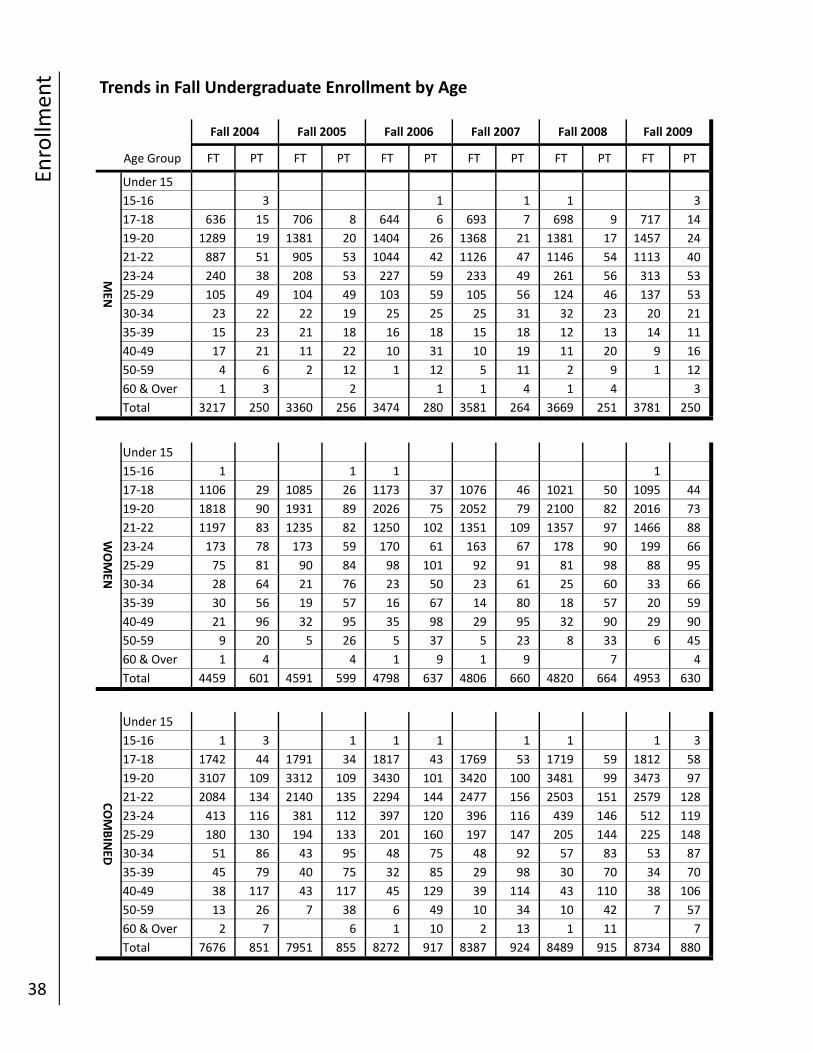
Trends in Fall Undergraduate Enrollment by Age
Age Group
Fall 2004 Fall 2005 Fall 2006 Fall 2007 Fall 2008 Fall 2009
FT PT FT PT FT PT FT PT FT PT FT PT
MEN
Under 15
15‐16 3 1 1 1 3
17‐18 636 15 706 8 644 6 693 7 698 9 717 14
19‐20 1289 19 1381 20 1404 26 1368 21 1381 17 1457 24
21‐22 887 51 905 53 1044 42 1126 47 1146 54 1113 40
23‐24 240 38 208 53 227 59 233 49 261 56 313 53
25‐29 105 49 104 49 103 59 105 56 124 46 137 53
30‐34 23 22 22 19 25 25 25 31 32 23 20 21
35‐39 15 23 21 18 16 18 15 18 12 13 14 11
40‐49 17 21 11 22 10 31 10 19 11 20 9 16
50‐59 4 6 2 12 1 12 5 11 2 9 1 12
60 & Over 1 3 2 1 1 4 1 4 3
Total 3217 250 3360 256 3474 280 3581 264 3669 251 3781 250
WOMEN
Under 15
15‐16 1 1 1 1
17‐18 1106 29 1085 26 1173 37 1076 46 1021 50 1095 44
19‐20 1818 90 1931 89 2026 75 2052 79 2100 82 2016 73
21‐22 1197 83 1235 82 1250 102 1351 109 1357 97 1466 88
23‐24 173 78 173 59 170 61 163 67 178 90 199 66
25‐29 75 81 90 84 98 101 92 91 81 98 88 95
30‐34 28 64 21 76 23 50 23 61 25 60 33 66
35‐39 30 56 19 57 16 67 14 80 18 57 20 59
40‐49 21 96 32 95 35 98 29 95 32 90 29 90
50‐59 9 20 5 26 5 37 5 23 8 33 6 45
60 & Over 1 4 4 1 9 1 9 7 4
Total 4459 601 4591 599 4798 637 4806 660 4820 664 4953 630
COMBINED
Under 15
15‐16 1 3 1 1 1 1 1 1 3
17‐18 1742 44 1791 34 1817 43 1769 53 1719 59 1812 58
19‐20 3107 109 3312 109 3430 101 3420 100 3481 99 3473 97
21‐22 2084 134 2140 135 2294 144 2477 156 2503 151 2579 128
23‐24 413 116 381 112 397 120 396 116 439 146 512 119
25‐29 180 130 194 133 201 160 197 147 205 144 225 148
30‐34 51 86 43 95 48 75 48 92 57 83 53 87
35‐39 45 79 40 75 32 85 29 98 30 70 34 70
40‐49 38 117 43 117 45 129 39 114 43 110 38 106
50‐59 13 26 7 38 6 49 10 34 10 42 7 57
60 & Over 2 7 6 1 10 2 13 1 11 7
Total 7676 851 7951 855 8272 917 8387 924 8489 915 8734 880
Enrollm
ent
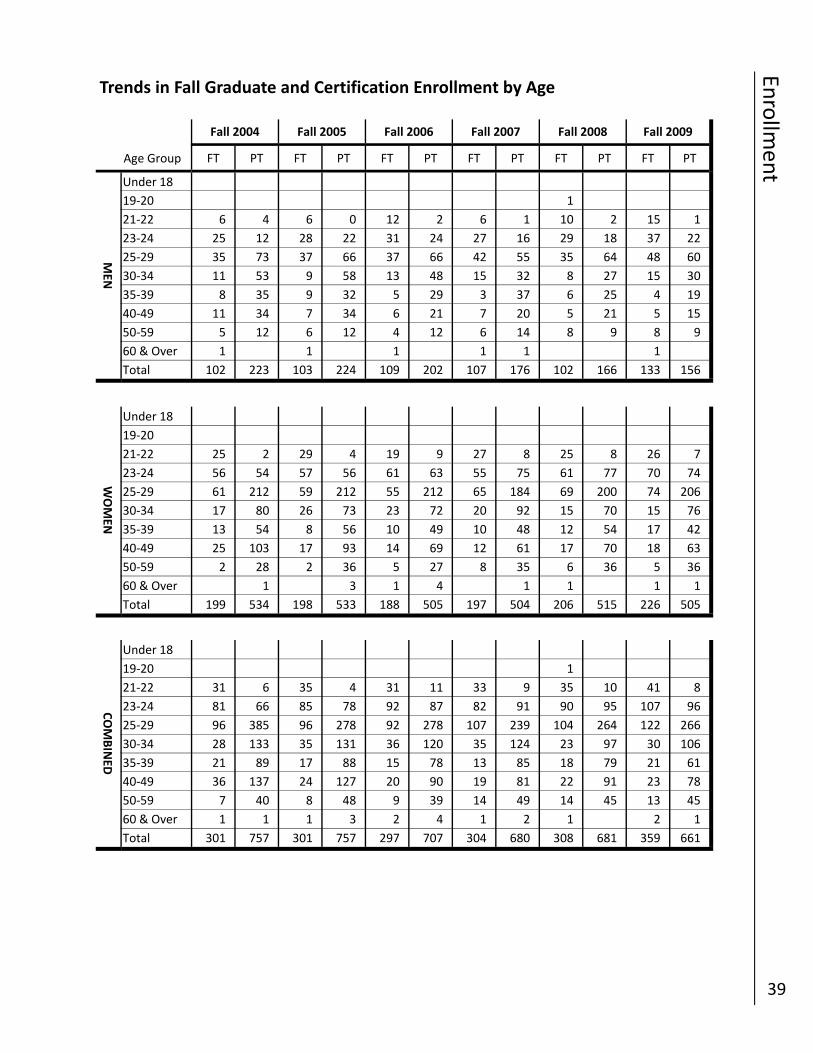
39
Trends in Fall Graduate and Certification Enrollment by Age
Age Group
Fall 2004 Fall 2005 Fall 2006 Fall 2007 Fall 2008 Fall 2009
FT PT FT PT FT PT FT PT FT PT FT PT
MEN
Under 18
19‐20 1
21‐22 6 4 6 0 12 2 6 1 10 2 15 1
23‐24 25 12 28 22 31 24 27 16 29 18 37 22
25‐29 35 73 37 66 37 66 42 55 35 64 48 60
30‐34 11 53 9 58 13 48 15 32 8 27 15 30
35‐39 8 35 9 32 5 29 3 37 6 25 4 19
40‐49 11 34 7 34 6 21 7 20 5 21 5 15
50‐59 5 12 6 12 4 12 6 14 8 9 8 9
60 & Over 1 1 1 1 1 1
Total 102 223 103 224 109 202 107 176 102 166 133 156
WOMEN
Under 18
19‐20
21‐22 25 2 29 4 19 9 27 8 25 8 26 7
23‐24 56 54 57 56 61 63 55 75 61 77 70 74
25‐29 61 212 59 212 55 212 65 184 69 200 74 206
30‐34 17 80 26 73 23 72 20 92 15 70 15 76
35‐39 13 54 8 56 10 49 10 48 12 54 17 42
40‐49 25 103 17 93 14 69 12 61 17 70 18 63
50‐59 2 28 2 36 5 27 8 35 6 36 5 36
60 & Over 1 3 1 4 1 1 1 1
Total 199 534 198 533 188 505 197 504 206 515 226 505
COMBINED
Under 18
19‐20 1
21‐22 31 6 35 4 31 11 33 9 35 10 41 8
23‐24 81 66 85 78 92 87 82 91 90 95 107 96
25‐29 96 385 96 278 92 278 107 239 104 264 122 266
30‐34 28 133 35 131 36 120 35 124 23 97 30 106
35‐39 21 89 17 88 15 78 13 85 18 79 21 61
40‐49 36 137 24 127 20 90 19 81 22 91 23 78
50‐59 7 40 8 48 9 39 14 49 14 45 13 45
60 & Over 1 1 1 3 2 4 1 2 1 2 1
Total 301 757 301 757 297 707 304 680 308 681 359 661
Enrollm
ent
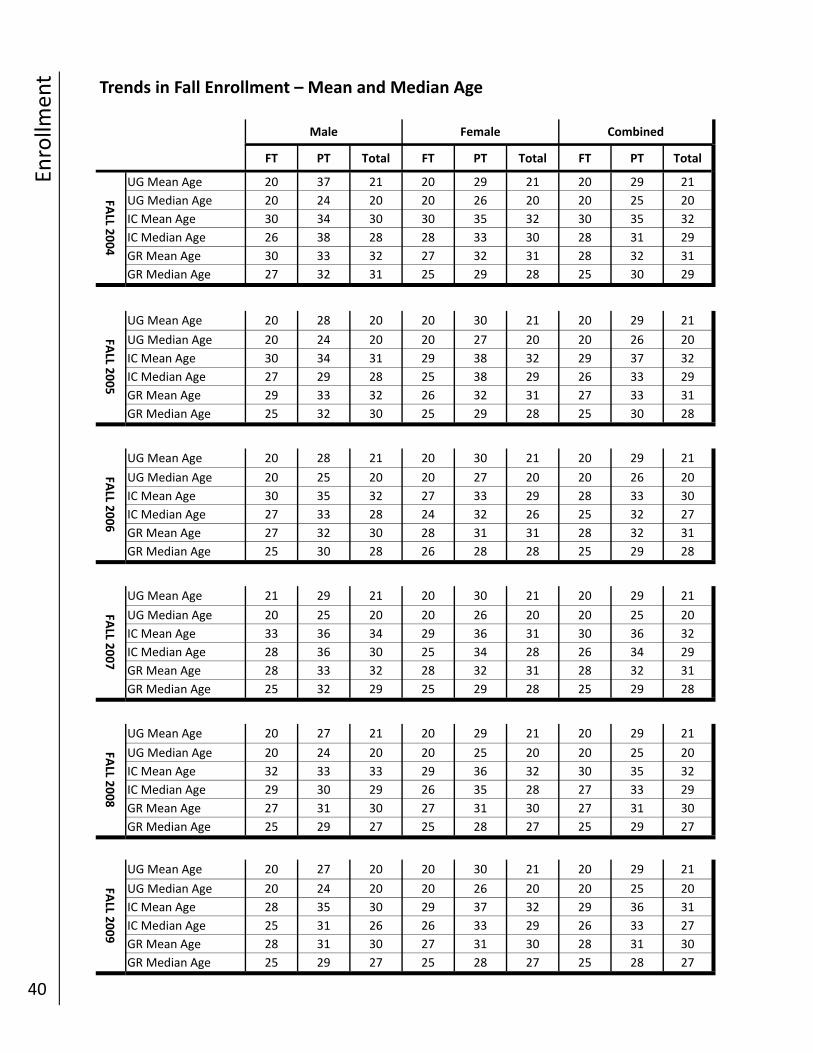
40
Trends in Fall Enrollment – Mean and Median Age
Male Female
FT PT Total FT PT Total FT PT Total
FALL 2
004
UG Mean Age 20 37 21 20 29 21 20 29 21
UG Median Age 20 24 20 20 26 20 20 25 20
IC Mean Age 30 34 30 30 35 32 30 35 32
IC Median Age 26 38 28 28 33 30 28 31 29
GR Mean Age 30 33 32 27 32 31 28 32 31
GR Median Age 27 32 31 25 29 28 25 30 29
Combined
FALL 2
005
UG Mean Age 20 28 20 20 30 21 20 29 21
UG Median Age 20 24 20 20 27 20 20 26 20
IC Mean Age 30 34 31 29 38 32 29 37 32
IC Median Age 27 29 28 25 38 29 26 33 29
GR Mean Age 29 33 32 26 32 31 27 33 31
GR Median Age 25 32 30 25 29 28 25 30 28
FALL 2
006
UG Mean Age 20 28 21 20 30 21 20 29 21
UG Median Age 20 25 20 20 27 20 20 26 20
IC Mean Age 30 35 32 27 33 29 28 33 30
IC Median Age 27 33 28 24 32 26 25 32 27
GR Mean Age 27 32 30 28 31 31 28 32 31
GR Median Age 25 30 28 26 28 28 25 29 28
FALL 2
007
UG Mean Age 21 29 21 20 30 21 20 29 21
UG Median Age 20 25 20 20 26 20 20 25 20
IC Mean Age 33 36 34 29 36 31 30 36 32
IC Median Age 28 36 30 25 34 28 26 34 29
GR Mean Age 28 33 32 28 32 31 28 32 31
GR Median Age 25 32 29 25 29 28 25 29 28 FA
LL 2008
UG Mean Age 20 27 21 20 29 21 20 29 21
UG Median Age 20 24 20 20 25 20 20 25 20
IC Mean Age 32 33 33 29 36 32 30 35 32
IC Median Age 29 30 29 26 35 28 27 33 29
GR Mean Age 27 31 30 27 31 30 27 31 30
GR Median Age 25 29 27 25 28 27 25 29 27
FALL 2
009
UG Mean Age 20 27 20 20 30 21 20 29 21
UG Median Age 20 24 20 20 26 20 20 25 20
IC Mean Age 28 35 30 29 37 32 29 36 31
IC Median Age 25 31 26 26 33 29 26 33 27
GR Mean Age 28 31 30 27 31 30 28 31 30
GR Median Age 25 29 27 25 28 27 25 28 27
Enrollm
ent
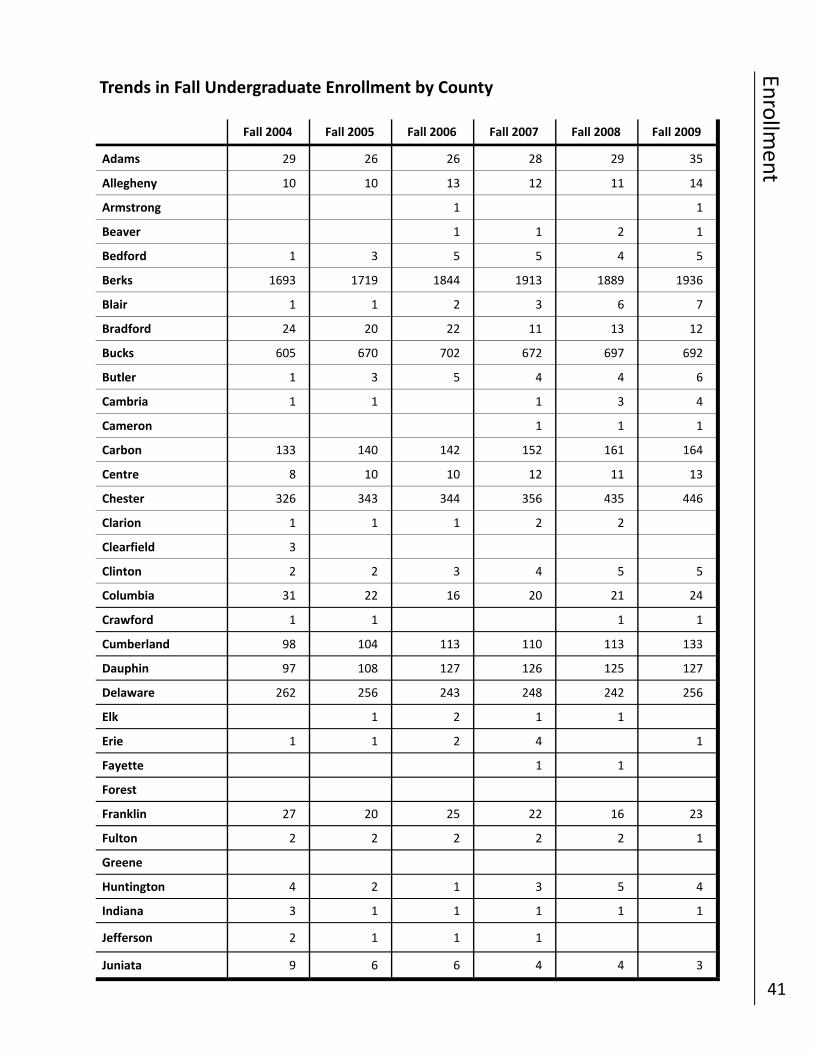
41
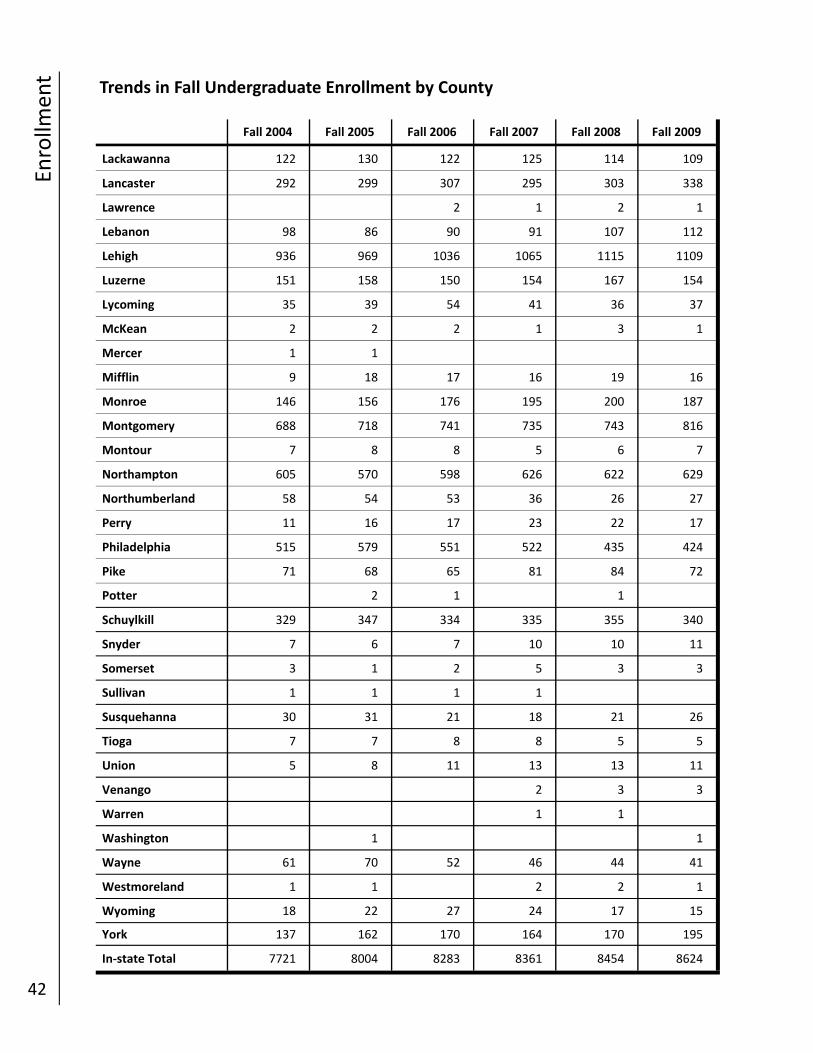
Trends in Fall Undergraduate Enrollment by County
Fall 2004 Fall 2005 Fall 2006 Fall 2007 Fall 2008 Fall 2009
Adams 29 26 26 28 29 35
Allegheny 10 10 13 12 11 14
Armstrong 1 1
Beaver 1 1 2 1
Bedford 1 3 5 5 4 5
Berks 1693 1719 1844 1913 1889 1936
Blair 1 1 2 3 6 7
Bradford 24 20 22 11 13 12
Bucks 605 670 702 672 697 692
Butler 1 3 5 4 4 6
Cambria 1 1 1 3 4
Cameron 1 1 1
Carbon 133 140 142 152 161 164
Centre 8 10 10 12 11 13
Chester 326 343 344 356 435 446
Clarion 1 1 1 2 2
Clearfield 3
Clinton 2 2 3 4 5 5
Columbia 31 22 16 20 21 24
Crawford 1 1 1 1
Cumberland 98 104 113 110 113 133
Dauphin 97 108 127 126 125 127
Delaware 262 256 243 248 242 256
Elk 1 2 1 1
Erie 1 1 2 4 1
Fayette 1 1
Forest
Franklin 27 20 25 22 16 23
Fulton 2 2 2 2 2 1
Greene
Huntington 4 2 1 3 5 4
Jefferson 2 1 1 1
Indiana 3 1 1 1 1 1
Juniata 9 6 6 4 4 3
Enrollm
ent
42
Trends in Fall Undergraduate Enrollment by County
Fall 2004 Fall 2005 Fall 2006 Fall 2007 Fall 2008 Fall 2009
Lackawanna 122 130 122 125 114 109
Lancaster 292 299 307 295 303 338
Lawrence 2 1 2 1
Lebanon 98 86 90 91 107 112
Lehigh 936 969 1036 1065 1115 1109
Luzerne 151 158 150 154 167 154
Lycoming 35 39 54 41 36 37
McKean 2 2 2 1 3 1
Mercer 1 1
Mifflin 9 18 17 16 19 16
Monroe 146 156 176 195 200 187
Montgomery 688 718 741 735 743 816
Montour 7 8 8 5 6 7
Northampton 605 570 598 626 622 629
Northumberland 58 54 53 36 26 27
Perry 11 16 17 23 22 17
Philadelphia 515 579 551 522 435 424
Pike 71 68 65 81 84 72
Potter 2 1 1
Schuylkill 329 347 334 335 355 340
Snyder 7 6 7 10 10 11
Somerset 3 1 2 5 3 3
Sullivan 1 1 1 1
Susquehanna 30 31 21 18 21 26
Tioga 7 7 8 8 5 5
Union 5 8 11 13 13 11
Venango 2 3 3
Warren 1 1
Washington 1 1
Wayne 61 70 52 46 44 41
Westmoreland 1 1 2 2 1
York 137 162 170 164 170 195
Wyoming 18 22 27 24 17 15
In‐state Total 7721 8004 8283 8361 8454 8624
Enrollm
ent
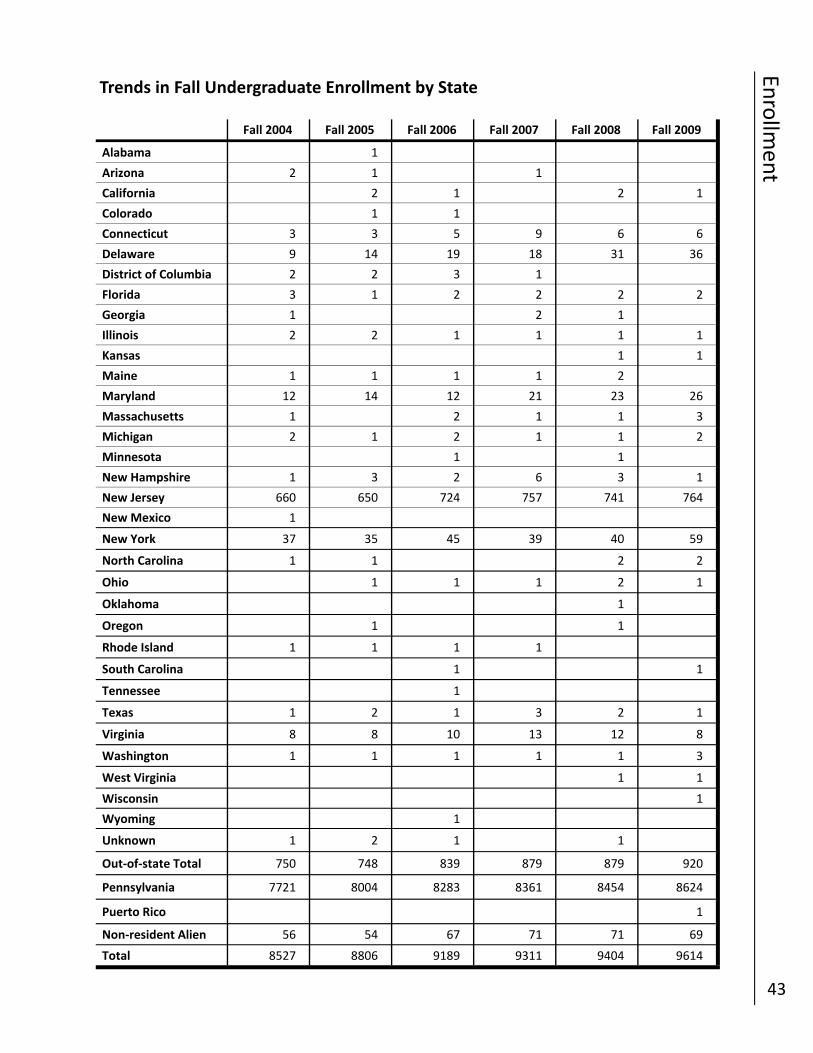
43
Trends in Fall Undergraduate Enrollment by State
Fall 2004 Fall 2005 Fall 2006 Fall 2007 Fall 2008 Fall 2009
Alabama 1
Arizona 2 1 1
California 2 1 2 1
Colorado 1 1
Connecticut 3 3 5 9 6 6
Delaware 9 14 19 18 31 36
District of Columbia 2 2 3 1
Florida 3 1 2 2 2 2
Georgia 1 2 1
Illinois 2 2 1 1 1 1
Kansas 1 1
Maine 1 1 1 1 2
Maryland 12 14 12 21 23 26
Massachusetts 1 2 1 1 3
Michigan 2 1 2 1 1 2
Minnesota 1 1
New Hampshire 1 3 2 6 3 1
New Jersey 660 650 724 757 741 764
New Mexico 1
New York 37 35 45 39 40 59
North Carolina 1 1 2 2
Ohio 1 1 1 2 1
Oklahoma 1
Oregon 1 1
Rhode Island 1 1 1 1
South Carolina 1 1
Tennessee 1
Texas 1 2 1 3 2 1
Virginia 8 8 10 13 12 8
Washington 1 1 1 1 1 3
West Virginia 1 1
Out‐of‐state Total 750 748 839 879 879 920
Wyoming 1
Pennsylvania 7721 8004 8283 8361 8454 8624
Puerto Rico 1
Non‐resident Alien 56 54 67 71 71 69
Total 8527 8806 9189 9311 9404 9614
Wisconsin 1
Unknown 1 2 1 1
Enrollm
ent
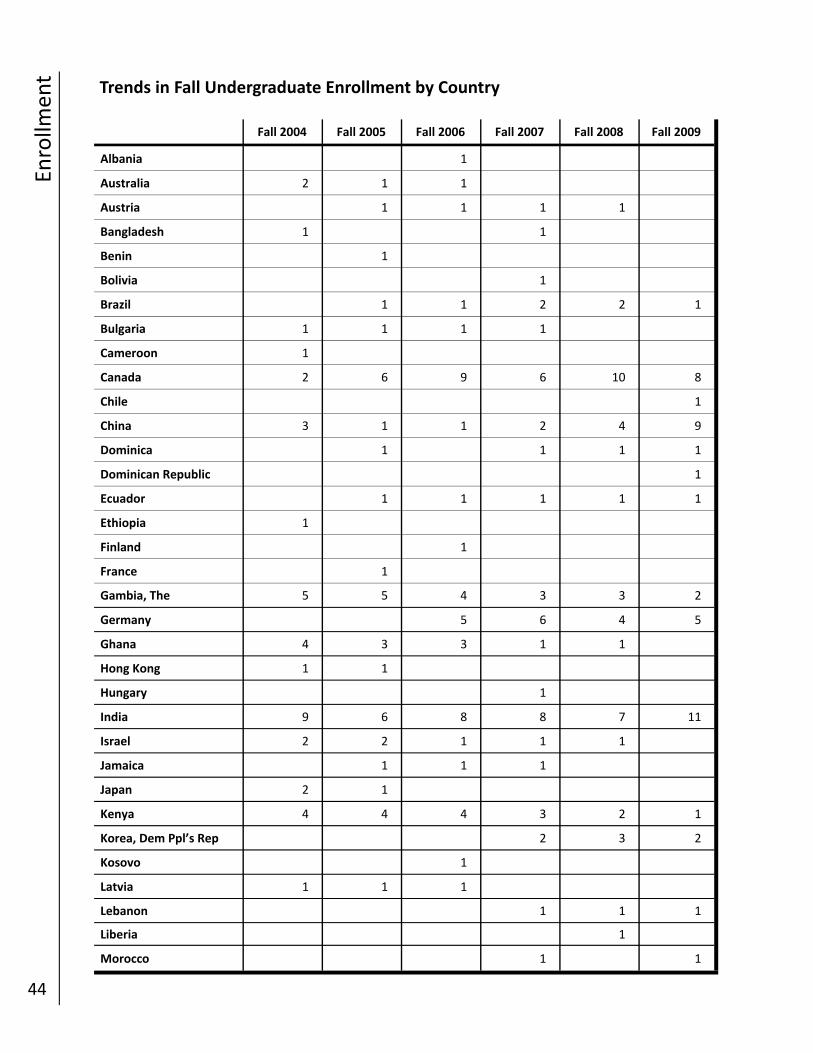
44
Trends in Fall Undergraduate Enrollment by Country
Fall 2004 Fall 2005 Fall 2006 Fall 2007 Fall 2008 Fall 2009
Albania 1
Australia 2 1 1
Austria 1 1 1 1
Bangladesh 1 1
Benin 1
Bolivia 1
Brazil 1 1 2 2 1
Bulgaria 1 1 1 1
Cameroon 1
Canada 2 6 9 6 10 8
Chile 1
China 3 1 1 2 4 9
Dominica 1 1 1 1
Dominican Republic 1
Ecuador 1 1 1 1 1
Ethiopia 1
Finland 1
France 1
Gambia, The 5 5 4 3 3 2
Germany 5 6 4 5
Ghana 4 3 3 1 1
Hong Kong 1 1
Hungary 1
India 9 6 8 8 7 11
Israel 2 2 1 1 1
Jamaica 1 1 1
Japan 2 1
Kenya 4 4 4 3 2 1
Korea, Dem Ppl’s Rep 2 3 2
Kosovo 1
Latvia 1 1 1
Lebanon 1 1 1
Liberia 1
Morocco 1 1
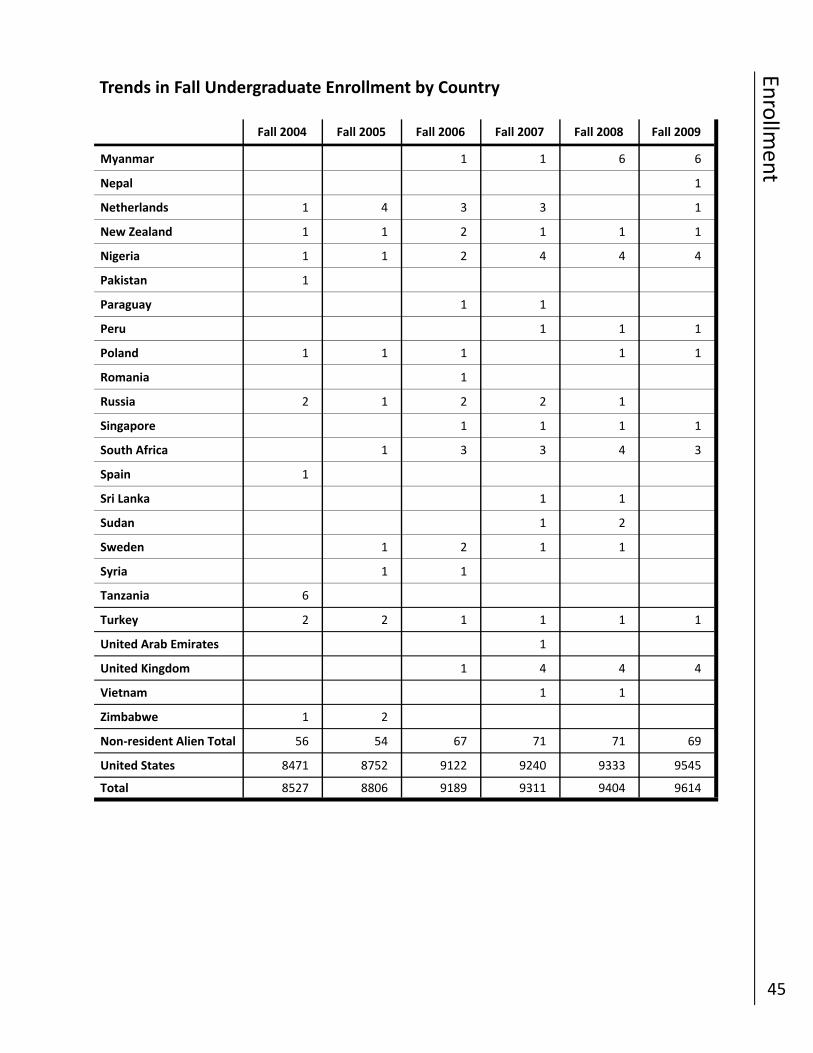
Enrollm
ent
45
Trends in Fall Undergraduate Enrollment by Country
Fall 2004 Fall 2005 Fall 2006 Fall 2007 Fall 2008 Fall 2009
Myanmar 1 1 6 6
Nepal 1
Netherlands 1 4 3 3 1
New Zealand 1 1 2 1 1 1
Nigeria 1 1 2 4 4 4
Pakistan 1
Paraguay 1 1
Peru 1 1 1
Poland 1 1 1 1 1
Romania 1
Russia 2 1 2 2 1
Singapore 1 1 1 1
South Africa 1 3 3 4 3
Spain 1
Sri Lanka 1 1
Sudan 1 2
Sweden 1 2 1 1
Syria 1 1
Tanzania 6
Turkey 2 2 1 1 1 1
United Arab Emirates 1
United Kingdom 1 4 4 4
Vietnam 1 1
Zimbabwe 1 2
Non‐resident Alien Total 56 54 67 71 71 69
United States 8471 8752 9122 9240 9333 9545
Total 8527 8806 9189 9311 9404 9614
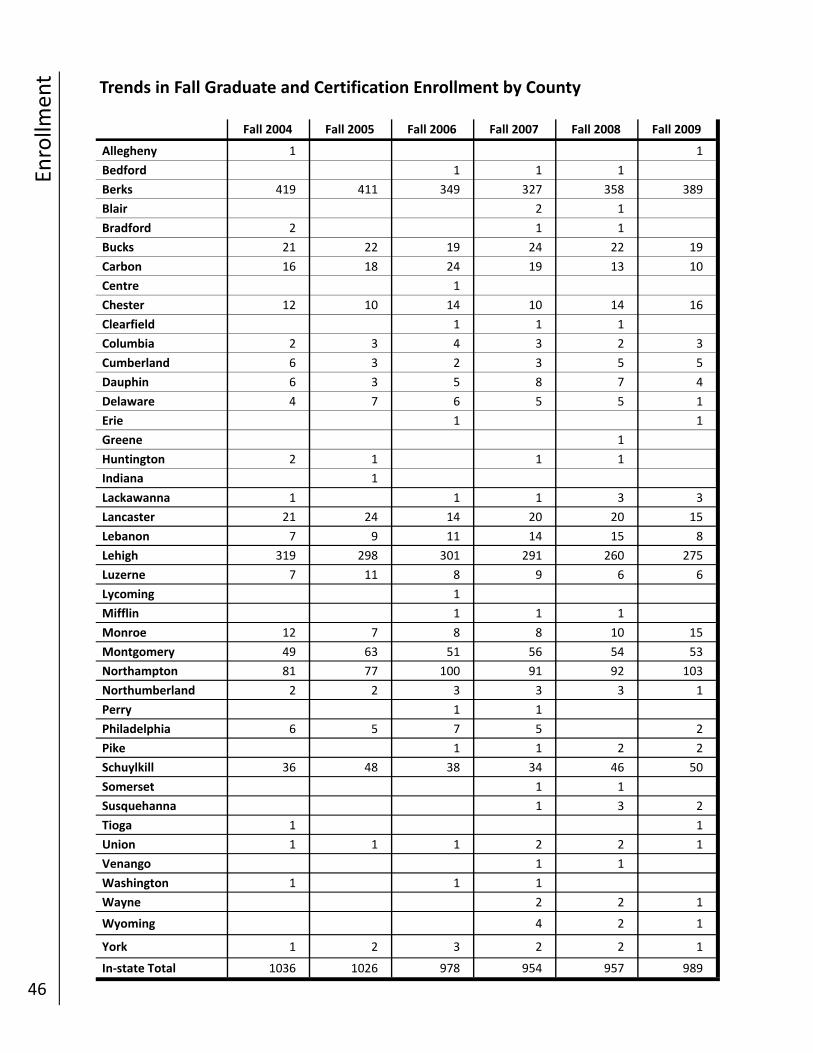
Enrollm
ent
46
Trends in Fall Graduate and Certification Enrollment by County
Fall 2004 Fall 2005 Fall 2006 Fall 2007 Fall 2008 Fall 2009
Allegheny 1 1
Bedford 1 1 1
Berks 419 411 349 327 358 389
Blair 2 1
Bradford 2 1 1
Bucks 21 22 19 24 22 19
Carbon 16 18 24 19 13 10
Centre 1
Chester 12 10 14 10 14 16
Clearfield 1 1 1
Columbia 2 3 4 3 2 3
Cumberland 6 3 2 3 5 5
Dauphin 6 3 5 8 7 4
Delaware 4 7 6 5 5 1
Erie 1 1
Greene 1
Huntington 2 1 1 1
Indiana 1
Lackawanna 1 1 1 3 3
Lancaster 21 24 14 20 20 15
Lebanon 7 9 11 14 15 8
Lehigh 319 298 301 291 260 275
Luzerne 7 11 8 9 6 6
Lycoming 1
Mifflin 1 1 1
Monroe 12 7 8 8 10 15
Montgomery 49 63 51 56 54 53
Northampton 81 77 100 91 92 103
Northumberland 2 2 3 3 3 1
Perry 1 1
Philadelphia 6 5 7 5 2
Pike 1 1 2 2
Schuylkill 36 48 38 34 46 50
Somerset 1 1
Susquehanna 1 3 2
Tioga 1 1
Union 1 1 1 2 2 1
Venango 1 1
Washington 1 1 1
Wayne 2 2 1
Wyoming 4 2 1
York 1 2 3 2 2 1
In‐state Total 1036 1026 978 954 957 989
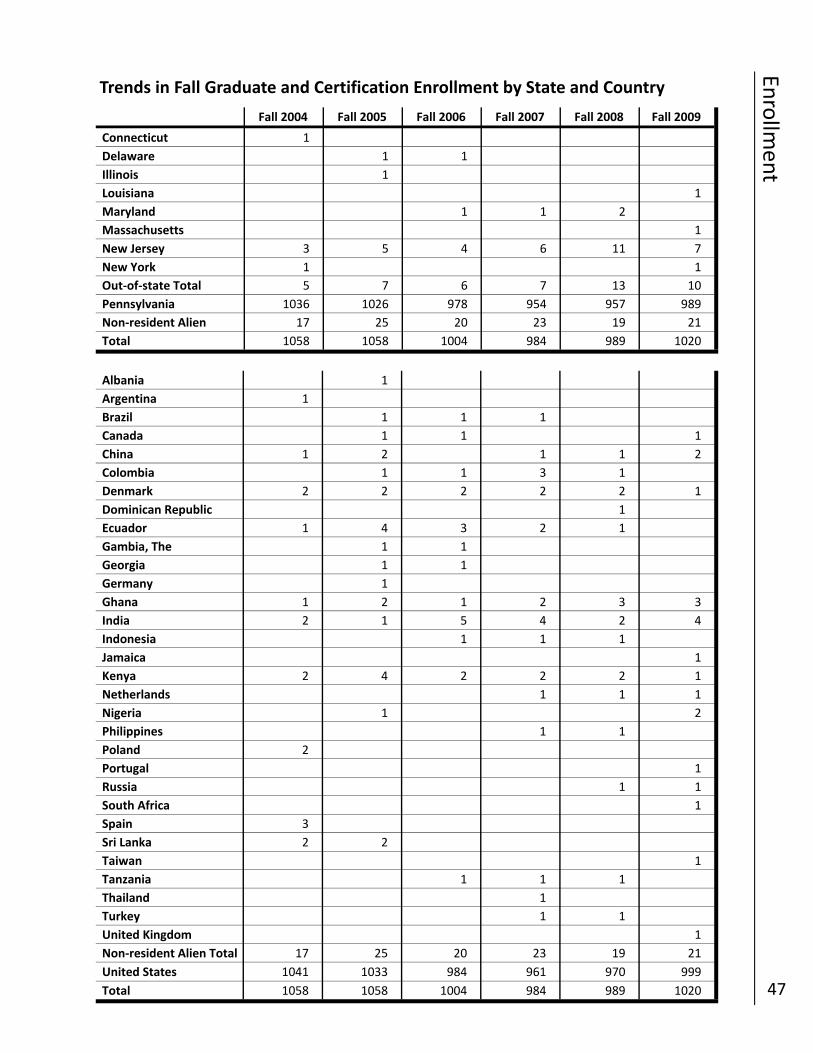
Enrollm
ent
47
Trends in Fall Graduate and Certification Enrollment by State and Country
Fall 2004 Fall 2005 Fall 2006 Fall 2007 Fall 2008 Fall 2009
Connecticut 1
Delaware 1 1
Illinois 1
Louisiana 1
Maryland 1 1 2
Massachusetts 1
New Jersey 3 5 4 6 11 7
New York 1 1
Out‐of‐state Total 5 7 6 7 13 10
Pennsylvania 1036 1026 978 954 957 989
Non‐resident Alien 17 25 20 23 19 21
Total 1058 1058 1004 984 989 1020
Albania 1
Argentina 1
Brazil 1 1 1
Canada 1 1 1
China 1 2 1 1 2
Colombia 1 1 3 1
Denmark 2 2 2 2 2 1
Dominican Republic 1
Ecuador 1 4 3 2 1
Gambia, The 1 1
Georgia 1 1
Total 1058 1058 1004 984 989 1020
Germany 1
Ghana 1 2 1 2 3 3
India 2 1 5 4 2 4
Indonesia 1 1 1
Portugal 1
Russia 1 1
Spain 3
Thailand 1
Turkey 1 1
United Kingdom 1
Non‐resident Alien Total 17 25 20 23 19 21
Jamaica 1
Kenya 2 4 2 2 2 1
Philippines 1 1
Poland 2
Netherlands 1 1 1
Nigeria 1 2
Sri Lanka 2 2
Taiwan 1
Tanzania 1 1 1
United States 1041 1033 984 961 970 999
South Africa 1
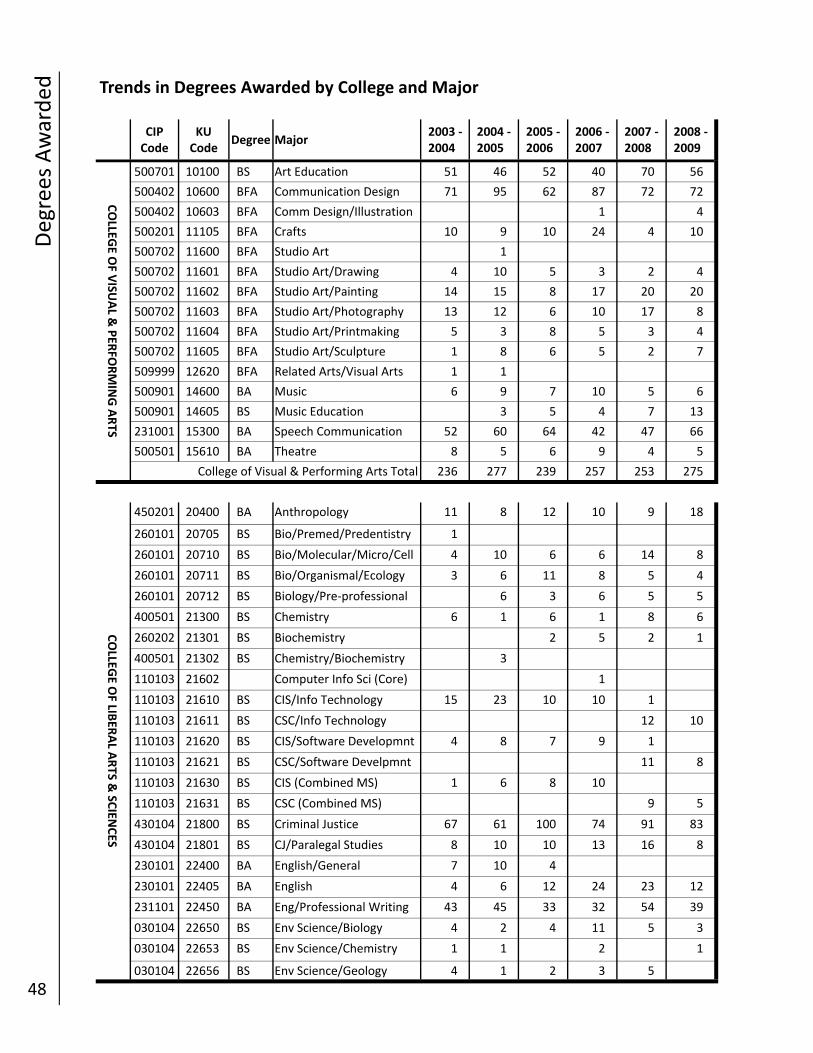
Degrees Awarded
48
Trends in Degrees Awarded by College and Major
CIP Code
KU Code
Degree Major 2003 ‐ 2004
2004 ‐ 2005
2005 ‐ 2006
2006 ‐ 2007
2007 ‐ 2008
2008 ‐ 2009
COLLEG
E OF V
ISUAL &
PER
FORMING ARTS
500701 10100 BS Art Education 51 46 52 40 70 56
500402 10600 BFA Communication Design 71 95 62 87 72 72
500402 10603 BFA Comm Design/Illustration 1 4
500201 11105 BFA Crafts 10 9 10 24 4 10
500702 11600 BFA Studio Art 1
500702 11601 BFA Studio Art/Drawing 4 10 5 3 2 4
500702 11602 BFA Studio Art/Painting 14 15 8 17 20 20
500702 11603 BFA Studio Art/Photography 13 12 6 10 17 8
500702 11604 BFA Studio Art/Printmaking 5 3 8 5 3 4
500702 11605 BFA Studio Art/Sculpture 1 8 6 5 2 7
509999 12620 BFA Related Arts/Visual Arts 1 1
500901 14600 BA Music 6 9 7 10 5 6
500901 14605 BS Music Education 3 5 4 7 13
231001 15300 BA Speech Communication 52 60 64 42 47 66
500501 15610 BA Theatre 8 5 6 9 4 5
236 277 239 257 253 275 College of Visual & Performing Arts Total
COLLEG
E OF LIB
ERAL A
RTS &
SCIEN
CES
450201 20400 BA Anthropology 11 8 12 10 9 18
260101 20705 BS Bio/Premed/Predentistry 1
260101 20710 BS Bio/Molecular/Micro/Cell 4 10 6 6 14 8
260101 20711 BS Bio/Organismal/Ecology 3 6 11 8 5 4
260101 20712 BS Biology/Pre‐professional 6 3 6 5 5
400501 21300 BS Chemistry 6 1 6 1 8 6
260202 21301 BS Biochemistry 2 5 2 1
400501 21302 BS Chemistry/Biochemistry 3
110103 21602 Computer Info Sci (Core) 1
110103 21610 BS CIS/Info Technology 15 23 10 10 1
110103 21611 BS CSC/Info Technology 12 10
110103 21620 BS CIS/Software Developmnt 4 8 7 9 1
110103 21621 BS CSC/Software Develpmnt 11 8
110103 21630 BS CIS (Combined MS) 1 6 8 10
110103 21631 BS CSC (Combined MS) 9 5
430104 21800 BS Criminal Justice 67 61 100 74 91 83
430104 21801 BS CJ/Paralegal Studies 8 10 10 13 16 8
230101 22400 BA English/General 7 10 4
230101 22405 BA English 4 6 12 24 23 12
231101 22450 BA Eng/Professional Writing 43 45 33 32 54 39
030104 22653 BS Env Science/Chemistry 1 1 2 1
030104 22650 BS Env Science/Biology 4 2 4 11 5 3
030104 22656 BS Env Science/Geology 4 1 2 3 5
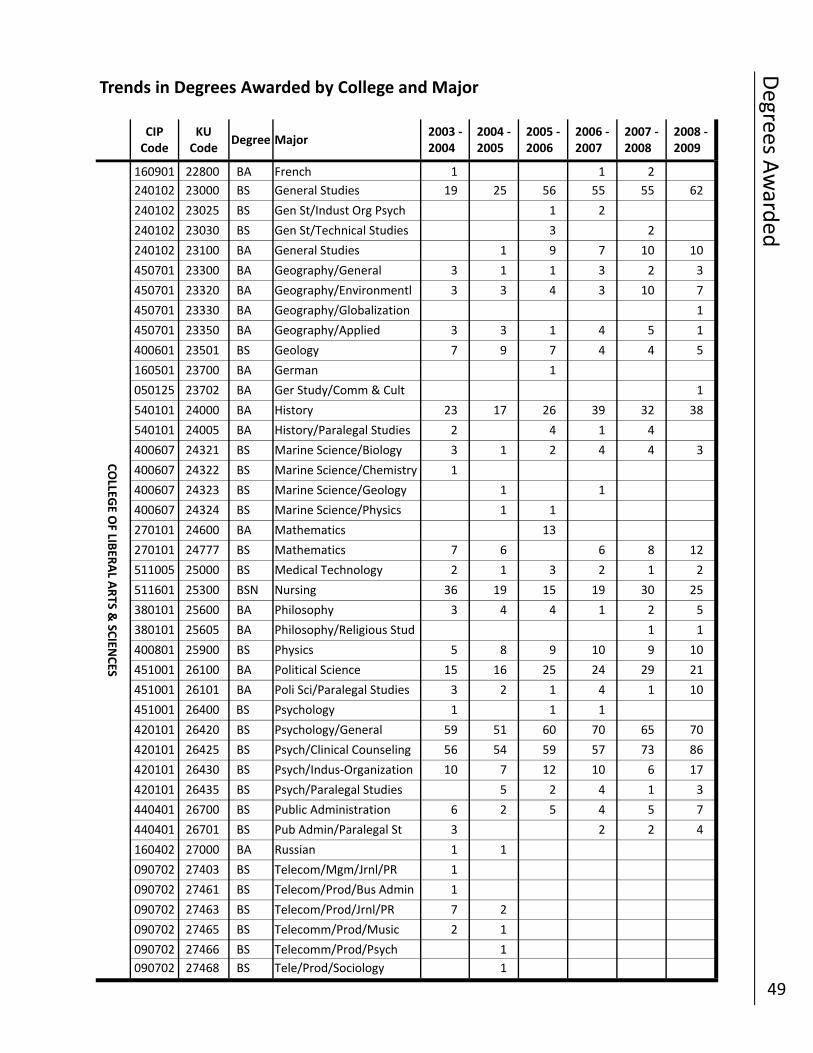
Degrees A
ward
ed
49
Trends in Degrees Awarded by College and Major
CIP Code
KU Code
Degree Major 2003 ‐ 2004
2004 ‐ 2005
2005 ‐ 2006
2006 ‐ 2007
2007 ‐ 2008
2008 ‐ 2009
COLLEG
E OF LIB
ERAL A
RTS &
SCIEN
CES
160901 22800 BA French 1 1 2
240102 23000 BS General Studies 19 25 56 55 55 62
240102 23025 BS Gen St/Indust Org Psych 1 2
240102 23030 BS Gen St/Technical Studies 3 2
240102 23100 BA General Studies 1 9 7 10 10
450701 23300 BA Geography/General 3 1 1 3 2 3
450701 23320 BA Geography/Environmentl 3 3 4 3 10 7
450701 23330 BA Geography/Globalization 1
450701 23350 BA Geography/Applied 3 3 1 4 5 1
400601 23501 BS Geology 7 9 7 4 4 5
160501 23700 BA German 1
050125 23702 BA Ger Study/Comm & Cult 1
540101 24000 BA History 23 17 26 39 32 38
540101 24005 BA History/Paralegal Studies 2 4 1 4
400607 24321 BS Marine Science/Biology 3 1 2 4 4 3
400607 24322 BS Marine Science/Chemistry 1
400607 24323 BS Marine Science/Geology 1 1
400607 24324 BS Marine Science/Physics 1 1
270101 24600 BA Mathematics 13
270101 24777 BS Mathematics 7 6 6 8 12
511005 25000 BS Medical Technology 2 1 3 2 1 2
511601 25300 BSN Nursing 36 19 15 19 30 25
380101 25600 BA Philosophy 3 4 4 1 2 5
380101 25605 BA Philosophy/Religious Stud 1 1
400801 25900 BS Physics 5 8 9 10 9 10
451001 26100 BA Political Science 15 16 25 24 29 21
451001 26101 BA Poli Sci/Paralegal Studies 3 2 1 4 1 10
451001 26400 BS Psychology 1 1 1
420101 26420 BS Psychology/General 59 51 60 70 65 70
420101 26425 BS Psych/Clinical Counseling 56 54 59 57 73 86
420101 26430 BS Psych/Indus‐Organization 10 7 12 10 6 17
420101 26435 BS Psych/Paralegal Studies 5 2 4 1 3
440401 26700 BS Public Administration 6 2 5 4 5 7
440401 26701 BS Pub Admin/Paralegal St 3 2 2 4
160402 27000 BA Russian 1 1
090702 27403 BS Telecom/Mgm/Jrnl/PR 1
090702 27461 BS Telecom/Prod/Bus Admin 1
090702 27463 BS Telecom/Prod/Jrnl/PR 7 2
090702 27465 BS Telecomm/Prod/Music 2 1
090702 27466 BS Telecomm/Prod/Psych 1
090702 27468 BS Tele/Prod/Sociology 1
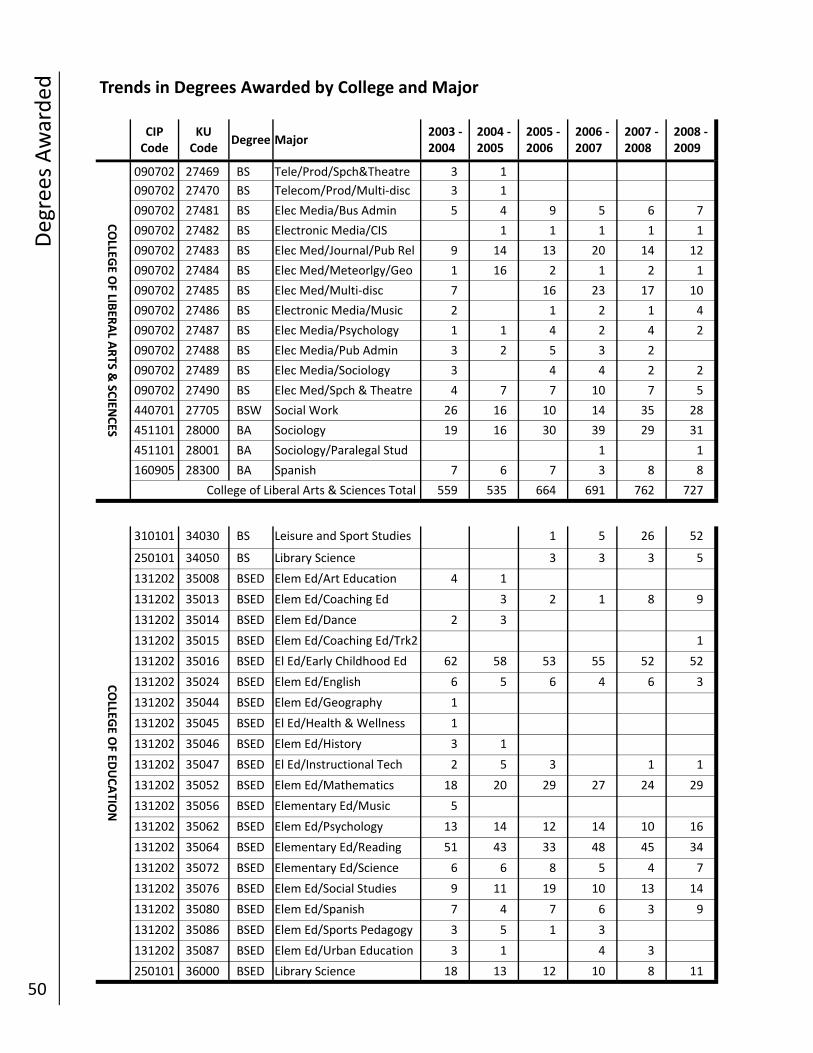
Degrees Awarded
50
Trends in Degrees Awarded by College and Major
CIP Code
KU Code
Degree Major 2003 ‐ 2004
2004 ‐ 2005
2005 ‐ 2006
2006 ‐ 2007
2007 ‐ 2008
2008 ‐ 2009
COLLEG
E OF LIB
ERAL A
RTS &
SCIEN
CES
090702 27469 BS Tele/Prod/Spch&Theatre 3 1
090702 27470 BS Telecom/Prod/Multi‐disc 3 1
090702 27481 BS Elec Media/Bus Admin 5 4 9 5 6 7
090702 27482 BS Electronic Media/CIS 1 1 1 1 1
090702 27483 BS Elec Med/Journal/Pub Rel 9 14 13 20 14 12
090702 27484 BS Elec Med/Meteorlgy/Geo 1 16 2 1 2 1
090702 27485 BS Elec Med/Multi‐disc 7 16 23 17 10
090702 27486 BS Electronic Media/Music 2 1 2 1 4
090702 27487 BS Elec Media/Psychology 1 1 4 2 4 2
090702 27488 BS Elec Media/Pub Admin 3 2 5 3 2
090702 27489 BS Elec Media/Sociology 3 4 4 2 2
090702 27490 BS Elec Med/Spch & Theatre 4 7 7 10 7 5
440701 27705 BSW Social Work 26 16 10 14 35 28
451101 28000 BA Sociology 19 16 30 39 29 31
451101 28001 BA Sociology/Paralegal Stud 1 1
160905 28300 BA Spanish 7 6 7 3 8 8
559 535 664 691 762 727 College of Liberal Arts & Sciences Total
COLLEG
E OF ED
UCATIO
N
310101 34030 BS Leisure and Sport Studies 1 5 26 52
250101 34050 BS Library Science 3 3 3 5
131202 35008 BSED Elem Ed/Art Education 4 1
131202 35013 BSED Elem Ed/Coaching Ed 3 2 1 8 9
131202 35014 BSED Elem Ed/Dance 2 3
131202 35015 BSED Elem Ed/Coaching Ed/Trk2 1
131202 35016 BSED El Ed/Early Childhood Ed 62 58 53 55 52 52
131202 35024 BSED Elem Ed/English 6 5 6 4 6 3
131202 35044 BSED Elem Ed/Geography 1
131202 35045 BSED El Ed/Health & Wellness 1
131202 35046 BSED Elem Ed/History 3 1
131202 35047 BSED El Ed/Instructional Tech 2 5 3 1 1
131202 35052 BSED Elem Ed/Mathematics 18 20 29 27 24 29
131202 35056 BSED Elementary Ed/Music 5
131202 35062 BSED Elem Ed/Psychology 13 14 12 14 10 16
131202 35064 BSED Elementary Ed/Reading 51 43 33 48 45 34
131202 35072 BSED Elementary Ed/Science 6 6 8 5 4 7
131202 35076 BSED Elem Ed/Social Studies 9 11 19 10 13 14
131202 35080 BSED Elem Ed/Spanish 7 4 7 6 3 9
131202 35086 BSED Elem Ed/Sports Pedagogy 3 5 1 3
131202 35087 BSED Elem Ed/Urban Education 3 1 4 3
250101 36000 BSED Library Science 18 13 12 10 8 11
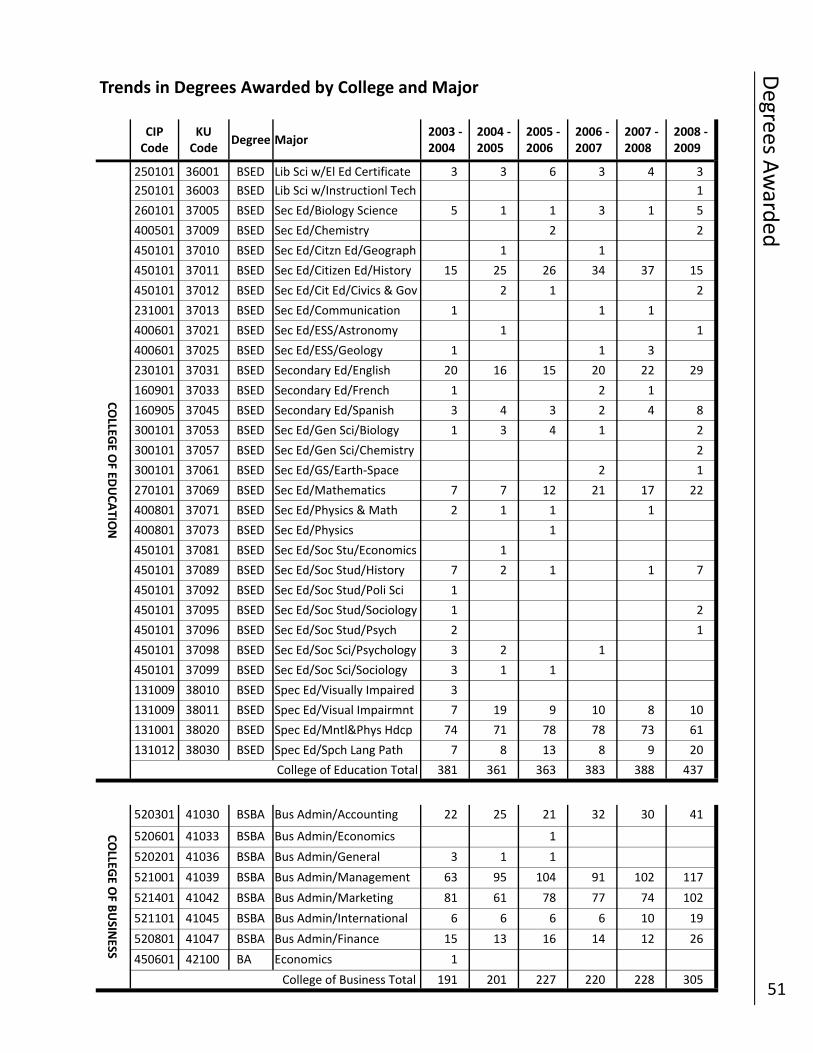
Degrees A
ward
ed
51
Trends in Degrees Awarded by College and Major
CIP Code
KU Code
Degree Major 2003 ‐ 2004
2004 ‐ 2005
2005 ‐ 2006
2006 ‐ 2007
2007 ‐ 2008
2008 ‐ 2009
COLLEG
E OF ED
UCATIO
N
250101 36001 BSED Lib Sci w/El Ed Certificate 3 3 6 3 4 3
250101 36003 BSED Lib Sci w/Instructionl Tech 1
260101 37005 BSED Sec Ed/Biology Science 5 1 1 3 1 5
400501 37009 BSED Sec Ed/Chemistry 2 2
450101 37010 BSED Sec Ed/Citzn Ed/Geograph 1 1
450101 37011 BSED Sec Ed/Citizen Ed/History 15 25 26 34 37 15
450101 37012 BSED Sec Ed/Cit Ed/Civics & Gov 2 1 2
231001 37013 BSED Sec Ed/Communication 1 1 1
400601 37021 BSED Sec Ed/ESS/Astronomy 1 1
400601 37025 BSED Sec Ed/ESS/Geology 1 1 3
230101 37031 BSED Secondary Ed/English 20 16 15 20 22 29
160901 37033 BSED Secondary Ed/French 1 2 1
160905 37045 BSED Secondary Ed/Spanish 3 4 3 2 4 8
300101 37053 BSED Sec Ed/Gen Sci/Biology 1 3 4 1 2
300101 37057 BSED Sec Ed/Gen Sci/Chemistry 2
300101 37061 BSED Sec Ed/GS/Earth‐Space 2 1
270101 37069 BSED Sec Ed/Mathematics 7 7 12 21 17 22
400801 37071 BSED Sec Ed/Physics & Math 2 1 1 1
400801 37073 BSED Sec Ed/Physics 1
450101 37081 BSED Sec Ed/Soc Stu/Economics 1
450101 37089 BSED Sec Ed/Soc Stud/History 7 2 1 1 7
450101 37092 BSED Sec Ed/Soc Stud/Poli Sci 1
450101 37095 BSED Sec Ed/Soc Stud/Sociology 1 2
450101 37096 BSED Sec Ed/Soc Stud/Psych 2 1
450101 37098 BSED Sec Ed/Soc Sci/Psychology 3 2 1
450101 37099 BSED Sec Ed/Soc Sci/Sociology 3 1 1
131009 38010 BSED Spec Ed/Visually Impaired 3
131009 38011 BSED Spec Ed/Visual Impairmnt 7 19 9 10 8 10
131001 38020 BSED Spec Ed/Mntl&Phys Hdcp 74 71 78 78 73 61
131012 38030 BSED Spec Ed/Spch Lang Path 7 8 13 8 9 20
381 361 363 383 388 437 College of Education Total
COLLEG
E OF B
USIN
ESS
520301 41030 BSBA Bus Admin/Accounting 22 25 21 32 30 41
520601 41033 BSBA Bus Admin/Economics 1
520201 41036 BSBA Bus Admin/General 3 1 1
521001 41039 BSBA Bus Admin/Management 63 95 104 91 102 117
521401 41042 BSBA Bus Admin/Marketing 81 61 78 77 74 102
521101 41045 BSBA Bus Admin/International 6 6 6 6 10 19
520801 41047 BSBA Bus Admin/Finance 15 13 16 14 12 26
450601 42100 BA Economics 1
191 201 227 220 228 305 College of Business Total
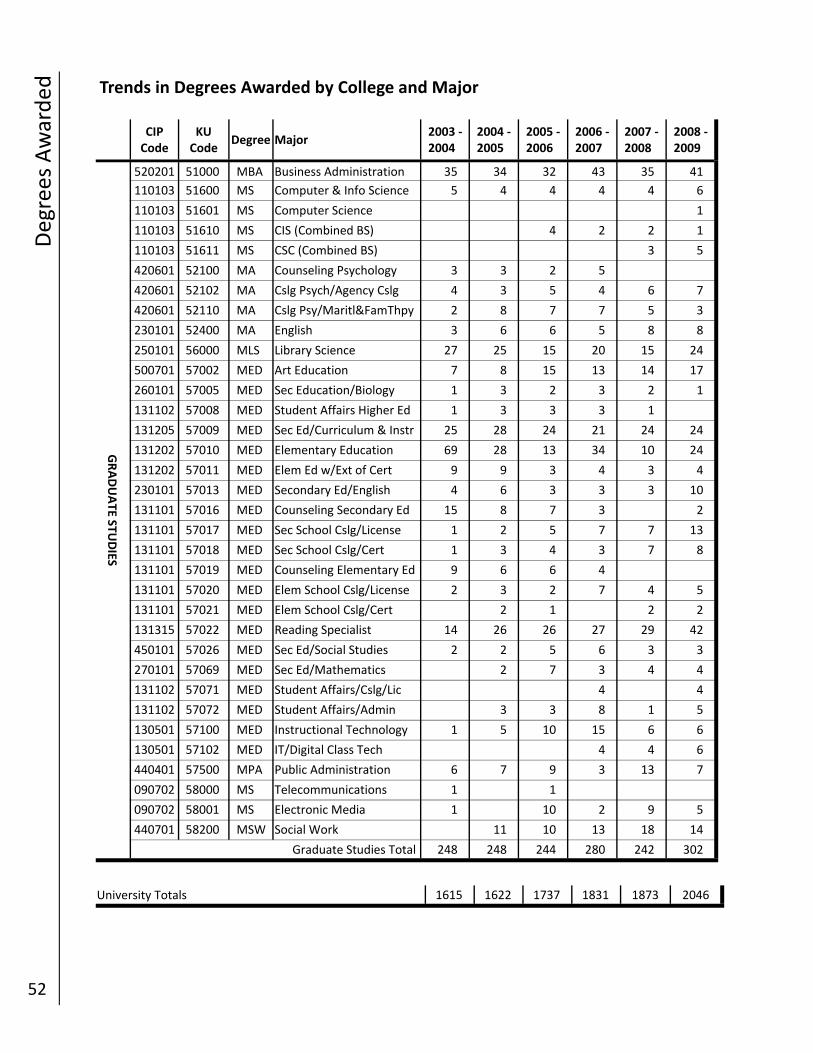
Degrees Awarded
52
Trends in Degrees Awarded by College and Major
1615 1622 1737 1831 1873 2046 University Totals
CIP Code
KU Code
Degree Major 2003 ‐ 2004
2004 ‐ 2005
2005 ‐ 2006
2006 ‐ 2007
2007 ‐ 2008
2008 ‐ 2009
GRADUATE STU
DIES
520201 51000 MBA Business Administration 35 34 32 43 35 41
110103 51600 MS Computer & Info Science 5 4 4 4 4 6
110103 51601 MS Computer Science 1
110103 51610 MS CIS (Combined BS) 4 2 2 1
110103 51611 MS CSC (Combined BS) 3 5
420601 52100 MA Counseling Psychology 3 3 2 5
420601 52102 MA Cslg Psych/Agency Cslg 4 3 5 4 6 7
420601 52110 MA Cslg Psy/Maritl&FamThpy 2 8 7 7 5 3
230101 52400 MA English 3 6 6 5 8 8
250101 56000 MLS Library Science 27 25 15 20 15 24
500701 57002 MED Art Education 7 8 15 13 14 17
260101 57005 MED Sec Education/Biology 1 3 2 3 2 1
131102 57008 MED Student Affairs Higher Ed 1 3 3 3 1
131205 57009 MED Sec Ed/Curriculum & Instr 25 28 24 21 24 24
131202 57010 MED Elementary Education 69 28 13 34 10 24
131202 57011 MED Elem Ed w/Ext of Cert 9 9 3 4 3 4
230101 57013 MED Secondary Ed/English 4 6 3 3 3 10
131101 57016 MED Counseling Secondary Ed 15 8 7 3 2
131101 57017 MED Sec School Cslg/License 1 2 5 7 7 13
131101 57018 MED Sec School Cslg/Cert 1 3 4 3 7 8
131101 57019 MED Counseling Elementary Ed 9 6 6 4
131101 57020 MED Elem School Cslg/License 2 3 2 7 4 5
131101 57021 MED Elem School Cslg/Cert 2 1 2 2
131315 57022 MED Reading Specialist 14 26 26 27 29 42
450101 57026 MED Sec Ed/Social Studies 2 2 5 6 3 3
270101 57069 MED Sec Ed/Mathematics 2 7 3 4 4
131102 57071 MED Student Affairs/Cslg/Lic 4 4
131102 57072 MED Student Affairs/Admin 3 3 8 1 5
130501 57100 MED Instructional Technology 1 5 10 15 6 6
130501 57102 MED IT/Digital Class Tech 4 4 6
440401 57500 MPA Public Administration 6 7 9 3 13 7
090702 58000 MS Telecommunications 1 1
090702 58001 MS Electronic Media 1 10 2 9 5
440701 58200 MSW Social Work 11 10 13 18 14
248 248 244 280 242 302 Graduate Studies Total
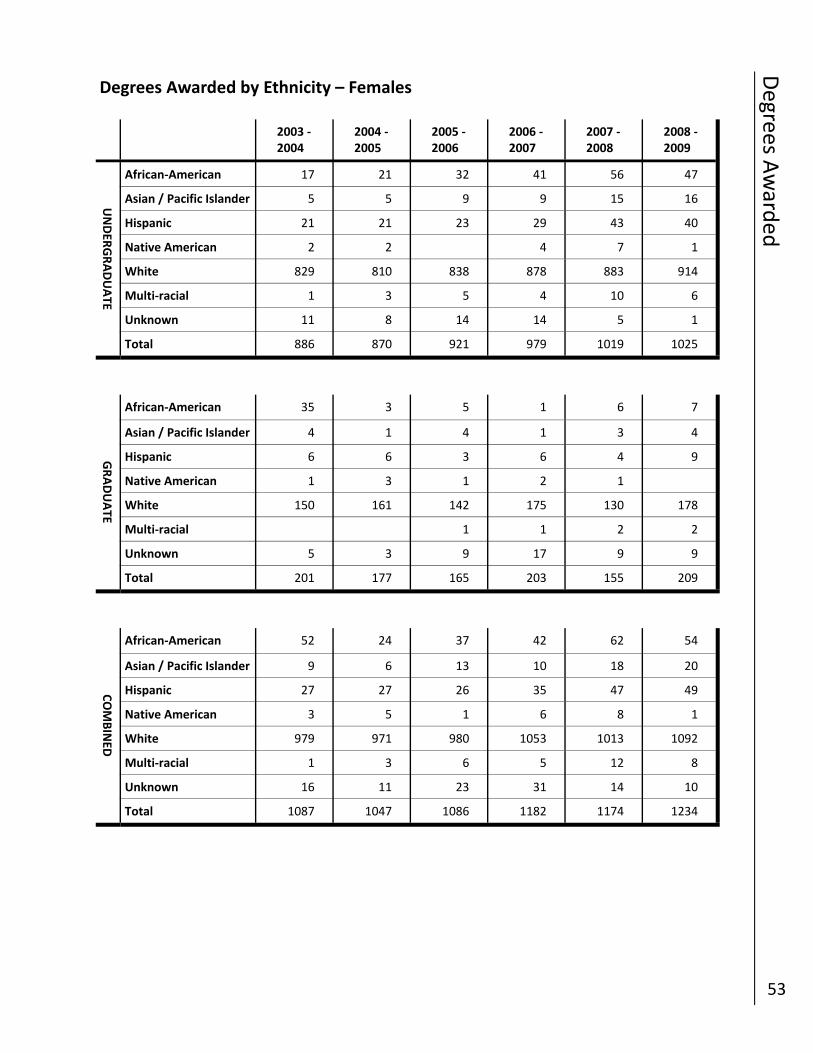
Degrees A
ward
ed
53
Degrees Awarded by Ethnicity – Females
2003 ‐ 2004
2004 ‐ 2005
2005 ‐ 2006
2006 ‐ 2007
2007 ‐ 2008
2008 ‐ 2009
UNDER
GRADUATE
African‐American 17 21 32 41 56 47
Asian / Pacific Islander 5 5 9 9 15 16
Hispanic 21 21 23 29 43 40
Native American 2 2 4 7 1
White 829 810 838 878 883 914
Multi‐racial 1 3 5 4 10 6
Total 886 870 921 979 1019 1025
Unknown 11 8 14 14 5 1
GRADUATE
African‐American 35 3 5 1 6 7
Asian / Pacific Islander 4 1 4 1 3 4
Hispanic 6 6 3 6 4 9
Native American 1 3 1 2 1
White 150 161 142 175 130 178
Multi‐racial 1 1 2 2
Unknown 5 3 9 17 9 9
Total 201 177 165 203 155 209
COMBINED
African‐American 52 24 37 42 62 54
Asian / Pacific Islander 9 6 13 10 18 20
Hispanic 27 27 26 35 47 49
Native American 3 5 1 6 8 1
White 979 971 980 1053 1013 1092
Multi‐racial 1 3 6 5 12 8
Unknown 16 11 23 31 14 10
Total 1087 1047 1086 1182 1174 1234
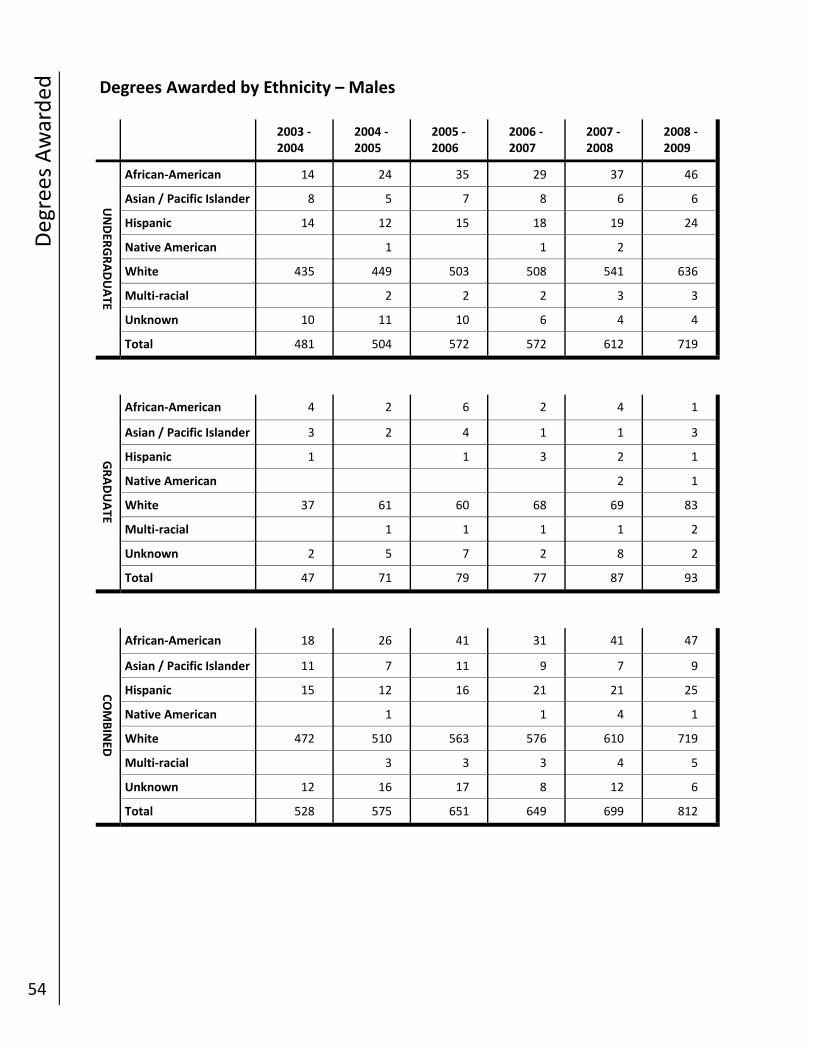
Degrees Awarded
54
Degrees Awarded by Ethnicity – Males
2003 ‐ 2004
2004 ‐ 2005
2005 ‐ 2006
2006 ‐ 2007
2007 ‐ 2008
2008 ‐ 2009
UNDER
GRADUATE
African‐American 14 24 35 29 37 46
Asian / Pacific Islander 8 5 7 8 6 6
Hispanic 14 12 15 18 19 24
Native American 1 1 2
White 435 449 503 508 541 636
Multi‐racial 2 2 2 3 3
Total 481 504 572 572 612 719
Unknown 10 11 10 6 4 4
GRADUATE
African‐American 4 2 6 2 4 1
Asian / Pacific Islander 3 2 4 1 1 3
Hispanic 1 1 3 2 1
Native American 2 1
White 37 61 60 68 69 83
Multi‐racial 1 1 1 1 2
Unknown 2 5 7 2 8 2
Total 47 71 79 77 87 93
COMBINED
African‐American 18 26 41 31 41 47
Asian / Pacific Islander 11 7 11 9 7 9
Hispanic 15 12 16 21 21 25
Native American 1 1 4 1
White 472 510 563 576 610 719
Multi‐racial 3 3 3 4 5
Unknown 12 16 17 8 12 6
Total 528 575 651 649 699 812
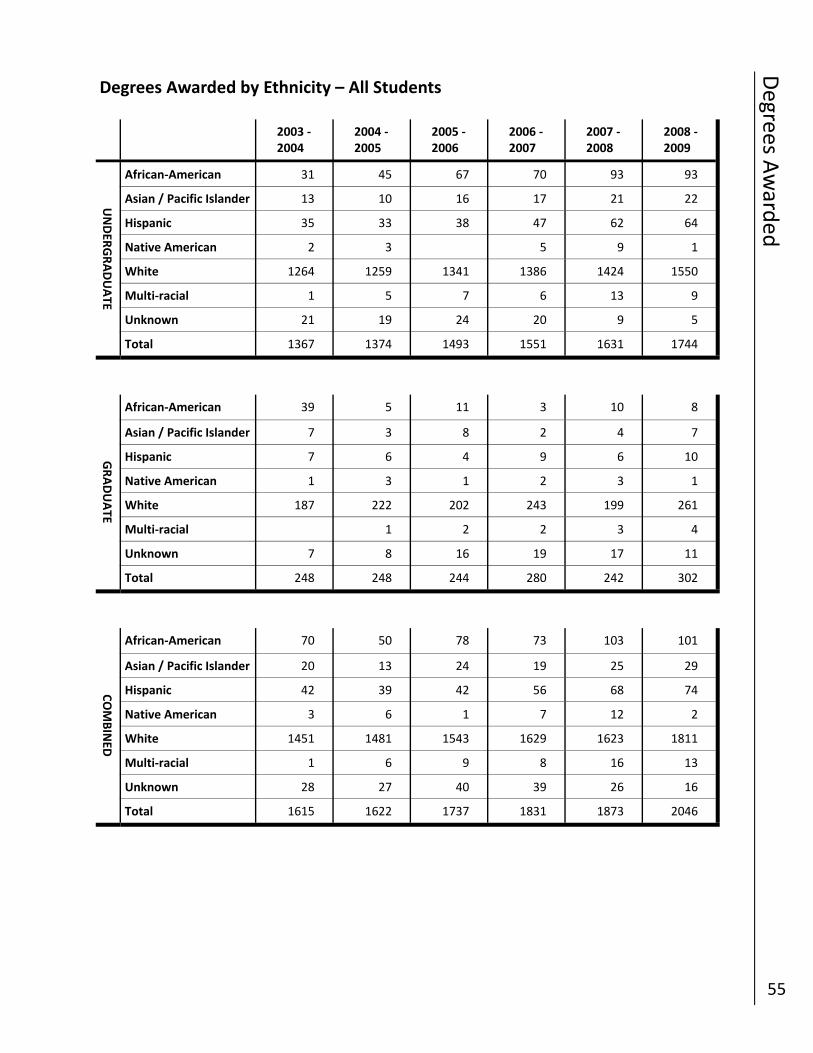
Degrees A
ward
ed
55
Degrees Awarded by Ethnicity – All Students
2003 ‐ 2004
2004 ‐ 2005
2005 ‐ 2006
2006 ‐ 2007
2007 ‐ 2008
2008 ‐ 2009
UNDER
GRADUATE
African‐American 31 45 67 70 93 93
Asian / Pacific Islander 13 10 16 17 21 22
Hispanic 35 33 38 47 62 64
Native American 2 3 5 9 1
White 1264 1259 1341 1386 1424 1550
Multi‐racial 1 5 7 6 13 9
Total 1367 1374 1493 1551 1631 1744
Unknown 21 19 24 20 9 5
GRADUATE
African‐American 39 5 11 3 10 8
Asian / Pacific Islander 7 3 8 2 4 7
Hispanic 7 6 4 9 6 10
Native American 1 3 1 2 3 1
White 187 222 202 243 199 261
Multi‐racial 1 2 2 3 4
Unknown 7 8 16 19 17 11
Total 248 248 244 280 242 302
COMBINED
African‐American 70 50 78 73 103 101
Asian / Pacific Islander 20 13 24 19 25 29
Hispanic 42 39 42 56 68 74
Native American 3 6 1 7 12 2
White 1451 1481 1543 1629 1623 1811
Multi‐racial 1 6 9 8 16 13
Unknown 28 27 40 39 26 16
Total 1615 1622 1737 1831 1873 2046
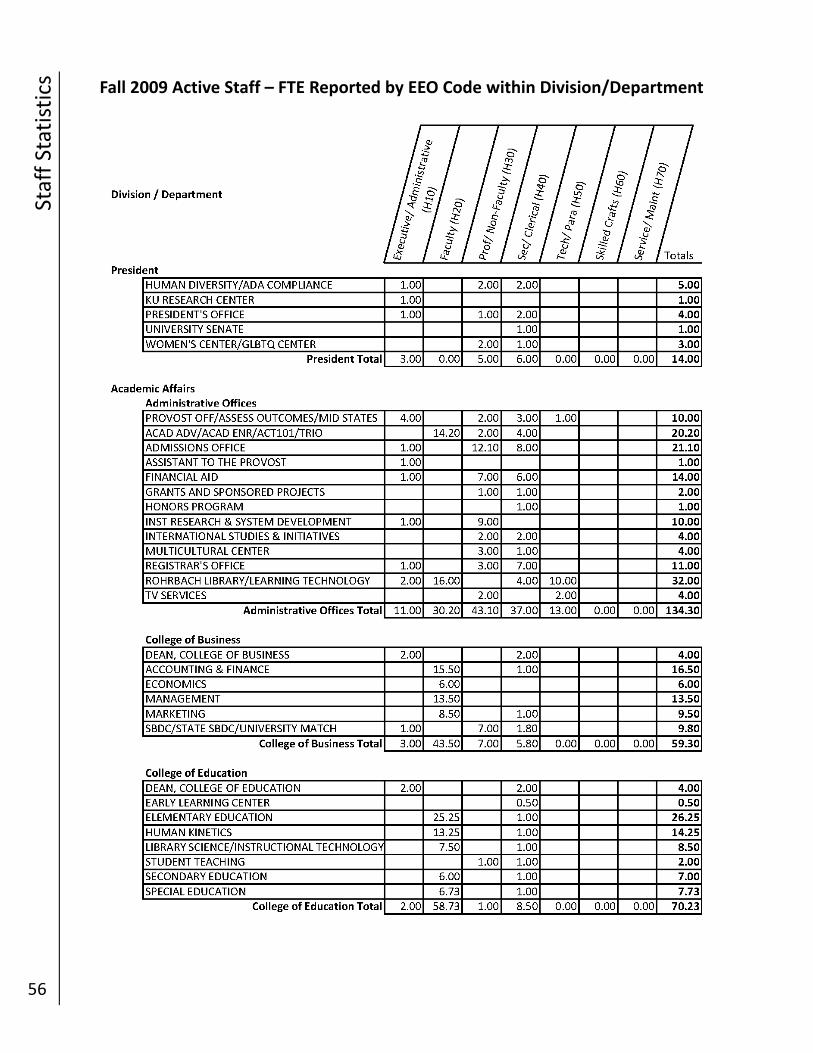
Staff Statistics
56
Fall 2009 Active Staff – FTE Reported by EEO Code within Division/Department
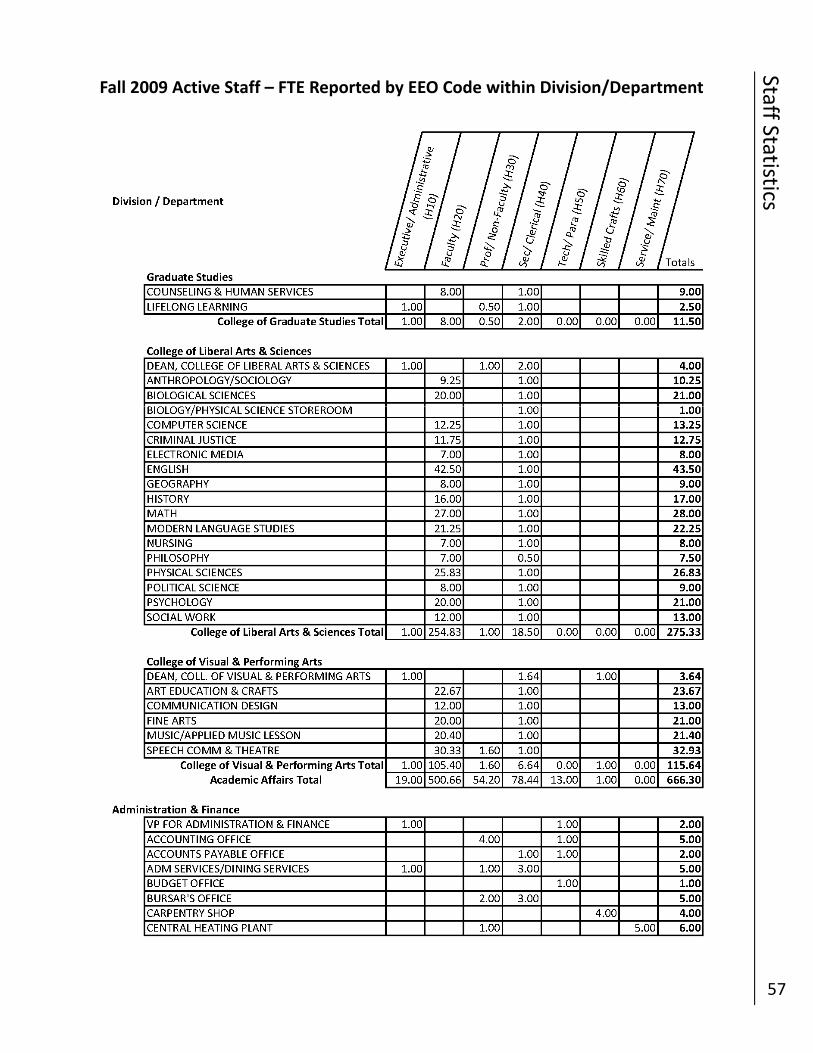
Staff Statistics
57
Fall 2009 Active Staff – FTE Reported by EEO Code within Division/Department
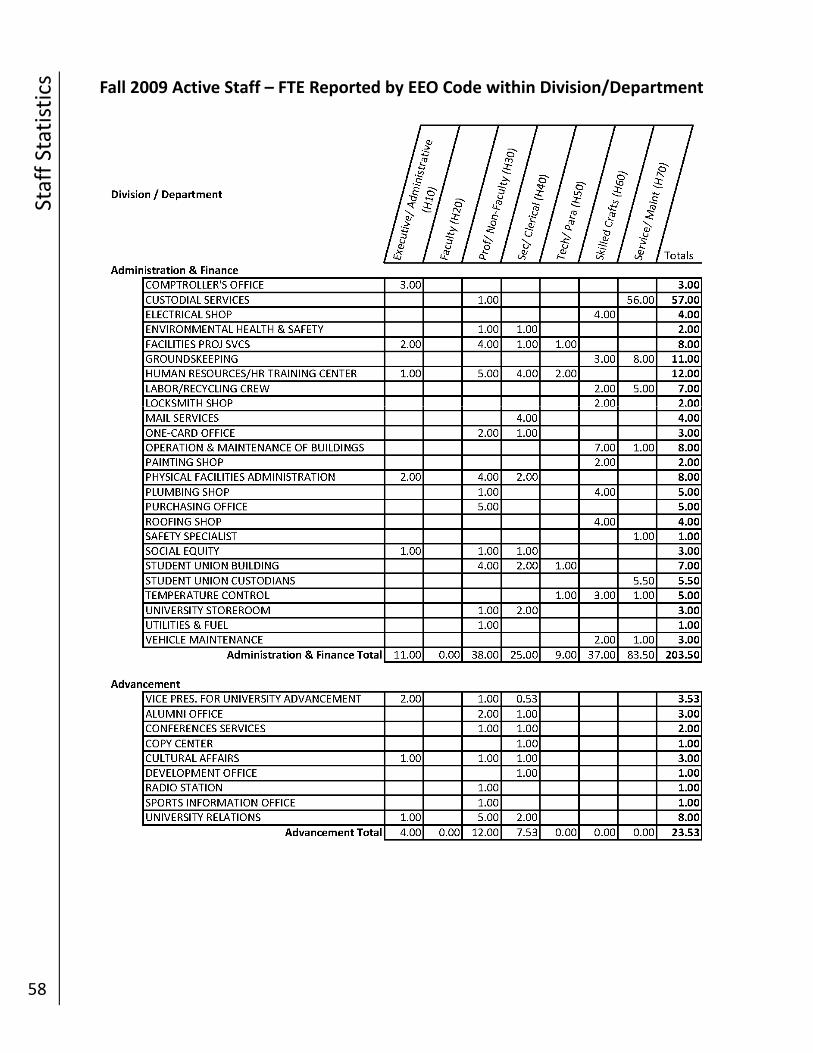
Staff Statistics
58
Fall 2009 Active Staff – FTE Reported by EEO Code within Division/Department
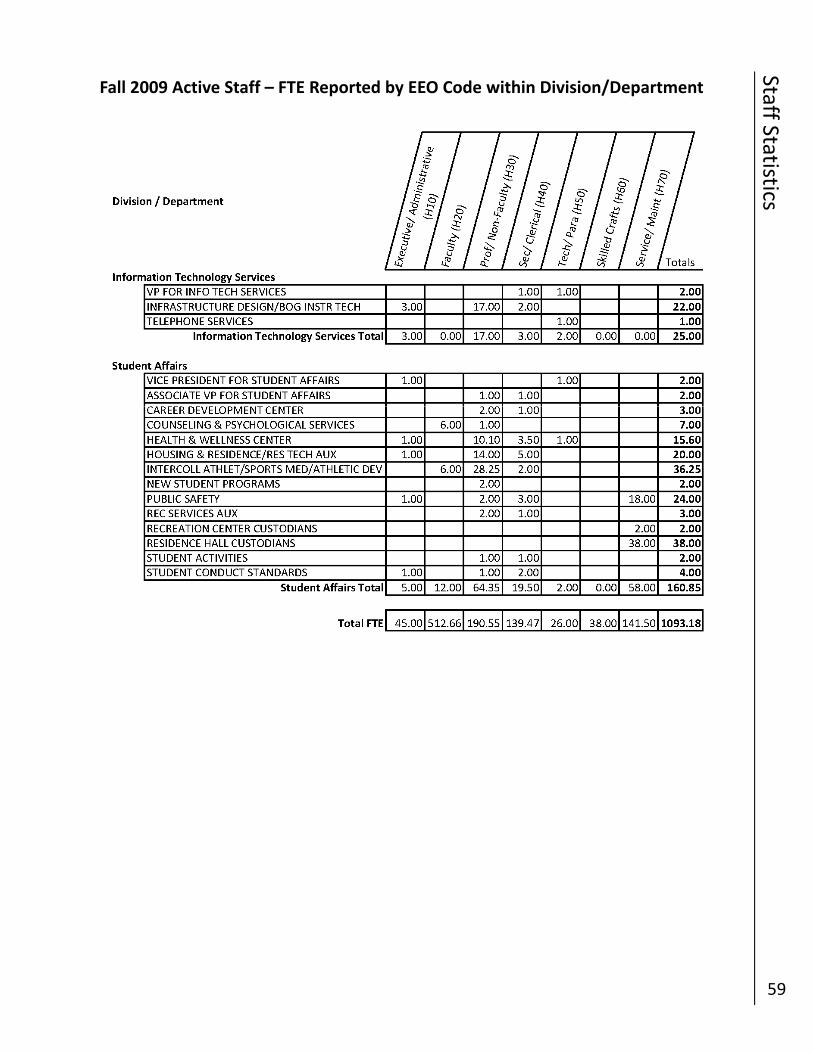
Staff Statistics
59
Fall 2009 Active Staff – FTE Reported by EEO Code within Division/Department
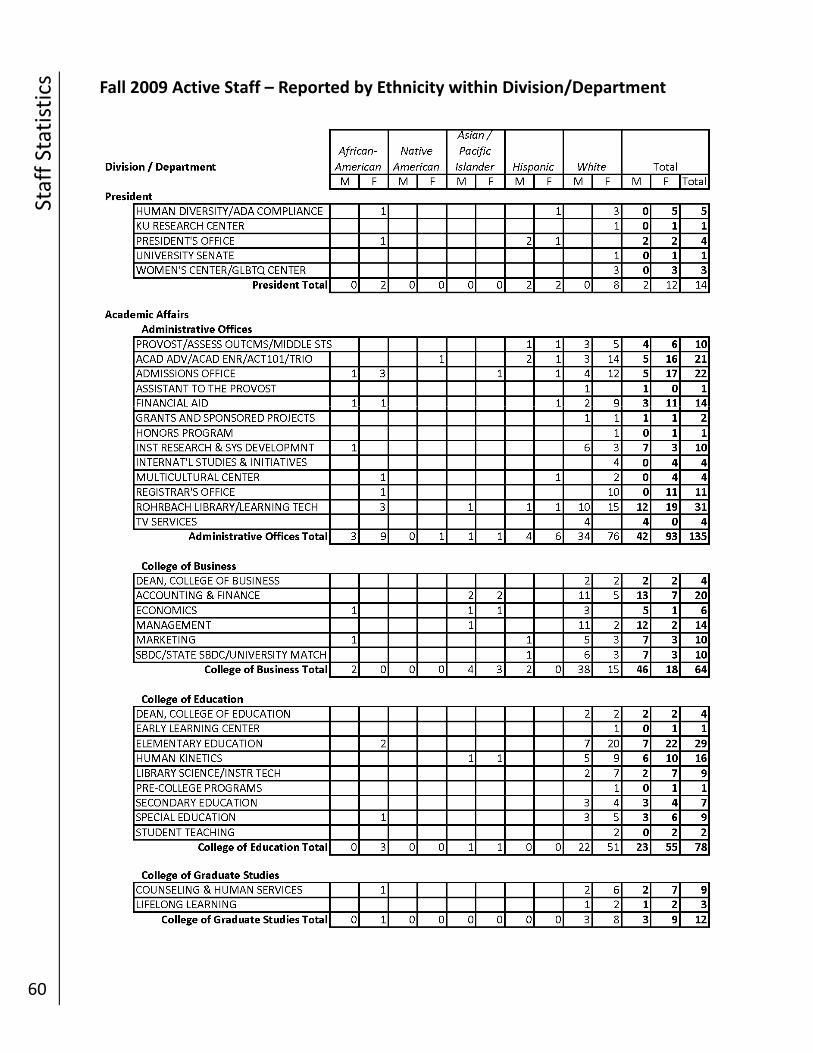
Staff Statistics
60
Fall 2009 Active Staff – Reported by Ethnicity within Division/Department
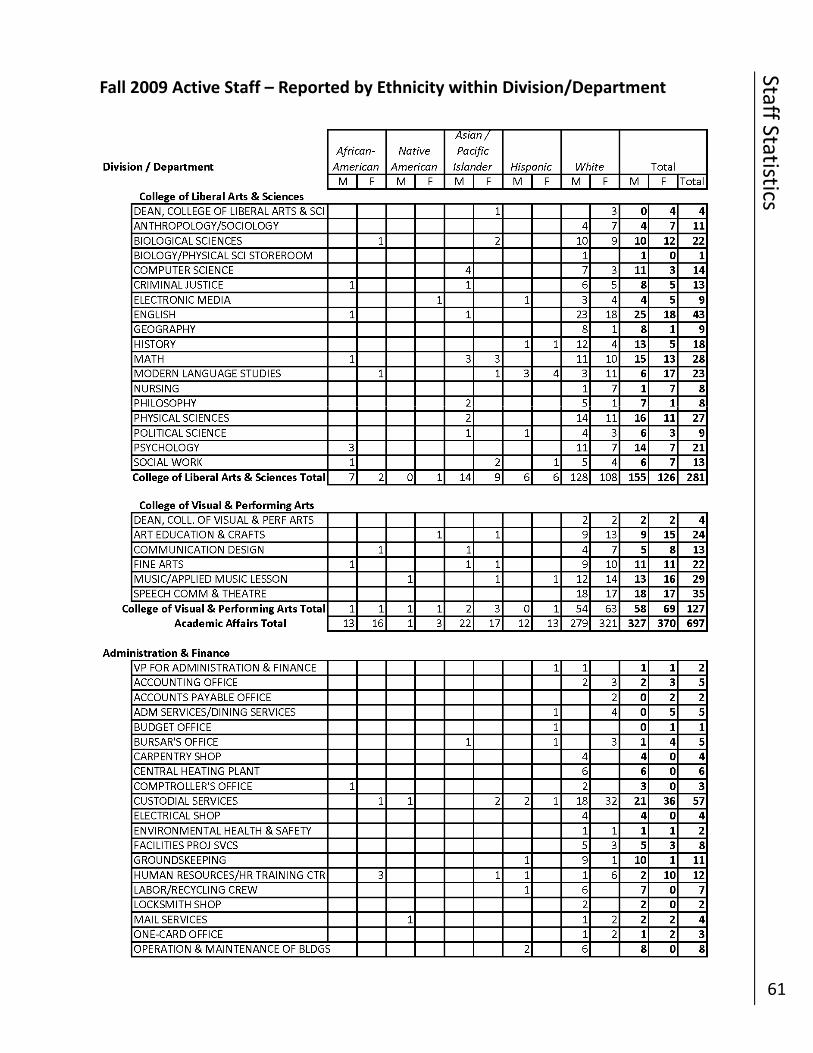
Staff Statistics
61
Fall 2009 Active Staff – Reported by Ethnicity within Division/Department
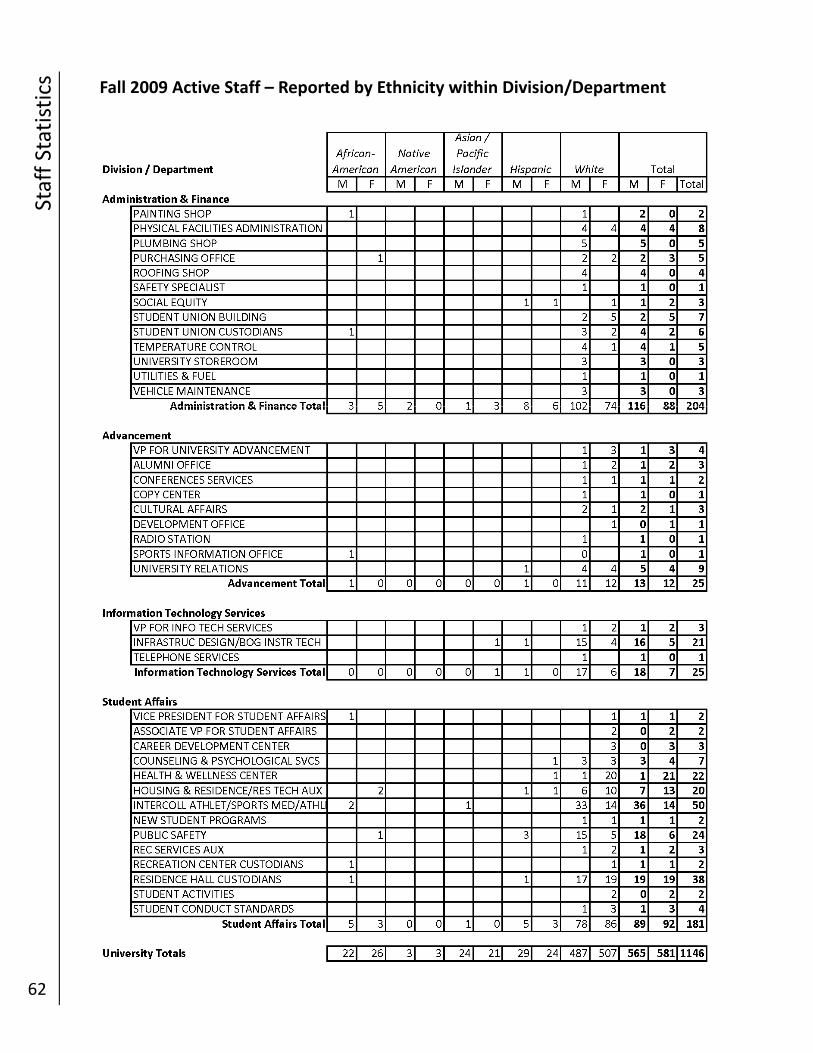
Staff Statistics
62
Fall 2009 Active Staff – Reported by Ethnicity within Division/Department
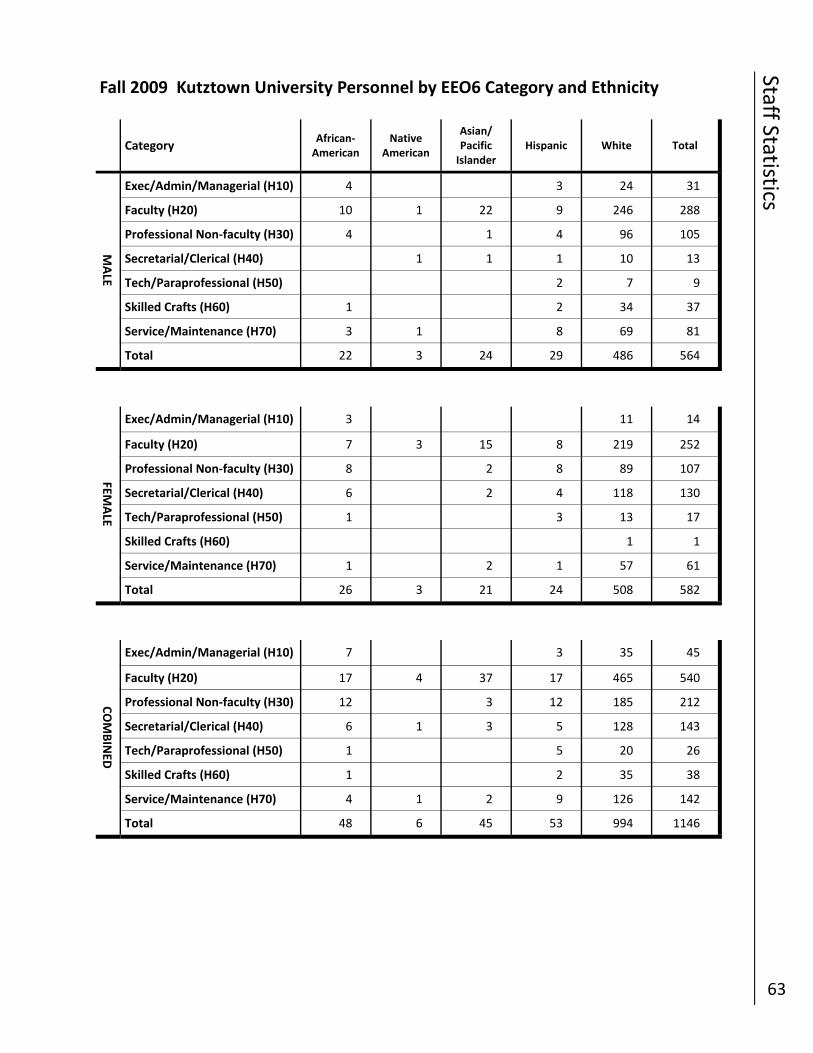
Staff Statistics
63
Fall 2009 Kutztown University Personnel by EEO6 Category and Ethnicity
Category
African‐American
Native American
Asian/Pacific Islander
Hispanic White Total
MALE
Exec/Admin/Managerial (H10) 4 3 24 31
Faculty (H20) 10 1 22 9 246 288
Professional Non‐faculty (H30) 4 1 4 96 105
Secretarial/Clerical (H40) 1 1 1 10 13
Tech/Paraprofessional (H50) 2 7 9
Skilled Crafts (H60) 1 2 34 37
Total 22 3 24 29 486 564
Service/Maintenance (H70) 3 1 8 69 81
COMBINED
Exec/Admin/Managerial (H10) 7 3 35 45
Faculty (H20) 17 4 37 17 465 540
Professional Non‐faculty (H30) 12 3 12 185 212
Secretarial/Clerical (H40) 6 1 3 5 128 143
Tech/Paraprofessional (H50) 1 5 20 26
Skilled Crafts (H60) 1 2 35 38
Service/Maintenance (H70) 4 1 2 9 126 142
Total 48 6 45 53 994 1146
FEMALE
Exec/Admin/Managerial (H10) 3 11 14
Faculty (H20) 7 3 15 8 219 252
Professional Non‐faculty (H30) 8 2 8 89 107
Secretarial/Clerical (H40) 6 2 4 118 130
Tech/Paraprofessional (H50) 1 3 13 17
Skilled Crafts (H60) 1 1
Service/Maintenance (H70) 1 2 1 57 61
Total 26 3 21 24 508 582
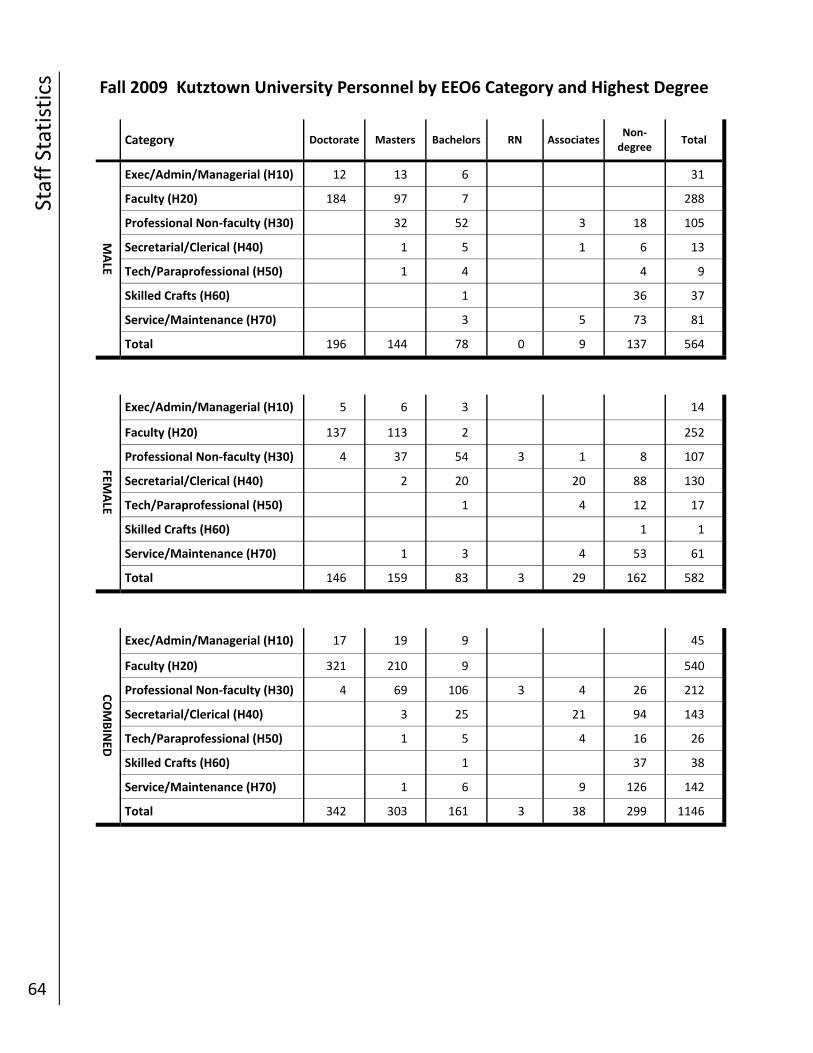
Staff Statistics
64
Fall 2009 Kutztown University Personnel by EEO6 Category and Highest Degree
Category Doctorate Masters Bachelors RN Associates
Non‐degree
MALE
Exec/Admin/Managerial (H10) 12 13 6
Faculty (H20) 184 97 7
Professional Non‐faculty (H30) 32 52 3 18
Secretarial/Clerical (H40) 1 5 1 6
Tech/Paraprofessional (H50) 1 4 4
Skilled Crafts (H60) 1 36
Total 196 144 78 0 9 137
Service/Maintenance (H70) 3 5 73
Total
31
288
105
13
9
37
81
564
FEMALE
Exec/Admin/Managerial (H10) 5 6 3 14
Faculty (H20) 137 113 2 252
Professional Non‐faculty (H30) 4 37 54 3 1 8 107
Secretarial/Clerical (H40) 2 20 20 88 130
Tech/Paraprofessional (H50) 1 4 12 17
Skilled Crafts (H60) 1 1
Service/Maintenance (H70) 1 3 4 53 61
Total 146 159 83 3 29 162 582
COMBINED
Exec/Admin/Managerial (H10) 17 19 9 45
Faculty (H20) 321 210 9 540
Professional Non‐faculty (H30) 4 69 106 3 4 26 212
Secretarial/Clerical (H40) 3 25 21 94 143
Tech/Paraprofessional (H50) 1 5 4 16 26
Skilled Crafts (H60) 1 37 38
Service/Maintenance (H70) 1 6 9 126 142
Total 342 303 161 3 38 299 1146
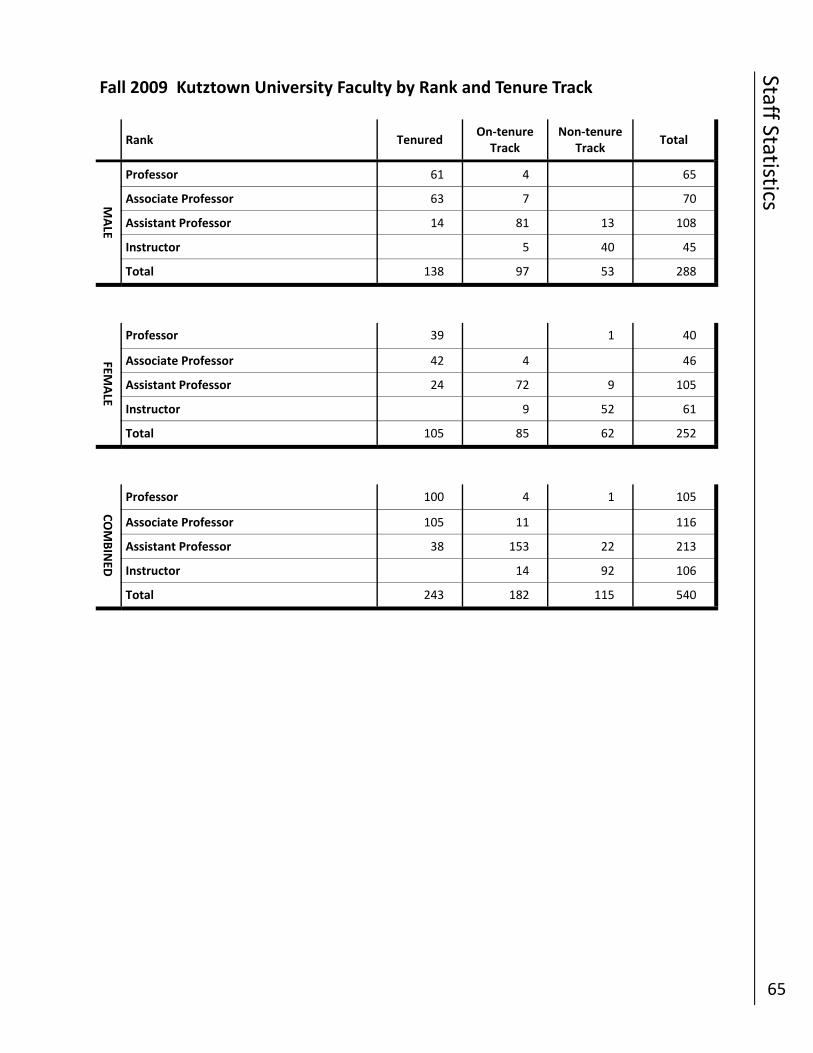
Staff Statistics
65
Fall 2009 Kutztown University Faculty by Rank and Tenure Track
Rank Tenured
On‐tenure Track
Non‐tenure Track
Total
MALE
Professor 61 4 65
Associate Professor 63 7 70
Assistant Professor 14 81 13 108
Instructor 5 40 45
Total 138 97 53 288
FEMALE
Professor 39 1 40
Associate Professor 42 4 46
Assistant Professor 24 72 9 105
Instructor 9 52 61
Total 105 85 62 252
COMBINED
Professor 100 4 1 105
Associate Professor 105 11 116
Assistant Professor 38 153 22 213
Instructor 14 92 106
Total 243 182 115 540
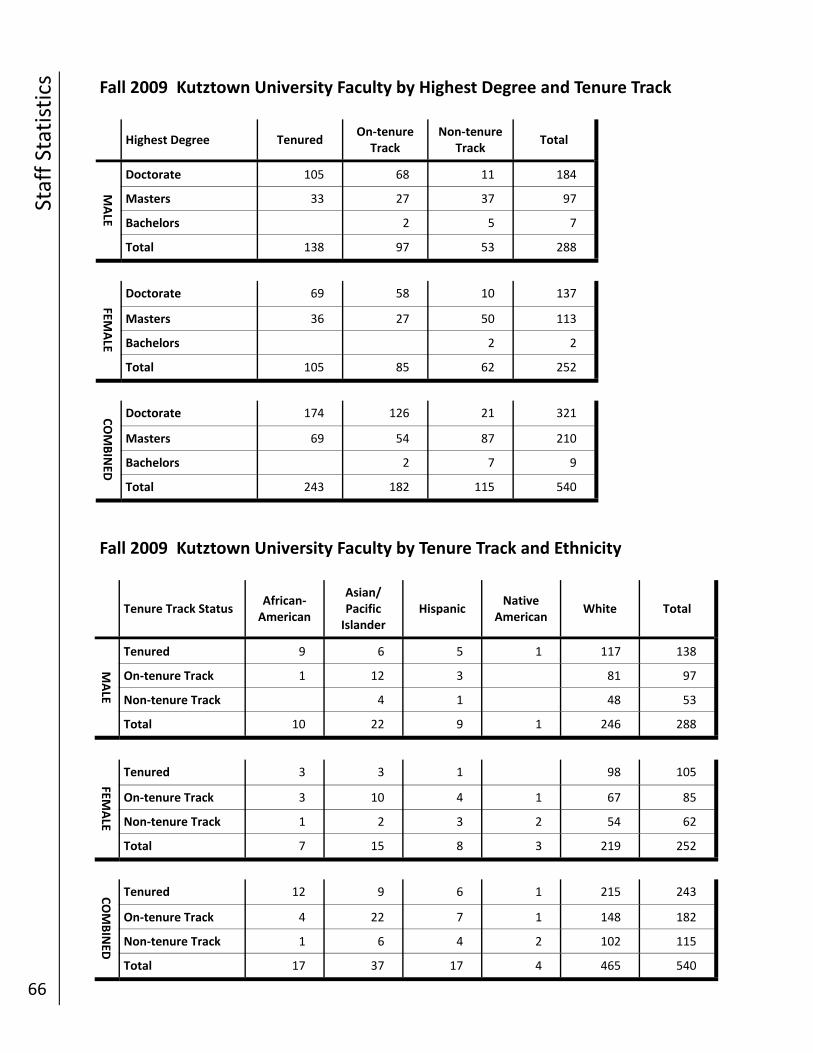
Staff Statistics
66
Fall 2009 Kutztown University Faculty by Highest Degree and Tenure Track
Fall 2009 Kutztown University Faculty by Tenure Track and Ethnicity
Highest Degree Tenured
On‐tenure Track
Non‐tenure Track
Total
MALE
Doctorate 105 68 11 184
Masters 33 27 37 97
Bachelors 2 5 7
Total 138 97 53 288
FEMALE
Doctorate 69 58 10 137
Masters 36 27 50 113
Bachelors 2 2
Total 105 85 62 252
COMBINED
Doctorate 174 126 21 321
Masters 69 54 87 210
Bachelors 2 7 9
Total 243 182 115 540
Tenure Track Status
African‐American
Asian/Pacific Islander
Hispanic Total
MALE
Tenured 9 6 5 138
On‐tenure Track 1 12 3 97
Non‐tenure Track 4 1 53
Total 10 22 9 288
Native American
White
1 117
81
48
1 246
FEMALE
Tenured 3 3 1 105
On‐tenure Track 3 10 4 85
Non‐tenure Track 1 2 3 62
Total 7 15 8 252
98
1 67
2 54
3 219
COMBINED
Tenured 12 9 6 243
On‐tenure Track 4 22 7 182
Non‐tenure Track 1 6 4 115
Total 17 37 17 540
1 215
1 148
2 102
4 465
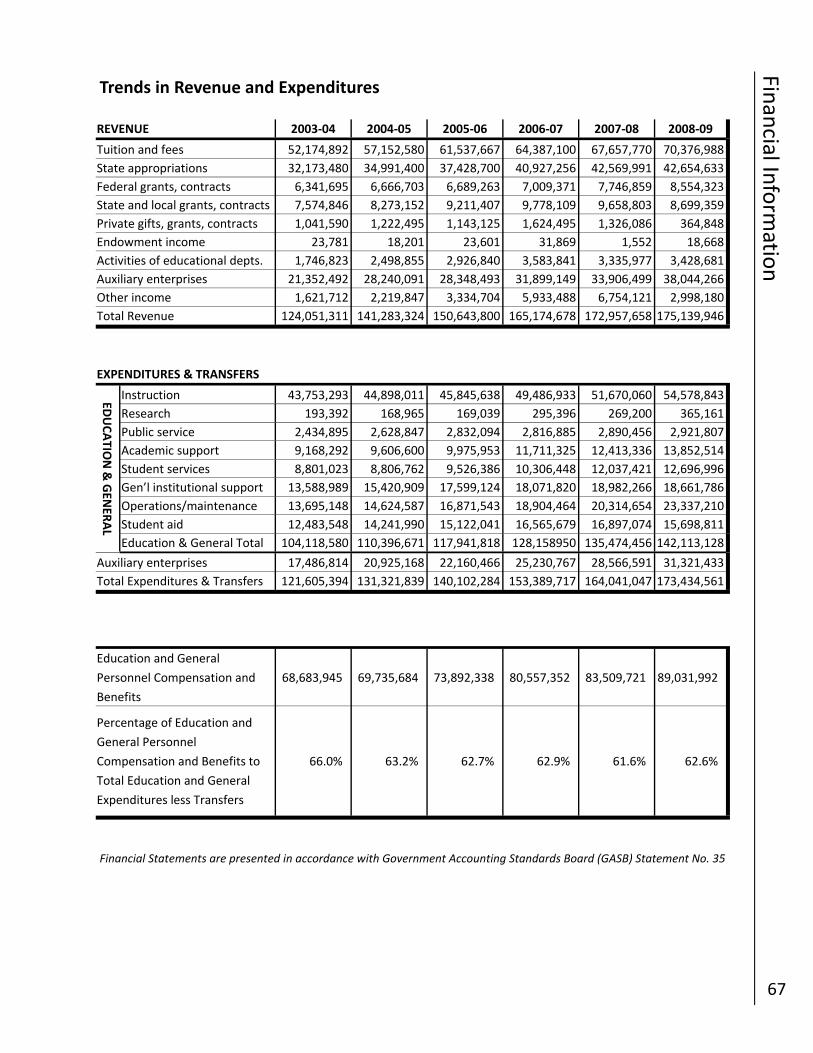
Financial In
form
ation
67
Trends in Revenue and Expenditures
Financial Statements are presented in accordance with Government Accounting Standards Board (GASB) Statement No. 35
REVENUE 2003‐04 2004‐05 2005‐06 2006‐07 2007‐08 2008‐09
Tuition and fees 52,174,892 57,152,580 61,537,667 64,387,100 67,657,770 70,376,988
State appropriations 32,173,480 34,991,400 37,428,700 40,927,256 42,569,991 42,654,633
Federal grants, contracts 6,341,695 6,666,703 6,689,263 7,009,371 7,746,859 8,554,323
State and local grants, contracts 7,574,846 8,273,152 9,211,407 9,778,109 9,658,803 8,699,359
Private gifts, grants, contracts 1,041,590 1,222,495 1,143,125 1,624,495 1,326,086 364,848
Endowment income 23,781 18,201 23,601 31,869 1,552 18,668
Activities of educational depts. 1,746,823 2,498,855 2,926,840 3,583,841 3,335,977 3,428,681
Auxiliary enterprises 21,352,492 28,240,091 28,348,493 31,899,149 33,906,499 38,044,266
Other income 1,621,712 2,219,847 3,334,704 5,933,488 6,754,121 2,998,180
Total Revenue 124,051,311 141,283,324 150,643,800 165,174,678 172,957,658 175,139,946
EXPENDITURES & TRANSFERS
EDUCATIO
N & GEN
ERAL
Instruction 43,753,293 44,898,011 45,845,638 49,486,933 51,670,060 54,578,843
Research 193,392 168,965 169,039 295,396 269,200 365,161
Public service 2,434,895 2,628,847 2,832,094 2,816,885 2,890,456 2,921,807
Academic support 9,168,292 9,606,600 9,975,953 11,711,325 12,413,336 13,852,514
Student services 8,801,023 8,806,762 9,526,386 10,306,448 12,037,421 12,696,996
Gen’l institutional support 13,588,989 15,420,909 17,599,124 18,071,820 18,982,266 18,661,786
Operations/maintenance 13,695,148 14,624,587 16,871,543 18,904,464 20,314,654 23,337,210
Student aid 12,483,548 14,241,990 15,122,041 16,565,679 16,897,074 15,698,811
Education & General Total 104,118,580 110,396,671 117,941,818 128,158950 135,474,456 142,113,128
Auxiliary enterprises 17,486,814 20,925,168 22,160,466 25,230,767 28,566,591 31,321,433
121,605,394 131,321,839 140,102,284 153,389,717 164,041,047 173,434,561 Total Expenditures & Transfers
Education and General
Personnel Compensation and
Benefits
68,683,945 69,735,684 73,892,338 80,557,352 83,509,721 89,031,992
Percentage of Education and
General Personnel
Compensation and Benefits to
Total Education and General
Expenditures less Transfers
66.0% 63.2% 62.7% 62.9% 61.6% 62.6%