Embed Size (px)
Citation preview
NOBLFACT SHEET As of 3/31/18
PROSHARES S&P 500 DIVIDEND ARISTOCRATS ETF
Fund objective
ProShares S&P 500 Dividend Aristocrats ETFseeks investment results, before fees andexpenses, that track the performance of theS&P 500® Dividend Aristocrats® Index.
Fund details
Inception Date 10/9/13
Trading Symbol NOBL
Intraday Symbol NOBL.IV
Bloomberg Index Symbol SPDAUDT
CUSIP 74348A467
Exchange BATS
Net Assets $3.44 billion
Expense Ratio1 0.35%
Distribution Schedule Quarterly
About the fund• NOBL is the only ETF that tracks the S&P 500® Dividend Aristocrats, the
high-quality companies in the S&P 500 with at least 25 consecutive years ofdividend growth.²
• NOBL's index, the S&P 500 Dividend Aristocrats, has outperformed the S&P500 with lower volatility.³
• NOBL is part of the largest suite of ETFs focused on dividend growers, coveringvarious U.S. market caps as well as international markets.
Year to Fund1Q 2018 Date 1-Year 3-Year 5-Year Inception
-2.34% -2.34% 12.84% 9.61% - 12.48%
-2.42% -2.42% 12.86% 9.58% - 12.49%
-2.24% -2.24% 13.30% 10.06% - 12.94%
-0.76% -0.76% 13.99% 10.77% - 13.32%
Fund performance and index history 4
ProShares S&P 500 Dividend Aristocrats ETFNAV Total Return
ProShares S&P 500 Dividend Aristocrats ETFMarket Price Total Return
S&P 500 Dividend Aristocrats Index
S&P 500
Periods greater than one year are annualized.
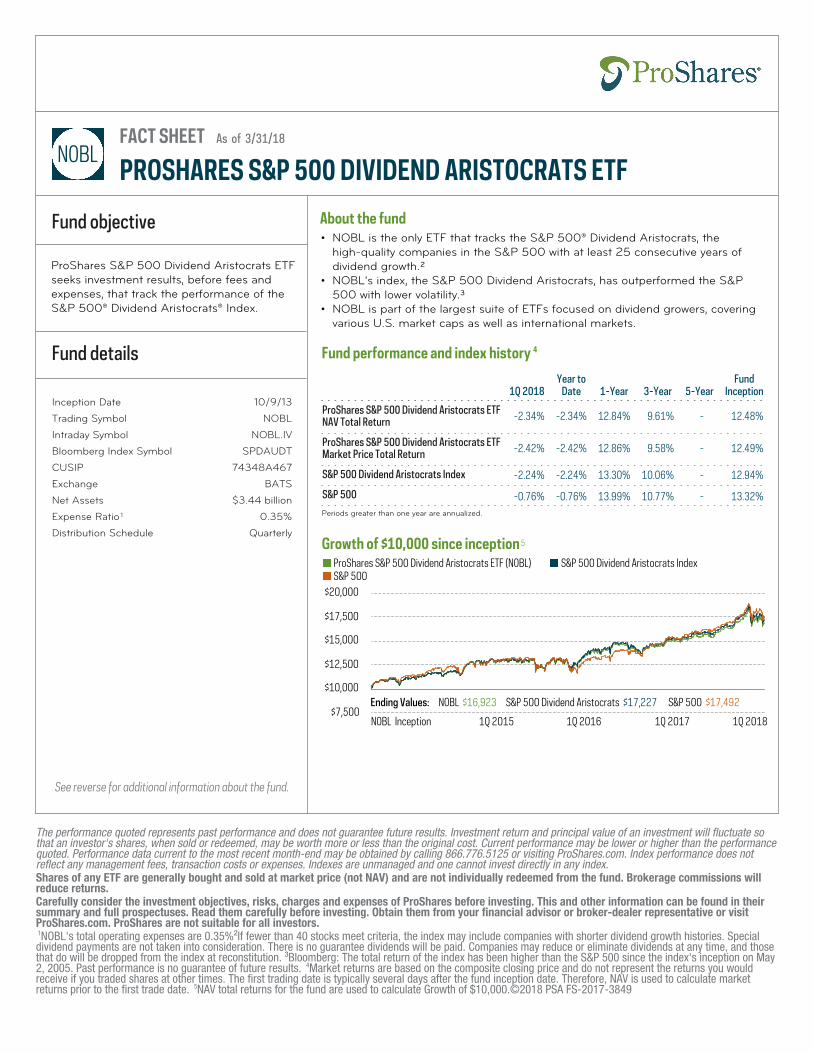
Growth of $10,000 since inception 5
ProShares S&P 500 Dividend Aristocrats ETF (NOBL) S&P 500 Dividend Aristocrats IndexS&P 500
Daily change in benchmark return1Q 2015 1Q 2016 1Q 2017 1Q 2018$7,500
$10,000
$12,500
$15,000
$17,500
$20,000
Ending Values: NOBL $16,923 S&P 500 Dividend Aristocrats $17,227 S&P 500 $17,4922005/09/02 00:00:00NOBL Inception
See reverse for additional information about the fund.
The performance quoted represents past performance and does not guarantee future results. Investment return and principal value of an investment will fluctuate sothat an investor's shares, when sold or redeemed, may be worth more or less than the original cost. Current performance may be lower or higher than the performancequoted. Performance data current to the most recent month-end may be obtained by calling 866.776.5125 or visiting ProShares.com. Index performance does notreflect any management fees, transaction costs or expenses. Indexes are unmanaged and one cannot invest directly in any index.Shares of any ETF are generally bought and sold at market price (not NAV) and are not individually redeemed from the fund. Brokerage commissions willreduce returns.Carefully consider the investment objectives, risks, charges and expenses of ProShares before investing. This and other information can be found in theirsummary and full prospectuses. Read them carefully before investing. Obtain them from your financial advisor or broker-dealer representative or visitProShares.com. ProShares are not suitable for all investors.1NOBL's total operating expenses are 0.35%²If fewer than 40 stocks meet criteria, the index may include companies with shorter dividend growth histories. Specialdividend payments are not taken into consideration. There is no guarantee dividends will be paid. Companies may reduce or eliminate dividends at any time, and thosethat do will be dropped from the index at reconstitution. ³Bloomberg: The total return of the index has been higher than the S&P 500 since the index's inception on May2, 2005. Past performance is no guarantee of future results. 4Market returns are based on the composite closing price and do not represent the returns you wouldreceive if you traded shares at other times. The first trading date is typically several days after the fund inception date. Therefore, NAV is used to calculate marketreturns prior to the first trade date. 5NAV total returns for the fund are used to calculate Growth of $10,000.©2018 PSA FS-2017-3849
Index description
S&P 500 Dividend Aristocrats Index
• Invests in the S&P 500 companies that have increased dividends eachyear for at least 25 consecutive years 2
• Contains a minimum of 40 stocks, which are equally weighted• Limits the weight of any single sector to no more than 30% of the
index• Is rebalanced each January, April, July and October, with an annual
reconstitution during the January rebalance• Inception: 5/2/05
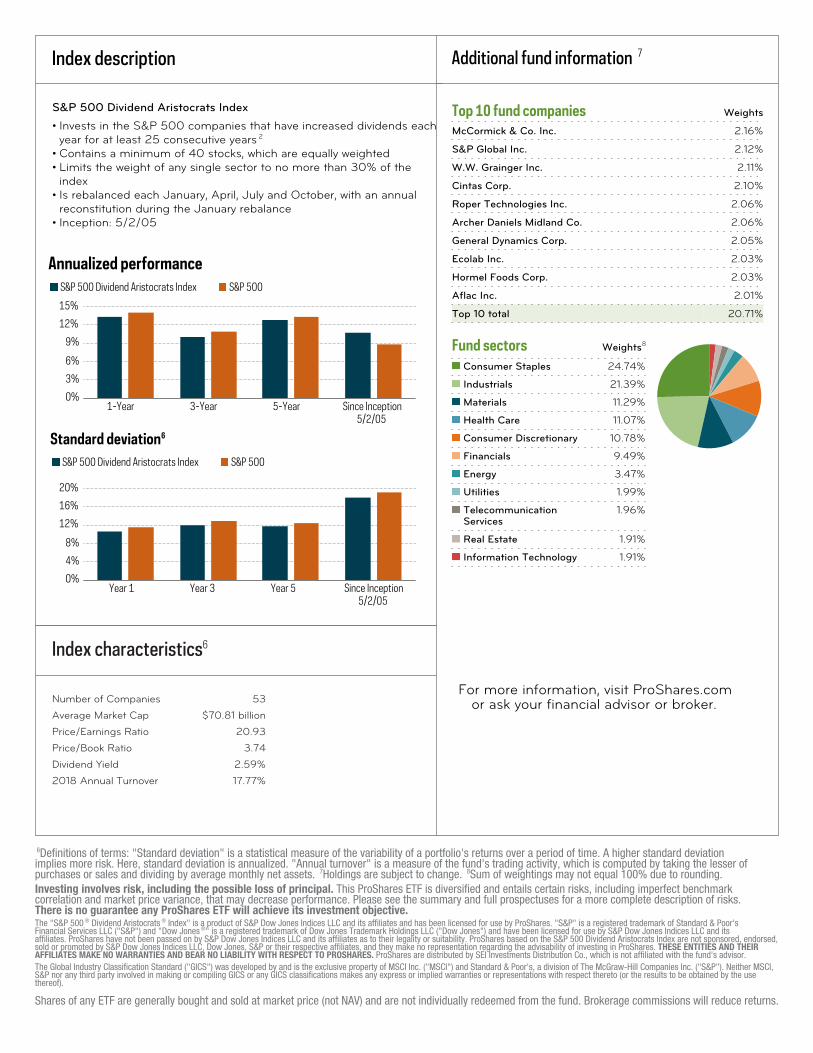
Annualized performanceS&P 500 Dividend Aristocrats Index S&P 500
1-Year 3-Year 5-Year0%
3%
6%
9%
12%
15%
Since Inception5/2/05
Standard deviation6
S&P 500 Dividend Aristocrats Index S&P 500
Year 1 Year 3 Year 50%
4%
8%
12%
16%
20%
Since Inception5/2/05
Index characteristics6
Number of Companies 53
Average Market Cap $70.81 billion
Price/Earnings Ratio 20.93
Price/Book Ratio 3.74
Dividend Yield 2.59%
2018 Annual Turnover 17.77%
Additional fund information 7
Top 10 fund companies Weights
McCormick & Co. Inc. 2.16%
S&P Global Inc. 2.12%
W.W. Grainger Inc. 2.11%
Cintas Corp. 2.10%
Roper Technologies Inc. 2.06%
Archer Daniels Midland Co. 2.06%
General Dynamics Corp. 2.05%
Ecolab Inc. 2.03%
Hormel Foods Corp. 2.03%
Aflac Inc. 2.01%
Top 10 total 20.71%
Fund sectors Weights8
Consumer Staples 24.74%
Industrials 21.39%
Materials 11.29%
Health Care 11.07%
Consumer Discretionary 10.78%
Financials 9.49%
Energy 3.47%
Utilities 1.99%
Telecommunication 1.96%Services
Real Estate 1.91%
Information Technology 1.91%
For more information, visit ProShares.com or ask your financial advisor or broker.
6Definitions of terms: "Standard deviation" is a statistical measure of the variability of a portfolio's returns over a period of time. A higher standard deviationimplies more risk. Here, standard deviation is annualized. "Annual turnover" is a measure of the fund's trading activity, which is computed by taking the lesser ofpurchases or sales and dividing by average monthly net assets. 7Holdings are subject to change. 8Sum of weightings may not equal 100% due to rounding.Investing involves risk, including the possible loss of principal. This ProShares ETF is diversified and entails certain risks, including imperfect benchmarkcorrelation and market price variance, that may decrease performance. Please see the summary and full prospectuses for a more complete description of risks.There is no guarantee any ProShares ETF will achieve its investment objective.The "S&P 500 ® Dividend Aristocrats ® Index" is a product of S&P Dow Jones Indices LLC and its affiliates and has been licensed for use by ProShares. "S&P" is a registered trademark of Standard & Poor'sFinancial Services LLC ("S&P") and "Dow Jones ®" is a registered trademark of Dow Jones Trademark Holdings LLC ("Dow Jones") and have been licensed for use by S&P Dow Jones Indices LLC and itsaffiliates. ProShares have not been passed on by S&P Dow Jones Indices LLC and its affiliates as to their legality or suitability. ProShares based on the S&P 500 Dividend Aristocrats Index are not sponsored, endorsed,sold or promoted by S&P Dow Jones Indices LLC, Dow Jones, S&P or their respective affiliates, and they make no representation regarding the advisability of investing in ProShares. THESE ENTITIES AND THEIRAFFILIATES MAKE NO WARRANTIES AND BEAR NO LIABILITY WITH RESPECT TO PROSHARES. ProShares are distributed by SEI Investments Distribution Co., which is not affiliated with the fund's advisor.The Global Industry Classification Standard ("GICS") was developed by and is the exclusive property of MSCI Inc. ("MSCI") and Standard & Poor's, a division of The McGraw-Hill Companies Inc. ("S&P"). Neither MSCI,S&P nor any third party involved in making or compiling GICS or any GICS classifications makes any express or implied warranties or representations with respect thereto (or the results to be obtained by the usethereof).
Shares of any ETF are generally bought and sold at market price (not NAV) and are not individually redeemed from the fund. Brokerage commissions will reduce returns.