Embed Size (px)
Citation preview

2019
SouthernRegionalEducationBoard
SREB.org
U.S. Regions and 50 States in Perspective
Fact Bookon Higher Education

Meeting the challenge of postsecondary educational attainment and workforce development
SREB states face serious challenges in meeting workforce needs within the next ten years. Decades of poverty, undereducation, and dependency on low-skilled jobs will come face to face with advancing technology and artificial intelligence in the workplace. Automation leaves the undereducated even more vulnerable to poverty — that is, unless secondary and postsecondary education combine efforts to help more people acquire skills they need for a new, middle-skills and high-skills marketplace. SREB’s 2019 research brief Unprepared and Unaware: Upskilling the Workforce for a Decade of Uncertainty lays out the challenge.
The 2019 Fact Book on Higher Education provides a picture of where SREB states stand on the changing workforce and on many aspects of postsecondary education, including college completion and college affordability. Here are some highlights.
Education attainment tied to jobs and wages
The percentage of working-age adults, 25 to 64 years old, in the SREB region holding an associate degree or higher still trails the national average, 39 percent compared with 42 percent in 2017. The SREB region’s rate has improved since 2012 when it was 36 percent. Associate degrees pay off, too. They bring 18 percent more in wages than a high school credential. The wage premium is even higher for a bachelor’s degree — 71 percent more than a high school credential. And jobs for individuals with postsecondary credentials are projected to grow 11 percent between 2016 and 2026, faster than for those with high school credentials only, at 5 percent.
Data on progress at key education milestones offer good news, but they also show challenges ahead. Pre-K-12 enrollment in the region increased from 2006 to 2016 by 8 percent, compared with 2 percent nationwide. This growth in the number of school-age children will soon make its way to college. But declines will soon set, in and by the early 2030’s SREB states will experience a slow-down in school and college enrollments. In the meantime, using the standard calculation (the Adjusted Cohort Graduation Rate), high school graduation rates rose from 80 percent in 2011-12 to 87 percent in 2016-17. SREB states now exceed the nation’s rate by 2 points.
Improving college enrollment and completion rates proving difficult
Even so, college enrollment nationwide and in the region declined from 2012 to 2017 by 5 percent and 3 percent, respectively. College-going rates dropped in 14 of the 16 SREB states. College enrollment shifted in its racial diversity. The enrollment of white students accounted for 56 percent of undergraduate enrollment in 2012 and dropped to 52 percent in 2017. During the same period, Hispanic students grew as a percentage of undergraduate enrollment from 15 percent of undergraduate enrollment to 19 percent, but black students fell from 23 percent to 20 percent.
Undergraduate and traditional-age students accounted for a larger percentage of students — from 58 percent to 60 percent from 2013 to 2017. The percentage of young adults 18 to 24 who attended college in 2017 was 36 percent in the region, up 2 percentage points from 2013. For the same period, the percentage of working age adults 25-49 dropped about 1 point. Any drop in adult attendance is troubling when workforce changes are looming.
Continued on inside back cover
The Workforce ChallengeImproving Education to Meet the Region’s Workforce Challenge
SREB Fact Book 2019
Susan Campbell Lounsbury Christiana Datubo-Brown
June 2019
Southern Regional Education Board592 10th St. N.W.
Atlanta, GA 30318-5776(404) 875-9211
SREB.org
Fact Bookon Higher Education
U.S. Regions and 50 States in Perspective

Copies of the Fact Book on Higher Education are available from the SREB publications office. SREB continuously monitors new comparative data and makes them available on the SREB website: www.sreb.org. The website also features an online edition of the Fact Book with links to the latest updates of the tables and individual Featured Facts reports for each of the 16 SREB states.
SREB Fact Book 2019 i
Message from the SREB President
Among the many documents that SREB produces, the Fact Book on Higher Education has been the most enduring. Since 1956, it has chronicled the history of progress in the South, as SREB states graduated more associate, bachelor’s, master’s and professional degree students year in and year out. In this, my first year at SREB, I have taken pride in claiming association with such SREB gems. The Fact Book represents the kind of work that keeps our region aware of the progress we are making — and our eyes focused on where we still need work.
I learned three features of the Fact Book are worth recalling from time to time.
First, SREB has collected higher education data from its compact states for a long time. Institutions and states in the region agreed these data are important enough to collect, tabulate, report and analyze annually. Each state’s Data Exchange coordinator submits the same core data sets, including degrees conferred, persistence and progression rates, credit and contact hours, funding, tuition and tuition policy, time- and credits-to-degree, and e-learning. These data help researchers and policymakers study trends and answer key policy questions.
In addition, SREB collects data from a variety of sources, some of which are not curated elsewhere. We choose sources that provide the most reliable and valid data to inform us on demographic, economic and policy trends while situating SREB states in both a regional and national context. SREB staff look for providers that collect data every year to ensure we can track long-term trends with comparable data. Federal sources are valuable, including the U.S. Census Bureau and the National Center for Education Statistics. Non-government sources, including the National Science Foundation and the College and the National Association of State Student Grant and Aid Programs, are indispensable also.
Finally, all regular users of the Fact Book realize it is more than a book. It’s a compilation of rich data tables — over 100 of them — displayed with engaging narrative and graphics. While printed biennially, it is available online, where it comes alive every day. There, we update tables to make new data available soon after it is released. Years of related data accompany each Fact Book table online, making even more information readily accessible. Lay users as well as institutional and legislative researchers can download what they need, match it with their own data and use the results to tell their own stories.
Since coming to SREB, I’ve been concerned about the readiness of young adults for the changes in the workplace that economists are now forecasting. How well prepared is the current generation of young workers and high schoolers for what’s to come? When will automation begin to disrupt their lives and careers? By 2030? How nimble are today’s education systems for re-thinking education for tomorrow’s challenges? Here’s some advice: keep the Fact Book close at hand. Bookmark it on your computer. It might help us forecast more accurately as we try to weather the stormy decade ahead. Knowing what’s coming helps to strategize for better days. I plan to host a lot of discussion on this topic in the months and years ahead. We certainly hope SREB is the first place you call when you and your colleagues are ready to talk.
Stephen L. Pruitt, Ph.D. President
The Fact Book has
chronicled the history
of progress in the
South since 1956.
ii SREB Fact Book 2019
Acknowledgments
The data collected with the SREB-State Data Exchange survey continues to serve as the foundation for the Fact Book. The survey, which began in 1969, relies on the assistance of Data Exchange coordinators from all 16 SREB states to gather up-to-date comparative data on degrees and certificates awarded, student persistence and progression, time- and credits-to-degree, full-time-equivalent enrollment, distance education, dual enrollment, state funding, and tuition and mandatory fees. We appreciate the commitment of these coordinators to submitting timely and accurate data.
The Fact Book also includes a multitude of data compiled from many different sources, including federal agencies and professional organizations. These include the American Association of Colleges of Osteopathic Medicine; the American Medical Association; the Association of Research Libraries; the Center for the Study of Education Policy at Illinois State University; The Chronicle of Higher Education; the College and University Professional Association for Human Resources; the Institute for College Access and Success; the National Association of State Student Grant and Aid Programs; the National Center for Higher Education Management Systems; the National Science Foundation; the State Higher Education Executive Officers Association; the U.S. Bureau of Economic Analysis; the U.S. Bureau of Labor Statistics; the U.S. Census Bureau; the Washington Office of The College Board; and various offices of the U.S. Department of Education, especially the National Center for Education Statistics, the Office of Postsecondary Education and the Office of Student Financial Assistance.
Production of the SREB Fact Book involves a team of thoughtful, detail-oriented SREB staff. Vice President of Education Data, Policy Research, and Programs, Joan Lord, provided invaluable input on drafts and assistance with crafting the book’s story. Editorial consultant Teresa Valentine contributed greatly to the accuracy, consistency, and readability of the book through her careful review of drafts. Senior Designer and Production Manager, Lety Jones, was responsible for the design and layout of the book. Research Associates Chris Fuga and Rebecca Purser and Policy Analysts Meagan Crowe and Samantha Durrance provided valuable assistance in the updating of tables and drafting of chapters.
SREB Fact Book 2019 iii
Table of Contents
Message from the SREB President . . . . . . . . . . . . . . . . . . . . . . . . . . . . . . . . . . . . . . . . . . . . . . . . . . . . . . . . . . . . . . . . . . . . . . . . . . . . . i
Acknowledgments . . . . . . . . . . . . . . . . . . . . . . . . . . . . . . . . . . . . . . . . . . . . . . . . . . . . . . . . . . . . . . . . . . . . . . . . . . . . . . . . . . . . . . . . . . . . ii
Table of Contents . . . . . . . . . . . . . . . . . . . . . . . . . . . . . . . . . . . . . . . . . . . . . . . . . . . . . . . . . . . . . . . . . . . . . . . . . . . . . . . . . . . . . . . . . . . . iii
Introduction . . . . . . . . . . . . . . . . . . . . . . . . . . . . . . . . . . . . . . . . . . . . . . . . . . . . . . . . . . . . . . . . . . . . . . . . . . . . . . . . . . . . . . . . . . . . . . . . . ix
Population, Economy, Schools and Government . . . . . . . . . . . . . . . . . . . . . . . . . . . . . . . . . .1
GraphsProportion of Total Growth by Region . . . . . . . . . . . . . . . . . . . . . . . . . . . . . . . . . . . . . . . . . . . . . . . . . . . . . . . . . . . . . . . . . . . . . . . . . . .1Population Growth by Region . . . . . . . . . . . . . . . . . . . . . . . . . . . . . . . . . . . . . . . . . . . . . . . . . . . . . . . . . . . . . . . . . . . . . . . . . . . . . . . . . . . .2Percent of 25- to 64-Year-Olds With an Associate Degree or Higher . . . . . . . . . . . . . . . . . . . . . . . . . . . . . . . . . . . . . . . . . . . . . .3Percent of Racial and Ethnic Groups 25 Years and Older With a Bachelor’s Degree or Higher, SREB States . . . . . . . . . . . . . . . . . . . . . . . . . . . . . . . . . . . . . . . . . . . . . . . . . . . . . . . . . . . . . . . . . . . . . . . . . . . . . . . . . . . . . . . . . . . . . .4Public High School Graduation Rates by Race/Ethnicity, SREB States . . . . . . . . . . . . . . . . . . . . . . . . . . . . . . . . . . . . . . . . . . . .6
Tables 1. Total Population and Changes . . . . . . . . . . . . . . . . . . . . . . . . . . . . . . . . . . . . . . . . . . . . . . . . . . . . . . . . . . . . . . . . . . . . . . . . . . . .8 2. Education Attainment of the Adult Population . . . . . . . . . . . . . . . . . . . . . . . . . . . . . . . . . . . . . . . . . . . . . . . . . . . . . . . . . . . .9 3. Education Attainment of Working-Age and Young Working-Age Adults . . . . . . . . . . . . . . . . . . . . . . . . . . . . . . . . . 10 4. Education Attainment of the Working-Age Population by Race/Ethnicity . . . . . . . . . . . . . . . . . . . . . . . . . . . . . . . . 11 5. Racial and Ethnic Composition of the Population . . . . . . . . . . . . . . . . . . . . . . . . . . . . . . . . . . . . . . . . . . . . . . . . . . . . . . . 12 6. Age Distribution of the Population . . . . . . . . . . . . . . . . . . . . . . . . . . . . . . . . . . . . . . . . . . . . . . . . . . . . . . . . . . . . . . . . . . . . . . 14 7. Education Attainment of the Adult Population by Race/Ethnicity . . . . . . . . . . . . . . . . . . . . . . . . . . . . . . . . . . . . . . . 16 8. Public Prekindergarten, Elementary and Secondary School Enrollment . . . . . . . . . . . . . . . . . . . . . . . . . . . . . . . . . . 17 9. High School Graduation Rates . . . . . . . . . . . . . . . . . . . . . . . . . . . . . . . . . . . . . . . . . . . . . . . . . . . . . . . . . . . . . . . . . . . . . . . . . . 1810. Per Capita Income . . . . . . . . . . . . . . . . . . . . . . . . . . . . . . . . . . . . . . . . . . . . . . . . . . . . . . . . . . . . . . . . . . . . . . . . . . . . . . . . . . . . . 2011. Median Annual Income of Households . . . . . . . . . . . . . . . . . . . . . . . . . . . . . . . . . . . . . . . . . . . . . . . . . . . . . . . . . . . . . . . . . . 2112. Poverty Rates in the Population and Among Children . . . . . . . . . . . . . . . . . . . . . . . . . . . . . . . . . . . . . . . . . . . . . . . . . . . 2213. Employment and Unemployment in the Civilian Labor Force . . . . . . . . . . . . . . . . . . . . . . . . . . . . . . . . . . . . . . . . . . . . 2314. Nonagricultural Employment . . . . . . . . . . . . . . . . . . . . . . . . . . . . . . . . . . . . . . . . . . . . . . . . . . . . . . . . . . . . . . . . . . . . . . . . . . . 2415. Percent Distribution of State and Local Government General Expenditures . . . . . . . . . . . . . . . . . . . . . . . . . . . . . . 2616. Percent Distribution of State and Local Government General Revenues . . . . . . . . . . . . . . . . . . . . . . . . . . . . . . . . . 2817. State and Local Government General Revenues and Personal Income . . . . . . . . . . . . . . . . . . . . . . . . . . . . . . . . . . . 3018. State and Local Government General Expenditures . . . . . . . . . . . . . . . . . . . . . . . . . . . . . . . . . . . . . . . . . . . . . . . . . . . . . 31
iv SREB Fact Book 2019
College Participation . . . . . . . . . . . . . . . . . . . . . . . . . . . . . . . . . . . . . . . . . . . . . . . . . . . . . . . . . . 33
GraphsPercent of First-Time Freshmen Attending College in Their Home State, 2016 . . . . . . . . . . . . . . . . . . . . . . . . . . . . . . . . . . 33Percent of Full-time Undergraduate Students Ages 24 or Younger, Two- and Four-Year Institutions, 2013 and 2017 . . . . . . . . . . . . . . . . . . . . . . . . . . . . . . . . . . . . . . . . . . . . . . . . . . . . . . . . . . . . . . . . . . . . . . . . . . . . . . . . . . . . . . . . . . 35Percent of Total Enrollment by Race/Ethnicity, 2017 . . . . . . . . . . . . . . . . . . . . . . . . . . . . . . . . . . . . . . . . . . . . . . . . . . . . . . . . . . . 36 College Enrollment Rates of 18- to 24-Year-Olds by Race/Ethnicity, United States . . . . . . . . . . . . . . . . . . . . . . . . . . . . . . 36Change in Two-Year College Students as a Percentage of Undergraduate Enrollment, 2012 and 2017 . . . . . . . . . . . . 37Enrollment in Online-Only Colleges by Region Where College Headquartered, 2017 . . . . . . . . . . . . . . . . . . . . . . . . . . . . 38
Tables19. Migration of First-Time Freshmen . . . . . . . . . . . . . . . . . . . . . . . . . . . . . . . . . . . . . . . . . . . . . . . . . . . . . . . . . . . . . . . . . . . . . . 4020. Freshman Merit Scholars . . . . . . . . . . . . . . . . . . . . . . . . . . . . . . . . . . . . . . . . . . . . . . . . . . . . . . . . . . . . . . . . . . . . . . . . . . . . . . . 4121. Total Enrollment in Higher Education. . . . . . . . . . . . . . . . . . . . . . . . . . . . . . . . . . . . . . . . . . . . . . . . . . . . . . . . . . . . . . . . . . . 4222. Enrollment Changes by Student Level and Type of Attendance . . . . . . . . . . . . . . . . . . . . . . . . . . . . . . . . . . . . . . . . . . 4323. Enrollment Changes by Gender and Race/Ethnicity . . . . . . . . . . . . . . . . . . . . . . . . . . . . . . . . . . . . . . . . . . . . . . . . . . . . . 4424. Enrollment Changes by Type of College and University . . . . . . . . . . . . . . . . . . . . . . . . . . . . . . . . . . . . . . . . . . . . . . . . . . 4525. Undergraduate Enrollment. . . . . . . . . . . . . . . . . . . . . . . . . . . . . . . . . . . . . . . . . . . . . . . . . . . . . . . . . . . . . . . . . . . . . . . . . . . . . . 4626. Graduate and Professional Program Enrollment . . . . . . . . . . . . . . . . . . . . . . . . . . . . . . . . . . . . . . . . . . . . . . . . . . . . . . . . . 4727. Part-Time Enrollment . . . . . . . . . . . . . . . . . . . . . . . . . . . . . . . . . . . . . . . . . . . . . . . . . . . . . . . . . . . . . . . . . . . . . . . . . . . . . . . . . . . 4828. Age Distribution of College Students . . . . . . . . . . . . . . . . . . . . . . . . . . . . . . . . . . . . . . . . . . . . . . . . . . . . . . . . . . . . . . . . . . . . 4929. College Enrollment Rates by Age . . . . . . . . . . . . . . . . . . . . . . . . . . . . . . . . . . . . . . . . . . . . . . . . . . . . . . . . . . . . . . . . . . . . . . . 5030. Enrollment of Women . . . . . . . . . . . . . . . . . . . . . . . . . . . . . . . . . . . . . . . . . . . . . . . . . . . . . . . . . . . . . . . . . . . . . . . . . . . . . . . . . . 5131. Enrollment of Men . . . . . . . . . . . . . . . . . . . . . . . . . . . . . . . . . . . . . . . . . . . . . . . . . . . . . . . . . . . . . . . . . . . . . . . . . . . . . . . . . . . . . . 5232. Enrollment of Black Students . . . . . . . . . . . . . . . . . . . . . . . . . . . . . . . . . . . . . . . . . . . . . . . . . . . . . . . . . . . . . . . . . . . . . . . . . . . 5333. Enrollment of Hispanic Students . . . . . . . . . . . . . . . . . . . . . . . . . . . . . . . . . . . . . . . . . . . . . . . . . . . . . . . . . . . . . . . . . . . . . . . . 5434. Enrollment of White Students . . . . . . . . . . . . . . . . . . . . . . . . . . . . . . . . . . . . . . . . . . . . . . . . . . . . . . . . . . . . . . . . . . . . . . . . . . . 5535. Enrollment in Four-Year Colleges and Universities . . . . . . . . . . . . . . . . . . . . . . . . . . . . . . . . . . . . . . . . . . . . . . . . . . . . . . 5636. Enrollment in Two-Year Colleges. . . . . . . . . . . . . . . . . . . . . . . . . . . . . . . . . . . . . . . . . . . . . . . . . . . . . . . . . . . . . . . . . . . . . . . . 5737. Enrollment in Predominantly Black and Historically Black Colleges and Universities . . . . . . . . . . . . . . . . . . . . . 5838. Enrollment in Online-Only Colleges and Universities by State Where Institution is Headquartered . . . . . . . 5939. Enrollment in Non-Degree-Granting Postsecondary Education Institutions . . . . . . . . . . . . . . . . . . . . . . . . . . . . . . 6040. Medical School Enrollment . . . . . . . . . . . . . . . . . . . . . . . . . . . . . . . . . . . . . . . . . . . . . . . . . . . . . . . . . . . . . . . . . . . . . . . . . . . . . 6141. Full-Time-Equivalent Enrollment in Public Colleges and Universities, SREB States . . . . . . . . . . . . . . . . . . . . . . . 6242. Percent of Undergraduate Credit-/Contact-Hours Taken by High School Students, SREB States, 2017-18 . . . . . . . . . . . . . . . . . . . . . . . . . . . . . . . . . . . . . . . . . . . . . . . . . . . . . . . . . . . . . . . . . . . . . . . . . . . . . . . . . . . . . . . . . . . . . . . . . 6443. Percent of Instruction Through E-Learning . . . . . . . . . . . . . . . . . . . . . . . . . . . . . . . . . . . . . . . . . . . . . . . . . . . . . . . . . . . . . . 65
SREB Fact Book 2019 v
College Completion . . . . . . . . . . . . . . . . . . . . . . . . . . . . . . . . . . . . . . . . . . . . . . . . . . . . . . . . . . . 67
GraphsAverage Annual Earnings of Adults Ages 25 or Older, by Highest Level of Education, United States, 2017 . . . . . . . . . . . . . . . . . . . . . . . . . . . . . . . . . . . . . . . . . . . . . . . . . . . . . . . . . . . . . . . . . . . . . . . . . . . . . . . . . . . . . 67Projected Increases in Employment by Education Required, United States . . . . . . . . . . . . . . . . . . . . . . . . . . . . . . . . . . . . . 68Trends in Student Progression Rates, SREB States . . . . . . . . . . . . . . . . . . . . . . . . . . . . . . . . . . . . . . . . . . . . . . . . . . . . . . . . . . . . . 69Graduation Rates, 150 Percent of Normal Time by Race and Ethnicity, Public Colleges and Universities . . . . . . . . . 70 Graduation Rates, 100 and 150 Percent of Normal Time, Public Colleges and Universities . . . . . . . . . . . . . . . . . . . . . . . 71Programs Completed, Public and Private Colleges, SREB States . . . . . . . . . . . . . . . . . . . . . . . . . . . . . . . . . . . . . . . . . . . . . . . . 72Student Status at Entry, Associate Degree Graduates, Public Two-Year Colleges Participating SREB States, 2016-17 . . . . . . . . . . . . . . . . . . . . . . . . . . . . . . . . . . . . . . . . . . . . . . . . . . . . . . . . . . . . . . . . . . . . . . 73Bachelor’s Degree Graduates from Public Four-Year Colleges and Universities Participating SREB States, 2016-17 . . . . . . . . . . . . . . . . . . . . . . . . . . . . . . . . . . . . . . . . . . . . . . . . . . . . . . . . . . . . . . . . . . . . . . 74Women Graduates as a Percent of Total Graduates, SREB States . . . . . . . . . . . . . . . . . . . . . . . . . . . . . . . . . . . . . . . . . . . . . . . 76Black Graduates as a Percent of Total Graduates, SREB States . . . . . . . . . . . . . . . . . . . . . . . . . . . . . . . . . . . . . . . . . . . . . . . . . 76 Hispanic Graduates as a Percent of Total Graduates, SREB States . . . . . . . . . . . . . . . . . . . . . . . . . . . . . . . . . . . . . . . . . . . . . . 77
Tables44. First-Year Persistence and Progression Rates Within 150 Percent of Normal Time to Graduation in Public Higher Education Institutions . . . . . . . . . . . . . . . . . . . . . . . . . . . . . . . . . . . . . . . . . . . . . . . . . . . 7945. Three- and Six-Year Graduation Rates in Public Colleges and Universities, by Race and Ethnicity . . . . . . . . . . . . . . . . . . . . . . . . . . . . . . . . . . . . . . . . . . . . . . . . . . . . . . . . . . . . . . . . . . . . . . . . . . . . . . . . . . . 8046. Two- and Four-Year Graduation Rates in Public Universities and Colleges . . . . . . . . . . . . . . . . . . . . . . . . . . . . . . . 8247. Sub-Bachelor’s Certificates Awarded by Public and Private Colleges and Universities . . . . . . . . . . . . . . . . . . . . 8348. Awards Earned at Online-Only Colleges and Universities . . . . . . . . . . . . . . . . . . . . . . . . . . . . . . . . . . . . . . . . . . . . . . . . 8449. Associate Degrees Awarded by Public and Private Colleges and Universities . . . . . . . . . . . . . . . . . . . . . . . . . . . . . 8550. Associate Degrees Awarded in Selected Fields . . . . . . . . . . . . . . . . . . . . . . . . . . . . . . . . . . . . . . . . . . . . . . . . . . . . . . . . . . . 8651. Percent Distribution of Associate Degree Graduates and Time- and Credits-to-Degree, Public Two-Year Colleges . . . . . . . . . . . . . . . . . . . . . . . . . . . . . . . . . . . . . . . . . . . . . . . . . . . . . . . . . . . . . . . . . . . . . . . . . . . . . . . 8752. Percent Distribution of Bachelor’s Degree Graduates and Time- and Credits-to-Degree, Public Four-Year Colleges and Universities . . . . . . . . . . . . . . . . . . . . . . . . . . . . . . . . . . . . . . . . . . . . . . . . . . . . . . . . . . . . . . 8853. Bachelor’s Degrees Awarded by Public and Private Colleges and Universities . . . . . . . . . . . . . . . . . . . . . . . . . . . . 8954. Bachelor’s Degrees Awarded in Selected Fields . . . . . . . . . . . . . . . . . . . . . . . . . . . . . . . . . . . . . . . . . . . . . . . . . . . . . . . . . . 9055. Master’s Degrees Awarded by Public and Private Colleges and Universities . . . . . . . . . . . . . . . . . . . . . . . . . . . . . . 9156. Master’s Degrees Awarded in Selected Fields . . . . . . . . . . . . . . . . . . . . . . . . . . . . . . . . . . . . . . . . . . . . . . . . . . . . . . . . . . . . 9257. Research and Scholarship Doctoral Degrees Awarded by Public and Private Colleges and Universities . . . 9358. Research and Scholarship Doctoral Degrees Awarded in Selected Fields . . . . . . . . . . . . . . . . . . . . . . . . . . . . . . . . . 9459. Professional Practice Doctoral Degrees Awarded by Public and Private Colleges and Universities . . . . . . . . 9560. Professional Practice Doctoral Degrees Awarded in Selected Fields . . . . . . . . . . . . . . . . . . . . . . . . . . . . . . . . . . . . . . 9661. Other Doctoral Degrees Awarded by Public and Private Colleges and Universities . . . . . . . . . . . . . . . . . . . . . . . 98
vi SREB Fact Book 2019
College Affordability . . . . . . . . . . . . . . . . . . . . . . . . . . . . . . . . . . . . . . . . . . . . . . . . . . . . . . . . . . 99
GraphsAnnual Undergraduate Costs of College Attendance, United States . . . . . . . . . . . . . . . . . . . . . . . . . . . . . . . . . . . . . . . . . . . . . 99Percent of Average Annual Household Income Required to Pay for One Year at a Public Four-Year College, United States . . . . . . . . . . . . . . . . . . . . . . . . . . . . . . . . . . . . . . . . . . . . . . . . . . . . . . . . . . . . . . . . 100 Percent of Tuition, Fees, Room and Board Covered by Maximum Federal Pell Grant, United States . . . . . . . . . . . . 102Student Financial Aid and Loan Trends, United States . . . . . . . . . . . . . . . . . . . . . . . . . . . . . . . . . . . . . . . . . . . . . . . . . . . . . . . . 103What Students and Their Families Pay, Public Four-Year Colleges and Universities . . . . . . . . . . . . . . . . . . . . . . . . . . . . 104Percent of Bachelor’s Degree Graduates with Debt, Public Four-Year Colleges . . . . . . . . . . . . . . . . . . . . . . . . . . . . . . . . . 105
Tables62. Median Annual Tuition and Required Fees for Full-Time Undergraduate Students . . . . . . . . . . . . . . . . . . . . . . 10663. Percent of Median Family Incomes Required to Pay Median Annual Tuition and Fees . . . . . . . . . . . . . . . . . . 10864. Median Annual Tuition and Required Fees for Full-Time Undergraduate Students at Public Universities, Colleges, and Technical Institutes or Colleges . . . . . . . . . . . . . . . . . . . . . . . . . . . . . . . . . . . . . . . . . . . . . 11065. Federal Pell Grants . . . . . . . . . . . . . . . . . . . . . . . . . . . . . . . . . . . . . . . . . . . . . . . . . . . . . . . . . . . . . . . . . . . . . . . . . . . . . . . . . . . . . 11266. Federal Student Loan Programs . . . . . . . . . . . . . . . . . . . . . . . . . . . . . . . . . . . . . . . . . . . . . . . . . . . . . . . . . . . . . . . . . . . . . . . . 11467. State Scholarships, Grants and Other Financial Aid Funds . . . . . . . . . . . . . . . . . . . . . . . . . . . . . . . . . . . . . . . . . . . . . . 11668. First-Time Students’ Participation in Student Financial Aid and Loan Programs at Public Four-Year Colleges and Universities . . . . . . . . . . . . . . . . . . . . . . . . . . . . . . . . . . . . . . . . . . . . . . . . . . . . . . . . . . 11869. First-Time Students’ Participation in Student Financial Aid and Loan Programs at Public Two-Year Colleges . . . . . . . . . . . . . . . . . . . . . . . . . . . . . . . . . . . . . . . . . . . . . . . . . . . . . . . . . . . . . . . . . . . . . . . . . . . . 12070. Cost of Attendance and Net Price for Fall-Term, Full-Time Degree- or Certificate-Seeking Undergraduates Who Paid In-State or In-District Tuition at Public Colleges and Universities . . . . . . . . . . . 12271. Federal Campus-Based Financial Aid to Students . . . . . . . . . . . . . . . . . . . . . . . . . . . . . . . . . . . . . . . . . . . . . . . . . . . . . . 12472. Average Minimum Debt of College Graduates at Public Four-Year Colleges and Universities . . . . . . . . . . . . 125
Faculty and Administrators . . . . . . . . . . . . . . . . . . . . . . . . . . . . . . . . . . . . . . . . . . . . . . . . . . 127
GraphsWomen Faculty and Administrators, SREB States . . . . . . . . . . . . . . . . . . . . . . . . . . . . . . . . . . . . . . . . . . . . . . . . . . . . . . . . . . . . . 127Black and Hispanic Faculty and Administrators, SREB States . . . . . . . . . . . . . . . . . . . . . . . . . . . . . . . . . . . . . . . . . . . . . . . . . 128Projected U.S. Job Growth . . . . . . . . . . . . . . . . . . . . . . . . . . . . . . . . . . . . . . . . . . . . . . . . . . . . . . . . . . . . . . . . . . . . . . . . . . . . . . . . . . . . 129Part-Time Faculty, SREB States . . . . . . . . . . . . . . . . . . . . . . . . . . . . . . . . . . . . . . . . . . . . . . . . . . . . . . . . . . . . . . . . . . . . . . . . . . . . . . . 129Student-to-Faculty Ratios, Four-Year Colleges and Universities . . . . . . . . . . . . . . . . . . . . . . . . . . . . . . . . . . . . . . . . . . . . . . . 130Changes in Annual Pay . . . . . . . . . . . . . . . . . . . . . . . . . . . . . . . . . . . . . . . . . . . . . . . . . . . . . . . . . . . . . . . . . . . . . . . . . . . . . . . . . . . . . . . 131Average Salaries, Full-Time Instructional Faculty at Public Four-Year Colleges and Universities, 2017-18 . . . . . . 132Average Salaries, Full-Time Instructional Faculty at Public Two-Year Colleges, 2017-18 . . . . . . . . . . . . . . . . . . . . . . . . 133
Tables73. Full-Time Faculty at Public Four-Year Colleges and Universities . . . . . . . . . . . . . . . . . . . . . . . . . . . . . . . . . . . . . . . . 13574. Full-Time Faculty at Public Two-Year Colleges . . . . . . . . . . . . . . . . . . . . . . . . . . . . . . . . . . . . . . . . . . . . . . . . . . . . . . . . . 136
SREB Fact Book 2019 vii
75. Part-Time Faculty and Graduate Assistants as a Percent of Total Instructional Faculty . . . . . . . . . . . . . . . . . . 13776. Full-Time Administrators at Public Four-Year Colleges and Universities . . . . . . . . . . . . . . . . . . . . . . . . . . . . . . . . 13877. Full-Time Administrators at Public Two-Year Colleges . . . . . . . . . . . . . . . . . . . . . . . . . . . . . . . . . . . . . . . . . . . . . . . . . 13978. Staff at Public Four-Year Colleges and Universities . . . . . . . . . . . . . . . . . . . . . . . . . . . . . . . . . . . . . . . . . . . . . . . . . . . . . 14079. Staff at Public Two-Year Colleges . . . . . . . . . . . . . . . . . . . . . . . . . . . . . . . . . . . . . . . . . . . . . . . . . . . . . . . . . . . . . . . . . . . . . . 14280. Percent Distribution of Full-Time Instructional Faculty by Rank at Public Four-Year Colleges and Universities . . . . . . . . . . . . . . . . . . . . . . . . . . . . . . . . . . . . . . . . . . . . . . . . . . . . . . . . . . 14481 Median Student-to-Faculty Ratios . . . . . . . . . . . . . . . . . . . . . . . . . . . . . . . . . . . . . . . . . . . . . . . . . . . . . . . . . . . . . . . . . . . . . . 14582. Average Salaries of Full-Time Instructional Faculty at Public Four-Year Colleges and Universities . . . . . . . 14683. Average Salaries of Full-Time Instructional Faculty at Public Two-Year Colleges and Technical Institutes or Colleges . . . . . . . . . . . . . . . . . . . . . . . . . . . . . . . . . . . . . . . . . . . . . . . . . . . . . . . . . . . . . . . . . . . . 14784. Average Salaries of Full-Time Instructional Faculty by Rank at Public Four-Year Colleges and Universities. . . . . . . . . . . . . . . . . . . . . . . . . . . . . . . . . . . . . . . . . . . . . . . . . . . . . . . . . . . . . . . . . . . . . . . . . . . . . . . 14885. Average Salaries of Full-Time Instructional Faculty by Type of Public Four-Year College or University . . 14986. Median Salaries of Full-Time Faculty by Discipline and Rank at Public Four-Year Colleges and Universities, United States . . . . . . . . . . . . . . . . . . . . . . . . . . . . . . . . . . . . . . . . . . . . . . . . . . . . . . . . . . . . . . . . . . . . . . . . . 15087. Unweighted Median Salary by Classificaiton, All Institutions . . . . . . . . . . . . . . . . . . . . . . . . . . . . . . . . . . . . . . . . . . . 151
Revenues and Expenditures . . . . . . . . . . . . . . . . . . . . . . . . . . . . . . . . . . . . . . . . . . . . . . . . . . 153
GraphsChanges in Per Student Funding Adjusted for Enrollment Changes and Inflation, Public Colleges and Universities, SREB States . . . . . . . . . . . . . . . . . . . . . . . . . . . . . . . . . . . . . . . . . . . . . . . . . . . . . . . . . . 153Components of Funding Growth, SREB States . . . . . . . . . . . . . . . . . . . . . . . . . . . . . . . . . . . . . . . . . . . . . . . . . . . . . . . . . . . . . . . . 154Ratio of State Appropriations and Tuition and Fee Revenues, SREB States . . . . . . . . . . . . . . . . . . . . . . . . . . . . . . . . . . . . . 155Funding Sources for Public Four-Year Colleges and Universities, SREB States . . . . . . . . . . . . . . . . . . . . . . . . . . . . . . . . . 156Funding Sources for Public Two-Year Colleges, SREB States . . . . . . . . . . . . . . . . . . . . . . . . . . . . . . . . . . . . . . . . . . . . . . . . . . . 157Spending Patterns at Public Four-Year Colleges and Universities, SREB States . . . . . . . . . . . . . . . . . . . . . . . . . . . . . . . . . 158Spending Patterns at Public Two-Year Colleges, SREB States . . . . . . . . . . . . . . . . . . . . . . . . . . . . . . . . . . . . . . . . . . . . . . . . . . 158Sources of Scholarship and Fellowship Spending at Public Colleges and Universities, SREB States, 2014-15 . . . . . . . . . . . . . . . . . . . . . . . . . . . . . . . . . . . . . . . . . . . . . . . . . . . . . . . . . . . . . . . . . . . . . . . . . . . . . . . . . . . 159
Tables88. Funds for Educational and General Operations Per Full-Time-Equivalent Student at Public Four-Year Colleges and Universities . . . . . . . . . . . . . . . . . . . . . . . . . . . . . . . . . . . . . . . . . . . . . . . . . . . . . . . . . . 16089. Funds for Educational and General Operations Per Full-Time-Equivalent Student at Public Two-Year Colleges . . . . . . . . . . . . . . . . . . . . . . . . . . . . . . . . . . . . . . . . . . . . . . . . . . . . . . . . . . . . . . . . . . . . . . . . . . . . 16290. Funds for Educational and General Operations Per Full-Time-Equivalent Student at Public Technical Institutes or Colleges . . . . . . . . . . . . . . . . . . . . . . . . . . . . . . . . . . . . . . . . . . . . . . . . . . . . . . . . . . . . . . . 16391. Appropriations of State Tax Funds for Operating Expenses Related to Higher Education . . . . . . . . . . . . . . . . 16492. State Appropriations Related to Higher Education as Percentages of State Taxes . . . . . . . . . . . . . . . . . . . . . . . 16593. Percent Distribution of Funds for Operations Related to Higher Education, 2017-18 . . . . . . . . . . . . . . . . . . . . 166
viii SREB Fact Book 2019
94. Percent Distribution of Revenues at Public Four-Year Colleges and Universities . . . . . . . . . . . . . . . . . . . . . . . . 16895. Percent Distribution of Revenues at Public Two-Year Colleges . . . . . . . . . . . . . . . . . . . . . . . . . . . . . . . . . . . . . . . . . . 16996. Percent Distribution of Spending at Public Four-Year Colleges and Universities . . . . . . . . . . . . . . . . . . . . . . . . . 17097. Percent Distribution of Spending at Public Two-Year Colleges . . . . . . . . . . . . . . . . . . . . . . . . . . . . . . . . . . . . . . . . . . 17198. Percent Distribution of Scholarships and Fellowships at Public Four-Year Colleges and Universities . . . . . . . . . . . . . . . . . . . . . . . . . . . . . . . . . . . . . . . . . . . . . . . . . . . . . . . . . . . . . . . . . . . . . . . . . . . . . . . . . . . . . . . 17299. Percent Distribution of Scholarships and Fellowships at Public Two-Year Colleges . . . . . . . . . . . . . . . . . . . . . . 173100. Federal Support for Research and Development at Universities by State . . . . . . . . . . . . . . . . . . . . . . . . . . . . . . . . 174101. Top-Ranked Universities’ Spending on Research and Development . . . . . . . . . . . . . . . . . . . . . . . . . . . . . . . . . . . . . 175102. Federal Support for Research and Development at Universities, Top 100 . . . . . . . . . . . . . . . . . . . . . . . . . . . . . . . . 176103. University Endowments . . . . . . . . . . . . . . . . . . . . . . . . . . . . . . . . . . . . . . . . . . . . . . . . . . . . . . . . . . . . . . . . . . . . . . . . . . . . . . . . 178104. Universities’ Large Library Collections, Expenditures and Staff . . . . . . . . . . . . . . . . . . . . . . . . . . . . . . . . . . . . . . . . . 180
Appendix A
SREB-State Data Exchange Definitions of Institutional Categories and Listing of Public Universities, Four-Year and Two-Year Colleges, and Technical Institutes and Colleges . . . . . . . . . 183
Appendix B
SREB-State Data Exchange Agencies . . . . . . . . . . . . . . . . . . . . . . . . . . . . . . . . . . . . . . . . . . . . . . . . . . . . . . . . . . . . . . . . . 195
SREB Fact Book 2019 ix
The 2019 edition of the SREB Fact Book on Higher Education continues a long history of providing comparative data that dates back to 1956. The Fact Book began as a compilation of data on enrollment and revenues for use by states in the region. Since then, the Fact Book has evolved to include data on education attainment and demographics; economic indicators; elementary and secondary school enrollment and graduation rates; government revenues and expenditures; college enrollment disaggregated by characteristics such as age, sex and race/ethnicity; persistence and progression rates; dual enrollment; e-learning enrollment; degrees awarded; tuition and mandatory fees; cost of attendance; student financial aid and student debt; faculty and administrator salaries; state funding for higher education; college and university revenues and expenditures; federal support for research; and university endowments. The Fact Book also expanded in 2011 to include data on all 50 states and the District of Columbia.
The Fact Book is divided into six chapters covering topics related to postsecondary education. These chapters cover student participation in postsecondary programs, completion of certificates and associate degrees to graduate and professional degrees, the affordability of college coupled with the effect of rising costs on families, the changes in postsecondary staffing including faculty, and the factors that influence institutional budgets and expenditures. These chapters are preceded by a chapter on the population and economics of the region. This first chapter sets an important context for readers and researchers by providing data from P-12 and postsecondary education on demographic and economic trends that affect education outcomes.
These chapters provide data and analysis policymakers need to answer key questions. Without current, high-quality data and timely comparisons from region to region and state to state, policymakers are left without insights they need to answer key questions and make important, often critical, decisions. The Fact Book provides data to help answer these questions, including the ones that follow.
How do states compare with their neighbors and peers?
n How is education attainment changing in a state? Is the state on track to meet education attainment goals?
nAre the percentages of residents who have graduated from high school, college and professional school adequate to meet workforce projections?
nHow does a state compare with its peers with respect to personal income levels, per capita wealth, employment growth and unemployment rates?
nAre there race/ethnicity gaps with respect to high school graduation, college enrollment and college completion?
Introduction
The SREB-State Data
Exchange survey collects
much of the data that
serves as the foundation
for the Fact Book.
x SREB Fact Book 2019
n What percentage of students persist and progress through college?
nHow long does it take students to complete bachelor’s degrees? Do they accumulate the appropriate number of credit hours for the degree?
nHow many degrees were awarded in high-demand fields of study?
Are states making postsecondary education affordable for their residents?
nAre the costs to attend universities, colleges, and technical colleges or institutes in line with students’ and families’ ability to pay?
nAre states providing adequate and appropriate amounts and types of student financial aid?
nWhat percentage of graduates have student debt, and what is the average amount of debt per graduate?
Are states funding postsecondary education at an appropriate level?
n Is higher education revenue keeping pace with inflation and changes in enrollment?
nHow has state support for postsecondary education changed over time?
nDo state and local budgets devote adequate funding to education and other major priorities? Are these budgets responding appropriately to changing needs for services?
nHow has spending by postsecondary institutions changed with respect to instruction, research, public service, academic and administrative support, and student scholarships?
The amount of data collected on various facets of postsecondary education has increased in recent years. Although the amount of data has increased, there is no guarantee that the quality of those data has improved. Readers are cautioned to consider the many differences between states that can affect the comparisons and rankings contained in this book. You are encouraged to contact the SREB-State Data Exchange agencies in Appendix B for state-specific context on these data.
As always, SREB welcomes feedback on the Fact Book. For those who are interested in doing their own analysis, the SREB Data Services website at www.sreb.org/fact-book-ed-data provides access to much of the data used to create the tables and graphs in the Fact Book.
SREB Fact Book 2019 1
POPU
LATIO
N
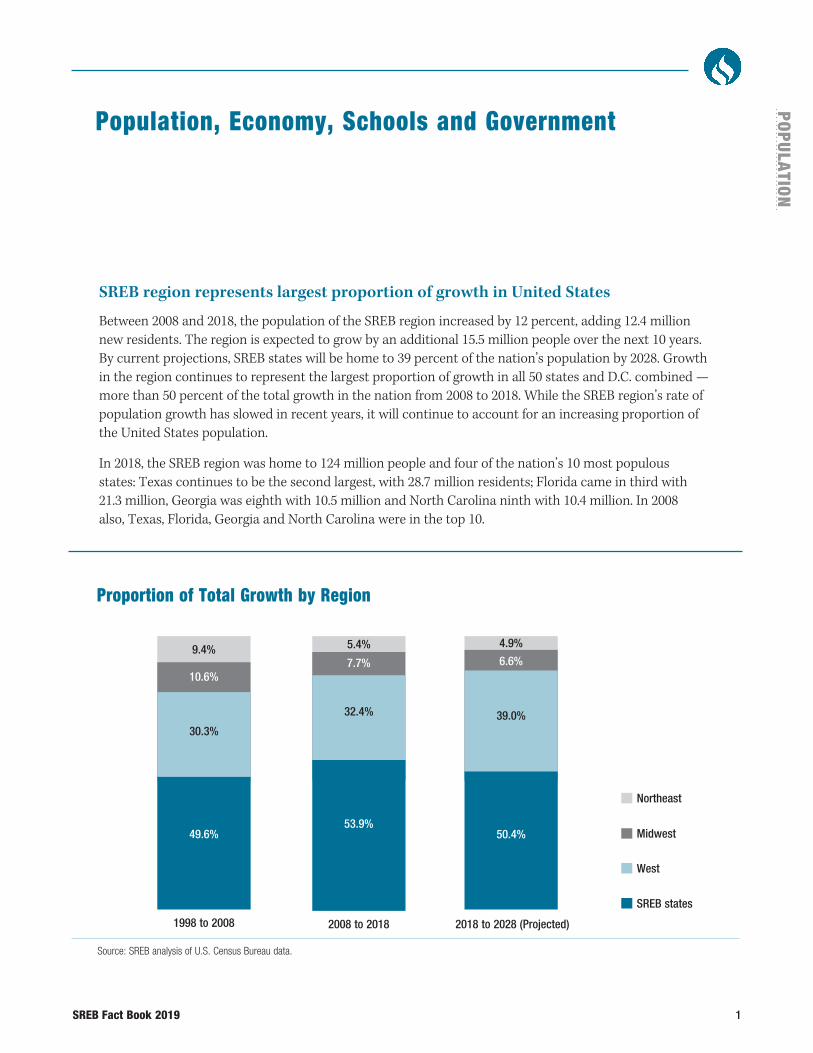
SREB region represents largest proportion of growth in United States
Between 2008 and 2018, the population of the SREB region increased by 12 percent, adding 12.4 million new residents. The region is expected to grow by an additional 15.5 million people over the next 10 years. By current projections, SREB states will be home to 39 percent of the nation’s population by 2028. Growth in the region continues to represent the largest proportion of growth in all 50 states and D.C. combined — more than 50 percent of the total growth in the nation from 2008 to 2018. While the SREB region’s rate of population growth has slowed in recent years, it will continue to account for an increasing proportion of the United States population.
In 2018, the SREB region was home to 124 million people and four of the nation’s 10 most populous states: Texas continues to be the second largest, with 28.7 million residents; Florida came in third with 21.3 million, Georgia was eighth with 10.5 million and North Carolina ninth with 10.4 million. In 2008 also, Texas, Florida, Georgia and North Carolina were in the top 10.
Proportion of Total Growth by Region
Source: SREB analysis of U.S. Census Bureau data.
Population, Economy, Schools and Government
SREB states
West
Midwest
Northeast
1998 to 2008
30.3%
10.6%
9.4%
49.6%
2008 to 2018
32.4%
7.7%
5.4%
53.9%
2018 to 2028 (Projected)
39.0%
6.6%
4.9%
50.4%
2 SREB Fact Book 2019
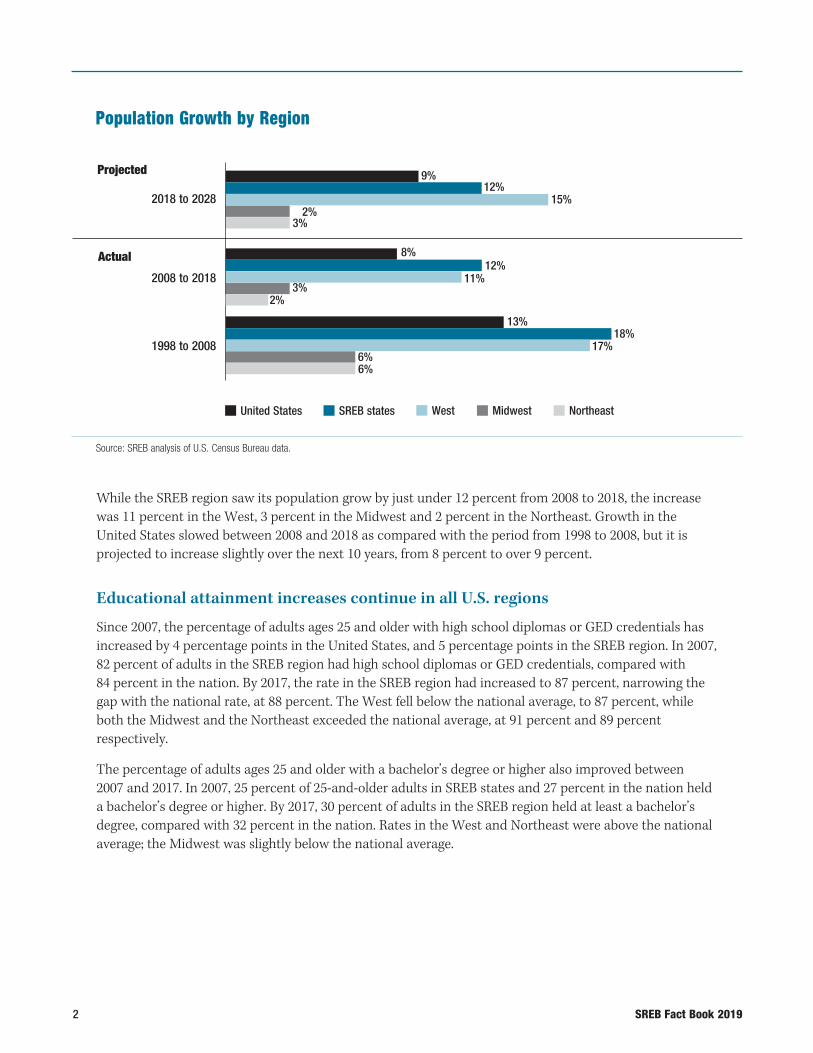
While the SREB region saw its population grow by just under 12 percent from 2008 to 2018, the increase was 11 percent in the West, 3 percent in the Midwest and 2 percent in the Northeast. Growth in the United States slowed between 2008 and 2018 as compared with the period from 1998 to 2008, but it is projected to increase slightly over the next 10 years, from 8 percent to over 9 percent.
Educational attainment increases continue in all U.S. regions
Since 2007, the percentage of adults ages 25 and older with high school diplomas or GED credentials has increased by 4 percentage points in the United States, and 5 percentage points in the SREB region. In 2007, 82 percent of adults in the SREB region had high school diplomas or GED credentials, compared with 84 percent in the nation. By 2017, the rate in the SREB region had increased to 87 percent, narrowing the gap with the national rate, at 88 percent. The West fell below the national average, to 87 percent, while both the Midwest and the Northeast exceeded the national average, at 91 percent and 89 percent respectively.
The percentage of adults ages 25 and older with a bachelor’s degree or higher also improved between 2007 and 2017. In 2007, 25 percent of 25-and-older adults in SREB states and 27 percent in the nation held a bachelor’s degree or higher. By 2017, 30 percent of adults in the SREB region held at least a bachelor’s degree, compared with 32 percent in the nation. Rates in the West and Northeast were above the national average; the Midwest was slightly below the national average.
Population Growth by Region
Source: SREB analysis of U.S. Census Bureau data.
SREB states West Midwest NortheastUnited States
9%
2018 to 2028
2008 to 2018
1998 to 2008
Actual
Projected12%
15%2%
3%
8%12%
11%3%
2%
13%18%
17%6%6%
SREB Fact Book 2019 3
POPU
LATIO
N
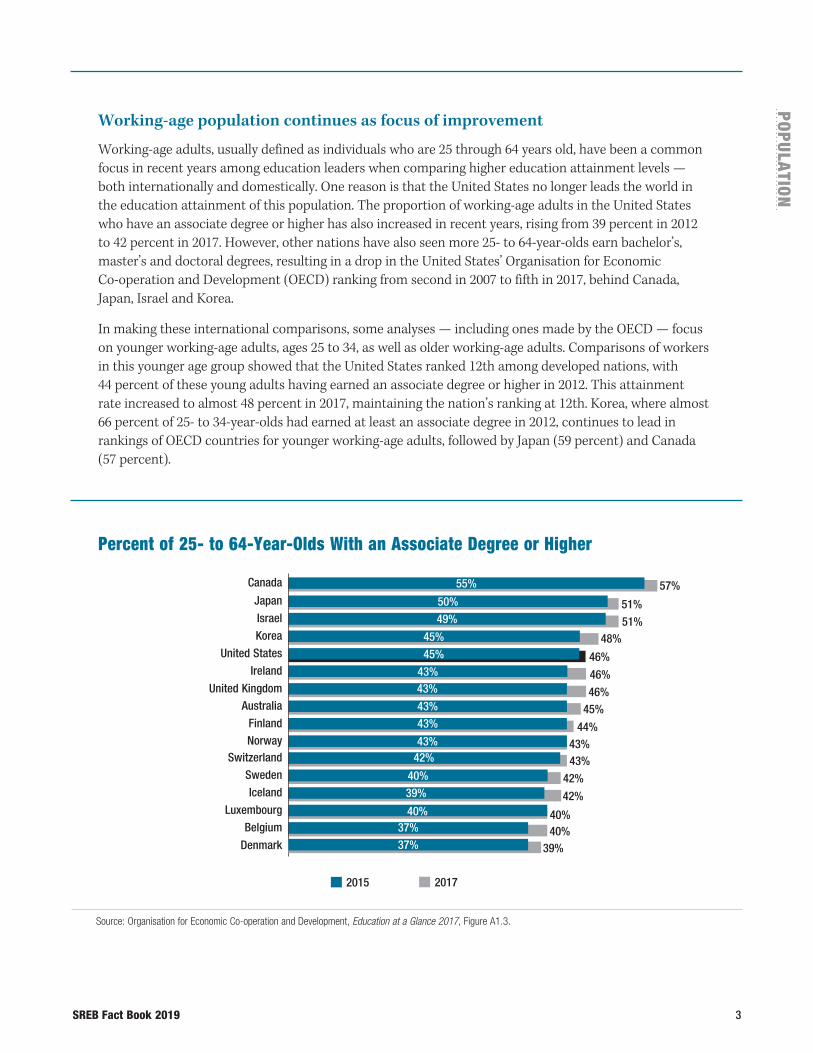
Working-age population continues as focus of improvement
Working-age adults, usually defined as individuals who are 25 through 64 years old, have been a common focus in recent years among education leaders when comparing higher education attainment levels — both internationally and domestically. One reason is that the United States no longer leads the world in the education attainment of this population. The proportion of working-age adults in the United States who have an associate degree or higher has also increased in recent years, rising from 39 percent in 2012 to 42 percent in 2017. However, other nations have also seen more 25- to 64-year-olds earn bachelor’s, master’s and doctoral degrees, resulting in a drop in the United States’ Organisation for Economic Co-operation and Development (OECD) ranking from second in 2007 to fifth in 2017, behind Canada, Japan, Israel and Korea.
In making these international comparisons, some analyses — including ones made by the OECD — focus on younger working-age adults, ages 25 to 34, as well as older working-age adults. Comparisons of workers in this younger age group showed that the United States ranked 12th among developed nations, with 44 percent of these young adults having earned an associate degree or higher in 2012. This attainment rate increased to almost 48 percent in 2017, maintaining the nation’s ranking at 12th. Korea, where almost 66 percent of 25- to 34-year-olds had earned at least an associate degree in 2012, continues to lead in rankings of OECD countries for younger working-age adults, followed by Japan (59 percent) and Canada (57 percent).
POPU
LATIO
N
Percent of 25- to 64-Year-Olds With an Associate Degree or Higher
Source: Organisation for Economic Co-operation and Development, Education at a Glance 2017, Figure A1.3.
2015 2017
Japan
Israel
Korea
United States
Ireland
United KingdomAustralia
FinlandNorway
51%50%
Canada 57%55%
51%49%
48%45%
46%45%
46%43%
46%43%
45%43%
44%43%
43%43%Switzerland 43%42%
Sweden
Iceland
Luxembourg
Belgium
Denmark
42%40%
42%39%
40%40%
40%37%
39%37%
4 SREB Fact Book 2019
Population of undereducated adults represents a key target group for college
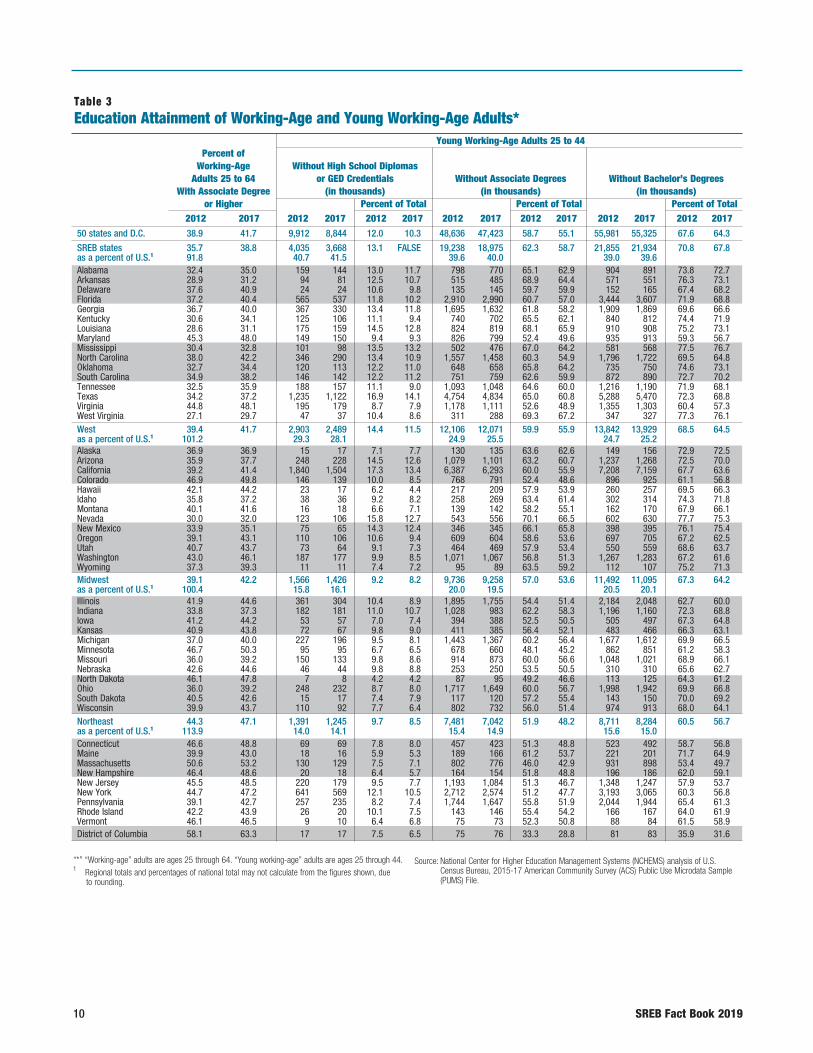
As higher education attainment becomes ever more important to economic competitiveness, the undereducated working-age adults ages 25 to 44 are a key target population for education services. In 2017, nearly 3.7 million (or 11 percent) of 25- to 44-year-olds in SREB states did not have high school diplomas or GED credentials. About 19 million (59 percent) had not earned associate degrees, and 22 million (68 percent) had not earned bachelor’s degrees. A greater concentration of undereducated adults resided in the SREB region than in the Midwest and Northeast, although the West had a higher percentage of these working-age adults without high school diplomas or GED credentials.
Highest growth racial groups continue to have low educational attainment
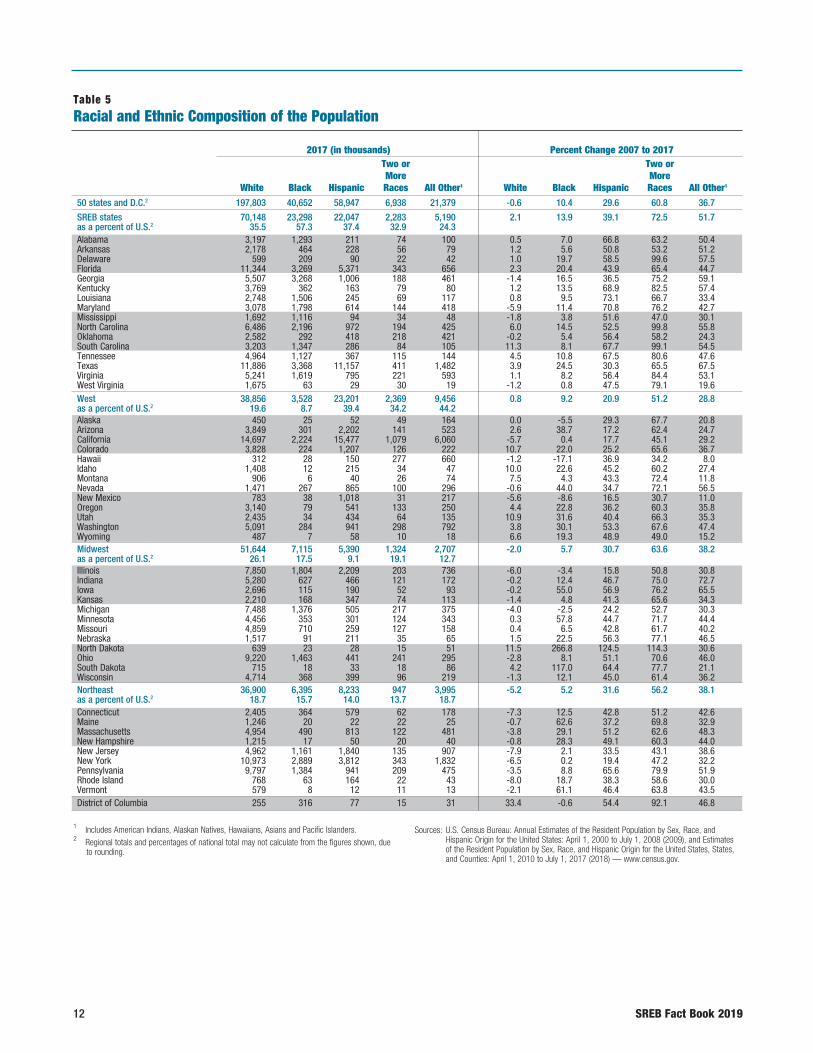
The nation’s black and Hispanic populations grew much faster than the white population from 2007 to 2017. In the SREB region, the black population grew by 14 percent and the Hispanic population grew by 39 percent, while the white population grew by 2 percent. Consequently, the portion of the population that is white dropped during this ten-year period from 63 percent to 57 percent of the total SREB population. Black population representation remained about 19 percent, and the Hispanic population rose from 14 percent to 18 percent.
In total numbers, these changes amounted to 6.3 million more Hispanic residents in the region, 2.9 million more black residents and 2 million more white residents in SREB states. In 2017, the SREB region accounted for over 37 percent of the nation’s Hispanic population and 57 percent of its black population. The Western states were home to slightly more of the nation’s Hispanic residents: 39 percent.
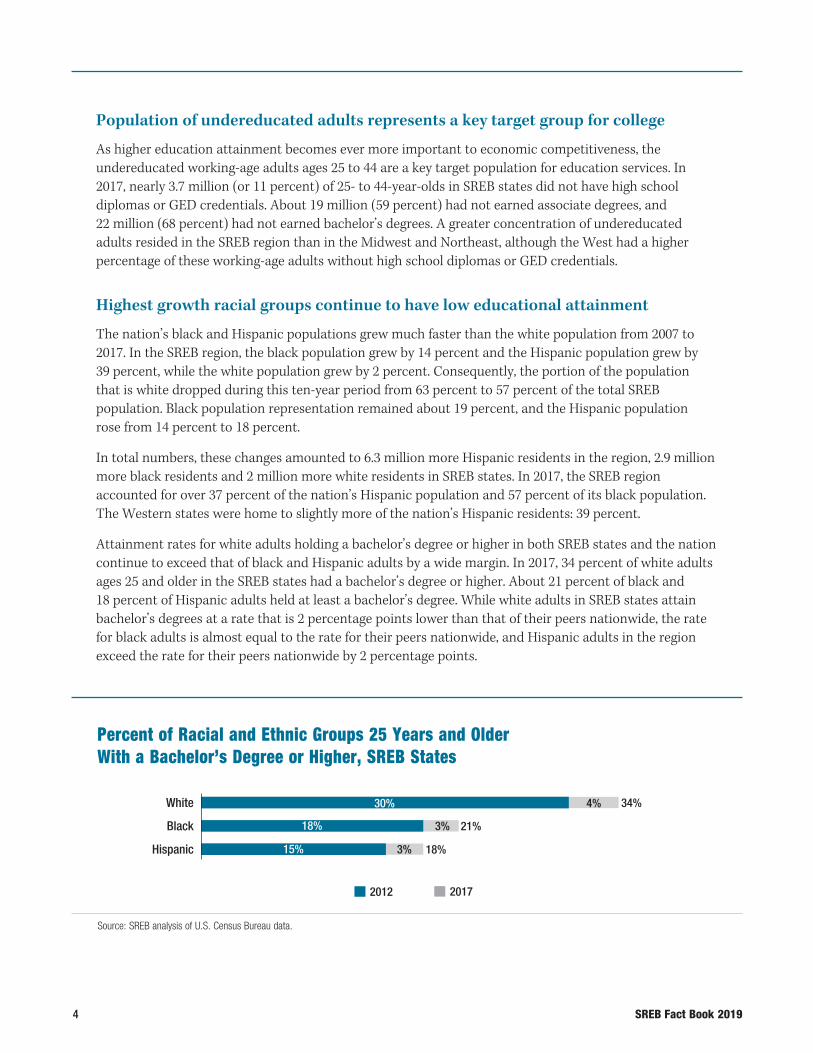
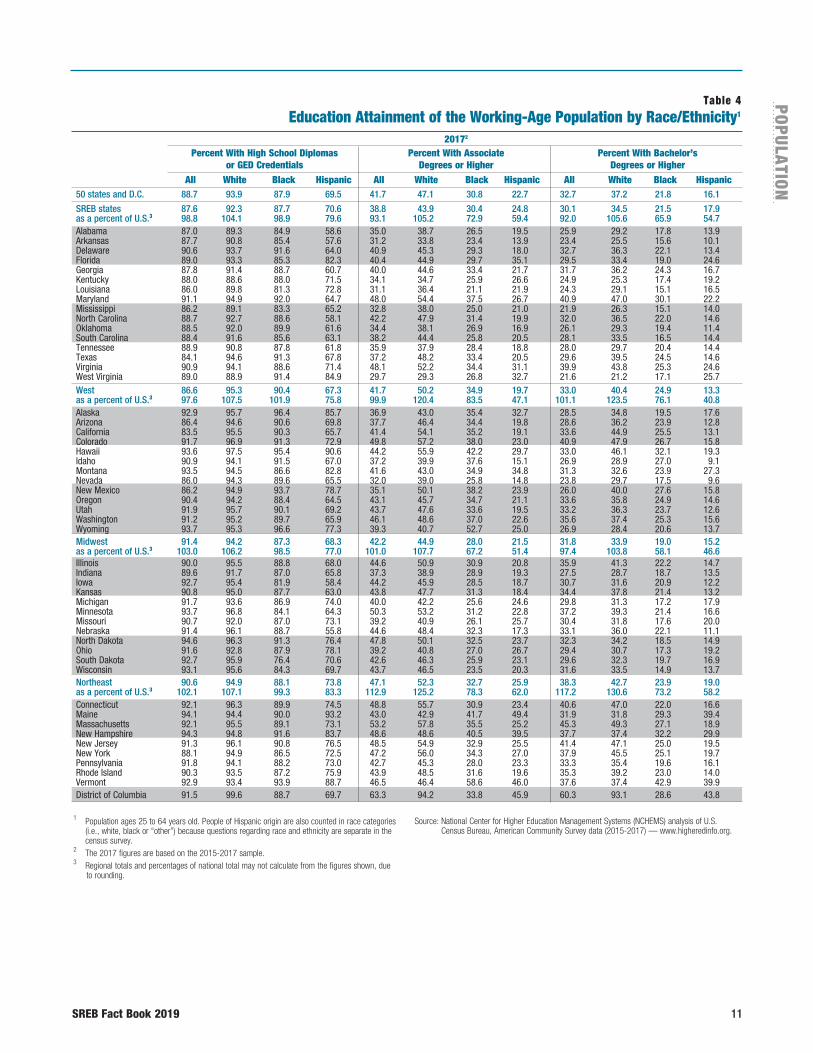
Attainment rates for white adults holding a bachelor’s degree or higher in both SREB states and the nation continue to exceed that of black and Hispanic adults by a wide margin. In 2017, 34 percent of white adults ages 25 and older in the SREB states had a bachelor’s degree or higher. About 21 percent of black and 18 percent of Hispanic adults held at least a bachelor’s degree. While white adults in SREB states attain bachelor’s degrees at a rate that is 2 percentage points lower than that of their peers nationwide, the rate for black adults is almost equal to the rate for their peers nationwide, and Hispanic adults in the region exceed the rate for their peers nationwide by 2 percentage points.
Percent of Racial and Ethnic Groups 25 Years and Older With a Bachelor’s Degree or Higher, SREB States
Source: SREB analysis of U.S. Census Bureau data.
18% 21%
15%
4%
3%
3% 18%
30% 34%White
Black
Hispanic
2012 2017
SREB Fact Book 2019 5
POPU
LATIO
N
In the SREB region, progress in attainment rates occurred for white, black and Hispanic adults from 2012 to 2017, but not at levels that would allow for black and Hispanic rates to reach that of white adults. The rate for white adults with at least a bachelor’s degree rose by 4 percentage points, and the rate for both black and Hispanic adults went up 3 percentage points. Other regions saw similar rates of increase.
The fact that the fastest-growing racial and ethnic groups continue to have lower education attainment levels poses a considerable challenge for the nation and the SREB region. The hope for having a well- educated populace in the future depends on creating accelerated improvement in the attainment levels of black, Hispanic and other fast-growing portions of the population.
Dependent population projected to outnumber working-age population
Children under age 5, students ages 5 through 24, and adults 65 and older represented 48 percent of the SREB region’s population in 2017. These groups are often referred to as the dependent portion of the population. By 2020, the dependent portion of the population is expected to almost equal the work-ing-age population — people between the ages of 25 and 64. Dependent representation is projected to reach 53 percent in the SREB region by 2030. It is at that time that working-age adults will no longer outnumber the dependent portion of the region’s population.
School enrollment in South and West regions projected for slight growth
Enrollment in public schools, pre-K through grade 12, grew by 2 percent nationwide and 8 percent in the SREB region from fall 2006 to fall 2016. Enrollment increased nearly 3 percent in the West but declined by nearly 3 percent in the Midwest and by almost 4 percent in the Northeast. Projections for the period from 2016 to 2026 show future enrollment rising 7 percent in the SREB region and 4 percent in the West. Further decreases of 3 percent in the Midwest and almost 5 percent in the Northeast are predicted.
In the 2016-17 school year, seven of the nation’s 10 states with the highest percentages of elementary and secondary students eligible for free or reduced-price lunches were in the SREB region. In that year, more than half (54 percent) of the SREB region’s school children were eligible for the lunch program. Lower proportions were eligible in the other regions. The percentages of school children eligible for the lunch program increased in nearly every SREB state from 2006-07 to 2016-17; seven states saw increases of more than 10 percentage points. One state whose proportion of qualifying children decreased was West Virginia — the percentage dropped by a moderate 5 percentage points over the ten-year period.
High school graduation rates increase incrementally
In the 2010-11 school year, states began using a standard, federal Adjusted Cohort Graduation Rate (ACGR) for calculating public high school graduation rates. The formula requires states to count the number of first-time ninth-graders who enter a high school and include them in a cohort that is followed for four years. During the years until graduation, students who transfer into the school are added to the cohort while those who transfer out, emigrate to another country, or die are subtracted from the cohort.
POPU
LATIO
N
6 SREB Fact Book 2019
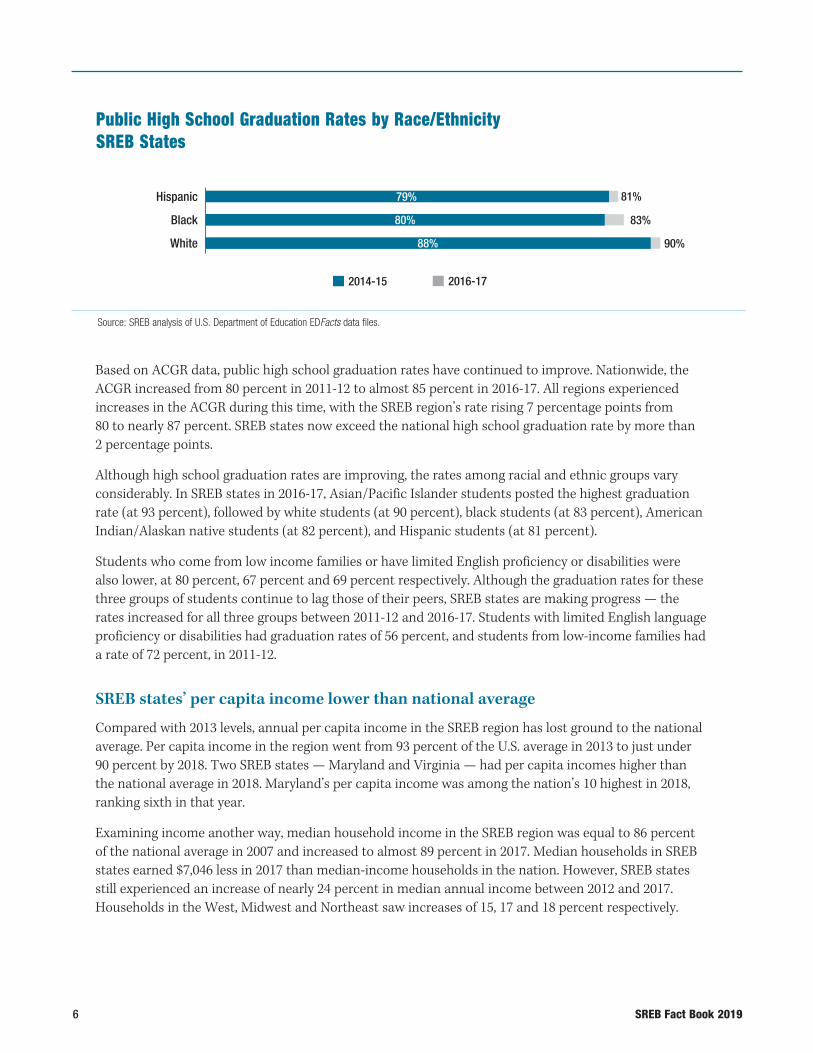
Based on ACGR data, public high school graduation rates have continued to improve. Nationwide, the ACGR increased from 80 percent in 2011-12 to almost 85 percent in 2016-17. All regions experienced increases in the ACGR during this time, with the SREB region’s rate rising 7 percentage points from 80 to nearly 87 percent. SREB states now exceed the national high school graduation rate by more than 2 percentage points.
Although high school graduation rates are improving, the rates among racial and ethnic groups vary considerably. In SREB states in 2016-17, Asian/Pacific Islander students posted the highest graduation rate (at 93 percent), followed by white students (at 90 percent), black students (at 83 percent), American Indian/Alaskan native students (at 82 percent), and Hispanic students (at 81 percent).
Students who come from low income families or have limited English proficiency or disabilities were also lower, at 80 percent, 67 percent and 69 percent respectively. Although the graduation rates for these three groups of students continue to lag those of their peers, SREB states are making progress — the rates increased for all three groups between 2011-12 and 2016-17. Students with limited English language proficiency or disabilities had graduation rates of 56 percent, and students from low-income families had a rate of 72 percent, in 2011-12.
SREB states’ per capita income lower than national average
Compared with 2013 levels, annual per capita income in the SREB region has lost ground to the national average. Per capita income in the region went from 93 percent of the U.S. average in 2013 to just under 90 percent by 2018. Two SREB states — Maryland and Virginia — had per capita incomes higher than the national average in 2018. Maryland’s per capita income was among the nation’s 10 highest in 2018, ranking sixth in that year.
Examining income another way, median household income in the SREB region was equal to 86 percent of the national average in 2007 and increased to almost 89 percent in 2017. Median households in SREB states earned $7,046 less in 2017 than median-income households in the nation. However, SREB states still experienced an increase of nearly 24 percent in median annual income between 2012 and 2017. Households in the West, Midwest and Northeast saw increases of 15, 17 and 18 percent respectively.
Public High School Graduation Rates by Race/Ethnicity SREB States
Source: SREB analysis of U.S. Department of Education EDFacts data files.
80% 83%
88% 90%
79% 81%Hispanic
Black
White
2014-15 2016-17

SREB Fact Book 2019 7
POPU
LATIO
N
Poverty rate highest in SREB region, but number of children living in poverty dropped
In 2017, the poverty level for a family of four in the U.S. was defined as annual income at or below $24,600. The poverty rate was 15 percent in the SREB region, compared with 13 percent nationwide.
Poverty rates were higher among families with children. On average, 21 percent of children under age 18 in SREB states lived in poverty in 2017, compared with 18 percent nationwide. That means over 6 million children lived in poverty in the region, with 13 SREB states home to more than one in five children living in poverty. Fifteen percent of children lived in families with incomes below the poverty line in the West (over 2.6 million children) and nearly 16 percent of children lived in families with incomes below the poverty line in the Midwest (more than 2.4 million). The Northeast had the lowest poverty rate for children under 18, at 14 percent (over 1.6 million). From 2012 to 2017, the number of children in poverty in the SREB region decreased by more than 1.1 million. All other regions also saw decreases.
Unemployment rates drop across the nation
From 2013 to 2018, employment in the SREB region rose by 9 percent, or more than 4.6 million workers. Over the same period, it rose 11 percent in the West, over 5 percent in the Midwest and more than 4 percent in the Northeast, while nationwide it increased 8 percent.
As the nation’s economy improved, the unemployment rate dropped dramatically from over 7 percent in 2013 to 4 percent in 2018. In the SREB region, the unemployment rate went down from 7 percent to 4 percent during this period. In the West, it was halved, dropping from 8 percent to 4 percent. In the Midwest, it dropped from 7 percent to 4 percent, and in the Northeast it fell from almost 8 percent to 4 percent.
Employment in all major economic sectors in the SREB region increased between 2013 and 2018. Some sectors saw increases of more than 10 percent during the period. Employment in the mining, logging and construction sector increased by almost 16 percent. The financial, professional and business services and leisure, hospitality and related services sectors grew by nearly 14 percent. Jobs in education and health ser-vices increased by 12 percent. Manufacturing, as well as trade, transportation and utilities, grew by over 6 percent. The government and information job sectors were the slowest to grow, at rates of nearly 3 percent and 1 percent, respectively.
POPU
LATIO
N

8 SREB Fact Book 2019
Table 1Total Population and Changes
Resident Population Percent Change Number National Rank Actual Projected (in thousands) Actual Projected 1998 to 2008 to 2018 to 2018 1998 2008 2018 2028 2008 2018 2028
50 states and D.C. 327,167 12.5 7.6 9.4
SREB states 124,051 17.6 11.7 12.5as a percent of U.S. 37.9 Alabama 4,888 23 23 24 24 8.4 3.6 -0.9Arkansas 3,014 33 32 33 32 13.3 4.8 6.3Delaware 967 45 45 45 45 18.8 9.4 3.8Florida 21,299 4 4 3 3 24.3 15.0 29.3Georgia 10,519 10 9 8 8 24.5 10.7 12.1Kentucky 4,468 25 26 26 27 9.0 4.2 1.3Louisiana 4,660 22 25 25 25 1.7 5.1 2.7Maryland 6,043 19 19 19 17 10.8 6.3 14.5Mississippi 2,987 31 31 34 33 7.1 1.3 3.2North Carolina 10,384 11 10 9 7 23.4 11.5 14.7Oklahoma 3,943 27 28 28 29 9.9 7.5 -1.7South Carolina 5,084 26 24 23 23 18.0 12.3 0.0Tennessee 6,770 17 17 16 15 15.0 8.4 7.2Texas 28,702 2 2 2 2 23.3 18.1 12.6Virginia 8,518 12 12 12 13 15.4 8.7 13.2West Virginia 1,806 35 37 38 39 1.6 -1.9 -3.6West 77,994 17.0 10.6 15.4as a percent of U.S. 23.8 Alaska 737 48 47 48 46 11.7 7.3 15.2Arizona 7,172 21 16 14 11 34.6 14.2 42.6California 39,557 1 1 1 1 12.0 8.1 15.2Colorado 5,696 24 22 21 22 23.2 16.5 -0.3Hawaii 1,420 41 40 40 41 11.9 6.6 2.4Idaho 1,754 40 39 39 37 24.6 14.3 9.6Montana 1,062 44 44 43 44 11.0 8.8 -1.9Nevada 3,034 36 35 32 28 52.2 14.3 35.6New Mexico 2,095 37 36 36 36 16.0 4.2 0.5Oregon 4,191 28 27 27 26 14.8 11.2 12.5Utah 3,161 34 34 30 31 26.8 18.7 6.9Washington 7,536 15 13 13 14 15.4 14.8 11.1Wyoming 578 50 50 50 50 13.7 5.8 -9.0Midwest 68,309 5.7 2.7 2.9as a percent of U.S. 20.9 Illinois 12,741 5 5 6 5 5.6 0.0 5.1Indiana 6,692 14 15 17 18 8.8 4.2 1.2Iowa 3,156 30 30 31 34 5.4 4.6 -5.9Kansas 2,912 32 33 35 35 6.4 3.7 0.7Michigan 9,996 8 8 10 10 1.3 0.5 7.1Minnesota 5,611 20 21 22 20 11.0 6.9 11.0Missouri 6,126 16 18 18 19 8.9 3.4 4.2Nebraska 1,929 38 38 37 38 8.2 7.4 -5.8North Dakota 760 47 48 47 49 3.1 15.6 -19.4Ohio 11,689 7 7 7 9 2.5 1.5 -1.0South Dakota 882 46 46 46 47 9.4 10.4 -9.2Wisconsin 5,814 18 20 20 21 8.0 3.1 5.4Northeast 56,111 6.2 2.3 2.7as a percent of U.S. 17.2 Connecticut 3,573 29 29 29 30 8.3 0.8 3.3Maine 1,338 39 41 42 42 6.6 0.6 5.6Massachusetts 6,902 13 14 15 16 5.3 6.7 1.2New Hampshire 1,356 42 42 41 40 11.0 3.1 19.6New Jersey 8,909 9 11 11 12 7.6 2.3 9.3New York 19,542 3 3 4 4 5.8 1.7 -0.2Pennsylvania 12,807 6 6 5 6 5.1 1.5 -0.2Rhode Island 1,057 43 43 44 43 6.8 0.2 9.3Vermont 626 49 49 49 48 5.7 0.3 13.2District of Columbia 702 11.3 21.1 -37.2
Sources: U.S. Census Bureau: ST-99-3 State Population Estimates: Annual Time Series, July 1, 1990 to July 1, 1999 (1999); Table 1. Annual Estimates of the Resident Population for the United States, Regions, States, and Puerto Rico, April 1, 2010 to July 1, 2018 (NST-EST2018-01) (2018); and Interim State Projections of Population by Single Year of Age, July 1, 2004 to 2030 (2005) — www.census.gov.
SREB Fact Book 2019 9
POPU
LATIO
N
POPU
LATIO
N
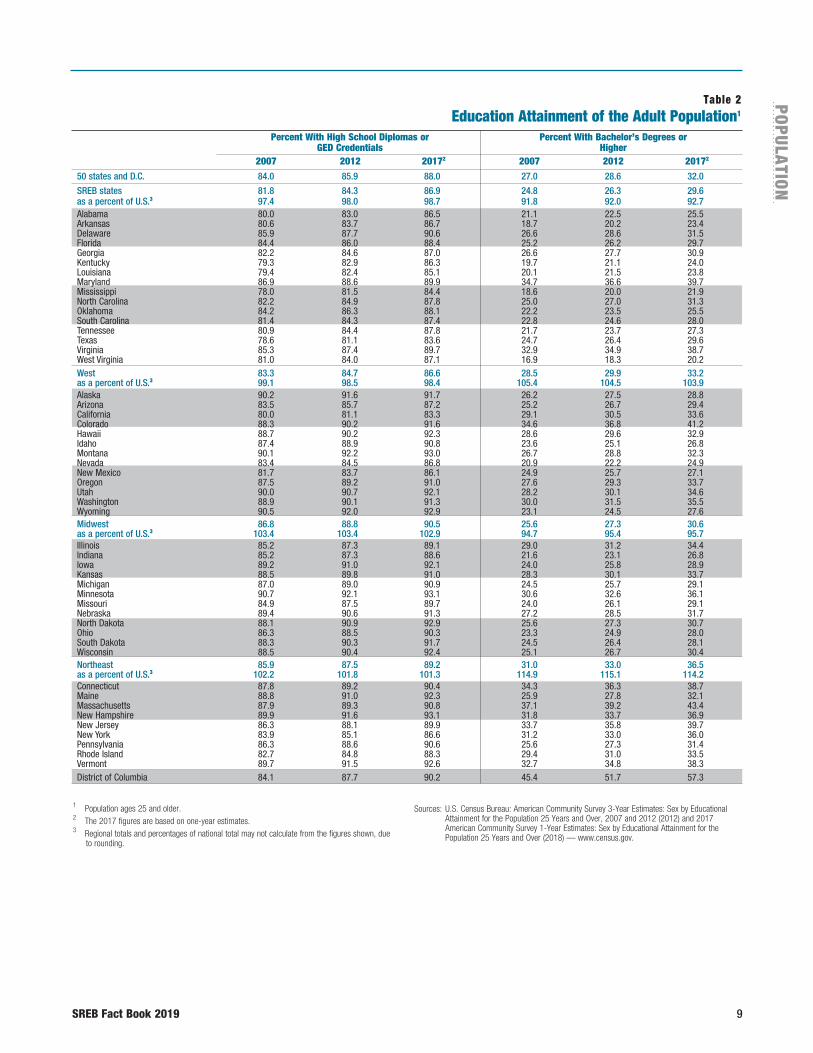
Table 2Education Attainment of the Adult Population1
Percent With High School Diplomas or Percent With Bachelor’s Degrees or GED Credentials Higher 2007 2012 20172 2007 2012 20172
50 states and D.C. 84.0 85.9 88.0 27.0 28.6 32.0
SREB states 81.8 84.3 86.9 24.8 26.3 29.6as a percent of U.S.3 97.4 98.0 98.7 91.8 92.0 92.7Alabama 80.0 83.0 86.5 21.1 22.5 25.5Arkansas 80.6 83.7 86.7 18.7 20.2 23.4Delaware 85.9 87.7 90.6 26.6 28.6 31.5Florida 84.4 86.0 88.4 25.2 26.2 29.7Georgia 82.2 84.6 87.0 26.6 27.7 30.9Kentucky 79.3 82.9 86.3 19.7 21.1 24.0Louisiana 79.4 82.4 85.1 20.1 21.5 23.8Maryland 86.9 88.6 89.9 34.7 36.6 39.7Mississippi 78.0 81.5 84.4 18.6 20.0 21.9North Carolina 82.2 84.9 87.8 25.0 27.0 31.3Oklahoma 84.2 86.3 88.1 22.2 23.5 25.5South Carolina 81.4 84.3 87.4 22.8 24.6 28.0Tennessee 80.9 84.4 87.8 21.7 23.7 27.3Texas 78.6 81.1 83.6 24.7 26.4 29.6Virginia 85.3 87.4 89.7 32.9 34.9 38.7West Virginia 81.0 84.0 87.1 16.9 18.3 20.2West 83.3 84.7 86.6 28.5 29.9 33.2as a percent of U.S.3 99.1 98.5 98.4 105.4 104.5 103.9Alaska 90.2 91.6 91.7 26.2 27.5 28.8Arizona 83.5 85.7 87.2 25.2 26.7 29.4California 80.0 81.1 83.3 29.1 30.5 33.6Colorado 88.3 90.2 91.6 34.6 36.8 41.2Hawaii 88.7 90.2 92.3 28.6 29.6 32.9Idaho 87.4 88.9 90.8 23.6 25.1 26.8Montana 90.1 92.2 93.0 26.7 28.8 32.3Nevada 83.4 84.5 86.8 20.9 22.2 24.9New Mexico 81.7 83.7 86.1 24.9 25.7 27.1Oregon 87.5 89.2 91.0 27.6 29.3 33.7Utah 90.0 90.7 92.1 28.2 30.1 34.6Washington 88.9 90.1 91.3 30.0 31.5 35.5Wyoming 90.5 92.0 92.9 23.1 24.5 27.6Midwest 86.8 88.8 90.5 25.6 27.3 30.6as a percent of U.S.3 103.4 103.4 102.9 94.7 95.4 95.7Illinois 85.2 87.3 89.1 29.0 31.2 34.4Indiana 85.2 87.3 88.6 21.6 23.1 26.8Iowa 89.2 91.0 92.1 24.0 25.8 28.9Kansas 88.5 89.8 91.0 28.3 30.1 33.7Michigan 87.0 89.0 90.9 24.5 25.7 29.1Minnesota 90.7 92.1 93.1 30.6 32.6 36.1Missouri 84.9 87.5 89.7 24.0 26.1 29.1Nebraska 89.4 90.6 91.3 27.2 28.5 31.7North Dakota 88.1 90.9 92.9 25.6 27.3 30.7Ohio 86.3 88.5 90.3 23.3 24.9 28.0South Dakota 88.3 90.3 91.7 24.5 26.4 28.1Wisconsin 88.5 90.4 92.4 25.1 26.7 30.4Northeast 85.9 87.5 89.2 31.0 33.0 36.5as a percent of U.S.3 102.2 101.8 101.3 114.9 115.1 114.2Connecticut 87.8 89.2 90.4 34.3 36.3 38.7Maine 88.8 91.0 92.3 25.9 27.8 32.1Massachusetts 87.9 89.3 90.8 37.1 39.2 43.4New Hampshire 89.9 91.6 93.1 31.8 33.7 36.9New Jersey 86.3 88.1 89.9 33.7 35.8 39.7New York 83.9 85.1 86.6 31.2 33.0 36.0Pennsylvania 86.3 88.6 90.6 25.6 27.3 31.4Rhode Island 82.7 84.8 88.3 29.4 31.0 33.5Vermont 89.7 91.5 92.6 32.7 34.8 38.3District of Columbia 84.1 87.7 90.2 45.4 51.7 57.3
1 Population ages 25 and older.2 The 2017 figures are based on one-year estimates.3 Regional totals and percentages of national total may not calculate from the figures shown, due
to rounding.
Sources: U.S. Census Bureau: American Community Survey 3-Year Estimates: Sex by Educational Attainment for the Population 25 Years and Over, 2007 and 2012 (2012) and 2017 American Community Survey 1-Year Estimates: Sex by Educational Attainment for the Population 25 Years and Over (2018) — www.census.gov.
10 SREB Fact Book 2019
Table 3Education Attainment of Working-Age and Young Working-Age Adults*
Young Working-Age Adults 25 to 44 Percent of Working-Age Without High School Diplomas Adults 25 to 64 or GED Credentials Without Associate Degrees Without Bachelor’s Degrees With Associate Degree (in thousands) (in thousands) (in thousands) or Higher Percent of Total Percent of Total Percent of Total 2012 2017 2012 2017 2012 2017 2012 2017 2012 2017 2012 2017 2012 2017
50 states and D.C. 38.9 41.7 9,912 8,844 12.0 10.3 48,636 47,423 58.7 55.1 55,981 55,325 67.6 64.3
SREB states 35.7 38.8 4,035 3,668 13.1 FALSE 19,238 18,975 62.3 58.7 21,855 21,934 70.8 67.8as a percent of U.S.1 91.8 40.7 41.5 39.6 40.0 39.0 39.6 Alabama 32.4 35.0 159 144 13.0 11.7 798 770 65.1 62.9 904 891 73.8 72.7Arkansas 28.9 31.2 94 81 12.5 10.7 515 485 68.9 64.4 571 551 76.3 73.1Delaware 37.6 40.9 24 24 10.6 9.8 135 145 59.7 59.9 152 165 67.4 68.2Florida 37.2 40.4 565 537 11.8 10.2 2,910 2,990 60.7 57.0 3,444 3,607 71.9 68.8Georgia 36.7 40.0 367 330 13.4 11.8 1,695 1,632 61.8 58.2 1,909 1,869 69.6 66.6Kentucky 30.6 34.1 125 106 11.1 9.4 740 702 65.5 62.1 840 812 74.4 71.9Louisiana 28.6 31.1 175 159 14.5 12.8 824 819 68.1 65.9 910 908 75.2 73.1Maryland 45.3 48.0 149 150 9.4 9.3 826 799 52.4 49.6 935 913 59.3 56.7Mississippi 30.4 32.8 101 98 13.5 13.2 502 476 67.0 64.2 581 568 77.5 76.7North Carolina 38.0 42.2 346 290 13.4 10.9 1,557 1,458 60.3 54.9 1,796 1,722 69.5 64.8Oklahoma 32.7 34.4 120 113 12.2 11.0 648 658 65.8 64.2 735 750 74.6 73.1South Carolina 34.9 38.2 146 142 12.2 11.2 751 759 62.6 59.9 872 890 72.7 70.2Tennessee 32.5 35.9 188 157 11.1 9.0 1,093 1,048 64.6 60.0 1,216 1,190 71.9 68.1Texas 34.2 37.2 1,235 1,122 16.9 14.1 4,754 4,834 65.0 60.8 5,288 5,470 72.3 68.8Virginia 44.8 48.1 195 179 8.7 7.9 1,178 1,111 52.6 48.9 1,355 1,303 60.4 57.3West Virginia 27.1 29.7 47 37 10.4 8.6 311 288 69.3 67.2 347 327 77.3 76.1West 39.4 41.7 2,903 2,489 14.4 11.5 12,106 12,071 59.9 55.9 13,842 13,929 68.5 64.5as a percent of U.S.1 101.2 29.3 28.1 24.9 25.5 24.7 25.2 Alaska 36.9 36.9 15 17 7.1 7.7 130 135 63.6 62.6 149 156 72.9 72.5Arizona 35.9 37.7 248 228 14.5 12.6 1,079 1,101 63.2 60.7 1,237 1,268 72.5 70.0California 39.2 41.4 1,840 1,504 17.3 13.4 6,387 6,293 60.0 55.9 7,208 7,159 67.7 63.6Colorado 46.9 49.8 146 139 10.0 8.5 768 791 52.4 48.6 896 925 61.1 56.8Hawaii 42.1 44.2 23 17 6.2 4.4 217 209 57.9 53.9 260 257 69.5 66.3Idaho 35.8 37.2 38 36 9.2 8.2 258 269 63.4 61.4 302 314 74.3 71.8Montana 40.1 41.6 16 18 6.6 7.1 139 142 58.2 55.1 162 170 67.9 66.1Nevada 30.0 32.0 123 106 15.8 12.7 543 556 70.1 66.5 602 630 77.7 75.3New Mexico 33.9 35.1 75 65 14.3 12.4 346 345 66.1 65.8 398 395 76.1 75.4Oregon 39.1 43.1 110 106 10.6 9.4 609 604 58.6 53.6 697 705 67.2 62.5Utah 40.7 43.7 73 64 9.1 7.3 464 469 57.9 53.4 550 559 68.6 63.7Washington 43.0 46.1 187 177 9.9 8.5 1,071 1,067 56.8 51.3 1,267 1,283 67.2 61.6Wyoming 37.3 39.3 11 11 7.4 7.2 95 89 63.5 59.2 112 107 75.2 71.3Midwest 39.1 42.2 1,566 1,426 9.2 8.2 9,736 9,258 57.0 53.6 11,492 11,095 67.3 64.2as a percent of U.S.1 100.4 15.8 16.1 20.0 19.5 20.5 20.1 Illinois 41.9 44.6 361 304 10.4 8.9 1,895 1,755 54.4 51.4 2,184 2,048 62.7 60.0Indiana 33.8 37.3 182 181 11.0 10.7 1,028 983 62.2 58.3 1,196 1,160 72.3 68.8Iowa 41.2 44.2 53 57 7.0 7.4 394 388 52.5 50.5 505 497 67.3 64.8Kansas 40.9 43.8 72 67 9.8 9.0 411 385 56.4 52.1 483 466 66.3 63.1Michigan 37.0 40.0 227 196 9.5 8.1 1,443 1,367 60.2 56.4 1,677 1,612 69.9 66.5Minnesota 46.7 50.3 95 95 6.7 6.5 678 660 48.1 45.2 862 851 61.2 58.3Missouri 36.0 39.2 150 133 9.8 8.6 914 873 60.0 56.6 1,048 1,021 68.9 66.1Nebraska 42.6 44.6 46 44 9.8 8.8 253 250 53.5 50.5 310 310 65.6 62.7North Dakota 46.1 47.8 7 8 4.2 4.2 87 95 49.2 46.6 113 125 64.3 61.2Ohio 36.0 39.2 248 232 8.7 8.0 1,717 1,649 60.0 56.7 1,998 1,942 69.9 66.8South Dakota 40.5 42.6 15 17 7.4 7.9 117 120 57.2 55.4 143 150 70.0 69.2Wisconsin 39.9 43.7 110 92 7.7 6.4 802 732 56.0 51.4 974 913 68.0 64.1Northeast 44.3 47.1 1,391 1,245 9.7 8.5 7,481 7,042 51.9 48.2 8,711 8,284 60.5 56.7as a percent of U.S.1 113.9 14.0 14.1 15.4 14.9 15.6 15.0 Connecticut 46.6 48.8 69 69 7.8 8.0 457 423 51.3 48.8 523 492 58.7 56.8Maine 39.9 43.0 18 16 5.9 5.3 189 166 61.2 53.7 221 201 71.7 64.9Massachusetts 50.6 53.2 130 129 7.5 7.1 802 776 46.0 42.9 931 898 53.4 49.7New Hampshire 46.4 48.6 20 18 6.4 5.7 164 154 51.8 48.8 196 186 62.0 59.1New Jersey 45.5 48.5 220 179 9.5 7.7 1,193 1,084 51.3 46.7 1,348 1,247 57.9 53.7New York 44.7 47.2 641 569 12.1 10.5 2,712 2,574 51.2 47.7 3,193 3,065 60.3 56.8Pennsylvania 39.1 42.7 257 235 8.2 7.4 1,744 1,647 55.8 51.9 2,044 1,944 65.4 61.3Rhode Island 42.2 43.9 26 20 10.1 7.5 143 146 55.4 54.2 166 167 64.0 61.9Vermont 46.1 46.5 9 10 6.4 6.8 75 73 52.3 50.8 88 84 61.5 58.9District of Columbia 58.1 63.3 17 17 7.5 6.5 75 76 33.3 28.8 81 83 35.9 31.6
“*” “Working-age” adults are ages 25 through 64. “Young working-age” adults are ages 25 through 44.1 Regional totals and percentages of national total may not calculate from the figures shown, due
to rounding.
Source: National Center for Higher Education Management Systems (NCHEMS) analysis of U.S. Census Bureau, 2015-17 American Community Survey (ACS) Public Use Microdata Sample (PUMS) File.
SREB Fact Book 2019 11
POPU
LATIO
N
Table 4Education Attainment of the Working-Age Population by Race/Ethnicity1
20172 Percent With High School Diplomas Percent With Associate Percent With Bachelor’s or GED Credentials Degrees or Higher Degrees or Higher All White Black Hispanic All White Black Hispanic All White Black Hispanic
50 states and D.C. 88.7 93.9 87.9 69.5 41.7 47.1 30.8 22.7 32.7 37.2 21.8 16.1
SREB states 87.6 92.3 87.7 70.6 38.8 43.9 30.4 24.8 30.1 34.5 21.5 17.9as a percent of U.S.3 98.8 104.1 98.9 79.6 93.1 105.2 72.9 59.4 92.0 105.6 65.9 54.7Alabama 87.0 89.3 84.9 58.6 35.0 38.7 26.5 19.5 25.9 29.2 17.8 13.9Arkansas 87.7 90.8 85.4 57.6 31.2 33.8 23.4 13.9 23.4 25.5 15.6 10.1Delaware 90.6 93.7 91.6 64.0 40.9 45.3 29.3 18.0 32.7 36.3 22.1 13.4Florida 89.0 93.3 85.3 82.3 40.4 44.9 29.7 35.1 29.5 33.4 19.0 24.6Georgia 87.8 91.4 88.7 60.7 40.0 44.6 33.4 21.7 31.7 36.2 24.3 16.7Kentucky 88.0 88.6 88.0 71.5 34.1 34.7 25.9 26.6 24.9 25.3 17.4 19.2Louisiana 86.0 89.8 81.3 72.8 31.1 36.4 21.1 21.9 24.3 29.1 15.1 16.5Maryland 91.1 94.9 92.0 64.7 48.0 54.4 37.5 26.7 40.9 47.0 30.1 22.2Mississippi 86.2 89.1 83.3 65.2 32.8 38.0 25.0 21.0 21.9 26.3 15.1 14.0North Carolina 88.7 92.7 88.6 58.1 42.2 47.9 31.4 19.9 32.0 36.5 22.0 14.6Oklahoma 88.5 92.0 89.9 61.6 34.4 38.1 26.9 16.9 26.1 29.3 19.4 11.4South Carolina 88.4 91.6 85.6 63.1 38.2 44.4 25.8 20.5 28.1 33.5 16.5 14.4Tennessee 88.9 90.8 87.8 61.8 35.9 37.9 28.4 18.8 28.0 29.7 20.4 14.4Texas 84.1 94.6 91.3 67.8 37.2 48.2 33.4 20.5 29.6 39.5 24.5 14.6Virginia 90.9 94.1 88.6 71.4 48.1 52.2 34.4 31.1 39.9 43.8 25.3 24.6West Virginia 89.0 88.9 91.4 84.9 29.7 29.3 26.8 32.7 21.6 21.2 17.1 25.7West 86.6 95.3 90.4 67.3 41.7 50.2 34.9 19.7 33.0 40.4 24.9 13.3as a percent of U.S.3 97.6 107.5 101.9 75.8 99.9 120.4 83.5 47.1 101.1 123.5 76.1 40.8Alaska 92.9 95.7 96.4 85.7 36.9 43.0 35.4 32.7 28.5 34.8 19.5 17.6Arizona 86.4 94.6 90.6 69.8 37.7 46.4 34.4 19.8 28.6 36.2 23.9 12.8California 83.5 95.5 90.3 65.7 41.4 54.1 35.2 19.1 33.6 44.9 25.5 13.1Colorado 91.7 96.9 91.3 72.9 49.8 57.2 38.0 23.0 40.9 47.9 26.7 15.8Hawaii 93.6 97.5 95.4 90.6 44.2 55.9 42.2 29.7 33.0 46.1 32.1 19.3Idaho 90.9 94.1 91.5 67.0 37.2 39.9 37.6 15.1 26.9 28.9 27.0 9.1Montana 93.5 94.5 86.6 82.8 41.6 43.0 34.9 34.8 31.3 32.6 23.9 27.3Nevada 86.0 94.3 89.6 65.5 32.0 39.0 25.8 14.8 23.8 29.7 17.5 9.6New Mexico 86.2 94.9 93.7 78.7 35.1 50.1 38.2 23.9 26.0 40.0 27.6 15.8Oregon 90.4 94.2 88.4 64.5 43.1 45.7 34.7 21.1 33.6 35.8 24.9 14.6Utah 91.9 95.7 90.1 69.2 43.7 47.6 33.6 19.5 33.2 36.3 23.7 12.6Washington 91.2 95.2 89.7 65.9 46.1 48.6 37.0 22.6 35.6 37.4 25.3 15.6Wyoming 93.7 95.3 96.6 77.3 39.3 40.7 52.7 25.0 26.9 28.4 20.6 13.7Midwest 91.4 94.2 87.3 68.3 42.2 44.9 28.0 21.5 31.8 33.9 19.0 15.2as a percent of U.S.3 103.0 106.2 98.5 77.0 101.0 107.7 67.2 51.4 97.4 103.8 58.1 46.6Illinois 90.0 95.5 88.8 68.0 44.6 50.9 30.9 20.8 35.9 41.3 22.2 14.7Indiana 89.6 91.7 87.0 65.8 37.3 38.9 28.9 19.3 27.5 28.7 18.7 13.5Iowa 92.7 95.4 81.9 58.4 44.2 45.9 28.5 18.7 30.7 31.6 20.9 12.2Kansas 90.8 95.0 87.7 63.0 43.8 47.7 31.3 18.4 34.4 37.8 21.4 13.2Michigan 91.7 93.6 86.9 74.0 40.0 42.2 25.6 24.6 29.8 31.3 17.2 17.9Minnesota 93.7 96.8 84.1 64.3 50.3 53.2 31.2 22.8 37.2 39.3 21.4 16.6Missouri 90.7 92.0 87.0 73.1 39.2 40.9 26.1 25.7 30.4 31.8 17.6 20.0Nebraska 91.4 96.1 88.7 55.8 44.6 48.4 32.3 17.3 33.1 36.0 22.1 11.1North Dakota 94.6 96.3 91.3 76.4 47.8 50.1 32.5 23.7 32.3 34.2 18.5 14.9Ohio 91.6 92.8 87.9 78.1 39.2 40.8 27.0 26.7 29.4 30.7 17.3 19.2South Dakota 92.7 95.9 76.4 70.6 42.6 46.3 25.9 23.1 29.6 32.3 19.7 16.9Wisconsin 93.1 95.6 84.3 69.7 43.7 46.5 23.5 20.3 31.6 33.5 14.9 13.7Northeast 90.6 94.9 88.1 73.8 47.1 52.3 32.7 25.9 38.3 42.7 23.9 19.0as a percent of U.S.3 102.1 107.1 99.3 83.3 112.9 125.2 78.3 62.0 117.2 130.6 73.2 58.2Connecticut 92.1 96.3 89.9 74.5 48.8 55.7 30.9 23.4 40.6 47.0 22.0 16.6Maine 94.1 94.4 90.0 93.2 43.0 42.9 41.7 49.4 31.9 31.8 29.3 39.4Massachusetts 92.1 95.5 89.1 73.1 53.2 57.8 35.5 25.2 45.3 49.3 27.1 18.9New Hampshire 94.3 94.8 91.6 83.7 48.6 48.6 40.5 39.5 37.7 37.4 32.2 29.9New Jersey 91.3 96.1 90.8 76.5 48.5 54.9 32.9 25.5 41.4 47.1 25.0 19.5New York 88.1 94.9 86.5 72.5 47.2 56.0 34.3 27.0 37.9 45.5 25.1 19.7Pennsylvania 91.8 94.1 88.2 73.0 42.7 45.3 28.0 23.3 33.3 35.4 19.6 16.1Rhode Island 90.3 93.5 87.2 75.9 43.9 48.5 31.6 19.6 35.3 39.2 23.0 14.0Vermont 92.9 93.4 93.9 88.7 46.5 46.4 58.6 46.0 37.6 37.4 42.9 39.9District of Columbia 91.5 99.6 88.7 69.7 63.3 94.2 33.8 45.9 60.3 93.1 28.6 43.8
1 Population ages 25 to 64 years old. People of Hispanic origin are also counted in race categories (i.e., white, black or “other”) because questions regarding race and ethnicity are separate in the census survey.
2 The 2017 figures are based on the 2015-2017 sample.3 Regional totals and percentages of national total may not calculate from the figures shown, due
to rounding.
Source: National Center for Higher Education Management Systems (NCHEMS) analysis of U.S. Census Bureau, American Community Survey data (2015-2017) — www.higheredinfo.org.
12 SREB Fact Book 2019
Table 5Racial and Ethnic Composition of the Population
2017 (in thousands) Percent Change 2007 to 2017 Two or Two or More More White Black Hispanic Races All Other1 White Black Hispanic Races All Other1
50 states and D.C.2 197,803 40,652 58,947 6,938 21,379 -0.6 10.4 29.6 60.8 36.7
SREB states 70,148 23,298 22,047 2,283 5,190 2.1 13.9 39.1 72.5 51.7as a percent of U.S.2 35.5 57.3 37.4 32.9 24.3 Alabama 3,197 1,293 211 74 100 0.5 7.0 66.8 63.2 50.4Arkansas 2,178 464 228 56 79 1.2 5.6 50.8 53.2 51.2Delaware 599 209 90 22 42 1.0 19.7 58.5 99.6 57.5Florida 11,344 3,269 5,371 343 656 2.3 20.4 43.9 65.4 44.7Georgia 5,507 3,268 1,006 188 461 -1.4 16.5 36.5 75.2 59.1Kentucky 3,769 362 163 79 80 1.2 13.5 68.9 82.5 57.4Louisiana 2,748 1,506 245 69 117 0.8 9.5 73.1 66.7 33.4Maryland 3,078 1,798 614 144 418 -5.9 11.4 70.8 76.2 42.7Mississippi 1,692 1,116 94 34 48 -1.8 3.8 51.6 47.0 30.1North Carolina 6,486 2,196 972 194 425 6.0 14.5 52.5 99.8 55.8Oklahoma 2,582 292 418 218 421 -0.2 5.4 56.4 58.2 24.3South Carolina 3,203 1,347 286 84 105 11.3 8.1 67.7 99.1 54.5Tennessee 4,964 1,127 367 115 144 4.5 10.8 67.5 80.6 47.6Texas 11,886 3,368 11,157 411 1,482 3.9 24.5 30.3 65.5 67.5Virginia 5,241 1,619 795 221 593 1.1 8.2 56.4 84.4 53.1West Virginia 1,675 63 29 30 19 -1.2 0.8 47.5 79.1 19.6West 38,856 3,528 23,201 2,369 9,456 0.8 9.2 20.9 51.2 28.8as a percent of U.S.2 19.6 8.7 39.4 34.2 44.2 Alaska 450 25 52 49 164 0.0 -5.5 29.3 67.7 20.8Arizona 3,849 301 2,202 141 523 2.6 38.7 17.2 62.4 24.7California 14,697 2,224 15,477 1,079 6,060 -5.7 0.4 17.7 45.1 29.2Colorado 3,828 224 1,207 126 222 10.7 22.0 25.2 65.6 36.7Hawaii 312 28 150 277 660 -1.2 -17.1 36.9 34.2 8.0Idaho 1,408 12 215 34 47 10.0 22.6 45.2 60.2 27.4Montana 906 6 40 26 74 7.5 4.3 43.3 72.4 11.8Nevada 1,471 267 865 100 296 -0.6 44.0 34.7 72.1 56.5New Mexico 783 38 1,018 31 217 -5.6 -8.6 16.5 30.7 11.0Oregon 3,140 79 541 133 250 4.4 22.8 36.2 60.3 35.8Utah 2,435 34 434 64 135 10.9 31.6 40.4 66.3 35.3Washington 5,091 284 941 298 792 3.8 30.1 53.3 67.6 47.4Wyoming 487 7 58 10 18 6.6 19.3 48.9 49.0 15.2Midwest 51,644 7,115 5,390 1,324 2,707 -2.0 5.7 30.7 63.6 38.2as a percent of U.S.2 26.1 17.5 9.1 19.1 12.7 Illinois 7,850 1,804 2,209 203 736 -6.0 -3.4 15.8 50.8 30.8Indiana 5,280 627 466 121 172 -0.2 12.4 46.7 75.0 72.7Iowa 2,696 115 190 52 93 -0.2 55.0 56.9 76.2 65.5Kansas 2,210 168 347 74 113 -1.4 4.8 41.3 65.6 34.3Michigan 7,488 1,376 505 217 375 -4.0 -2.5 24.2 52.7 30.3Minnesota 4,456 353 301 124 343 0.3 57.8 44.7 71.7 44.4Missouri 4,859 710 259 127 158 0.4 6.5 42.8 61.7 40.2Nebraska 1,517 91 211 35 65 1.5 22.5 56.3 77.1 46.5North Dakota 639 23 28 15 51 11.5 266.8 124.5 114.3 30.6Ohio 9,220 1,463 441 241 295 -2.8 8.1 51.1 70.6 46.0South Dakota 715 18 33 18 86 4.2 117.0 64.4 77.7 21.1Wisconsin 4,714 368 399 96 219 -1.3 12.1 45.0 61.4 36.2Northeast 36,900 6,395 8,233 947 3,995 -5.2 5.2 31.6 56.2 38.1as a percent of U.S.2 18.7 15.7 14.0 13.7 18.7 Connecticut 2,405 364 579 62 178 -7.3 12.5 42.8 51.2 42.6Maine 1,246 20 22 22 25 -0.7 62.6 37.2 69.8 32.9Massachusetts 4,954 490 813 122 481 -3.8 29.1 51.2 62.6 48.3New Hampshire 1,215 17 50 20 40 -0.8 28.3 49.1 60.3 44.0New Jersey 4,962 1,161 1,840 135 907 -7.9 2.1 33.5 43.1 38.6New York 10,973 2,889 3,812 343 1,832 -6.5 0.2 19.4 47.2 32.2Pennsylvania 9,797 1,384 941 209 475 -3.5 8.8 65.6 79.9 51.9Rhode Island 768 63 164 22 43 -8.0 18.7 38.3 58.6 30.0Vermont 579 8 12 11 13 -2.1 61.1 46.4 63.8 43.5District of Columbia 255 316 77 15 31 33.4 -0.6 54.4 92.1 46.8
1 Includes American Indians, Alaskan Natives, Hawaiians, Asians and Pacific Islanders.2 Regional totals and percentages of national total may not calculate from the figures shown, due
to rounding.
Sources: U.S. Census Bureau: Annual Estimates of the Resident Population by Sex, Race, and Hispanic Origin for the United States: April 1, 2000 to July 1, 2008 (2009), and Estimates of the Resident Population by Sex, Race, and Hispanic Origin for the United States, States, and Counties: April 1, 2010 to July 1, 2017 (2018) — www.census.gov.
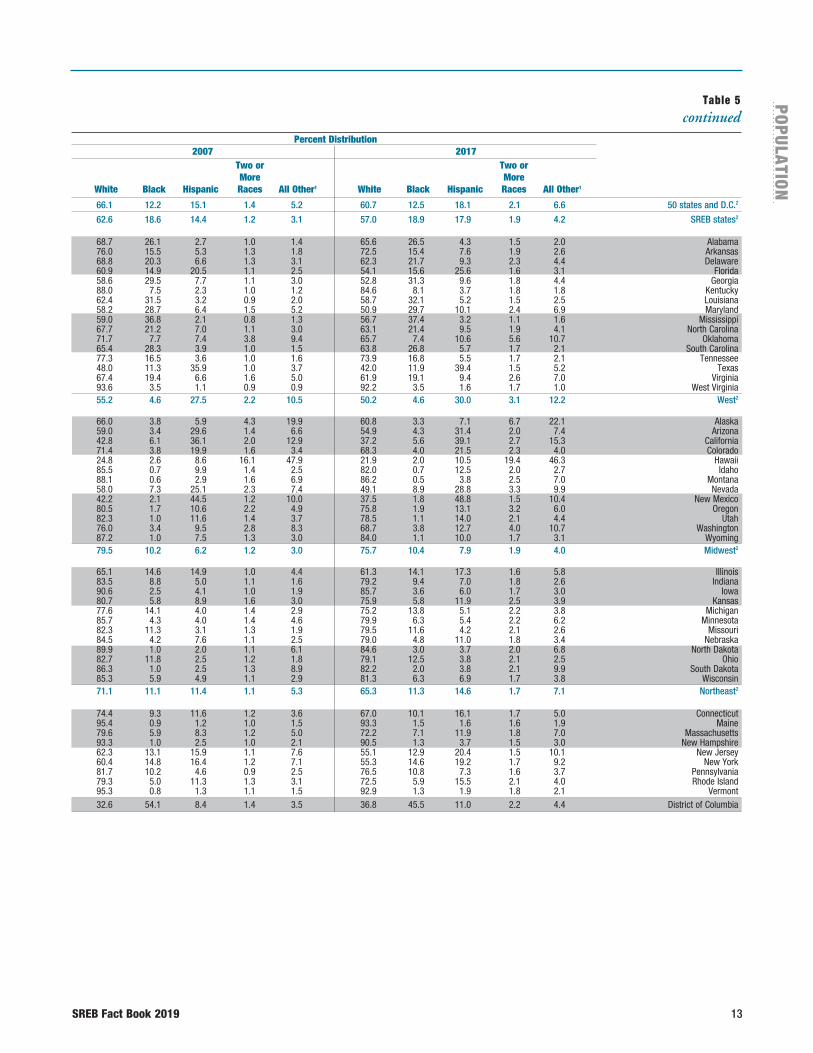
SREB Fact Book 2019 13
POPU
LATIO
N
POPU
LATIO
N
Percent Distribution
Table 5 continued
66.1 12.2 15.1 1.4 5.2 60.7 12.5 18.1 2.1 6.6 50 states and D.C.2
62.6 18.6 14.4 1.2 3.1 57.0 18.9 17.9 1.9 4.2 SREB states2
68.7 26.1 2.7 1.0 1.4 65.6 26.5 4.3 1.5 2.0 Alabama 76.0 15.5 5.3 1.3 1.8 72.5 15.4 7.6 1.9 2.6 Arkansas 68.8 20.3 6.6 1.3 3.1 62.3 21.7 9.3 2.3 4.4 Delaware 60.9 14.9 20.5 1.1 2.5 54.1 15.6 25.6 1.6 3.1 Florida 58.6 29.5 7.7 1.1 3.0 52.8 31.3 9.6 1.8 4.4 Georgia 88.0 7.5 2.3 1.0 1.2 84.6 8.1 3.7 1.8 1.8 Kentucky 62.4 31.5 3.2 0.9 2.0 58.7 32.1 5.2 1.5 2.5 Louisiana 58.2 28.7 6.4 1.5 5.2 50.9 29.7 10.1 2.4 6.9 Maryland 59.0 36.8 2.1 0.8 1.3 56.7 37.4 3.2 1.1 1.6 Mississippi 67.7 21.2 7.0 1.1 3.0 63.1 21.4 9.5 1.9 4.1 North Carolina 71.7 7.7 7.4 3.8 9.4 65.7 7.4 10.6 5.6 10.7 Oklahoma 65.4 28.3 3.9 1.0 1.5 63.8 26.8 5.7 1.7 2.1 South Carolina 77.3 16.5 3.6 1.0 1.6 73.9 16.8 5.5 1.7 2.1 Tennessee 48.0 11.3 35.9 1.0 3.7 42.0 11.9 39.4 1.5 5.2 Texas 67.4 19.4 6.6 1.6 5.0 61.9 19.1 9.4 2.6 7.0 Virginia 93.6 3.5 1.1 0.9 0.9 92.2 3.5 1.6 1.7 1.0 West Virginia 55.2 4.6 27.5 2.2 10.5 50.2 4.6 30.0 3.1 12.2 West2
66.0 3.8 5.9 4.3 19.9 60.8 3.3 7.1 6.7 22.1 Alaska 59.0 3.4 29.6 1.4 6.6 54.9 4.3 31.4 2.0 7.4 Arizona 42.8 6.1 36.1 2.0 12.9 37.2 5.6 39.1 2.7 15.3 California 71.4 3.8 19.9 1.6 3.4 68.3 4.0 21.5 2.3 4.0 Colorado 24.8 2.6 8.6 16.1 47.9 21.9 2.0 10.5 19.4 46.3 Hawaii 85.5 0.7 9.9 1.4 2.5 82.0 0.7 12.5 2.0 2.7 Idaho 88.1 0.6 2.9 1.6 6.9 86.2 0.5 3.8 2.5 7.0 Montana 58.0 7.3 25.1 2.3 7.4 49.1 8.9 28.8 3.3 9.9 Nevada 42.2 2.1 44.5 1.2 10.0 37.5 1.8 48.8 1.5 10.4 New Mexico 80.5 1.7 10.6 2.2 4.9 75.8 1.9 13.1 3.2 6.0 Oregon 82.3 1.0 11.6 1.4 3.7 78.5 1.1 14.0 2.1 4.4 Utah 76.0 3.4 9.5 2.8 8.3 68.7 3.8 12.7 4.0 10.7 Washington 87.2 1.0 7.5 1.3 3.0 84.0 1.1 10.0 1.7 3.1 Wyoming 79.5 10.2 6.2 1.2 3.0 75.7 10.4 7.9 1.9 4.0 Midwest2
65.1 14.6 14.9 1.0 4.4 61.3 14.1 17.3 1.6 5.8 Illinois 83.5 8.8 5.0 1.1 1.6 79.2 9.4 7.0 1.8 2.6 Indiana 90.6 2.5 4.1 1.0 1.9 85.7 3.6 6.0 1.7 3.0 Iowa 80.7 5.8 8.9 1.6 3.0 75.9 5.8 11.9 2.5 3.9 Kansas 77.6 14.1 4.0 1.4 2.9 75.2 13.8 5.1 2.2 3.8 Michigan 85.7 4.3 4.0 1.4 4.6 79.9 6.3 5.4 2.2 6.2 Minnesota 82.3 11.3 3.1 1.3 1.9 79.5 11.6 4.2 2.1 2.6 Missouri 84.5 4.2 7.6 1.1 2.5 79.0 4.8 11.0 1.8 3.4 Nebraska 89.9 1.0 2.0 1.1 6.1 84.6 3.0 3.7 2.0 6.8 North Dakota 82.7 11.8 2.5 1.2 1.8 79.1 12.5 3.8 2.1 2.5 Ohio 86.3 1.0 2.5 1.3 8.9 82.2 2.0 3.8 2.1 9.9 South Dakota 85.3 5.9 4.9 1.1 2.9 81.3 6.3 6.9 1.7 3.8 Wisconsin 71.1 11.1 11.4 1.1 5.3 65.3 11.3 14.6 1.7 7.1 Northeast2
74.4 9.3 11.6 1.2 3.6 67.0 10.1 16.1 1.7 5.0 Connecticut 95.4 0.9 1.2 1.0 1.5 93.3 1.5 1.6 1.6 1.9 Maine 79.6 5.9 8.3 1.2 5.0 72.2 7.1 11.9 1.8 7.0 Massachusetts 93.3 1.0 2.5 1.0 2.1 90.5 1.3 3.7 1.5 3.0 New Hampshire 62.3 13.1 15.9 1.1 7.6 55.1 12.9 20.4 1.5 10.1 New Jersey 60.4 14.8 16.4 1.2 7.1 55.3 14.6 19.2 1.7 9.2 New York 81.7 10.2 4.6 0.9 2.5 76.5 10.8 7.3 1.6 3.7 Pennsylvania 79.3 5.0 11.3 1.3 3.1 72.5 5.9 15.5 2.1 4.0 Rhode Island 95.3 0.8 1.3 1.1 1.5 92.9 1.3 1.9 1.8 2.1 Vermont 32.6 54.1 8.4 1.4 3.5 36.8 45.5 11.0 2.2 4.4 District of Columbia
2007 2017 Two or Two or More More White Black Hispanic Races All Other1 White Black Hispanic Races All Other1
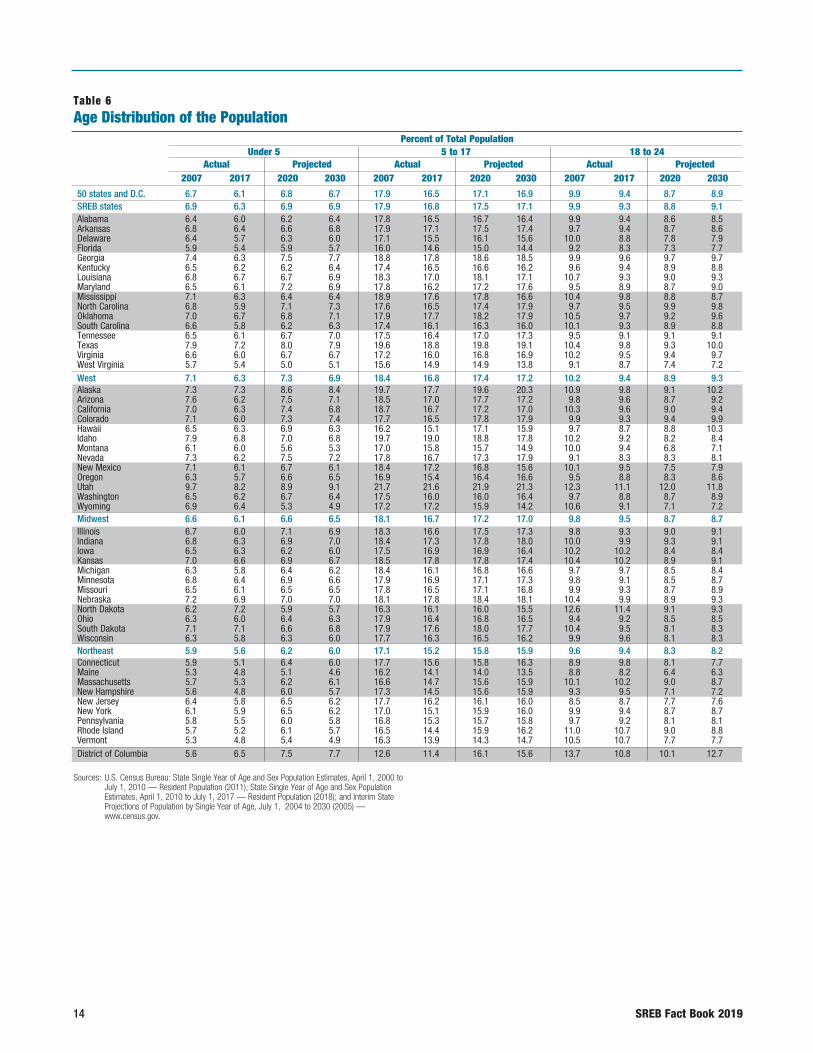
14 SREB Fact Book 2019
Percent of Total Population Under 5 5 to 17 18 to 24 Actual Projected Actual Projected Actual Projected 2007 2017 2020 2030 2007 2017 2020 2030 2007 2017 2020 2030
Table 6Age Distribution of the Population
50 states and D.C. 6.7 6.1 6.8 6.7 17.9 16.5 17.1 16.9 9.9 9.4 8.7 8.9SREB states 6.9 6.3 6.9 6.9 17.9 16.8 17.5 17.1 9.9 9.3 8.8 9.1Alabama 6.4 6.0 6.2 6.4 17.8 16.5 16.7 16.4 9.9 9.4 8.6 8.5Arkansas 6.8 6.4 6.6 6.8 17.9 17.1 17.5 17.4 9.7 9.4 8.7 8.6Delaware 6.4 5.7 6.3 6.0 17.1 15.5 16.1 15.6 10.0 8.8 7.8 7.9Florida 5.9 5.4 5.9 5.7 16.0 14.6 15.0 14.4 9.2 8.3 7.3 7.7Georgia 7.4 6.3 7.5 7.7 18.8 17.8 18.6 18.5 9.9 9.6 9.7 9.7Kentucky 6.5 6.2 6.2 6.4 17.4 16.5 16.6 16.2 9.6 9.4 8.9 8.8Louisiana 6.8 6.7 6.7 6.9 18.3 17.0 18.1 17.1 10.7 9.3 9.0 9.3Maryland 6.5 6.1 7.2 6.9 17.8 16.2 17.2 17.6 9.5 8.9 8.7 9.0Mississippi 7.1 6.3 6.4 6.4 18.9 17.6 17.8 16.6 10.4 9.8 8.8 8.7North Carolina 6.8 5.9 7.1 7.3 17.6 16.5 17.4 17.9 9.7 9.5 9.9 9.8Oklahoma 7.0 6.7 6.8 7.1 17.9 17.7 18.2 17.9 10.5 9.7 9.2 9.6South Carolina 6.6 5.8 6.2 6.3 17.4 16.1 16.3 16.0 10.1 9.3 8.9 8.8Tennessee 6.5 6.1 6.7 7.0 17.5 16.4 17.0 17.3 9.5 9.1 9.1 9.1Texas 7.9 7.2 8.0 7.9 19.6 18.8 19.8 19.1 10.4 9.8 9.3 10.0Virginia 6.6 6.0 6.7 6.7 17.2 16.0 16.8 16.9 10.2 9.5 9.4 9.7West Virginia 5.7 5.4 5.0 5.1 15.6 14.9 14.9 13.8 9.1 8.7 7.4 7.2West 7.1 6.3 7.3 6.9 18.4 16.8 17.4 17.2 10.2 9.4 8.9 9.3 Alaska 7.3 7.3 8.6 8.4 19.7 17.7 19.6 20.3 10.9 9.8 9.1 10.2Arizona 7.6 6.2 7.5 7.1 18.5 17.0 17.7 17.2 9.8 9.6 8.7 9.2California 7.0 6.3 7.4 6.8 18.7 16.7 17.2 17.0 10.3 9.6 9.0 9.4Colorado 7.1 6.0 7.3 7.4 17.7 16.5 17.8 17.9 9.9 9.3 9.4 9.9Hawaii 6.5 6.3 6.9 6.3 16.2 15.1 17.1 15.9 9.7 8.7 8.8 10.3Idaho 7.9 6.8 7.0 6.8 19.7 19.0 18.8 17.8 10.2 9.2 8.2 8.4Montana 6.1 6.0 5.6 5.3 17.0 15.8 15.7 14.9 10.0 9.4 6.8 7.1Nevada 7.3 6.2 7.5 7.2 17.8 16.7 17.3 17.9 9.1 8.3 8.3 8.1New Mexico 7.1 6.1 6.7 6.1 18.4 17.2 16.8 15.6 10.1 9.5 7.5 7.9Oregon 6.3 5.7 6.6 6.5 16.9 15.4 16.4 16.6 9.5 8.8 8.3 8.6Utah 9.7 8.2 8.9 9.1 21.7 21.6 21.9 21.3 12.3 11.1 12.0 11.8Washington 6.5 6.2 6.7 6.4 17.5 16.0 16.0 16.4 9.7 8.8 8.7 8.9Wyoming 6.9 6.4 5.3 4.9 17.2 17.2 15.9 14.2 10.6 9.1 7.1 7.2Midwest 6.6 6.1 6.6 6.5 18.1 16.7 17.2 17.0 9.8 9.5 8.7 8.7Illinois 6.7 6.0 7.1 6.9 18.3 16.6 17.5 17.3 9.8 9.3 9.0 9.1Indiana 6.8 6.3 6.9 7.0 18.4 17.3 17.8 18.0 10.0 9.9 9.3 9.1Iowa 6.5 6.3 6.2 6.0 17.5 16.9 16.9 16.4 10.2 10.2 8.4 8.4Kansas 7.0 6.6 6.9 6.7 18.5 17.8 17.8 17.4 10.4 10.2 8.9 9.1Michigan 6.3 5.8 6.4 6.2 18.4 16.1 16.8 16.6 9.7 9.7 8.5 8.4Minnesota 6.8 6.4 6.9 6.6 17.9 16.9 17.1 17.3 9.8 9.1 8.5 8.7Missouri 6.5 6.1 6.5 6.5 17.8 16.5 17.1 16.8 9.9 9.3 8.7 8.9Nebraska 7.2 6.9 7.0 7.0 18.1 17.8 18.4 18.1 10.4 9.9 8.9 9.3North Dakota 6.2 7.2 5.9 5.7 16.3 16.1 16.0 15.5 12.6 11.4 9.1 9.3Ohio 6.3 6.0 6.4 6.3 17.9 16.4 16.8 16.5 9.4 9.2 8.5 8.5South Dakota 7.1 7.1 6.6 6.8 17.9 17.6 18.0 17.7 10.4 9.5 8.1 8.3Wisconsin 6.3 5.8 6.3 6.0 17.7 16.3 16.5 16.2 9.9 9.6 8.1 8.3Northeast 5.9 5.6 6.2 6.0 17.1 15.2 15.8 15.9 9.6 9.4 8.3 8.2Connecticut 5.9 5.1 6.4 6.0 17.7 15.6 15.8 16.3 8.9 9.8 8.1 7.7Maine 5.3 4.8 5.1 4.6 16.2 14.1 14.0 13.5 8.8 8.2 6.4 6.3Massachusetts 5.7 5.3 6.2 6.1 16.6 14.7 15.6 15.9 10.1 10.2 9.0 8.7New Hampshire 5.6 4.8 6.0 5.7 17.3 14.5 15.6 15.9 9.3 9.5 7.1 7.2New Jersey 6.4 5.8 6.5 6.2 17.7 16.2 16.1 16.0 8.5 8.7 7.7 7.6New York 6.1 5.9 6.5 6.2 17.0 15.1 15.9 16.0 9.9 9.4 8.7 8.7Pennsylvania 5.8 5.5 6.0 5.8 16.8 15.3 15.7 15.8 9.7 9.2 8.1 8.1Rhode Island 5.7 5.2 6.1 5.7 16.5 14.4 15.9 16.2 11.0 10.7 9.0 8.8Vermont 5.3 4.8 5.4 4.9 16.3 13.9 14.3 14.7 10.5 10.7 7.7 7.7District of Columbia 5.6 6.5 7.5 7.7 12.6 11.4 16.1 15.6 13.7 10.8 10.1 12.7
Sources: U.S. Census Bureau: State Single Year of Age and Sex Population Estimates, April 1, 2000 to July 1, 2010 — Resident Population (2011); State Single Year of Age and Sex Population Estimates, April 1, 2010 to July 1, 2017 — Resident Population (2018); and Interim State Projections of Population by Single Year of Age, July 1, 2004 to 2030 (2005) — www.census.gov.
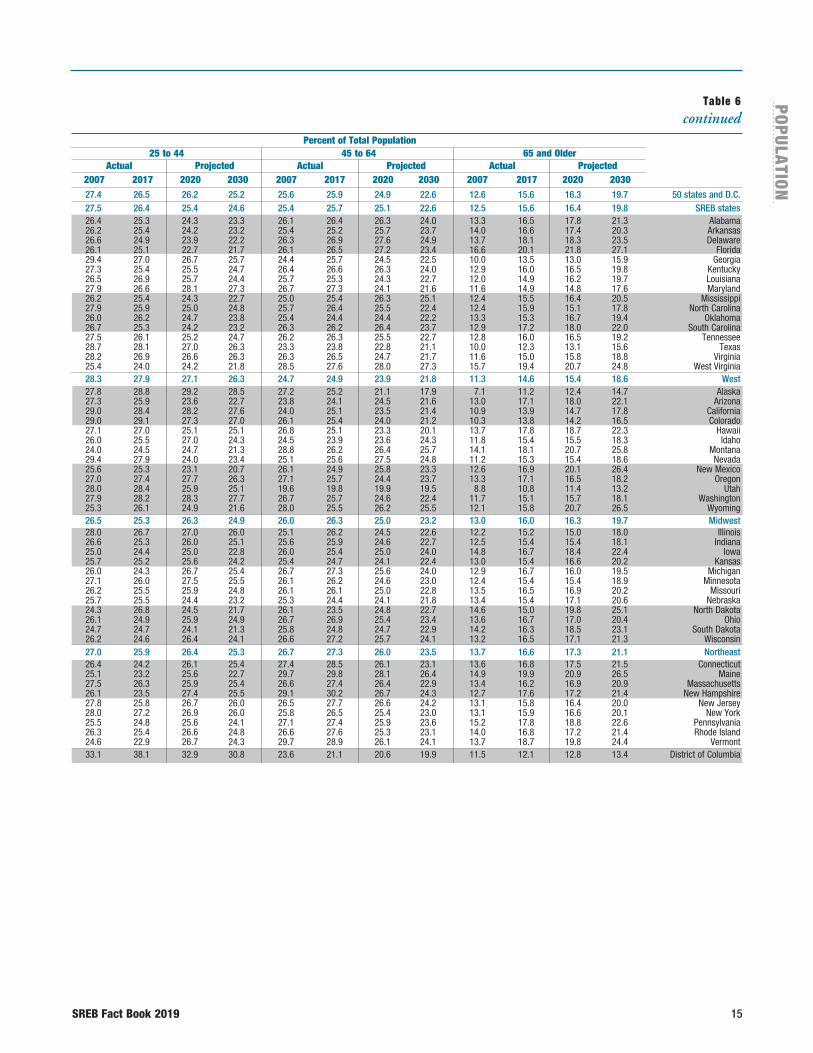
SREB Fact Book 2019 15
POPU
LATIO
N
Table 6 continued
27.4 26.5 26.2 25.2 25.6 25.9 24.9 22.6 12.6 15.6 16.3 19.7 50 states and D.C. 27.5 26.4 25.4 24.6 25.4 25.7 25.1 22.6 12.5 15.6 16.4 19.8 SREB states 26.4 25.3 24.3 23.3 26.1 26.4 26.3 24.0 13.3 16.5 17.8 21.3 Alabama 26.2 25.4 24.2 23.2 25.4 25.2 25.7 23.7 14.0 16.6 17.4 20.3 Arkansas 26.6 24.9 23.9 22.2 26.3 26.9 27.6 24.9 13.7 18.1 18.3 23.5 Delaware 26.1 25.1 22.7 21.7 26.1 26.5 27.2 23.4 16.6 20.1 21.8 27.1 Florida 29.4 27.0 26.7 25.7 24.4 25.7 24.5 22.5 10.0 13.5 13.0 15.9 Georgia 27.3 25.4 25.5 24.7 26.4 26.6 26.3 24.0 12.9 16.0 16.5 19.8 Kentucky 26.5 26.9 25.7 24.4 25.7 25.3 24.3 22.7 12.0 14.9 16.2 19.7 Louisiana 27.9 26.6 28.1 27.3 26.7 27.3 24.1 21.6 11.6 14.9 14.8 17.6 Maryland 26.2 25.4 24.3 22.7 25.0 25.4 26.3 25.1 12.4 15.5 16.4 20.5 Mississippi 27.9 25.9 25.0 24.8 25.7 26.4 25.5 22.4 12.4 15.9 15.1 17.8 North Carolina 26.0 26.2 24.7 23.8 25.4 24.4 24.4 22.2 13.3 15.3 16.7 19.4 Oklahoma 26.7 25.3 24.2 23.2 26.3 26.2 26.4 23.7 12.9 17.2 18.0 22.0 South Carolina 27.5 26.1 25.2 24.7 26.2 26.3 25.5 22.7 12.8 16.0 16.5 19.2 Tennessee 28.7 28.1 27.0 26.3 23.3 23.8 22.8 21.1 10.0 12.3 13.1 15.6 Texas 28.2 26.9 26.6 26.3 26.3 26.5 24.7 21.7 11.6 15.0 15.8 18.8 Virginia 25.4 24.0 24.2 21.8 28.5 27.6 28.0 27.3 15.7 19.4 20.7 24.8 West Virginia 28.3 27.9 27.1 26.3 24.7 24.9 23.9 21.8 11.3 14.6 15.4 18.6 West 27.8 28.8 29.2 28.5 27.2 25.2 21.1 17.9 7.1 11.2 12.4 14.7 Alaska 27.3 25.9 23.6 22.7 23.8 24.1 24.5 21.6 13.0 17.1 18.0 22.1 Arizona 29.0 28.4 28.2 27.6 24.0 25.1 23.5 21.4 10.9 13.9 14.7 17.8 California 29.0 29.1 27.3 27.0 26.1 25.4 24.0 21.2 10.3 13.8 14.2 16.5 Colorado 27.1 27.0 25.1 25.1 26.8 25.1 23.3 20.1 13.7 17.8 18.7 22.3 Hawaii 26.0 25.5 27.0 24.3 24.5 23.9 23.6 24.3 11.8 15.4 15.5 18.3 Idaho 24.0 24.5 24.7 21.3 28.8 26.2 26.4 25.7 14.1 18.1 20.7 25.8 Montana 29.4 27.9 24.0 23.4 25.1 25.6 27.5 24.8 11.2 15.3 15.4 18.6 Nevada 25.6 25.3 23.1 20.7 26.1 24.9 25.8 23.3 12.6 16.9 20.1 26.4 New Mexico 27.0 27.4 27.7 26.3 27.1 25.7 24.4 23.7 13.3 17.1 16.5 18.2 Oregon 28.0 28.4 25.9 25.1 19.6 19.8 19.9 19.5 8.8 10.8 11.4 13.2 Utah 27.9 28.2 28.3 27.7 26.7 25.7 24.6 22.4 11.7 15.1 15.7 18.1 Washington 25.3 26.1 24.9 21.6 28.0 25.5 26.2 25.5 12.1 15.8 20.7 26.5 Wyoming 26.5 25.3 26.3 24.9 26.0 26.3 25.0 23.2 13.0 16.0 16.3 19.7 Midwest 28.0 26.7 27.0 26.0 25.1 26.2 24.5 22.6 12.2 15.2 15.0 18.0 Illinois 26.6 25.3 26.0 25.1 25.6 25.9 24.6 22.7 12.5 15.4 15.4 18.1 Indiana 25.0 24.4 25.0 22.8 26.0 25.4 25.0 24.0 14.8 16.7 18.4 22.4 Iowa 25.7 25.2 25.6 24.2 25.4 24.7 24.1 22.4 13.0 15.4 16.6 20.2 Kansas 26.0 24.3 26.7 25.4 26.7 27.3 25.6 24.0 12.9 16.7 16.0 19.5 Michigan 27.1 26.0 27.5 25.5 26.1 26.2 24.6 23.0 12.4 15.4 15.4 18.9 Minnesota 26.2 25.5 25.9 24.8 26.1 26.1 25.0 22.8 13.5 16.5 16.9 20.2 Missouri 25.7 25.5 24.4 23.2 25.3 24.4 24.1 21.8 13.4 15.4 17.1 20.6 Nebraska 24.3 26.8 24.5 21.7 26.1 23.5 24.8 22.7 14.6 15.0 19.8 25.1 North Dakota 26.1 24.9 25.9 24.9 26.7 26.9 25.4 23.4 13.6 16.7 17.0 20.4 Ohio 24.7 24.7 24.1 21.3 25.8 24.8 24.7 22.9 14.2 16.3 18.5 23.1 South Dakota 26.2 24.6 26.4 24.1 26.6 27.2 25.7 24.1 13.2 16.5 17.1 21.3 Wisconsin 27.0 25.9 26.4 25.3 26.7 27.3 26.0 23.5 13.7 16.6 17.3 21.1 Northeast 26.4 24.2 26.1 25.4 27.4 28.5 26.1 23.1 13.6 16.8 17.5 21.5 Connecticut 25.1 23.2 25.6 22.7 29.7 29.8 28.1 26.4 14.9 19.9 20.9 26.5 Maine 27.5 26.3 25.9 25.4 26.6 27.4 26.4 22.9 13.4 16.2 16.9 20.9 Massachusetts 26.1 23.5 27.4 25.5 29.1 30.2 26.7 24.3 12.7 17.6 17.2 21.4 New Hampshire 27.8 25.8 26.7 26.0 26.5 27.7 26.6 24.2 13.1 15.8 16.4 20.0 New Jersey 28.0 27.2 26.9 26.0 25.8 26.5 25.4 23.0 13.1 15.9 16.6 20.1 New York 25.5 24.8 25.6 24.1 27.1 27.4 25.9 23.6 15.2 17.8 18.8 22.6 Pennsylvania 26.3 25.4 26.6 24.8 26.6 27.6 25.3 23.1 14.0 16.8 17.2 21.4 Rhode Island 24.6 22.9 26.7 24.3 29.7 28.9 26.1 24.1 13.7 18.7 19.8 24.4 Vermont 33.1 38.1 32.9 30.8 23.6 21.1 20.6 19.9 11.5 12.1 12.8 13.4 District of Columbia
Percent of Total Population 25 to 44 45 to 64 65 and Older Actual Projected Actual Projected Actual Projected 2007 2017 2020 2030 2007 2017 2020 2030 2007 2017 2020 2030
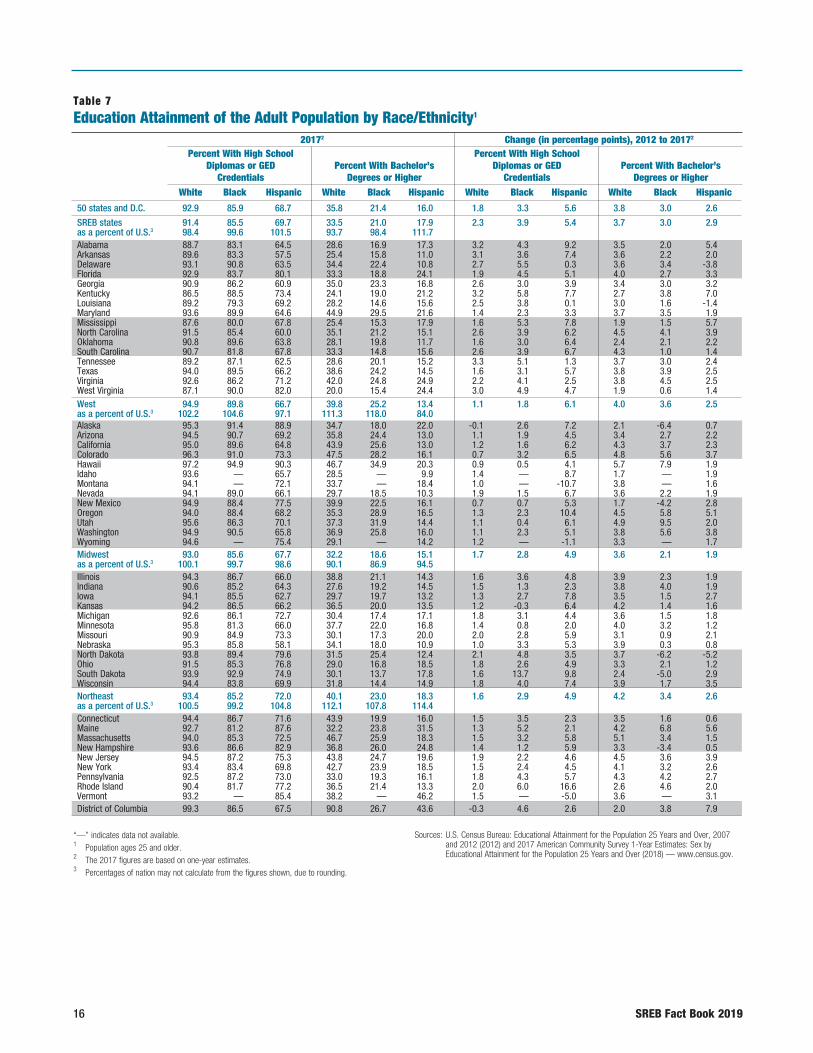
16 SREB Fact Book 2019
Table 7Education Attainment of the Adult Population by Race/Ethnicity1
20172 Change (in percentage points), 2012 to 20172 Percent With High School Percent With High School Diplomas or GED Percent With Bachelor’s Diplomas or GED Percent With Bachelor’s Credentials Degrees or Higher Credentials Degrees or Higher White Black Hispanic White Black Hispanic White Black Hispanic White Black Hispanic
“—” indicates data not available.1 Population ages 25 and older. 2 The 2017 figures are based on one-year estimates.3 Percentages of nation may not calculate from the figures shown, due to rounding.
Sources: U.S. Census Bureau: Educational Attainment for the Population 25 Years and Over, 2007 and 2012 (2012) and 2017 American Community Survey 1-Year Estimates: Sex by Educational Attainment for the Population 25 Years and Over (2018) — www.census.gov.
50 states and D.C. 92.9 85.9 68.7 35.8 21.4 16.0 1.8 3.3 5.6 3.8 3.0 2.6
SREB states 91.4 85.5 69.7 33.5 21.0 17.9 2.3 3.9 5.4 3.7 3.0 2.9as a percent of U.S.3 98.4 99.6 101.5 93.7 98.4 111.7 Alabama 88.7 83.1 64.5 28.6 16.9 17.3 3.2 4.3 9.2 3.5 2.0 5.4Arkansas 89.6 83.3 57.5 25.4 15.8 11.0 3.1 3.6 7.4 3.6 2.2 2.0Delaware 93.1 90.8 63.5 34.4 22.4 10.8 2.7 5.5 0.3 3.6 3.4 -3.8Florida 92.9 83.7 80.1 33.3 18.8 24.1 1.9 4.5 5.1 4.0 2.7 3.3Georgia 90.9 86.2 60.9 35.0 23.3 16.8 2.6 3.0 3.9 3.4 3.0 3.2Kentucky 86.5 88.5 73.4 24.1 19.0 21.2 3.2 5.8 7.7 2.7 3.8 7.0Louisiana 89.2 79.3 69.2 28.2 14.6 15.6 2.5 3.8 0.1 3.0 1.6 -1.4Maryland 93.6 89.9 64.6 44.9 29.5 21.6 1.4 2.3 3.3 3.7 3.5 1.9Mississippi 87.6 80.0 67.8 25.4 15.3 17.9 1.6 5.3 7.8 1.9 1.5 5.7North Carolina 91.5 85.4 60.0 35.1 21.2 15.1 2.6 3.9 6.2 4.5 4.1 3.9Oklahoma 90.8 89.6 63.8 28.1 19.8 11.7 1.6 3.0 6.4 2.4 2.1 2.2South Carolina 90.7 81.8 67.8 33.3 14.8 15.6 2.6 3.9 6.7 4.3 1.0 1.4Tennessee 89.2 87.1 62.5 28.6 20.1 15.2 3.3 5.1 1.3 3.7 3.0 2.4Texas 94.0 89.5 66.2 38.6 24.2 14.5 1.6 3.1 5.7 3.8 3.9 2.5Virginia 92.6 86.2 71.2 42.0 24.8 24.9 2.2 4.1 2.5 3.8 4.5 2.5West Virginia 87.1 90.0 82.0 20.0 15.4 24.4 3.0 4.9 4.7 1.9 0.6 1.4West 94.9 89.8 66.7 39.8 25.2 13.4 1.1 1.8 6.1 4.0 3.6 2.5as a percent of U.S.3 102.2 104.6 97.1 111.3 118.0 84.0 Alaska 95.3 91.4 88.9 34.7 18.0 22.0 -0.1 2.6 7.2 2.1 -6.4 0.7Arizona 94.5 90.7 69.2 35.8 24.4 13.0 1.1 1.9 4.5 3.4 2.7 2.2California 95.0 89.6 64.8 43.9 25.6 13.0 1.2 1.6 6.2 4.3 3.7 2.3Colorado 96.3 91.0 73.3 47.5 28.2 16.1 0.7 3.2 6.5 4.8 5.6 3.7Hawaii 97.2 94.9 90.3 46.7 34.9 20.3 0.9 0.5 4.1 5.7 7.9 1.9Idaho 93.6 — 65.7 28.5 — 9.9 1.4 — 8.7 1.7 — 1.9Montana 94.1 — 72.1 33.7 — 18.4 1.0 — -10.7 3.8 — 1.6Nevada 94.1 89.0 66.1 29.7 18.5 10.3 1.9 1.5 6.7 3.6 2.2 1.9New Mexico 94.9 88.4 77.5 39.9 22.5 16.1 0.7 0.7 5.3 1.7 -4.2 2.8Oregon 94.0 88.4 68.2 35.3 28.9 16.5 1.3 2.3 10.4 4.5 5.8 5.1Utah 95.6 86.3 70.1 37.3 31.9 14.4 1.1 0.4 6.1 4.9 9.5 2.0Washington 94.9 90.5 65.8 36.9 25.8 16.0 1.1 2.3 5.1 3.8 5.6 3.8Wyoming 94.6 — 75.4 29.1 — 14.2 1.2 — -1.1 3.3 — 1.7Midwest 93.0 85.6 67.7 32.2 18.6 15.1 1.7 2.8 4.9 3.6 2.1 1.9as a percent of U.S.3 100.1 99.7 98.6 90.1 86.9 94.5 Illinois 94.3 86.7 66.0 38.8 21.1 14.3 1.6 3.6 4.8 3.9 2.3 1.9Indiana 90.6 85.2 64.3 27.6 19.2 14.5 1.5 1.3 2.3 3.8 4.0 1.9Iowa 94.1 85.5 62.7 29.7 19.7 13.2 1.3 2.7 7.8 3.5 1.5 2.7Kansas 94.2 86.5 66.2 36.5 20.0 13.5 1.2 -0.3 6.4 4.2 1.4 1.6Michigan 92.6 86.1 72.7 30.4 17.4 17.1 1.8 3.1 4.4 3.6 1.5 1.8Minnesota 95.8 81.3 66.0 37.7 22.0 16.8 1.4 0.8 2.0 4.0 3.2 1.2Missouri 90.9 84.9 73.3 30.1 17.3 20.0 2.0 2.8 5.9 3.1 0.9 2.1Nebraska 95.3 85.8 58.1 34.1 18.0 10.9 1.0 3.3 5.3 3.9 0.3 0.8North Dakota 93.8 89.4 79.6 31.5 25.4 12.4 2.1 4.8 3.5 3.7 -6.2 -5.2Ohio 91.5 85.3 76.8 29.0 16.8 18.5 1.8 2.6 4.9 3.3 2.1 1.2South Dakota 93.9 92.9 74.9 30.1 13.7 17.8 1.6 13.7 9.8 2.4 -5.0 2.9Wisconsin 94.4 83.8 69.9 31.8 14.4 14.9 1.8 4.0 7.4 3.9 1.7 3.5Northeast 93.4 85.2 72.0 40.1 23.0 18.3 1.6 2.9 4.9 4.2 3.4 2.6as a percent of U.S.3 100.5 99.2 104.8 112.1 107.8 114.4 Connecticut 94.4 86.7 71.6 43.9 19.9 16.0 1.5 3.5 2.3 3.5 1.6 0.6Maine 92.7 81.2 87.6 32.2 23.8 31.5 1.3 5.2 2.1 4.2 6.8 5.6Massachusetts 94.0 85.3 72.5 46.7 25.9 18.3 1.5 3.2 5.8 5.1 3.4 1.5New Hampshire 93.6 86.6 82.9 36.8 26.0 24.8 1.4 1.2 5.9 3.3 -3.4 0.5New Jersey 94.5 87.2 75.3 43.8 24.7 19.6 1.9 2.2 4.6 4.5 3.6 3.9New York 93.4 83.4 69.8 42.7 23.9 18.5 1.5 2.4 4.5 4.1 3.2 2.6Pennsylvania 92.5 87.2 73.0 33.0 19.3 16.1 1.8 4.3 5.7 4.3 4.2 2.7Rhode Island 90.4 81.7 77.2 36.5 21.4 13.3 2.0 6.0 16.6 2.6 4.6 2.0Vermont 93.2 — 85.4 38.2 — 46.2 1.5 — -5.0 3.6 — 3.1District of Columbia 99.3 86.5 67.5 90.8 26.7 43.6 -0.3 4.6 2.6 2.0 3.8 7.9

SREB Fact Book 2019 17
POPU
LATIO
N
Total Percent Change Percent Eligible For Actual Projected Percent Minority1,2 Free or Reduced-Price Lunches3
National Rank 2006 to 2016 to National Rank National Rank Fall 2016 2006 2016 2016 2026 2006 2016 2006 2016 2006-07 2016-17 2006-07 2016-17
Table 8Public Prekindergarten, Elementary and Secondary School Enrollment
1 Minority indicates non-white students; calculated based on a total that excludes students whose race is unknown.
2 The regional percent minority figures are the median state in each region. 3 Eligibility for free meals requires family income of 130 percent of the Federal Poverty Guideline
(set annually and varies by family size); eligibility for reduced lunch prices requires family income above 130 percent and up to 185 percent of the Federal Poverty Guideline.
Sources: National Center for Education Statistics: Digest of Education Statistics 2016 (2018); Projections of Education Statistics to 2026 (2016); and Common Core of Data (CCD) State Nonfiscal Survey of Public Elementary/Secondary Education Survey, 2016-17 (2018).
50 states and D.C. 50,506,507 2.4 2.4 44.1 51.8 42.4 46.6
SREB states 19,663,568 7.9 6.9 44.3 56.7 47.6 53.7 as a percent of U.S. 38.9 Alabama 744,930 23 24 0.2 -2.7 40.9 45.0 21 24 51.0 51.7 9 14Arkansas 493,447 33 33 3.6 1.4 32.4 38.6 25 28 58.7 64.3 5 43Delaware 136,264 46 46 11.5 7.7 46.1 54.9 14 15 37.1 — 28 46Florida 2,816,791 4 3 5.4 10.2 51.6 61.3 11 8 45.2 58.0 15 11Georgia 1,764,346 9 6 8.3 8.4 51.8 59.7 10 10 50.3 62.0 10 6Kentucky 684,017 25 27 0.1 5.1 14.2 22.5 45 44 51.3 58.7 — 9Louisiana 716,293 26 25 6.0 2.8 49.9 54.9 12 14 61.7 63.0 3 4Maryland 886,221 20 20 4.1 4.6 52.2 61.8 9 7 32.3 46.7 38 22Mississippi 483,150 31 34 -2.4 -4.4 53.5 55.6 8 12 67.6 75.0 1 1North Carolina 1,550,062 10 9 7.3 6.0 42.5 51.1 19 — 43.9 57.4 17 12Oklahoma 693,903 27 26 8.5 5.7 41.4 50.6 20 19 55.2 62.3 6 5South Carolina 770,856 24 23 8.9 6.5 46.1 48.8 15 21 51.3 66.9 7 3Tennessee 1,001,562 16 16 2.4 3.8 30.9 36.5 27 30 48.7 — — 46Texas 5,360,849 2 2 16.6 11.0 64.3 71.9 5 5 47.6 58.9 14 8Virginia 1,287,026 12 12 5.5 3.0 40.7 50.3 22 20 32.7 40.8 37 33West Virginia 273,851 38 39 -2.9 -0.5 6.7 9.6 49 50 49.7 44.6 12 —West 12,258,889 2.6 4.3 38.1 62.5 45.1 48.1 as a percent of U.S. 24.3 Alaska 132,737 45 47 0.1 7.1 42.6 52.0 18 16 38.6 44.0 25 29Arizona 1,123,137 13 13 5.1 12.1 54.6 61.1 7 9 42.8 — 18 —California 6,228,235 1 1 -2.8 -0.4 69.8 76.4 3 — 50.2 58.0 11 10Colorado 905,019 22 19 14.0 8.5 38.1 46.2 23 22 34.2 42.1 34 32Hawaii 181,550 42 40 0.5 6.8 80.4 88.4 2 2 41.0 47.6 20 19Idaho 297,200 39 38 11.2 1.5 17.7 24.3 41 42 37.6 45.8 26 23Montana 146,375 44 43 1.4 8.8 16.1 21.0 42 47 35.6 45.3 32 24Nevada 473,744 35 35 11.5 11.1 55.6 66.8 6 6 40.7 60.7 22 7New Mexico 336,263 36 36 2.5 1.3 69.4 75.9 4 4 60.8 71.3 4 2Oregon 578,947 29 29 2.9 10.9 26.8 37.0 31 29 42.0 48.2 19 17Utah 659,801 30 28 26.1 13.8 19.2 25.1 40 41 30.9 35.7 43 41Washington 1,101,711 15 14 7.3 7.6 31.1 44.7 26 25 36.7 43.6 29 30Wyoming 94,170 50 49 10.5 9.2 15.5 22.0 43 45 29.7 38.6 46 35Midwest 10,538,943 -2.6 -2.9 22.7 34.6 36.1 37.6 as a percent of U.S. 20.9 Illinois 2,026,714 5 5 -4.3 -4.3 44.1 51.5 17 17 40.8 49.8 21 16Indiana 1,049,547 14 15 0.3 -3.5 20.5 31.4 38 36 37.6 47.2 27 20Iowa 509,831 32 31 5.5 1.0 14.1 23.3 44 43 32.2 40.2 39 34Kansas 494,347 34 32 5.3 2.4 26.1 35.4 29 31 39.8 47.7 23 18Michigan 1,528,666 8 10 -11.3 -9.8 28.2 33.4 25 33 36.2 44.2 31 28Minnesota 875,021 21 21 4.1 2.5 22.8 32.5 31 35 31.0 37.6 42 37Missouri 915,040 18 18 -0.6 -0.7 23.7 28.4 29 39 39.1 50.5 24 15Nebraska 319,194 37 37 11.0 4.3 23.5 33.1 29 34 36.5 44.7 30 25North Dakota 109,706 48 48 13.5 24.6 13.2 21.8 39 46 30.3 30.3 45 44Ohio 1,710,143 7 8 -6.9 -4.9 21.2 29.4 30 38 33.8 — 35 46South Dakota 136,302 47 45 12.5 5.0 15.5 25.4 35 40 30.3 37.7 44 36Wisconsin 864,432 19 22 -1.4 -3.0 22.7 29.6 27 37 31.2 37.4 41 38Northeast 7,959,257 -3.6 -4.7 28.8 45.3 34.8 39.0 as a percent of U.S. 15.8 Connecticut 535,118 28 30 -7.0 -13.1 34.0 45.2 24 23 28.1 35.3 49 42Maine 180,512 41 42 -6.9 -10.7 5.4 10.3 50 49 35.0 44.2 33 27Massachusetts 964,467 17 17 -0.4 -4.4 27.1 38.6 30 27 29.2 — 47 46New Hampshire 180,888 40 41 -11.1 -12.1 7.1 13.7 48 48 17.9 27.1 51 45New Jersey 1,410,421 11 11 1.6 -6.2 44.3 55.3 16 13 28.4 36.9 — 39New York 2,729,776 3 4 -2.8 -0.6 47.9 55.9 13 11 44.6 52.1 16 13Pennsylvania 1,727,497 6 7 -7.7 -5.9 25.4 33.4 33 32 31.7 43.3 40 31Rhode Island 142,150 43 44 -6.2 -5.0 30.5 41.3 28 26 33.2 47.1 36 21Vermont 88,428 49 50 -7.3 -10.9 4.7 9.3 51 51 26.8 36.8 50 40District of Columbia 85,850 51 51 17.8 33.6 95.0 89.3 1 1 62.1 — 2 46
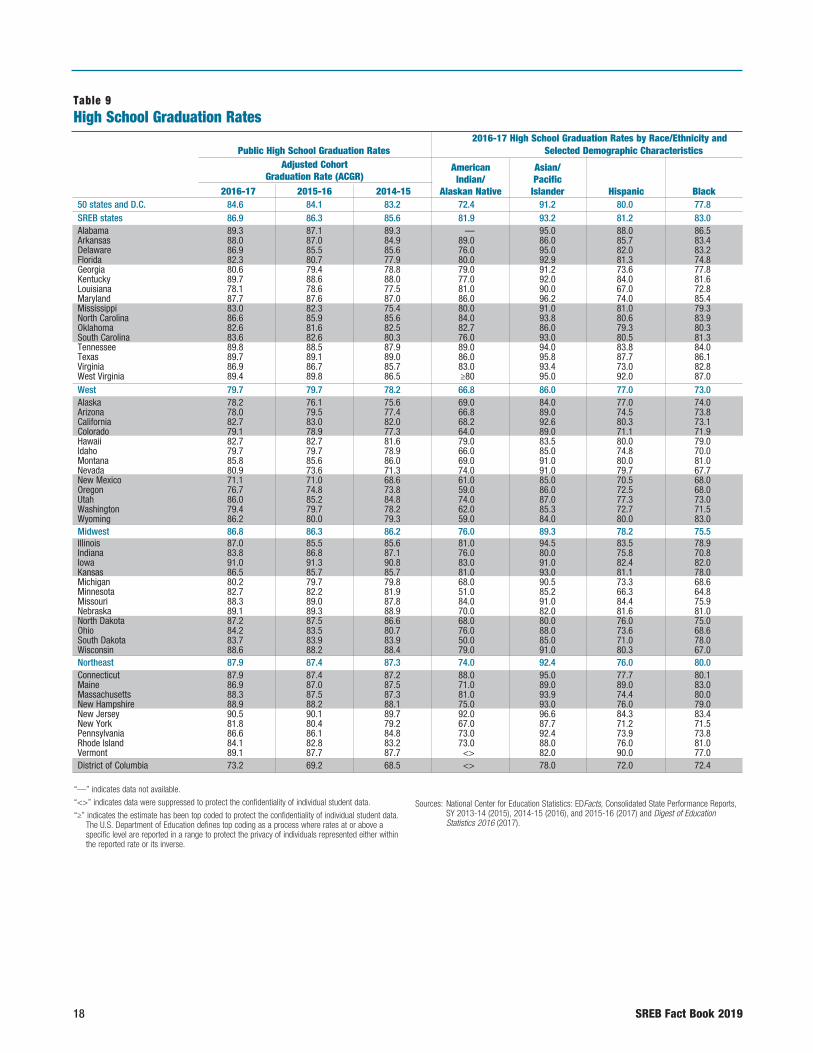
18 SREB Fact Book 2019
Table 9High School Graduation Rates
50 states and D.C. 84.6 84.1 83.2 72.4 91.2 80.0 77.8SREB states 86.9 86.3 85.6 81.9 93.2 81.2 83.0 Alabama 89.3 87.1 89.3 — 95.0 88.0 86.5Arkansas 88.0 87.0 84.9 89.0 86.0 85.7 83.4Delaware 86.9 85.5 85.6 76.0 95.0 82.0 83.2Florida 82.3 80.7 77.9 80.0 92.9 81.3 74.8Georgia 80.6 79.4 78.8 79.0 91.2 73.6 77.8Kentucky 89.7 88.6 88.0 77.0 92.0 84.0 81.6Louisiana 78.1 78.6 77.5 81.0 90.0 67.0 72.8Maryland 87.7 87.6 87.0 86.0 96.2 74.0 85.4Mississippi 83.0 82.3 75.4 80.0 91.0 81.0 79.3North Carolina 86.6 85.9 85.6 84.0 93.8 80.6 83.9Oklahoma 82.6 81.6 82.5 82.7 86.0 79.3 80.3South Carolina 83.6 82.6 80.3 76.0 93.0 80.5 81.3Tennessee 89.8 88.5 87.9 89.0 94.0 83.8 84.0Texas 89.7 89.1 89.0 86.0 95.8 87.7 86.1Virginia 86.9 86.7 85.7 83.0 93.4 73.0 82.8West Virginia 89.4 89.8 86.5 ≥80 95.0 92.0 87.0West 79.7 79.7 78.2 66.8 86.0 77.0 73.0Alaska 78.2 76.1 75.6 69.0 84.0 77.0 74.0Arizona 78.0 79.5 77.4 66.8 89.0 74.5 73.8California 82.7 83.0 82.0 68.2 92.6 80.3 73.1Colorado 79.1 78.9 77.3 64.0 89.0 71.1 71.9Hawaii 82.7 82.7 81.6 79.0 83.5 80.0 79.0Idaho 79.7 79.7 78.9 66.0 85.0 74.8 70.0Montana 85.8 85.6 86.0 69.0 91.0 80.0 81.0Nevada 80.9 73.6 71.3 74.0 91.0 79.7 67.7New Mexico 71.1 71.0 68.6 61.0 85.0 70.5 68.0Oregon 76.7 74.8 73.8 59.0 86.0 72.5 68.0Utah 86.0 85.2 84.8 74.0 87.0 77.3 73.0Washington 79.4 79.7 78.2 62.0 85.3 72.7 71.5Wyoming 86.2 80.0 79.3 59.0 84.0 80.0 83.0Midwest 86.8 86.3 86.2 76.0 89.3 78.2 75.5Illinois 87.0 85.5 85.6 81.0 94.5 83.5 78.9Indiana 83.8 86.8 87.1 76.0 80.0 75.8 70.8Iowa 91.0 91.3 90.8 83.0 91.0 82.4 82.0Kansas 86.5 85.7 85.7 81.0 93.0 81.1 78.0Michigan 80.2 79.7 79.8 68.0 90.5 73.3 68.6Minnesota 82.7 82.2 81.9 51.0 85.2 66.3 64.8Missouri 88.3 89.0 87.8 84.0 91.0 84.4 75.9Nebraska 89.1 89.3 88.9 70.0 82.0 81.6 81.0North Dakota 87.2 87.5 86.6 68.0 80.0 76.0 75.0Ohio 84.2 83.5 80.7 76.0 88.0 73.6 68.6South Dakota 83.7 83.9 83.9 50.0 85.0 71.0 78.0Wisconsin 88.6 88.2 88.4 79.0 91.0 80.3 67.0Northeast 87.9 87.4 87.3 74.0 92.4 76.0 80.0Connecticut 87.9 87.4 87.2 88.0 95.0 77.7 80.1Maine 86.9 87.0 87.5 71.0 89.0 89.0 83.0Massachusetts 88.3 87.5 87.3 81.0 93.9 74.4 80.0New Hampshire 88.9 88.2 88.1 75.0 93.0 76.0 79.0New Jersey 90.5 90.1 89.7 92.0 96.6 84.3 83.4New York 81.8 80.4 79.2 67.0 87.7 71.2 71.5Pennsylvania 86.6 86.1 84.8 73.0 92.4 73.9 73.8Rhode Island 84.1 82.8 83.2 73.0 88.0 76.0 81.0Vermont 89.1 87.7 87.7 <> 82.0 90.0 77.0District of Columbia 73.2 69.2 68.5 <> 78.0 72.0 72.4
“—” indicates data not available.
“<>” indicates data were suppressed to protect the confidentiality of individual student data.
“≥” indicates the estimate has been top coded to protect the confidentiality of individual student data. The U.S. Department of Education defines top coding as a process where rates at or above a specific level are reported in a range to protect the privacy of individuals represented either within the reported rate or its inverse.
Sources: National Center for Education Statistics: EDFacts, Consolidated State Performance Reports, SY 2013-14 (2015), 2014-15 (2016), and 2015-16 (2017) and Digest of Education Statistics 2016 (2017).
2016-17 High School Graduation Rates by Race/Ethnicity and Public High School Graduation Rates Selected Demographic Characteristics Adjusted Cohort Graduation Rate (ACGR) 2016-17 2015-16 2014-15
American Indian/
Alaskan Native
Asian/ Pacific
Islander
Hispanic
Black
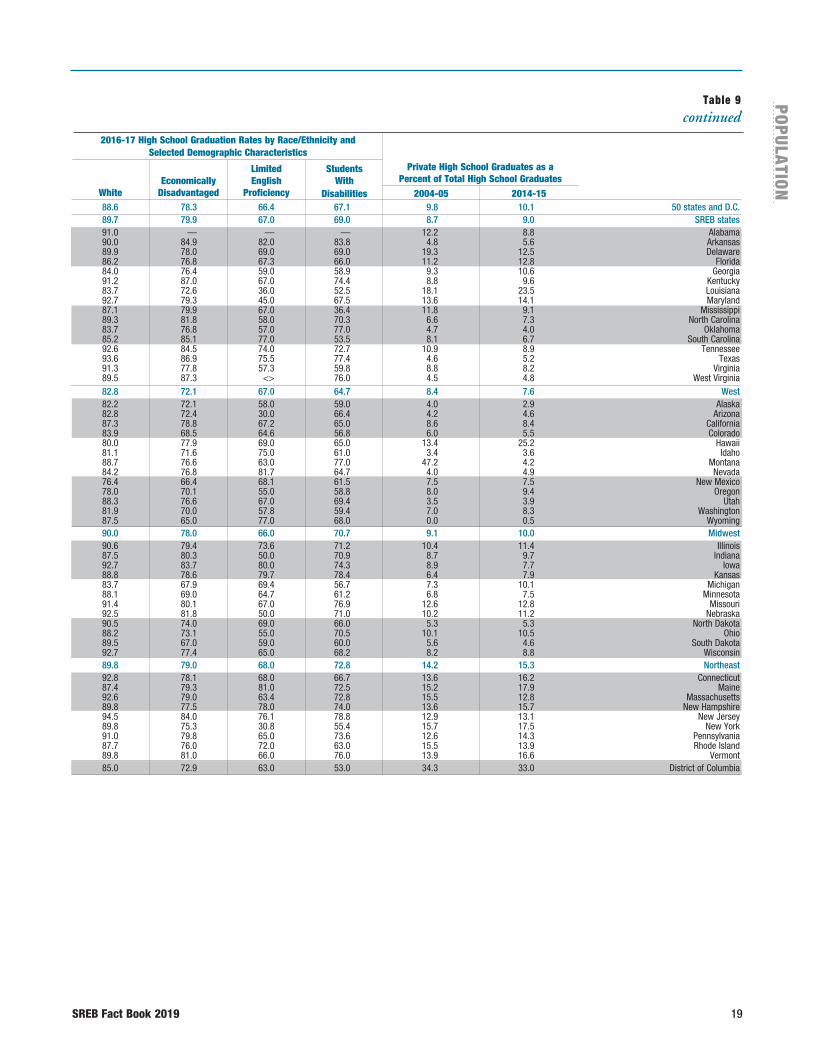
SREB Fact Book 2019 19
POPU
LATIO
N
White
Economically
Disadvantaged
Limited English
Proficiency
Students With
Disabilities 2004-05 2014-15
Table 9 continued
88.6 78.3 66.4 67.1 9.8 10.1 50 states and D.C. 89.7 79.9 67.0 69.0 8.7 9.0 SREB states 91.0 — — — 12.2 8.8 Alabama 90.0 84.9 82.0 83.8 4.8 5.6 Arkansas 89.9 78.0 69.0 69.0 19.3 12.5 Delaware 86.2 76.8 67.3 66.0 11.2 12.8 Florida 84.0 76.4 59.0 58.9 9.3 10.6 Georgia 91.2 87.0 67.0 74.4 8.8 9.6 Kentucky 83.7 72.6 36.0 52.5 18.1 23.5 Louisiana 92.7 79.3 45.0 67.5 13.6 14.1 Maryland 87.1 79.9 67.0 36.4 11.8 9.1 Mississippi 89.3 81.8 58.0 70.3 6.6 7.3 North Carolina 83.7 76.8 57.0 77.0 4.7 4.0 Oklahoma 85.2 85.1 77.0 53.5 8.1 6.7 South Carolina 92.6 84.5 74.0 72.7 10.9 8.9 Tennessee 93.6 86.9 75.5 77.4 4.6 5.2 Texas 91.3 77.8 57.3 59.8 8.8 8.2 Virginia 89.5 87.3 <> 76.0 4.5 4.8 West Virginia 82.8 72.1 67.0 64.7 8.4 7.6 West 82.2 72.1 58.0 59.0 4.0 2.9 Alaska 82.8 72.4 30.0 66.4 4.2 4.6 Arizona 87.3 78.8 67.2 65.0 8.6 8.4 California 83.9 68.5 64.6 56.8 6.0 5.5 Colorado 80.0 77.9 69.0 65.0 13.4 25.2 Hawaii 81.1 71.6 75.0 61.0 3.4 3.6 Idaho 88.7 76.6 63.0 77.0 47.2 4.2 Montana 84.2 76.8 81.7 64.7 4.0 4.9 Nevada 76.4 66.4 68.1 61.5 7.5 7.5 New Mexico 78.0 70.1 55.0 58.8 8.0 9.4 Oregon 88.3 76.6 67.0 69.4 3.5 3.9 Utah 81.9 70.0 57.8 59.4 7.0 8.3 Washington 87.5 65.0 77.0 68.0 0.0 0.5 Wyoming 90.0 78.0 66.0 70.7 9.1 10.0 Midwest 90.6 79.4 73.6 71.2 10.4 11.4 Illinois 87.5 80.3 50.0 70.9 8.7 9.7 Indiana 92.7 83.7 80.0 74.3 8.9 7.7 Iowa 88.8 78.6 79.7 78.4 6.4 7.9 Kansas 83.7 67.9 69.4 56.7 7.3 10.1 Michigan 88.1 69.0 64.7 61.2 6.8 7.5 Minnesota 91.4 80.1 67.0 76.9 12.6 12.8 Missouri 92.5 81.8 50.0 71.0 10.2 11.2 Nebraska 90.5 74.0 69.0 66.0 5.3 5.3 North Dakota 88.2 73.1 55.0 70.5 10.1 10.5 Ohio 89.5 67.0 59.0 60.0 5.6 4.6 South Dakota 92.7 77.4 65.0 68.2 8.2 8.8 Wisconsin 89.8 79.0 68.0 72.8 14.2 15.3 Northeast 92.8 78.1 68.0 66.7 13.6 16.2 Connecticut 87.4 79.3 81.0 72.5 15.2 17.9 Maine 92.6 79.0 63.4 72.8 15.5 12.8 Massachusetts 89.8 77.5 78.0 74.0 13.6 15.7 New Hampshire 94.5 84.0 76.1 78.8 12.9 13.1 New Jersey 89.8 75.3 30.8 55.4 15.7 17.5 New York 91.0 79.8 65.0 73.6 12.6 14.3 Pennsylvania 87.7 76.0 72.0 63.0 15.5 13.9 Rhode Island 89.8 81.0 66.0 76.0 13.9 16.6 Vermont 85.0 72.9 63.0 53.0 34.3 33.0 District of Columbia
2016-17 High School Graduation Rates by Race/Ethnicity and Selected Demographic Characteristics
Private High School Graduates as a Percent of Total High School Graduates
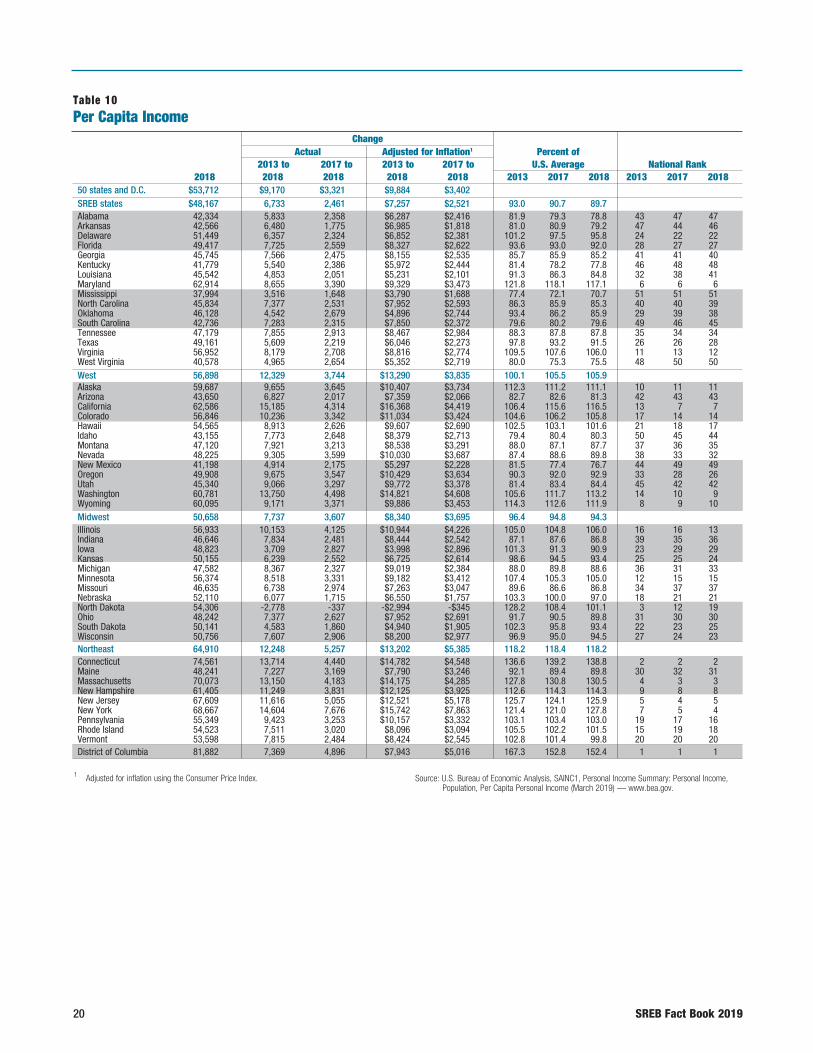
20 SREB Fact Book 2019
50 states and D.C. $53,712 $9,170 $3,321 $9,884 $3,402 SREB states $48,167 6,733 2,461 $7,257 $2,521 93.0 90.7 89.7 Alabama 42,334 5,833 2,358 $6,287 $2,416 81.9 79.3 78.8 43 47 47Arkansas 42,566 6,480 1,775 $6,985 $1,818 81.0 80.9 79.2 47 44 46Delaware 51,449 6,357 2,324 $6,852 $2,381 101.2 97.5 95.8 24 22 22Florida 49,417 7,725 2,559 $8,327 $2,622 93.6 93.0 92.0 28 27 27Georgia 45,745 7,566 2,475 $8,155 $2,535 85.7 85.9 85.2 41 41 40Kentucky 41,779 5,540 2,386 $5,972 $2,444 81.4 78.2 77.8 46 48 48Louisiana 45,542 4,853 2,051 $5,231 $2,101 91.3 86.3 84.8 32 38 41Maryland 62,914 8,655 3,390 $9,329 $3,473 121.8 118.1 117.1 6 6 6Mississippi 37,994 3,516 1,648 $3,790 $1,688 77.4 72.1 70.7 51 51 51North Carolina 45,834 7,377 2,531 $7,952 $2,593 86.3 85.9 85.3 40 40 39Oklahoma 46,128 4,542 2,679 $4,896 $2,744 93.4 86.2 85.9 29 39 38South Carolina 42,736 7,283 2,315 $7,850 $2,372 79.6 80.2 79.6 49 46 45Tennessee 47,179 7,855 2,913 $8,467 $2,984 88.3 87.8 87.8 35 34 34Texas 49,161 5,609 2,219 $6,046 $2,273 97.8 93.2 91.5 26 26 28Virginia 56,952 8,179 2,708 $8,816 $2,774 109.5 107.6 106.0 11 13 12West Virginia 40,578 4,965 2,654 $5,352 $2,719 80.0 75.3 75.5 48 50 50West 56,898 12,329 3,744 $13,290 $3,835 100.1 105.5 105.9 Alaska 59,687 9,655 3,645 $10,407 $3,734 112.3 111.2 111.1 10 11 11Arizona 43,650 6,827 2,017 $7,359 $2,066 82.7 82.6 81.3 42 43 43California 62,586 15,185 4,314 $16,368 $4,419 106.4 115.6 116.5 13 7 7Colorado 56,846 10,236 3,342 $11,034 $3,424 104.6 106.2 105.8 17 14 14Hawaii 54,565 8,913 2,626 $9,607 $2,690 102.5 103.1 101.6 21 18 17Idaho 43,155 7,773 2,648 $8,379 $2,713 79.4 80.4 80.3 50 45 44Montana 47,120 7,921 3,213 $8,538 $3,291 88.0 87.1 87.7 37 36 35Nevada 48,225 9,305 3,599 $10,030 $3,687 87.4 88.6 89.8 38 33 32New Mexico 41,198 4,914 2,175 $5,297 $2,228 81.5 77.4 76.7 44 49 49Oregon 49,908 9,675 3,547 $10,429 $3,634 90.3 92.0 92.9 33 28 26Utah 45,340 9,066 3,297 $9,772 $3,378 81.4 83.4 84.4 45 42 42Washington 60,781 13,750 4,498 $14,821 $4,608 105.6 111.7 113.2 14 10 9Wyoming 60,095 9,171 3,371 $9,886 $3,453 114.3 112.6 111.9 8 9 10Midwest 50,658 7,737 3,607 $8,340 $3,695 96.4 94.8 94.3 Illinois 56,933 10,153 4,125 $10,944 $4,226 105.0 104.8 106.0 16 16 13Indiana 46,646 7,834 2,481 $8,444 $2,542 87.1 87.6 86.8 39 35 36Iowa 48,823 3,709 2,827 $3,998 $2,896 101.3 91.3 90.9 23 29 29Kansas 50,155 6,239 2,552 $6,725 $2,614 98.6 94.5 93.4 25 25 24Michigan 47,582 8,367 2,327 $9,019 $2,384 88.0 89.8 88.6 36 31 33Minnesota 56,374 8,518 3,331 $9,182 $3,412 107.4 105.3 105.0 12 15 15Missouri 46,635 6,738 2,974 $7,263 $3,047 89.6 86.6 86.8 34 37 37Nebraska 52,110 6,077 1,715 $6,550 $1,757 103.3 100.0 97.0 18 21 21North Dakota 54,306 -2,778 -337 -$2,994 -$345 128.2 108.4 101.1 3 12 19Ohio 48,242 7,377 2,627 $7,952 $2,691 91.7 90.5 89.8 31 30 30South Dakota 50,141 4,583 1,860 $4,940 $1,905 102.3 95.8 93.4 22 23 25Wisconsin 50,756 7,607 2,906 $8,200 $2,977 96.9 95.0 94.5 27 24 23Northeast 64,910 12,248 5,257 $13,202 $5,385 118.2 118.4 118.2 Connecticut 74,561 13,714 4,440 $14,782 $4,548 136.6 139.2 138.8 2 2 2Maine 48,241 7,227 3,169 $7,790 $3,246 92.1 89.4 89.8 30 32 31Massachusetts 70,073 13,150 4,183 $14,175 $4,285 127.8 130.8 130.5 4 3 3New Hampshire 61,405 11,249 3,831 $12,125 $3,925 112.6 114.3 114.3 9 8 8New Jersey 67,609 11,616 5,055 $12,521 $5,178 125.7 124.1 125.9 5 4 5New York 68,667 14,604 7,676 $15,742 $7,863 121.4 121.0 127.8 7 5 4Pennsylvania 55,349 9,423 3,253 $10,157 $3,332 103.1 103.4 103.0 19 17 16Rhode Island 54,523 7,511 3,020 $8,096 $3,094 105.5 102.2 101.5 15 19 18Vermont 53,598 7,815 2,484 $8,424 $2,545 102.8 101.4 99.8 20 20 20District of Columbia 81,882 7,369 4,896 $7,943 $5,016 167.3 152.8 152.4 1 1 1
1 Adjusted for inflation using the Consumer Price Index. Source: U.S. Bureau of Economic Analysis, SAINC1, Personal Income Summary: Personal Income, Population, Per Capita Personal Income (March 2019) — www.bea.gov.
Table 10Per Capita Income
Change Actual Adjusted for Inflation1 Percent of
2013 to 2017 to 2013 to 2017 to U.S. Average National Rank 2018 2018 2018 2018 2018 2013 2017 2018 2013 2017 2018
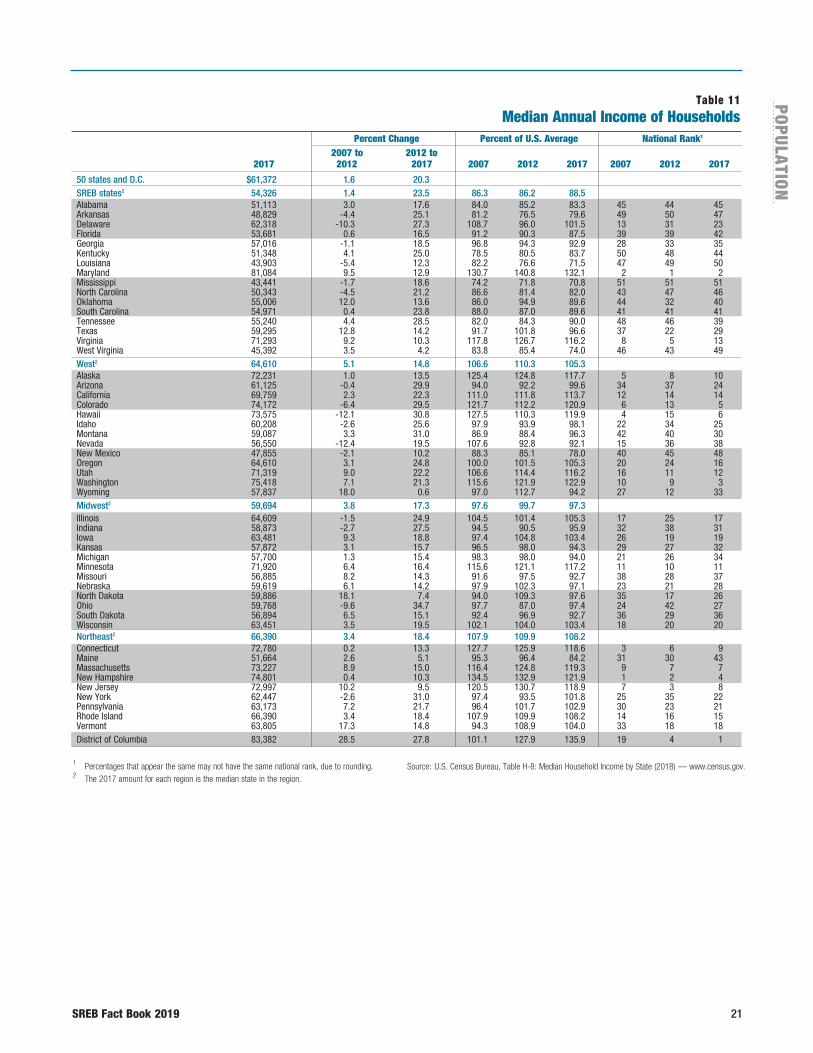
SREB Fact Book 2019 21
POPU
LATIO
N
Table 11Median Annual Income of Households
50 states and D.C. $61,372 1.6 20.3 SREB states2 54,326 1.4 23.5 86.3 86.2 88.5 Alabama 51,113 3.0 17.6 84.0 85.2 83.3 45 44 45Arkansas 48,829 -4.4 25.1 81.2 76.5 79.6 49 50 47Delaware 62,318 -10.3 27.3 108.7 96.0 101.5 13 31 23Florida 53,681 0.6 16.5 91.2 90.3 87.5 39 39 42Georgia 57,016 -1.1 18.5 96.8 94.3 92.9 28 33 35Kentucky 51,348 4.1 25.0 78.5 80.5 83.7 50 48 44Louisiana 43,903 -5.4 12.3 82.2 76.6 71.5 47 49 50Maryland 81,084 9.5 12.9 130.7 140.8 132.1 2 1 2Mississippi 43,441 -1.7 18.6 74.2 71.8 70.8 51 51 51North Carolina 50,343 -4.5 21.2 86.6 81.4 82.0 43 47 46Oklahoma 55,006 12.0 13.6 86.0 94.9 89.6 44 32 40South Carolina 54,971 0.4 23.8 88.0 87.0 89.6 41 41 41Tennessee 55,240 4.4 28.5 82.0 84.3 90.0 48 46 39Texas 59,295 12.8 14.2 91.7 101.8 96.6 37 22 29Virginia 71,293 9.2 10.3 117.8 126.7 116.2 8 5 13West Virginia 45,392 3.5 4.2 83.8 85.4 74.0 46 43 49West2 64,610 5.1 14.8 106.6 110.3 105.3 Alaska 72,231 1.0 13.5 125.4 124.8 117.7 5 8 10Arizona 61,125 -0.4 29.9 94.0 92.2 99.6 34 37 24California 69,759 2.3 22.3 111.0 111.8 113.7 12 14 14Colorado 74,172 -6.4 29.5 121.7 112.2 120.9 6 13 5Hawaii 73,575 -12.1 30.8 127.5 110.3 119.9 4 15 6Idaho 60,208 -2.6 25.6 97.9 93.9 98.1 22 34 25Montana 59,087 3.3 31.0 86.9 88.4 96.3 42 40 30Nevada 56,550 -12.4 19.5 107.6 92.8 92.1 15 36 38New Mexico 47,855 -2.1 10.2 88.3 85.1 78.0 40 45 48Oregon 64,610 3.1 24.8 100.0 101.5 105.3 20 24 16Utah 71,319 9.0 22.2 106.6 114.4 116.2 16 11 12Washington 75,418 7.1 21.3 115.6 121.9 122.9 10 9 3Wyoming 57,837 18.0 0.6 97.0 112.7 94.2 27 12 33Midwest2 59,694 3.8 17.3 97.6 99.7 97.3 Illinois 64,609 -1.5 24.9 104.5 101.4 105.3 17 25 17Indiana 58,873 -2.7 27.5 94.5 90.5 95.9 32 38 31Iowa 63,481 9.3 18.8 97.4 104.8 103.4 26 19 19Kansas 57,872 3.1 15.7 96.5 98.0 94.3 29 27 32Michigan 57,700 1.3 15.4 98.3 98.0 94.0 21 26 34Minnesota 71,920 6.4 16.4 115.6 121.1 117.2 11 10 11Missouri 56,885 8.2 14.3 91.6 97.5 92.7 38 28 37Nebraska 59,619 6.1 14.2 97.9 102.3 97.1 23 21 28North Dakota 59,886 18.1 7.4 94.0 109.3 97.6 35 17 26Ohio 59,768 -9.6 34.7 97.7 87.0 97.4 24 42 27South Dakota 56,894 6.5 15.1 92.4 96.9 92.7 36 29 36Wisconsin 63,451 3.5 19.5 102.1 104.0 103.4 18 20 20Northeast2 66,390 3.4 18.4 107.9 109.9 108.2 Connecticut 72,780 0.2 13.3 127.7 125.9 118.6 3 6 9Maine 51,664 2.6 5.1 95.3 96.4 84.2 31 30 43Massachusetts 73,227 8.9 15.0 116.4 124.8 119.3 9 7 7New Hampshire 74,801 0.4 10.3 134.5 132.9 121.9 1 2 4New Jersey 72,997 10.2 9.5 120.5 130.7 118.9 7 3 8New York 62,447 -2.6 31.0 97.4 93.5 101.8 25 35 22Pennsylvania 63,173 7.2 21.7 96.4 101.7 102.9 30 23 21Rhode Island 66,390 3.4 18.4 107.9 109.9 108.2 14 16 15Vermont 63,805 17.3 14.8 94.3 108.9 104.0 33 18 18District of Columbia 83,382 28.5 27.8 101.1 127.9 135.9 19 4 1
1 Percentages that appear the same may not have the same national rank, due to rounding.2 The 2017 amount for each region is the median state in the region.
Source: U.S. Census Bureau, Table H-8: Median Household Income by State (2018) — www.census.gov.
Percent Change Percent of U.S. Average National Rank1
2007 to 2012 to 2017 2012 2017 2007 2012 2017 2007 2012 2017

22 SREB Fact Book 2019
50 states and D.C. 13.4 -1.6 18.4 13,552,590 -3,105,459
SREB states3 15.2 -1.9 21.4 6,059,329 -1,135,505as a percent of U.S. 113.4 116.0 44.7 36.6Alabama 16.9 16 6 0.7 24.6 269,486 5 6 -37,823Arkansas 16.4 7 8 -1.6 22.5 158,747 3 8 -43,738Delaware 13.6 31 20 0.5 18.5 37,830 37 21 2,232Florida 14.0 20 18 -1.4 20.3 853,003 14 16 -166,152Georgia 14.9 5 12 -3.5 21.0 528,087 6 13 -148,603Kentucky 17.2 10 5 0.0 22.4 226,361 9 9 -43,237Louisiana 19.7 1 2 -1.5 28.0 310,353 4 1 -2,855Maryland 9.3 48 50 -0.7 12.0 161,701 50 45 -24,080Mississippi 19.8 2 1 -0.8 26.9 191,950 1 3 -65,851North Carolina 14.7 13 14 -2.0 21.2 488,097 11 11 -105,774Oklahoma 15.8 17 9 -0.3 21.5 206,246 17 10 -20,272South Carolina 15.4 9 10 -2.1 22.6 249,656 8 7 -40,179Tennessee 15.0 10 11 -2.2 21.2 319,590 12 11 -65,523Texas 14.7 8 14 -2.9 20.9 1,539,502 12 14 -262,836Virginia 10.6 41 41 -0.3 14.0 261,685 45 37 -23,098West Virginia 19.1 12 4 2.1 25.9 95,757 16 4 1,286West3 12.5 -1.6 14.9 2,663,372 -959,910as a percent of U.S. 93.3 81.0 19.7 30.9Alaska 11.1 38 36 -0.3 14.9 27,554 49 31 1,400Arizona 14.9 6 12 -3.4 20.8 339,766 7 15 -96,864California 13.3 14 23 -3.1 18.1 1,639,885 19 24 -551,859Colorado 10.3 35 43 -2.2 12.0 151,420 32 45 -76,660Hawaii 9.5 34 48 -3.3 11.5 35,161 38 48 -17,162Idaho 12.8 25 27 -1.9 15.3 67,900 26 30 -20,525Montana 12.5 23 29 -2.3 14.7 33,647 28 33 -11,603Nevada 13.0 18 25 -2.9 18.5 126,811 18 21 -31,507New Mexico 19.7 3 2 -0.6 27.2 132,760 2 2 -17,348Oregon 13.2 27 24 -0.9 16.5 144,147 21 29 -53,632Utah 9.7 44 46 -1.0 10.7 99,157 46 50 -35,018Washington 11.0 36 38 -0.9 14.3 235,352 32 35 -58,512Wyoming 11.3 48 33 1.3 13.3 18,152 39 41 -4,921Midwest3 12.3 -1.4 15.7 2,437,833 -511,883as a percent of U.S. 91.4 85.3 18.0 16.5Illinois 12.6 29 28 -1.0 17.0 492,521 26 25 -140,286Indiana 13.5 19 21 -2.2 18.4 289,507 24 23 -66,575Iowa 10.7 46 40 0.4 12.3 90,029 40 44 -25,073Kansas 11.9 26 31 -2.4 14.8 105,456 31 32 -32,611Michigan 14.2 23 16 -0.6 19.7 428,800 15 18 -136,272Minnesota 9.5 46 48 -0.8 11.8 153,242 48 47 -33,354Missouri 13.4 22 22 -1.8 18.6 257,233 23 20 -60,301Nebraska 10.8 41 39 -0.1 14.1 67,078 35 36 -15,740North Dakota 10.3 39 43 -1.0 10.9 19,159 51 49 -1,534Ohio 14.0 21 18 -1.3 20.1 523,652 19 17 -111,362South Dakota 13.0 29 25 -0.6 16.6 35,666 36 27 -261Wisconsin 11.3 37 33 -0.2 14.5 185,983 34 34 -53,549Northeast3 11.1 -0.1 13.8 1,621,138 -268,629as a percent of U.S. 82.8 75.0 12.0 8.7Connecticut 9.6 50 47 -0.1 12.6 93,722 47 43 -23,932Maine 11.1 32 36 -1.9 13.1 33,095 25 42 -22,258Massachusetts 10.5 41 42 -0.4 13.5 184,944 43 40 -30,566New Hampshire 7.7 51 51 0.3 10.3 26,654 41 51 -16,374New Jersey 10.0 45 45 -0.6 13.9 275,084 43 38 -38,323New York 14.1 14 17 -2.3 19.7 818,436 22 18 -153,914Pennsylvania 12.5 33 29 -0.4 17.0 452,968 29 25 -86,400Rhode Island 11.6 28 32 -2.1 16.6 34,417 30 27 -7,818Vermont 11.3 40 33 0.1 13.8 16,122 42 39 -3,184District of Columbia 16.6 4 7 -2.7 25.6 31,870 9 5 3,345
Table 12Poverty Rates in the Population and Among Children
Overall Poverty Rate1 Poverty Among Children Under 182 Change Change in (in percentage Number of Children National Rank points) Rate Estimated National Rank in Poverty 2017 2012 2017 2012 to 2017 2017 Number 2012 2017 2012 to 2017
1 The poverty rates for 2012 are 3-year estimates. The 2012 figures are averages of the 2010, 2011 and 2012 estimates. The Census Bureau no longer produces 3-year estimates of poverty rates, so the 2017 figures are 1-year estimates.
2 In 2017, an annual income of $24,600 was the federally defined poverty threshold for families of four with children in the 48 contiguous states and D.C.
3 The regional rates are the median state rates in each region. The regional total estimated number of children in poverty may not equal the sum of the numbers shown, due to rounding.
Sources: U.S. Census Bureau, American Fact Finder, American Community Survey 2017, Table S1701, Percent of Children Under 18 Years Below Poverty Level in the Past 12 Months (2018) — www.census.gov.
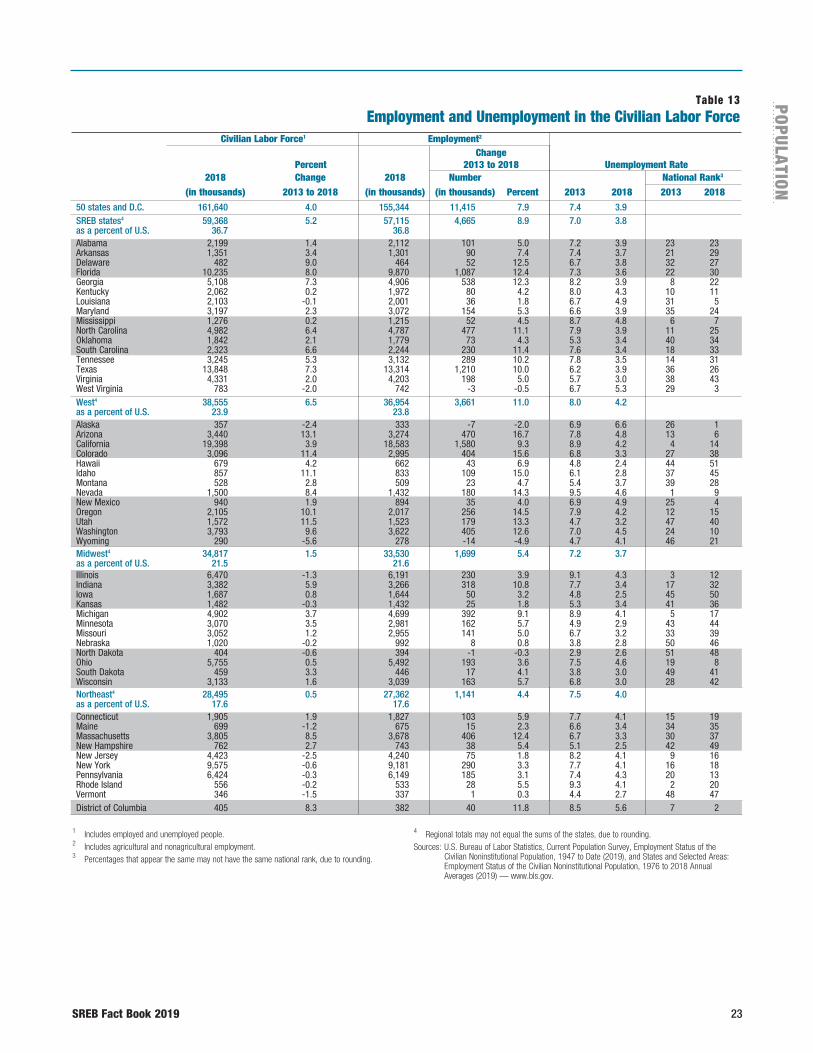
SREB Fact Book 2019 23
POPU
LATIO
N
Table 13Employment and Unemployment in the Civilian Labor Force
Civilian Labor Force1 Employment2 Change Percent 2013 to 2018 Unemployment Rate 2018 Change 2018 Number National Rank3
(in thousands) 2013 to 2018 (in thousands) (in thousands) Percent 2013 2018 2013 2018
50 states and D.C. 161,640 4.0 155,344 11,415 7.9 7.4 3.9 SREB states4 59,368 5.2 57,115 4,665 8.9 7.0 3.8 as a percent of U.S. 36.7 36.8 Alabama 2,199 1.4 2,112 101 5.0 7.2 3.9 23 23Arkansas 1,351 3.4 1,301 90 7.4 7.4 3.7 21 29Delaware 482 9.0 464 52 12.5 6.7 3.8 32 27Florida 10,235 8.0 9,870 1,087 12.4 7.3 3.6 22 30Georgia 5,108 7.3 4,906 538 12.3 8.2 3.9 8 22Kentucky 2,062 0.2 1,972 80 4.2 8.0 4.3 10 11Louisiana 2,103 -0.1 2,001 36 1.8 6.7 4.9 31 5Maryland 3,197 2.3 3,072 154 5.3 6.6 3.9 35 24Mississippi 1,276 0.2 1,215 52 4.5 8.7 4.8 6 7North Carolina 4,982 6.4 4,787 477 11.1 7.9 3.9 11 25Oklahoma 1,842 2.1 1,779 73 4.3 5.3 3.4 40 34South Carolina 2,323 6.6 2,244 230 11.4 7.6 3.4 18 33Tennessee 3,245 5.3 3,132 289 10.2 7.8 3.5 14 31Texas 13,848 7.3 13,314 1,210 10.0 6.2 3.9 36 26Virginia 4,331 2.0 4,203 198 5.0 5.7 3.0 38 43West Virginia 783 -2.0 742 -3 -0.5 6.7 5.3 29 3West4 38,555 6.5 36,954 3,661 11.0 8.0 4.2 as a percent of U.S. 23.9 23.8 Alaska 357 -2.4 333 -7 -2.0 6.9 6.6 26 1Arizona 3,440 13.1 3,274 470 16.7 7.8 4.8 13 6California 19,398 3.9 18,583 1,580 9.3 8.9 4.2 4 14Colorado 3,096 11.4 2,995 404 15.6 6.8 3.3 27 38Hawaii 679 4.2 662 43 6.9 4.8 2.4 44 51Idaho 857 11.1 833 109 15.0 6.1 2.8 37 45Montana 528 2.8 509 23 4.7 5.4 3.7 39 28Nevada 1,500 8.4 1,432 180 14.3 9.5 4.6 1 9New Mexico 940 1.9 894 35 4.0 6.9 4.9 25 4Oregon 2,105 10.1 2,017 256 14.5 7.9 4.2 12 15Utah 1,572 11.5 1,523 179 13.3 4.7 3.2 47 40Washington 3,793 9.6 3,622 405 12.6 7.0 4.5 24 10Wyoming 290 -5.6 278 -14 -4.9 4.7 4.1 46 21Midwest4 34,817 1.5 33,530 1,699 5.4 7.2 3.7 as a percent of U.S. 21.5 21.6 Illinois 6,470 -1.3 6,191 230 3.9 9.1 4.3 3 12Indiana 3,382 5.9 3,266 318 10.8 7.7 3.4 17 32Iowa 1,687 0.8 1,644 50 3.2 4.8 2.5 45 50Kansas 1,482 -0.3 1,432 25 1.8 5.3 3.4 41 36Michigan 4,902 3.7 4,699 392 9.1 8.9 4.1 5 17Minnesota 3,070 3.5 2,981 162 5.7 4.9 2.9 43 44Missouri 3,052 1.2 2,955 141 5.0 6.7 3.2 33 39Nebraska 1,020 -0.2 992 8 0.8 3.8 2.8 50 46North Dakota 404 -0.6 394 -1 -0.3 2.9 2.6 51 48Ohio 5,755 0.5 5,492 193 3.6 7.5 4.6 19 8South Dakota 459 3.3 446 17 4.1 3.8 3.0 49 41Wisconsin 3,133 1.6 3,039 163 5.7 6.8 3.0 28 42Northeast4 28,495 0.5 27,362 1,141 4.4 7.5 4.0 as a percent of U.S. 17.6 17.6 Connecticut 1,905 1.9 1,827 103 5.9 7.7 4.1 15 19Maine 699 -1.2 675 15 2.3 6.6 3.4 34 35Massachusetts 3,805 8.5 3,678 406 12.4 6.7 3.3 30 37New Hampshire 762 2.7 743 38 5.4 5.1 2.5 42 49New Jersey 4,423 -2.5 4,240 75 1.8 8.2 4.1 9 16New York 9,575 -0.6 9,181 290 3.3 7.7 4.1 16 18Pennsylvania 6,424 -0.3 6,149 185 3.1 7.4 4.3 20 13Rhode Island 556 -0.2 533 28 5.5 9.3 4.1 2 20Vermont 346 -1.5 337 1 0.3 4.4 2.7 48 47District of Columbia 405 8.3 382 40 11.8 8.5 5.6 7 2
1 Includes employed and unemployed people. 2 Includes agricultural and nonagricultural employment.3 Percentages that appear the same may not have the same national rank, due to rounding.
4 Regional totals may not equal the sums of the states, due to rounding.Sources: U.S. Bureau of Labor Statistics, Current Population Survey, Employment Status of the Civilian Noninstitutional Population, 1947 to Date (2019), and States and Selected Areas: Employment Status of the Civilian Noninstitutional Population, 1976 to 2018 Annual Averages (2019) — www.bls.gov.
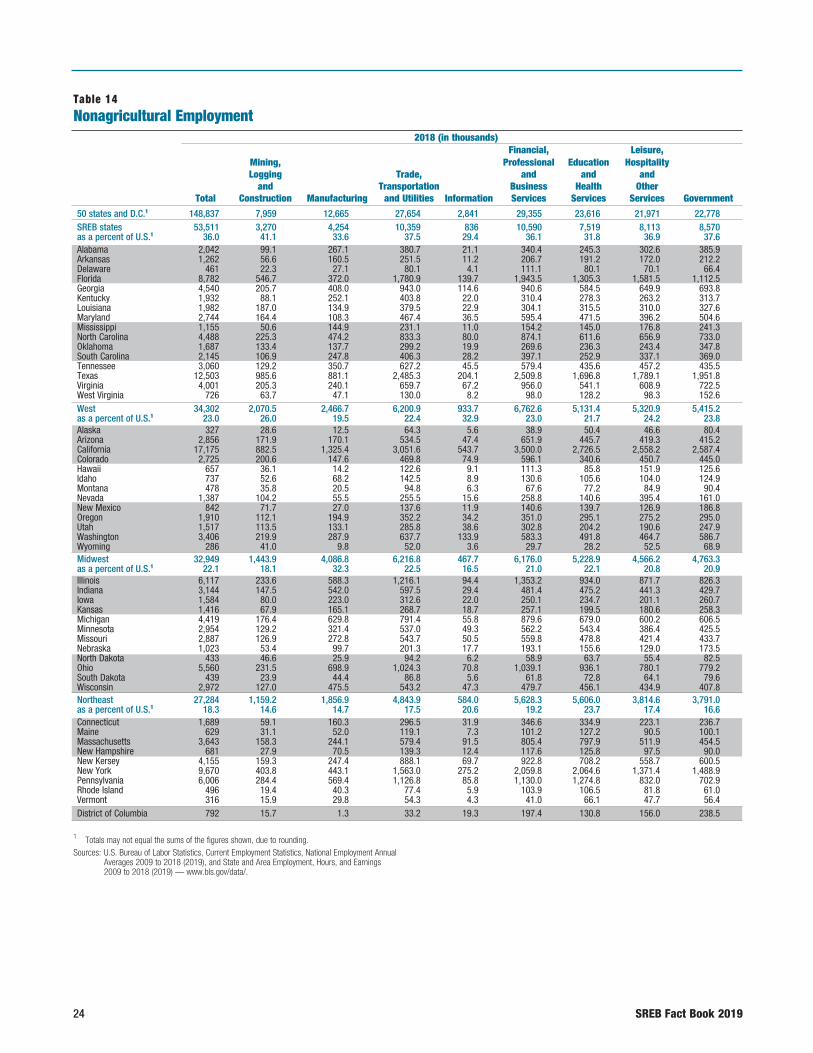
24 SREB Fact Book 2019
Table 14Nonagricultural Employment
50 states and D.C.1 148,837 7,959 12,665 27,654 2,841 29,355 23,616 21,971 22,778SREB states 53,511 3,270 4,254 10,359 836 10,590 7,519 8,113 8,570as a percent of U.S.1 36.0 41.1 33.6 37.5 29.4 36.1 31.8 36.9 37.6Alabama 2,042 99.1 267.1 380.7 21.1 340.4 245.3 302.6 385.9Arkansas 1,262 56.6 160.5 251.5 11.2 206.7 191.2 172.0 212.2Delaware 461 22.3 27.1 80.1 4.1 111.1 80.1 70.1 66.4Florida 8,782 546.7 372.0 1,780.9 139.7 1,943.5 1,305.3 1,581.5 1,112.5Georgia 4,540 205.7 408.0 943.0 114.6 940.6 584.5 649.9 693.8Kentucky 1,932 88.1 252.1 403.8 22.0 310.4 278.3 263.2 313.7Louisiana 1,982 187.0 134.9 379.5 22.9 304.1 315.5 310.0 327.6Maryland 2,744 164.4 108.3 467.4 36.5 595.4 471.5 396.2 504.6Mississippi 1,155 50.6 144.9 231.1 11.0 154.2 145.0 176.8 241.3North Carolina 4,488 225.3 474.2 833.3 80.0 874.1 611.6 656.9 733.0Oklahoma 1,687 133.4 137.7 299.2 19.9 269.6 236.3 243.4 347.8South Carolina 2,145 106.9 247.8 406.3 28.2 397.1 252.9 337.1 369.0Tennessee 3,060 129.2 350.7 627.2 45.5 579.4 435.6 457.2 435.5Texas 12,503 985.6 881.1 2,485.3 204.1 2,509.8 1,696.8 1,789.1 1,951.8Virginia 4,001 205.3 240.1 659.7 67.2 956.0 541.1 608.9 722.5West Virginia 726 63.7 47.1 130.0 8.2 98.0 128.2 98.3 152.6West 34,302 2,070.5 2,466.7 6,200.9 933.7 6,762.6 5,131.4 5,320.9 5,415.2as a percent of U.S.1 23.0 26.0 19.5 22.4 32.9 23.0 21.7 24.2 23.8Alaska 327 28.6 12.5 64.3 5.6 38.9 50.4 46.6 80.4Arizona 2,856 171.9 170.1 534.5 47.4 651.9 445.7 419.3 415.2California 17,175 882.5 1,325.4 3,051.6 543.7 3,500.0 2,726.5 2,558.2 2,587.4Colorado 2,725 200.6 147.6 469.8 74.9 596.1 340.6 450.7 445.0Hawaii 657 36.1 14.2 122.6 9.1 111.3 85.8 151.9 125.6Idaho 737 52.6 68.2 142.5 8.9 130.6 105.6 104.0 124.9Montana 478 35.8 20.5 94.8 6.3 67.6 77.2 84.9 90.4Nevada 1,387 104.2 55.5 255.5 15.6 258.8 140.6 395.4 161.0New Mexico 842 71.7 27.0 137.6 11.9 140.6 139.7 126.9 186.8Oregon 1,910 112.1 194.9 352.2 34.2 351.0 295.1 275.2 295.0Utah 1,517 113.5 133.1 285.8 38.6 302.8 204.2 190.6 247.9Washington 3,406 219.9 287.9 637.7 133.9 583.3 491.8 464.7 586.7Wyoming 286 41.0 9.8 52.0 3.6 29.7 28.2 52.5 68.9Midwest 32,949 1,443.9 4,086.8 6,216.8 467.7 6,176.0 5,228.9 4,566.2 4,763.3as a percent of U.S.1 22.1 18.1 32.3 22.5 16.5 21.0 22.1 20.8 20.9Illinois 6,117 233.6 588.3 1,216.1 94.4 1,353.2 934.0 871.7 826.3Indiana 3,144 147.5 542.0 597.5 29.4 481.4 475.2 441.3 429.7Iowa 1,584 80.0 223.0 312.6 22.0 250.1 234.7 201.1 260.7Kansas 1,416 67.9 165.1 268.7 18.7 257.1 199.5 180.6 258.3Michigan 4,419 176.4 629.8 791.4 55.8 879.6 679.0 600.2 606.5Minnesota 2,954 129.2 321.4 537.0 49.3 562.2 543.4 386.4 425.5Missouri 2,887 126.9 272.8 543.7 50.5 559.8 478.8 421.4 433.7Nebraska 1,023 53.4 99.7 201.3 17.7 193.1 155.6 129.0 173.5North Dakota 433 46.6 25.9 94.2 6.2 58.9 63.7 55.4 82.5Ohio 5,560 231.5 698.9 1,024.3 70.8 1,039.1 936.1 780.1 779.2South Dakota 439 23.9 44.4 86.8 5.6 61.8 72.8 64.1 79.6Wisconsin 2,972 127.0 475.5 543.2 47.3 479.7 456.1 434.9 407.8Northeast 27,284 1,159.2 1,856.9 4,843.9 584.0 5,628.3 5,606.0 3,814.6 3,791.0as a percent of U.S.1 18.3 14.6 14.7 17.5 20.6 19.2 23.7 17.4 16.6Connecticut 1,689 59.1 160.3 296.5 31.9 346.6 334.9 223.1 236.7Maine 629 31.1 52.0 119.1 7.3 101.2 127.2 90.5 100.1Massachusetts 3,643 158.3 244.1 579.4 91.5 805.4 797.9 511.9 454.5New Hampshire 681 27.9 70.5 139.3 12.4 117.6 125.8 97.5 90.0New Kersey 4,155 159.3 247.4 888.1 69.7 922.8 708.2 558.7 600.5New York 9,670 403.8 443.1 1,563.0 275.2 2,059.8 2,064.6 1,371.4 1,488.9Pennsylvania 6,006 284.4 569.4 1,126.8 85.8 1,130.0 1,274.8 832.0 702.9Rhode Island 496 19.4 40.3 77.4 5.9 103.9 106.5 81.8 61.0Vermont 316 15.9 29.8 54.3 4.3 41.0 66.1 47.7 56.4District of Columbia 792 15.7 1.3 33.2 19.3 197.4 130.8 156.0 238.5
2018 (in thousands) Financial, Leisure, Mining, Professional Education Hospitality Logging Trade, and and and and Transportation Business Health Other Total Construction Manufacturing and Utilities Information Services Services Services Government
1 Totals may not equal the sums of the figures shown, due to rounding.Sources: U.S. Bureau of Labor Statistics, Current Employment Statistics, National Employment Annual Averages 2009 to 2018 (2019), and State and Area Employment, Hours, and Earnings 2009 to 2018 (2019) — www.bls.gov/data/.
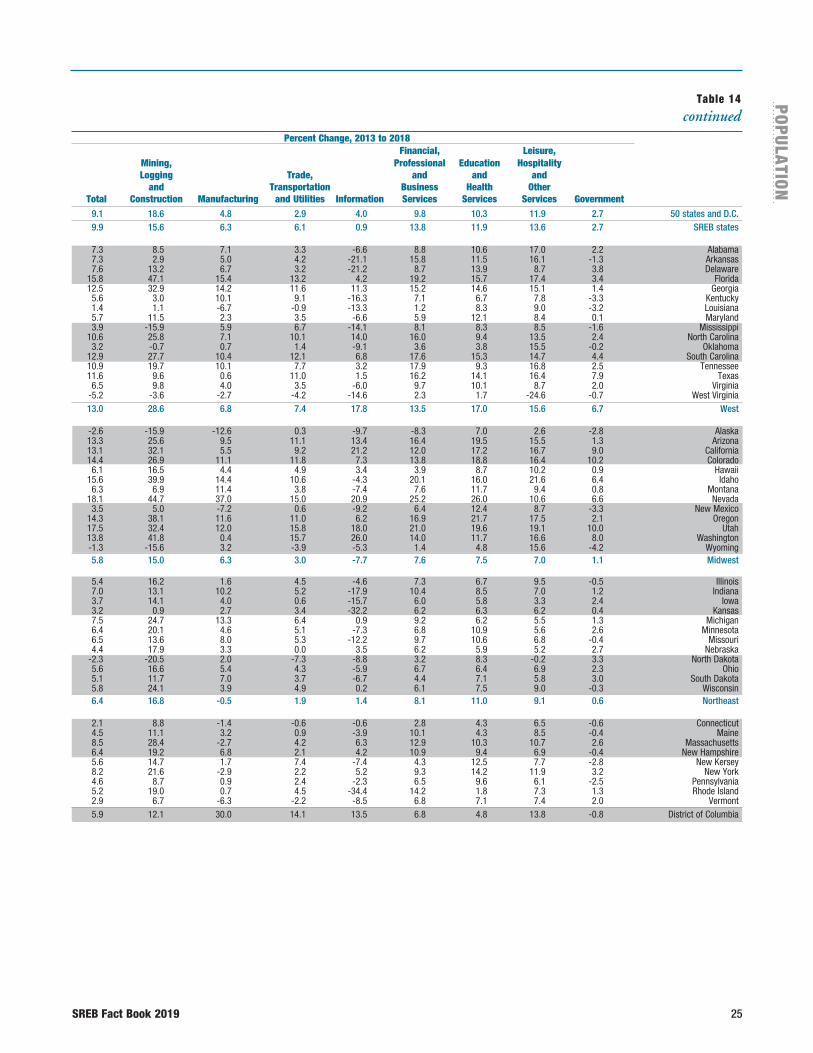
SREB Fact Book 2019 25
POPU
LATIO
N
Table 14 continued
9.1 18.6 4.8 2.9 4.0 9.8 10.3 11.9 2.7 50 states and D.C. 9.9 15.6 6.3 6.1 0.9 13.8 11.9 13.6 2.7 SREB states 7.3 8.5 7.1 3.3 -6.6 8.8 10.6 17.0 2.2 Alabama 7.3 2.9 5.0 4.2 -21.1 15.8 11.5 16.1 -1.3 Arkansas 7.6 13.2 6.7 3.2 -21.2 8.7 13.9 8.7 3.8 Delaware 15.8 47.1 15.4 13.2 4.2 19.2 15.7 17.4 3.4 Florida 12.5 32.9 14.2 11.6 11.3 15.2 14.6 15.1 1.4 Georgia 5.6 3.0 10.1 9.1 -16.3 7.1 6.7 7.8 -3.3 Kentucky 1.4 1.1 -6.7 -0.9 -13.3 1.2 8.3 9.0 -3.2 Louisiana 5.7 11.5 2.3 3.5 -6.6 5.9 12.1 8.4 0.1 Maryland 3.9 -15.9 5.9 6.7 -14.1 8.1 8.3 8.5 -1.6 Mississippi 10.6 25.8 7.1 10.1 14.0 16.0 9.4 13.5 2.4 North Carolina 3.2 -0.7 0.7 1.4 -9.1 3.6 3.8 15.5 -0.2 Oklahoma 12.9 27.7 10.4 12.1 6.8 17.6 15.3 14.7 4.4 South Carolina 10.9 19.7 10.1 7.7 3.2 17.9 9.3 16.8 2.5 Tennessee 11.6 9.6 0.6 11.0 1.5 16.2 14.1 16.4 7.9 Texas 6.5 9.8 4.0 3.5 -6.0 9.7 10.1 8.7 2.0 Virginia -5.2 -3.6 -2.7 -4.2 -14.6 2.3 1.7 -24.6 -0.7 West Virginia 13.0 28.6 6.8 7.4 17.8 13.5 17.0 15.6 6.7 West -2.6 -15.9 -12.6 0.3 -9.7 -8.3 7.0 2.6 -2.8 Alaska 13.3 25.6 9.5 11.1 13.4 16.4 19.5 15.5 1.3 Arizona 13.1 32.1 5.5 9.2 21.2 12.0 17.2 16.7 9.0 California 14.4 26.9 11.1 11.8 7.3 13.8 18.8 16.4 10.2 Colorado 6.1 16.5 4.4 4.9 3.4 3.9 8.7 10.2 0.9 Hawaii 15.6 39.9 14.4 10.6 -4.3 20.1 16.0 21.6 6.4 Idaho 6.3 6.9 11.4 3.8 -7.4 7.6 11.7 9.4 0.8 Montana 18.1 44.7 37.0 15.0 20.9 25.2 26.0 10.6 6.6 Nevada 3.5 5.0 -7.2 0.6 -9.2 6.4 12.4 8.7 -3.3 New Mexico 14.3 38.1 11.6 11.0 6.2 16.9 21.7 17.5 2.1 Oregon 17.5 32.4 12.0 15.8 18.0 21.0 19.6 19.1 10.0 Utah 13.8 41.8 0.4 15.7 26.0 14.0 11.7 16.6 8.0 Washington -1.3 -15.6 3.2 -3.9 -5.3 1.4 4.8 15.6 -4.2 Wyoming 5.8 15.0 6.3 3.0 -7.7 7.6 7.5 7.0 1.1 Midwest 5.4 16.2 1.6 4.5 -4.6 7.3 6.7 9.5 -0.5 Illinois 7.0 13.1 10.2 5.2 -17.9 10.4 8.5 7.0 1.2 Indiana 3.7 14.1 4.0 0.6 -15.7 6.0 5.8 3.3 2.4 Iowa 3.2 0.9 2.7 3.4 -32.2 6.2 6.3 6.2 0.4 Kansas 7.5 24.7 13.3 6.4 0.9 9.2 6.2 5.5 1.3 Michigan 6.4 20.1 4.6 5.1 -7.3 6.8 10.9 5.6 2.6 Minnesota 6.5 13.6 8.0 5.3 -12.2 9.7 10.6 6.8 -0.4 Missouri 4.4 17.9 3.3 0.0 3.5 6.2 5.9 5.2 2.7 Nebraska -2.3 -20.5 2.0 -7.3 -8.8 3.2 8.3 -0.2 3.3 North Dakota 5.6 16.6 5.4 4.3 -5.9 6.7 6.4 6.9 2.3 Ohio 5.1 11.7 7.0 3.7 -6.7 4.4 7.1 5.8 3.0 South Dakota 5.8 24.1 3.9 4.9 0.2 6.1 7.5 9.0 -0.3 Wisconsin 6.4 16.8 -0.5 1.9 1.4 8.1 11.0 9.1 0.6 Northeast 2.1 8.8 -1.4 -0.6 -0.6 2.8 4.3 6.5 -0.6 Connecticut 4.5 11.1 3.2 0.9 -3.9 10.1 4.3 8.5 -0.4 Maine 8.5 28.4 -2.7 4.2 6.3 12.9 10.3 10.7 2.6 Massachusetts 6.4 19.2 6.8 2.1 4.2 10.9 9.4 6.9 -0.4 New Hampshire 5.6 14.7 1.7 7.4 -7.4 4.3 12.5 7.7 -2.8 New Kersey 8.2 21.6 -2.9 2.2 5.2 9.3 14.2 11.9 3.2 New York 4.6 8.7 0.9 2.4 -2.3 6.5 9.6 6.1 -2.5 Pennsylvania 5.2 19.0 0.7 4.5 -34.4 14.2 1.8 7.3 1.3 Rhode Island 2.9 6.7 -6.3 -2.2 -8.5 6.8 7.1 7.4 2.0 Vermont 5.9 12.1 30.0 14.1 13.5 6.8 4.8 13.8 -0.8 District of Columbia
Percent Change, 2013 to 2018 Financial, Leisure, Mining, Professional Education Hospitality Logging Trade, and and and and Transportation Business Health Other Total Construction Manufacturing and Utilities Information Services Services Services Government
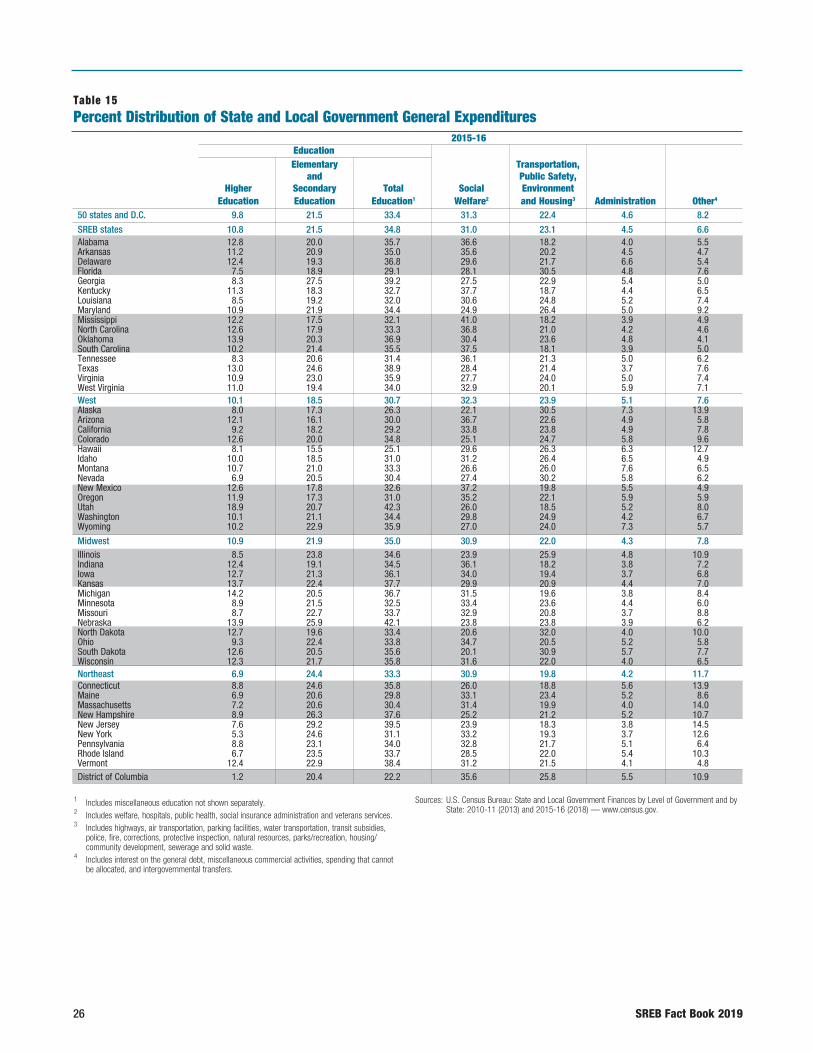
26 SREB Fact Book 2019
1 Includes miscellaneous education not shown separately.2 Includes welfare, hospitals, public health, social insurance administration and veterans services.3 Includes highways, air transportation, parking facilities, water transportation, transit subsidies,
police, fire, corrections, protective inspection, natural resources, parks/recreation, housing/ community development, sewerage and solid waste.
4 Includes interest on the general debt, miscellaneous commercial activities, spending that cannot be allocated, and intergovernmental transfers.
Sources: U.S. Census Bureau: State and Local Government Finances by Level of Government and by State: 2010-11 (2013) and 2015-16 (2018) — www.census.gov.
Table 15Percent Distribution of State and Local Government General Expenditures
50 states and D.C. 9.8 21.5 33.4 31.3 22.4 4.6 8.2
SREB states 10.8 21.5 34.8 31.0 23.1 4.5 6.6Alabama 12.8 20.0 35.7 36.6 18.2 4.0 5.5Arkansas 11.2 20.9 35.0 35.6 20.2 4.5 4.7Delaware 12.4 19.3 36.8 29.6 21.7 6.6 5.4Florida 7.5 18.9 29.1 28.1 30.5 4.8 7.6Georgia 8.3 27.5 39.2 27.5 22.9 5.4 5.0Kentucky 11.3 18.3 32.7 37.7 18.7 4.4 6.5Louisiana 8.5 19.2 32.0 30.6 24.8 5.2 7.4Maryland 10.9 21.9 34.4 24.9 26.4 5.0 9.2Mississippi 12.2 17.5 32.1 41.0 18.2 3.9 4.9North Carolina 12.6 17.9 33.3 36.8 21.0 4.2 4.6Oklahoma 13.9 20.3 36.9 30.4 23.6 4.8 4.1South Carolina 10.2 21.4 35.5 37.5 18.1 3.9 5.0Tennessee 8.3 20.6 31.4 36.1 21.3 5.0 6.2Texas 13.0 24.6 38.9 28.4 21.4 3.7 7.6Virginia 10.9 23.0 35.9 27.7 24.0 5.0 7.4West Virginia 11.0 19.4 34.0 32.9 20.1 5.9 7.1West 10.1 18.5 30.7 32.3 23.9 5.1 7.6Alaska 8.0 17.3 26.3 22.1 30.5 7.3 13.9Arizona 12.1 16.1 30.0 36.7 22.6 4.9 5.8California 9.2 18.2 29.2 33.8 23.8 4.9 7.8Colorado 12.6 20.0 34.8 25.1 24.7 5.8 9.6Hawaii 8.1 15.5 25.1 29.6 26.3 6.3 12.7Idaho 10.0 18.5 31.0 31.2 26.4 6.5 4.9Montana 10.7 21.0 33.3 26.6 26.0 7.6 6.5Nevada 6.9 20.5 30.4 27.4 30.2 5.8 6.2New Mexico 12.6 17.8 32.6 37.2 19.8 5.5 4.9Oregon 11.9 17.3 31.0 35.2 22.1 5.9 5.9Utah 18.9 20.7 42.3 26.0 18.5 5.2 8.0Washington 10.1 21.1 34.4 29.8 24.9 4.2 6.7Wyoming 10.2 22.9 35.9 27.0 24.0 7.3 5.7
Midwest 10.9 21.9 35.0 30.9 22.0 4.3 7.8Illinois 8.5 23.8 34.6 23.9 25.9 4.8 10.9Indiana 12.4 19.1 34.5 36.1 18.2 3.8 7.2Iowa 12.7 21.3 36.1 34.0 19.4 3.7 6.8Kansas 13.7 22.4 37.7 29.9 20.9 4.4 7.0Michigan 14.2 20.5 36.7 31.5 19.6 3.8 8.4Minnesota 8.9 21.5 32.5 33.4 23.6 4.4 6.0Missouri 8.7 22.7 33.7 32.9 20.8 3.7 8.8Nebraska 13.9 25.9 42.1 23.8 23.8 3.9 6.2North Dakota 12.7 19.6 33.4 20.6 32.0 4.0 10.0Ohio 9.3 22.4 33.8 34.7 20.5 5.2 5.8South Dakota 12.6 20.5 35.6 20.1 30.9 5.7 7.7Wisconsin 12.3 21.7 35.8 31.6 22.0 4.0 6.5Northeast 6.9 24.4 33.3 30.9 19.8 4.2 11.7Connecticut 8.8 24.6 35.8 26.0 18.8 5.6 13.9Maine 6.9 20.6 29.8 33.1 23.4 5.2 8.6Massachusetts 7.2 20.6 30.4 31.4 19.9 4.0 14.0New Hampshire 8.9 26.3 37.6 25.2 21.2 5.2 10.7New Jersey 7.6 29.2 39.5 23.9 18.3 3.8 14.5New York 5.3 24.6 31.1 33.2 19.3 3.7 12.6Pennsylvania 8.8 23.1 34.0 32.8 21.7 5.1 6.4Rhode Island 6.7 23.5 33.7 28.5 22.0 5.4 10.3Vermont 12.4 22.9 38.4 31.2 21.5 4.1 4.8District of Columbia 1.2 20.4 22.2 35.6 25.8 5.5 10.9
2015-16 Education Elementary Transportation, and Public Safety, Higher Secondary Total Social Environment Education Education Education1 Welfare2 and Housing3 Administration Other4

SREB Fact Book 2019 27
POPU
LATIO
N
Table 15 continued
0.0 -0.4 -0.3 3.1 -1.2 -0.2 -1.5 50 states and D.C. 0.0 -0.7 -0.6 2.5 -0.6 0.0 -1.2 SREB states -1.3 -1.5 -2.4 4.1 -1.4 -0.3 -0.1 Alabama -0.5 -4.9 -6.0 7.0 -0.6 -0.3 -0.1 Arkansas -0.1 -0.9 -0.1 3.7 -0.9 -0.2 -2.4 Delaware 0.5 -0.2 0.5 1.3 -0.3 -0.2 -1.3 Florida -0.7 1.2 0.1 0.1 0.4 0.2 -0.9 Georgia -0.4 -2.6 -3.1 6.7 -1.1 -0.4 -2.2 Kentucky 1.2 0.1 3.3 2.8 -2.1 0.1 -4.0 Louisiana -0.3 -2.2 -2.6 1.5 1.2 -0.2 0.1 Maryland 1.3 -0.4 1.4 3.2 -2.2 -0.3 -2.0 Mississippi -1.2 -1.6 -2.3 4.5 -0.5 0.4 -2.1 North Carolina 0.9 -1.1 0.2 1.1 -0.7 0.6 -1.3 Oklahoma 0.8 0.1 1.2 0.9 0.4 -0.7 -1.8 South Carolina 0.4 0.2 0.8 1.7 -1.3 0.5 -1.7 Tennessee -0.4 -0.8 -1.3 2.3 -0.1 0.1 -1.0 Texas -0.7 -0.4 -1.2 2.4 -0.9 -0.1 -0.2 Virginia 0.1 -3.5 -5.0 5.4 -1.4 0.2 0.8 West Virginia 0.0 0.0 0.1 5.0 -2.5 -0.5 -2.4 West 1.7 -1.9 -0.5 2.2 0.2 0.5 -2.4 Alaska 1.4 -2.8 -1.7 8.0 -3.3 -0.2 -2.7 Arizona -0.3 0.4 0.1 5.4 -2.0 -0.9 -3.2 California 1.6 0.2 2.1 3.7 -4.3 -0.2 -1.4 Colorado -2.6 -0.3 -2.6 1.2 2.3 1.0 -1.8 Hawaii -0.3 0.4 0.7 -0.2 -0.5 0.8 -0.8 Idaho 0.9 1.0 0.9 3.8 -2.6 0.5 -2.6 Montana 0.1 -1.0 0.0 7.2 -5.0 -1.1 -1.2 Nevada 0.3 -3.1 -2.5 5.8 -1.4 -0.1 -1.9 New Mexico -1.1 -1.7 -2.7 7.5 -3.8 0.7 -1.7 Oregon 2.7 0.6 3.6 4.4 -7.2 -1.7 0.9 Utah -0.2 1.3 1.2 2.0 -2.8 0.3 -0.7 Washington 1.2 1.3 2.5 0.3 -2.1 0.6 -1.4 Wyoming 0.2 -0.9 -0.9 3.1 -0.6 -0.1 -1.4 Midwest 0.2 0.3 0.5 0.6 0.7 0.1 -1.9 Illinois 0.3 -2.1 -2.0 8.3 -2.7 -0.4 -3.3 Indiana -0.4 -0.4 -0.9 3.5 -1.8 -0.2 -0.6 Iowa 1.3 -0.5 0.8 2.6 -0.1 -0.2 -3.2 Kansas 0.3 -3.3 -2.8 3.1 -0.3 0.0 0.0 Michigan -0.4 0.3 -0.5 1.6 0.4 -0.3 -1.1 Minnesota 0.0 0.0 0.0 3.0 -2.7 0.2 -0.6 Missouri 1.2 1.4 2.5 -0.8 0.2 -0.2 -2.0 Nebraska -1.0 0.4 -1.5 2.4 2.0 0.4 -3.3 North Dakota 0.1 -1.1 -2.1 4.2 -0.8 -0.4 -1.0 Ohio 1.7 -0.7 1.3 -0.7 -0.8 0.4 -0.2 South Dakota 0.0 -1.1 -1.1 4.1 -1.5 0.3 -1.8 Wisconsin -0.1 0.4 0.5 2.0 -1.4 -0.3 -0.9 Northeast 0.9 -1.0 -0.1 0.4 -0.1 0.3 -0.5 Connecticut -0.1 -0.9 -1.0 1.7 0.4 0.8 -1.9 Maine -0.4 -0.5 -0.4 2.4 -0.2 -0.2 -1.9 Massachusetts 0.6 -0.8 0.4 2.8 -0.6 0.1 -2.7 New Hampshire 0.6 0.5 1.5 1.1 -2.4 -0.3 0.2 New Jersey -0.7 1.1 0.3 2.4 -1.4 -0.6 -0.7 New York 0.7 0.4 1.3 2.1 -1.8 -0.2 -1.5 Pennsylvania 0.0 -0.3 0.3 0.4 0.5 0.0 -1.3 Rhode Island 0.5 -1.0 -0.4 4.0 -2.1 0.3 -1.8 Vermont -0.4 -0.5 -1.1 2.0 -1.8 0.6 0.2 District of Columbia
Percentage-Point Change, 2010-11 to 2015-16 Education Elementary Transportation, and Public Safety, Higher Secondary Total Social Environment Education Education Education1 Welfare2 and Housing3 Administration Other4
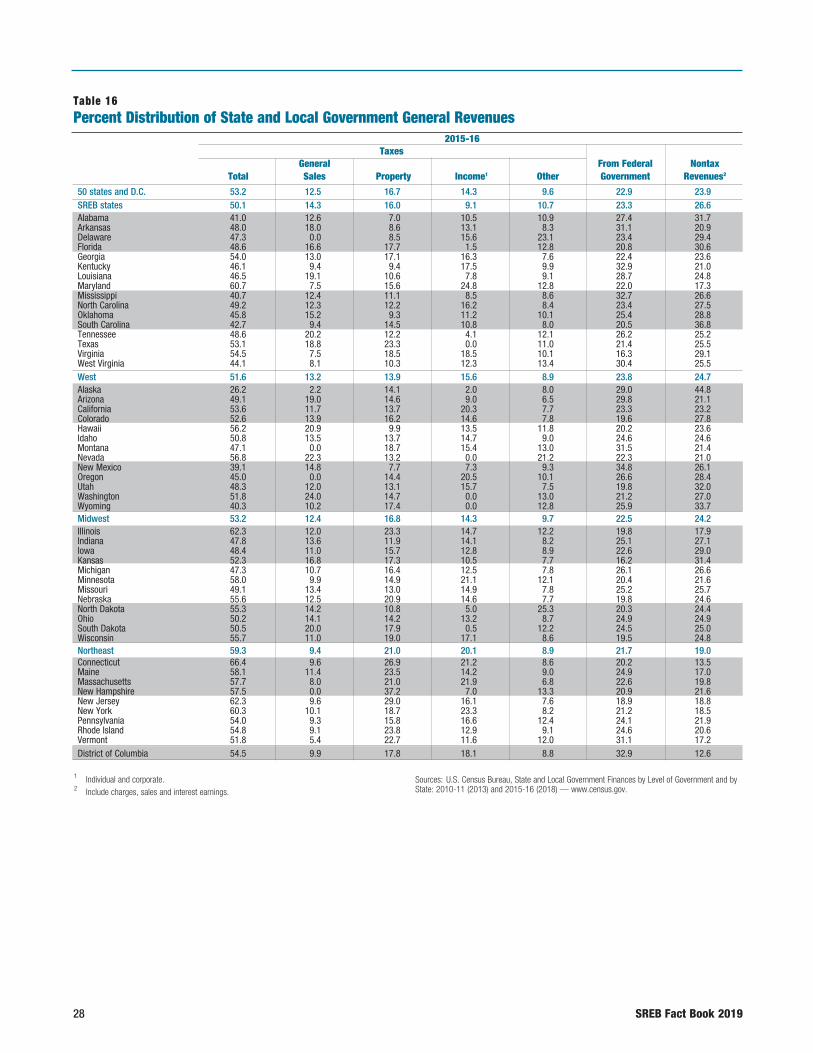
28 SREB Fact Book 2019
1 Individual and corporate.2 Include charges, sales and interest earnings.
Sources: U.S. Census Bureau, State and Local Government Finances by Level of Government and by State: 2010-11 (2013) and 2015-16 (2018) — www.census.gov.
Table 16Percent Distribution of State and Local Government General Revenues
50 states and D.C. 53.2 12.5 16.7 14.3 9.6 22.9 23.9SREB states 50.1 14.3 16.0 9.1 10.7 23.3 26.6Alabama 41.0 12.6 7.0 10.5 10.9 27.4 31.7Arkansas 48.0 18.0 8.6 13.1 8.3 31.1 20.9Delaware 47.3 0.0 8.5 15.6 23.1 23.4 29.4Florida 48.6 16.6 17.7 1.5 12.8 20.8 30.6Georgia 54.0 13.0 17.1 16.3 7.6 22.4 23.6Kentucky 46.1 9.4 9.4 17.5 9.9 32.9 21.0Louisiana 46.5 19.1 10.6 7.8 9.1 28.7 24.8Maryland 60.7 7.5 15.6 24.8 12.8 22.0 17.3Mississippi 40.7 12.4 11.1 8.5 8.6 32.7 26.6North Carolina 49.2 12.3 12.2 16.2 8.4 23.4 27.5Oklahoma 45.8 15.2 9.3 11.2 10.1 25.4 28.8South Carolina 42.7 9.4 14.5 10.8 8.0 20.5 36.8Tennessee 48.6 20.2 12.2 4.1 12.1 26.2 25.2Texas 53.1 18.8 23.3 0.0 11.0 21.4 25.5Virginia 54.5 7.5 18.5 18.5 10.1 16.3 29.1West Virginia 44.1 8.1 10.3 12.3 13.4 30.4 25.5West 51.6 13.2 13.9 15.6 8.9 23.8 24.7Alaska 26.2 2.2 14.1 2.0 8.0 29.0 44.8Arizona 49.1 19.0 14.6 9.0 6.5 29.8 21.1California 53.6 11.7 13.7 20.3 7.7 23.3 23.2Colorado 52.6 13.9 16.2 14.6 7.8 19.6 27.8Hawaii 56.2 20.9 9.9 13.5 11.8 20.2 23.6Idaho 50.8 13.5 13.7 14.7 9.0 24.6 24.6Montana 47.1 0.0 18.7 15.4 13.0 31.5 21.4Nevada 56.8 22.3 13.2 0.0 21.2 22.3 21.0New Mexico 39.1 14.8 7.7 7.3 9.3 34.8 26.1Oregon 45.0 0.0 14.4 20.5 10.1 26.6 28.4Utah 48.3 12.0 13.1 15.7 7.5 19.8 32.0Washington 51.8 24.0 14.7 0.0 13.0 21.2 27.0Wyoming 40.3 10.2 17.4 0.0 12.8 25.9 33.7Midwest 53.2 12.4 16.8 14.3 9.7 22.5 24.2Illinois 62.3 12.0 23.3 14.7 12.2 19.8 17.9Indiana 47.8 13.6 11.9 14.1 8.2 25.1 27.1Iowa 48.4 11.0 15.7 12.8 8.9 22.6 29.0Kansas 52.3 16.8 17.3 10.5 7.7 16.2 31.4Michigan 47.3 10.7 16.4 12.5 7.8 26.1 26.6Minnesota 58.0 9.9 14.9 21.1 12.1 20.4 21.6Missouri 49.1 13.4 13.0 14.9 7.8 25.2 25.7Nebraska 55.6 12.5 20.9 14.6 7.7 19.8 24.6North Dakota 55.3 14.2 10.8 5.0 25.3 20.3 24.4Ohio 50.2 14.1 14.2 13.2 8.7 24.9 24.9South Dakota 50.5 20.0 17.9 0.5 12.2 24.5 25.0Wisconsin 55.7 11.0 19.0 17.1 8.6 19.5 24.8Northeast 59.3 9.4 21.0 20.1 8.9 21.7 19.0Connecticut 66.4 9.6 26.9 21.2 8.6 20.2 13.5Maine 58.1 11.4 23.5 14.2 9.0 24.9 17.0Massachusetts 57.7 8.0 21.0 21.9 6.8 22.6 19.8New Hampshire 57.5 0.0 37.2 7.0 13.3 20.9 21.6New Jersey 62.3 9.6 29.0 16.1 7.6 18.9 18.8New York 60.3 10.1 18.7 23.3 8.2 21.2 18.5Pennsylvania 54.0 9.3 15.8 16.6 12.4 24.1 21.9Rhode Island 54.8 9.1 23.8 12.9 9.1 24.6 20.6Vermont 51.8 5.4 22.7 11.6 12.0 31.1 17.2District of Columbia 54.5 9.9 17.8 18.1 8.8 32.9 12.6
2015-16 Taxes General From Federal Nontax Total Sales Property Income1 Other Government Revenues2
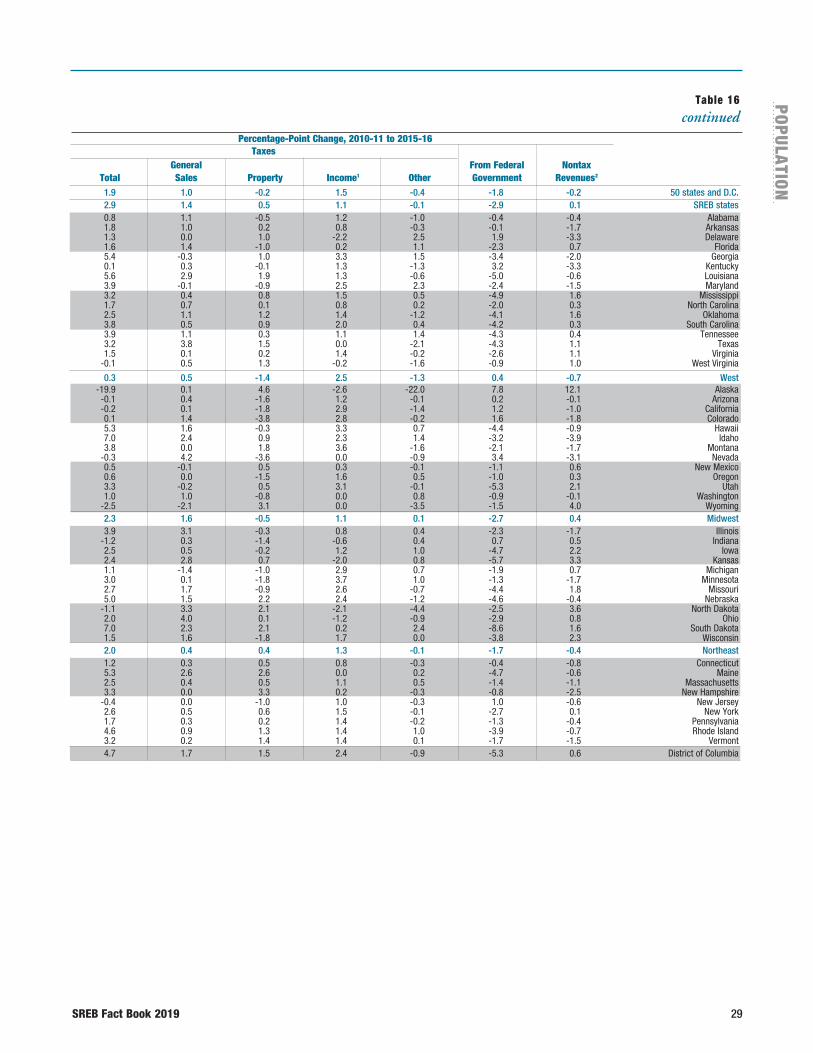
SREB Fact Book 2019 29
POPU
LATIO
N
Table 16 continued
1.9 1.0 -0.2 1.5 -0.4 -1.8 -0.2 50 states and D.C. 2.9 1.4 0.5 1.1 -0.1 -2.9 0.1 SREB states 0.8 1.1 -0.5 1.2 -1.0 -0.4 -0.4 Alabama 1.8 1.0 0.2 0.8 -0.3 -0.1 -1.7 Arkansas 1.3 0.0 1.0 -2.2 2.5 1.9 -3.3 Delaware 1.6 1.4 -1.0 0.2 1.1 -2.3 0.7 Florida 5.4 -0.3 1.0 3.3 1.5 -3.4 -2.0 Georgia 0.1 0.3 -0.1 1.3 -1.3 3.2 -3.3 Kentucky 5.6 2.9 1.9 1.3 -0.6 -5.0 -0.6 Louisiana 3.9 -0.1 -0.9 2.5 2.3 -2.4 -1.5 Maryland 3.2 0.4 0.8 1.5 0.5 -4.9 1.6 Mississippi 1.7 0.7 0.1 0.8 0.2 -2.0 0.3 North Carolina 2.5 1.1 1.2 1.4 -1.2 -4.1 1.6 Oklahoma 3.8 0.5 0.9 2.0 0.4 -4.2 0.3 South Carolina 3.9 1.1 0.3 1.1 1.4 -4.3 0.4 Tennessee 3.2 3.8 1.5 0.0 -2.1 -4.3 1.1 Texas 1.5 0.1 0.2 1.4 -0.2 -2.6 1.1 Virginia -0.1 0.5 1.3 -0.2 -1.6 -0.9 1.0 West Virginia
0.3 0.5 -1.4 2.5 -1.3 0.4 -0.7 West -19.9 0.1 4.6 -2.6 -22.0 7.8 12.1 Alaska -0.1 0.4 -1.6 1.2 -0.1 0.2 -0.1 Arizona -0.2 0.1 -1.8 2.9 -1.4 1.2 -1.0 California 0.1 1.4 -3.8 2.8 -0.2 1.6 -1.8 Colorado 5.3 1.6 -0.3 3.3 0.7 -4.4 -0.9 Hawaii 7.0 2.4 0.9 2.3 1.4 -3.2 -3.9 Idaho 3.8 0.0 1.8 3.6 -1.6 -2.1 -1.7 Montana -0.3 4.2 -3.6 0.0 -0.9 3.4 -3.1 Nevada 0.5 -0.1 0.5 0.3 -0.1 -1.1 0.6 New Mexico 0.6 0.0 -1.5 1.6 0.5 -1.0 0.3 Oregon 3.3 -0.2 0.5 3.1 -0.1 -5.3 2.1 Utah 1.0 1.0 -0.8 0.0 0.8 -0.9 -0.1 Washington -2.5 -2.1 3.1 0.0 -3.5 -1.5 4.0 Wyoming 2.3 1.6 -0.5 1.1 0.1 -2.7 0.4 Midwest 3.9 3.1 -0.3 0.8 0.4 -2.3 -1.7 Illinois -1.2 0.3 -1.4 -0.6 0.4 0.7 0.5 Indiana 2.5 0.5 -0.2 1.2 1.0 -4.7 2.2 Iowa 2.4 2.8 0.7 -2.0 0.8 -5.7 3.3 Kansas 1.1 -1.4 -1.0 2.9 0.7 -1.9 0.7 Michigan 3.0 0.1 -1.8 3.7 1.0 -1.3 -1.7 Minnesota 2.7 1.7 -0.9 2.6 -0.7 -4.4 1.8 Missouri 5.0 1.5 2.2 2.4 -1.2 -4.6 -0.4 Nebraska -1.1 3.3 2.1 -2.1 -4.4 -2.5 3.6 North Dakota 2.0 4.0 0.1 -1.2 -0.9 -2.9 0.8 Ohio 7.0 2.3 2.1 0.2 2.4 -8.6 1.6 South Dakota 1.5 1.6 -1.8 1.7 0.0 -3.8 2.3 Wisconsin 2.0 0.4 0.4 1.3 -0.1 -1.7 -0.4 Northeast 1.2 0.3 0.5 0.8 -0.3 -0.4 -0.8 Connecticut 5.3 2.6 2.6 0.0 0.2 -4.7 -0.6 Maine 2.5 0.4 0.5 1.1 0.5 -1.4 -1.1 Massachusetts 3.3 0.0 3.3 0.2 -0.3 -0.8 -2.5 New Hampshire -0.4 0.0 -1.0 1.0 -0.3 1.0 -0.6 New Jersey 2.6 0.5 0.6 1.5 -0.1 -2.7 0.1 New York 1.7 0.3 0.2 1.4 -0.2 -1.3 -0.4 Pennsylvania 4.6 0.9 1.3 1.4 1.0 -3.9 -0.7 Rhode Island 3.2 0.2 1.4 1.4 0.1 -1.7 -1.5 Vermont 4.7 1.7 1.5 2.4 -0.9 -5.3 0.6 District of Columbia
Percentage-Point Change, 2010-11 to 2015-16 Taxes General From Federal Nontax Total Sales Property Income1 Other Government Revenues2
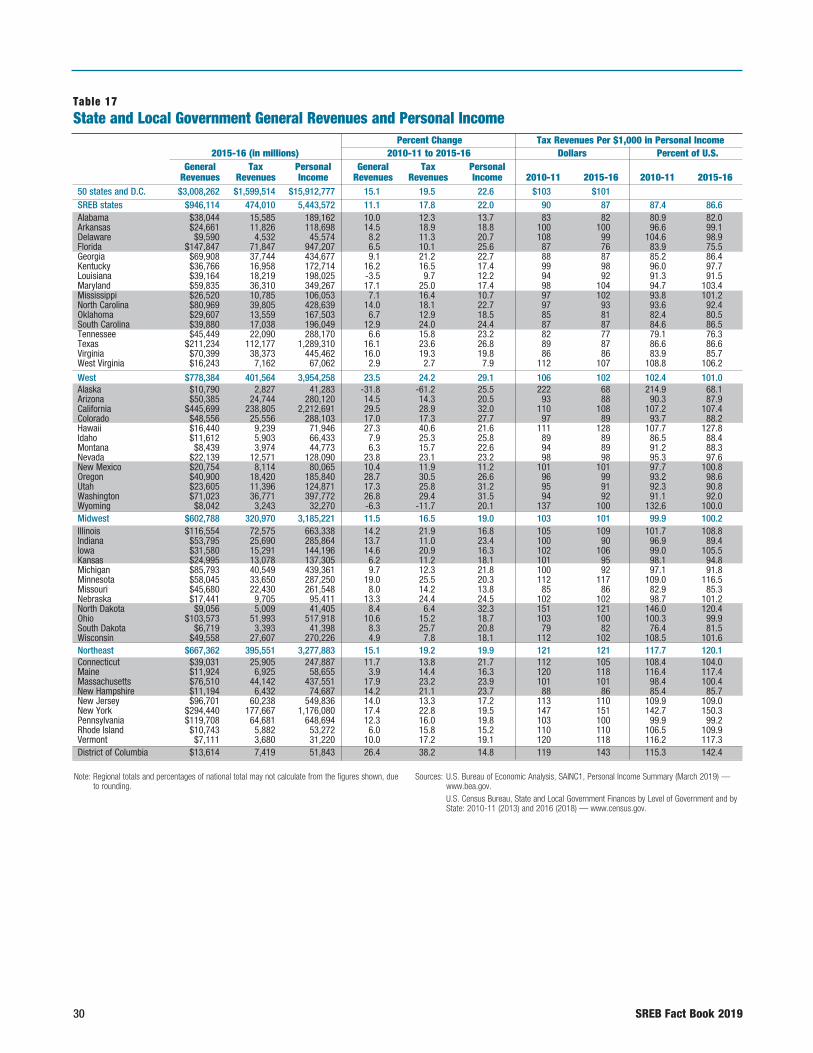
30 SREB Fact Book 2019
50 states and D.C. $3,008,262 $1,599,514 $15,912,777 15.1 19.5 22.6 $103 $101 SREB states $946,114 474,010 5,443,572 11.1 17.8 22.0 90 87 87.4 86.6Alabama $38,044 15,585 189,162 10.0 12.3 13.7 83 82 80.9 82.0Arkansas $24,661 11,826 118,698 14.5 18.9 18.8 100 100 96.6 99.1Delaware $9,590 4,532 45,574 8.2 11.3 20.7 108 99 104.6 98.9Florida $147,847 71,847 947,207 6.5 10.1 25.6 87 76 83.9 75.5Georgia $69,908 37,744 434,677 9.1 21.2 22.7 88 87 85.2 86.4Kentucky $36,766 16,958 172,714 16.2 16.5 17.4 99 98 96.0 97.7Louisiana $39,164 18,219 198,025 -3.5 9.7 12.2 94 92 91.3 91.5Maryland $59,835 36,310 349,267 17.1 25.0 17.4 98 104 94.7 103.4Mississippi $26,520 10,785 106,053 7.1 16.4 10.7 97 102 93.8 101.2North Carolina $80,969 39,805 428,639 14.0 18.1 22.7 97 93 93.6 92.4Oklahoma $29,607 13,559 167,503 6.7 12.9 18.5 85 81 82.4 80.5South Carolina $39,880 17,038 196,049 12.9 24.0 24.4 87 87 84.6 86.5Tennessee $45,449 22,090 288,170 6.6 15.8 23.2 82 77 79.1 76.3Texas $211,234 112,177 1,289,310 16.1 23.6 26.8 89 87 86.6 86.6Virginia $70,399 38,373 445,462 16.0 19.3 19.8 86 86 83.9 85.7West Virginia $16,243 7,162 67,062 2.9 2.7 7.9 112 107 108.8 106.2
West $778,384 401,564 3,954,258 23.5 24.2 29.1 106 102 102.4 101.0Alaska $10,790 2,827 41,283 -31.8 -61.2 25.5 222 68 214.9 68.1Arizona $50,385 24,744 280,120 14.5 14.3 20.5 93 88 90.3 87.9California $445,699 238,805 2,212,691 29.5 28.9 32.0 110 108 107.2 107.4Colorado $48,556 25,556 288,103 17.0 17.3 27.7 97 89 93.7 88.2Hawaii $16,440 9,239 71,946 27.3 40.6 21.6 111 128 107.7 127.8Idaho $11,612 5,903 66,433 7.9 25.3 25.8 89 89 86.5 88.4Montana $8,439 3,974 44,773 6.3 15.7 22.6 94 89 91.2 88.3Nevada $22,139 12,571 128,090 23.8 23.1 23.2 98 98 95.3 97.6New Mexico $20,754 8,114 80,065 10.4 11.9 11.2 101 101 97.7 100.8Oregon $40,900 18,420 185,840 28.7 30.5 26.6 96 99 93.2 98.6Utah $23,605 11,396 124,871 17.3 25.8 31.2 95 91 92.3 90.8Washington $71,023 36,771 397,772 26.8 29.4 31.5 94 92 91.1 92.0Wyoming $8,042 3,243 32,270 -6.3 -11.7 20.1 137 100 132.6 100.0Midwest $602,788 320,970 3,185,221 11.5 16.5 19.0 103 101 99.9 100.2Illinois $116,554 72,575 663,338 14.2 21.9 16.8 105 109 101.7 108.8Indiana $53,795 25,690 285,864 13.7 11.0 23.4 100 90 96.9 89.4Iowa $31,580 15,291 144,196 14.6 20.9 16.3 102 106 99.0 105.5Kansas $24,995 13,078 137,305 6.2 11.2 18.1 101 95 98.1 94.8Michigan $85,793 40,549 439,361 9.7 12.3 21.8 100 92 97.1 91.8Minnesota $58,045 33,650 287,250 19.0 25.5 20.3 112 117 109.0 116.5Missouri $45,680 22,430 261,548 8.0 14.2 13.8 85 86 82.9 85.3Nebraska $17,441 9,705 95,411 13.3 24.4 24.5 102 102 98.7 101.2North Dakota $9,056 5,009 41,405 8.4 6.4 32.3 151 121 146.0 120.4Ohio $103,573 51,993 517,918 10.6 15.2 18.7 103 100 100.3 99.9South Dakota $6,719 3,393 41,398 8.3 25.7 20.8 79 82 76.4 81.5Wisconsin $49,558 27,607 270,226 4.9 7.8 18.1 112 102 108.5 101.6Northeast $667,362 395,551 3,277,883 15.1 19.2 19.9 121 121 117.7 120.1Connecticut $39,031 25,905 247,887 11.7 13.8 21.7 112 105 108.4 104.0Maine $11,924 6,925 58,655 3.9 14.4 16.3 120 118 116.4 117.4Massachusetts $76,510 44,142 437,551 17.9 23.2 23.9 101 101 98.4 100.4New Hampshire $11,194 6,432 74,687 14.2 21.1 23.7 88 86 85.4 85.7New Jersey $96,701 60,238 549,836 14.0 13.3 17.2 113 110 109.9 109.0New York $294,440 177,667 1,176,080 17.4 22.8 19.5 147 151 142.7 150.3Pennsylvania $119,708 64,681 648,694 12.3 16.0 19.8 103 100 99.9 99.2Rhode Island $10,743 5,882 53,272 6.0 15.8 15.2 110 110 106.5 109.9Vermont $7,111 3,680 31,220 10.0 17.2 19.1 120 118 116.2 117.3District of Columbia $13,614 7,419 51,843 26.4 38.2 14.8 119 143 115.3 142.4
Note: Regional totals and percentages of national total may not calculate from the figures shown, due to rounding.
Sources: U.S. Bureau of Economic Analysis, SAINC1, Personal Income Summary (March 2019) — www.bea.gov. U.S. Census Bureau, State and Local Government Finances by Level of Government and by State: 2010-11 (2013) and 2016 (2018) — www.census.gov.
Table 17State and Local Government General Revenues and Personal Income
Percent Change Tax Revenues Per $1,000 in Personal Income 2015-16 (in millions) 2010-11 to 2015-16 Dollars Percent of U.S. General Tax Personal General Tax Personal Revenues Revenues Income Revenues Revenues Income 2010-11 2015-16 2010-11 2015-16
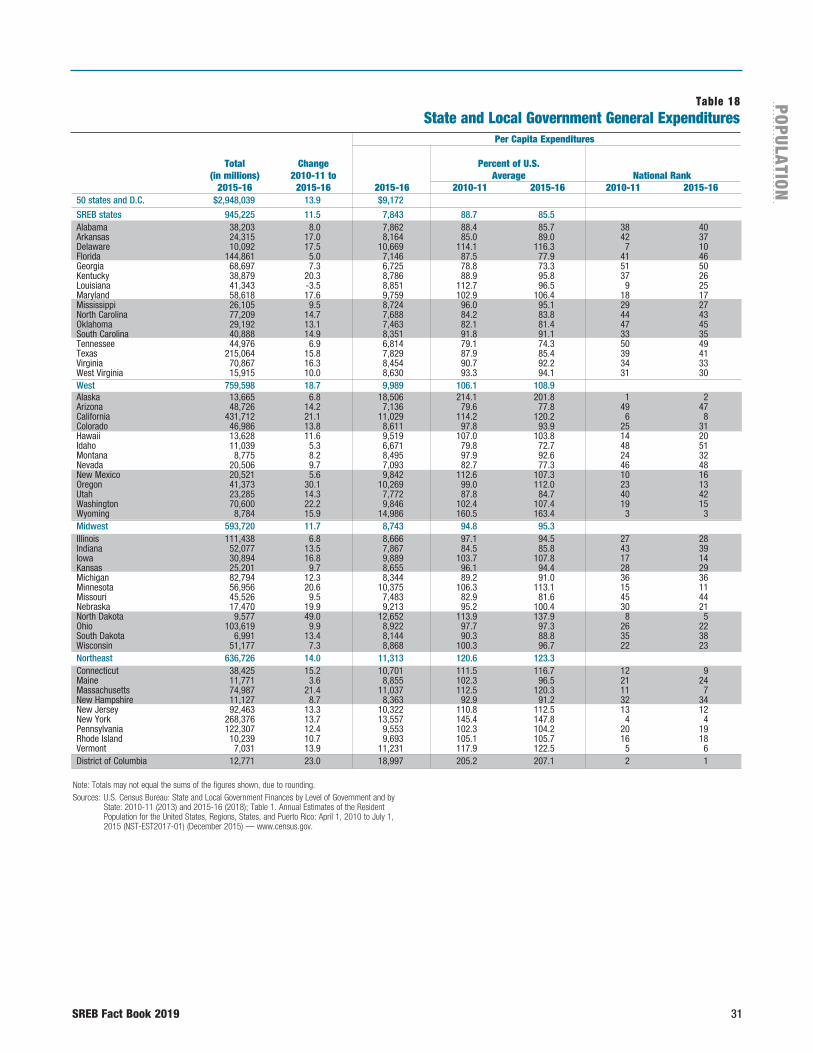
SREB Fact Book 2019 31
POPU
LATIO
N
Note: Totals may not equal the sums of the figures shown, due to rounding.Sources: U.S. Census Bureau: State and Local Government Finances by Level of Government and by State: 2010-11 (2013) and 2015-16 (2018); Table 1. Annual Estimates of the Resident Population for the United States, Regions, States, and Puerto Rico: April 1, 2010 to July 1, 2015 (NST-EST2017-01) (December 2015) — www.census.gov.
Per Capita Expenditures Total Change Percent of U.S. (in millions) 2010-11 to Average National Rank 2015-16 2015-16 2015-16 2010-11 2015-16 2010-11 2015-16
Table 18State and Local Government General Expenditures
50 states and D.C. $2,948,039 13.9 $9,172
SREB states 945,225 11.5 7,843 88.7 85.5 Alabama 38,203 8.0 7,862 88.4 85.7 38 40Arkansas 24,315 17.0 8,164 85.0 89.0 42 37Delaware 10,092 17.5 10,669 114.1 116.3 7 10Florida 144,861 5.0 7,146 87.5 77.9 41 46Georgia 68,697 7.3 6,725 78.8 73.3 51 50Kentucky 38,879 20.3 8,786 88.9 95.8 37 26Louisiana 41,343 -3.5 8,851 112.7 96.5 9 25Maryland 58,618 17.6 9,759 102.9 106.4 18 17Mississippi 26,105 9.5 8,724 96.0 95.1 29 27North Carolina 77,209 14.7 7,688 84.2 83.8 44 43Oklahoma 29,192 13.1 7,463 82.1 81.4 47 45South Carolina 40,888 14.9 8,351 91.8 91.1 33 35Tennessee 44,976 6.9 6,814 79.1 74.3 50 49Texas 215,064 15.8 7,829 87.9 85.4 39 41Virginia 70,867 16.3 8,454 90.7 92.2 34 33West Virginia 15,915 10.0 8,630 93.3 94.1 31 30West 759,598 18.7 9,989 106.1 108.9 Alaska 13,665 6.8 18,506 214.1 201.8 1 2Arizona 48,726 14.2 7,136 79.6 77.8 49 47California 431,712 21.1 11,029 114.2 120.2 6 8Colorado 46,986 13.8 8,611 97.8 93.9 25 31Hawaii 13,628 11.6 9,519 107.0 103.8 14 20Idaho 11,039 5.3 6,671 79.8 72.7 48 51Montana 8,775 8.2 8,495 97.9 92.6 24 32Nevada 20,506 9.7 7,093 82.7 77.3 46 48New Mexico 20,521 5.6 9,842 112.6 107.3 10 16Oregon 41,373 30.1 10,269 99.0 112.0 23 13Utah 23,285 14.3 7,772 87.8 84.7 40 42Washington 70,600 22.2 9,846 102.4 107.4 19 15Wyoming 8,784 15.9 14,986 160.5 163.4 3 3Midwest 593,720 11.7 8,743 94.8 95.3 Illinois 111,438 6.8 8,666 97.1 94.5 27 28Indiana 52,077 13.5 7,867 84.5 85.8 43 39Iowa 30,894 16.8 9,889 103.7 107.8 17 14Kansas 25,201 9.7 8,655 96.1 94.4 28 29Michigan 82,794 12.3 8,344 89.2 91.0 36 36Minnesota 56,956 20.6 10,375 106.3 113.1 15 11Missouri 45,526 9.5 7,483 82.9 81.6 45 44Nebraska 17,470 19.9 9,213 95.2 100.4 30 21North Dakota 9,577 49.0 12,652 113.9 137.9 8 5Ohio 103,619 9.9 8,922 97.7 97.3 26 22South Dakota 6,991 13.4 8,144 90.3 88.8 35 38Wisconsin 51,177 7.3 8,868 100.3 96.7 22 23Northeast 636,726 14.0 11,313 120.6 123.3 Connecticut 38,425 15.2 10,701 111.5 116.7 12 9Maine 11,771 3.6 8,855 102.3 96.5 21 24Massachusetts 74,987 21.4 11,037 112.5 120.3 11 7New Hampshire 11,127 8.7 8,363 92.9 91.2 32 34New Jersey 92,463 13.3 10,322 110.8 112.5 13 12New York 268,376 13.7 13,557 145.4 147.8 4 4Pennsylvania 122,307 12.4 9,553 102.3 104.2 20 19Rhode Island 10,239 10.7 9,693 105.1 105.7 16 18Vermont 7,031 13.9 11,231 117.9 122.5 5 6District of Columbia 12,771 23.0 18,997 205.2 207.1 2 1

Copies of the Fact Book on Higher Education are available from the SREB publications office. SREB continuously monitors new comparative data and makes them available on the SREB website: www.sreb.org. The website also features an online edition of the Fact Book with links to the latest updates of the tables and individual Featured Facts reports for each of the 16 SREB states.
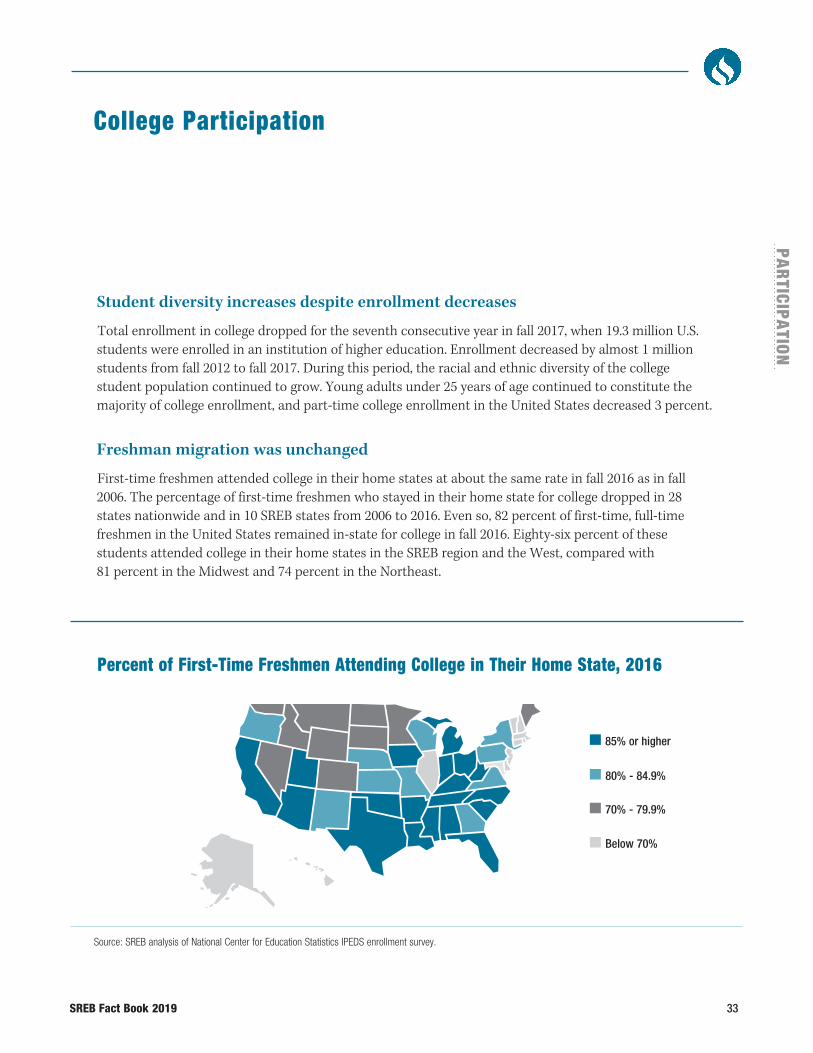
SREB Fact Book 2019 33
PAR
TICIPATIO
N
Student diversity increases despite enrollment decreases
Total enrollment in college dropped for the seventh consecutive year in fall 2017, when 19.3 million U.S. students were enrolled in an institution of higher education. Enrollment decreased by almost 1 million students from fall 2012 to fall 2017. During this period, the racial and ethnic diversity of the college student population continued to grow. Young adults under 25 years of age continued to constitute the majority of college enrollment, and part-time college enrollment in the United States decreased 3 percent.
Freshman migration was unchanged
First-time freshmen attended college in their home states at about the same rate in fall 2016 as in fall 2006. The percentage of first-time freshmen who stayed in their home state for college dropped in 28 states nationwide and in 10 SREB states from 2006 to 2016. Even so, 82 percent of first-time, full-time freshmen in the United States remained in-state for college in fall 2016. Eighty-six percent of these students attended college in their home states in the SREB region and the West, compared with 81 percent in the Midwest and 74 percent in the Northeast.
College Participation
Source: SREB analysis of National Center for Education Statistics IPEDS enrollment survey.
Percent of First-Time Freshmen Attending College in Their Home State, 2016
85% or higher
80% - 84.9%
70% - 79.9%
Below 70%
34 SREB Fact Book 2019
Thirteen SREB states brought in more first-time freshmen than they lost to out-of-state institutions in fall 2016 — all but Georgia, Maryland and Texas. Florida’s net gain of over 13,600 students was the larg-est in the region. During that same period, West Virginia's import/export ratio of 3.85 indicated they enrolled almost four out-of-state first-time freshmen for every one in-state first-time freshman.
In fall 2016, four of the nation’s top 10 universities for attracting Freshman Merit Scholars were in SREB states: the University of Oklahoma in Norman, Vanderbilt University, the University of Florida and the University of Texas at Dallas. The list of the 100 universities with the most Freshmen Merit Scholars consisted of 38 universities in SREB states, 15 in the West, 26 in the Midwest and 23 in the Northeast.
Enrollment falls nationwide and in 14 SREB states
From fall 2012 to fall 2017, total college enrollment in SREB states decreased by 3 percent, or about 205,500 students — a smaller decrease than the nearly 5 percent drop nationwide. This stands in sharp contrast to the period from fall 2007 to fall 2012, when total enrollment grew by over 18 percent in the SREB region. From fall 2012 to fall 2017, 10 SREB states had decreases in college enrollment rates that exceeded the rate of decline in the United States. Despite the overall decrease in enrollment for the SREB region, Delaware and Texas experienced growth.
Enrollment declines for women greater than for men
Between fall 2012 and fall 2017, the enrollment of men fell less than the enrollment of women, both nationwide and in the SREB region. Enrollment of men decreased by 4 percent nationwide, almost 3 percent in the SREB region, 2 percent in the West, over 10 percent in the Midwest and nearly 3 percent in the Northeast. The number of women enrolling in colleges and universities during that same period dropped almost 5 percent nationwide, over 3 percent in SREB states, almost 2 percent in the West, 13 percent in the Midwest and 2 percent in the Northeast.
Traditional college-age students account for larger percentage of undergraduates
Not surprisingly, college participation in fall 2017 was still greatest among 18- to 24-year-olds. The proportion of undergraduate college students in the SREB region who are younger than 25 years old increased from over 63 percent to more than 67 percent between fall 2013 and fall 2017. Younger students remained the largest college-going age group in every region in fall 2017. In the West, they were 61 percent of all enrolled college students, and in the Midwest, they were 67 percent. The highest percentage was in the Northeast, where they made up nearly 68 percent of the total.
The percentage of these adults who were enrolled in college increased slightly from 2013. In the SREB region in fall 2017, 36 percent of 18- to 24-year-olds attended college — 2 percentage points higher than in fall 2013 but still the lowest regional rate in the nation. The Northeast had the highest participation rate for this age group, at nearly 42 percent. Participation rates for working-age adults, ages 25 to 64, were lower in three regions, with a less than one percentage-point decrease in SREB states, the Midwest and the West. The participation rate in the Northeast remained the same at nearly 4 percent.
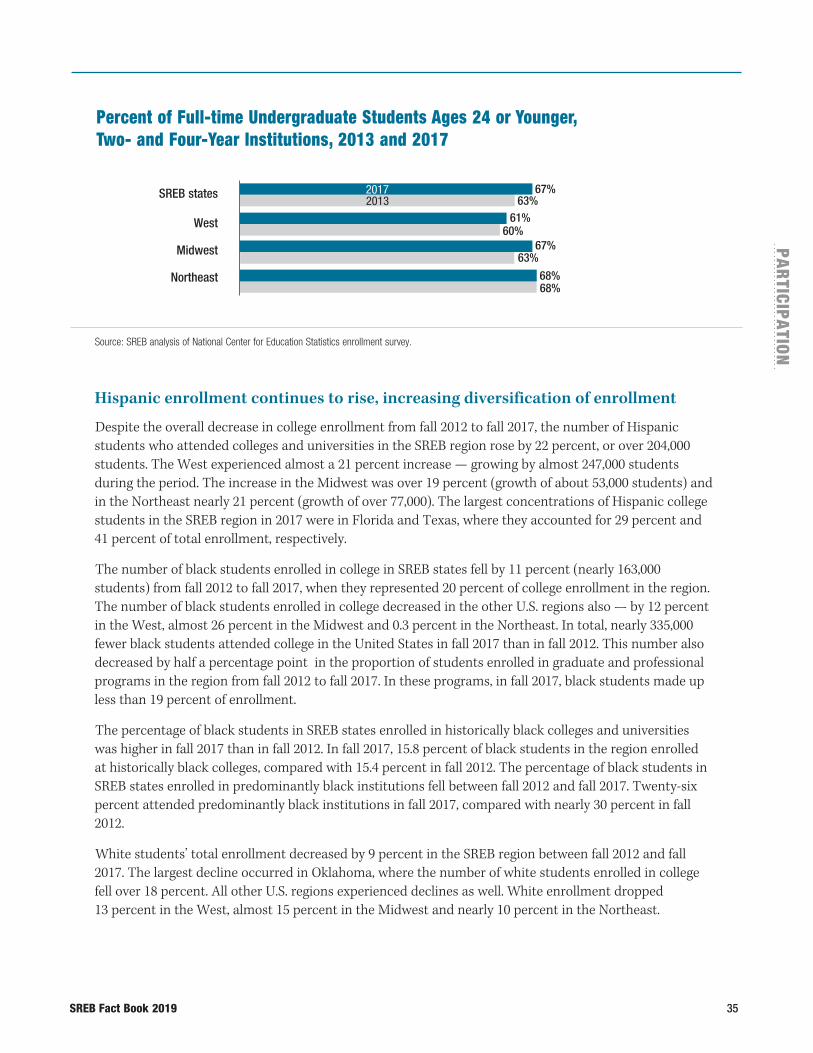
SREB Fact Book 2019 35
PAR
TICIPATIO
N
Hispanic enrollment continues to rise, increasing diversification of enrollment
Despite the overall decrease in college enrollment from fall 2012 to fall 2017, the number of Hispanic students who attended colleges and universities in the SREB region rose by 22 percent, or over 204,000 students. The West experienced almost a 21 percent increase — growing by almost 247,000 students during the period. The increase in the Midwest was over 19 percent (growth of about 53,000 students) and in the Northeast nearly 21 percent (growth of over 77,000). The largest concentrations of Hispanic college students in the SREB region in 2017 were in Florida and Texas, where they accounted for 29 percent and 41 percent of total enrollment, respectively.
The number of black students enrolled in college in SREB states fell by 11 percent (nearly 163,000 students) from fall 2012 to fall 2017, when they represented 20 percent of college enrollment in the region. The number of black students enrolled in college decreased in the other U.S. regions also — by 12 percent in the West, almost 26 percent in the Midwest and 0.3 percent in the Northeast. In total, nearly 335,000 fewer black students attended college in the United States in fall 2017 than in fall 2012. This number also decreased by half a percentage point in the proportion of students enrolled in graduate and professional programs in the region from fall 2012 to fall 2017. In these programs, in fall 2017, black students made up less than 19 percent of enrollment.
The percentage of black students in SREB states enrolled in historically black colleges and universities was higher in fall 2017 than in fall 2012. In fall 2017, 15.8 percent of black students in the region enrolled at historically black colleges, compared with 15.4 percent in fall 2012. The percentage of black students in SREB states enrolled in predominantly black institutions fell between fall 2012 and fall 2017. Twenty-six percent attended predominantly black institutions in fall 2017, compared with nearly 30 percent in fall 2012.
White students’ total enrollment decreased by 9 percent in the SREB region between fall 2012 and fall 2017. The largest decline occurred in Oklahoma, where the number of white students enrolled in college fell over 18 percent. All other U.S. regions experienced declines as well. White enrollment dropped 13 percent in the West, almost 15 percent in the Midwest and nearly 10 percent in the Northeast.
Source: SREB analysis of National Center for Education Statistics enrollment survey.
Percent of Full-time Undergraduate Students Ages 24 or Younger, Two- and Four-Year Institutions, 2013 and 2017
SREB states
West
Midwest
Northeast
63% 67%
61% 60%
63%67%
68%68%
20172013
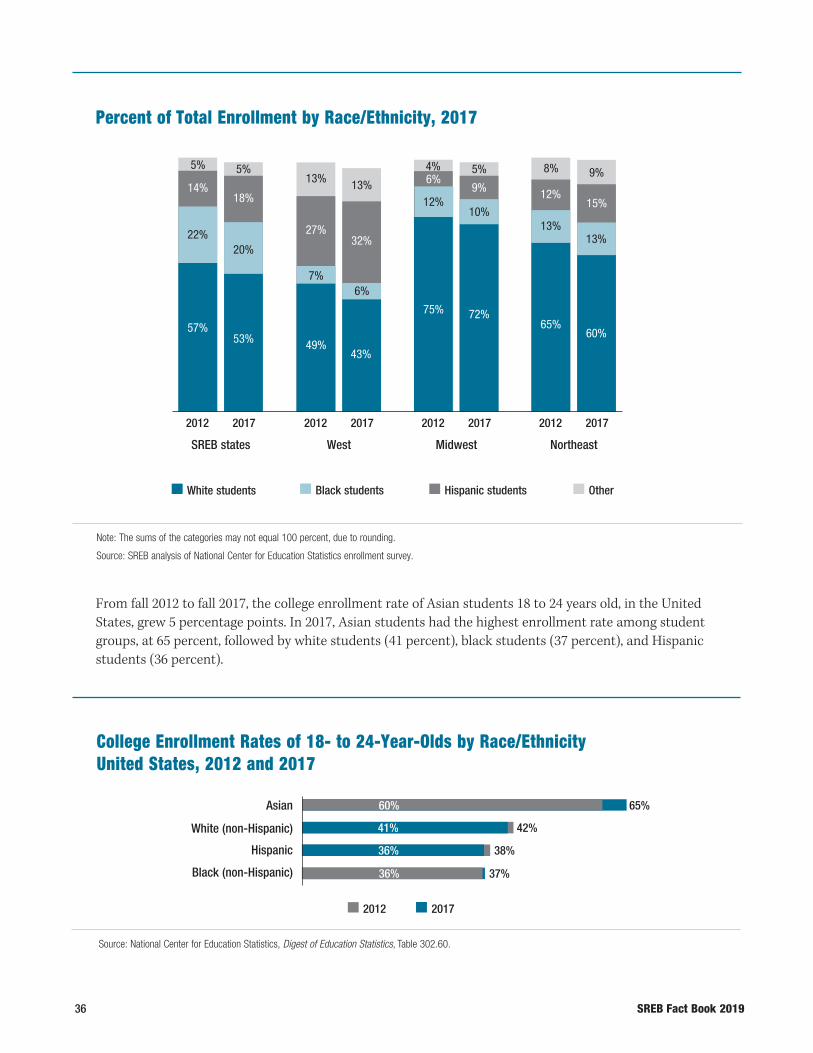
36 SREB Fact Book 2019
From fall 2012 to fall 2017, the college enrollment rate of Asian students 18 to 24 years old, in the United States, grew 5 percentage points. In 2017, Asian students had the highest enrollment rate among student groups, at 65 percent, followed by white students (41 percent), black students (37 percent), and Hispanic students (36 percent).
Percent of Total Enrollment by Race/Ethnicity, 2017
Note: The sums of the categories may not equal 100 percent, due to rounding.
Source: SREB analysis of National Center for Education Statistics enrollment survey.
White students Black students Hispanic students Other
Source: National Center for Education Statistics, Digest of Education Statistics, Table 302.60.
20172012
College Enrollment Rates of 18- to 24-Year-Olds by Race/Ethnicity United States, 2012 and 2017
42%
38%
37%
60%Asian
White (non-Hispanic)
Hispanic
Black (non-Hispanic)
65%
41%
36%
36%
SREB states
2012 2017
West
2012 2017
Midwest
2012 2017
Northeast
2012 2017
22%
57%
14%
5%
20%
53%
18%
5%
7%
49%
27%
13%
6%
43%
32%
13%12%
75%
6%4%
10%
72%
9%
5%
13%
65%
12%
8%
13%
60%
15%
9%

SREB Fact Book 2019 37
PAR
TICIPATIO
N
Two-year college enrollment decreases continue
Two-year colleges in SREB states in fall 2017 enrolled 2.6 million students — a loss of 10 percent since fall 2012. Two-year college enrollment in the other regions fell at rates ranging from almost 6 percent in the West to nearly 16 percent in the Northeast and 18 percent in the Midwest. The nation saw an 11 percent decline. In 2017, two-year colleges in SREB states enrolled almost 45 percent of all under-graduates and first-time freshmen. These rates were higher in the West and lower in the Midwest and Northeast. Alabama was the only SREB state to increase its percentage of undergraduate students attending two-year colleges from fall 2012 to fall 2017. Despite decreases from fall 2012 to fall 2017, two-year colleges in Florida and Texas still enrolled more than 50 percent of all undergraduates statewide.
Two-year colleges accounted for more than half of all undergraduates in five of 13 Western states. Two-year colleges in one Midwest state enrolled more than half of undergraduates statewide; none did in the Northeast.
Change in Two-Year College Students as a Percentage of Undergraduate Enrollment, 2012 and 2017
Source: SREB analysis of National Center for Education Statistics enrollment survey.
20172012
50 states and D.C.West
Texas
Florida
Mississippi
SREB statesMidwest
Northeast
51%
Delaware 29%West Virginia 27%
Louisiana 34%
Georgia 34%
Alabama 35%
Arkansas 34%
Tennessee 35%
Virginia 39%
Kentucky 37%
South Carolina 42%
Oklahoma 38%
North Carolina 47%Maryland 42%
48%
51%55%
30%39%
45%53%
43%
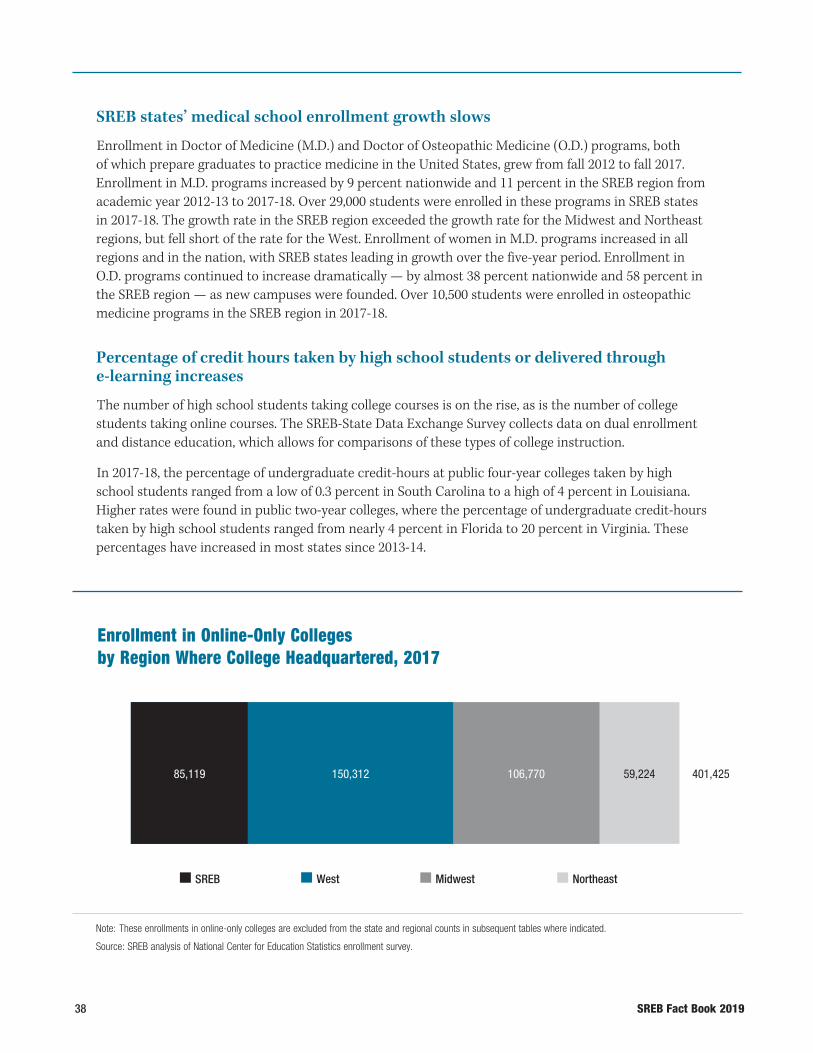
38 SREB Fact Book 2019
Note: These enrollments in online-only colleges are excluded from the state and regional counts in subsequent tables where indicated.
Source: SREB analysis of National Center for Education Statistics enrollment survey.
SREB West Midwest Northeast
Enrollment in Online-Only Colleges by Region Where College Headquartered, 2017
85,119 150,312 59,224 401,425106,770
SREB states’ medical school enrollment growth slows
Enrollment in Doctor of Medicine (M.D.) and Doctor of Osteopathic Medicine (O.D.) programs, both of which prepare graduates to practice medicine in the United States, grew from fall 2012 to fall 2017. Enrollment in M.D. programs increased by 9 percent nationwide and 11 percent in the SREB region from academic year 2012-13 to 2017-18. Over 29,000 students were enrolled in these programs in SREB states in 2017-18. The growth rate in the SREB region exceeded the growth rate for the Midwest and Northeast regions, but fell short of the rate for the West. Enrollment of women in M.D. programs increased in all regions and in the nation, with SREB states leading in growth over the five-year period. Enrollment in O.D. programs continued to increase dramatically — by almost 38 percent nationwide and 58 percent in the SREB region — as new campuses were founded. Over 10,500 students were enrolled in osteopathic medicine programs in the SREB region in 2017-18.
Percentage of credit hours taken by high school students or delivered through e-learning increases
The number of high school students taking college courses is on the rise, as is the number of college students taking online courses. The SREB-State Data Exchange Survey collects data on dual enrollment and distance education, which allows for comparisons of these types of college instruction.
In 2017-18, the percentage of undergraduate credit-hours at public four-year colleges taken by high school students ranged from a low of 0.3 percent in South Carolina to a high of 4 percent in Louisiana. Higher rates were found in public two-year colleges, where the percentage of undergraduate credit-hours taken by high school students ranged from nearly 4 percent in Florida to 20 percent in Virginia. These percentages have increased in most states since 2013-14.
SREB Fact Book 2019 39
PAR
TICIPATIO
N
An e-learning course is one in which more than 50 percent of the content is delivered electronically — through the Internet, site-to-site two-way audio/video, satellite or cable TV, broadcast TV/radio, closed circuit TV, videotape, CD-ROMs/DVDs or email. Online courses dominate e-learning. Since 2012-13, most SREB states have increased the proportion of credit hours they offer electronically in public four-year institutions — some, like Maryland and Texas, by nearly 8 percentage points. The proportion of credit hours offered electronically in public two-year colleges rose 28 and 13 points, respectively, in North Carolina and South Carolina.
Among the 15 SREB states reporting in 2017-18, the percentage of undergraduate instruction delivered through e-learning at public four-year colleges and universities ranged from almost 4 percent in Delaware to almost 30 percent in Maryland. Only two of the reporting states, Delaware and Maryland, had less than one-fifth of the credit-hours taken at public two-year colleges offered through e-learning. The percentage of graduate-level instruction offered through e-learning ranged from 12 percent in Delaware to 54 percent in Arkansas. Enrollments in online-only colleges nationwide exceeded 400,000 students in fall 2017, with just over 21 percent of those enrollments in SREB states.
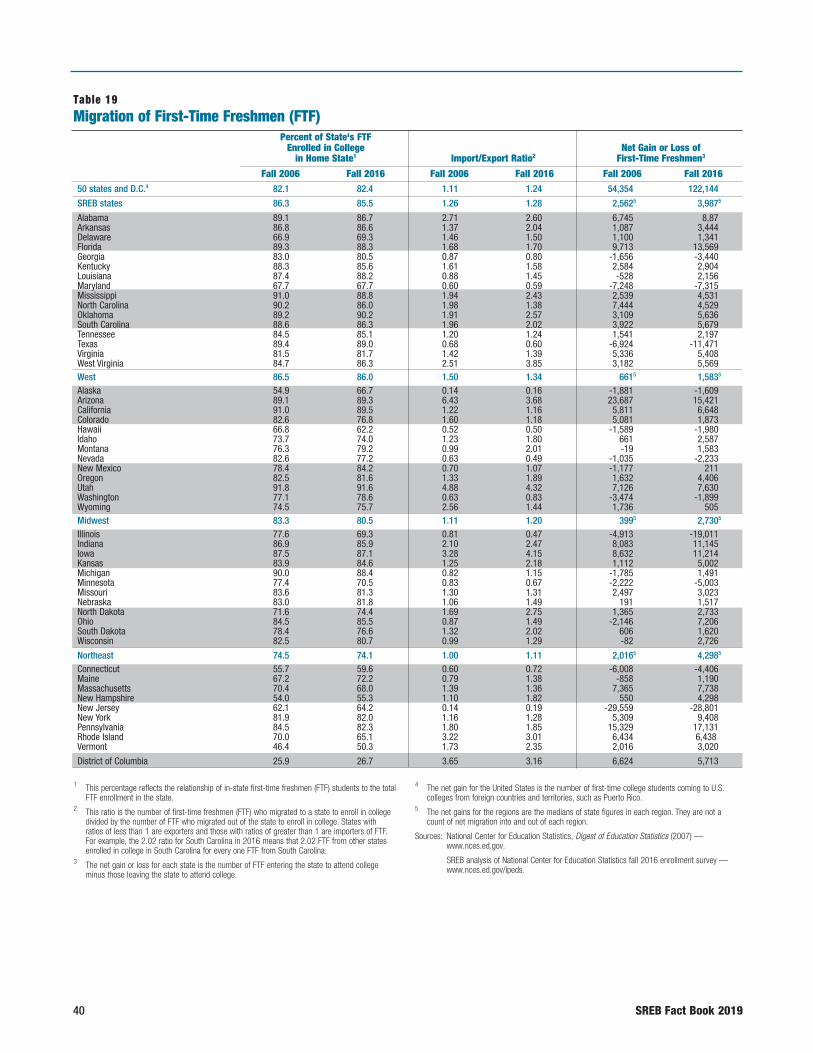
40 SREB Fact Book 2019
50 states and D.C.4 82.1 82.4 1.11 1.24 54,354 122,144
SREB states 86.3 85.5 1.26 1.28 2,5625 3,9875
Alabama 89.1 86.7 2.71 2.60 6,745 8,87Arkansas 86.8 86.6 1.37 2.04 1,087 3,444Delaware 66.9 69.3 1.46 1.50 1,100 1,341Florida 89.3 88.3 1.68 1.70 9,713 13,569Georgia 83.0 80.5 0.87 0.80 -1,656 -3,440Kentucky 88.3 85.6 1.61 1.58 2,584 2,904Louisiana 87.4 88.2 0.88 1.45 -528 2,156Maryland 67.7 67.7 0.60 0.59 -7,248 -7,315Mississippi 91.0 88.8 1.94 2.43 2,539 4,531North Carolina 90.2 86.0 1.98 1.38 7,444 4,529Oklahoma 89.2 90.2 1.91 2.57 3,109 5,636South Carolina 88.6 86.3 1.96 2.02 3,922 5,679Tennessee 84.5 85.1 1.20 1.24 1,541 2,197Texas 89.4 89.0 0.68 0.60 -6,924 -11,471Virginia 81.5 81.7 1.42 1.39 5,336 5,408West Virginia 84.7 86.3 2.51 3.85 3,182 5,569West 86.5 86.0 1.50 1.34 6615 1,5835
Alaska 54.9 66.7 0.14 0.16 -1,881 -1,609Arizona 89.1 89.3 6.43 3.68 23,687 15,421California 91.0 89.5 1.22 1.16 5,811 6,648Colorado 82.6 76.8 1.60 1.18 5,081 1,873Hawaii 66.8 62.2 0.52 0.50 -1,589 -1,980Idaho 73.7 74.0 1.23 1.80 661 2,587Montana 76.3 79.2 0.99 2.01 -19 1,583Nevada 82.6 77.2 0.63 0.49 -1,035 -2,233New Mexico 78.4 84.2 0.70 1.07 -1,177 211Oregon 82.5 81.6 1.33 1.89 1,632 4,406Utah 91.8 91.6 4.88 4.32 7,126 7,630Washington 77.1 78.6 0.63 0.83 -3,474 -1,899Wyoming 74.5 75.7 2.56 1.44 1,736 505Midwest 83.3 80.5 1.11 1.20 3995 2,7305
Illinois 77.6 69.3 0.81 0.47 -4,913 -19,011Indiana 86.9 85.9 2.10 2.47 8,083 11,145Iowa 87.5 87.1 3.28 4.15 8,632 11,214Kansas 83.9 84.6 1.25 2.18 1,112 5,002Michigan 90.0 88.4 0.82 1.15 -1,785 1,491Minnesota 77.4 70.5 0.83 0.67 -2,222 -5,003Missouri 83.6 81.3 1.30 1.31 2,497 3,023Nebraska 83.0 81.8 1.06 1.49 191 1,517North Dakota 71.6 74.4 1.69 2.75 1,365 2,733Ohio 84.5 85.5 0.87 1.49 -2,146 7,206South Dakota 78.4 76.6 1.32 2.02 606 1,620Wisconsin 82.5 80.7 0.99 1.29 -82 2,726
Northeast 74.5 74.1 1.00 1.11 2,0165 4,2985
Connecticut 55.7 59.6 0.60 0.72 -6,008 -4,406Maine 67.2 72.2 0.79 1.38 -858 1,190Massachusetts 70.4 68.0 1.39 1.36 7,365 7,738New Hampshire 54.0 55.3 1.10 1.82 550 4,298New Jersey 62.1 64.2 0.14 0.19 -29,559 -28,801New York 81.9 82.0 1.16 1.28 5,309 9,408Pennsylvania 84.5 82.3 1.80 1.85 15,329 17,131Rhode Island 70.0 65.1 3.22 3.01 6,434 6,438,Vermont 46.4 50.3 1.73 2.35 2,016 3,020
District of Columbia 25.9 26.7 3.65 3.16 6,624 5,713
1 This percentage reflects the relationship of in-state first-time freshmen (FTF) students to the total FTF enrollment in the state.
2 This ratio is the number of first-time freshmen (FTF) who migrated to a state to enroll in college divided by the number of FTF who migrated out of the state to enroll in college. States with ratios of less than 1 are exporters and those with ratios of greater than 1 are importers of FTF. For example, the 2.02 ratio for South Carolina in 2016 means that 2.02 FTF from other states enrolled in college in South Carolina for every one FTF from South Carolina.
3 The net gain or loss for each state is the number of FTF entering the state to attend college minus those leaving the state to attend college.
4 The net gain for the United States is the number of first-time college students coming to U.S. colleges from foreign countries and territories, such as Puerto Rico.
5 The net gains for the regions are the medians of state figures in each region. They are not a count of net migration into and out of each region.
Sources: National Center for Education Statistics, Digest of Education Statistics (2007) — www.nces.ed.gov.
SREB analysis of National Center for Education Statistics fall 2016 enrollment survey — www.nces.ed.gov/ipeds.
Table 19Migration of First-Time Freshmen (FTF)
Percent of State's FTF Enrolled in College Net Gain or Loss of in Home State1 Import/Export Ratio2 First-Time Freshmen3
Fall 2006 Fall 2016 Fall 2006 Fall 2016 Fall 2006 Fall 2016
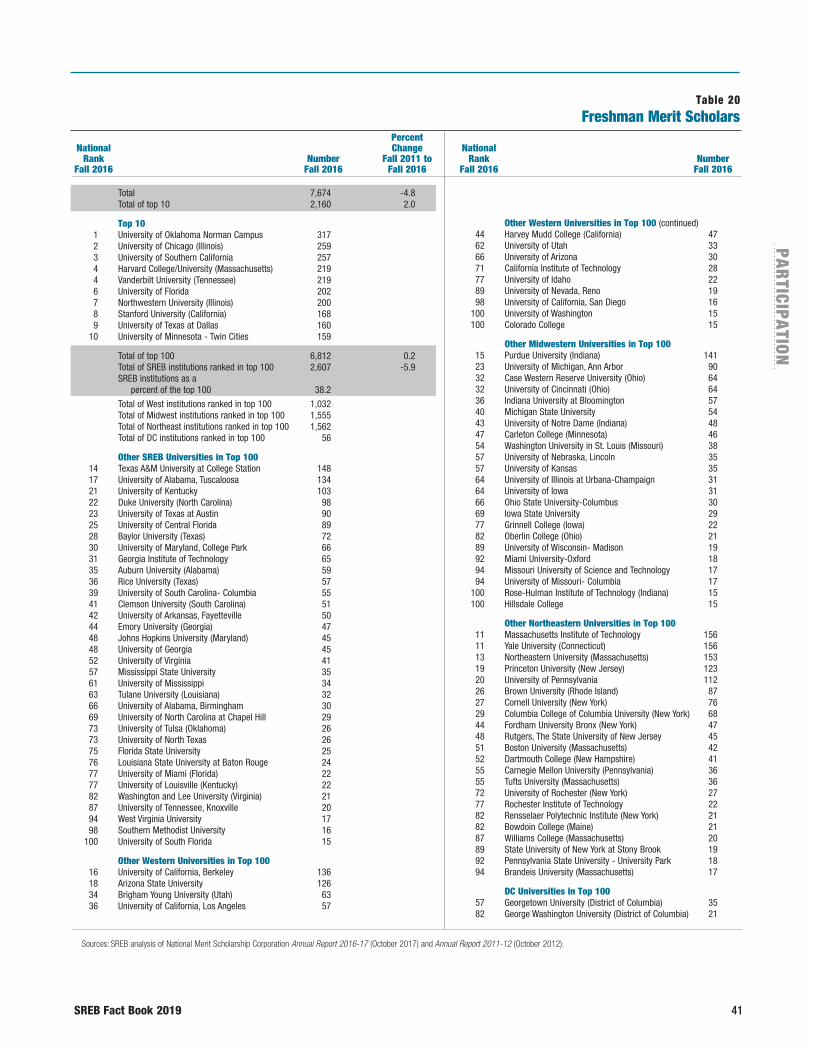
SREB Fact Book 2019 41
PAR
TICIPATIO
N
Table 20Freshman Merit Scholars
Percent National Change National Rank Number Fall 2011 to Rank Number Fall 2016 Fall 2016 Fall 2016 Fall 2016 Fall 2016
Total 7,674 -4.8 Total of top 10 2,160 2.0 Top 10 1 University of Oklahoma Norman Campus 317 2 University of Chicago (Illinois) 259 3 University of Southern California 257 4 Harvard College/University (Massachusetts) 219 4 Vanderbilt University (Tennessee) 219 6 University of Florida 202 7 Northwestern University (Illinois) 200 8 Stanford University (California) 168 9 University of Texas at Dallas 160 10 University of Minnesota - Twin Cities 159 Total of top 100 6,812 0.2 Total of SREB institutions ranked in top 100 2,607 -5.9 SREB institutions as a percent of the top 100 38.2
Total of West institutions ranked in top 100 1,032 Total of Midwest institutions ranked in top 100 1,555 Total of Northeast institutions ranked in top 100 1,562 Total of DC institutions ranked in top 100 56 Other SREB Universities in Top 100 14 Texas A&M University at College Station 148 17 University of Alabama, Tuscaloosa 134 21 University of Kentucky 103 22 Duke University (North Carolina) 98 23 University of Texas at Austin 90 25 University of Central Florida 89 28 Baylor University (Texas) 72 30 University of Maryland, College Park 66 31 Georgia Institute of Technology 65 35 Auburn University (Alabama) 59 36 Rice University (Texas) 57 39 University of South Carolina- Columbia 55 41 Clemson University (South Carolina) 51 42 University of Arkansas, Fayetteville 50 44 Emory University (Georgia) 47 48 Johns Hopkins University (Maryland) 45 48 University of Georgia 45 52 University of Virginia 41 57 Mississippi State University 35 61 University of Mississippi 34 63 Tulane University (Louisiana) 32 66 University of Alabama, Birmingham 30 69 University of North Carolina at Chapel Hill 29 73 University of Tulsa (Oklahoma) 26 73 University of North Texas 26 75 Florida State University 25 76 Louisiana State University at Baton Rouge 24 77 University of Miami (Florida) 22 77 University of Louisville (Kentucky) 22 82 Washington and Lee University (Virginia) 21 87 University of Tennessee, Knoxville 20 94 West Virginia University 17 98 Southern Methodist University 16 100 University of South Florida 15 Other Western Universities in Top 100 16 University of California, Berkeley 136 18 Arizona State University 126 34 Brigham Young University (Utah) 63 36 University of California, Los Angeles 57
Other Western Universities in Top 100 (continued) 44 Harvey Mudd College (California) 47 62 University of Utah 33 66 University of Arizona 30 71 California Institute of Technology 28 77 University of Idaho 22 89 University of Nevada, Reno 19 98 University of California, San Diego 16 100 University of Washington 15 100 Colorado College 15 Other Midwestern Universities in Top 100 15 Purdue University (Indiana) 141 23 University of Michigan, Ann Arbor 90 32 Case Western Reserve University (Ohio) 64 32 University of Cincinnati (Ohio) 64 36 Indiana University at Bloomington 57 40 Michigan State University 54 43 University of Notre Dame (Indiana) 48 47 Carleton College (Minnesota) 46 54 Washington University in St. Louis (Missouri) 38 57 University of Nebraska, Lincoln 35 57 University of Kansas 35 64 University of Illinois at Urbana-Champaign 31 64 University of Iowa 31 66 Ohio State University-Columbus 30 69 Iowa State University 29 77 Grinnell College (Iowa) 22 82 Oberlin College (Ohio) 21 89 University of Wisconsin- Madison 19 92 Miami University-Oxford 18 94 Missouri University of Science and Technology 17 94 University of Missouri- Columbia 17 100 Rose-Hulman Institute of Technology (Indiana) 15 100 Hillsdale College 15
Other Northeastern Universities in Top 100 11 Massachusetts Institute of Technology 156 11 Yale University (Connecticut) 156 13 Northeastern University (Massachusetts) 153 19 Princeton University (New Jersey) 123 20 University of Pennsylvania 112 26 Brown University (Rhode Island) 87 27 Cornell University (New York) 76 29 Columbia College of Columbia University (New York) 68 44 Fordham University Bronx (New York) 47 48 Rutgers, The State University of New Jersey 45 51 Boston University (Massachusetts) 42 52 Dartmouth College (New Hampshire) 41 55 Carnegie Mellon University (Pennsylvania) 36 55 Tufts University (Massachusetts) 36 72 University of Rochester (New York) 27 77 Rochester Institute of Technology 22 82 Rensselaer Polytechnic Institute (New York) 21 82 Bowdoin College (Maine) 21 87 Williams College (Massachusetts) 20 89 State University of New York at Stony Brook 19 92 Pennsylvania State University - University Park 18 94 Brandeis University (Massachusetts) 17
DC Universities in Top 100 57 Georgetown University (District of Columbia) 35 82 George Washington University (District of Columbia) 21
Sources: SREB analysis of National Merit Scholarship Corporation Annual Report 2016-17 (October 2017) and Annual Report 2011-12 (October 2012).

42 SREB Fact Book 2019
Table 21Total Enrollment in Higher Education1
Percent Change Percent in Total Public Public Colleges Fall 2017 2007 to 2012 2012 to 2017 2007 to 2012 2012 to 2017 2007 2012 2017
50 states and D.C. 19,348,627 11.2 -4.6 10.2 -2.3 73.9 73.3 75.0
SREB states 6,755,370 18.1 -3.0 15.1 -0.6 81.7 79.7 81.6as a percent of U.S. 34.9 Alabama 285,329 15.7 -8.1 5.6 1.2 88.6 80.9 89.0Arkansas 164,082 16.0 -7.0 16.0 -6.7 89.1 89.1 89.4Delaware 60,338 11.1 3.8 5.2 2.9 74.7 70.7 70.1Florida 1,065,654 25.8 -7.3 17.8 -1.2 74.8 70.0 74.6Georgia 530,549 17.5 -0.5 17.3 1.5 79.3 79.2 80.8Kentucky 256,494 8.6 -8.5 6.1 -9.7 81.8 79.9 78.9Louisiana 242,065 15.2 -6.5 14.3 -4.7 86.0 85.4 87.0Maryland 364,207 14.3 -2.7 15.1 -2.2 82.3 82.9 83.4Mississippi 171,751 13.8 -2.8 12.9 -3.6 90.1 89.4 88.7North Carolina 563,831 15.1 -2.5 13.4 -2.4 81.8 80.6 80.6Oklahoma 202,051 10.7 -11.6 9.8 -10.7 86.1 85.4 86.2South Carolina 246,388 19.2 -5.1 15.8 -4.0 82.9 80.5 81.4Tennessee 322,991 15.4 -6.0 12.7 -5.0 70.0 68.4 69.1Texas 1,629,951 21.4 5.8 21.5 7.5 87.4 87.5 88.9Virginia 554,212 23.1 -5.9 10.3 -4.8 77.5 69.4 70.2West Virginia 95,477 -10.9 -8.3 5.9 -9.8 75.2 89.4 87.9West 4,999,373 7.5 -1.7 5.2 2.1 79.4 77.7 80.7as a percent of U.S. 25.8 Alaska 26,905 7.1 -18.0 4.1 -15.5 96.0 93.3 96.1Arizona 582,870 14.6 -18.5 8.2 2.1 53.2 50.2 62.9California 2,692,774 3.2 3.1 -0.3 5.5 84.4 81.5 83.4Colorado 339,494 6.5 2.7 17.2 -0.2 73.4 80.8 78.5Hawaii 64,125 17.8 -18.3 19.5 -14.3 75.8 76.9 80.6Idaho 131,803 37.0 22.0 30.2 -3.8 76.8 72.9 57.5Montana 50,642 12.4 -4.9 12.8 -4.8 90.5 90.8 90.8Nevada 117,574 1.7 -0.6 -1.1 4.1 90.1 87.6 91.7New Mexico 129,494 16.4 -17.2 17.6 -14.7 92.9 93.8 96.7Oregon 229,273 25.3 -9.8 28.5 -9.4 81.4 83.5 83.9Utah 233,460 10.9 3.4 15.6 5.3 72.7 75.7 77.1Washington 367,944 3.8 0.7 3.2 2.2 85.7 85.2 86.5Wyoming 33,015 7.3 -12.7 6.4 -9.2 95.6 94.8 98.6Midwest 4,112,150 8.8 -11.9 8.9 -8.1 71.3 71.4 74.5as a percent of U.S. 21.3 Illinois 747,303 1.9 -12.4 1.1 -14.2 65.8 65.3 64.0Indiana 398,804 17.6 -10.8 19.7 -9.6 73.3 74.6 75.6Iowa 260,901 40.9 -27.8 12.2 -1.8 60.3 48.1 65.3Kansas 204,466 10.1 -4.4 8.2 -2.2 87.6 86.1 88.0Michigan 558,053 3.2 -15.9 4.0 -11.4 80.8 81.4 85.8Minnesota 327,002 -6.8 -10.6 8.7 -8.4 63.8 74.5 76.3Missouri 382,486 12.3 -11.4 15.4 -8.5 58.1 59.6 61.6Nebraska 135,864 9.6 -2.7 7.7 -3.0 75.9 74.6 74.4North Dakota 53,749 10.5 -2.6 13.7 -2.8 86.1 88.7 88.5Ohio 649,687 12.6 -8.5 13.9 -5.1 73.0 73.9 76.6South Dakota 53,620 12.7 -4.3 13.5 1.0 78.2 78.8 83.2Wisconsin 340,215 7.6 -8.0 7.2 -4.9 79.6 79.4 82.0Northeast 3,385,735 8.3 -2.3 9.6 -5.6 57.4 58.1 56.1as a percent of U.S. 17.5 Connecticut 196,034 12.7 -2.8 9.5 -8.3 63.7 62.0 58.5Maine 71,811 8.4 -1.4 4.0 -6.5 72.0 69.0 65.4Massachusetts 502,333 11.2 -2.5 14.8 -6.5 42.9 44.3 42.5New Hampshire 149,184 16.9 80.4 3.1 -8.1 59.4 52.4 26.7New Jersey 419,037 10.5 -4.8 12.0 -6.1 79.9 81.0 79.8New York 1,222,104 8.1 -3.6 10.7 -3.4 55.6 57.0 57.1Pennsylvania 699,783 4.5 -7.7 5.2 -7.4 54.7 55.1 55.3Rhode Island 81,594 1.1 -2.7 4.1 -5.1 50.1 51.5 50.3Vermont 43,855 6.0 -1.9 6.7 -4.5 58.8 59.3 57.7District of Columbia 95,999 -21.7 6.5 -2.4 -17.3 4.9 6.1 4.7
1 Table shows enrollments in degree-granting institutions eligible for federal Title IV student financial aid in the 50 states and D.C., excluding service schools and online-only colleges and universities.
Source: SREB analysis of National Center for Education Statistics fall enrollment surveys — www.nces.ed.gov/ipeds.
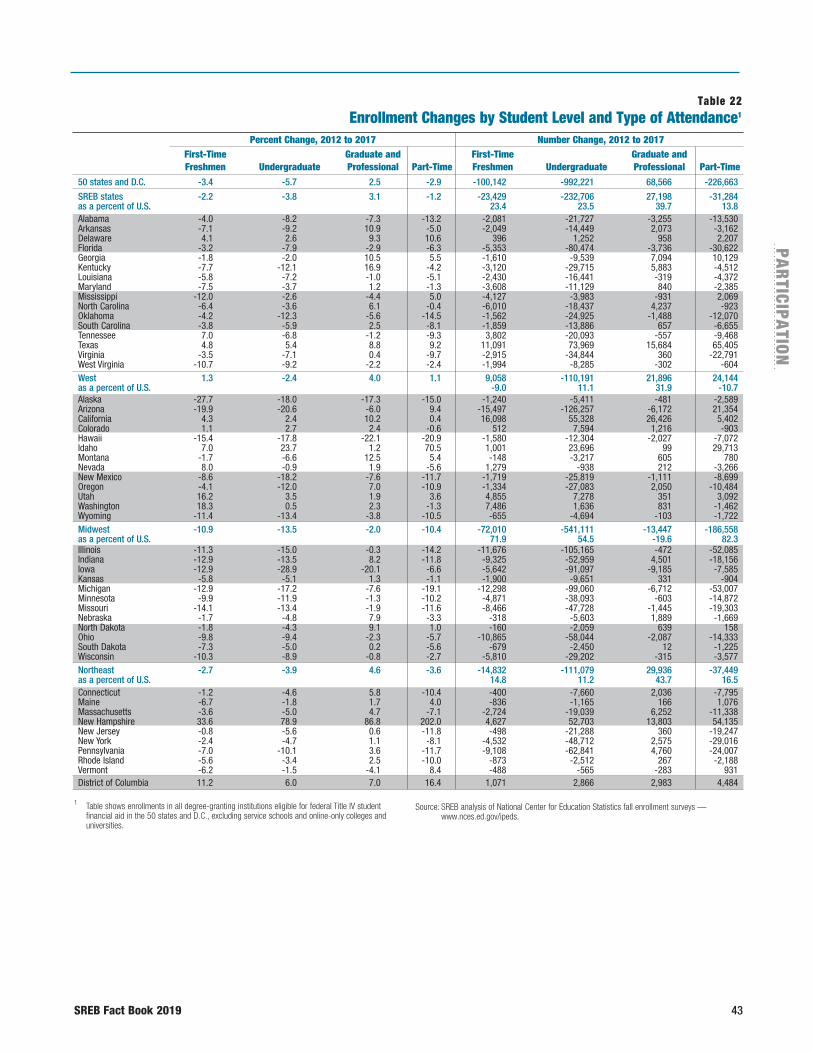
SREB Fact Book 2019 43
PAR
TICIPATIO
N
Table 22Enrollment Changes by Student Level and Type of Attendance1
Percent Change, 2012 to 2017 Number Change, 2012 to 2017 First-Time Graduate and First-Time Graduate and Freshmen Undergraduate Professional Part-Time Freshmen Undergraduate Professional Part-Time
50 states and D.C. -3.4 -5.7 2.5 -2.9 -100,142 -992,221 68,566 -226,663
SREB states -2.2 -3.8 3.1 -1.2 -23,429 -232,706 27,198 -31,284as a percent of U.S. 23.4 23.5 39.7 13.8Alabama -4.0 -8.2 -7.3 -13.2 -2,081 -21,727 -3,255 -13,530Arkansas -7.1 -9.2 10.9 -5.0 -2,049 -14,449 2,073 -3,162Delaware 4.1 2.6 9.3 10.6 396 1,252 958 2,207Florida -3.2 -7.9 -2.9 -6.3 -5,353 -80,474 -3,736 -30,622Georgia -1.8 -2.0 10.5 5.5 -1,610 -9,539 7,094 10,129Kentucky -7.7 -12.1 16.9 -4.2 -3,120 -29,715 5,883 -4,512Louisiana -5.8 -7.2 -1.0 -5.1 -2,430 -16,441 -319 -4,372Maryland -7.5 -3.7 1.2 -1.3 -3,608 -11,129 840 -2,385Mississippi -12.0 -2.6 -4.4 5.0 -4,127 -3,983 -931 2,069North Carolina -6.4 -3.6 6.1 -0.4 -6,010 -18,437 4,237 -923Oklahoma -4.2 -12.3 -5.6 -14.5 -1,562 -24,925 -1,488 -12,070South Carolina -3.8 -5.9 2.5 -8.1 -1,859 -13,886 657 -6,655Tennessee 7.0 -6.8 -1.2 -9.3 3,802 -20,093 -557 -9,468Texas 4.8 5.4 8.8 9.2 11,091 73,969 15,684 65,405Virginia -3.5 -7.1 0.4 -9.7 -2,915 -34,844 360 -22,791West Virginia -10.7 -9.2 -2.2 -2.4 -1,994 -8,285 -302 -604West 1.3 -2.4 4.0 1.1 9,058 -110,191 21,896 24,144as a percent of U.S. -9.0 11.1 31.9 -10.7Alaska -27.7 -18.0 -17.3 -15.0 -1,240 -5,411 -481 -2,589Arizona -19.9 -20.6 -6.0 9.4 -15,497 -126,257 -6,172 21,354California 4.3 2.4 10.2 0.4 16,098 55,328 26,426 5,402Colorado 1.1 2.7 2.4 -0.6 512 7,594 1,216 -903Hawaii -15.4 -17.8 -22.1 -20.9 -1,580 -12,304 -2,027 -7,072Idaho 7.0 23.7 1.2 70.5 1,001 23,696 99 29,713Montana -1.7 -6.6 12.5 5.4 -148 -3,217 605 780Nevada 8.0 -0.9 1.9 -5.6 1,279 -938 212 -3,266New Mexico -8.6 -18.2 -7.6 -11.7 -1,719 -25,819 -1,111 -8,699Oregon -4.1 -12.0 7.0 -10.9 -1,334 -27,083 2,050 -10,484Utah 16.2 3.5 1.9 3.6 4,855 7,278 351 3,092Washington 18.3 0.5 2.3 -1.3 7,486 1,636 831 -1,462Wyoming -11.4 -13.4 -3.8 -10.5 -655 -4,694 -103 -1,722Midwest -10.9 -13.5 -2.0 -10.4 -72,010 -541,111 -13,447 -186,558as a percent of U.S. 71.9 54.5 -19.6 82.3Illinois -11.3 -15.0 -0.3 -14.2 -11,676 -105,165 -472 -52,085Indiana -12.9 -13.5 8.2 -11.8 -9,325 -52,959 4,501 -18,156Iowa -12.9 -28.9 -20.1 -6.6 -5,642 -91,097 -9,185 -7,585Kansas -5.8 -5.1 1.3 -1.1 -1,900 -9,651 331 -904Michigan -12.9 -17.2 -7.6 -19.1 -12,298 -99,060 -6,712 -53,007Minnesota -9.9 -11.9 -1.3 -10.2 -4,871 -38,093 -603 -14,872Missouri -14.1 -13.4 -1.9 -11.6 -8,466 -47,728 -1,445 -19,303Nebraska -1.7 -4.8 7.9 -3.3 -318 -5,603 1,889 -1,669North Dakota -1.8 -4.3 9.1 1.0 -160 -2,059 639 158Ohio -9.8 -9.4 -2.3 -5.7 -10,865 -58,044 -2,087 -14,333South Dakota -7.3 -5.0 0.2 -5.6 -679 -2,450 12 -1,225Wisconsin -10.3 -8.9 -0.8 -2.7 -5,810 -29,202 -315 -3,577Northeast -2.7 -3.9 4.6 -3.6 -14,832 -111,079 29,936 -37,449as a percent of U.S. 14.8 11.2 43.7 16.5Connecticut -1.2 -4.6 5.8 -10.4 -400 -7,660 2,036 -7,795Maine -6.7 -1.8 1.7 4.0 -836 -1,165 166 1,076Massachusetts -3.6 -5.0 4.7 -7.1 -2,724 -19,039 6,252 -11,338New Hampshire 33.6 78.9 86.8 202.0 4,627 52,703 13,803 54,135New Jersey -0.8 -5.6 0.6 -11.8 -498 -21,288 360 -19,247New York -2.4 -4.7 1.1 -8.1 -4,532 -48,712 2,575 -29,016Pennsylvania -7.0 -10.1 3.6 -11.7 -9,108 -62,841 4,760 -24,007Rhode Island -5.6 -3.4 2.5 -10.0 -873 -2,512 267 -2,188Vermont -6.2 -1.5 -4.1 8.4 -488 -565 -283 931District of Columbia 11.2 6.0 7.0 16.4 1,071 2,866 2,983 4,484
1 Table shows enrollments in all degree-granting institutions eligible for federal Title IV student financial aid in the 50 states and D.C., excluding service schools and online-only colleges and universities.
Source: SREB analysis of National Center for Education Statistics fall enrollment surveys — www.nces.ed.gov/ipeds.
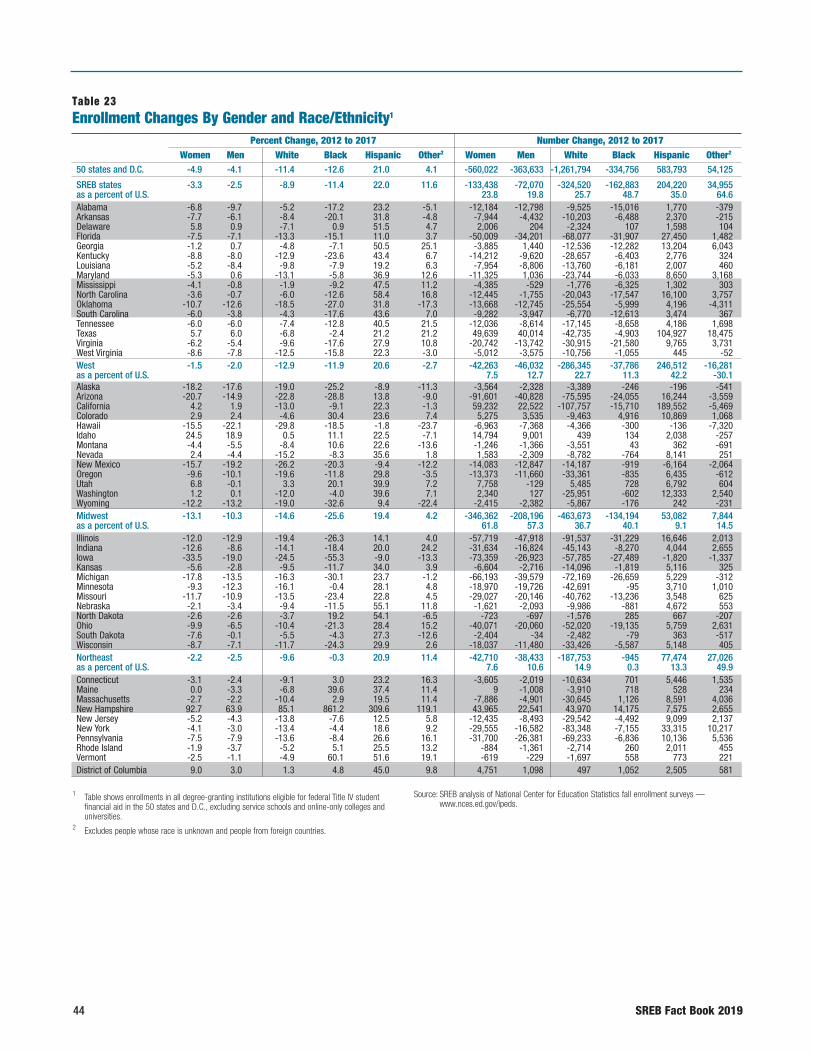
44 SREB Fact Book 2019
Table 23Enrollment Changes By Gender and Race/Ethnicity1
Percent Change, 2012 to 2017 Number Change, 2012 to 2017 Women Men White Black Hispanic Other2 Women Men White Black Hispanic Other2
50 states and D.C. -4.9 -4.1 -11.4 -12.6 21.0 4.1 -560,022 -363,633 -1,261,794 -334,756 583,793 54,125
SREB states -3.3 -2.5 -8.9 -11.4 22.0 11.6 -133,438 -72,070 -324,520 -162,883 204,220 34,955as a percent of U.S. 23.8 19.8 25.7 48.7 35.0 64.6Alabama -6.8 -9.7 -5.2 -17.2 23.2 -5.1 -12,184 -12,798 -9,525 -15,016 1,770 -379Arkansas -7.7 -6.1 -8.4 -20.1 31.8 -4.8 -7,944 -4,432 -10,203 -6,488 2,370 -215Delaware 5.8 0.9 -7.1 0.9 51.5 4.7 2,006 204 -2,324 107 1,598 104Florida -7.5 -7.1 -13.3 -15.1 11.0 3.7 -50,009 -34,201 -68,077 -31,907 27,450 1,482Georgia -1.2 0.7 -4.8 -7.1 50.5 25.1 -3,885 1,440 -12,536 -12,282 13,204 6,043Kentucky -8.8 -8.0 -12.9 -23.6 43.4 6.7 -14,212 -9,620 -28,657 -6,403 2,776 324Louisiana -5.2 -8.4 -9.8 -7.9 19.2 6.3 -7,954 -8,806 -13,760 -6,181 2,007 460Maryland -5.3 0.6 -13.1 -5.8 36.9 12.6 -11,325 1,036 -23,744 -6,033 8,650 3,168Mississippi -4.1 -0.8 -1.9 -9.2 47.5 11.2 -4,385 -529 -1,776 -6,325 1,302 303North Carolina -3.6 -0.7 -6.0 -12.6 58.4 16.8 -12,445 -1,755 -20,043 -17,547 16,100 3,757Oklahoma -10.7 -12.6 -18.5 -27.0 31.8 -17.3 -13,668 -12,745 -25,554 -5,999 4,196 -4,311South Carolina -6.0 -3.8 -4.3 -17.6 43.6 7.0 -9,282 -3,947 -6,770 -12,613 3,474 367Tennessee -6.0 -6.0 -7.4 -12.8 40.5 21.5 -12,036 -8,614 -17,145 -8,658 4,186 1,698Texas 5.7 6.0 -6.8 -2.4 21.2 21.2 49,639 40,014 -42,735 -4,903 104,927 18,475Virginia -6.2 -5.4 -9.6 -17.6 27.9 10.8 -20,742 -13,742 -30,915 -21,580 9,765 3,731West Virginia -8.6 -7.8 -12.5 -15.8 22.3 -3.0 -5,012 -3,575 -10,756 -1,055 445 -52West -1.5 -2.0 -12.9 -11.9 20.6 -2.7 -42,263 -46,032 -286,345 -37,786 246,512 -16,281as a percent of U.S. 7.5 12.7 22.7 11.3 42.2 -30.1Alaska -18.2 -17.6 -19.0 -25.2 -8.9 -11.3 -3,564 -2,328 -3,389 -246 -196 -541Arizona -20.7 -14.9 -22.8 -28.8 13.8 -9.0 -91,601 -40,828 -75,595 -24,055 16,244 -3,559California 4.2 1.9 -13.0 -9.1 22.3 -1.3 59,232 22,522 -107,757 -15,710 189,552 -5,469Colorado 2.9 2.4 -4.6 30.4 23.6 7.4 5,275 3,535 -9,463 4,916 10,869 1,068Hawaii -15.5 -22.1 -29.8 -18.5 -1.8 -23.7 -6,963 -7,368 -4,366 -300 -136 -7,320Idaho 24.5 18.9 0.5 11.1 22.5 -7.1 14,794 9,001 439 134 2,038 -257Montana -4.4 -5.5 -8.4 10.6 22.6 -13.6 -1,246 -1,366 -3,551 43 362 -691Nevada 2.4 -4.4 -15.2 -8.3 35.6 1.8 1,583 -2,309 -8,782 -764 8,141 251New Mexico -15.7 -19.2 -26.2 -20.3 -9.4 -12.2 -14,083 -12,847 -14,187 -919 -6,164 -2,064Oregon -9.6 -10.1 -19.6 -11.8 29.8 -3.5 -13,373 -11,660 -33,361 -835 6,435 -612Utah 6.8 -0.1 3.3 20.1 39.9 7.2 7,758 -129 5,485 728 6,792 604Washington 1.2 0.1 -12.0 -4.0 39.6 7.1 2,340 127 -25,951 -602 12,333 2,540Wyoming -12.2 -13.2 -19.0 -32.6 9.4 -22.4 -2,415 -2,382 -5,867 -176 242 -231Midwest -13.1 -10.3 -14.6 -25.6 19.4 4.2 -346,362 -208,196 -463,673 -134,194 53,082 7,844as a percent of U.S. 61.8 57.3 36.7 40.1 9.1 14.5Illinois -12.0 -12.9 -19.4 -26.3 14.1 4.0 -57,719 -47,918 -91,537 -31,229 16,646 2,013Indiana -12.6 -8.6 -14.1 -18.4 20.0 24.2 -31,634 -16,824 -45,143 -8,270 4,044 2,655Iowa -33.5 -19.0 -24.5 -55.3 -9.0 -13.3 -73,359 -26,923 -57,785 -27,489 -1,820 -1,337Kansas -5.6 -2.8 -9.5 -11.7 34.0 3.9 -6,604 -2,716 -14,096 -1,819 5,116 325Michigan -17.8 -13.5 -16.3 -30.1 23.7 -1.2 -66,193 -39,579 -72,169 -26,659 5,229 -312Minnesota -9.3 -12.3 -16.1 -0.4 28.1 4.8 -18,970 -19,726 -42,691 -95 3,710 1,010Missouri -11.7 -10.9 -13.5 -23.4 22.8 4.5 -29,027 -20,146 -40,762 -13,236 3,548 625Nebraska -2.1 -3.4 -9.4 -11.5 55.1 11.8 -1,621 -2,093 -9,986 -881 4,672 553North Dakota -2.6 -2.6 -3.7 19.2 54.1 -6.5 -723 -697 -1,576 285 667 -207Ohio -9.9 -6.5 -10.4 -21.3 28.4 15.2 -40,071 -20,060 -52,020 -19,135 5,759 2,631South Dakota -7.6 -0.1 -5.5 -4.3 27.3 -12.6 -2,404 -34 -2,482 -79 363 -517Wisconsin -8.7 -7.1 -11.7 -24.3 29.9 2.6 -18,037 -11,480 -33,426 -5,587 5,148 405Northeast -2.2 -2.5 -9.6 -0.3 20.9 11.4 -42,710 -38,433 -187,753 -945 77,474 27,026as a percent of U.S. 7.6 10.6 14.9 0.3 13.3 49.9Connecticut -3.1 -2.4 -9.1 3.0 23.2 16.3 -3,605 -2,019 -10,634 701 5,446 1,535Maine 0.0 -3.3 -6.8 39.6 37.4 11.4 9 -1,008 -3,910 718 528 234Massachusetts -2.7 -2.2 -10.4 2.9 19.5 11.4 -7,886 -4,901 -30,645 1,126 8,591 4,036New Hampshire 92.7 63.9 85.1 861.2 309.6 119.1 43,965 22,541 43,970 14,175 7,575 2,655New Jersey -5.2 -4.3 -13.8 -7.6 12.5 5.8 -12,435 -8,493 -29,542 -4,492 9,099 2,137New York -4.1 -3.0 -13.4 -4.4 18.6 9.2 -29,555 -16,582 -83,348 -7,155 33,315 10,217Pennsylvania -7.5 -7.9 -13.6 -8.4 26.6 16.1 -31,700 -26,381 -69,233 -6,836 10,136 5,536Rhode Island -1.9 -3.7 -5.2 5.1 25.5 13.2 -884 -1,361 -2,714 260 2,011 455Vermont -2.5 -1.1 -4.9 60.1 51.6 19.1 -619 -229 -1,697 558 773 221District of Columbia 9.0 3.0 1.3 4.8 45.0 9.8 4,751 1,098 497 1,052 2,505 581
1 Table shows enrollments in all degree-granting institutions eligible for federal Title IV student financial aid in the 50 states and D.C., excluding service schools and online-only colleges and universities.
2 Excludes people whose race is unknown and people from foreign countries.
Source: SREB analysis of National Center for Education Statistics fall enrollment surveys — www.nces.ed.gov/ipeds.
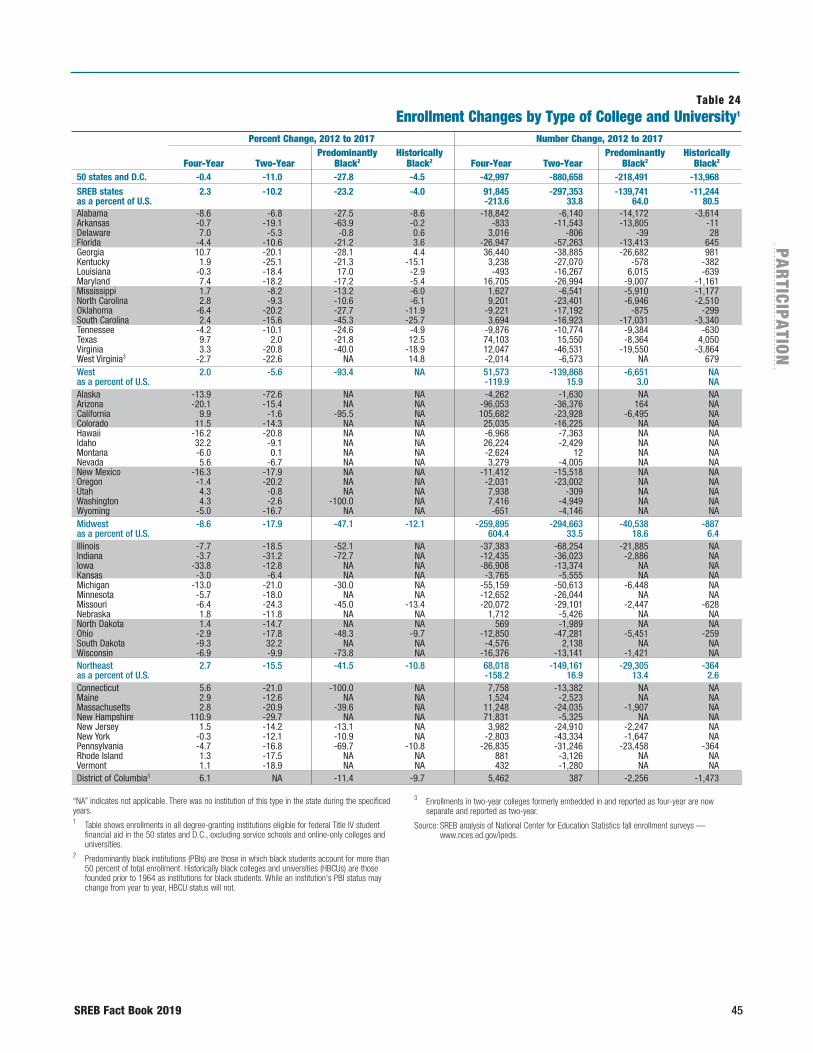
SREB Fact Book 2019 45
PAR
TICIPATIO
N
Table 24Enrollment Changes by Type of College and University1
Percent Change, 2012 to 2017 Number Change, 2012 to 2017 Predominantly Historically Predominantly Historically Four-Year Two-Year Black2 Black2 Four-Year Two-Year Black2 Black2
50 states and D.C. -0.4 -11.0 -27.8 -4.5 -42,997 -880,658 -218,491 -13,968
SREB states 2.3 -10.2 -23.2 -4.0 91,845 -297,353 -139,741 -11,244 as a percent of U.S. -213.6 33.8 64.0 80.5 Alabama -8.6 -6.8 -27.5 -8.6 -18,842 -6,140 -14,172 -3,614Arkansas -0.7 -19.1 -63.9 -0.2 -833 -11,543 -13,805 -11Delaware 7.0 -5.3 -0.8 0.6 3,016 -806 -39 28Florida -4.4 -10.6 -21.2 3.6 -26,947 -57,263 -13,413 645Georgia 10.7 -20.1 -28.1 4.4 36,440 -38,885 -26,682 981Kentucky 1.9 -25.1 -21.3 -15.1 3,238 -27,070 -578 -382Louisiana -0.3 -18.4 17.0 -2.9 -493 -16,267 6,015 -639Maryland 7.4 -18.2 -17.2 -5.4 16,705 -26,994 -9,007 -1,161Mississippi 1.7 -8.2 -13.2 -6.0 1,627 -6,541 -5,910 -1,177North Carolina 2.8 -9.3 -10.6 -6.1 9,201 -23,401 -6,946 -2,510Oklahoma -6.4 -20.2 -27.7 -11.9 -9,221 -17,192 -875 -299South Carolina 2.4 -15.6 -45.3 -25.7 3,694 -16,923 -17,031 -3,340Tennessee -4.2 -10.1 -24.6 -4.9 -9,876 -10,774 -9,384 -630Texas 9.7 2.0 -21.8 12.5 74,103 15,550 -8,364 4,050Virginia 3.3 -20.8 -40.0 -18.9 12,047 -46,531 -19,550 -3,864West Virginia3 -2.7 -22.6 NA 14.8 -2,014 -6,573 NA 679West 2.0 -5.6 -93.4 NA 51,573 -139,868 -6,651 NAas a percent of U.S. -119.9 15.9 3.0 NAAlaska -13.9 -72.6 NA NA -4,262 -1,630 NA NAArizona -20.1 -15.4 NA NA -96,053 -36,376 164 NACalifornia 9.9 -1.6 -95.5 NA 105,682 -23,928 -6,495 NAColorado 11.5 -14.3 NA NA 25,035 -16,225 NA NAHawaii -16.2 -20.8 NA NA -6,968 -7,363 NA NAIdaho 32.2 -9.1 NA NA 26,224 -2,429 NA NAMontana -6.0 0.1 NA NA -2,624 12 NA NANevada 5.6 -6.7 NA NA 3,279 -4,005 NA NANew Mexico -16.3 -17.9 NA NA -11,412 -15,518 NA NAOregon -1.4 -20.2 NA NA -2,031 -23,002 NA NAUtah 4.3 -0.8 NA NA 7,938 -309 NA NAWashington 4.3 -2.6 -100.0 NA 7,416 -4,949 NA NAWyoming -5.0 -16.7 NA NA -651 -4,146 NA NAMidwest -8.6 -17.9 -47.1 -12.1 -259,895 -294,663 -40,538 -887as a percent of U.S. 604.4 33.5 18.6 6.4Illinois -7.7 -18.5 -52.1 NA -37,383 -68,254 -21,885 NAIndiana -3.7 -31.2 -72.7 NA -12,435 -36,023 -2,886 NAIowa -33.8 -12.8 NA NA -86,908 -13,374 NA NAKansas -3.0 -6.4 NA NA -3,765 -5,555 NA NAMichigan -13.0 -21.0 -30.0 NA -55,159 -50,613 -6,448 NAMinnesota -5.7 -18.0 NA NA -12,652 -26,044 NA NAMissouri -6.4 -24.3 -45.0 -13.4 -20,072 -29,101 -2,447 -628Nebraska 1.8 -11.8 NA NA 1,712 -5,426 NA NANorth Dakota 1.4 -14.7 NA NA 569 -1,989 NA NAOhio -2.9 -17.8 -48.3 -9.7 -12,850 -47,281 -5,451 -259South Dakota -9.3 32.2 NA NA -4,576 2,138 NA NAWisconsin -6.9 -9.9 -73.8 NA -16,376 -13,141 -1,421 NANortheast 2.7 -15.5 -41.5 -10.8 68,018 -149,161 -29,305 -364as a percent of U.S. -158.2 16.9 13.4 2.6Connecticut 5.6 -21.0 -100.0 NA 7,758 -13,382 NA NAMaine 2.9 -12.6 NA NA 1,524 -2,523 NA NAMassachusetts 2.8 -20.9 -39.6 NA 11,248 -24,035 -1,907 NANew Hampshire 110.9 -29.7 NA NA 71,831 -5,325 NA NANew Jersey 1.5 -14.2 -13.1 NA 3,982 -24,910 -2,247 NANew York -0.3 -12.1 -10.9 NA -2,803 -43,334 -1,647 NAPennsylvania -4.7 -16.8 -69.7 -10.8 -26,835 -31,246 -23,458 -364Rhode Island 1.3 -17.5 NA NA 881 -3,126 NA NAVermont 1.1 -18.9 NA NA 432 -1,280 NA NADistrict of Columbia3 6.1 NA -11.4 -9.7 5,462 387 -2,256 -1,473
“NA” indicates not applicable. There was no institution of this type in the state during the specificed years.1 Table shows enrollments in all degree-granting institutions eligible for federal Title IV student
financial aid in the 50 states and D.C., excluding service schools and online-only colleges and universities.
2 Predominantly black institutions (PBIs) are those in which black students account for more than 50 percent of total enrollment. Historically black colleges and universities (HBCUs) are those founded prior to 1964 as institutions for black students. While an institution's PBI status may change from year to year, HBCU status will not.
3 Enrollments in two-year colleges formerly embedded in and reported as four-year are now separate and reported as two-year.
Source: SREB analysis of National Center for Education Statistics fall enrollment surveys — www.nces.ed.gov/ipeds.
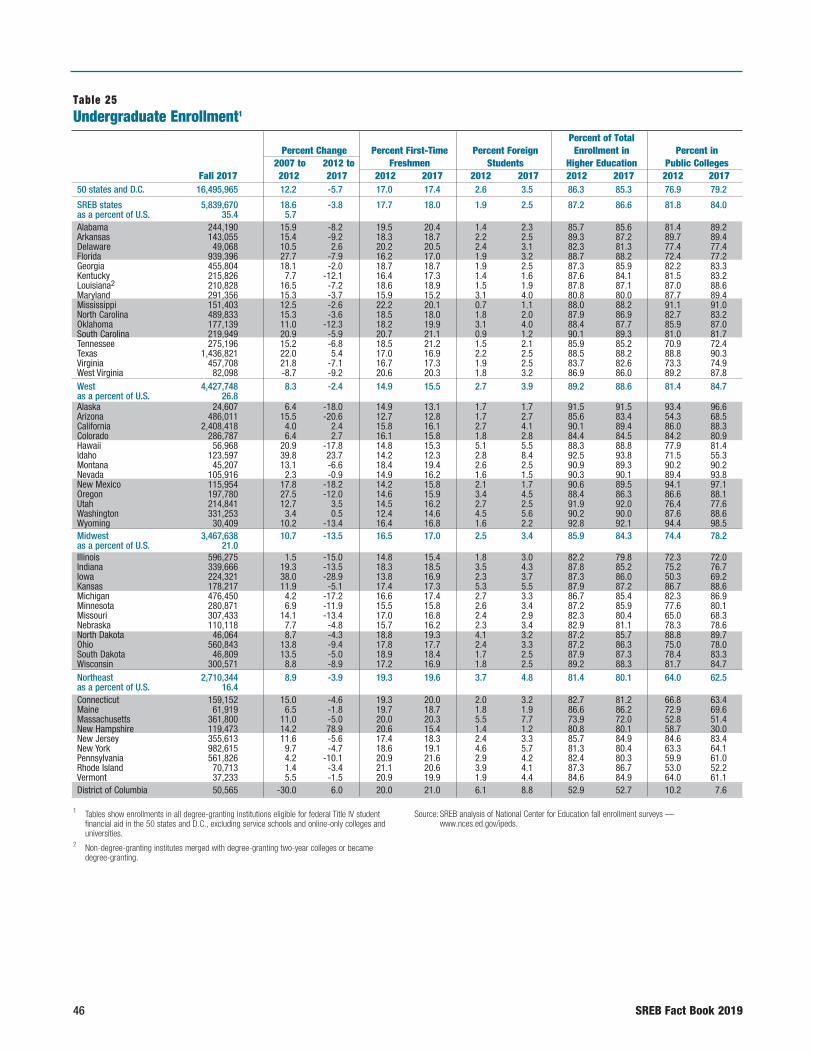
46 SREB Fact Book 2019
Table 25Undergraduate Enrollment1
Percent of Total Percent Change Percent First-Time Percent Foreign Enrollment in Percent in 2007 to 2012 to Freshmen Students Higher Education Public Colleges Fall 2017 2012 2017 2012 2017 2012 2017 2012 2017 2012 2017
1 Tables show enrollments in all degree-granting institutions eligible for federal Title IV student financial aid in the 50 states and D.C., excluding service schools and online-only colleges and universities.
2 Non-degree-granting institutes merged with degree-granting two-year colleges or became degree-granting.
Source: SREB analysis of National Center for Education fall enrollment surveys — www.nces.ed.gov/ipeds.
50 states and D.C. 16,495,965 12.2 -5.7 17.0 17.4 2.6 3.5 86.3 85.3 76.9 79.2
SREB states 5,839,670 18.6 -3.8 17.7 18.0 1.9 2.5 87.2 86.6 81.8 84.0as a percent of U.S. 35.4 5.7 Alabama 244,190 15.9 -8.2 19.5 20.4 1.4 2.3 85.7 85.6 81.4 89.2Arkansas 143,055 15.4 -9.2 18.3 18.7 2.2 2.5 89.3 87.2 89.7 89.4Delaware 49,068 10.5 2.6 20.2 20.5 2.4 3.1 82.3 81.3 77.4 77.4Florida 939,396 27.7 -7.9 16.2 17.0 1.9 3.2 88.7 88.2 72.4 77.2Georgia 455,804 18.1 -2.0 18.7 18.7 1.9 2.5 87.3 85.9 82.2 83.3Kentucky 215,826 7.7 -12.1 16.4 17.3 1.4 1.6 87.6 84.1 81.5 83.2Louisiana2 210,828 16.5 -7.2 18.6 18.9 1.5 1.9 87.8 87.1 87.0 88.6Maryland 291,356 15.3 -3.7 15.9 15.2 3.1 4.0 80.8 80.0 87.7 89.4Mississippi 151,403 12.5 -2.6 22.2 20.1 0.7 1.1 88.0 88.2 91.1 91.0North Carolina 489,833 15.3 -3.6 18.5 18.0 1.8 2.0 87.9 86.9 82.7 83.2Oklahoma 177,139 11.0 -12.3 18.2 19.9 3.1 4.0 88.4 87.7 85.9 87.0South Carolina 219,949 20.9 -5.9 20.7 21.1 0.9 1.2 90.1 89.3 81.0 81.7Tennessee 275,196 15.2 -6.8 18.5 21.2 1.5 2.1 85.9 85.2 70.9 72.4Texas 1,436,821 22.0 5.4 17.0 16.9 2.2 2.5 88.5 88.2 88.8 90.3Virginia 457,708 21.8 -7.1 16.7 17.3 1.9 2.5 83.7 82.6 73.3 74.9West Virginia 82,098 -8.7 -9.2 20.6 20.3 1.8 3.2 86.9 86.0 89.2 87.8West 4,427,748 8.3 -2.4 14.9 15.5 2.7 3.9 89.2 88.6 81.4 84.7as a percent of U.S. 26.8 Alaska 24,607 6.4 -18.0 14.9 13.1 1.7 1.7 91.5 91.5 93.4 96.6Arizona 486,011 15.5 -20.6 12.7 12.8 1.7 2.7 85.6 83.4 54.3 68.5California 2,408,418 4.0 2.4 15.8 16.1 2.7 4.1 90.1 89.4 86.0 88.3Colorado 286,787 6.4 2.7 16.1 15.8 1.8 2.8 84.4 84.5 84.2 80.9Hawaii 56,968 20.9 -17.8 14.8 15.3 5.1 5.5 88.3 88.8 77.9 81.4Idaho 123,597 39.8 23.7 14.2 12.3 2.8 8.4 92.5 93.8 71.5 55.3Montana 45,207 13.1 -6.6 18.4 19.4 2.6 2.5 90.9 89.3 90.2 90.2Nevada 105,916 2.3 -0.9 14.9 16.2 1.6 1.5 90.3 90.1 89.4 93.8New Mexico 115,954 17.8 -18.2 14.2 15.8 2.1 1.7 90.6 89.5 94.1 97.1Oregon 197,780 27.5 -12.0 14.6 15.9 3.4 4.5 88.4 86.3 86.6 88.1Utah 214,841 12.7 3.5 14.5 16.2 2.7 2.5 91.9 92.0 76.4 77.6Washington 331,253 3.4 0.5 12.4 14.6 4.5 5.6 90.2 90.0 87.6 88.6Wyoming 30,409 10.2 -13.4 16.4 16.8 1.6 2.2 92.8 92.1 94.4 98.5Midwest 3,467,638 10.7 -13.5 16.5 17.0 2.5 3.4 85.9 84.3 74.4 78.2as a percent of U.S. 21.0 Illinois 596,275 1.5 -15.0 14.8 15.4 1.8 3.0 82.2 79.8 72.3 72.0Indiana 339,666 19.3 -13.5 18.3 18.5 3.5 4.3 87.8 85.2 75.2 76.7Iowa 224,321 38.0 -28.9 13.8 16.9 2.3 3.7 87.3 86.0 50.3 69.2Kansas 178,217 11.9 -5.1 17.4 17.3 5.3 5.5 87.9 87.2 86.7 88.6Michigan 476,450 4.2 -17.2 16.6 17.4 2.7 3.3 86.7 85.4 82.3 86.9Minnesota 280,871 6.9 -11.9 15.5 15.8 2.6 3.4 87.2 85.9 77.6 80.1Missouri 307,433 14.1 -13.4 17.0 16.8 2.4 2.9 82.3 80.4 65.0 68.3Nebraska 110,118 7.7 -4.8 15.7 16.2 2.3 3.4 82.9 81.1 78.3 78.6North Dakota 46,064 8.7 -4.3 18.8 19.3 4.1 3.2 87.2 85.7 88.8 89.7Ohio 560,843 13.8 -9.4 17.8 17.7 2.4 3.3 87.2 86.3 75.0 78.0South Dakota 46,809 13.5 -5.0 18.9 18.4 1.7 2.5 87.9 87.3 78.4 83.3Wisconsin 300,571 8.8 -8.9 17.2 16.9 1.8 2.5 89.2 88.3 81.7 84.7Northeast 2,710,344 8.9 -3.9 19.3 19.6 3.7 4.8 81.4 80.1 64.0 62.5as a percent of U.S. 16.4 Connecticut 159,152 15.0 -4.6 19.3 20.0 2.0 3.2 82.7 81.2 66.8 63.4Maine 61,919 6.5 -1.8 19.7 18.7 1.8 1.9 86.6 86.2 72.9 69.6Massachusetts 361,800 11.0 -5.0 20.0 20.3 5.5 7.7 73.9 72.0 52.8 51.4New Hampshire 119,473 14.2 78.9 20.6 15.4 1.4 1.2 80.8 80.1 58.7 30.0New Jersey 355,613 11.6 -5.6 17.4 18.3 2.4 3.3 85.7 84.9 84.6 83.4New York 982,615 9.7 -4.7 18.6 19.1 4.6 5.7 81.3 80.4 63.3 64.1Pennsylvania 561,826 4.2 -10.1 20.9 21.6 2.9 4.2 82.4 80.3 59.9 61.0Rhode Island 70,713 1.4 -3.4 21.1 20.6 3.9 4.1 87.3 86.7 53.0 52.2Vermont 37,233 5.5 -1.5 20.9 19.9 1.9 4.4 84.6 84.9 64.0 61.1District of Columbia 50,565 -30.0 6.0 20.0 21.0 6.1 8.8 52.9 52.7 10.2 7.6

SREB Fact Book 2019 47
PAR
TICIPATIO
N
50 states and D.C. 2,852,662 5.3 2.5 11.9 14.9 13.7 14.7 50.3 50.8SREB states 915,700 14.5 3.1 10.3 13.1 12.8 13.6 65.2 65.9as a percent of U.S. 32.1 Alabama 41,139 14.6 -7.3 6.1 8.2 14.3 14.4 77.7 88.3Arkansas 21,027 20.8 10.9 7.4 10.2 10.7 12.8 83.9 89.3Delaware 11,270 13.9 9.3 17.2 29.9 17.7 18.7 39.8 38.4Florida 126,258 13.2 -2.9 9.7 12.6 11.3 11.8 50.7 55.4Georgia 74,745 13.2 10.5 11.2 15.2 12.7 14.1 58.7 65.4Kentucky 40,668 15.2 16.9 6.5 17.9 12.4 15.9 69.0 55.7Louisiana 31,237 6.5 -1.0 10.5 10.4 12.2 12.9 73.9 76.5Maryland 72,851 10.5 1.2 11.0 13.9 19.2 20.0 62.9 59.4Mississippi 20,348 24.2 -4.4 5.5 7.7 12.0 11.8 77.0 71.8North Carolina 73,998 13.6 6.1 10.9 13.1 12.1 13.1 64.9 63.5Oklahoma 24,912 8.2 -5.6 11.4 11.7 11.6 12.3 81.3 80.3South Carolina 26,439 5.6 2.5 9.8 9.5 9.9 10.7 76.1 79.0Tennessee 47,795 16.5 -1.2 6.4 7.1 14.1 14.8 52.9 50.1Texas 193,130 16.9 8.8 15.0 17.6 11.5 11.8 77.6 78.1Virginia 96,504 29.9 0.4 7.0 8.5 16.3 17.4 49.8 48.2West Virginia 13,379 -23.6 -2.2 8.0 9.5 13.1 14.0 90.8 88.1West 571,625 1.3 4.0 10.7 13.2 10.8 11.4 47.8 50.3as a percent of U.S. 20.0 Alaska 2,298 16.0 -17.3 7.1 6.2 8.5 8.5 92.2 90.7Arizona 96,859 9.5 -6.0 6.9 7.2 14.4 16.6 26.1 34.7California 284,356 -3.8 10.2 13.7 17.5 9.9 10.6 41.0 41.9Colorado 52,707 6.7 2.4 7.2 8.2 15.6 15.5 62.3 65.5Hawaii 7,157 -1.2 -22.1 13.0 10.9 11.7 11.2 69.3 74.0Idaho 8,206 10.1 1.2 6.6 6.6 7.5 6.2 90.1 91.4Montana 5,435 6.3 12.5 4.9 6.8 9.1 10.7 96.6 95.8Nevada 11,658 -2.9 1.9 5.0 6.3 9.7 9.9 71.0 72.9New Mexico 13,540 4.2 -7.6 9.2 10.7 9.4 10.5 91.8 93.7Oregon 31,493 10.7 7.0 8.8 10.3 11.6 13.7 59.8 57.6Utah 18,619 -6.5 1.9 10.7 10.2 8.1 8.0 67.7 71.9Washington 36,691 7.9 2.3 10.4 13.4 9.8 10.0 63.7 67.4Wyoming 2,606 -20.2 -3.8 15.9 14.7 7.2 7.9 100.0 100.0Midwest 644,512 -1.6 -2.0 12.0 14.5 14.1 15.7 53.4 54.6as a percent of U.S. 22.6 Illinois 151,028 3.8 -0.3 13.1 16.4 17.8 20.2 33.0 32.1Indiana 59,138 6.3 8.2 16.3 18.0 12.2 14.8 70.4 69.4Iowa 36,580 64.9 -20.1 8.4 12.3 12.7 14.0 32.7 41.4Kansas 26,249 -1.2 1.3 11.5 11.3 12.1 12.8 81.1 83.9Michigan 81,603 -3.1 -7.6 14.3 18.3 13.3 14.6 75.5 79.5Minnesota 46,131 -50.2 -1.3 9.1 10.8 12.8 14.1 53.0 52.7Missouri 75,053 4.7 -1.9 8.9 11.8 17.7 19.6 34.6 34.1Nebraska 25,746 19.9 7.9 7.2 7.7 17.1 18.9 56.7 56.3North Dakota 7,685 23.9 9.1 14.5 13.3 12.8 14.3 87.9 81.5Ohio 88,844 4.7 -2.3 13.3 15.1 12.8 13.7 66.3 67.5South Dakota 6,811 7.0 0.2 8.5 10.9 12.1 12.7 81.8 83.0Wisconsin 39,644 -2.0 -0.8 10.9 11.6 10.8 11.7 59.7 61.5Northeast 675,391 5.8 4.6 14.9 19.0 18.6 19.9 32.0 30.4as a percent of U.S. 23.7 Connecticut 36,882 2.6 5.8 14.1 17.0 17.3 18.8 38.7 37.2Maine 9,892 22.7 1.7 2.4 3.3 13.4 13.8 43.8 39.8Massachusetts 140,533 11.6 4.7 16.7 22.9 26.1 28.0 20.2 19.4New Hampshire 29,711 29.8 86.8 9.5 5.9 19.2 19.9 25.9 13.1New Jersey 63,424 4.6 0.6 12.6 15.9 14.3 15.1 59.9 59.9New York 239,489 2.0 1.1 17.2 21.8 18.7 19.6 29.3 28.4Pennsylvania 137,957 5.6 3.6 12.4 16.8 17.6 19.7 32.6 32.0Rhode Island 10,881 -0.7 2.5 16.4 17.6 12.7 13.3 41.4 37.5Vermont 6,622 8.8 -4.1 3.6 4.1 15.4 15.1 33.6 38.4District of Columbia2 45,434 -9.7 7.0 12.4 14.2 47.1 47.3 1.5 1.5
1 Tables show enrollments in all degree-granting institutions eligible for federal Title IV student financial aid in the 50 states and D.C., excluding service schools and online-only colleges and universities.
2 Non-degree-granting institutes merged with degree-granting two-year colleges or became degree-granting.
Source: SREB analysis of National Center for Education fall enrollment surveys — www.nces.ed.gov/ipeds.
Table 26Graduate and Professional Program Enrollment1
Percent of Total Percent Change Percent Foreign Enrollment in Percent in 2007 to 2012 to Students Higher Education Public Colleges Fall 2017 2012 2017 2012 2017 2012 2017 2012 2017

48 SREB Fact Book 2019
Table 27Part-Time Enrollment1
Percent Percent in Percent in Percent of Percent of Percent in Change Four-Year Colleges Two-Year Undergraduate Graduate Public Percent 2007 to 2012 to and Universities Colleges Enrollment Enrollment Colleges Women Fall 2017 2012 2017 2012 2017 2012 2017 2012 2017 2012 2017 2012 2017 2012 2017
1 Table shows enrollments in all degree-granting institutions eligible for federal Title IV student financial aid in the 50 states and D.C., excluding service schools and online-only colleges and universities.
Source: SREB analysis of National Center for Education fall enrollment surveys — www.nces.ed.gov/ipeds.
50 states and D.C. 7,473,585 10.3 -2.9 39.3 40.8 60.7 59.2 37.2 37.9 43.2 42.7 82.4 83.1 59.5 59.1
SREB states 2,680,686 20.1 -1.2 38.6 40.0 61.4 60.0 38.0 38.9 45.3 44.6 86.2 88.0 60.7 60.1as a percent of U.S. 35.9 Alabama 89,069 12.9 -13.2 58.5 49.2 41.5 50.8 31.9 29.6 40.2 40.8 83.2 93.9 59.7 61.0Arkansas 60,438 15.3 -5.0 50.6 55.3 49.4 44.7 32.9 33.5 62.6 59.7 94.1 95.3 62.3 61.3Delaware 23,044 13.3 10.6 57.1 58.9 42.9 41.1 33.6 35.5 46.5 50.0 56.8 53.7 63.5 65.4Florida 453,742 24.3 -6.3 36.1 36.4 63.9 63.6 42.3 43.2 40.5 37.9 80.3 85.4 60.7 60.1Georgia 194,886 22.6 5.5 44.1 51.3 55.9 48.7 34.1 35.8 38.8 42.2 84.8 85.5 63.4 61.6Kentucky 102,150 4.8 -4.2 42.8 51.9 57.2 48.1 36.7 37.6 47.3 51.8 85.1 79.2 57.7 57.2Louisiana 81,262 32.9 -5.1 46.6 54.0 53.4 46.0 32.8 32.8 35.0 38.7 91.3 93.4 62.3 63.7Maryland 175,338 18.1 -1.3 46.1 53.8 53.9 46.2 44.6 45.6 59.4 58.1 87.1 87.3 60.1 57.5Mississippi 43,177 14.5 5.0 48.9 45.7 51.1 54.3 20.3 22.2 44.9 47.1 86.5 83.8 65.6 64.3North Carolina 204,486 11.1 -0.4 31.0 30.7 69.0 69.3 34.5 35.7 43.2 40.3 89.1 89.9 63.0 62.0Oklahoma 71,088 13.5 -14.5 43.5 44.8 56.5 55.2 34.9 33.5 48.0 47.0 93.6 94.6 58.6 60.9South Carolina 75,275 18.0 -8.1 30.0 31.9 70.0 68.1 30.2 29.2 43.5 42.1 88.2 87.4 65.4 64.3Tennessee 92,282 23.5 -9.3 48.1 52.4 51.9 47.6 28.0 26.9 39.2 38.1 81.0 78.7 62.6 61.5Texas 777,057 26.4 9.2 29.4 29.6 70.6 70.4 46.2 48.0 45.9 45.5 93.9 95.3 59.3 59.0Virginia 212,792 25.1 -9.7 43.7 45.0 56.3 55.0 37.8 36.4 51.3 48.0 71.2 71.7 59.7 59.2West Virginia 24,600 -36.2 -2.4 50.6 56.4 49.4 43.6 22.1 24.9 37.9 30.9 95.1 94.0 62.7 61.6West 2,151,396 1.6 1.1 26.4 29.1 73.6 70.9 42.6 43.8 35.1 36.9 89.8 88.8 56.0 56.3as a percent of U.S. 28.8 Alaska 14,715 -3.0 -15.0 96.3 99.6 3.7 0.4 52.2 53.6 59.1 65.9 98.5 98.0 63.5 63.2Arizona 249,676 11.9 9.4 32.3 45.6 67.7 54.4 32.5 41.6 28.6 49.2 78.5 71.4 61.5 62.7California 1,209,543 -3.8 0.4 15.4 14.9 84.6 85.1 47.8 46.8 30.9 29.2 91.5 93.0 54.4 54.4Colorado 138,793 20.4 -0.6 49.0 54.5 51.0 45.5 40.2 39.1 53.2 50.3 84.9 83.7 57.3 57.5Hawaii 26,695 22.6 -20.9 36.0 34.7 64.0 65.3 42.7 41.6 45.3 41.6 84.2 90.0 58.8 61.1Idaho 71,869 61.4 70.5 65.8 77.7 34.2 22.3 38.0 54.9 51.3 48.2 79.1 50.9 59.7 59.6Montana 15,250 17.7 5.4 69.2 67.4 30.8 32.6 24.4 26.6 55.1 59.1 95.6 94.1 60.8 61.5Nevada 54,610 -6.3 -5.6 30.7 31.1 69.3 68.9 49.4 47.0 44.2 41.5 96.5 97.6 56.8 58.1New Mexico 65,578 14.3 -11.7 28.0 28.1 72.0 71.9 47.2 50.8 49.9 48.9 98.0 98.8 58.8 60.4Oregon 86,064 19.6 -10.9 36.3 40.7 63.7 59.3 38.1 38.2 36.9 33.4 91.7 93.0 56.3 55.0Utah 89,649 11.4 3.6 71.9 71.8 28.1 28.2 38.4 38.5 38.0 36.9 91.4 93.3 51.5 51.8Washington 114,234 -15.1 -1.3 24.9 24.1 75.1 75.9 31.2 30.8 35.5 32.9 90.4 92.0 57.6 57.1Wyoming 14,720 0.7 -10.5 18.3 17.6 81.7 82.4 43.6 44.8 41.6 41.6 100.0 100.0 56.8 54.1Midwest 1,598,708 11.9 -10.4 46.1 46.0 53.9 54.0 36.8 37.6 47.1 45.7 76.3 79.6 60.4 59.5as a percent of U.S. 21.4 Illinois 314,623 8.2 -14.2 38.1 39.2 61.9 60.8 42.0 40.9 47.7 46.7 72.7 71.9 60.2 61.1Indiana 135,241 32.7 -11.8 56.9 59.6 43.1 40.4 33.2 32.3 42.1 43.2 85.0 86.8 59.0 57.2Iowa 107,717 20.2 -6.6 52.0 47.4 48.0 52.6 30.5 41.1 41.7 42.7 56.4 63.9 63.8 61.4Kansas 84,511 7.2 -1.1 42.6 41.6 57.4 58.4 38.7 40.0 49.3 50.5 87.8 90.3 59.4 58.5Michigan 223,940 3.7 -19.1 43.9 41.0 56.1 59.0 40.5 39.6 49.9 43.4 81.4 86.9 59.3 57.3Minnesota 131,204 -5.3 -10.2 43.8 46.5 56.2 53.5 38.5 38.8 49.6 48.3 80.1 83.3 60.3 60.1Missouri 147,739 10.9 -11.6 64.6 67.8 35.4 32.2 35.9 36.0 51.6 49.3 58.8 61.3 60.3 60.5Nebraska 48,428 11.7 -3.3 47.1 48.0 52.9 52.0 33.3 33.2 48.3 46.1 80.6 81.7 58.2 58.6North Dakota 16,687 24.5 1.0 62.6 65.7 37.4 34.3 26.6 27.8 53.1 50.7 89.8 91.8 55.4 55.0Ohio 237,050 26.7 -5.7 41.4 39.9 58.6 60.1 34.4 35.6 42.2 42.2 80.7 85.3 61.7 60.2South Dakota 20,670 26.4 -5.6 92.6 84.6 7.4 15.4 35.6 34.8 64.0 64.3 73.4 81.8 65.0 61.4Wisconsin 130,898 12.1 -2.7 36.0 34.6 64.0 65.4 35.4 37.8 44.5 43.7 82.7 87.9 60.9 58.6Northeast 1,010,939 7.0 -3.6 54.0 58.0 46.0 42.0 27.3 26.9 43.1 41.7 69.8 65.7 61.6 61.7as a percent of U.S. 13.5 Connecticut 66,891 19.9 -10.4 42.8 49.5 57.2 50.5 35.5 32.7 44.3 40.2 72.3 68.4 63.0 62.7Maine 28,237 9.8 4.0 58.6 61.6 41.4 38.4 36.2 38.7 44.2 43.2 80.1 75.8 63.9 65.8Massachusetts 148,895 11.0 -7.1 58.7 61.6 41.3 38.4 26.4 24.8 44.4 42.2 62.2 59.9 61.8 61.6New Hampshire 80,933 26.3 202.0 60.2 90.0 39.8 10.0 28.9 51.4 47.4 65.5 52.0 14.4 62.9 64.8New Jersey 144,145 5.4 -11.8 48.3 46.6 51.7 53.4 34.8 31.9 51.3 48.3 86.2 86.3 58.4 58.5New York 328,896 6.1 -8.1 58.1 58.4 41.9 41.6 25.1 23.9 41.7 39.3 69.1 70.7 61.4 60.8Pennsylvania 181,267 1.6 -11.7 51.5 52.5 48.5 47.5 24.1 22.7 41.0 38.8 62.2 63.3 63.0 63.7Rhode Island 19,623 -0.4 -10.0 44.9 50.8 55.1 49.2 24.6 22.7 35.6 32.8 81.7 80.7 62.3 62.1Vermont 12,052 3.4 8.4 52.6 61.1 47.4 38.9 24.1 25.9 29.2 36.4 79.6 68.3 66.8 60.8District of Columbia 31,856 -46.0 16.4 100.0 100.0 0.0 0.0 18.5 21.2 43.7 46.5 11.3 7.1 61.2 61.5
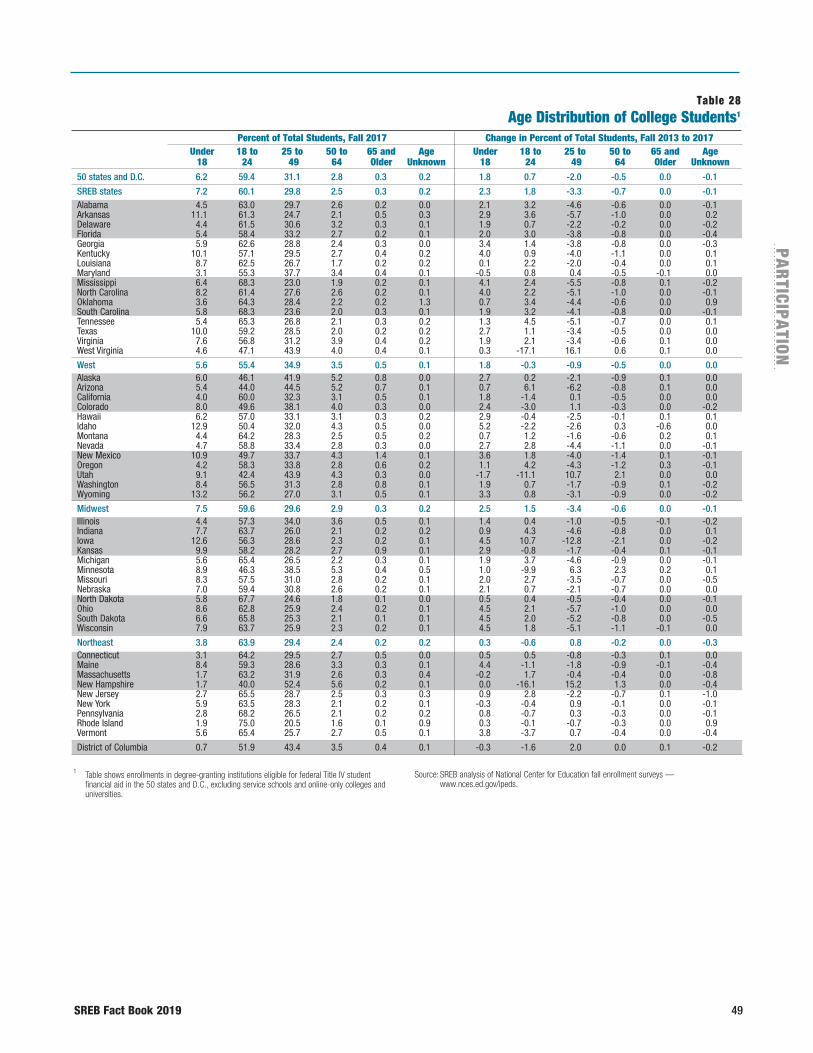
SREB Fact Book 2019 49
PAR
TICIPATIO
N
1 Table shows enrollments in degree-granting institutions eligible for federal Title IV student financial aid in the 50 states and D.C., excluding service schools and online-only colleges and universities.
Source: SREB analysis of National Center for Education fall enrollment surveys — www.nces.ed.gov/ipeds.
50 states and D.C. 6.2 59.4 31.1 2.8 0.3 0.2 1.8 0.7 -2.0 -0.5 0.0 -0.1
SREB states 7.2 60.1 29.8 2.5 0.3 0.2 2.3 1.8 -3.3 -0.7 0.0 -0.1 Alabama 4.5 63.0 29.7 2.6 0.2 0.0 2.1 3.2 -4.6 -0.6 0.0 -0.1 Arkansas 11.1 61.3 24.7 2.1 0.5 0.3 2.9 3.6 -5.7 -1.0 0.0 0.2 Delaware 4.4 61.5 30.6 3.2 0.3 0.1 1.9 0.7 -2.2 -0.2 0.0 -0.2 Florida 5.4 58.4 33.2 2.7 0.2 0.1 2.0 3.0 -3.8 -0.8 0.0 -0.4 Georgia 5.9 62.6 28.8 2.4 0.3 0.0 3.4 1.4 -3.8 -0.8 0.0 -0.3 Kentucky 10.1 57.1 29.5 2.7 0.4 0.2 4.0 0.9 -4.0 -1.1 0.0 0.1 Louisiana 8.7 62.5 26.7 1.7 0.2 0.2 0.1 2.2 -2.0 -0.4 0.0 0.1 Maryland 3.1 55.3 37.7 3.4 0.4 0.1 -0.5 0.8 0.4 -0.5 -0.1 0.0 Mississippi 6.4 68.3 23.0 1.9 0.2 0.1 4.1 2.4 -5.5 -0.8 0.1 -0.2 North Carolina 8.2 61.4 27.6 2.6 0.2 0.1 4.0 2.2 -5.1 -1.0 0.0 -0.1 Oklahoma 3.6 64.3 28.4 2.2 0.2 1.3 0.7 3.4 -4.4 -0.6 0.0 0.9 South Carolina 5.8 68.3 23.6 2.0 0.3 0.1 1.9 3.2 -4.1 -0.8 0.0 -0.1 Tennessee 5.4 65.3 26.8 2.1 0.3 0.2 1.3 4.5 -5.1 -0.7 0.0 0.1 Texas 10.0 59.2 28.5 2.0 0.2 0.2 2.7 1.1 -3.4 -0.5 0.0 0.0 Virginia 7.6 56.8 31.2 3.9 0.4 0.2 1.9 2.1 -3.4 -0.6 0.1 0.0 West Virginia 4.6 47.1 43.9 4.0 0.4 0.1 0.3 -17.1 16.1 0.6 0.1 0.0
West 5.6 55.4 34.9 3.5 0.5 0.1 1.8 -0.3 -0.9 -0.5 0.0 0.0 Alaska 6.0 46.1 41.9 5.2 0.8 0.0 2.7 0.2 -2.1 -0.9 0.1 0.0 Arizona 5.4 44.0 44.5 5.2 0.7 0.1 0.7 6.1 -6.2 -0.8 0.1 0.0 California 4.0 60.0 32.3 3.1 0.5 0.1 1.8 -1.4 0.1 -0.5 0.0 0.0 Colorado 8.0 49.6 38.1 4.0 0.3 0.0 2.4 -3.0 1.1 -0.3 0.0 -0.2 Hawaii 6.2 57.0 33.1 3.1 0.3 0.2 2.9 -0.4 -2.5 -0.1 0.1 0.1 Idaho 12.9 50.4 32.0 4.3 0.5 0.0 5.2 -2.2 -2.6 0.3 -0.6 0.0 Montana 4.4 64.2 28.3 2.5 0.5 0.2 0.7 1.2 -1.6 -0.6 0.2 0.1 Nevada 4.7 58.8 33.4 2.8 0.3 0.0 2.7 2.8 -4.4 -1.1 0.0 -0.1 New Mexico 10.9 49.7 33.7 4.3 1.4 0.1 3.6 1.8 -4.0 -1.4 0.1 -0.1 Oregon 4.2 58.3 33.8 2.8 0.6 0.2 1.1 4.2 -4.3 -1.2 0.3 -0.1 Utah 9.1 42.4 43.9 4.3 0.3 0.0 -1.7 -11.1 10.7 2.1 0.0 0.0 Washington 8.4 56.5 31.3 2.8 0.8 0.1 1.9 0.7 -1.7 -0.9 0.1 -0.2 Wyoming 13.2 56.2 27.0 3.1 0.5 0.1 3.3 0.8 -3.1 -0.9 0.0 -0.2
Midwest 7.5 59.6 29.6 2.9 0.3 0.2 2.5 1.5 -3.4 -0.6 0.0 -0.1 Illinois 4.4 57.3 34.0 3.6 0.5 0.1 1.4 0.4 -1.0 -0.5 -0.1 -0.2 Indiana 7.7 63.7 26.0 2.1 0.2 0.2 0.9 4.3 -4.6 -0.8 0.0 0.1 Iowa 12.6 56.3 28.6 2.3 0.2 0.1 4.5 10.7 -12.8 -2.1 0.0 -0.2 Kansas 9.9 58.2 28.2 2.7 0.9 0.1 2.9 -0.8 -1.7 -0.4 0.1 -0.1 Michigan 5.6 65.4 26.5 2.2 0.3 0.1 1.9 3.7 -4.6 -0.9 0.0 -0.1 Minnesota 8.9 46.3 38.5 5.3 0.4 0.5 1.0 -9.9 6.3 2.3 0.2 0.1 Missouri 8.3 57.5 31.0 2.8 0.2 0.1 2.0 2.7 -3.5 -0.7 0.0 -0.5 Nebraska 7.0 59.4 30.8 2.6 0.2 0.1 2.1 0.7 -2.1 -0.7 0.0 0.0 North Dakota 5.8 67.7 24.6 1.8 0.1 0.0 0.5 0.4 -0.5 -0.4 0.0 -0.1 Ohio 8.6 62.8 25.9 2.4 0.2 0.1 4.5 2.1 -5.7 -1.0 0.0 0.0 South Dakota 6.6 65.8 25.3 2.1 0.1 0.1 4.5 2.0 -5.2 -0.8 0.0 -0.5 Wisconsin 7.9 63.7 25.9 2.3 0.2 0.1 4.5 1.8 -5.1 -1.1 -0.1 0.0
Northeast 3.8 63.9 29.4 2.4 0.2 0.2 0.3 -0.6 0.8 -0.2 0.0 -0.3 Connecticut 3.1 64.2 29.5 2.7 0.5 0.0 0.5 0.5 -0.8 -0.3 0.1 0.0 Maine 8.4 59.3 28.6 3.3 0.3 0.1 4.4 -1.1 -1.8 -0.9 -0.1 -0.4 Massachusetts 1.7 63.2 31.9 2.6 0.3 0.4 -0.2 1.7 -0.4 -0.4 0.0 -0.8 New Hampshire 1.7 40.0 52.4 5.6 0.2 0.1 0.0 -16.1 15.2 1.3 0.0 -0.4 New Jersey 2.7 65.5 28.7 2.5 0.3 0.3 0.9 2.8 -2.2 -0.7 0.1 -1.0 New York 5.9 63.5 28.3 2.1 0.2 0.1 -0.3 -0.4 0.9 -0.1 0.0 -0.1 Pennsylvania 2.8 68.2 26.5 2.1 0.2 0.2 0.8 -0.7 0.3 -0.3 0.0 -0.1 Rhode Island 1.9 75.0 20.5 1.6 0.1 0.9 0.3 -0.1 -0.7 -0.3 0.0 0.9 Vermont 5.6 65.4 25.7 2.7 0.5 0.1 3.8 -3.7 0.7 -0.4 0.0 -0.4
District of Columbia 0.7 51.9 43.4 3.5 0.4 0.1 -0.3 -1.6 2.0 0.0 0.1 -0.2
Table 28Age Distribution of College Students1
Percent of Total Students, Fall 2017 Change in Percent of Total Students, Fall 2013 to 2017 Under 18 to 25 to 50 to 65 and Age Under 18 to 25 to 50 to 65 and Age 18 24 49 64 Older Unknown 18 24 49 64 Older Unknown
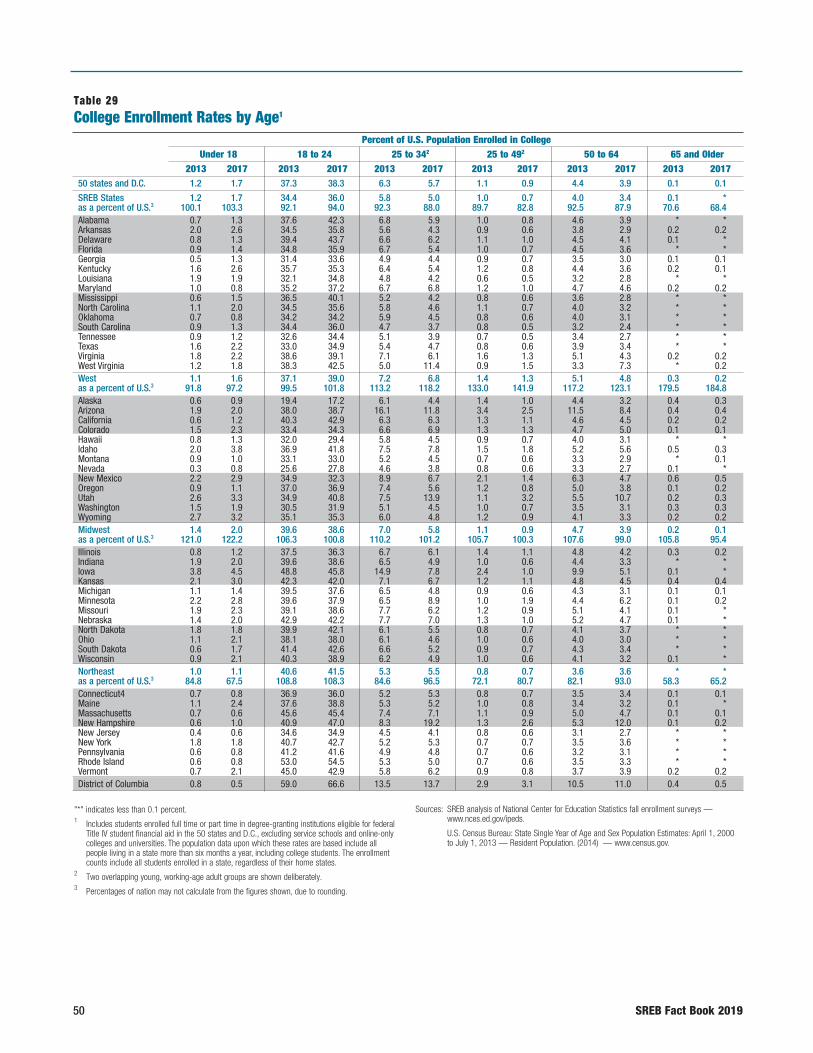
50 SREB Fact Book 2019
Table 29College Enrollment Rates by Age1
Percent of U.S. Population Enrolled in College Under 18 18 to 24 25 to 342 25 to 492 50 to 64 65 and Older 2013 2017 2013 2017 2013 2017 2013 2017 2013 2017 2013 2017
50 states and D.C. 1.2 1.7 37.3 38.3 6.3 5.7 1.1 0.9 4.4 3.9 0.1 0.1
SREB States 1.2 1.7 34.4 36.0 5.8 5.0 1.0 0.7 4.0 3.4 0.1 *as a percent of U.S.3 100.1 103.3 92.1 94.0 92.3 88.0 89.7 82.8 92.5 87.9 70.6 68.4Alabama 0.7 1.3 37.6 42.3 6.8 5.9 1.0 0.8 4.6 3.9 * *Arkansas 2.0 2.6 34.5 35.8 5.6 4.3 0.9 0.6 3.8 2.9 0.2 0.2Delaware 0.8 1.3 39.4 43.7 6.6 6.2 1.1 1.0 4.5 4.1 0.1 *Florida 0.9 1.4 34.8 35.9 6.7 5.4 1.0 0.7 4.5 3.6 * *Georgia 0.5 1.3 31.4 33.6 4.9 4.4 0.9 0.7 3.5 3.0 0.1 0.1Kentucky 1.6 2.6 35.7 35.3 6.4 5.4 1.2 0.8 4.4 3.6 0.2 0.1Louisiana 1.9 1.9 32.1 34.8 4.8 4.2 0.6 0.5 3.2 2.8 * *Maryland 1.0 0.8 35.2 37.2 6.7 6.8 1.2 1.0 4.7 4.6 0.2 0.2Mississippi 0.6 1.5 36.5 40.1 5.2 4.2 0.8 0.6 3.6 2.8 * *North Carolina 1.1 2.0 34.5 35.6 5.8 4.6 1.1 0.7 4.0 3.2 * *Oklahoma 0.7 0.8 34.2 34.2 5.9 4.5 0.8 0.6 4.0 3.1 * *South Carolina 0.9 1.3 34.4 36.0 4.7 3.7 0.8 0.5 3.2 2.4 * *Tennessee 0.9 1.2 32.6 34.4 5.1 3.9 0.7 0.5 3.4 2.7 * *Texas 1.6 2.2 33.0 34.9 5.4 4.7 0.8 0.6 3.9 3.4 * *Virginia 1.8 2.2 38.6 39.1 7.1 6.1 1.6 1.3 5.1 4.3 0.2 0.2West Virginia 1.2 1.8 38.3 42.5 5.0 11.4 0.9 1.5 3.3 7.3 * 0.2West 1.1 1.6 37.1 39.0 7.2 6.8 1.4 1.3 5.1 4.8 0.3 0.2as a percent of U.S.3 91.8 97.2 99.5 101.8 113.2 118.2 133.0 141.9 117.2 123.1 179.5 184.8Alaska 0.6 0.9 19.4 17.2 6.1 4.4 1.4 1.0 4.4 3.2 0.4 0.3Arizona 1.9 2.0 38.0 38.7 16.1 11.8 3.4 2.5 11.5 8.4 0.4 0.4California 0.6 1.2 40.3 42.9 6.3 6.3 1.3 1.1 4.6 4.5 0.2 0.2Colorado 1.5 2.3 33.4 34.3 6.6 6.9 1.3 1.3 4.7 5.0 0.1 0.1Hawaii 0.8 1.3 32.0 29.4 5.8 4.5 0.9 0.7 4.0 3.1 * *Idaho 2.0 3.8 36.9 41.8 7.5 7.8 1.5 1.8 5.2 5.6 0.5 0.3Montana 0.9 1.0 33.1 33.0 5.2 4.5 0.7 0.6 3.3 2.9 * 0.1Nevada 0.3 0.8 25.6 27.8 4.6 3.8 0.8 0.6 3.3 2.7 0.1 *New Mexico 2.2 2.9 34.9 32.3 8.9 6.7 2.1 1.4 6.3 4.7 0.6 0.5Oregon 0.9 1.1 37.0 36.9 7.4 5.6 1.2 0.8 5.0 3.8 0.1 0.2Utah 2.6 3.3 34.9 40.8 7.5 13.9 1.1 3.2 5.5 10.7 0.2 0.3Washington 1.5 1.9 30.5 31.9 5.1 4.5 1.0 0.7 3.5 3.1 0.3 0.3Wyoming 2.7 3.2 35.1 35.3 6.0 4.8 1.2 0.9 4.1 3.3 0.2 0.2Midwest 1.4 2.0 39.6 38.6 7.0 5.8 1.1 0.9 4.7 3.9 0.2 0.1as a percent of U.S.3 121.0 122.2 106.3 100.8 110.2 101.2 105.7 100.3 107.6 99.0 105.8 95.4Illinois 0.8 1.2 37.5 36.3 6.7 6.1 1.4 1.1 4.8 4.2 0.3 0.2Indiana 1.9 2.0 39.6 38.6 6.5 4.9 1.0 0.6 4.4 3.3 * *Iowa 3.8 4.5 48.8 45.8 14.9 7.8 2.4 1.0 9.9 5.1 0.1 *Kansas 2.1 3.0 42.3 42.0 7.1 6.7 1.2 1.1 4.8 4.5 0.4 0.4Michigan 1.1 1.4 39.5 37.6 6.5 4.8 0.9 0.6 4.3 3.1 0.1 0.1Minnesota 2.2 2.8 39.6 37.9 6.5 8.9 1.0 1.9 4.4 6.2 0.1 0.2Missouri 1.9 2.3 39.1 38.6 7.7 6.2 1.2 0.9 5.1 4.1 0.1 *Nebraska 1.4 2.0 42.9 42.2 7.7 7.0 1.3 1.0 5.2 4.7 0.1 *North Dakota 1.8 1.8 39.9 42.1 6.1 5.5 0.8 0.7 4.1 3.7 * *Ohio 1.1 2.1 38.1 38.0 6.1 4.6 1.0 0.6 4.0 3.0 * *South Dakota 0.6 1.7 41.4 42.6 6.6 5.2 0.9 0.7 4.3 3.4 * *Wisconsin 0.9 2.1 40.3 38.9 6.2 4.9 1.0 0.6 4.1 3.2 0.1 *Northeast 1.0 1.1 40.6 41.5 5.3 5.5 0.8 0.7 3.6 3.6 * *as a percent of U.S.3 84.8 67.5 108.8 108.3 84.6 96.5 72.1 80.7 82.1 93.0 58.3 65.2Connecticut4 0.7 0.8 36.9 36.0 5.2 5.3 0.8 0.7 3.5 3.4 0.1 0.1Maine 1.1 2.4 37.6 38.8 5.3 5.2 1.0 0.8 3.4 3.2 0.1 *Massachusetts 0.7 0.6 45.6 45.4 7.4 7.1 1.1 0.9 5.0 4.7 0.1 0.1New Hampshire 0.6 1.0 40.9 47.0 8.3 19.2 1.3 2.6 5.3 12.0 0.1 0.2New Jersey 0.4 0.6 34.6 34.9 4.5 4.1 0.8 0.6 3.1 2.7 * *New York 1.8 1.8 40.7 42.7 5.2 5.3 0.7 0.7 3.5 3.6 * *Pennsylvania 0.6 0.8 41.2 41.6 4.9 4.8 0.7 0.6 3.2 3.1 * *Rhode Island 0.6 0.8 53.0 54.5 5.3 5.0 0.7 0.6 3.5 3.3 * *Vermont 0.7 2.1 45.0 42.9 5.8 6.2 0.9 0.8 3.7 3.9 0.2 0.2District of Columbia 0.8 0.5 59.0 66.6 13.5 13.7 2.9 3.1 10.5 11.0 0.4 0.5
"*" indicates less than 0.1 percent.1 Includes students enrolled full time or part time in degree-granting institutions eligible for federal
Title IV student financial aid in the 50 states and D.C., excluding service schools and online-only colleges and universities. The population data upon which these rates are based include all people living in a state more than six months a year, including college students. The enrollment counts include all students enrolled in a state, regardless of their home states.
2 Two overlapping young, working-age adult groups are shown deliberately.3 Percentages of nation may not calculate from the figures shown, due to rounding.
Sources: SREB analysis of National Center for Education Statistics fall enrollment surveys — www.nces.ed.gov/ipeds.
U.S. Census Bureau: State Single Year of Age and Sex Population Estimates: April 1, 2000 to July 1, 2013 — Resident Population. (2014) — www.census.gov.
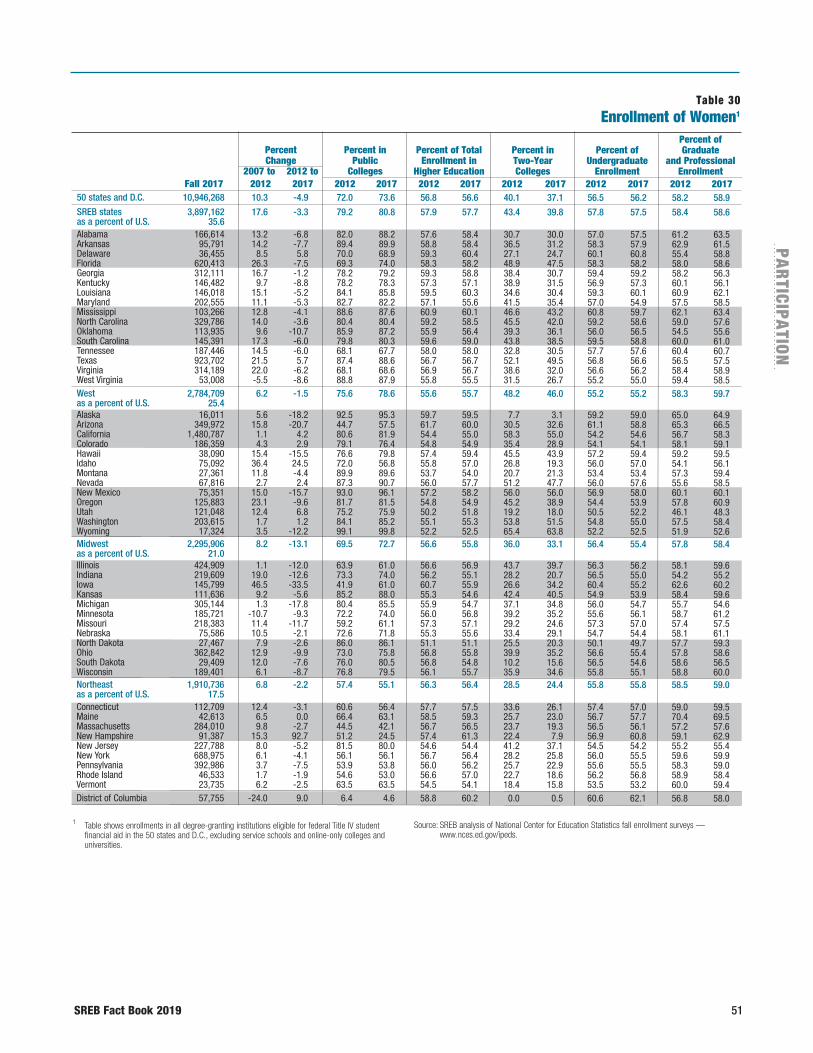
SREB Fact Book 2019 51
PAR
TICIPATIO
N
Table 30Enrollment of Women1
Percent of Percent Percent in Percent of Total Percent in Percent of Graduate Change Public Enrollment in Two-Year Undergraduate and Professional 2007 to 2012 to Colleges Higher Education Colleges Enrollment Enrollment Fall 2017 2012 2017 2012 2017 2012 2017 2012 2017 2012 2017 2012 2017
50 states and D.C. 10,946,268 10.3 -4.9 72.0 73.6 56.8 56.6 40.1 37.1 56.5 56.2 58.2 58.9
SREB states 3,897,162 17.6 -3.3 79.2 80.8 57.9 57.7 43.4 39.8 57.8 57.5 58.4 58.6as a percent of U.S. 35.6 Alabama 166,614 13.2 -6.8 82.0 88.2 57.6 58.4 30.7 30.0 57.0 57.5 61.2 63.5Arkansas 95,791 14.2 -7.7 89.4 89.9 58.8 58.4 36.5 31.2 58.3 57.9 62.9 61.5Delaware 36,455 8.5 5.8 70.0 68.9 59.3 60.4 27.1 24.7 60.1 60.8 55.4 58.8Florida 620,413 26.3 -7.5 69.3 74.0 58.3 58.2 48.9 47.5 58.3 58.2 58.0 58.6Georgia 312,111 16.7 -1.2 78.2 79.2 59.3 58.8 38.4 30.7 59.4 59.2 58.2 56.3Kentucky 146,482 9.7 -8.8 78.2 78.3 57.3 57.1 38.9 31.5 56.9 57.3 60.1 56.1Louisiana 146,018 15.1 -5.2 84.1 85.8 59.5 60.3 34.6 30.4 59.3 60.1 60.9 62.1Maryland 202,555 11.1 -5.3 82.7 82.2 57.1 55.6 41.5 35.4 57.0 54.9 57.5 58.5Mississippi 103,266 12.8 -4.1 88.6 87.6 60.9 60.1 46.6 43.2 60.8 59.7 62.1 63.4North Carolina 329,786 14.0 -3.6 80.4 80.4 59.2 58.5 45.5 42.0 59.2 58.6 59.0 57.6Oklahoma 113,935 9.6 -10.7 85.9 87.2 55.9 56.4 39.3 36.1 56.0 56.5 54.5 55.6South Carolina 145,391 17.3 -6.0 79.8 80.3 59.6 59.0 43.8 38.5 59.5 58.8 60.0 61.0Tennessee 187,446 14.5 -6.0 68.1 67.7 58.0 58.0 32.8 30.5 57.7 57.6 60.4 60.7Texas 923,702 21.5 5.7 87.4 88.6 56.7 56.7 52.1 49.5 56.8 56.6 56.5 57.5Virginia 314,189 22.0 -6.2 68.1 68.6 56.9 56.7 38.6 32.0 56.6 56.2 58.4 58.9West Virginia 53,008 -5.5 -8.6 88.8 87.9 55.8 55.5 31.5 26.7 55.2 55.0 59.4 58.5West 2,784,709 6.2 -1.5 75.6 78.6 55.6 55.7 48.2 46.0 55.2 55.2 58.3 59.7as a percent of U.S. 25.4 Alaska 16,011 5.6 -18.2 92.5 95.3 59.7 59.5 7.7 3.1 59.2 59.0 65.0 64.9Arizona 349,972 15.8 -20.7 44.7 57.5 61.7 60.0 30.5 32.6 61.1 58.8 65.3 66.5California 1,480,787 1.1 4.2 80.6 81.9 54.4 55.0 58.3 55.0 54.2 54.6 56.7 58.3Colorado 186,359 4.3 2.9 79.1 76.4 54.8 54.9 35.4 28.9 54.1 54.1 58.1 59.1Hawaii 38,090 15.4 -15.5 76.6 79.8 57.4 59.4 45.5 43.9 57.2 59.4 59.2 59.5Idaho 75,092 36.4 24.5 72.0 56.8 55.8 57.0 26.8 19.3 56.0 57.0 54.1 56.1Montana 27,361 11.8 -4.4 89.9 89.6 53.7 54.0 20.7 21.3 53.4 53.4 57.3 59.4Nevada 67,816 2.7 2.4 87.3 90.7 56.0 57.7 51.2 47.7 56.0 57.6 55.6 58.5New Mexico 75,351 15.0 -15.7 93.0 96.1 57.2 58.2 56.0 56.0 56.9 58.0 60.1 60.1Oregon 125,883 23.1 -9.6 81.7 81.5 54.8 54.9 45.2 38.9 54.4 53.9 57.8 60.9Utah 121,048 12.4 6.8 75.2 75.9 50.2 51.8 19.2 18.0 50.5 52.2 46.1 48.3Washington 203,615 1.7 1.2 84.1 85.2 55.1 55.3 53.8 51.5 54.8 55.0 57.5 58.4Wyoming 17,324 3.5 -12.2 99.1 99.8 52.2 52.5 65.4 63.8 52.2 52.5 51.9 52.6Midwest 2,295,906 8.2 -13.1 69.5 72.7 56.6 55.8 36.0 33.1 56.4 55.4 57.8 58.4as a percent of U.S. 21.0 Illinois 424,909 1.1 -12.0 63.9 61.0 56.6 56.9 43.7 39.7 56.3 56.2 58.1 59.6Indiana 219,609 19.0 -12.6 73.3 74.0 56.2 55.1 28.2 20.7 56.5 55.0 54.2 55.2Iowa 145,799 46.5 -33.5 41.9 61.0 60.7 55.9 26.6 34.2 60.4 55.2 62.6 60.2Kansas 111,636 9.2 -5.6 85.2 88.0 55.3 54.6 42.4 40.5 54.9 53.9 58.4 59.6Michigan 305,144 1.3 -17.8 80.4 85.5 55.9 54.7 37.1 34.8 56.0 54.7 55.7 54.6Minnesota 185,721 -10.7 -9.3 72.2 74.0 56.0 56.8 39.2 35.2 55.6 56.1 58.7 61.2Missouri 218,383 11.4 -11.7 59.2 61.1 57.3 57.1 29.2 24.6 57.3 57.0 57.4 57.5Nebraska 75,586 10.5 -2.1 72.6 71.8 55.3 55.6 33.4 29.1 54.7 54.4 58.1 61.1North Dakota 27,467 7.9 -2.6 86.0 86.1 51.1 51.1 25.5 20.3 50.1 49.7 57.7 59.3Ohio 362,842 12.9 -9.9 73.0 75.8 56.8 55.8 39.9 35.2 56.6 55.4 57.8 58.6South Dakota 29,409 12.0 -7.6 76.0 80.5 56.8 54.8 10.2 15.6 56.5 54.6 58.6 56.5Wisconsin 189,401 6.1 -8.7 76.8 79.5 56.1 55.7 35.9 34.6 55.8 55.1 58.8 60.0Northeast 1,910,736 6.8 -2.2 57.4 55.1 56.3 56.4 28.5 24.4 55.8 55.8 58.5 59.0as a percent of U.S. 17.5 Connecticut 112,709 12.4 -3.1 60.6 56.4 57.7 57.5 33.6 26.1 57.4 57.0 59.0 59.5Maine 42,613 6.5 0.0 66.4 63.1 58.5 59.3 25.7 23.0 56.7 57.7 70.4 69.5Massachusetts 284,010 9.8 -2.7 44.5 42.1 56.7 56.5 23.7 19.3 56.5 56.1 57.2 57.6New Hampshire 91,387 15.3 92.7 51.2 24.5 57.4 61.3 22.4 7.9 56.9 60.8 59.1 62.9New Jersey 227,788 8.0 -5.2 81.5 80.0 54.6 54.4 41.2 37.1 54.5 54.2 55.2 55.4New York 688,975 6.1 -4.1 56.1 56.1 56.7 56.4 28.2 25.8 56.0 55.5 59.6 59.9Pennsylvania 392,986 3.7 -7.5 53.9 53.8 56.0 56.2 25.7 22.9 55.6 55.5 58.3 59.0Rhode Island 46,533 1.7 -1.9 54.6 53.0 56.6 57.0 22.7 18.6 56.2 56.8 58.9 58.4Vermont 23,735 6.2 -2.5 63.5 63.5 54.5 54.1 18.4 15.8 53.5 53.2 60.0 59.4District of Columbia 57,755 -24.0 9.0 6.4 4.6 58.8 60.2 0.0 0.5 60.6 62.1 56.8 58.0
1 Table shows enrollments in all degree-granting institutions eligible for federal Title IV student financial aid in the 50 states and D.C., excluding service schools and online-only colleges and universities.
Source: SREB analysis of National Center for Education Statistics fall enrollment surveys — www.nces.ed.gov/ipeds.

52 SREB Fact Book 2019
Table 31Enrollment of Men1
Percent of Percent Percent in Percent of Total Percent in Percent of Graduate Change Public Enrollment in Two-Year Undergraduate and Professional 2007 to 2012 to Colleges Higher Education Colleges Enrollment Enrollment Fall 2017 2012 2017 2012 2017 2012 2017 2012 2017 2012 2017 2012 2017
50 states and D.C. 8,402,359 12.3 -4.1 74.9 76.8 43.2 43.4 38.6 36.4 43.5 43.8 41.8 41.1
SREB states 2,858,208 18.8 -2.5 80.3 82.6 42.1 42.3 39.7 37.2 42.2 42.5 41.6 41.4as a percent of U.S. 34.0 Alabama 118,715 19.3 -9.7 79.4 90.3 42.4 41.6 27.3 29.2 43.0 42.5 38.8 36.5Arkansas 68,291 18.6 -6.1 88.7 88.7 41.2 41.6 30.9 27.7 41.7 42.1 37.1 38.5Delaware 23,883 15.0 0.9 71.8 72.1 40.7 39.6 24.6 22.3 39.9 39.2 44.6 41.2Florida 445,241 25.1 -7.1 71.0 75.5 41.7 41.8 44.4 42.5 41.7 41.8 42.0 41.4Georgia 218,438 18.6 0.7 80.6 83.0 40.7 41.2 33.3 26.9 40.6 40.8 41.8 43.7Kentucky 110,012 7.1 -8.0 82.3 79.7 42.7 42.9 37.7 31.4 43.1 42.7 39.9 43.9Louisiana 96,047 15.3 -8.4 87.2 89.0 40.5 39.7 33.4 28.7 40.7 39.9 39.1 37.9Maryland 161,652 18.8 0.6 83.3 84.8 42.9 44.4 37.3 30.8 43.0 45.1 42.5 41.5Mississippi 68,485 15.4 -0.8 90.7 90.3 39.1 39.9 42.7 41.6 39.2 40.3 37.9 36.6North Carolina 234,045 16.7 -0.7 80.8 80.9 40.8 41.5 41.2 38.9 40.8 41.4 41.0 42.4Oklahoma 88,116 12.2 -12.6 84.8 84.9 44.1 43.6 34.7 30.5 44.0 43.5 45.5 44.4South Carolina 100,997 22.1 -3.8 81.6 83.1 40.4 41.0 38.6 35.0 40.5 41.2 40.0 39.0Tennessee 135,545 16.7 -6.0 68.8 71.0 42.0 42.0 28.9 28.9 42.3 42.4 39.6 39.3Texas 706,249 21.1 6.0 87.6 89.2 43.3 43.3 48.7 47.8 43.2 43.4 43.5 42.5Virginia 240,023 24.5 -5.4 71.2 72.4 43.1 43.3 37.0 31.7 43.4 43.8 41.6 41.1West Virginia 42,469 -17.0 -7.8 90.1 87.9 44.2 44.5 23.4 19.6 44.8 45.0 40.6 41.5West 2,214,664 9.2 -2.0 80.4 83.4 44.4 44.3 49.5 47.9 44.8 44.8 41.7 40.3as a percent of U.S. 26.4 Alaska 10,894 9.4 -17.6 94.4 97.3 40.3 40.5 5.6 1.1 40.8 41.0 35.0 35.1Arizona 232,898 12.7 -14.9 59.1 71.0 38.3 40.0 37.1 36.9 38.9 41.2 34.7 33.5California 1,211,987 5.9 1.9 82.7 85.3 45.6 45.0 59.7 57.8 45.8 45.4 43.3 41.7Colorado 153,135 9.1 2.4 82.9 81.1 45.2 45.1 33.3 28.6 45.9 45.9 41.9 40.9Hawaii 26,035 21.2 -22.1 77.2 81.7 42.6 40.6 44.7 43.6 42.8 40.6 40.8 40.5Idaho 56,711 37.7 18.9 74.1 58.4 44.2 43.0 22.0 17.2 44.0 43.0 45.9 43.9Montana 23,281 13.1 -5.5 91.7 92.3 46.3 46.0 15.1 16.5 46.6 46.6 42.7 40.6Nevada 49,758 0.6 -4.4 87.9 93.2 44.0 42.3 49.0 46.3 44.0 42.4 44.4 41.5New Mexico 54,143 18.4 -19.2 94.9 97.6 42.8 41.8 54.5 53.3 43.1 42.0 39.9 39.9Oregon 103,390 28.1 -10.1 85.6 86.9 45.2 45.1 44.2 40.4 45.6 46.1 42.2 39.1Utah 112,412 9.3 -0.1 76.2 78.5 49.8 48.2 16.9 16.6 49.5 47.8 53.9 51.7Washington 164,329 6.5 0.1 86.6 88.2 44.9 44.7 51.8 50.9 45.2 45.0 42.5 41.6Wyoming 15,691 11.8 -13.2 90.1 97.3 47.8 47.5 65.6 61.0 47.8 47.5 48.1 47.4Midwest 1,816,244 9.6 -10.3 74.0 76.8 43.4 44.2 34.3 32.6 43.6 44.6 42.2 41.6as a percent of U.S. 21.6 Illinois 322,394 3.0 -12.9 67.2 67.8 43.4 43.1 42.7 40.9 43.7 43.8 41.9 40.4Indiana 179,195 15.8 -8.6 76.3 77.5 43.8 44.9 22.7 18.9 43.5 45.0 45.8 44.8Iowa 115,102 33.1 -19.0 57.5 70.9 39.3 44.1 32.4 35.6 39.6 44.8 37.4 39.8Kansas 92,830 11.4 -2.8 87.1 88.0 44.7 45.4 39.1 39.6 45.1 46.1 41.6 40.4Michigan 252,909 5.7 -13.5 82.7 86.2 44.1 45.3 35.3 33.3 44.0 45.3 44.3 45.4Minnesota 141,281 -1.3 -12.3 77.4 79.2 44.0 43.2 39.9 37.5 44.4 43.9 41.3 38.8Missouri 164,103 13.5 -10.9 60.2 62.2 42.7 42.9 25.9 22.6 42.7 43.0 42.6 42.5Nebraska 60,278 8.5 -3.4 77.2 77.6 44.7 44.4 32.7 31.1 45.3 45.6 41.9 38.9North Dakota 26,282 13.2 -2.6 91.5 91.0 48.9 48.9 23.4 22.6 49.9 50.3 42.3 40.7Ohio 286,845 12.2 -6.5 75.0 77.6 43.2 44.2 34.3 31.7 43.4 44.6 42.2 41.4South Dakota 24,211 13.6 -0.1 82.5 86.5 43.2 45.2 14.0 17.3 43.5 45.4 41.4 43.5Wisconsin 150,814 9.5 -7.1 82.6 85.1 43.9 44.3 35.8 35.7 44.2 44.9 41.2 40.0Northeast 1,474,999 10.3 -2.5 58.9 57.4 43.7 43.6 26.8 23.5 44.2 44.2 41.5 41.0as a percent of U.S. 17.6 Connecticut 83,325 13.0 -2.4 63.8 61.2 42.3 42.5 28.9 25.1 42.6 43.0 41.0 40.5Maine 29,198 11.2 -3.3 72.7 68.9 41.5 40.7 29.9 26.2 43.3 42.3 29.6 30.5Massachusetts 218,323 12.9 -2.2 44.1 43.0 43.3 43.5 20.5 16.5 43.5 43.9 42.8 42.4New Hampshire 57,797 19.1 63.9 53.9 30.0 42.6 38.7 20.6 9.2 43.1 39.2 40.9 37.1New Jersey 191,249 13.7 -4.3 80.5 79.6 45.4 45.6 38.4 34.7 45.5 45.8 44.8 44.6New York 533,129 10.9 -3.0 58.1 58.4 43.3 43.6 28.5 26.0 44.0 44.5 40.4 40.1Pennsylvania 306,797 5.5 -7.9 56.6 57.1 44.0 43.8 23.0 21.0 44.4 44.5 41.7 41.0Rhode Island 35,061 0.4 -3.7 47.6 46.6 43.4 43.0 19.5 17.4 43.8 43.2 41.1 41.6Vermont 20,120 5.6 -1.1 54.2 50.9 45.5 45.9 11.3 8.7 46.5 46.8 40.0 40.6District of Columbia 38,244 -18.2 3.0 5.7 4.9 41.2 39.8 0.0 0.3 39.4 37.9 43.2 42.0
1 Table shows enrollments in all degree-granting institutions eligible for federal Title IV student financial aid in the 50 states and D.C., excluding service schools and online-only colleges and universities.
Source: SREB analysis of National Center for Education Statistics fall enrollment surveys — www.nces.ed.gov/ipeds.
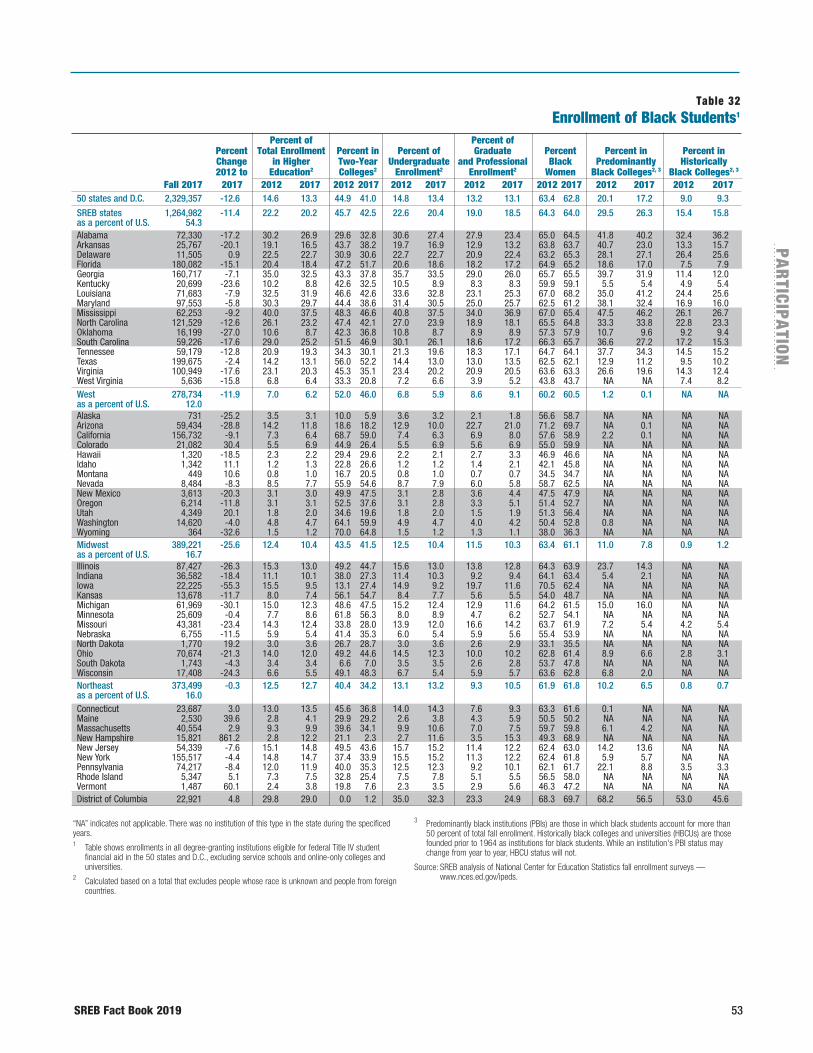
SREB Fact Book 2019 53
PAR
TICIPATIO
N
Table 32Enrollment of Black Students1
Percent of Percent of Percent Total Enrollment Percent in Percent of Graduate Percent Percent in Percent in Change in Higher Two-Year Undergraduate and Professional Black Predominantly Historically 2012 to Education2 Colleges2 Enrollment2 Enrollment2 Women Black Colleges2, 3 Black Colleges2, 3 Fall 2017 2017 2012 2017 2012 2017 2012 2017 2012 2017 2012 2017 2012 2017 2012 2017
50 states and D.C. 2,329,357 -12.6 14.6 13.3 44.9 41.0 14.8 13.4 13.2 13.1 63.4 62.8 20.1 17.2 9.0 9.3
SREB states 1,264,982 -11.4 22.2 20.2 45.7 42.5 22.6 20.4 19.0 18.5 64.3 64.0 29.5 26.3 15.4 15.8as a percent of U.S. 54.3 Alabama 72,330 -17.2 30.2 26.9 29.6 32.8 30.6 27.4 27.9 23.4 65.0 64.5 41.8 40.2 32.4 36.2Arkansas 25,767 -20.1 19.1 16.5 43.7 38.2 19.7 16.9 12.9 13.2 63.8 63.7 40.7 23.0 13.3 15.7Delaware 11,505 0.9 22.5 22.7 30.9 30.6 22.7 22.7 20.9 22.4 63.2 65.3 28.1 27.1 26.4 25.6Florida 180,082 -15.1 20.4 18.4 47.2 51.7 20.6 18.6 18.2 17.2 64.9 65.2 18.6 17.0 7.5 7.9Georgia 160,717 -7.1 35.0 32.5 43.3 37.8 35.7 33.5 29.0 26.0 65.7 65.5 39.7 31.9 11.4 12.0Kentucky 20,699 -23.6 10.2 8.8 42.6 32.5 10.5 8.9 8.3 8.3 59.9 59.1 5.5 5.4 4.9 5.4Louisiana 71,683 -7.9 32.5 31.9 46.6 42.6 33.6 32.8 23.1 25.3 67.0 68.2 35.0 41.2 24.4 25.6Maryland 97,553 -5.8 30.3 29.7 44.4 38.6 31.4 30.5 25.0 25.7 62.5 61.2 38.1 32.4 16.9 16.0Mississippi 62,253 -9.2 40.0 37.5 48.3 46.6 40.8 37.5 34.0 36.9 67.0 65.4 47.5 46.2 26.1 26.7North Carolina 121,529 -12.6 26.1 23.2 47.4 42.1 27.0 23.9 18.9 18.1 65.5 64.8 33.3 33.8 22.8 23.3Oklahoma 16,199 -27.0 10.6 8.7 42.3 36.8 10.8 8.7 8.9 8.9 57.3 57.9 10.7 9.6 9.2 9.4South Carolina 59,226 -17.6 29.0 25.2 51.5 46.9 30.1 26.1 18.6 17.2 66.3 65.7 36.6 27.2 17.2 15.3Tennessee 59,179 -12.8 20.9 19.3 34.3 30.1 21.3 19.6 18.3 17.1 64.7 64.1 37.7 34.3 14.5 15.2Texas 199,675 -2.4 14.2 13.1 56.0 52.2 14.4 13.0 13.0 13.5 62.5 62.1 12.9 11.2 9.5 10.2Virginia 100,949 -17.6 23.1 20.3 45.3 35.1 23.4 20.2 20.9 20.5 63.6 63.3 26.6 19.6 14.3 12.4West Virginia 5,636 -15.8 6.8 6.4 33.3 20.8 7.2 6.6 3.9 5.2 43.8 43.7 NA NA 7.4 8.2West 278,734 -11.9 7.0 6.2 52.0 46.0 6.8 5.9 8.6 9.1 60.2 60.5 1.2 0.1 NA NAas a percent of U.S. 12.0 Alaska 731 -25.2 3.5 3.1 10.0 5.9 3.6 3.2 2.1 1.8 56.6 58.7 NA NA NA NAArizona 59,434 -28.8 14.2 11.8 18.6 18.2 12.9 10.0 22.7 21.0 71.2 69.7 NA 0.1 NA NACalifornia 156,732 -9.1 7.3 6.4 68.7 59.0 7.4 6.3 6.9 8.0 57.6 58.9 2.2 0.1 NA NAColorado 21,082 30.4 5.5 6.9 44.9 26.4 5.5 6.9 5.6 6.9 55.0 59.9 NA NA NA NAHawaii 1,320 -18.5 2.3 2.2 29.4 29.6 2.2 2.1 2.7 3.3 46.9 46.6 NA NA NA NAIdaho 1,342 11.1 1.2 1.3 22.8 26.6 1.2 1.2 1.4 2.1 42.1 45.8 NA NA NA NAMontana 449 10.6 0.8 1.0 16.7 20.5 0.8 1.0 0.7 0.7 34.5 34.7 NA NA NA NANevada 8,484 -8.3 8.5 7.7 55.9 54.6 8.7 7.9 6.0 5.8 58.7 62.5 NA NA NA NANew Mexico 3,613 -20.3 3.1 3.0 49.9 47.5 3.1 2.8 3.6 4.4 47.5 47.9 NA NA NA NAOregon 6,214 -11.8 3.1 3.1 52.5 37.6 3.1 2.8 3.3 5.1 51.4 52.7 NA NA NA NAUtah 4,349 20.1 1.8 2.0 34.6 19.6 1.8 2.0 1.5 1.9 51.3 56.4 NA NA NA NAWashington 14,620 -4.0 4.8 4.7 64.1 59.9 4.9 4.7 4.0 4.2 50.4 52.8 0.8 NA NA NAWyoming 364 -32.6 1.5 1.2 70.0 64.8 1.5 1.2 1.3 1.1 38.0 36.3 NA NA NA NAMidwest 389,221 -25.6 12.4 10.4 43.5 41.5 12.5 10.4 11.5 10.3 63.4 61.1 11.0 7.8 0.9 1.2as a percent of U.S. 16.7 Illinois 87,427 -26.3 15.3 13.0 49.2 44.7 15.6 13.0 13.8 12.8 64.3 63.9 23.7 14.3 NA NAIndiana 36,582 -18.4 11.1 10.1 38.0 27.3 11.4 10.3 9.2 9.4 64.1 63.4 5.4 2.1 NA NAIowa 22,225 -55.3 15.5 9.5 13.1 27.4 14.9 9.2 19.7 11.6 70.5 62.4 NA NA NA NAKansas 13,678 -11.7 8.0 7.4 56.1 54.7 8.4 7.7 5.6 5.5 54.0 48.7 NA NA NA NAMichigan 61,969 -30.1 15.0 12.3 48.6 47.5 15.2 12.4 12.9 11.6 64.2 61.5 15.0 16.0 NA NAMinnesota 25,609 -0.4 7.7 8.6 61.8 56.3 8.0 8.9 4.7 6.2 52.7 54.1 NA NA NA NAMissouri 43,381 -23.4 14.3 12.4 33.8 28.0 13.9 12.0 16.6 14.2 63.7 61.9 7.2 5.4 4.2 5.4Nebraska 6,755 -11.5 5.9 5.4 41.4 35.3 6.0 5.4 5.9 5.6 55.4 53.9 NA NA NA NANorth Dakota 1,770 19.2 3.0 3.6 26.7 28.7 3.0 3.6 2.6 2.9 33.1 35.5 NA NA NA NAOhio 70,674 -21.3 14.0 12.0 49.2 44.6 14.5 12.3 10.0 10.2 62.8 61.4 8.9 6.6 2.8 3.1South Dakota 1,743 -4.3 3.4 3.4 6.6 7.0 3.5 3.5 2.6 2.8 53.7 47.8 NA NA NA NAWisconsin 17,408 -24.3 6.6 5.5 49.1 48.3 6.7 5.4 5.9 5.7 63.6 62.8 6.8 2.0 NA NANortheast 373,499 -0.3 12.5 12.7 40.4 34.2 13.1 13.2 9.3 10.5 61.9 61.8 10.2 6.5 0.8 0.7as a percent of U.S. 16.0 Connecticut 23,687 3.0 13.0 13.5 45.6 36.8 14.0 14.3 7.6 9.3 63.3 61.6 0.1 NA NA NAMaine 2,530 39.6 2.8 4.1 29.9 29.2 2.6 3.8 4.3 5.9 50.5 50.2 NA NA NA NAMassachusetts 40,554 2.9 9.3 9.9 39.6 34.1 9.9 10.6 7.0 7.5 59.7 59.8 6.1 4.2 NA NANew Hampshire 15,821 861.2 2.8 12.2 21.1 2.3 2.7 11.6 3.5 15.3 49.3 68.9 NA NA NA NANew Jersey 54,339 -7.6 15.1 14.8 49.5 43.6 15.7 15.2 11.4 12.2 62.4 63.0 14.2 13.6 NA NANew York 155,517 -4.4 14.8 14.7 37.4 33.9 15.5 15.2 11.3 12.2 62.4 61.8 5.9 5.7 NA NAPennsylvania 74,217 -8.4 12.0 11.9 40.0 35.3 12.5 12.3 9.2 10.1 62.1 61.7 22.1 8.8 3.5 3.3Rhode Island 5,347 5.1 7.3 7.5 32.8 25.4 7.5 7.8 5.1 5.5 56.5 58.0 NA NA NA NAVermont 1,487 60.1 2.4 3.8 19.8 7.6 2.3 3.5 2.9 5.6 46.3 47.2 NA NA NA NADistrict of Columbia 22,921 4.8 29.8 29.0 0.0 1.2 35.0 32.3 23.3 24.9 68.3 69.7 68.2 56.5 53.0 45.6
“NA” indicates not applicable. There was no institution of this type in the state during the specificed years.1 Table shows enrollments in all degree-granting institutions eligible for federal Title IV student
financial aid in the 50 states and D.C., excluding service schools and online-only colleges and universities.
2 Calculated based on a total that excludes people whose race is unknown and people from foreign countries.
3 Predominantly black institutions (PBIs) are those in which black students account for more than 50 percent of total fall enrollment. Historically black colleges and universities (HBCUs) are those founded prior to 1964 as institutions for black students. While an institution's PBI status may change from year to year, HBCU status will not.
Source: SREB analysis of National Center for Education Statistics fall enrollment surveys — www.nces.ed.gov/ipeds.
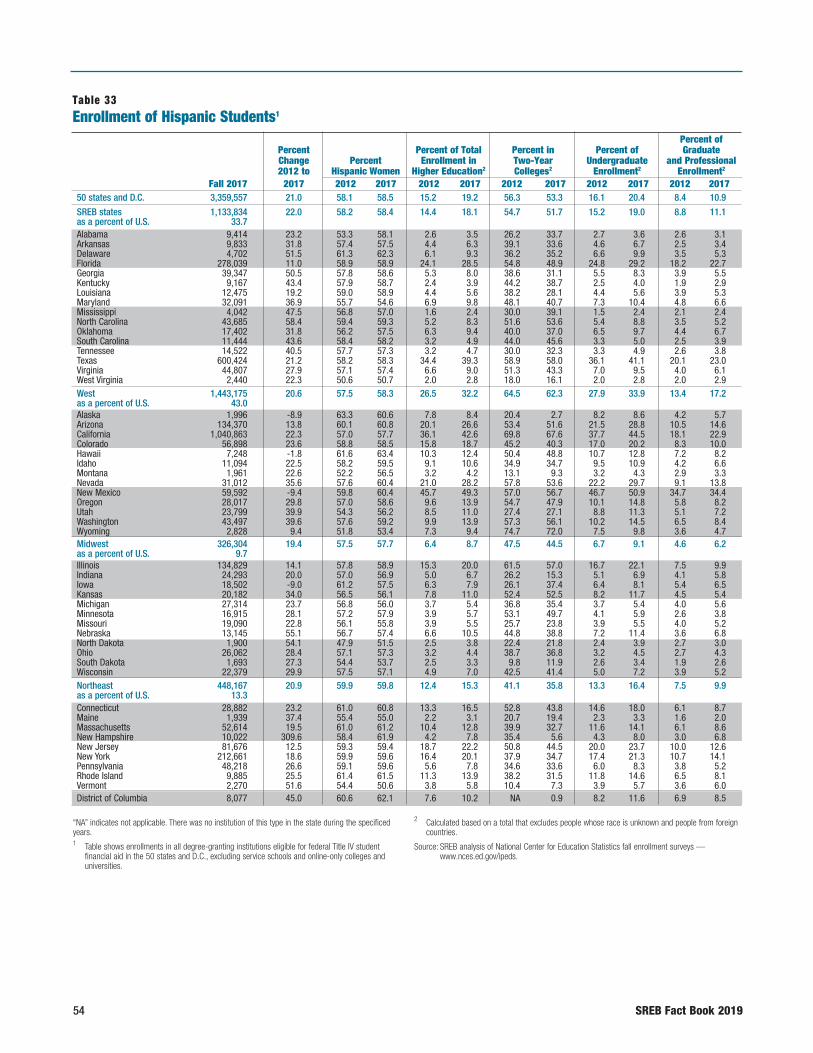
54 SREB Fact Book 2019
Table 33Enrollment of Hispanic Students1
Percent of Percent Percent of Total Percent in Percent of Graduate Change Percent Enrollment in Two-Year Undergraduate and Professional 2012 to Hispanic Women Higher Education2 Colleges2 Enrollment2 Enrollment2 Fall 2017 2017 2012 2017 2012 2017 2012 2017 2012 2017 2012 2017
50 states and D.C. 3,359,557 21.0 58.1 58.5 15.2 19.2 56.3 53.3 16.1 20.4 8.4 10.9
SREB states 1,133,834 22.0 58.2 58.4 14.4 18.1 54.7 51.7 15.2 19.0 8.8 11.1as a percent of U.S. 33.7 Alabama 9,414 23.2 53.3 58.1 2.6 3.5 26.2 33.7 2.7 3.6 2.6 3.1Arkansas 9,833 31.8 57.4 57.5 4.4 6.3 39.1 33.6 4.6 6.7 2.5 3.4Delaware 4,702 51.5 61.3 62.3 6.1 9.3 36.2 35.2 6.6 9.9 3.5 5.3Florida 278,039 11.0 58.9 58.9 24.1 28.5 54.8 48.9 24.8 29.2 18.2 22.7Georgia 39,347 50.5 57.8 58.6 5.3 8.0 38.6 31.1 5.5 8.3 3.9 5.5Kentucky 9,167 43.4 57.9 58.7 2.4 3.9 44.2 38.7 2.5 4.0 1.9 2.9Louisiana 12,475 19.2 59.0 58.9 4.4 5.6 38.2 28.1 4.4 5.6 3.9 5.3Maryland 32,091 36.9 55.7 54.6 6.9 9.8 48.1 40.7 7.3 10.4 4.8 6.6Mississippi 4,042 47.5 56.8 57.0 1.6 2.4 30.0 39.1 1.5 2.4 2.1 2.4North Carolina 43,685 58.4 59.4 59.3 5.2 8.3 51.6 53.6 5.4 8.8 3.5 5.2Oklahoma 17,402 31.8 56.2 57.5 6.3 9.4 40.0 37.0 6.5 9.7 4.4 6.7South Carolina 11,444 43.6 58.4 58.2 3.2 4.9 44.0 45.6 3.3 5.0 2.5 3.9Tennessee 14,522 40.5 57.7 57.3 3.2 4.7 30.0 32.3 3.3 4.9 2.6 3.8Texas 600,424 21.2 58.2 58.3 34.4 39.3 58.9 58.0 36.1 41.1 20.1 23.0Virginia 44,807 27.9 57.1 57.4 6.6 9.0 51.3 43.3 7.0 9.5 4.0 6.1West Virginia 2,440 22.3 50.6 50.7 2.0 2.8 18.0 16.1 2.0 2.8 2.0 2.9West 1,443,175 20.6 57.5 58.3 26.5 32.2 64.5 62.3 27.9 33.9 13.4 17.2as a percent of U.S. 43.0 Alaska 1,996 -8.9 63.3 60.6 7.8 8.4 20.4 2.7 8.2 8.6 4.2 5.7Arizona 134,370 13.8 60.1 60.8 20.1 26.6 53.4 51.6 21.5 28.8 10.5 14.6California 1,040,863 22.3 57.0 57.7 36.1 42.6 69.8 67.6 37.7 44.5 18.1 22.9Colorado 56,898 23.6 58.8 58.5 15.8 18.7 45.2 40.3 17.0 20.2 8.3 10.0Hawaii 7,248 -1.8 61.6 63.4 10.3 12.4 50.4 48.8 10.7 12.8 7.2 8.2Idaho 11,094 22.5 58.2 59.5 9.1 10.6 34.9 34.7 9.5 10.9 4.2 6.6Montana 1,961 22.6 52.2 56.5 3.2 4.2 13.1 9.3 3.2 4.3 2.9 3.3Nevada 31,012 35.6 57.6 60.4 21.0 28.2 57.8 53.6 22.2 29.7 9.1 13.8New Mexico 59,592 -9.4 59.8 60.4 45.7 49.3 57.0 56.7 46.7 50.9 34.7 34.4Oregon 28,017 29.8 57.0 58.6 9.6 13.9 54.7 47.9 10.1 14.8 5.8 8.2Utah 23,799 39.9 54.3 56.2 8.5 11.0 27.4 27.1 8.8 11.3 5.1 7.2Washington 43,497 39.6 57.6 59.2 9.9 13.9 57.3 56.1 10.2 14.5 6.5 8.4Wyoming 2,828 9.4 51.8 53.4 7.3 9.4 74.7 72.0 7.5 9.8 3.6 4.7Midwest 326,304 19.4 57.5 57.7 6.4 8.7 47.5 44.5 6.7 9.1 4.6 6.2as a percent of U.S. 9.7 Illinois 134,829 14.1 57.8 58.9 15.3 20.0 61.5 57.0 16.7 22.1 7.5 9.9Indiana 24,293 20.0 57.0 56.9 5.0 6.7 26.2 15.3 5.1 6.9 4.1 5.8Iowa 18,502 -9.0 61.2 57.5 6.3 7.9 26.1 37.4 6.4 8.1 5.4 6.5Kansas 20,182 34.0 56.5 56.1 7.8 11.0 52.4 52.5 8.2 11.7 4.5 5.4Michigan 27,314 23.7 56.8 56.0 3.7 5.4 36.8 35.4 3.7 5.4 4.0 5.6Minnesota 16,915 28.1 57.2 57.9 3.9 5.7 53.1 49.7 4.1 5.9 2.6 3.8Missouri 19,090 22.8 56.1 55.8 3.9 5.5 25.7 23.8 3.9 5.5 4.0 5.2Nebraska 13,145 55.1 56.7 57.4 6.6 10.5 44.8 38.8 7.2 11.4 3.6 6.8North Dakota 1,900 54.1 47.9 51.5 2.5 3.8 22.4 21.8 2.4 3.9 2.7 3.0Ohio 26,062 28.4 57.1 57.3 3.2 4.4 38.7 36.8 3.2 4.5 2.7 4.3South Dakota 1,693 27.3 54.4 53.7 2.5 3.3 9.8 11.9 2.6 3.4 1.9 2.6Wisconsin 22,379 29.9 57.5 57.1 4.9 7.0 42.5 41.4 5.0 7.2 3.9 5.2Northeast 448,167 20.9 59.9 59.8 12.4 15.3 41.1 35.8 13.3 16.4 7.5 9.9as a percent of U.S. 13.3 Connecticut 28,882 23.2 61.0 60.8 13.3 16.5 52.8 43.8 14.6 18.0 6.1 8.7Maine 1,939 37.4 55.4 55.0 2.2 3.1 20.7 19.4 2.3 3.3 1.6 2.0Massachusetts 52,614 19.5 61.0 61.2 10.4 12.8 39.9 32.7 11.6 14.1 6.1 8.6New Hampshire 10,022 309.6 58.4 61.9 4.2 7.8 35.4 5.6 4.3 8.0 3.0 6.8New Jersey 81,676 12.5 59.3 59.4 18.7 22.2 50.8 44.5 20.0 23.7 10.0 12.6New York 212,661 18.6 59.9 59.6 16.4 20.1 37.9 34.7 17.4 21.3 10.7 14.1Pennsylvania 48,218 26.6 59.1 59.6 5.6 7.8 34.6 33.6 6.0 8.3 3.8 5.2Rhode Island 9,885 25.5 61.4 61.5 11.3 13.9 38.2 31.5 11.8 14.6 6.5 8.1Vermont 2,270 51.6 54.4 50.6 3.8 5.8 10.4 7.3 3.9 5.7 3.6 6.0District of Columbia 8,077 45.0 60.6 62.1 7.6 10.2 NA 0.9 8.2 11.6 6.9 8.5
“NA” indicates not applicable. There was no institution of this type in the state during the specificed years.1 Table shows enrollments in all degree-granting institutions eligible for federal Title IV student
financial aid in the 50 states and D.C., excluding service schools and online-only colleges and universities.
2 Calculated based on a total that excludes people whose race is unknown and people from foreign countries.
Source: SREB analysis of National Center for Education Statistics fall enrollment surveys — www.nces.ed.gov/ipeds.
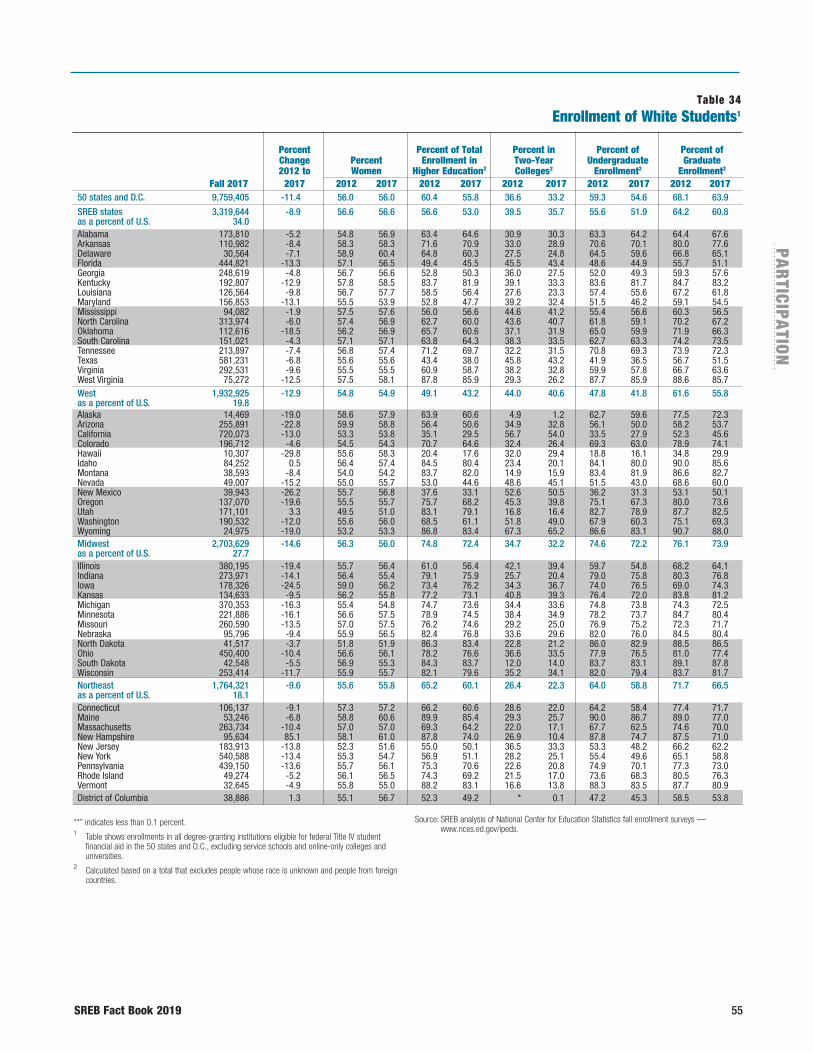
SREB Fact Book 2019 55
PAR
TICIPATIO
N
Table 34Enrollment of White Students1
Percent Percent of Total Percent in Percent of Percent of Change Percent Enrollment in Two-Year Undergraduate Graduate 2012 to Women Higher Education2 Colleges2 Enrollment2 Enrollment2 Fall 2017 2017 2012 2017 2012 2017 2012 2017 2012 2017 2012 2017
50 states and D.C. 9,759,405 -11.4 56.0 56.0 60.4 55.8 36.6 33.2 59.3 54.6 68.1 63.9
SREB states 3,319,644 -8.9 56.6 56.6 56.6 53.0 39.5 35.7 55.6 51.9 64.2 60.8as a percent of U.S. 34.0 Alabama 173,810 -5.2 54.8 56.9 63.4 64.6 30.9 30.3 63.3 64.2 64.4 67.6Arkansas 110,982 -8.4 58.3 58.3 71.6 70.9 33.0 28.9 70.6 70.1 80.0 77.6Delaware 30,564 -7.1 58.9 60.4 64.8 60.3 27.5 24.8 64.5 59.6 66.8 65.1Florida 444,821 -13.3 57.1 56.5 49.4 45.5 45.5 43.4 48.6 44.9 55.7 51.1Georgia 248,619 -4.8 56.7 56.6 52.8 50.3 36.0 27.5 52.0 49.3 59.3 57.6Kentucky 192,807 -12.9 57.8 58.5 83.7 81.9 39.1 33.3 83.6 81.7 84.7 83.2Louisiana 126,564 -9.8 56.7 57.7 58.5 56.4 27.6 23.3 57.4 55.6 67.2 61.8Maryland 156,853 -13.1 55.5 53.9 52.8 47.7 39.2 32.4 51.5 46.2 59.1 54.5Mississippi 94,082 -1.9 57.5 57.6 56.0 56.6 44.6 41.2 55.4 56.6 60.3 56.5North Carolina 313,974 -6.0 57.4 56.9 62.7 60.0 43.6 40.7 61.8 59.1 70.2 67.2Oklahoma 112,616 -18.5 56.2 56.9 65.7 60.6 37.1 31.9 65.0 59.9 71.9 66.3South Carolina 151,021 -4.3 57.1 57.1 63.8 64.3 38.3 33.5 62.7 63.3 74.2 73.5Tennessee 213,897 -7.4 56.8 57.4 71.2 69.7 32.2 31.5 70.8 69.3 73.9 72.3Texas 581,231 -6.8 55.6 55.6 43.4 38.0 45.8 43.2 41.9 36.5 56.7 51.5Virginia 292,531 -9.6 55.5 55.5 60.9 58.7 38.2 32.8 59.9 57.8 66.7 63.6West Virginia 75,272 -12.5 57.5 58.1 87.8 85.9 29.3 26.2 87.7 85.9 88.6 85.7West 1,932,925 -12.9 54.8 54.9 49.1 43.2 44.0 40.6 47.8 41.8 61.6 55.8as a percent of U.S. 19.8 Alaska 14,469 -19.0 58.6 57.9 63.9 60.6 4.9 1.2 62.7 59.6 77.5 72.3Arizona 255,891 -22.8 59.9 58.8 56.4 50.6 34.9 32.8 56.1 50.0 58.2 53.7California 720,073 -13.0 53.3 53.8 35.1 29.5 56.7 54.0 33.5 27.9 52.3 45.6Colorado 196,712 -4.6 54.5 54.3 70.7 64.6 32.4 26.4 69.3 63.0 78.9 74.1Hawaii 10,307 -29.8 55.6 58.3 20.4 17.6 32.0 29.4 18.8 16.1 34.8 29.9Idaho 84,252 0.5 56.4 57.4 84.5 80.4 23.4 20.1 84.1 80.0 90.0 85.6Montana 38,593 -8.4 54.0 54.2 83.7 82.0 14.9 15.9 83.4 81.9 86.6 82.7Nevada 49,007 -15.2 55.0 55.7 53.0 44.6 48.6 45.1 51.5 43.0 68.6 60.0New Mexico 39,943 -26.2 55.7 56.8 37.6 33.1 52.6 50.5 36.2 31.3 53.1 50.1Oregon 137,070 -19.6 55.5 55.7 75.7 68.2 45.3 39.8 75.1 67.3 80.0 73.6Utah 171,101 3.3 49.5 51.0 83.1 79.1 16.8 16.4 82.7 78.9 87.7 82.5Washington 190,532 -12.0 55.6 56.0 68.5 61.1 51.8 49.0 67.9 60.3 75.1 69.3Wyoming 24,975 -19.0 53.2 53.3 86.8 83.4 67.3 65.2 86.6 83.1 90.7 88.0Midwest 2,703,629 -14.6 56.3 56.0 74.8 72.4 34.7 32.2 74.6 72.2 76.1 73.9as a percent of U.S. 27.7 Illinois 380,195 -19.4 55.7 56.4 61.0 56.4 42.1 39.4 59.7 54.8 68.2 64.1Indiana 273,971 -14.1 56.4 55.4 79.1 75.9 25.7 20.4 79.0 75.8 80.3 76.8Iowa 178,326 -24.5 59.0 56.2 73.4 76.2 34.3 36.7 74.0 76.5 69.0 74.3Kansas 134,633 -9.5 56.2 55.8 77.2 73.1 40.8 39.3 76.4 72.0 83.8 81.2Michigan 370,353 -16.3 55.4 54.8 74.7 73.6 34.4 33.6 74.8 73.8 74.3 72.5Minnesota 221,886 -16.1 56.6 57.5 78.9 74.5 38.4 34.9 78.2 73.7 84.7 80.4Missouri 260,590 -13.5 57.0 57.5 76.2 74.6 29.2 25.0 76.9 75.2 72.3 71.7Nebraska 95,796 -9.4 55.9 56.5 82.4 76.8 33.6 29.6 82.0 76.0 84.5 80.4North Dakota 41,517 -3.7 51.8 51.9 86.3 83.4 22.8 21.2 86.0 82.9 88.5 86.5Ohio 450,400 -10.4 56.6 56.1 78.2 76.6 36.6 33.5 77.9 76.5 81.0 77.4South Dakota 42,548 -5.5 56.9 55.3 84.3 83.7 12.0 14.0 83.7 83.1 89.1 87.8Wisconsin 253,414 -11.7 55.9 55.7 82.1 79.6 35.2 34.1 82.0 79.4 83.7 81.7Northeast 1,764,321 -9.6 55.6 55.8 65.2 60.1 26.4 22.3 64.0 58.8 71.7 66.5as a percent of U.S. 18.1 Connecticut 106,137 -9.1 57.3 57.2 66.2 60.6 28.6 22.0 64.2 58.4 77.4 71.7Maine 53,246 -6.8 58.8 60.6 89.9 85.4 29.3 25.7 90.0 86.7 89.0 77.0Massachusetts 263,734 -10.4 57.0 57.0 69.3 64.2 22.0 17.1 67.7 62.5 74.6 70.0New Hampshire 95,634 85.1 58.1 61.0 87.8 74.0 26.9 10.4 87.8 74.7 87.5 71.0New Jersey 183,913 -13.8 52.3 51.6 55.0 50.1 36.5 33.3 53.3 48.2 66.2 62.2New York 540,588 -13.4 55.3 54.7 56.9 51.1 28.2 25.1 55.4 49.6 65.1 58.8Pennsylvania 439,150 -13.6 55.7 56.1 75.3 70.6 22.6 20.8 74.9 70.1 77.3 73.0Rhode Island 49,274 -5.2 56.1 56.5 74.3 69.2 21.5 17.0 73.6 68.3 80.5 76.3Vermont 32,645 -4.9 55.8 55.0 88.2 83.1 16.6 13.8 88.3 83.5 87.7 80.9District of Columbia 38,886 1.3 55.1 56.7 52.3 49.2 * 0.1 47.2 45.3 58.5 53.8
“*” indicates less than 0.1 percent.1 Table shows enrollments in all degree-granting institutions eligible for federal Title IV student
financial aid in the 50 states and D.C., excluding service schools and online-only colleges and universities.
2 Calculated based on a total that excludes people whose race is unknown and people from foreign countries.
Source: SREB analysis of National Center for Education Statistics fall enrollment surveys — www.nces.ed.gov/ipeds.
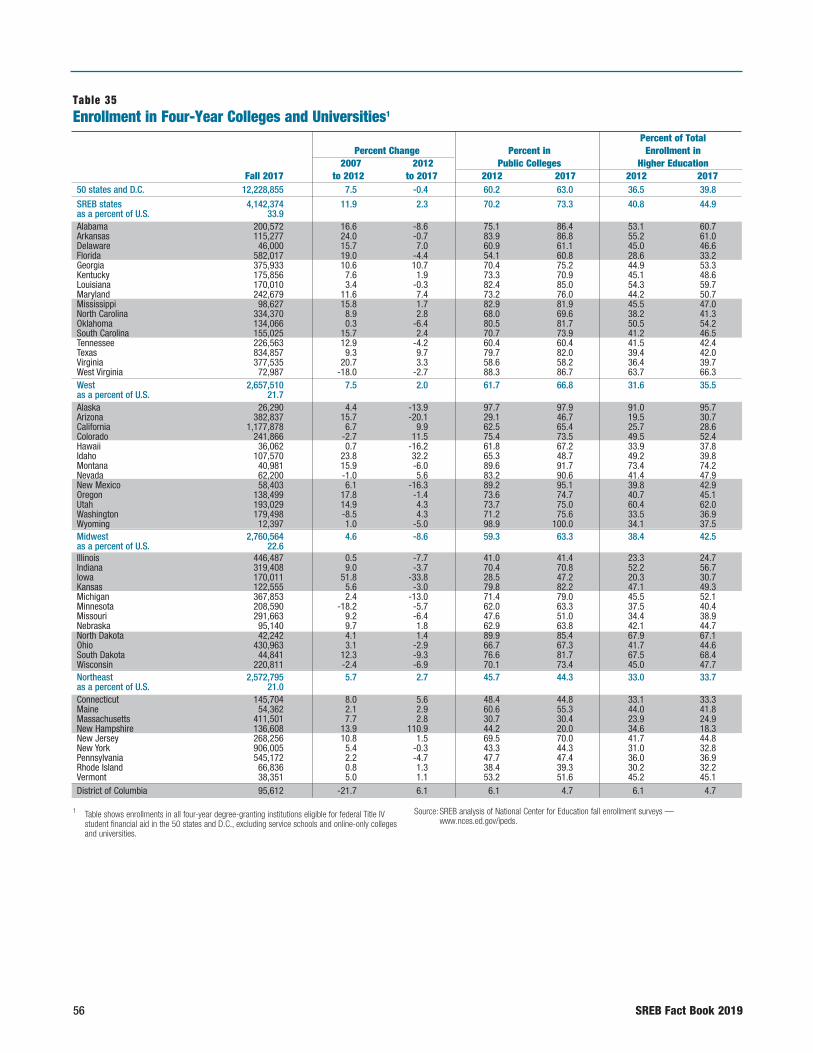
56 SREB Fact Book 2019
50 states and D.C. 12,228,855 7.5 -0.4 60.2 63.0 36.5 39.8
SREB states 4,142,374 11.9 2.3 70.2 73.3 40.8 44.9as a percent of U.S. 33.9 Alabama 200,572 16.6 -8.6 75.1 86.4 53.1 60.7Arkansas 115,277 24.0 -0.7 83.9 86.8 55.2 61.0Delaware 46,000 15.7 7.0 60.9 61.1 45.0 46.6Florida 582,017 19.0 -4.4 54.1 60.8 28.6 33.2Georgia 375,933 10.6 10.7 70.4 75.2 44.9 53.3Kentucky 175,856 7.6 1.9 73.3 70.9 45.1 48.6Louisiana 170,010 3.4 -0.3 82.4 85.0 54.3 59.7Maryland 242,679 11.6 7.4 73.2 76.0 44.2 50.7Mississippi 98,627 15.8 1.7 82.9 81.9 45.5 47.0North Carolina 334,370 8.9 2.8 68.0 69.6 38.2 41.3Oklahoma 134,066 0.3 -6.4 80.5 81.7 50.5 54.2South Carolina 155,025 15.7 2.4 70.7 73.9 41.2 46.5Tennessee 226,563 12.9 -4.2 60.4 60.4 41.5 42.4Texas 834,857 9.3 9.7 79.7 82.0 39.4 42.0Virginia 377,535 20.7 3.3 58.6 58.2 36.4 39.7West Virginia 72,987 -18.0 -2.7 88.3 86.7 63.7 66.3West 2,657,510 7.5 2.0 61.7 66.8 31.6 35.5as a percent of U.S. 21.7 Alaska 26,290 4.4 -13.9 97.7 97.9 91.0 95.7Arizona 382,837 15.7 -20.1 29.1 46.7 19.5 30.7California 1,177,878 6.7 9.9 62.5 65.4 25.7 28.6Colorado 241,866 -2.7 11.5 75.4 73.5 49.5 52.4Hawaii 36,062 0.7 -16.2 61.8 67.2 33.9 37.8Idaho 107,570 23.8 32.2 65.3 48.7 49.2 39.8Montana 40,981 15.9 -6.0 89.6 91.7 73.4 74.2Nevada 62,200 -1.0 5.6 83.2 90.6 41.4 47.9New Mexico 58,403 6.1 -16.3 89.2 95.1 39.8 42.9Oregon 138,499 17.8 -1.4 73.6 74.7 40.7 45.1Utah 193,029 14.9 4.3 73.7 75.0 60.4 62.0Washington 179,498 -8.5 4.3 71.2 75.6 33.5 36.9Wyoming 12,397 1.0 -5.0 98.9 100.0 34.1 37.5Midwest 2,760,564 4.6 -8.6 59.3 63.3 38.4 42.5as a percent of U.S. 22.6 Illinois 446,487 0.5 -7.7 41.0 41.4 23.3 24.7Indiana 319,408 9.0 -3.7 70.4 70.8 52.2 56.7Iowa 170,011 51.8 -33.8 28.5 47.2 20.3 30.7Kansas 122,555 5.6 -3.0 79.8 82.2 47.1 49.3Michigan 367,853 2.4 -13.0 71.4 79.0 45.5 52.1Minnesota 208,590 -18.2 -5.7 62.0 63.3 37.5 40.4Missouri 291,663 9.2 -6.4 47.6 51.0 34.4 38.9Nebraska 95,140 9.7 1.8 62.9 63.8 42.1 44.7North Dakota 42,242 4.1 1.4 89.9 85.4 67.9 67.1Ohio 430,963 3.1 -2.9 66.7 67.3 41.7 44.6South Dakota 44,841 12.3 -9.3 76.6 81.7 67.5 68.4Wisconsin 220,811 -2.4 -6.9 70.1 73.4 45.0 47.7Northeast 2,572,795 5.7 2.7 45.7 44.3 33.0 33.7as a percent of U.S. 21.0 Connecticut 145,704 8.0 5.6 48.4 44.8 33.1 33.3Maine 54,362 2.1 2.9 60.6 55.3 44.0 41.8Massachusetts 411,501 7.7 2.8 30.7 30.4 23.9 24.9New Hampshire 136,608 13.9 110.9 44.2 20.0 34.6 18.3New Jersey 268,256 10.8 1.5 69.5 70.0 41.7 44.8New York 906,005 5.4 -0.3 43.3 44.3 31.0 32.8Pennsylvania 545,172 2.2 -4.7 47.7 47.4 36.0 36.9Rhode Island 66,836 0.8 1.3 38.4 39.3 30.2 32.2Vermont 38,351 5.0 1.1 53.2 51.6 45.2 45.1District of Columbia 95,612 -21.7 6.1 6.1 4.7 6.1 4.7
1 Table shows enrollments in all four-year degree-granting institutions eligible for federal Title IV student financial aid in the 50 states and D.C., excluding service schools and online-only colleges and universities.
Source: SREB analysis of National Center for Education fall enrollment surveys — www.nces.ed.gov/ipeds.
Table 35Enrollment in Four-Year Colleges and Universities1
Percent of Total Percent Change Percent in Enrollment in 2007 2012 Public Colleges Higher Education Fall 2017 to 2012 to 2017 2012 2017 2012 2017
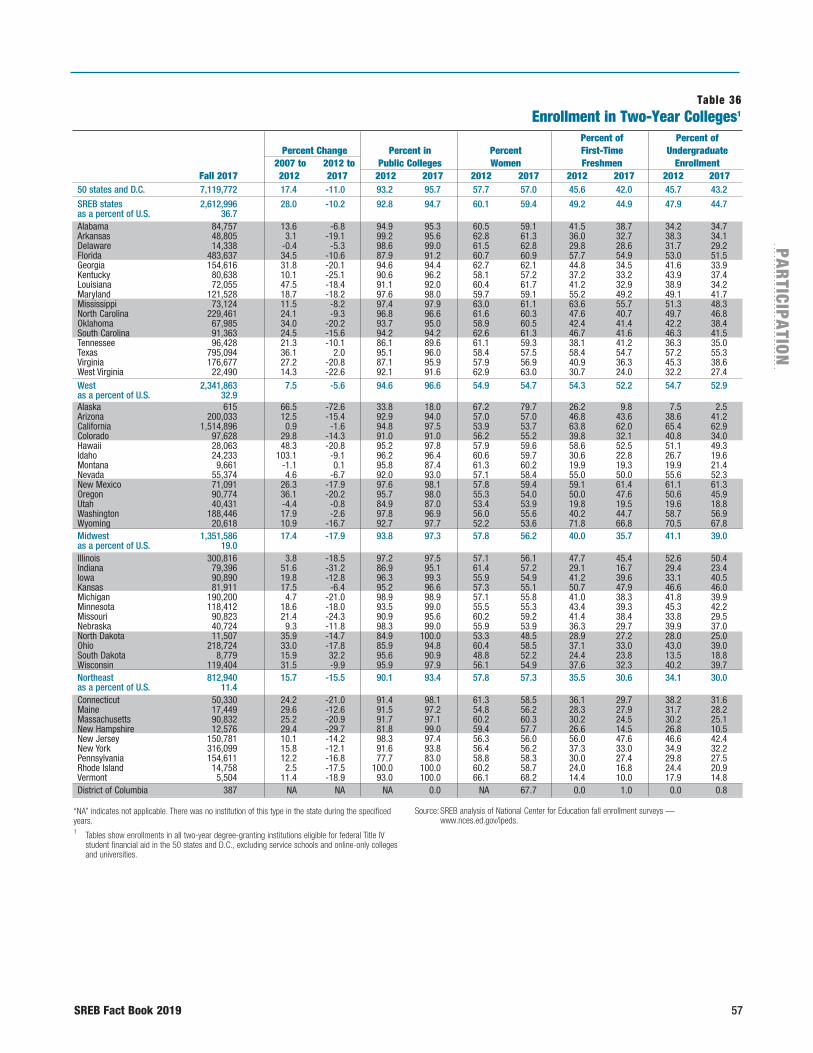
SREB Fact Book 2019 57
PAR
TICIPATIO
N
Table 36Enrollment in Two-Year Colleges1
Percent of Percent of Percent Change Percent in Percent First-Time Undergraduate 2007 to 2012 to Public Colleges Women Freshmen Enrollment Fall 2017 2012 2017 2012 2017 2012 2017 2012 2017 2012 2017
50 states and D.C. 7,119,772 17.4 -11.0 93.2 95.7 57.7 57.0 45.6 42.0 45.7 43.2
SREB states 2,612,996 28.0 -10.2 92.8 94.7 60.1 59.4 49.2 44.9 47.9 44.7as a percent of U.S. 36.7 Alabama 84,757 13.6 -6.8 94.9 95.3 60.5 59.1 41.5 38.7 34.2 34.7Arkansas 48,805 3.1 -19.1 99.2 95.6 62.8 61.3 36.0 32.7 38.3 34.1Delaware 14,338 -0.4 -5.3 98.6 99.0 61.5 62.8 29.8 28.6 31.7 29.2Florida 483,637 34.5 -10.6 87.9 91.2 60.7 60.9 57.7 54.9 53.0 51.5Georgia 154,616 31.8 -20.1 94.6 94.4 62.7 62.1 44.8 34.5 41.6 33.9Kentucky 80,638 10.1 -25.1 90.6 96.2 58.1 57.2 37.2 33.2 43.9 37.4Louisiana 72,055 47.5 -18.4 91.1 92.0 60.4 61.7 41.2 32.9 38.9 34.2Maryland 121,528 18.7 -18.2 97.6 98.0 59.7 59.1 55.2 49.2 49.1 41.7Mississippi 73,124 11.5 -8.2 97.4 97.9 63.0 61.1 63.6 55.7 51.3 48.3North Carolina 229,461 24.1 -9.3 96.8 96.6 61.6 60.3 47.6 40.7 49.7 46.8Oklahoma 67,985 34.0 -20.2 93.7 95.0 58.9 60.5 42.4 41.4 42.2 38.4South Carolina 91,363 24.5 -15.6 94.2 94.2 62.6 61.3 46.7 41.6 46.3 41.5Tennessee 96,428 21.3 -10.1 86.1 89.6 61.1 59.3 38.1 41.2 36.3 35.0Texas 795,094 36.1 2.0 95.1 96.0 58.4 57.5 58.4 54.7 57.2 55.3Virginia 176,677 27.2 -20.8 87.1 95.9 57.9 56.9 40.9 36.3 45.3 38.6West Virginia 22,490 14.3 -22.6 92.1 91.6 62.9 63.0 30.7 24.0 32.2 27.4West 2,341,863 7.5 -5.6 94.6 96.6 54.9 54.7 54.3 52.2 54.7 52.9as a percent of U.S. 32.9 Alaska 615 66.5 -72.6 33.8 18.0 67.2 79.7 26.2 9.8 7.5 2.5Arizona 200,033 12.5 -15.4 92.9 94.0 57.0 57.0 46.8 43.6 38.6 41.2California 1,514,896 0.9 -1.6 94.8 97.5 53.9 53.7 63.8 62.0 65.4 62.9Colorado 97,628 29.8 -14.3 91.0 91.0 56.2 55.2 39.8 32.1 40.8 34.0Hawaii 28,063 48.3 -20.8 95.2 97.8 57.9 59.6 58.6 52.5 51.1 49.3Idaho 24,233 103.1 -9.1 96.2 96.4 60.6 59.7 30.6 22.8 26.7 19.6Montana 9,661 -1.1 0.1 95.8 87.4 61.3 60.2 19.9 19.3 19.9 21.4Nevada 55,374 4.6 -6.7 92.0 93.0 57.1 58.4 55.0 50.0 55.6 52.3New Mexico 71,091 26.3 -17.9 97.6 98.1 57.8 59.4 59.1 61.4 61.1 61.3Oregon 90,774 36.1 -20.2 95.7 98.0 55.3 54.0 50.0 47.6 50.6 45.9Utah 40,431 -4.4 -0.8 84.9 87.0 53.4 53.9 19.8 19.5 19.6 18.8Washington 188,446 17.9 -2.6 97.8 96.9 56.0 55.6 40.2 44.7 58.7 56.9Wyoming 20,618 10.9 -16.7 92.7 97.7 52.2 53.6 71.8 66.8 70.5 67.8Midwest 1,351,586 17.4 -17.9 93.8 97.3 57.8 56.2 40.0 35.7 41.1 39.0as a percent of U.S. 19.0 Illinois 300,816 3.8 -18.5 97.2 97.5 57.1 56.1 47.7 45.4 52.6 50.4Indiana 79,396 51.6 -31.2 86.9 95.1 61.4 57.2 29.1 16.7 29.4 23.4Iowa 90,890 19.8 -12.8 96.3 99.3 55.9 54.9 41.2 39.6 33.1 40.5Kansas 81,911 17.5 -6.4 95.2 96.6 57.3 55.1 50.7 47.9 46.6 46.0Michigan 190,200 4.7 -21.0 98.9 98.9 57.1 55.8 41.0 38.3 41.8 39.9Minnesota 118,412 18.6 -18.0 93.5 99.0 55.5 55.3 43.4 39.3 45.3 42.2Missouri 90,823 21.4 -24.3 90.9 95.6 60.2 59.2 41.4 38.4 33.8 29.5Nebraska 40,724 9.3 -11.8 98.3 99.0 55.9 53.9 36.3 29.7 39.9 37.0North Dakota 11,507 35.9 -14.7 84.9 100.0 53.3 48.5 28.9 27.2 28.0 25.0Ohio 218,724 33.0 -17.8 85.9 94.8 60.4 58.5 37.1 33.0 43.0 39.0South Dakota 8,779 15.9 32.2 95.6 90.9 48.8 52.2 24.4 23.8 13.5 18.8Wisconsin 119,404 31.5 -9.9 95.9 97.9 56.1 54.9 37.6 32.3 40.2 39.7Northeast 812,940 15.7 -15.5 90.1 93.4 57.8 57.3 35.5 30.6 34.1 30.0as a percent of U.S. 11.4 Connecticut 50,330 24.2 -21.0 91.4 98.1 61.3 58.5 36.1 29.7 38.2 31.6Maine 17,449 29.6 -12.6 91.5 97.2 54.8 56.2 28.3 27.9 31.7 28.2Massachusetts 90,832 25.2 -20.9 91.7 97.1 60.2 60.3 30.2 24.5 30.2 25.1New Hampshire 12,576 29.4 -29.7 81.8 99.0 59.4 57.7 26.6 14.5 26.8 10.5New Jersey 150,781 10.1 -14.2 98.3 97.4 56.3 56.0 56.0 47.6 46.6 42.4New York 316,099 15.8 -12.1 91.6 93.8 56.4 56.2 37.3 33.0 34.9 32.2Pennsylvania 154,611 12.2 -16.8 77.7 83.0 58.8 58.3 30.0 27.4 29.8 27.5Rhode Island 14,758 2.5 -17.5 100.0 100.0 60.2 58.7 24.0 16.8 24.4 20.9Vermont 5,504 11.4 -18.9 93.0 100.0 66.1 68.2 14.4 10.0 17.9 14.8District of Columbia 387 NA NA NA 0.0 NA 67.7 0.0 1.0 0.0 0.8
“NA” indicates not applicable. There was no institution of this type in the state during the specificed years.1 Tables show enrollments in all two-year degree-granting institutions eligible for federal Title IV
student financial aid in the 50 states and D.C., excluding service schools and online-only colleges and universities.
Source: SREB analysis of National Center for Education fall enrollment surveys — www.nces.ed.gov/ipeds.
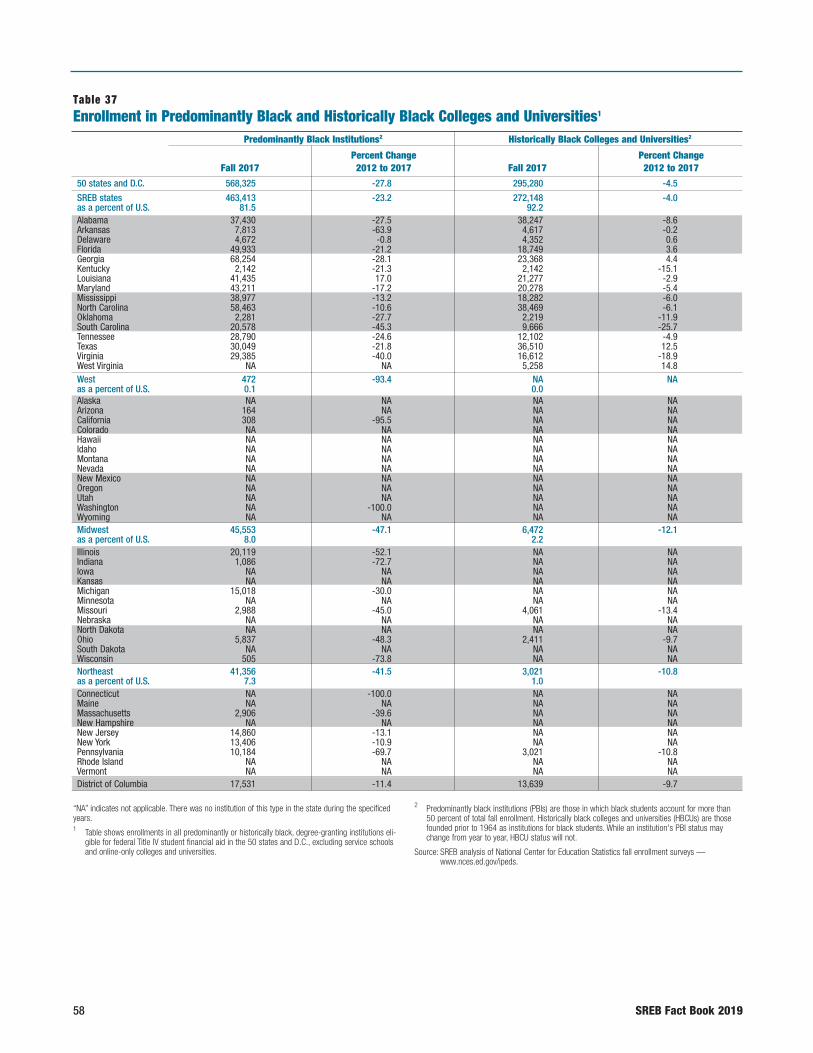
58 SREB Fact Book 2019
Table 37Enrollment in Predominantly Black and Historically Black Colleges and Universities1
Predominantly Black Institutions2 Historically Black Colleges and Universities2
Percent Change Percent Change Fall 2017 2012 to 2017 Fall 2017 2012 to 2017
50 states and D.C. 568,325 -27.8 295,280 -4.5
SREB states 463,413 -23.2 272,148 -4.0as a percent of U.S. 81.5 92.2 Alabama 37,430 -27.5 38,247 -8.6Arkansas 7,813 -63.9 4,617 -0.2Delaware 4,672 -0.8 4,352 0.6Florida 49,933 -21.2 18,749 3.6Georgia 68,254 -28.1 23,368 4.4Kentucky 2,142 -21.3 2,142 -15.1Louisiana 41,435 17.0 21,277 -2.9Maryland 43,211 -17.2 20,278 -5.4Mississippi 38,977 -13.2 18,282 -6.0North Carolina 58,463 -10.6 38,469 -6.1Oklahoma 2,281 -27.7 2,219 -11.9South Carolina 20,578 -45.3 9,666 -25.7Tennessee 28,790 -24.6 12,102 -4.9Texas 30,049 -21.8 36,510 12.5Virginia 29,385 -40.0 16,612 -18.9West Virginia NA NA 5,258 14.8West 472 -93.4 NA NAas a percent of U.S. 0.1 0.0 Alaska NA NA NA NAArizona 164 NA NA NACalifornia 308 -95.5 NA NAColorado NA NA NA NAHawaii NA NA NA NAIdaho NA NA NA NAMontana NA NA NA NANevada NA NA NA NANew Mexico NA NA NA NAOregon NA NA NA NAUtah NA NA NA NAWashington NA -100.0 NA NAWyoming NA NA NA NAMidwest 45,553 -47.1 6,472 -12.1as a percent of U.S. 8.0 2.2 Illinois 20,119 -52.1 NA NAIndiana 1,086 -72.7 NA NAIowa NA NA NA NAKansas NA NA NA NAMichigan 15,018 -30.0 NA NAMinnesota NA NA NA NAMissouri 2,988 -45.0 4,061 -13.4Nebraska NA NA NA NANorth Dakota NA NA NA NAOhio 5,837 -48.3 2,411 -9.7South Dakota NA NA NA NAWisconsin 505 -73.8 NA NANortheast 41,356 -41.5 3,021 -10.8as a percent of U.S. 7.3 1.0 Connecticut NA -100.0 NA NAMaine NA NA NA NAMassachusetts 2,906 -39.6 NA NANew Hampshire NA NA NA NANew Jersey 14,860 -13.1 NA NANew York 13,406 -10.9 NA NAPennsylvania 10,184 -69.7 3,021 -10.8Rhode Island NA NA NA NAVermont NA NA NA NADistrict of Columbia 17,531 -11.4 13,639 -9.7
“NA” indicates not applicable. There was no institution of this type in the state during the specificed years.1 Table shows enrollments in all predominantly or historically black, degree-granting institutions eli-
gible for federal Title IV student financial aid in the 50 states and D.C., excluding service schools and online-only colleges and universities.
2 Predominantly black institutions (PBIs) are those in which black students account for more than 50 percent of total fall enrollment. Historically black colleges and universities (HBCUs) are those founded prior to 1964 as institutions for black students. While an institution's PBI status may change from year to year, HBCU status will not.
Source: SREB analysis of National Center for Education Statistics fall enrollment surveys — www.nces.ed.gov/ipeds.

SREB Fact Book 2019 59
PAR
TICIPATIO
N
Table 38Enrollment in Online-Only Colleges and Universities1 by State Where Institution Is Headquartered
Fall 2017 Percent Percent Percent Percent Percent Percent Percent Total Public Undergraduate Four-Year Women White Black Hispanic
50 states and D.C. 401,425 7.9 62.0 97.0 61.7 60.1 22.8 9.3
SREB states 85,119 3.4 75.1 98.1 45.8 59.6 20.9 11.6as a percent of U.S. 21.2 Alabama 21,493 71.5 100.0 40.5 59.3 24.9 7.4Arkansas NA NA NA NA NA NA NADelaware NA NA NA NA NA NA NAFlorida 5,830 49.1 84.5 97.7 57.6 60.0 16.8 17.1Georgia 7,575 53.5 100.0 81.5 46.4 36.9 12.0Kentucky 2,004 100.0 94.3 77.8 9.4 6.3Louisiana NA NA NA NA NA NA NAMaryland NA NA NA NA NA NA NAMississippi NA NA NA NA NA NA NANorth Carolina NA NA NA NA NA NA NAOklahoma NA NA NA NA NA NA NASouth Carolina NA NA NA NA NA NA NATennessee 166 86.7 100.0 86.1 81.2 5.8 10.4Texas 565 100.0 80.5 27.9 37.1 27.7Virginia NA NA NA NA NA NA NAWest Virginia 47,486 81.9 98.1 38.4 61.4 17.4 12.8
West 150,312 8.2 66.8 97.8 64.3 68.4 13.1 10.2as a percent of U.S. 37.4 104.6 107.7 100.8 104.2 113.9 57.6 109.4Alaska NA NA NA NA NA NA NAArizona 8,756 84.5 66.1 60.3 57.6 29.3 8.2California 21,277 32.5 98.5 58.0 41.4 30.2 18.2Colorado 20,742 59.7 62.8 100.0 67.7 70.1 10.5 10.5Hawaii NA NA NA NA NA NA NAIdaho NA NA NA NA NA NA NAMontana NA NA NA NA NA NA NANevada NA NA NA NA NA NA NANew Mexico NA NA NA NA NA NA NAOregon 663 63.0 100.0 93.5 87.8 7.0 1.7Utah 98,874 73.5 100.0 65.2 73.0 9.7 9.1Washington NA NA NA NA NA NA NAWyoming NA NA NA NA NA NA NA
Midwest 106,770 0.5 32.7 99.9 74.5 45.4 42.3 5.0as a percent of U.S. 26.6 6.6 52.7 103.0 120.8 75.5 185.7 54.0Illinois 9,699 89.7 100.0 70.7 39.9 49.0 2.9Indiana NA NA NA NA NA NA NAIowa 53 37.7 100.0 50.9 68.8 18.8 10.4Kansas 9,496 84.0 100.0 49.2 37.7 49.4 5.8Michigan NA NA NA NA NA NA NAMinnesota 85,964 19.4 100.0 77.9 46.8 41.3 5.0Missouri 1,003 96.6 100.0 73.1 49.2 24.6 15.4Nebraska NA NA NA NA NA NA NANorth Dakota NA NA NA NA NA NA NAOhio NA NA NA NA NA NA NASouth Dakota NA NA NA NA NA NA NAWisconsin 555 100.0 100.0 90.3 66.8 58.8 3.2 3.4Northeast 59,224 26.7 83.8 88.1 54.9 63.3 18.4 10.6as a percent of U.S. 14.8 338.9 135.2 90.8 89.0 105.3 80.7 114.1Connecticut 1,500 100.0 94.4 100.0 67.7 59.8 18.2 16.2Maine NA NA NA NA NA NA NAMassachusetts 1,175 80.1 100.0 71.7 62.4 19.7 11.0New Hampshire NA NA NA NA NA NA NANew Jersey NA NA NA NA NA NA NANew York 38,136 92.2 89.2 54.2 60.3 21.9 10.3Pennsylvania 17,241 82.9 66.4 82.9 53.3 70.6 9.9 10.9Rhode Island 1,172 58.7 100.0 69.0 58.6 24.2 10.5Vermont NA NA NA NA NA NA NADistrict of Columbia NA NA NA NA NA NA NA
“NA” indicates not applicable. There was no institution of this type in the state during the specificed years.1 This table supplements the other headcount enrollment tables on degree-granting institutions
eligible for federal Title IV student financial aid by detailing students enrolled in colleges and universities whose offerings are all online. This sub-category of institutions was not identified in the National Center for Education Statistics IPEDS data until 2011.
Source: SREB analysis of National Center for Education Statistics fall enrollment surveys — www.nces.ed.gov/ipeds.

60 SREB Fact Book 2019
Table 39Enrollment in Non-Degree-Granting Postsecondary Education Institutions1
Fall 2017 Percent in Percent First-Time Percent Percent Percent Percent Total Public Colleges Freshmen Women White Black Hispanic
50 states and D.C. 359,167 29.3 34.3 63.8 44.9 21.4 23.9
SREB states 160,238 42.5 34.6 56.9 41.7 25.2 22.8as a percent of U.S. 44.6 Alabama 1,775 NA 20.3 83.4 45.0 49.2 2.9Arkansas 2,472 13.7 33.6 78.8 56.4 31.5 7.5Delaware 1,015 NA 33.7 87.1 42.3 37.5 11.0Florida 51,133 61.0 34.7 46.0 35.6 22.6 35.3Georgia 6,224 1.1 27.7 77.8 25.0 58.8 7.7Kentucky 2,441 NA 29.5 87.4 64.3 21.6 2.5Louisiana 7,908 NA 31.0 84.6 45.2 43.8 5.4Maryland 4,380 NA 31.6 66.0 24.1 61.5 4.9Mississippi 2,222 NA 54.3 71.0 31.0 65.9 1.2North Carolina 6,028 NA 31.1 56.1 44.0 39.2 8.7Oklahoma 24,087 92.8 26.6 48.6 54.6 7.9 12.8South Carolina 3,098 1.3 26.8 82.2 45.7 45.6 4.0Tennessee 16,394 78.3 37.9 47.9 72.1 18.9 4.4Texas 25,907 NA 45.0 62.6 21.7 18.7 47.0Virginia 3,420 10.4 26.6 67.3 35.3 37.0 9.3West Virginia 1,734 57.6 43.9 66.8 90.4 6.6 0.7West 78,381 27.1 33.7 68.6 44.9 8.5 38.9as a percent of U.S. 21.8 Alaska 967 0.3 88.5 13.1 50.8 0.5 2.9Arizona 7,675 9.0 35.8 56.3 43.1 9.7 29.1California 42,425 5.0 30.8 65.6 20.4 9.4 49.6Colorado 8,694 65.2 33.3 45.2 52.7 7.1 28.8Hawaii 356 NA 19.7 55.6 24.7 13.8 5.3Idaho 1,362 2.1 28.4 92.1 75.0 1.8 18.3Montana 397 NA 52.1 97.5 84.6 1.3 3.0Nevada 3,241 NA 30.0 70.7 35.4 14.9 29.3New Mexico 1,283 NA 31.4 85.6 24.5 15.8 44.3Oregon 2,819 NA 24.8 86.5 65.4 4.5 15.1Utah 14,748 79.5 20.6 51.4 78.5 1.2 13.4Washington 3,006 NA 33.2 76.2 60.4 6.6 15.3Wyoming 50 NA 66.0 92.0 64.0 6.0 30.0Midwest 52,025 17.3 34.5 75.7 57.6 26.4 8.0as a percent of U.S. 14.5 Illinois 10,758 1.6 32.4 72.6 45.1 27.7 19.7Indiana 3,805 NA 25.8 80.2 57.9 28.9 6.8Iowa 1,420 NA 27.6 93.2 74.7 10.4 7.0Kansas 2,622 53.1 26.1 64.2 61.8 7.5 10.6Michigan 10,752 1.9 33.1 78.7 47.4 40.6 4.3Minnesota 1,651 NA 36.2 83.7 53.4 21.1 7.6Missouri 3,715 26.7 29.0 76.5 74.2 16.8 3.8Nebraska 744 NA 39.8 91.3 72.3 6.7 11.2North Dakota 412 NA 39.3 90.5 86.9 4.9 2.7Ohio 14,258 43.7 42.5 70.5 65.3 25.8 3.1South Dakota 339 NA 21.2 94.1 78.8 2.1 2.7Wisconsin 1,549 NA 36.5 89.2 65.9 13.4 10.8Northeast 68,007 10.0 34.3 65.7 43.0 22.9 21.5as a percent of U.S. 18.9 Connecticut 8,551 0.7 28.6 56.1 39.3 24.0 25.1Maine 960 NA 55.6 83.2 89.9 3.6 1.5Massachusetts 6,516 8.0 33.5 64.0 51.3 15.8 21.0New Hampshire 1,078 NA 24.4 90.8 82.1 8.4 5.0New Jersey 15,372 3.2 28.6 60.7 30.9 26.6 32.0New York 20,807 17.0 40.6 71.0 36.6 23.7 21.8Pennsylvania 12,762 17.0 34.6 66.6 57.9 24.2 9.9Rhode Island 1,878 NA 33.8 68.3 49.8 14.2 17.4Vermont 83 NA 34.9 50.6 97.6 0.0 0.0District of Columbia 516 NA 51.9 64.3 2.5 92.4 1.9
“NA” indicates not applicable. There was no institution of this type in the state during the specificed years.1 This table supplements the other headcount enrollment tables, which include only the
degree-granting institutions eligible for federal Title IV student financial aid. It does so by including the non-degree-granting institutions eligible for Title IV student financial aid. SREB's historical databases from National Center for Education Statistics surveys only counted the degree-granting institutions. Because of the growing importance of non-degree-granting institutions that award career certificates and diplomas, these enrollment data are also reported.
Source: SREB analysis of National Center for Education Statistics fall enrollment surveys — www.nces.ed.gov/ipeds.
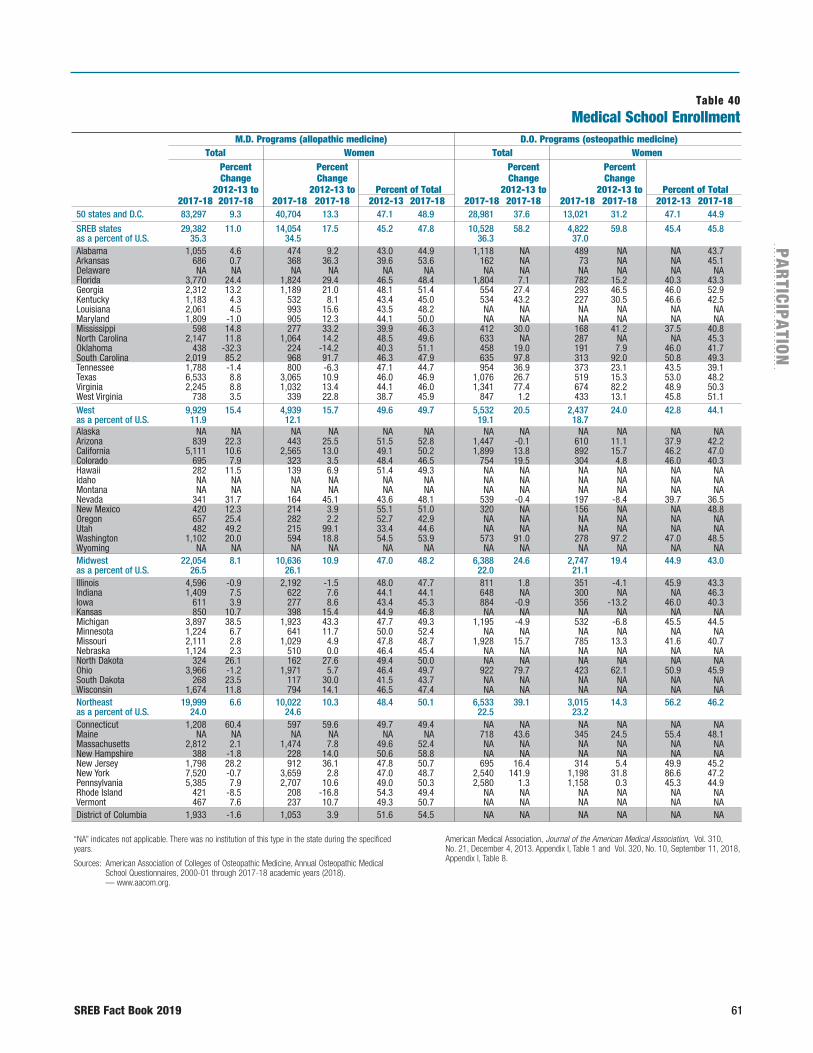
SREB Fact Book 2019 61
PAR
TICIPATIO
N
Table 40Medical School Enrollment
M.D. Programs (allopathic medicine) D.O. Programs (osteopathic medicine) Total Women Total Women Percent Percent Percent Percent Change Change Change Change 2012-13 to 2012-13 to Percent of Total 2012-13 to 2012-13 to Percent of Total 2017-18 2017-18 2017-18 2017-18 2012-13 2017-18 2017-18 2017-18 2017-18 2017-18 2012-13 2017-18
50 states and D.C. 83,297 9.3 40,704 13.3 47.1 48.9 28,981 37.6 13,021 31.2 47.1 44.9
SREB states 29,382 11.0 14,054 17.5 45.2 47.8 10,528 58.2 4,822 59.8 45.4 45.8as a percent of U.S. 35.3 34.5 36.3 37.0 Alabama 1,055 4.6 474 9.2 43.0 44.9 1,118 NA 489 NA NA 43.7Arkansas 686 0.7 368 36.3 39.6 53.6 162 NA 73 NA NA 45.1Delaware NA NA NA NA NA NA NA NA NA NA NA NAFlorida 3,770 24.4 1,824 29.4 46.5 48.4 1,804 7.1 782 15.2 40.3 43.3Georgia 2,312 13.2 1,189 21.0 48.1 51.4 554 27.4 293 46.5 46.0 52.9Kentucky 1,183 4.3 532 8.1 43.4 45.0 534 43.2 227 30.5 46.6 42.5Louisiana 2,061 4.5 993 15.6 43.5 48.2 NA NA NA NA NA NAMaryland 1,809 -1.0 905 12.3 44.1 50.0 NA NA NA NA NA NAMississippi 598 14.8 277 33.2 39.9 46.3 412 30.0 168 41.2 37.5 40.8North Carolina 2,147 11.8 1,064 14.2 48.5 49.6 633 NA 287 NA NA 45.3Oklahoma 438 -32.3 224 -14.2 40.3 51.1 458 19.0 191 7.9 46.0 41.7South Carolina 2,019 85.2 968 91.7 46.3 47.9 635 97.8 313 92.0 50.8 49.3Tennessee 1,788 -1.4 800 -6.3 47.1 44.7 954 36.9 373 23.1 43.5 39.1Texas 6,533 8.8 3,065 10.9 46.0 46.9 1,076 26.7 519 15.3 53.0 48.2Virginia 2,245 8.8 1,032 13.4 44.1 46.0 1,341 77.4 674 82.2 48.9 50.3West Virginia 738 3.5 339 22.8 38.7 45.9 847 1.2 433 13.1 45.8 51.1West 9,929 15.4 4,939 15.7 49.6 49.7 5,532 20.5 2,437 24.0 42.8 44.1as a percent of U.S. 11.9 12.1 19.1 18.7 Alaska NA NA NA NA NA NA NA NA NA NA NA NAArizona 839 22.3 443 25.5 51.5 52.8 1,447 -0.1 610 11.1 37.9 42.2California 5,111 10.6 2,565 13.0 49.1 50.2 1,899 13.8 892 15.7 46.2 47.0Colorado 695 7.9 323 3.5 48.4 46.5 754 19.5 304 4.8 46.0 40.3Hawaii 282 11.5 139 6.9 51.4 49.3 NA NA NA NA NA NAIdaho NA NA NA NA NA NA NA NA NA NA NA NAMontana NA NA NA NA NA NA NA NA NA NA NA NANevada 341 31.7 164 45.1 43.6 48.1 539 -0.4 197 -8.4 39.7 36.5New Mexico 420 12.3 214 3.9 55.1 51.0 320 NA 156 NA NA 48.8Oregon 657 25.4 282 2.2 52.7 42.9 NA NA NA NA NA NAUtah 482 49.2 215 99.1 33.4 44.6 NA NA NA NA NA NAWashington 1,102 20.0 594 18.8 54.5 53.9 573 91.0 278 97.2 47.0 48.5Wyoming NA NA NA NA NA NA NA NA NA NA NA NAMidwest 22,054 8.1 10,636 10.9 47.0 48.2 6,388 24.6 2,747 19.4 44.9 43.0as a percent of U.S. 26.5 26.1 22.0 21.1 Illinois 4,596 -0.9 2,192 -1.5 48.0 47.7 811 1.8 351 -4.1 45.9 43.3Indiana 1,409 7.5 622 7.6 44.1 44.1 648 NA 300 NA NA 46.3Iowa 611 3.9 277 8.6 43.4 45.3 884 -0.9 356 -13.2 46.0 40.3Kansas 850 10.7 398 15.4 44.9 46.8 NA NA NA NA NA NAMichigan 3,897 38.5 1,923 43.3 47.7 49.3 1,195 -4.9 532 -6.8 45.5 44.5Minnesota 1,224 6.7 641 11.7 50.0 52.4 NA NA NA NA NA NAMissouri 2,111 2.8 1,029 4.9 47.8 48.7 1,928 15.7 785 13.3 41.6 40.7Nebraska 1,124 2.3 510 0.0 46.4 45.4 NA NA NA NA NA NANorth Dakota 324 26.1 162 27.6 49.4 50.0 NA NA NA NA NA NAOhio 3,966 -1.2 1,971 5.7 46.4 49.7 922 79.7 423 62.1 50.9 45.9South Dakota 268 23.5 117 30.0 41.5 43.7 NA NA NA NA NA NAWisconsin 1,674 11.8 794 14.1 46.5 47.4 NA NA NA NA NA NANortheast 19,999 6.6 10,022 10.3 48.4 50.1 6,533 39.1 3,015 14.3 56.2 46.2as a percent of U.S. 24.0 24.6 22.5 23.2 Connecticut 1,208 60.4 597 59.6 49.7 49.4 NA NA NA NA NA NAMaine NA NA NA NA NA NA 718 43.6 345 24.5 55.4 48.1Massachusetts 2,812 2.1 1,474 7.8 49.6 52.4 NA NA NA NA NA NANew Hampshire 388 -1.8 228 14.0 50.6 58.8 NA NA NA NA NA NANew Jersey 1,798 28.2 912 36.1 47.8 50.7 695 16.4 314 5.4 49.9 45.2New York 7,520 -0.7 3,659 2.8 47.0 48.7 2,540 141.9 1,198 31.8 86.6 47.2Pennsylvania 5,385 7.9 2,707 10.6 49.0 50.3 2,580 1.3 1,158 0.3 45.3 44.9Rhode Island 421 -8.5 208 -16.8 54.3 49.4 NA NA NA NA NA NAVermont 467 7.6 237 10.7 49.3 50.7 NA NA NA NA NA NADistrict of Columbia 1,933 -1.6 1,053 3.9 51.6 54.5 NA NA NA NA NA NA
“NA” indicates not applicable. There was no institution of this type in the state during the specificed years.
Sources: American Association of Colleges of Osteopathic Medicine, Annual Osteopathic Medical School Questionnaires, 2000-01 through 2017-18 academic years (2018). — www.aacom.org.
American Medical Association, Journal of the American Medical Association, Vol. 310, No. 21, December 4, 2013. Appendix I, Table 1 and Vol. 320, No. 10, September 11, 2018, Appendix I, Table 8.
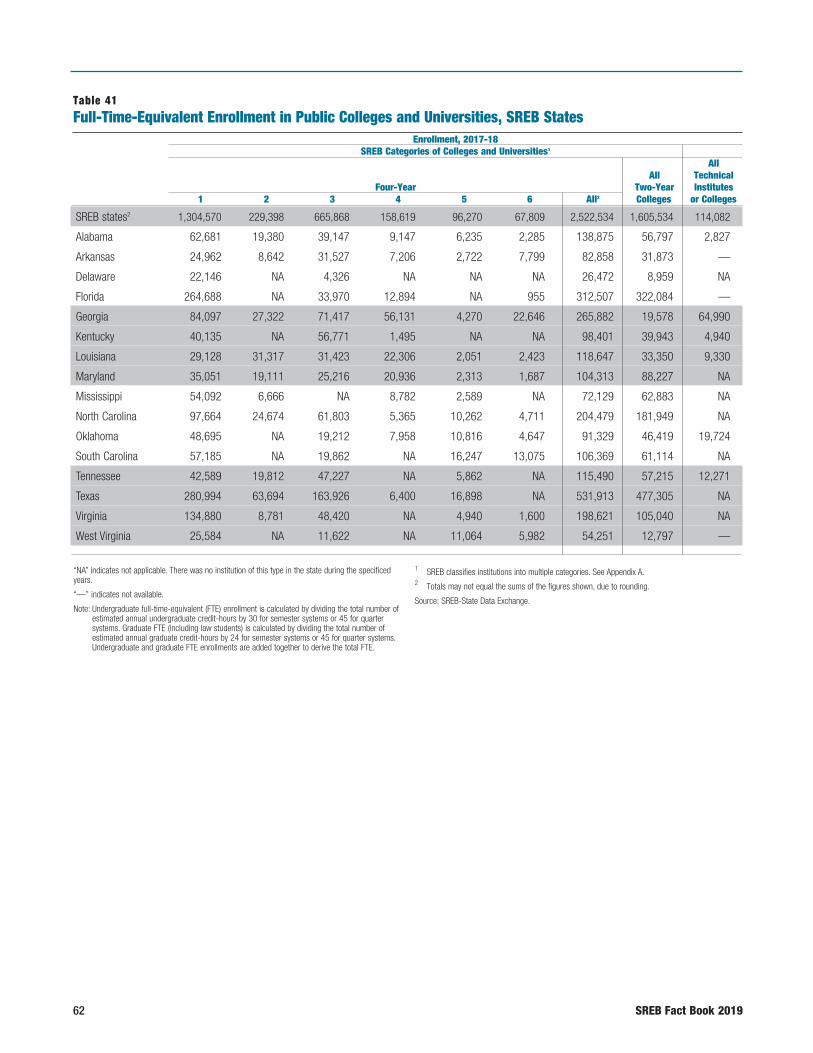
62 SREB Fact Book 2019
“NA” indicates not applicable. There was no institution of this type in the state during the specificed years.
“—” indicates not available.
Note: Undergraduate full-time-equivalent (FTE) enrollment is calculated by dividing the total number of estimated annual undergraduate credit-hours by 30 for semester systems or 45 for quarter systems. Graduate FTE (including law students) is calculated by dividing the total number of estimated annual graduate credit-hours by 24 for semester systems or 45 for quarter systems. Undergraduate and graduate FTE enrollments are added together to derive the total FTE.
1 SREB classifies institutions into multiple categories. See Appendix A.2 Totals may not equal the sums of the figures shown, due to rounding.
Source: SREB-State Data Exchange.
Table 41Full-Time-Equivalent Enrollment in Public Colleges and Universities, SREB States
Enrollment, 2017-18 SREB Categories of Colleges and Universities1
All All Technical Four-Year Two-Year Institutes 1 2 3 4 5 6 All2 Colleges or Colleges
SREB states2 1,304,570 229,398 665,868 158,619 96,270 67,809 2,522,534 1,605,534 114,082
Alabama 62,681 19,380 39,147 9,147 6,235 2,285 138,875 56,797 2,827
Arkansas 24,962 8,642 31,527 7,206 2,722 7,799 82,858 31,873 —
Delaware 22,146 NA 4,326 NA NA NA 26,472 8,959 NA
Florida 264,688 NA 33,970 12,894 NA 955 312,507 322,084 —
Georgia 84,097 27,322 71,417 56,131 4,270 22,646 265,882 19,578 64,990
Kentucky 40,135 NA 56,771 1,495 NA NA 98,401 39,943 4,940
Louisiana 29,128 31,317 31,423 22,306 2,051 2,423 118,647 33,350 9,330
Maryland 35,051 19,111 25,216 20,936 2,313 1,687 104,313 88,227 NA
Mississippi 54,092 6,666 NA 8,782 2,589 NA 72,129 62,883 NA
North Carolina 97,664 24,674 61,803 5,365 10,262 4,711 204,479 181,949 NA
Oklahoma 48,695 NA 19,212 7,958 10,816 4,647 91,329 46,419 19,724
South Carolina 57,185 NA 19,862 NA 16,247 13,075 106,369 61,114 NA
Tennessee 42,589 19,812 47,227 NA 5,862 NA 115,490 57,215 12,271
Texas 280,994 63,694 163,926 6,400 16,898 NA 531,913 477,305 NA
Virginia 134,880 8,781 48,420 NA 4,940 1,600 198,621 105,040 NA
West Virginia 25,584 NA 11,622 NA 11,064 5,982 54,251 12,797 —
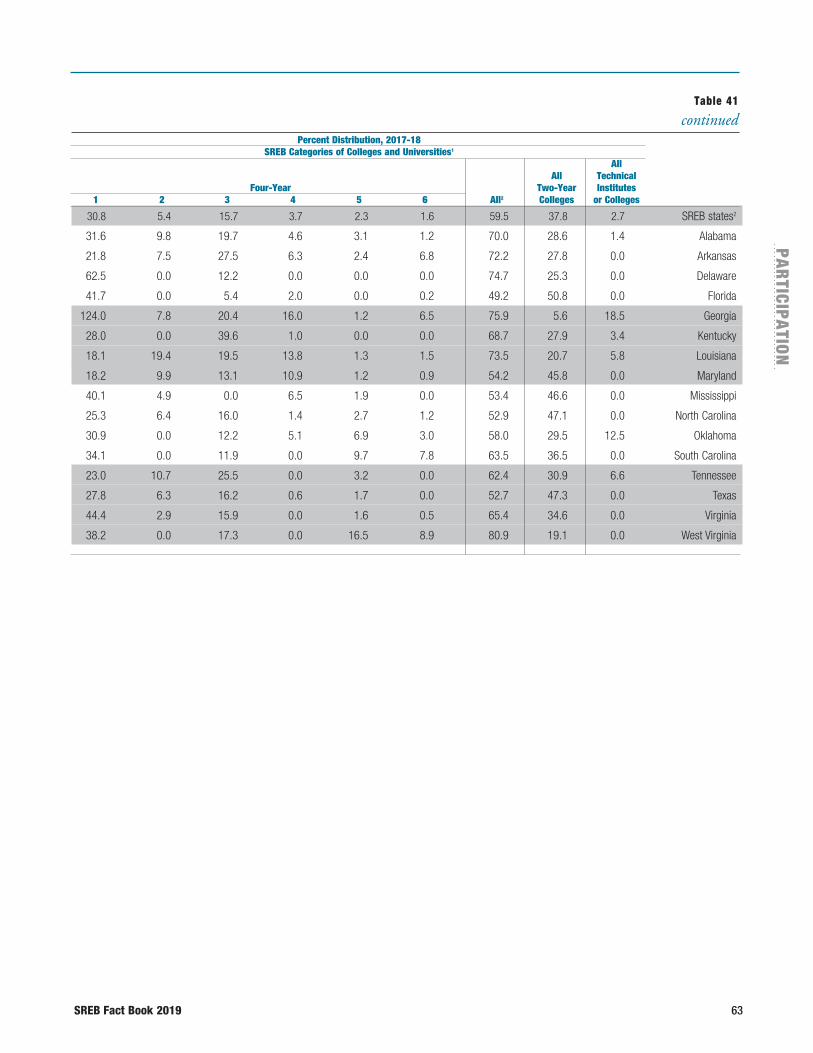
SREB Fact Book 2019 63
PAR
TICIPATIO
N
30.8 5.4 15.7 3.7 2.3 1.6 59.5 37.8 2.7 SREB states2
31.6 9.8 19.7 4.6 3.1 1.2 70.0 28.6 1.4 Alabama
21.8 7.5 27.5 6.3 2.4 6.8 72.2 27.8 0.0 Arkansas
62.5 0.0 12.2 0.0 0.0 0.0 74.7 25.3 0.0 Delaware
41.7 0.0 5.4 2.0 0.0 0.2 49.2 50.8 0.0 Florida
124.0 7.8 20.4 16.0 1.2 6.5 75.9 5.6 18.5 Georgia
28.0 0.0 39.6 1.0 0.0 0.0 68.7 27.9 3.4 Kentucky
18.1 19.4 19.5 13.8 1.3 1.5 73.5 20.7 5.8 Louisiana
18.2 9.9 13.1 10.9 1.2 0.9 54.2 45.8 0.0 Maryland
40.1 4.9 0.0 6.5 1.9 0.0 53.4 46.6 0.0 Mississippi
25.3 6.4 16.0 1.4 2.7 1.2 52.9 47.1 0.0 North Carolina
30.9 0.0 12.2 5.1 6.9 3.0 58.0 29.5 12.5 Oklahoma
34.1 0.0 11.9 0.0 9.7 7.8 63.5 36.5 0.0 South Carolina
23.0 10.7 25.5 0.0 3.2 0.0 62.4 30.9 6.6 Tennessee
27.8 6.3 16.2 0.6 1.7 0.0 52.7 47.3 0.0 Texas
44.4 2.9 15.9 0.0 1.6 0.5 65.4 34.6 0.0 Virginia
38.2 0.0 17.3 0.0 16.5 8.9 80.9 19.1 0.0 West Virginia
Table 41
continued Percent Distribution, 2017-18 SREB Categories of Colleges and Universities1
All All Technical Four-Year Two-Year Institutes 1 2 3 4 5 6 All2 Colleges or Colleges

64 SREB Fact Book 2019
“NA” indicates not applicable. There was no institution of this type in the state during the specificed years.
“—” indicates data not yet available for one or both of the years.
Source: SREB-State Data Exchange.
Table 42Percent of Undergraduate Credit-/Contact-Hours Taken by High School Students, SREB States, 2017-18
Percent, 2017-18 Percentage-Point Change, 2013-14 to 2017-18 Four-Year Technical Four-Year Technical Colleges and Two-Year Institutes or Colleges and Two-Year Institutes or Universities Colleges Colleges Universities Colleges Colleges
Alabama 0.5 5.6 4.1 0.2 2.7 0.5
Arkansas 3.6 12.7 — 1.3 5.2 —
Delaware — — NA — — NA
Florida 0.8 3.5 — 0.0 0.5 —
Georgia 2.0 7.0 12.2 1.2 5.0 8.8
Kentucky 3.4 9.1 10.6 1.7 4.2 6.2
Louisiana 4.1 5.9 11.0 1.6 0.8 2.7
Maryland — — NA — — NA
Mississippi — 4.8 NA — 3.2 NA
North Carolina 0.4 12.9 NA 0.2 7.5 NA
Oklahoma 1.1 6.6 — 0.3 0.9 —
South Carolina 0.3 7.1 NA 0.1 3.8 NA
Tennessee 1.0 7.8 — 0.5 2.1 —
Texas 0.8 6.2 NA 0.4 -2.2 NA
Virginia 0.4 20.0 NA -0.4 3.6 NA
West Virginia 2.6 6.4 — 1.6 2.8 —
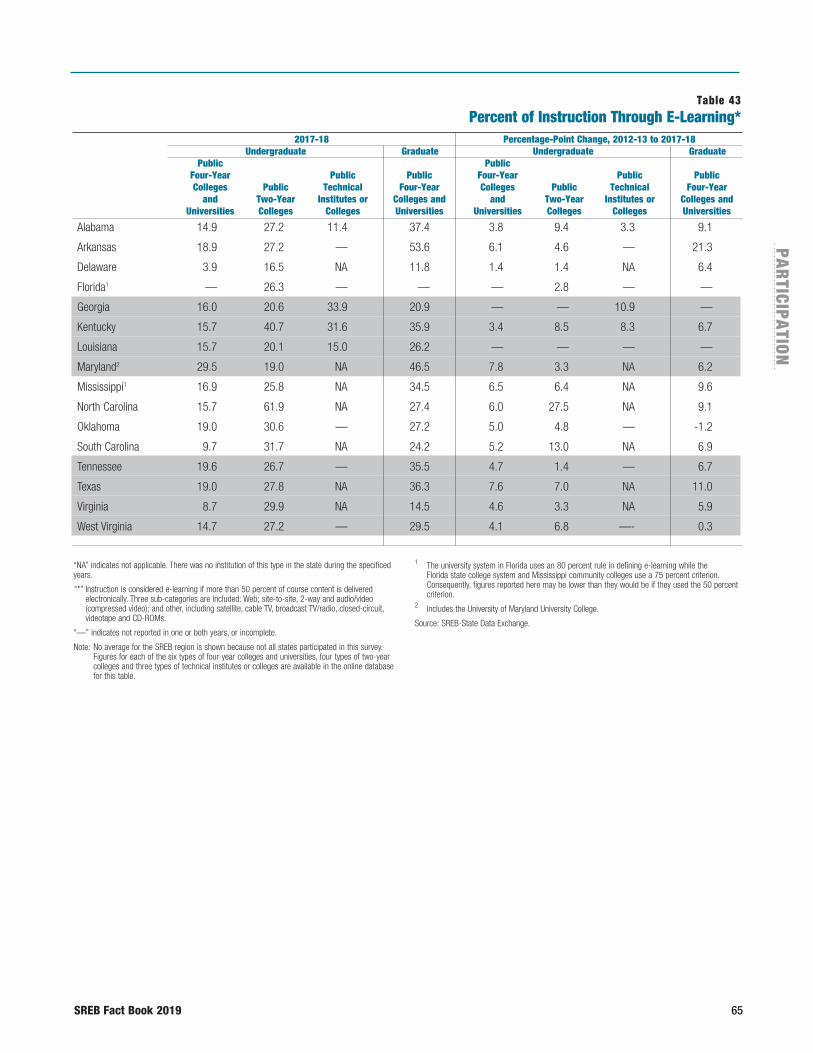
SREB Fact Book 2019 65
PAR
TICIPATIO
N
2017-18 Percentage-Point Change, 2012-13 to 2017-18 Undergraduate Graduate Undergraduate Graduate Public Public Four-Year Public Public Four-Year Public Public Colleges Public Technical Four-Year Colleges Public Technical Four-Year and Two-Year Institutes or Colleges and and Two-Year Institutes or Colleges and Universities Colleges Colleges Universities Universities Colleges Colleges Universities
Table 43Percent of Instruction Through E-Learning*
Alabama 14.9 27.2 11.4 37.4 3.8 9.4 3.3 9.1
Arkansas 18.9 27.2 — 53.6 6.1 4.6 — 21.3
Delaware 3.9 16.5 NA 11.8 1.4 1.4 NA 6.4
Florida1 — 26.3 — — — 2.8 — —
Georgia 16.0 20.6 33.9 20.9 — — 10.9 —
Kentucky 15.7 40.7 31.6 35.9 3.4 8.5 8.3 6.7
Louisiana 15.7 20.1 15.0 26.2 — — — —
Maryland2 29.5 19.0 NA 46.5 7.8 3.3 NA 6.2
Mississippi1 16.9 25.8 NA 34.5 6.5 6.4 NA 9.6
North Carolina 15.7 61.9 NA 27.4 6.0 27.5 NA 9.1
Oklahoma 19.0 30.6 — 27.2 5.0 4.8 — -1.2
South Carolina 9.7 31.7 NA 24.2 5.2 13.0 NA 6.9
Tennessee 19.6 26.7 — 35.5 4.7 1.4 — 6.7
Texas 19.0 27.8 NA 36.3 7.6 7.0 NA 11.0
Virginia 8.7 29.9 NA 14.5 4.6 3.3 NA 5.9
West Virginia 14.7 27.2 — 29.5 4.1 6.8 —- 0.3
“NA” indicates not applicable. There was no institution of this type in the state during the specificed years.
“*” Instruction is considered e-learning if more than 50 percent of course content is delivered electronically. Three sub-categories are included: Web; site-to-site, 2-way and audio/video (compressed video); and other, including satellite, cable TV, broadcast TV/radio, closed-circuit, videotape and CD-ROMs.
“—” indicates not reported in one or both years, or incomplete.
Note: No average for the SREB region is shown because not all states participated in this survey. Figures for each of the six types of four-year colleges and universities, four types of two-year colleges and three types of technical institutes or colleges are available in the online database for this table.
1 The university system in Florida uses an 80 percent rule in defining e-learning while the Florida state college system and Mississippi community colleges use a 75 percent criterion. Consequently, figures reported here may be lower than they would be if they used the 50 percent criterion.
2 Includes the University of Maryland University College.
Source: SREB-State Data Exchange.

Copies of the Fact Book on Higher Education are available from the SREB publications office. SREB continuously monitors new comparative data and makes them available on the SREB website: www.sreb.org. The website also features an online edition of the Fact Book with links to the latest updates of the tables and individual Featured Facts reports for each of the 16 SREB states.
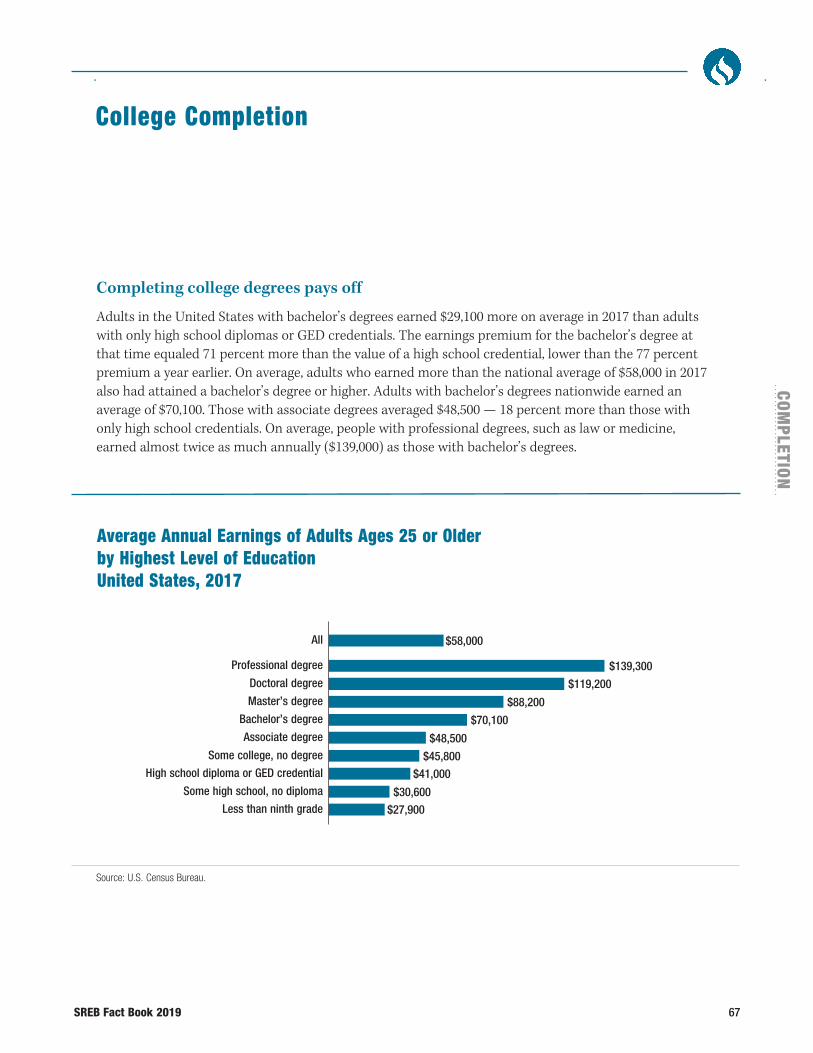
SREB Fact Book 2019 67
COM
PLETION
Completing college degrees pays off
Adults in the United States with bachelor’s degrees earned $29,100 more on average in 2017 than adults with only high school diplomas or GED credentials. The earnings premium for the bachelor’s degree at that time equaled 71 percent more than the value of a high school credential, lower than the 77 percent premium a year earlier. On average, adults who earned more than the national average of $58,000 in 2017 also had attained a bachelor’s degree or higher. Adults with bachelor’s degrees nationwide earned an average of $70,100. Those with associate degrees averaged $48,500 — 18 percent more than those with only high school credentials. On average, people with professional degrees, such as law or medicine, earned almost twice as much annually ($139,000) as those with bachelor’s degrees.
College Completion
Average Annual Earnings of Adults Ages 25 or Older by Highest Level of Education United States, 2017
Source: U.S. Census Bureau.
Professional degree
Doctoral degree
Master’s degree
Bachelor’s degree
Associate degree
Some college, no degree
High school diploma or GED credential
Some high school, no diploma
Less than ninth grade
$139,300
All $58,000
$119,200
$88,200
$70,100
$48,500
$45,800
$41,000
$30,600
$27,900
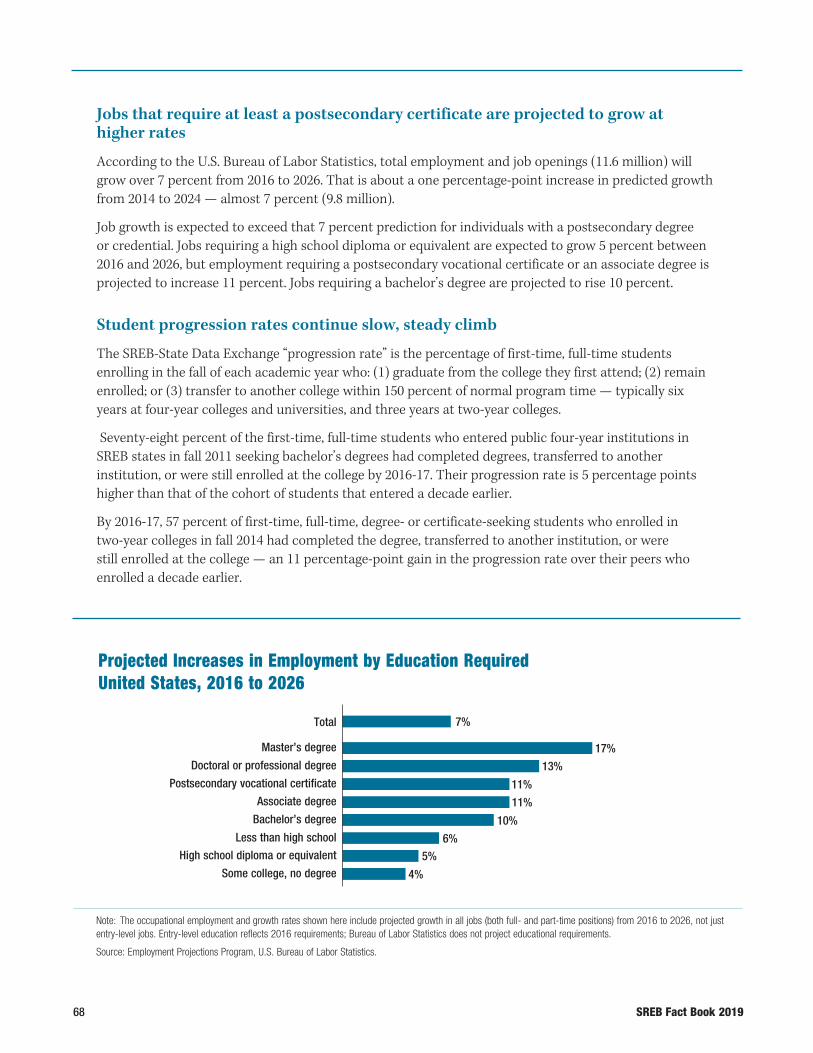
68 SREB Fact Book 2019
Jobs that require at least a postsecondary certificate are projected to grow at higher rates
According to the U.S. Bureau of Labor Statistics, total employment and job openings (11.6 million) will grow over 7 percent from 2016 to 2026. That is about a one percentage-point increase in predicted growth from 2014 to 2024 — almost 7 percent (9.8 million).
Job growth is expected to exceed that 7 percent prediction for individuals with a postsecondary degree or credential. Jobs requiring a high school diploma or equivalent are expected to grow 5 percent between 2016 and 2026, but employment requiring a postsecondary vocational certificate or an associate degree is projected to increase 11 percent. Jobs requiring a bachelor’s degree are projected to rise 10 percent.
Student progression rates continue slow, steady climb
The SREB-State Data Exchange “progression rate” is the percentage of first-time, full-time students enrolling in the fall of each academic year who: (1) graduate from the college they first attend; (2) remain enrolled; or (3) transfer to another college within 150 percent of normal program time — typically six years at four-year colleges and universities, and three years at two-year colleges.
Seventy-eight percent of the first-time, full-time students who entered public four-year institutions in SREB states in fall 2011 seeking bachelor’s degrees had completed degrees, transferred to another institution, or were still enrolled at the college by 2016-17. Their progression rate is 5 percentage points higher than that of the cohort of students that entered a decade earlier.
By 2016-17, 57 percent of first-time, full-time, degree- or certificate-seeking students who enrolled in two-year colleges in fall 2014 had completed the degree, transferred to another institution, or were still enrolled at the college — an 11 percentage-point gain in the progression rate over their peers who enrolled a decade earlier.
Projected Increases in Employment by Education RequiredUnited States, 2016 to 2026
Note: The occupational employment and growth rates shown here include projected growth in all jobs (both full- and part-time positions) from 2016 to 2026, not just entry-level jobs. Entry-level education reflects 2016 requirements; Bureau of Labor Statistics does not project educational requirements.
Source: Employment Projections Program, U.S. Bureau of Labor Statistics.
Master’s degree
Doctoral or professional degree
Postsecondary vocational certificate
Associate degree
Bachelor’s degree
Less than high school
High school diploma or equivalent
Some college, no degree
17%
Total 7%
13%
11%
11%
10%
6%
5%
4%

SREB Fact Book 2019 69
COM
PLETION
Graduation rates in SREB region rising, but still lower than national rate
In the SREB region, 57 percent of students who enrolled in public four-year colleges and universities in fall 2011 had graduated by 2016-17 — below the national rate of 60 percent yet an increase of 2 percentage points from the fall 2007 cohort graduation rate. The highest rate for the students who enrolled in 2011 was in the Northeast at 64 percent, followed by 62 percent in the West and 60 percent in the Midwest.
At public two-year colleges in the SREB region, 22 percent of students in the fall 2014 cohort of first-time, full-time, degree-seeking students graduated by 2016-17. The national average was higher, at 25 percent. The other regions had similar or higher graduation rates, the highest, at 29 percent, in the West, followed by 27 percent in the Midwest and 22 percent in the Northeast.
Graduation rates continue to differ by race and ethnicity
In 2016-17, Asian students completed bachelor’s degrees within six years at public four-year colleges and universities at higher rates than other groups, both nationwide and in the SREB region. Their 70 percent graduation rate in SREB states was 2 percentage points lower than the 72 percent rate for their national
* The progression rates for public four-year colleges and universities are the percentages of first-time, full-time students who completed a bachelor’s degree, remained enrolled or transferred within six years. The progression rates for public two-year colleges are the percentages of first-time, full-time students who completed a degree or certificate, remained enrolled or transferred within three years.
Source: SREB-State Data Exchange.
Trends in Student Progression Rates*SREB States
2007 2009 2011 2013 2015 2017
Public Two-Year Colleges
Public Four-Year Colleges and Universities
2007 2009 2011 2013 2015 2017
73% 75% 75% 75% 76% 77%
75% 76% 77% 78% 76%
46% 48%
50% 51%
53% 51% 50%
51% 52% 54%
57%
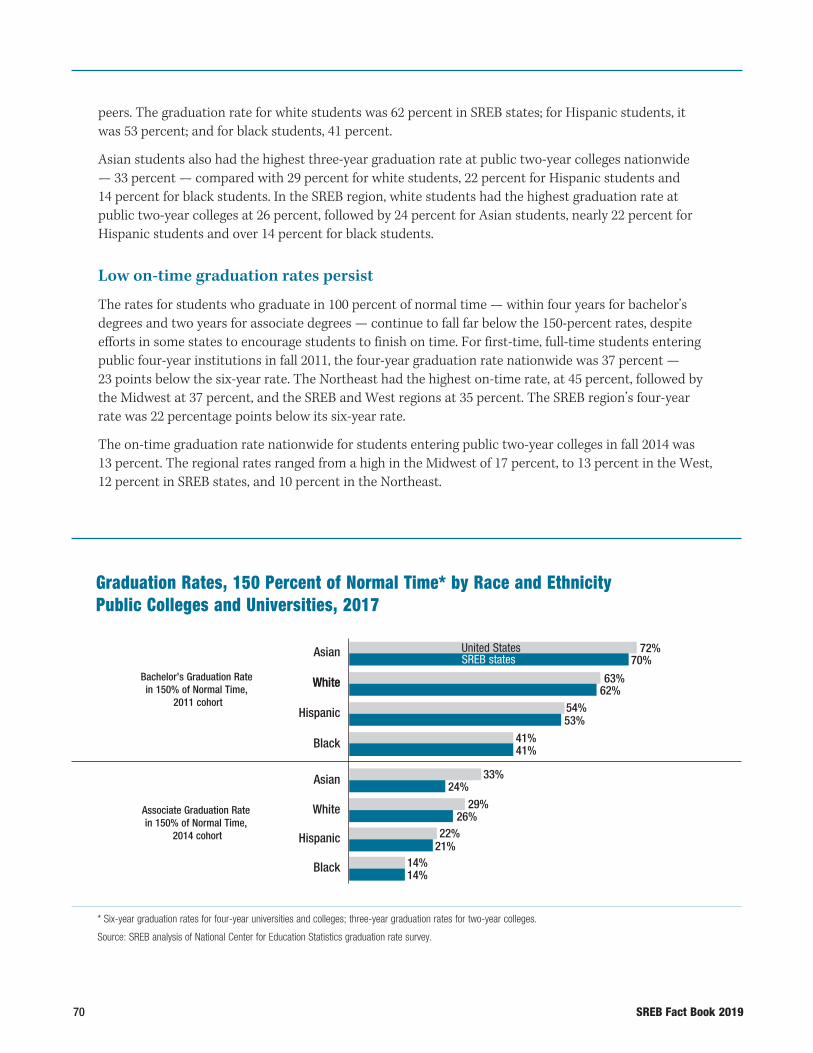
70 SREB Fact Book 2019
peers. The graduation rate for white students was 62 percent in SREB states; for Hispanic students, it was 53 percent; and for black students, 41 percent.
Asian students also had the highest three-year graduation rate at public two-year colleges nationwide — 33 percent — compared with 29 percent for white students, 22 percent for Hispanic students and 14 percent for black students. In the SREB region, white students had the highest graduation rate at public two-year colleges at 26 percent, followed by 24 percent for Asian students, nearly 22 percent for Hispanic students and over 14 percent for black students.
Low on-time graduation rates persist
The rates for students who graduate in 100 percent of normal time — within four years for bachelor’s degrees and two years for associate degrees — continue to fall far below the 150-percent rates, despite efforts in some states to encourage students to finish on time. For first-time, full-time students entering public four-year institutions in fall 2011, the four-year graduation rate nationwide was 37 percent — 23 points below the six-year rate. The Northeast had the highest on-time rate, at 45 percent, followed by the Midwest at 37 percent, and the SREB and West regions at 35 percent. The SREB region’s four-year rate was 22 percentage points below its six-year rate.
The on-time graduation rate nationwide for students entering public two-year colleges in fall 2014 was 13 percent. The regional rates ranged from a high in the Midwest of 17 percent, to 13 percent in the West, 12 percent in SREB states, and 10 percent in the Northeast.
Graduation Rates, 150 Percent of Normal Time* by Race and EthnicityPublic Colleges and Universities, 2017
41%41%
33%24%
29%26%
22%21%
14%14%
63%62%
54%53%
White
Hispanic
Black
Asian
White
72%70%
United StatesSREB states
Asian
White
Hispanic
Black
Bachelor’s Graduation Rate in 150% of Normal Time,
2011 cohort
Associate Graduation Rate in 150% of Normal Time,
2014 cohort
* Six-year graduation rates for four-year universities and colleges; three-year graduation rates for two-year colleges.
Source: SREB analysis of National Center for Education Statistics graduation rate survey.
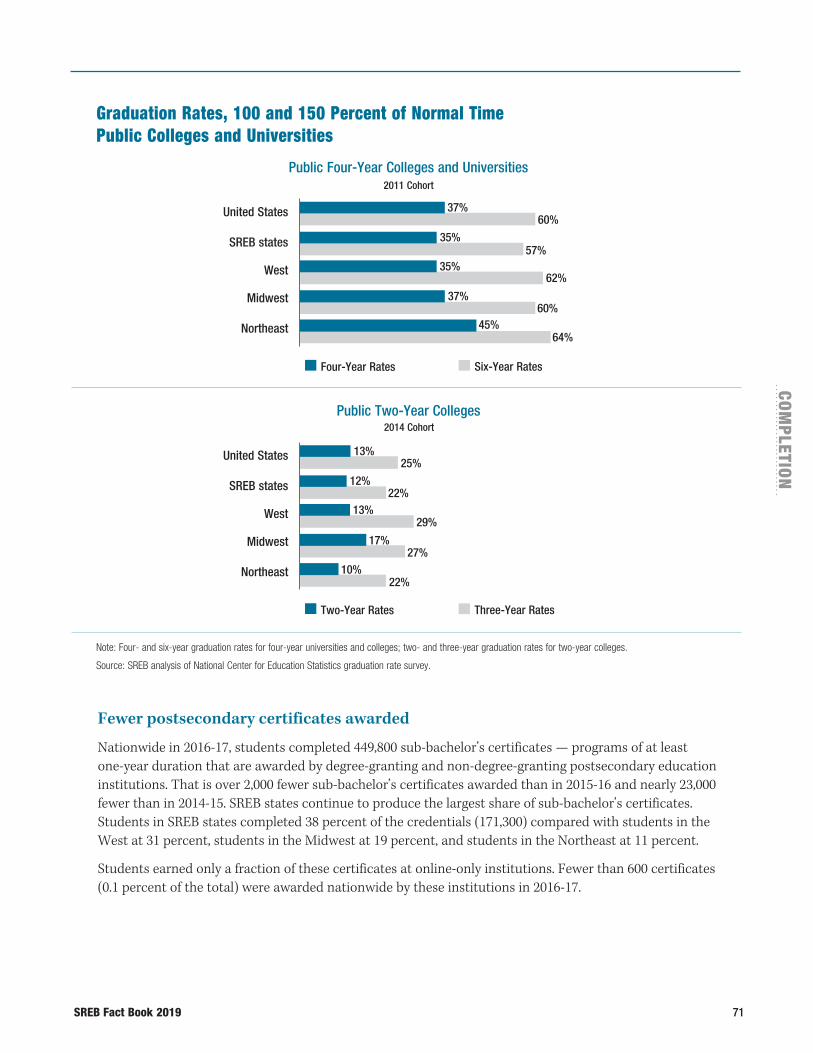
SREB Fact Book 2019 71
COM
PLETION
Fewer postsecondary certificates awarded
Nationwide in 2016-17, students completed 449,800 sub-bachelor’s certificates — programs of at least one-year duration that are awarded by degree-granting and non-degree-granting postsecondary education institutions. That is over 2,000 fewer sub-bachelor’s certificates awarded than in 2015-16 and nearly 23,000 fewer than in 2014-15. SREB states continue to produce the largest share of sub-bachelor’s certificates. Students in SREB states completed 38 percent of the credentials (171,300) compared with students in the West at 31 percent, students in the Midwest at 19 percent, and students in the Northeast at 11 percent.
Students earned only a fraction of these certificates at online-only institutions. Fewer than 600 certificates (0.1 percent of the total) were awarded nationwide by these institutions in 2016-17.
Graduation Rates, 100 and 150 Percent of Normal Time Public Colleges and Universities
Note: Four- and six-year graduation rates for four-year universities and colleges; two- and three-year graduation rates for two-year colleges.
Source: SREB analysis of National Center for Education Statistics graduation rate survey.
Public Two-Year Colleges2014 Cohort
2011 Cohort
Public Four-Year Colleges and Universities
Two-Year Rates Three-Year Rates
Four-Year Rates Six-Year Rates
35%57%
35%62%
37%60%
45%64%
37%60%
United States
SREB states
West
Midwest
Northeast
12%22%
13%29%
17%27%
10%22%
13%25%
United States
SREB states
West
Midwest
Northeast
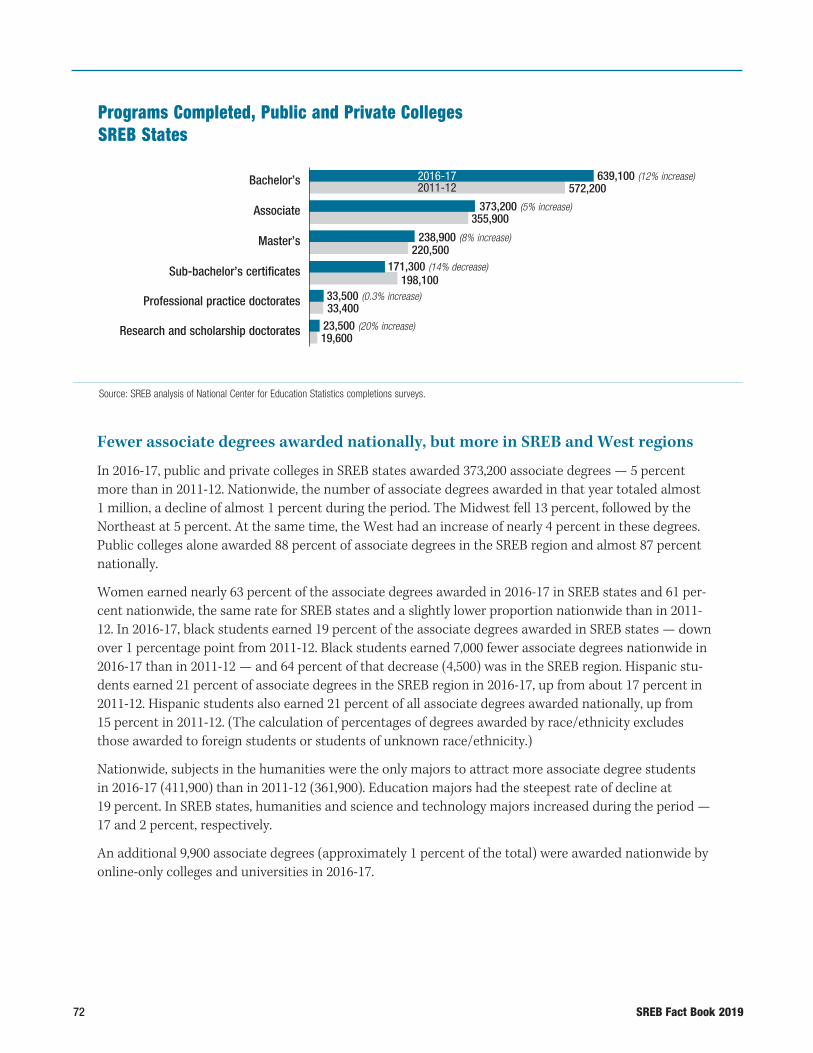
72 SREB Fact Book 2019
Fewer associate degrees awarded nationally, but more in SREB and West regions
In 2016-17, public and private colleges in SREB states awarded 373,200 associate degrees — 5 percent more than in 2011-12. Nationwide, the number of associate degrees awarded in that year totaled almost 1 million, a decline of almost 1 percent during the period. The Midwest fell 13 percent, followed by the Northeast at 5 percent. At the same time, the West had an increase of nearly 4 percent in these degrees. Public colleges alone awarded 88 percent of associate degrees in the SREB region and almost 87 percent nationally.
Women earned nearly 63 percent of the associate degrees awarded in 2016-17 in SREB states and 61 per-cent nationwide, the same rate for SREB states and a slightly lower proportion nationwide than in 2011-12. In 2016-17, black students earned 19 percent of the associate degrees awarded in SREB states — down over 1 percentage point from 2011-12. Black students earned 7,000 fewer associate degrees nationwide in 2016-17 than in 2011-12 — and 64 percent of that decrease (4,500) was in the SREB region. Hispanic stu-dents earned 21 percent of associate degrees in the SREB region in 2016-17, up from about 17 percent in 2011-12. Hispanic students also earned 21 percent of all associate degrees awarded nationally, up from 15 percent in 2011-12. (The calculation of percentages of degrees awarded by race/ethnicity excludes those awarded to foreign students or students of unknown race/ethnicity.)
Nationwide, subjects in the humanities were the only majors to attract more associate degree students in 2016-17 (411,900) than in 2011-12 (361,900). Education majors had the steepest rate of decline at 19 percent. In SREB states, humanities and science and technology majors increased during the period — 17 and 2 percent, respectively.
An additional 9,900 associate degrees (approximately 1 percent of the total) were awarded nationwide by online-only colleges and universities in 2016-17.
Programs Completed, Public and Private Colleges SREB States
Source: SREB analysis of National Center for Education Statistics completions surveys.
238,900 (8% increase)220,500
33,500 (0.3% increase)33,400
23,500 (20% increase)19,600
373,200 (5% increase)355,900
Associate
Master’s
Sub-bachelor’s certificates
Professional practice doctorates
639,100 (12% increase)572,200
2016-172011-12
Bachelor’s
Research and scholarship doctorates
171,300 (14% decrease)198,100
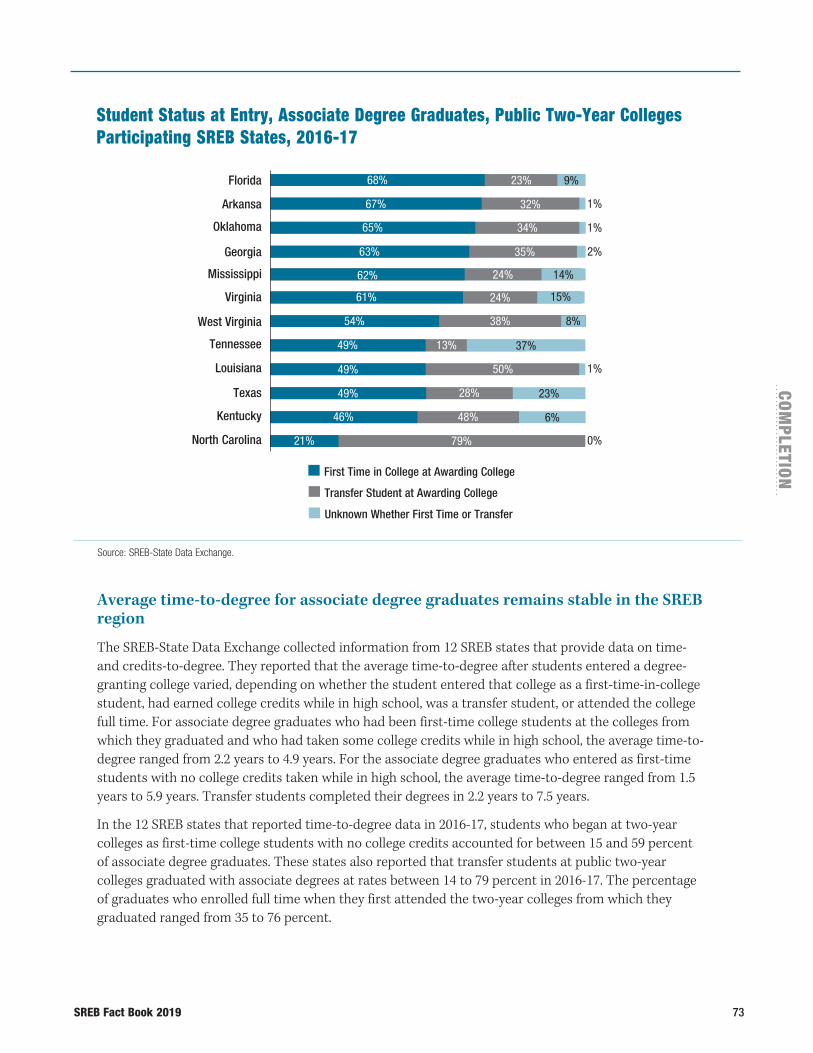
SREB Fact Book 2019 73
COM
PLETION
Student Status at Entry, Associate Degree Graduates, Public Two-Year CollegesParticipating SREB States, 2016-17
Source: SREB-State Data Exchange.
Average time-to-degree for associate degree graduates remains stable in the SREB region
The SREB-State Data Exchange collected information from 12 SREB states that provide data on time- and credits-to-degree. They reported that the average time-to-degree after students entered a degree- granting college varied, depending on whether the student entered that college as a first-time-in-college student, had earned college credits while in high school, was a transfer student, or attended the college full time. For associate degree graduates who had been first-time college students at the colleges from which they graduated and who had taken some college credits while in high school, the average time-to-degree ranged from 2.2 years to 4.9 years. For the associate degree graduates who entered as first-time students with no college credits taken while in high school, the average time-to-degree ranged from 1.5 years to 5.9 years. Transfer students completed their degrees in 2.2 years to 7.5 years.
In the 12 SREB states that reported time-to-degree data in 2016-17, students who began at two-year colleges as first-time college students with no college credits accounted for between 15 and 59 percent of associate degree graduates. These states also reported that transfer students at public two-year colleges graduated with associate degrees at rates between 14 to 79 percent in 2016-17. The percentage of graduates who enrolled full time when they first attended the two-year colleges from which they graduated ranged from 35 to 76 percent.
67% 32%
66% 34%
46% 48%
21% 79%
Florida
Arkansa
49% 50%Louisiana
Texas
Kentucky
North Carolina
49% 28%
13%Tennessee 49%
57% 42%Virginia 61% 24%
59% 36%5%West Virginia 54% 38%
61% 38%Georgia 63% 35%
63% 32%Oklahoma 65% 34%
63% 36%Mississippi 62% 24%
67% 32%
68% 23% 9%
1%
14%
15%
8%
37%
23%
6%
First Time in College at Awarding College
Transfer Student at Awarding College
Unknown Whether First Time or Transfer
1%
2%
1%
0%

74 SREB Fact Book 2019
Number of bachelor’s degrees awarded grows, but not in all fields
Public and private colleges and universities awarded over 1.9 million bachelor’s degrees in 2016-17 in the United States — an 8 percent increase from 2011-12. More than 639,000 bachelor’s degrees were awarded in the SREB region, almost a 12 percent increase in the same five-year span. SREB states accounted for the nation’s largest proportion of bachelor’s degrees awarded in 2016-17, at over 33 percent. The Midwest accounted for the next largest share, at 23 percent; the West for 22 percent; and the Northeast for 21 percent.
Public colleges and universities awarded a higher percentage of bachelor’s degrees in the SREB region than in any other region in 2016-17, at 76 percent. In the West, 71 percent of bachelor’s degrees were awarded by public colleges and universities; in the Midwest, 64 percent; and in the Northeast, 49 percent.
Women continued to comprise a majority of bachelor’s degree completions: in 2016-17, women earned 58 percent of the bachelor’s degrees in SREB states and 57 percent in the nation. These percentages remained unchanged from five years earlier.
Black students earned over 16 percent of the bachelor’s degrees awarded in the SREB region in 2016-17 — down nearly one percent since 2011-12. Despite this decrease, the number of bachelor’s degrees awarded to black students increased by 7,700 between 2011-12 and 2016-17. In 2016-17, historically and predominantly black colleges awarded 30 percent of the bachelor’s degrees earned by black students in the SREB region —
Source: SREB-State Data Exchange.
Bachelor’s Degree Graduates from Public Four-Year Colleges and UniversitiesParticipating SREB States, 2016-17
87% 13%
67% 33%
54% 26%
46% 42%
56% 43%
63% 36%
66% 25%
West Virginia
Virginia
Louisiana
Arkansas
North Carolina
Oklahoma
Tennessee
Georgia
Texas
Kentucky
Mississippi 50% 45%
67% 32%
66% 34%
63% 36%
61% 38%
60% 38%
55% 27%
55% 45%
41% 54%
60% 36%
68% 29%
First Time in College at Awarding College
Transfer Student at Awarding College
Unknown Whether First Time or Transfer
3%
0%
1%
1%
1%
18%
5%
6%
6%
1%
0%
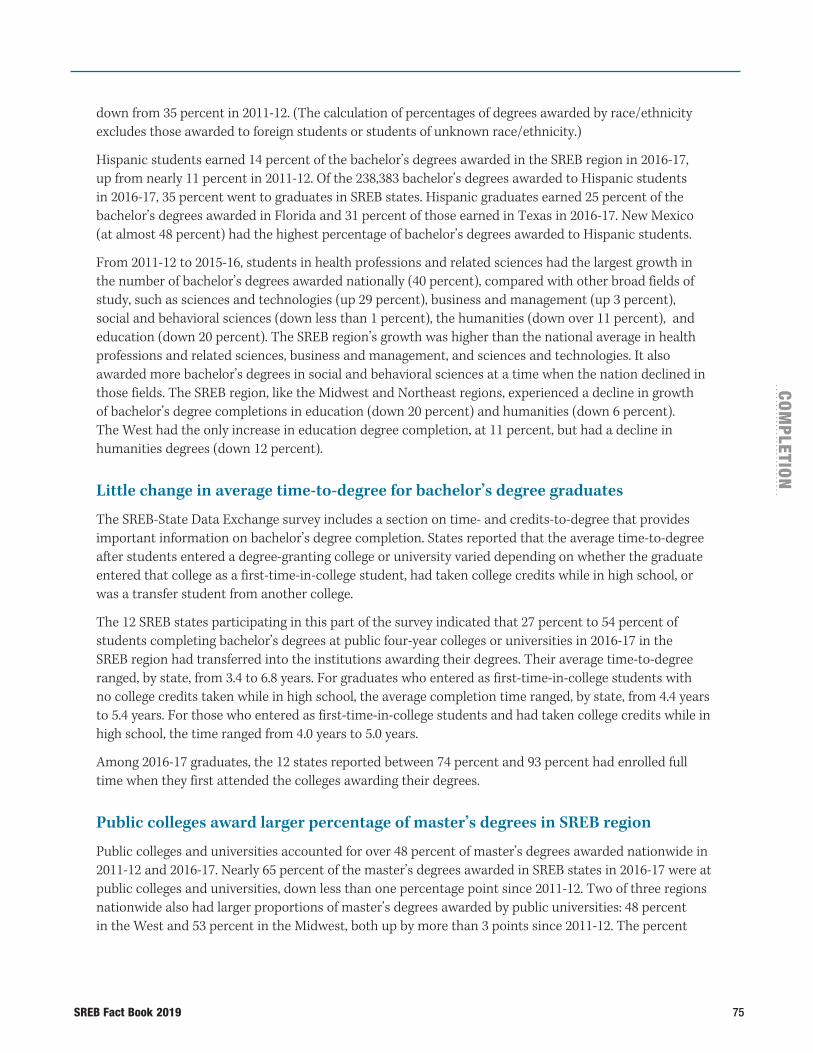
SREB Fact Book 2019 75
COM
PLETION
down from 35 percent in 2011-12. (The calculation of percentages of degrees awarded by race/ethnicity excludes those awarded to foreign students or students of unknown race/ethnicity.)
Hispanic students earned 14 percent of the bachelor’s degrees awarded in the SREB region in 2016-17, up from nearly 11 percent in 2011-12. Of the 238,383 bachelor’s degrees awarded to Hispanic students in 2016-17, 35 percent went to graduates in SREB states. Hispanic graduates earned 25 percent of the bachelor’s degrees awarded in Florida and 31 percent of those earned in Texas in 2016-17. New Mexico (at almost 48 percent) had the highest percentage of bachelor’s degrees awarded to Hispanic students.
From 2011-12 to 2015-16, students in health professions and related sciences had the largest growth in the number of bachelor’s degrees awarded nationally (40 percent), compared with other broad fields of study, such as sciences and technologies (up 29 percent), business and management (up 3 percent), social and behavioral sciences (down less than 1 percent), the humanities (down over 11 percent), and education (down 20 percent). The SREB region’s growth was higher than the national average in health professions and related sciences, business and management, and sciences and technologies. It also awarded more bachelor’s degrees in social and behavioral sciences at a time when the nation declined in those fields. The SREB region, like the Midwest and Northeast regions, experienced a decline in growth of bachelor’s degree completions in education (down 20 percent) and humanities (down 6 percent). The West had the only increase in education degree completion, at 11 percent, but had a decline in humanities degrees (down 12 percent).
Little change in average time-to-degree for bachelor’s degree graduates
The SREB-State Data Exchange survey includes a section on time- and credits-to-degree that provides important information on bachelor’s degree completion. States reported that the average time-to-degree after students entered a degree-granting college or university varied depending on whether the graduate entered that college as a first-time-in-college student, had taken college credits while in high school, or was a transfer student from another college.
The 12 SREB states participating in this part of the survey indicated that 27 percent to 54 percent of students completing bachelor’s degrees at public four-year colleges or universities in 2016-17 in the SREB region had transferred into the institutions awarding their degrees. Their average time-to-degree ranged, by state, from 3.4 to 6.8 years. For graduates who entered as first-time-in-college students with no college credits taken while in high school, the average completion time ranged, by state, from 4.4 years to 5.4 years. For those who entered as first-time-in-college students and had taken college credits while in high school, the time ranged from 4.0 years to 5.0 years.
Among 2016-17 graduates, the 12 states reported between 74 percent and 93 percent had enrolled full time when they first attended the colleges awarding their degrees.
Public colleges award larger percentage of master’s degrees in SREB region
Public colleges and universities accounted for over 48 percent of master’s degrees awarded nationwide in 2011-12 and 2016-17. Nearly 65 percent of the master’s degrees awarded in SREB states in 2016-17 were at public colleges and universities, down less than one percentage point since 2011-12. Two of three regions nationwide also had larger proportions of master’s degrees awarded by public universities: 48 percent in the West and 53 percent in the Midwest, both up by more than 3 points since 2011-12. The percent
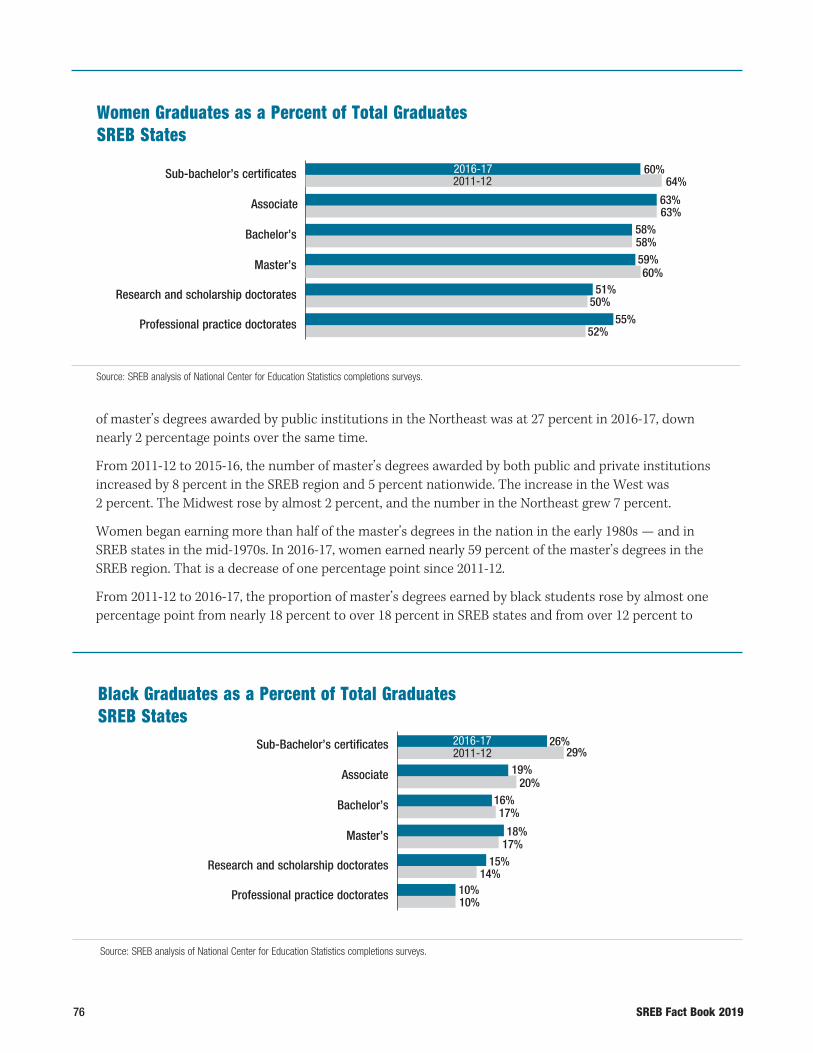
76 SREB Fact Book 2019
of master’s degrees awarded by public institutions in the Northeast was at 27 percent in 2016-17, down nearly 2 percentage points over the same time.
From 2011-12 to 2015-16, the number of master’s degrees awarded by both public and private institutions increased by 8 percent in the SREB region and 5 percent nationwide. The increase in the West was 2 percent. The Midwest rose by almost 2 percent, and the number in the Northeast grew 7 percent.
Women began earning more than half of the master’s degrees in the nation in the early 1980s — and in SREB states in the mid-1970s. In 2016-17, women earned nearly 59 percent of the master’s degrees in the SREB region. That is a decrease of one percentage point since 2011-12.
From 2011-12 to 2016-17, the proportion of master’s degrees earned by black students rose by almost one percentage point from nearly 18 percent to over 18 percent in SREB states and from over 12 percent to
Women Graduates as a Percent of Total GraduatesSREB States
Source: SREB analysis of National Center for Education Statistics completions surveys.
58%58%59%
51%50%
55%52%
63% 63%
Associate
Bachelor’s
Master’s
Research and scholarship doctorates
Sub-bachelor’s certificates
Professional practice doctorates
60% 64%
2016-172011-12
60%
Black Graduates as a Percent of Total Graduates SREB States
Source: SREB analysis of National Center for Education Statistics completions surveys.
16%17%
18% 17%
15%14%
10%10%
19% 20%
Associate
Bachelor’s
Master’s
Research and scholarship doctorates
Sub-Bachelor’s certificates
Professional practice doctorates
26% 29%
2016-172011-12
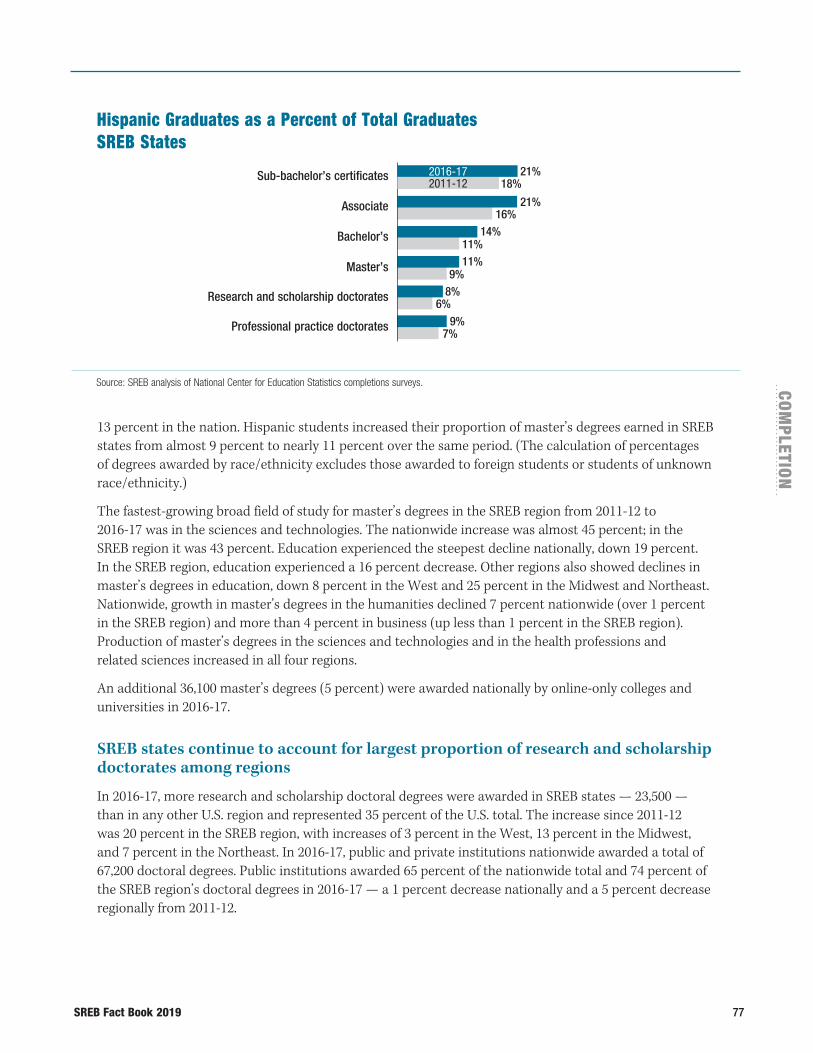
SREB Fact Book 2019 77
COM
PLETION
Hispanic Graduates as a Percent of Total Graduates SREB States
Source: SREB analysis of National Center for Education Statistics completions surveys.
14%11%11%
9%8%
6%9%
7%
21% 16%
Associate
Bachelor’s
Master’s
Research and scholarship doctorates
Sub-bachelor’s certificates
Professional practice doctorates
21% 18%
2016-172011-12
13 percent in the nation. Hispanic students increased their proportion of master’s degrees earned in SREB states from almost 9 percent to nearly 11 percent over the same period. (The calculation of percentages of degrees awarded by race/ethnicity excludes those awarded to foreign students or students of unknown race/ethnicity.)
The fastest-growing broad field of study for master’s degrees in the SREB region from 2011-12 to 2016-17 was in the sciences and technologies. The nationwide increase was almost 45 percent; in the SREB region it was 43 percent. Education experienced the steepest decline nationally, down 19 percent. In the SREB region, education experienced a 16 percent decrease. Other regions also showed declines in master’s degrees in education, down 8 percent in the West and 25 percent in the Midwest and Northeast. Nationwide, growth in master’s degrees in the humanities declined 7 percent nationwide (over 1 percent in the SREB region) and more than 4 percent in business (up less than 1 percent in the SREB region). Production of master’s degrees in the sciences and technologies and in the health professions and related sciences increased in all four regions.
An additional 36,100 master’s degrees (5 percent) were awarded nationally by online-only colleges and universities in 2016-17.
SREB states continue to account for largest proportion of research and scholarship doctorates among regions
In 2016-17, more research and scholarship doctoral degrees were awarded in SREB states — 23,500 — than in any other U.S. region and represented 35 percent of the U.S. total. The increase since 2011-12 was 20 percent in the SREB region, with increases of 3 percent in the West, 13 percent in the Midwest, and 7 percent in the Northeast. In 2016-17, public and private institutions nationwide awarded a total of 67,200 doctoral degrees. Public institutions awarded 65 percent of the nationwide total and 74 percent of the SREB region’s doctoral degrees in 2016-17 — a 1 percent decrease nationally and a 5 percent decrease regionally from 2011-12.
78 SREB Fact Book 2019
In 2006-07, for the first time, women earned at least half of the academic doctorates awarded nationwide. Ten years later, in 2016-17, women accounted for just over 49 percent nationwide: 51 percent in SREB states, 49 percent in the West and Northeast, and 47 percent in the Midwest.
Black students earned 10 percent of all research and scholarship doctorates nationwide in 2016-17 and 15 percent in the SREB region, a regional increase of almost 2 percentage points since 2011-12. In 2016-17, Hispanic students earned 8 percent of these degrees awarded in both the nation and the SREB region — up nearly 2 percentage points from 2011-12. Nationwide, 28 percent of the doctorates awarded in 2016-17 went to students from foreign countries: almost 27 percent in the SREB region, 23 percent in the West, and nearly 32 percent in the Midwest and Northeast. (The calculation of percentages of degrees awarded by race/ ethnicity excludes those awarded to foreign students or students of unknown race/ethnicity.)
Research and scholarship doctorates increased at faster rates in health professions and related sciences than in other fields from 2011-12 to 2016-17 — up 28 percent nationwide. Rates in health professions and related sciences were up nearly 49 percent in the SREB region, higher than in any of the other regions. Growth rates in sciences and technologies were 15 percent in SREB states and almost 12 percent nationally. In education, the number of doctoral degrees awarded increased over 25 percent in SREB states and more than 21 percent nationally. Growth rates in the social and behavioral sciences were almost 12 percent in SREB states and 5 percent nationally. In business and management, the number of doctoral degrees awarded increased over 35 percent in SREB states; nationwide it rose 14 percent. Growth rates in the humanities rose nearly 13 percent in SREB states and declined 2 percent nationally with bigger decreases in other regions.
Nationwide, an additional 3,700 research and scholarship doctorates (more than 5 percent of the total) were awarded by online-only colleges and universities in 2016-17.
Women still account for more than half of professional practice doctorates
Women earned at least half of the professional practice doctoral degrees in fields such as medicine, dentistry and law for the first time in 2006-07. By 2016-17, women earned 55 percent of these degrees nationally, and in all regions except the West, where they earned 56 percent.
Black students earned 7 percent of professional practice doctoral degrees in the nation and 10 percent in the SREB region in 2016-7. In nine states in the SREB region, black students earned 10 percent or more of these degrees — Alabama, Florida, Georgia, Louisiana, Maryland, Mississippi, North Carolina, Tennessee and Virginia. Hispanic graduates accounted for 8 percent of those earning professional practice doctorates in the nation and almost 10 percent in the SREB region. New Mexico, notably at nearly 40 percent; Florida at more than 21 percent; Texas at 17 percent; and California and Colorado at 13 percent led the nation in the percentage of these doctorates completed by Hispanic students.
Osteopathic medicine was the fastest-growing professional practice doctoral field in the nation. Osteopathic medicine degrees increased by 39 percent nationwide and by nearly 77 percent in the SREB region between 2011-12 and 2016-17. Nationwide, the number of pharmacy degrees awarded in 2016-17 was more than 14 percent greater than in 2011-12 — and over 17 percent greater in SREB states. The number of law degrees awarded from 2011-12 to 2016-17 decreased nationwide and across all regions. Nationwide, more than 34,800 law degrees were awarded in 2016-17, down nearly 25 percent since 2011-12. In the SREB region, the number of law degrees awarded also decreased 25 percent. That is less than the decrease in the Northeast (down 26 percent) and Midwest (down 30 percent), but greater than the West’s 20 percent decrease.
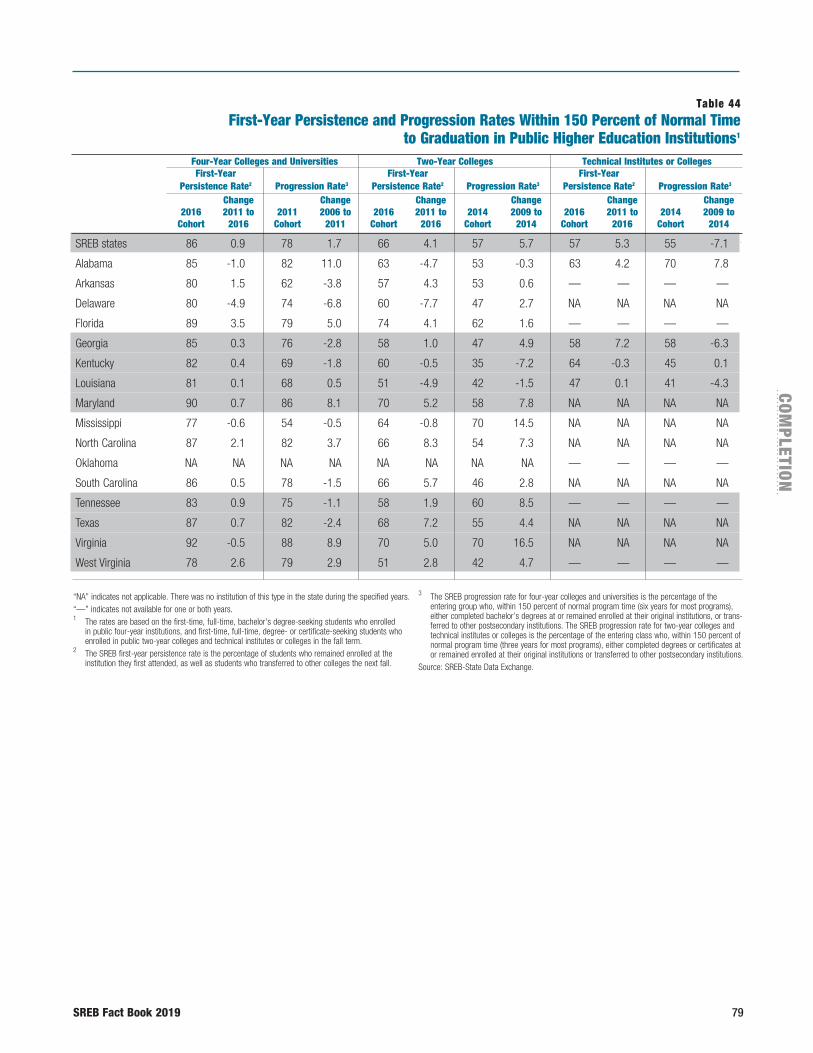
SREB Fact Book 2019 79
COM
PLETION
“NA” indicates not applicable. There was no institution of this type in the state during the specified years.“—” indicates not available for one or both years. 1 The rates are based on the first-time, full-time, bachelor’s degree-seeking students who enrolled
in public four-year institutions, and first-time, full-time, degree- or certificate-seeking students who enrolled in public two-year colleges and technical institutes or colleges in the fall term.
2 The SREB first-year persistence rate is the percentage of students who remained enrolled at the institution they first attended, as well as students who transferred to other colleges the next fall.
3 The SREB progression rate for four-year colleges and universities is the percentage of the entering group who, within 150 percent of normal program time (six years for most programs), either completed bachelor’s degrees at or remained enrolled at their original institutions, or trans-ferred to other postsecondary institutions. The SREB progression rate for two-year colleges and technical institutes or colleges is the percentage of the entering class who, within 150 percent of normal program time (three years for most programs), either completed degrees or certificates at or remained enrolled at their original institutions or transferred to other postsecondary institutions.
Source: SREB-State Data Exchange.
Four-Year Colleges and Universities Two-Year Colleges Technical Institutes or Colleges First-Year First-Year First-Year Persistence Rate2 Progression Rate3 Persistence Rate2 Progression Rate3 Persistence Rate2 Progression Rate3
Change Change Change Change Change Change 2016 2011 to 2011 2006 to 2016 2011 to 2014 2009 to 2016 2011 to 2014 2009 to Cohort 2016 Cohort 2011 Cohort 2016 Cohort 2014 Cohort 2016 Cohort 2014
Table 44First-Year Persistence and Progression Rates Within 150 Percent of Normal Time
to Graduation in Public Higher Education Institutions1
SREB states 86 0.9 78 1.7 66 4.1 57 5.7 57 5.3 55 -7.1
Alabama 85 -1.0 82 11.0 63 -4.7 53 -0.3 63 4.2 70 7.8
Arkansas 80 1.5 62 -3.8 57 4.3 53 0.6 — — — —
Delaware 80 -4.9 74 -6.8 60 -7.7 47 2.7 NA NA NA NA
Florida 89 3.5 79 5.0 74 4.1 62 1.6 — — — —
Georgia 85 0.3 76 -2.8 58 1.0 47 4.9 58 7.2 58 -6.3
Kentucky 82 0.4 69 -1.8 60 -0.5 35 -7.2 64 -0.3 45 0.1
Louisiana 81 0.1 68 0.5 51 -4.9 42 -1.5 47 0.1 41 -4.3
Maryland 90 0.7 86 8.1 70 5.2 58 7.8 NA NA NA NA
Mississippi 77 -0.6 54 -0.5 64 -0.8 70 14.5 NA NA NA NA
North Carolina 87 2.1 82 3.7 66 8.3 54 7.3 NA NA NA NA
Oklahoma NA NA NA NA NA NA NA NA — — — —
South Carolina 86 0.5 78 -1.5 66 5.7 46 2.8 NA NA NA NA
Tennessee 83 0.9 75 -1.1 58 1.9 60 8.5 — — — —
Texas 87 0.7 82 -2.4 68 7.2 55 4.4 NA NA NA NA
Virginia 92 -0.5 88 8.9 70 5.0 70 16.5 NA NA NA NA
West Virginia 78 2.6 79 2.9 51 2.8 42 4.7 — — — —
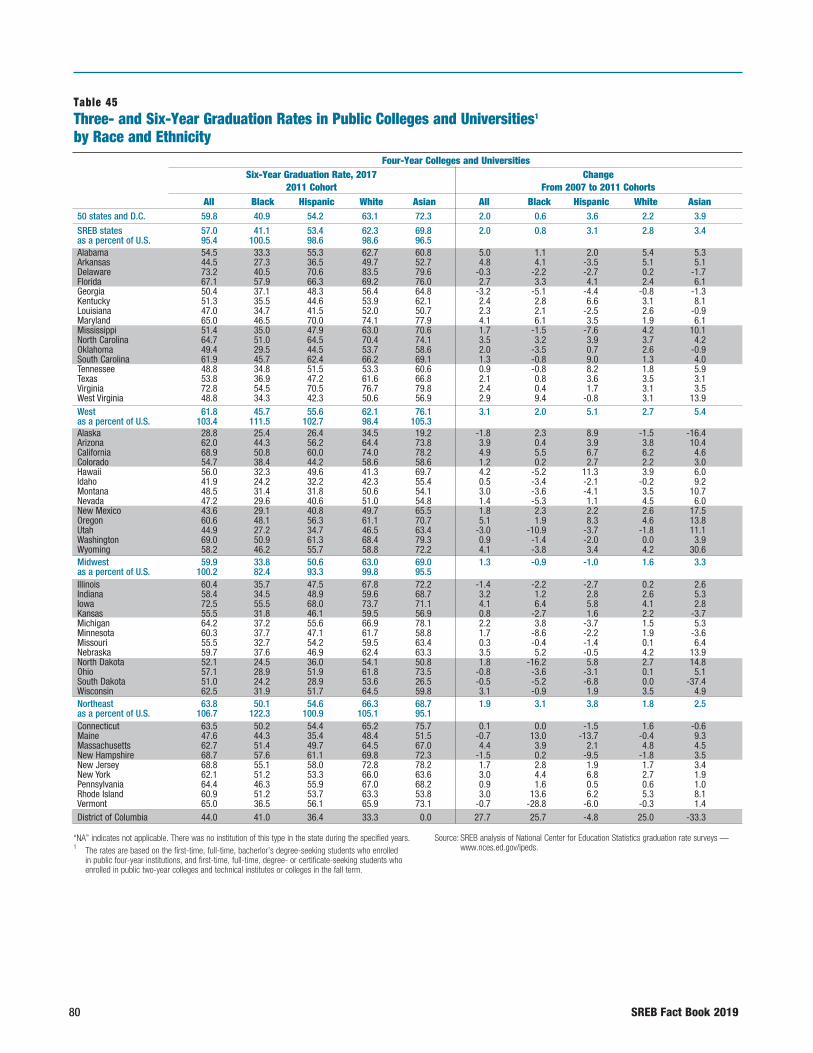
80 SREB Fact Book 2019
“NA” indicates not applicable. There was no institution of this type in the state during the specified years.1 The rates are based on the first-time, full-time, bacherlor’s degree-seeking students who enrolled
in public four-year institutions, and first-time, full-time, degree- or certificate-seeking students who enrolled in public two-year colleges and technical institutes or colleges in the fall term.
Source: SREB analysis of National Center for Education Statistics graduation rate surveys — www.nces.ed.gov/ipeds.
Table 45Three- and Six-Year Graduation Rates in Public Colleges and Universities1 by Race and Ethnicity
Six-Year Graduation Rate, 2017 Change 2011 Cohort From 2007 to 2011 Cohorts All Black Hispanic White Asian All Black Hispanic White Asian
50 states and D.C. 59.8 40.9 54.2 63.1 72.3 2.0 0.6 3.6 2.2 3.9
SREB states 57.0 41.1 53.4 62.3 69.8 2.0 0.8 3.1 2.8 3.4as a percent of U.S. 95.4 100.5 98.6 98.6 96.5 Alabama 54.5 33.3 55.3 62.7 60.8 5.0 1.1 2.0 5.4 5.3Arkansas 44.5 27.3 36.5 49.7 52.7 4.8 4.1 -3.5 5.1 5.1Delaware 73.2 40.5 70.6 83.5 79.6 -0.3 -2.2 -2.7 0.2 -1.7Florida 67.1 57.9 66.3 69.2 76.0 2.7 3.3 4.1 2.4 6.1Georgia 50.4 37.1 48.3 56.4 64.8 -3.2 -5.1 -4.4 -0.8 -1.3Kentucky 51.3 35.5 44.6 53.9 62.1 2.4 2.8 6.6 3.1 8.1Louisiana 47.0 34.7 41.5 52.0 50.7 2.3 2.1 -2.5 2.6 -0.9Maryland 65.0 46.5 70.0 74.1 77.9 4.1 6.1 3.5 1.9 6.1Mississippi 51.4 35.0 47.9 63.0 70.6 1.7 -1.5 -7.6 4.2 10.1North Carolina 64.7 51.0 64.5 70.4 74.1 3.5 3.2 3.9 3.7 4.2Oklahoma 49.4 29.5 44.5 53.7 58.6 2.0 -3.5 0.7 2.6 -0.9South Carolina 61.9 45.7 62.4 66.2 69.1 1.3 -0.8 9.0 1.3 4.0Tennessee 48.8 34.8 51.5 53.3 60.6 0.9 -0.8 8.2 1.8 5.9Texas 53.8 36.9 47.2 61.6 66.8 2.1 0.8 3.6 3.5 3.1Virginia 72.8 54.5 70.5 76.7 79.8 2.4 0.4 1.7 3.1 3.5West Virginia 48.8 34.3 42.3 50.6 56.9 2.9 9.4 -0.8 3.1 13.9West 61.8 45.7 55.6 62.1 76.1 3.1 2.0 5.1 2.7 5.4as a percent of U.S. 103.4 111.5 102.7 98.4 105.3 Alaska 28.8 25.4 26.4 34.5 19.2 -1.8 2.3 8.9 -1.5 -16.4Arizona 62.0 44.3 56.2 64.4 73.8 3.9 0.4 3.9 3.8 10.4California 68.9 50.8 60.0 74.0 78.2 4.9 5.5 6.7 6.2 4.6Colorado 54.7 38.4 44.2 58.6 58.6 1.2 0.2 2.7 2.2 3.0Hawaii 56.0 32.3 49.6 41.3 69.7 4.2 -5.2 11.3 3.9 6.0Idaho 41.9 24.2 32.2 42.3 55.4 0.5 -3.4 -2.1 -0.2 9.2Montana 48.5 31.4 31.8 50.6 54.1 3.0 -3.6 -4.1 3.5 10.7Nevada 47.2 29.6 40.6 51.0 54.8 1.4 -5.3 1.1 4.5 6.0New Mexico 43.6 29.1 40.8 49.7 65.5 1.8 2.3 2.2 2.6 17.5Oregon 60.6 48.1 56.3 61.1 70.7 5.1 1.9 8.3 4.6 13.8Utah 44.9 27.2 34.7 46.5 63.4 -3.0 -10.9 -3.7 -1.8 11.1Washington 69.0 50.9 61.3 68.4 79.3 0.9 -1.4 -2.0 0.0 3.9Wyoming 58.2 46.2 55.7 58.8 72.2 4.1 -3.8 3.4 4.2 30.6Midwest 59.9 33.8 50.6 63.0 69.0 1.3 -0.9 -1.0 1.6 3.3as a percent of U.S. 100.2 82.4 93.3 99.8 95.5 Illinois 60.4 35.7 47.5 67.8 72.2 -1.4 -2.2 -2.7 0.2 2.6Indiana 58.4 34.5 48.9 59.6 68.7 3.2 1.2 2.8 2.6 5.3Iowa 72.5 55.5 68.0 73.7 71.1 4.1 6.4 5.8 4.1 2.8Kansas 55.5 31.8 46.1 59.5 56.9 0.8 -2.7 1.6 2.2 -3.7Michigan 64.2 37.2 55.6 66.9 78.1 2.2 3.8 -3.7 1.5 5.3Minnesota 60.3 37.7 47.1 61.7 58.8 1.7 -8.6 -2.2 1.9 -3.6Missouri 55.5 32.7 54.2 59.5 63.4 0.3 -0.4 -1.4 0.1 6.4Nebraska 59.7 37.6 46.9 62.4 63.3 3.5 5.2 -0.5 4.2 13.9North Dakota 52.1 24.5 36.0 54.1 50.8 1.8 -16.2 5.8 2.7 14.8Ohio 57.1 28.9 51.9 61.8 73.5 -0.8 -3.6 -3.1 0.1 5.1South Dakota 51.0 24.2 28.9 53.6 26.5 -0.5 -5.2 -6.8 0.0 -37.4Wisconsin 62.5 31.9 51.7 64.5 59.8 3.1 -0.9 1.9 3.5 4.9Northeast 63.8 50.1 54.6 66.3 68.7 1.9 3.1 3.8 1.8 2.5as a percent of U.S. 106.7 122.3 100.9 105.1 95.1 Connecticut 63.5 50.2 54.4 65.2 75.7 0.1 0.0 -1.5 1.6 -0.6Maine 47.6 44.3 35.4 48.4 51.5 -0.7 13.0 -13.7 -0.4 9.3Massachusetts 62.7 51.4 49.7 64.5 67.0 4.4 3.9 2.1 4.8 4.5New Hampshire 68.7 57.6 61.1 69.8 72.3 -1.5 0.2 -9.5 -1.8 3.5New Jersey 68.8 55.1 58.0 72.8 78.2 1.7 2.8 1.9 1.7 3.4New York 62.1 51.2 53.3 66.0 63.6 3.0 4.4 6.8 2.7 1.9Pennsylvania 64.4 46.3 55.9 67.0 68.2 0.9 1.6 0.5 0.6 1.0Rhode Island 60.9 51.2 53.7 63.3 53.8 3.0 13.6 6.2 5.3 8.1Vermont 65.0 36.5 56.1 65.9 73.1 -0.7 -28.8 -6.0 -0.3 1.4District of Columbia 44.0 41.0 36.4 33.3 0.0 27.7 25.7 -4.8 25.0 -33.3
Four-Year Colleges and Universities
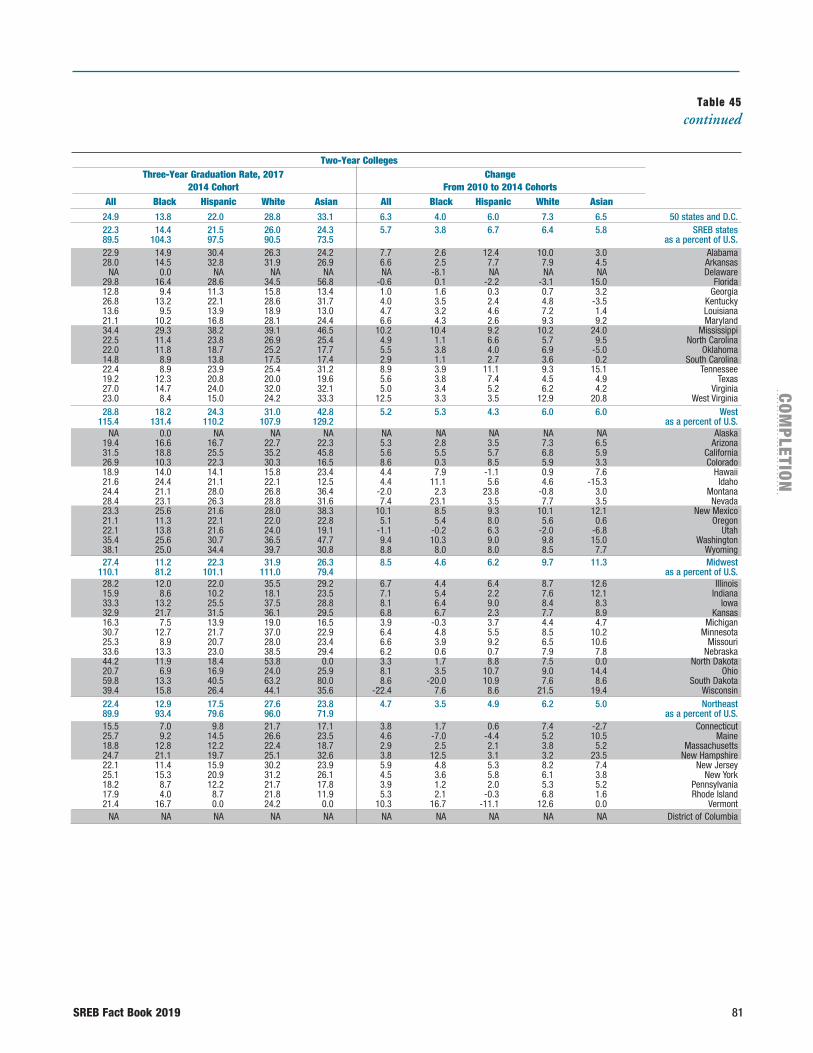
SREB Fact Book 2019 81
COM
PLETION
Table 45continued
Three-Year Graduation Rate, 2017 Change 2014 Cohort From 2010 to 2014 Cohorts All Black Hispanic White Asian All Black Hispanic White Asian
Two-Year Colleges
24.9 13.8 22.0 28.8 33.1 6.3 4.0 6.0 7.3 6.5 50 states and D.C. 22.3 14.4 21.5 26.0 24.3 5.7 3.8 6.7 6.4 5.8 SREB states 89.5 104.3 97.5 90.5 73.5 as a percent of U.S. 22.9 14.9 30.4 26.3 24.2 7.7 2.6 12.4 10.0 3.0 Alabama 28.0 14.5 32.8 31.9 26.9 6.6 2.5 7.7 7.9 4.5 Arkansas NA 0.0 NA NA NA NA -8.1 NA NA NA Delaware 29.8 16.4 28.6 34.5 56.8 -0.6 0.1 -2.2 -3.1 15.0 Florida 12.8 9.4 11.3 15.8 13.4 1.0 1.6 0.3 0.7 3.2 Georgia 26.8 13.2 22.1 28.6 31.7 4.0 3.5 2.4 4.8 -3.5 Kentucky 13.6 9.5 13.9 18.9 13.0 4.7 3.2 4.6 7.2 1.4 Louisiana 21.1 10.2 16.8 28.1 24.4 6.6 4.3 2.6 9.3 9.2 Maryland 34.4 29.3 38.2 39.1 46.5 10.2 10.4 9.2 10.2 24.0 Mississippi 22.5 11.4 23.8 26.9 25.4 4.9 1.1 6.6 5.7 9.5 North Carolina 22.0 11.8 18.7 25.2 17.7 5.5 3.8 4.0 6.9 -5.0 Oklahoma 14.8 8.9 13.8 17.5 17.4 2.9 1.1 2.7 3.6 0.2 South Carolina 22.4 8.9 23.9 25.4 31.2 8.9 3.9 11.1 9.3 15.1 Tennessee 19.2 12.3 20.8 20.0 19.6 5.6 3.8 7.4 4.5 4.9 Texas 27.0 14.7 24.0 32.0 32.1 5.0 3.4 5.2 6.2 4.2 Virginia 23.0 8.4 15.0 24.2 33.3 12.5 3.3 3.5 12.9 20.8 West Virginia 28.8 18.2 24.3 31.0 42.8 5.2 5.3 4.3 6.0 6.0 West 115.4 131.4 110.2 107.9 129.2 as a percent of U.S. NA 0.0 NA NA NA NA NA NA NA NA Alaska 19.4 16.6 16.7 22.7 22.3 5.3 2.8 3.5 7.3 6.5 Arizona 31.5 18.8 25.5 35.2 45.8 5.6 5.5 5.7 6.8 5.9 California 26.9 10.3 22.3 30.3 16.5 8.6 0.3 8.5 5.9 3.3 Colorado 18.9 14.0 14.1 15.8 23.4 4.4 7.9 -1.1 0.9 7.6 Hawaii 21.6 24.4 21.1 22.1 12.5 4.4 11.1 5.6 4.6 -15.3 Idaho 24.4 21.1 28.0 26.8 36.4 -2.0 2.3 23.8 -0.8 3.0 Montana 28.4 23.1 26.3 28.8 31.6 7.4 23.1 3.5 7.7 3.5 Nevada 23.3 25.6 21.6 28.0 38.3 10.1 8.5 9.3 10.1 12.1 New Mexico 21.1 11.3 22.1 22.0 22.8 5.1 5.4 8.0 5.6 0.6 Oregon 22.1 13.8 21.6 24.0 19.1 -1.1 -0.2 6.3 -2.0 -6.8 Utah 35.4 25.6 30.7 36.5 47.7 9.4 10.3 9.0 9.8 15.0 Washington 38.1 25.0 34.4 39.7 30.8 8.8 8.0 8.0 8.5 7.7 Wyoming 27.4 11.2 22.3 31.9 26.3 8.5 4.6 6.2 9.7 11.3 Midwest 110.1 81.2 101.1 111.0 79.4 as a percent of U.S. 28.2 12.0 22.0 35.5 29.2 6.7 4.4 6.4 8.7 12.6 Illinois 15.9 8.6 10.2 18.1 23.5 7.1 5.4 2.2 7.6 12.1 Indiana 33.3 13.2 25.5 37.5 28.8 8.1 6.4 9.0 8.4 8.3 Iowa 32.9 21.7 31.5 36.1 29.5 6.8 6.7 2.3 7.7 8.9 Kansas 16.3 7.5 13.9 19.0 16.5 3.9 -0.3 3.7 4.4 4.7 Michigan 30.7 12.7 21.7 37.0 22.9 6.4 4.8 5.5 8.5 10.2 Minnesota 25.3 8.9 20.7 28.0 23.4 6.6 3.9 9.2 6.5 10.6 Missouri 33.6 13.3 23.0 38.5 29.4 6.2 0.6 0.7 7.9 7.8 Nebraska 44.2 11.9 18.4 53.8 0.0 3.3 1.7 8.8 7.5 0.0 North Dakota 20.7 6.9 16.9 24.0 25.9 8.1 3.5 10.7 9.0 14.4 Ohio 59.8 13.3 40.5 63.2 80.0 8.6 -20.0 10.9 7.6 8.6 South Dakota 39.4 15.8 26.4 44.1 35.6 -22.4 7.6 8.6 21.5 19.4 Wisconsin 22.4 12.9 17.5 27.6 23.8 4.7 3.5 4.9 6.2 5.0 Northeast 89.9 93.4 79.6 96.0 71.9 as a percent of U.S. 15.5 7.0 9.8 21.7 17.1 3.8 1.7 0.6 7.4 -2.7 Connecticut 25.7 9.2 14.5 26.6 23.5 4.6 -7.0 -4.4 5.2 10.5 Maine 18.8 12.8 12.2 22.4 18.7 2.9 2.5 2.1 3.8 5.2 Massachusetts 24.7 21.1 19.7 25.1 32.6 3.8 12.5 3.1 3.2 23.5 New Hampshire 22.1 11.4 15.9 30.2 23.9 5.9 4.8 5.3 8.2 7.4 New Jersey 25.1 15.3 20.9 31.2 26.1 4.5 3.6 5.8 6.1 3.8 New York 18.2 8.7 12.2 21.7 17.8 3.9 1.2 2.0 5.3 5.2 Pennsylvania 17.9 4.0 8.7 21.8 11.9 5.3 2.1 -0.3 6.8 1.6 Rhode Island 21.4 16.7 0.0 24.2 0.0 10.3 16.7 -11.1 12.6 0.0 Vermont NA NA NA NA NA NA NA NA NA NA District of Columbia
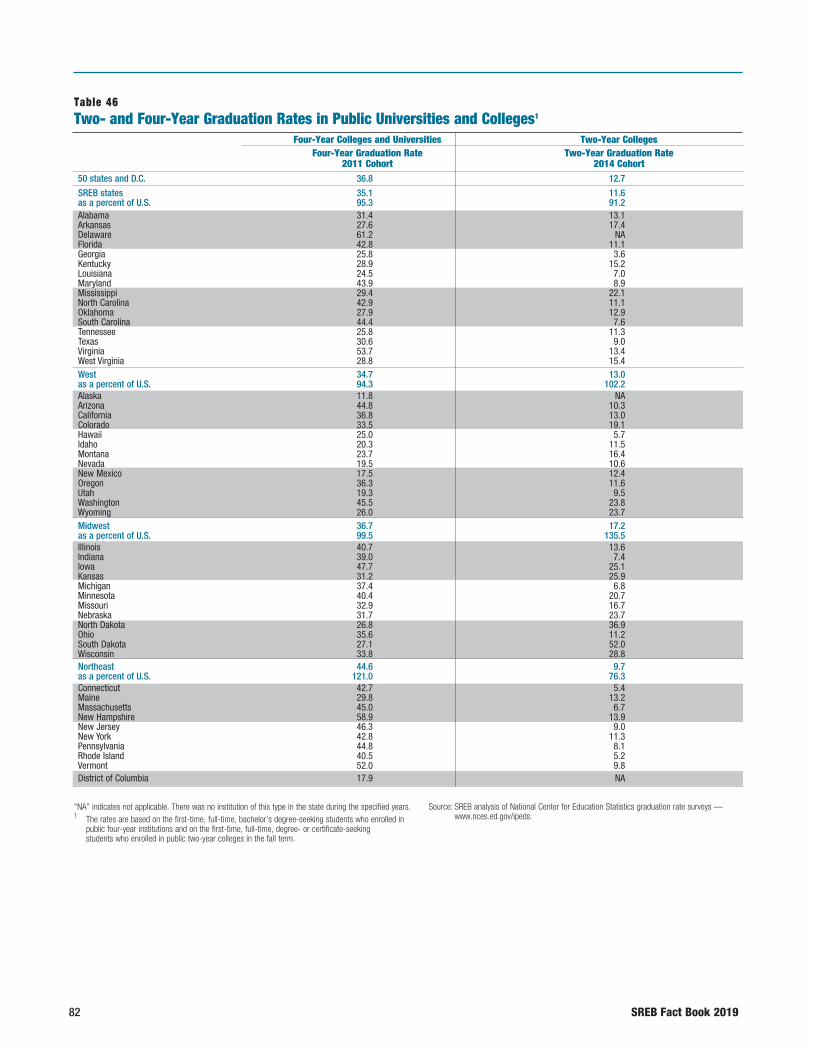
82 SREB Fact Book 2019
“NA” indicates not applicable. There was no institution of this type in the state during the specified years.1 The rates are based on the first-time, full-time, bachelor’s degree-seeking students who enrolled in
public four-year institutions and on the first-time, full-time, degree- or certificate-seeking students who enrolled in public two-year colleges in the fall term.
Source: SREB analysis of National Center for Education Statistics graduation rate surveys — www.nces.ed.gov/ipeds.
Table 46Two- and Four-Year Graduation Rates in Public Universities and Colleges1
Four-Year Colleges and Universities Two-Year Colleges Four-Year Graduation Rate Two-Year Graduation Rate 2011 Cohort 2014 Cohort
50 states and D.C. 36.8 12.7
SREB states 35.1 11.6as a percent of U.S. 95.3 91.2Alabama 31.4 13.1Arkansas 27.6 17.4Delaware 61.2 NAFlorida 42.8 11.1Georgia 25.8 3.6Kentucky 28.9 15.2Louisiana 24.5 7.0Maryland 43.9 8.9Mississippi 29.4 22.1North Carolina 42.9 11.1Oklahoma 27.9 12.9South Carolina 44.4 7.6Tennessee 25.8 11.3Texas 30.6 9.0Virginia 53.7 13.4West Virginia 28.8 15.4West 34.7 13.0as a percent of U.S. 94.3 102.2Alaska 11.8 NAArizona 44.8 10.3California 36.8 13.0Colorado 33.5 19.1Hawaii 25.0 5.7Idaho 20.3 11.5Montana 23.7 16.4Nevada 19.5 10.6New Mexico 17.5 12.4Oregon 36.3 11.6Utah 19.3 9.5Washington 45.5 23.8Wyoming 26.0 23.7Midwest 36.7 17.2as a percent of U.S. 99.5 135.5Illinois 40.7 13.6Indiana 39.0 7.4Iowa 47.7 25.1Kansas 31.2 25.9Michigan 37.4 6.8Minnesota 40.4 20.7Missouri 32.9 16.7Nebraska 31.7 23.7North Dakota 26.8 36.9Ohio 35.6 11.2South Dakota 27.1 52.0Wisconsin 33.8 28.8Northeast 44.6 9.7as a percent of U.S. 121.0 76.3Connecticut 42.7 5.4Maine 29.8 13.2Massachusetts 45.0 6.7New Hampshire 58.9 13.9New Jersey 46.3 9.0New York 42.8 11.3Pennsylvania 44.8 8.1Rhode Island 40.5 5.2Vermont 52.0 9.8District of Columbia 17.9 NA

SREB Fact Book 2019 83
COM
PLETION
Table 47Sub-Bachelor’s Certificates Awarded by Public and Private Colleges and Universities1
Total Percent of Total
Black Students2
Women Foreign Percent at Hispanic 2016-17 Public Colleges Students Students PBIs or HBCUs3 Students2
50 States and D.C. 449,798 55.8 61.4 1.0 17.1 33.8 23.9
SREB States 171,266 58.2 60.3 0.5 25.8 41.8 20.7as a percent of U.S. 38.1 Alabama 4,753 51.5 67.9 0.2 44.9 70.9 2.3Arkansas 6,515 84.3 62.4 0.5 20.7 25.3 7.0Delaware 638 14.7 87.8 0.2 41.0 0.8 10.0Florida 27,549 44.0 59.3 0.9 23.7 30.4 33.1Georgia 13,965 67.6 65.9 0.3 45.6 67.4 7.5Kentucky 5,898 71.2 62.5 0.2 10.0 13.7 2.2Louisiana 12,214 66.3 60.0 0.5 40.2 32.0 4.4Maryland 4,979 40.9 67.8 0.4 47.1 77.4 8.6Mississippi 6,572 79.0 53.1 0.0 46.9 56.8 1.9North Carolina 7,878 60.9 66.0 1.0 28.8 44.8 8.5Oklahoma 9,157 79.4 48.6 0.3 8.5 1.9 11.1South Carolina 3,189 34.4 84.6 * 43.4 64.7 3.7Tennessee 11,187 63.6 52.1 0.1 21.0 43.8 4.7Texas 41,954 47.1 58.0 0.6 16.6 19.7 48.2Virginia 11,307 69.4 63.6 0.9 23.8 29.7 8.5West Virginia 3,511 73.9 63.9 0.1 6.5 0.4 1.3West 140,794 61.3 61.3 2.0 5.9 3.3 39.5as a percent of U.S. 31.3 Alaska 661 71.6 59.3 0.5 4.1 NA 8.3Arizona 19,409 71.2 55.4 0.7 5.7 NA 35.3California 78,083 57.2 62.0 3.0 6.8 4.5 48.6Colorado 5,792 49.9 61.5 0.5 7.4 5.5 27.9Hawaii 1,686 71.4 57.1 2.8 2.6 NA 7.8Idaho 1,816 65.3 63.6 0.2 0.8 NA 14.0Montana 839 75.3 53.5 1.3 1.2 NA 2.7Nevada 2,584 22.7 69.4 0.6 10.3 4.0 32.0New Mexico 9,659 90.6 64.8 0.2 3.2 NA 49.1Oregon 3,959 60.0 69.8 0.6 3.6 NA 13.9Utah 5,813 67.6 64.1 0.9 1.7 NA 15.1Washington 9,326 54.2 60.8 1.2 5.8 NA 16.8Wyoming 1,167 60.4 32.8 0.3 1.1 NA 11.1Midwest 86,464 61.8 62.1 0.4 14.9 29.8 7.5as a percent of U.S. 19.2 Illinois 13,478 50.4 60.4 0.7 16.4 18.9 17.3Indiana 13,966 76.4 63.8 0.1 12.7 12.7 6.0Iowa 4,058 77.6 62.8 0.4 6.1 NA 7.2Kansas 4,499 74.0 53.3 0.8 8.2 NA 12.8Michigan 11,674 45.7 69.8 0.5 21.3 53.5 5.1Minnesota 6,140 77.4 52.0 0.4 7.2 3.7 4.7Missouri 7,823 56.8 62.0 0.2 15.9 36.1 4.8Nebraska 1,522 66.4 65.8 1.3 4.5 NA 11.5North Dakota 708 59.5 59.0 1.3 3.2 NA 3.4Ohio 14,160 46.1 66.3 0.4 24.8 38.5 3.6South Dakota 767 77.4 69.4 NA 1.9 NA 2.4Wisconsin 7,669 84.0 54.4 * 6.2 9.2 6.4Northeast 50,702 22.9 64.3 1.0 21.4 27.9 20.3as a percent of U.S. 11.3 Connecticut 4,826 7.4 53.0 NA 18.9 12.3 25.0Maine 720 57.5 57.5 0.8 2.6 NA 1.6Massachusetts 5,164 20.6 69.8 1.7 17.8 3.0 21.8New Hampshire 765 20.4 86.5 NA 5.7 42.9 4.1New Jersey 9,773 17.9 60.3 0.4 25.6 24.9 32.5New York 15,389 28.6 69.2 2.0 23.0 25.3 21.7Pennsylvania 12,927 24.9 61.3 0.2 21.6 48.1 10.0Rhode Island 848 11.1 78.5 0.6 12.2 NA 17.0Vermont 290 63.4 78.3 2.8 2.5 NA 3.6District of Columbia 572 * 47.9 0.5 71.9 92.9 7.7
“*” indicates less than one-tenth of 1 percent.“NA” indicates not applicable. There was no institution of this type in the state during the specified years.1 Table includes one- but less than two-year certificates and two- but less than four-year certificates
(in the first major) awarded by all degree- and non-degree-granting institutions eligible for federal Title IV student financial aid in the 50 states and D.C., excluding service schools. Less than one- year certificates are not included. Non-degree-granting institutions are not included in other tables. About 92 percent of the certificates reported here were one- but less than two-year certificates, and 73 percent were awarded by degree-granting institutions.
2 Calculated based on a total that excludes students whose race is unknown and students from foreign countries.
3 Predominantly black institutions (PBIs) are those in which black students account for more than 50 percent of total fall enrollment. Historically black colleges and universities (HBCUs) are those founded prior to 1964 as institutions for black students. While an institution’s PBI status may change from year to year, HBCU status will not.
Source: SREB analysis of National Center for Education Statistics completions surveys — www.nces.ed.gov/ipeds.
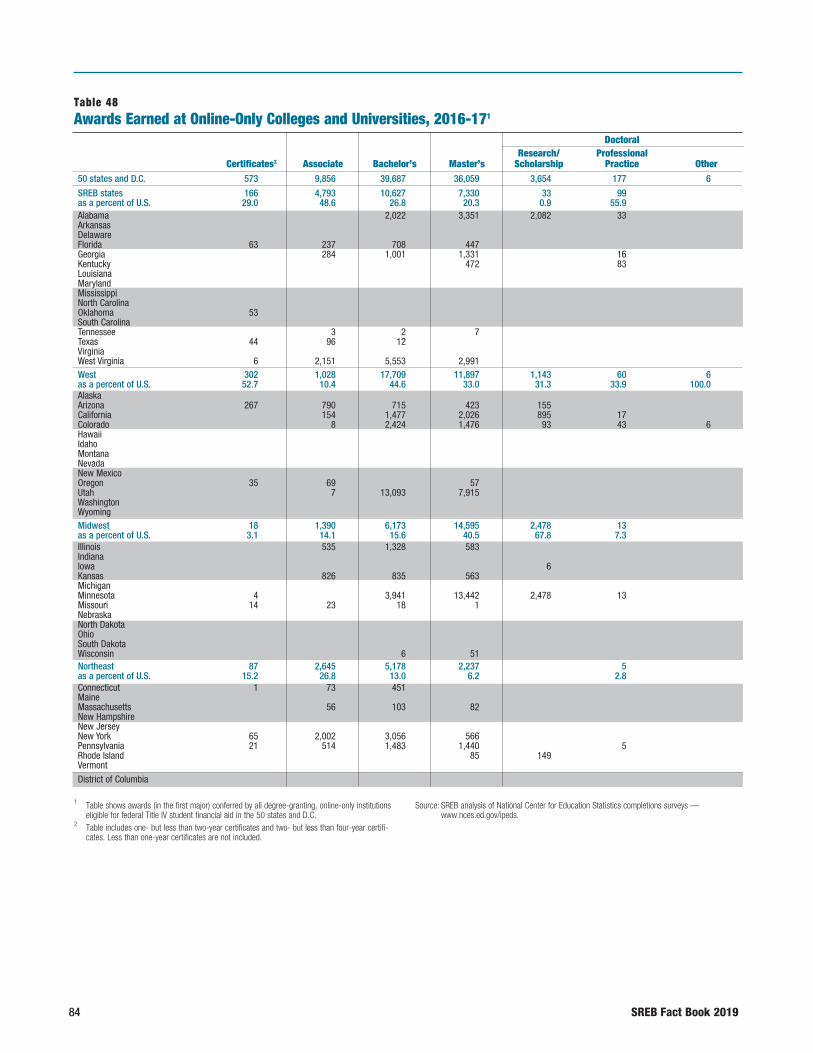
84 SREB Fact Book 2019
1 Table shows awards (in the first major) conferred by all degree-granting, online-only institutions eligible for federal Title IV student financial aid in the 50 states and D.C.
2 Table includes one- but less than two-year certificates and two- but less than four-year certifi-cates. Less than one-year certificates are not included.
Source: SREB analysis of National Center for Education Statistics completions surveys — www.nces.ed.gov/ipeds.
Table 48Awards Earned at Online-Only Colleges and Universities, 2016-171
Doctoral Research/ Professional Certificates2 Associate Bachelor’s Master’s Scholarship Practice Other
50 states and D.C. 573 9,856 39,687 36,059 3,654 177 6
SREB states 166 4,793 10,627 7,330 33 99 as a percent of U.S. 29.0 48.6 26.8 20.3 0.9 55.9 Alabama 2,022 3,351 2,082 33 Arkansas Delaware Florida 63 237 708 447 Georgia 284 1,001 1,331 16 Kentucky 472 83 Louisiana Maryland Mississippi North Carolina Oklahoma 53 South Carolina Tennessee 3 2 7 Texas 44 96 12 Virginia West Virginia 6 2,151 5,553 2,991 West 302 1,028 17,709 11,897 1,143 60 6as a percent of U.S. 52.7 10.4 44.6 33.0 31.3 33.9 100.0Alaska Arizona 267 790 715 423 155 California 154 1,477 2,026 895 17 Colorado 8 2,424 1,476 93 43 6Hawaii Idaho Montana Nevada New Mexico Oregon 35 69 57 Utah 7 13,093 7,915 Washington Wyoming Midwest 18 1,390 6,173 14,595 2,478 13 as a percent of U.S. 3.1 14.1 15.6 40.5 67.8 7.3 Illinois 535 1,328 583 Indiana Iowa 6 Kansas 826 835 563 Michigan Minnesota 4 3,941 13,442 2,478 13 Missouri 14 23 18 1 Nebraska North Dakota Ohio South Dakota Wisconsin 6 51 Northeast 87 2,645 5,178 2,237 5 as a percent of U.S. 15.2 26.8 13.0 6.2 2.8 Connecticut 1 73 451 Maine Massachusetts 56 103 82 New Hampshire New Jersey New York 65 2,002 3,056 566 Pennsylvania 21 514 1,483 1,440 5 Rhode Island 85 149 Vermont
District of Columbia
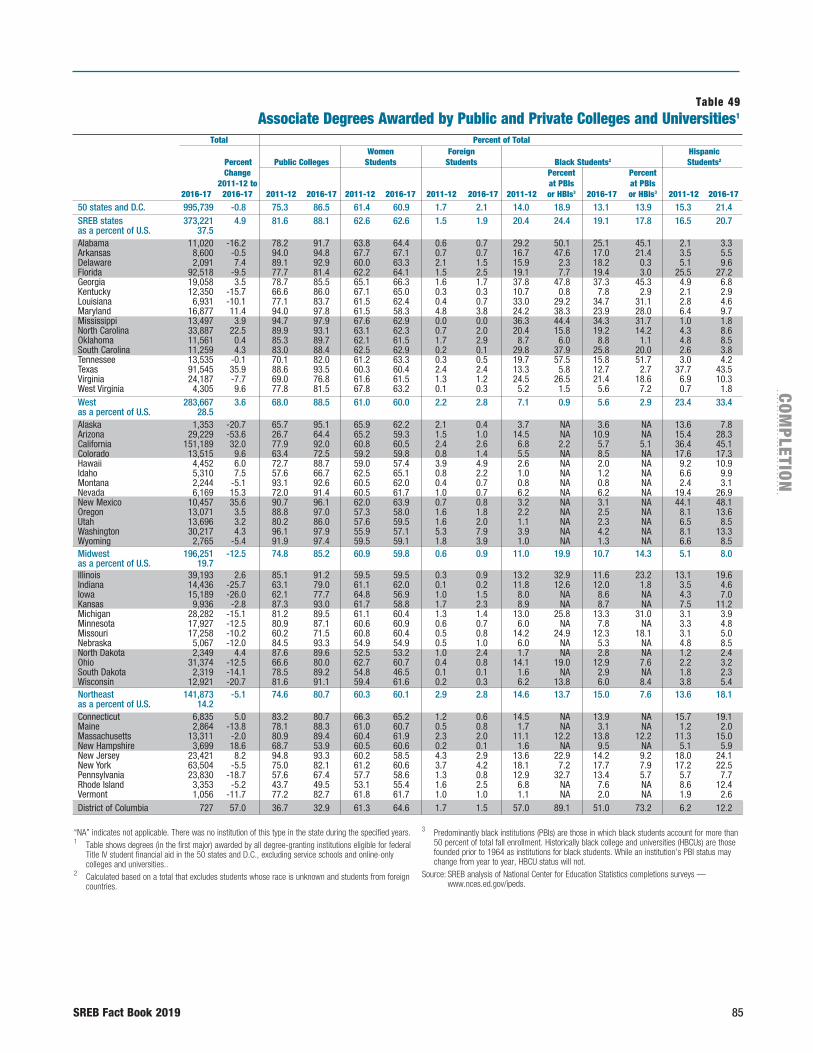
SREB Fact Book 2019 85
COM
PLETION
Table 49Associate Degrees Awarded by Public and Private Colleges and Universities1
Total Percent of Total Women Foreign Hispanic Percent Public Colleges Students Students Black Students2 Students2
Change Percent Percent 2011-12 to at PBIs at PBIs 2016-17 2016-17 2011-12 2016-17 2011-12 2016-17 2011-12 2016-17 2011-12 or HBIs3 2016-17 or HBIs3 2011-12 2016-17 50 states and D.C. 995,739 -0.8 75.3 86.5 61.4 60.9 1.7 2.1 14.0 18.9 13.1 13.9 15.3 21.4
SREB states 373,221 4.9 81.6 88.1 62.6 62.6 1.5 1.9 20.4 24.4 19.1 17.8 16.5 20.7as a percent of U.S. 37.5 Alabama 11,020 -16.2 78.2 91.7 63.8 64.4 0.6 0.7 29.2 50.1 25.1 45.1 2.1 3.3Arkansas 8,600 -0.5 94.0 94.8 67.7 67.1 0.7 0.7 16.7 47.6 17.0 21.4 3.5 5.5Delaware 2,091 7.4 89.1 92.9 60.0 63.3 2.1 1.5 15.9 2.3 18.2 0.3 5.1 9.6Florida 92,518 -9.5 77.7 81.4 62.2 64.1 1.5 2.5 19.1 7.7 19.4 3.0 25.5 27.2Georgia 19,058 3.5 78.7 85.5 65.1 66.3 1.6 1.7 37.8 47.8 37.3 45.3 4.9 6.8Kentucky 12,350 -15.7 66.6 86.0 67.1 65.0 0.3 0.3 10.7 0.8 7.8 2.9 2.1 2.9Louisiana 6,931 -10.1 77.1 83.7 61.5 62.4 0.4 0.7 33.0 29.2 34.7 31.1 2.8 4.6Maryland 16,877 11.4 94.0 97.8 61.5 58.3 4.8 3.8 24.2 38.3 23.9 28.0 6.4 9.7Mississippi 13,497 3.9 94.7 97.9 67.6 62.9 0.0 0.0 36.3 44.4 34.3 31.7 1.0 1.8North Carolina 33,887 22.5 89.9 93.1 63.1 62.3 0.7 2.0 20.4 15.8 19.2 14.2 4.3 8.6Oklahoma 11,561 0.4 85.3 89.7 62.1 61.5 1.7 2.9 8.7 6.0 8.8 1.1 4.8 8.5South Carolina 11,259 4.3 83.0 88.4 62.5 62.9 0.2 0.1 29.8 37.9 25.8 20.0 2.6 3.8Tennessee 13,535 -0.1 70.1 82.0 61.2 63.3 0.3 0.5 19.7 57.5 15.8 51.7 3.0 4.2Texas 91,545 35.9 88.6 93.5 60.3 60.4 2.4 2.4 13.3 5.8 12.7 2.7 37.7 43.5Virginia 24,187 -7.7 69.0 76.8 61.6 61.5 1.3 1.2 24.5 26.5 21.4 18.6 6.9 10.3West Virginia 4,305 9.6 77.8 81.5 67.8 63.2 0.1 0.3 5.2 1.5 5.6 7.2 0.7 1.8West 283,667 3.6 68.0 88.5 61.0 60.0 2.2 2.8 7.1 0.9 5.6 2.9 23.4 33.4as a percent of U.S. 28.5 Alaska 1,353 -20.7 65.7 95.1 65.9 62.2 2.1 0.4 3.7 NA 3.6 NA 13.6 7.8Arizona 29,229 -53.6 26.7 64.4 65.2 59.3 1.5 1.0 14.5 NA 10.9 NA 15.4 28.3California 151,189 32.0 77.9 92.0 60.8 60.5 2.4 2.6 6.8 2.2 5.7 5.1 36.4 45.1Colorado 13,515 9.6 63.4 72.5 59.2 59.8 0.8 1.4 5.5 NA 8.5 NA 17.6 17.3Hawaii 4,452 6.0 72.7 88.7 59.0 57.4 3.9 4.9 2.6 NA 2.0 NA 9.2 10.9Idaho 5,310 7.5 57.6 66.7 62.5 65.1 0.8 2.2 1.0 NA 1.2 NA 6.6 9.9Montana 2,244 -5.1 93.1 92.6 60.5 62.0 0.4 0.7 0.8 NA 0.8 NA 2.4 3.1Nevada 6,169 15.3 72.0 91.4 60.5 61.7 1.0 0.7 6.2 NA 6.2 NA 19.4 26.9New Mexico 10,457 35.6 90.7 96.1 62.0 63.9 0.7 0.8 3.2 NA 3.1 NA 44.1 48.1Oregon 13,071 3.5 88.8 97.0 57.3 58.0 1.6 1.8 2.2 NA 2.5 NA 8.1 13.6Utah 13,696 3.2 80.2 86.0 57.6 59.5 1.6 2.0 1.1 NA 2.3 NA 6.5 8.5Washington 30,217 4.3 96.1 97.9 55.9 57.1 5.3 7.9 3.9 NA 4.2 NA 8.1 13.3Wyoming 2,765 -5.4 91.9 97.4 59.5 59.1 1.8 3.9 1.0 NA 1.3 NA 6.6 8.5Midwest 196,251 -12.5 74.8 85.2 60.9 59.8 0.6 0.9 11.0 19.9 10.7 14.3 5.1 8.0as a percent of U.S. 19.7 Illinois 39,193 2.6 85.1 91.2 59.5 59.5 0.3 0.9 13.2 32.9 11.6 23.2 13.1 19.6Indiana 14,436 -25.7 63.1 79.0 61.1 62.0 0.1 0.2 11.8 12.6 12.0 1.8 3.5 4.6Iowa 15,189 -26.0 62.1 77.7 64.8 56.9 1.0 1.5 8.0 NA 8.6 NA 4.3 7.0Kansas 9,936 -2.8 87.3 93.0 61.7 58.8 1.7 2.3 8.9 NA 8.7 NA 7.5 11.2Michigan 28,282 -15.1 81.2 89.5 61.1 60.4 1.3 1.4 13.0 25.8 13.3 31.0 3.1 3.9Minnesota 17,927 -12.5 80.9 87.1 60.6 60.9 0.6 0.7 6.0 NA 7.8 NA 3.3 4.8Missouri 17,258 -10.2 60.2 71.5 60.8 60.4 0.5 0.8 14.2 24.9 12.3 18.1 3.1 5.0Nebraska 5,067 -12.0 84.5 93.3 54.9 54.9 0.5 1.0 6.0 NA 5.3 NA 4.8 8.5North Dakota 2,349 4.4 87.6 89.6 52.5 53.2 1.0 2.4 1.7 NA 2.8 NA 1.2 2.4Ohio 31,374 -12.5 66.6 80.0 62.7 60.7 0.4 0.8 14.1 19.0 12.9 7.6 2.2 3.2South Dakota 2,319 -14.1 78.5 89.2 54.8 46.5 0.1 0.1 1.6 NA 2.9 NA 1.8 2.3Wisconsin 12,921 -20.7 81.6 91.1 59.4 61.6 0.2 0.3 6.2 13.8 6.0 8.4 3.8 5.4Northeast 141,873 -5.1 74.6 80.7 60.3 60.1 2.9 2.8 14.6 13.7 15.0 7.6 13.6 18.1as a percent of U.S. 14.2 Connecticut 6,835 5.0 83.2 80.7 66.3 65.2 1.2 0.6 14.5 NA 13.9 NA 15.7 19.1Maine 2,864 -13.8 78.1 88.3 61.0 60.7 0.5 0.8 1.7 NA 3.1 NA 1.2 2.0Massachusetts 13,311 -2.0 80.9 89.4 60.4 61.9 2.3 2.0 11.1 12.2 13.8 12.2 11.3 15.0New Hampshire 3,699 18.6 68.7 53.9 60.5 60.6 0.2 0.1 1.6 NA 9.5 NA 5.1 5.9New Jersey 23,421 8.2 94.8 93.3 60.2 58.5 4.3 2.9 13.6 22.9 14.2 9.2 18.0 24.1New York 63,504 -5.5 75.0 82.1 61.2 60.6 3.7 4.2 18.1 7.2 17.7 7.9 17.2 22.5Pennsylvania 23,830 -18.7 57.6 67.4 57.7 58.6 1.3 0.8 12.9 32.7 13.4 5.7 5.7 7.7Rhode Island 3,353 -5.2 43.7 49.5 53.1 55.4 1.6 2.5 6.8 NA 7.6 NA 8.6 12.4Vermont 1,056 -11.7 77.2 82.7 61.8 61.7 1.0 1.0 1.1 NA 2.0 NA 1.9 2.6District of Columbia 727 57.0 36.7 32.9 61.3 64.6 1.7 1.5 57.0 89.1 51.0 73.2 6.2 12.2
“NA” indicates not applicable. There was no institution of this type in the state during the specified years.1 Table shows degrees (in the first major) awarded by all degree-granting institutions eligible for federal
Title IV student financial aid in the 50 states and D.C., excluding service schools and online-only colleges and universities..
2 Calculated based on a total that excludes students whose race is unknown and students from foreign countries.
3 Predominantly black institutions (PBIs) are those in which black students account for more than 50 percent of total fall enrollment. Historically black college and universities (HBCUs) are those founded prior to 1964 as institutions for black students. While an institution’s PBI status may change from year to year, HBCU status will not.
Source: SREB analysis of National Center for Education Statistics completions surveys — www.nces.ed.gov/ipeds.
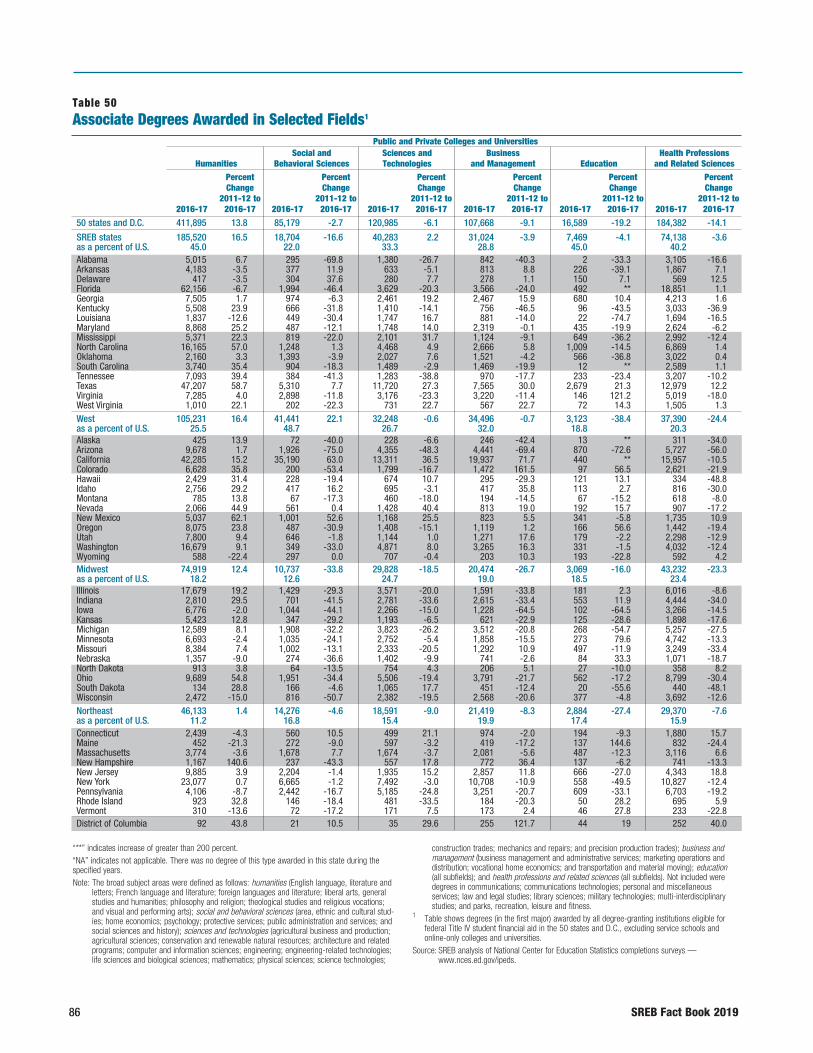
86 SREB Fact Book 2019
Table 50Associate Degrees Awarded in Selected Fields1
Public and Private Colleges and Universities Social and Sciences and Business Health Professions Humanities Behavioral Sciences Technologies and Management Education and Related Sciences
Percent Percent Percent Percent Percent Percent Change Change Change Change Change Change 2011-12 to 2011-12 to 2011-12 to 2011-12 to 2011-12 to 2011-12 to 2016-17 2016-17 2016-17 2016-17 2016-17 2016-17 2016-17 2016-17 2016-17 2016-17 2016-17 2016-17
50 states and D.C. 411,895 13.8 85,179 -2.7 120,985 -6.1 107,668 -9.1 16,589 -19.2 184,382 -14.1
SREB states 185,520 16.5 18,704 -16.6 40,283 2.2 31,024 -3.9 7,469 -4.1 74,138 -3.6as a percent of U.S. 45.0 22.0 33.3 28.8 45.0 40.2 Alabama 5,015 6.7 295 -69.8 1,380 -26.7 842 -40.3 2 -33.3 3,105 -16.6Arkansas 4,183 -3.5 377 11.9 633 -5.1 813 8.8 226 -39.1 1,867 7.1Delaware 417 -3.5 304 37.6 280 7.7 278 1.1 150 7.1 569 12.5Florida 62,156 -6.7 1,994 -46.4 3,629 -20.3 3,566 -24.0 492 ** 18,851 1.1Georgia 7,505 1.7 974 -6.3 2,461 19.2 2,467 15.9 680 10.4 4,213 1.6Kentucky 5,508 23.9 666 -31.8 1,410 -14.1 756 -46.5 96 -43.5 3,033 -36.9Louisiana 1,837 -12.6 449 -30.4 1,747 16.7 881 -14.0 22 -74.7 1,694 -16.5Maryland 8,868 25.2 487 -12.1 1,748 14.0 2,319 -0.1 435 -19.9 2,624 -6.2Mississippi 5,371 22.3 819 -22.0 2,101 31.7 1,124 -9.1 649 -36.2 2,992 -12.4North Carolina 16,165 57.0 1,248 1.3 4,468 4.9 2,666 5.8 1,009 -14.5 6,869 1.4Oklahoma 2,160 3.3 1,393 -3.9 2,027 7.6 1,521 -4.2 566 -36.8 3,022 0.4South Carolina 3,740 35.4 904 -18.3 1,489 -2.9 1,469 -19.9 12 ** 2,589 1.1Tennessee 7,093 39.4 384 -41.3 1,283 -38.8 970 -17.7 233 -23.4 3,207 -10.2Texas 47,207 58.7 5,310 7.7 11,720 27.3 7,565 30.0 2,679 21.3 12,979 12.2Virginia 7,285 4.0 2,898 -11.8 3,176 -23.3 3,220 -11.4 146 121.2 5,019 -18.0West Virginia 1,010 22.1 202 -22.3 731 22.7 567 22.7 72 14.3 1,505 1.3West 105,231 16.4 41,441 22.1 32,248 -0.6 34,496 -0.7 3,123 -38.4 37,390 -24.4as a percent of U.S. 25.5 48.7 26.7 32.0 18.8 20.3 Alaska 425 13.9 72 -40.0 228 -6.6 246 -42.4 13 ** 311 -34.0Arizona 9,678 1.7 1,926 -75.0 4,355 -48.3 4,441 -69.4 870 -72.6 5,727 -56.0California 42,285 15.2 35,190 63.0 13,311 36.5 19,937 71.7 440 ** 15,957 -10.5Colorado 6,628 35.8 200 -53.4 1,799 -16.7 1,472 161.5 97 56.5 2,621 -21.9Hawaii 2,429 31.4 228 -19.4 674 10.7 295 -29.3 121 13.1 334 -48.8Idaho 2,756 29.2 417 16.2 695 -3.1 417 35.8 113 2.7 816 -30.0Montana 785 13.8 67 -17.3 460 -18.0 194 -14.5 67 -15.2 618 -8.0Nevada 2,066 44.9 561 0.4 1,428 40.4 813 19.0 192 15.7 907 -17.2New Mexico 5,037 62.1 1,001 52.6 1,168 25.5 823 5.5 341 -5.8 1,735 10.9Oregon 8,075 23.8 487 -30.9 1,408 -15.1 1,119 1.2 166 56.6 1,442 -19.4Utah 7,800 9.4 646 -1.8 1,144 1.0 1,271 17.6 179 -2.2 2,298 -12.9Washington 16,679 9.1 349 -33.0 4,871 8.0 3,265 16.3 331 -1.5 4,032 -12.4Wyoming 588 -22.4 297 0.0 707 -0.4 203 10.3 193 -22.8 592 4.2Midwest 74,919 12.4 10,737 -33.8 29,828 -18.5 20,474 -26.7 3,069 -16.0 43,232 -23.3as a percent of U.S. 18.2 12.6 24.7 19.0 18.5 23.4 Illinois 17,679 19.2 1,429 -29.3 3,571 -20.0 1,591 -33.8 181 2.3 6,016 -8.6Indiana 2,810 29.5 701 -41.5 2,781 -33.6 2,615 -33.4 553 11.9 4,444 -34.0Iowa 6,776 -2.0 1,044 -44.1 2,266 -15.0 1,228 -64.5 102 -64.5 3,266 -14.5Kansas 5,423 12.8 347 -29.2 1,193 -6.5 621 -22.9 125 -28.6 1,898 -17.6Michigan 12,589 8.1 1,908 -32.2 3,823 -26.2 3,512 -20.8 268 -54.7 5,257 -27.5Minnesota 6,693 -2.4 1,035 -24.1 2,752 -5.4 1,858 -15.5 273 79.6 4,742 -13.3Missouri 8,384 7.4 1,002 -13.1 2,333 -20.5 1,292 10.9 497 -11.9 3,249 -33.4Nebraska 1,357 -9.0 274 -36.6 1,402 -9.9 741 -2.6 84 33.3 1,071 -18.7North Dakota 913 3.8 64 -13.5 754 4.3 206 5.1 27 -10.0 358 8.2Ohio 9,689 54.8 1,951 -34.4 5,506 -19.4 3,791 -21.7 562 -17.2 8,799 -30.4South Dakota 134 28.8 166 -4.6 1,065 17.7 451 -12.4 20 -55.6 440 -48.1Wisconsin 2,472 -15.0 816 -50.7 2,382 -19.5 2,568 -20.6 377 -4.8 3,692 -12.6Northeast 46,133 1.4 14,276 -4.6 18,591 -9.0 21,419 -8.3 2,884 -27.4 29,370 -7.6as a percent of U.S. 11.2 16.8 15.4 19.9 17.4 15.9 Connecticut 2,439 -4.3 560 10.5 499 21.1 974 -2.0 194 -9.3 1,880 15.7Maine 452 -21.3 272 -9.0 597 -3.2 419 -17.2 137 144.6 832 -24.4Massachusetts 3,774 -3.6 1,678 7.7 1,674 -3.7 2,081 -5.6 487 -12.3 3,116 6.6New Hampshire 1,167 140.6 237 -43.3 557 17.8 772 36.4 137 -6.2 741 -13.3New Jersey 9,885 3.9 2,204 -1.4 1,935 15.2 2,857 11.8 666 -27.0 4,343 18.8New York 23,077 0.7 6,665 -1.2 7,492 -3.0 10,708 -10.9 558 -49.5 10,827 -12.4Pennsylvania 4,106 -8.7 2,442 -16.7 5,185 -24.8 3,251 -20.7 609 -33.1 6,703 -19.2Rhode Island 923 32.8 146 -18.4 481 -33.5 184 -20.3 50 28.2 695 5.9Vermont 310 -13.6 72 -17.2 171 7.5 173 2.4 46 27.8 233 -22.8District of Columbia 92 43.8 21 10.5 35 29.6 255 121.7 44 19 252 40.0
“**” indicates increase of greater than 200 percent.“NA” indicates not applicable. There was no degree of this type awarded in this state during the specified years.Note: The broad subject areas were defined as follows: humanities (English language, literature and
letters; French language and literature; foreign languages and literature; liberal arts, general studies and humanities; philosophy and religion; theological studies and religious vocations; and visual and performing arts); social and behavioral sciences (area, ethnic and cultural stud-ies; home economics; psychology; protective services; public administration and services; and social sciences and history); sciences and technologies (agricultural business and production; agricultural sciences; conservation and renewable natural resources; architecture and related programs; computer and information sciences; engineering; engineering-related technologies; life sciences and biological sciences; mathematics; physical sciences; science technologies;
construction trades; mechanics and repairs; and precision production trades); business and management (business management and administrative services; marketing operations and distribution; vocational home economics; and transportation and material moving); education (all subfields); and health professions and related sciences (all subfields). Not included were degrees in communications; communications technologies; personal and miscellaneous services; law and legal studies; library sciences; military technologies; multi-interdisciplinary studies; and parks, recreation, leisure and fitness.
1 Table shows degrees (in the first major) awarded by all degree-granting institutions eligible for federal Title IV student financial aid in the 50 states and D.C., excluding service schools and online-only colleges and universities.
Source: SREB analysis of National Center for Education Statistics completions surveys — www.nces.ed.gov/ipeds.
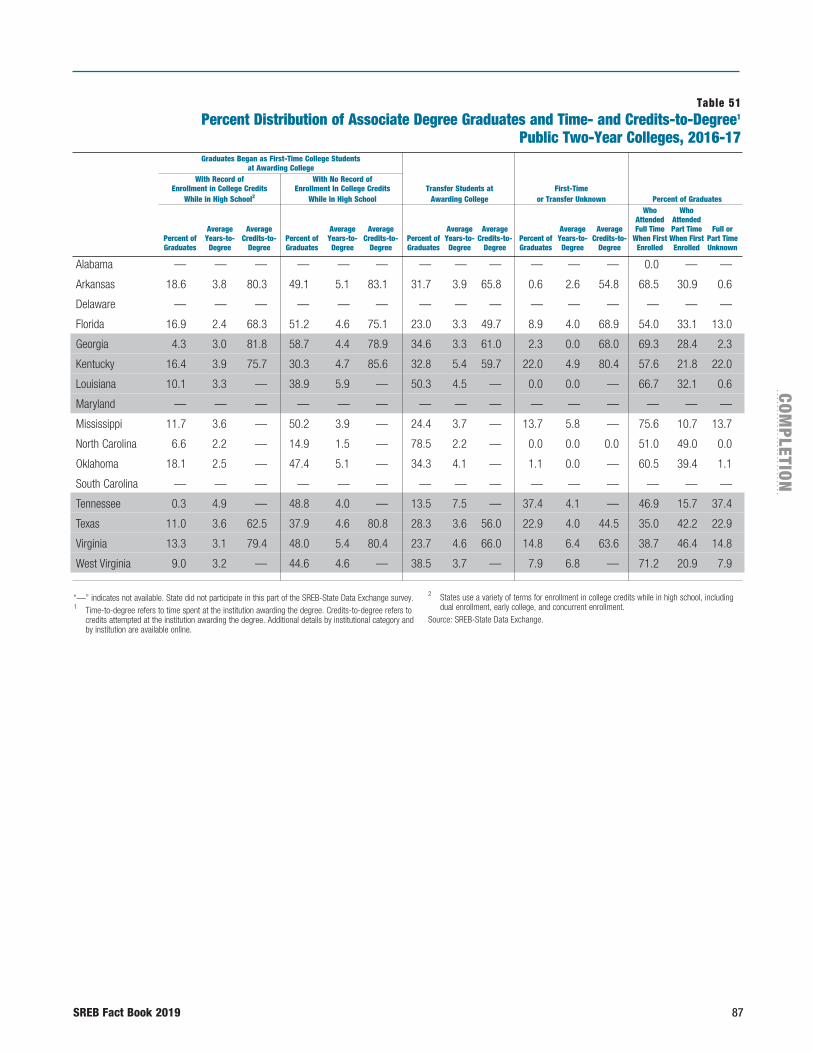
SREB Fact Book 2019 87
COM
PLETION
Graduates Began as First-Time College Students at Awarding College With Record of With No Record of Enrollment in College Credits Enrollment In College Credits Transfer Students at First-Time While in High School2 While in High School Awarding College or Transfer Unknown Percent of Graduates Who Who Attended Attended Average Average Average Average Average Average Average Average Full Time Part Time Full or Percent of Years-to- Credits-to- Percent of Years-to- Credits-to- Percent of Years-to- Credits-to- Percent of Years-to- Credits-to- When First When First Part Time Graduates Degree Degree Graduates Degree Degree Graduates Degree Degree Graduates Degree Degree Enrolled Enrolled Unknown
Table 51Percent Distribution of Associate Degree Graduates and Time- and Credits-to-Degree1
Public Two-Year Colleges, 2016-17
Alabama — — — — — — — — — — — — 0.0 — —
Arkansas 18.6 3.8 80.3 49.1 5.1 83.1 31.7 3.9 65.8 0.6 2.6 54.8 68.5 30.9 0.6
Delaware — — — — — — — — — — — — — — —
Florida 16.9 2.4 68.3 51.2 4.6 75.1 23.0 3.3 49.7 8.9 4.0 68.9 54.0 33.1 13.0
Georgia 4.3 3.0 81.8 58.7 4.4 78.9 34.6 3.3 61.0 2.3 0.0 68.0 69.3 28.4 2.3
Kentucky 16.4 3.9 75.7 30.3 4.7 85.6 32.8 5.4 59.7 22.0 4.9 80.4 57.6 21.8 22.0
Louisiana 10.1 3.3 — 38.9 5.9 — 50.3 4.5 — 0.0 0.0 — 66.7 32.1 0.6
Maryland — — — — — — — — — — — — — — —
Mississippi 11.7 3.6 — 50.2 3.9 — 24.4 3.7 — 13.7 5.8 — 75.6 10.7 13.7
North Carolina 6.6 2.2 — 14.9 1.5 — 78.5 2.2 — 0.0 0.0 0.0 51.0 49.0 0.0
Oklahoma 18.1 2.5 — 47.4 5.1 — 34.3 4.1 — 1.1 0.0 — 60.5 39.4 1.1
South Carolina — — — — — — — — — — — — — — —
Tennessee 0.3 4.9 — 48.8 4.0 — 13.5 7.5 — 37.4 4.1 — 46.9 15.7 37.4
Texas 11.0 3.6 62.5 37.9 4.6 80.8 28.3 3.6 56.0 22.9 4.0 44.5 35.0 42.2 22.9
Virginia 13.3 3.1 79.4 48.0 5.4 80.4 23.7 4.6 66.0 14.8 6.4 63.6 38.7 46.4 14.8
West Virginia 9.0 3.2 — 44.6 4.6 — 38.5 3.7 — 7.9 6.8 — 71.2 20.9 7.9
“—” indicates not available. State did not participate in this part of the SREB-State Data Exchange survey.1 Time-to-degree refers to time spent at the institution awarding the degree. Credits-to-degree refers to
credits attempted at the institution awarding the degree. Additional details by institutional category and by institution are available online.
2 States use a variety of terms for enrollment in college credits while in high school, including dual enrollment, early college, and concurrent enrollment.
Source: SREB-State Data Exchange.
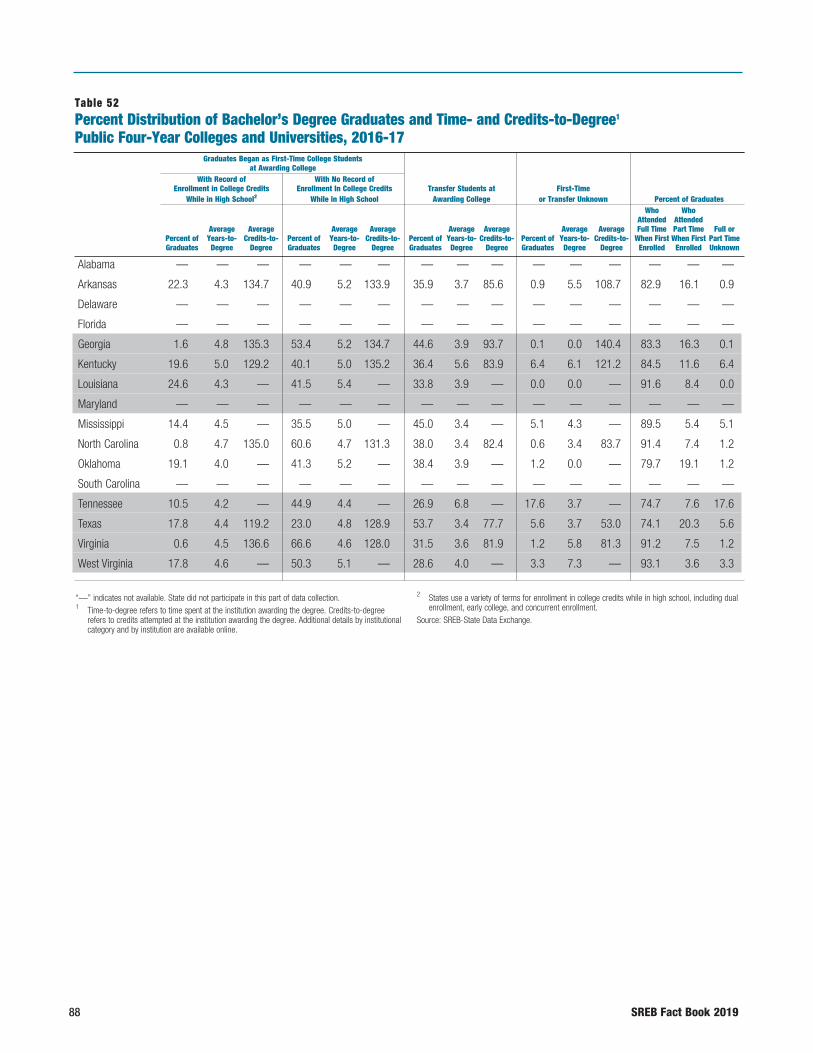
88 SREB Fact Book 2019
Table 52Percent Distribution of Bachelor’s Degree Graduates and Time- and Credits-to-Degree1 Public Four-Year Colleges and Universities, 2016-17 Graduates Began as First-Time College Students at Awarding College With Record of With No Record of Enrollment in College Credits Enrollment In College Credits Transfer Students at First-Time While in High School2 While in High School Awarding College or Transfer Unknown Percent of Graduates Who Who Attended Attended Average Average Average Average Average Average Average Average Full Time Part Time Full or Percent of Years-to- Credits-to- Percent of Years-to- Credits-to- Percent of Years-to- Credits-to- Percent of Years-to- Credits-to- When First When First Part Time Graduates Degree Degree Graduates Degree Degree Graduates Degree Degree Graduates Degree Degree Enrolled Enrolled Unknown
Alabama — — — — — — — — — — — — — — —
Arkansas 22.3 4.3 134.7 40.9 5.2 133.9 35.9 3.7 85.6 0.9 5.5 108.7 82.9 16.1 0.9
Delaware — — — — — — — — — — — — — — —
Florida — — — — — — — — — — — — — — —
Georgia 1.6 4.8 135.3 53.4 5.2 134.7 44.6 3.9 93.7 0.1 0.0 140.4 83.3 16.3 0.1
Kentucky 19.6 5.0 129.2 40.1 5.0 135.2 36.4 5.6 83.9 6.4 6.1 121.2 84.5 11.6 6.4
Louisiana 24.6 4.3 — 41.5 5.4 — 33.8 3.9 — 0.0 0.0 — 91.6 8.4 0.0
Maryland — — — — — — — — — — — — — — —
Mississippi 14.4 4.5 — 35.5 5.0 — 45.0 3.4 — 5.1 4.3 — 89.5 5.4 5.1
North Carolina 0.8 4.7 135.0 60.6 4.7 131.3 38.0 3.4 82.4 0.6 3.4 83.7 91.4 7.4 1.2
Oklahoma 19.1 4.0 — 41.3 5.2 — 38.4 3.9 — 1.2 0.0 — 79.7 19.1 1.2
South Carolina — — — — — — — — — — — — — — —
Tennessee 10.5 4.2 — 44.9 4.4 — 26.9 6.8 — 17.6 3.7 — 74.7 7.6 17.6
Texas 17.8 4.4 119.2 23.0 4.8 128.9 53.7 3.4 77.7 5.6 3.7 53.0 74.1 20.3 5.6
Virginia 0.6 4.5 136.6 66.6 4.6 128.0 31.5 3.6 81.9 1.2 5.8 81.3 91.2 7.5 1.2
West Virginia 17.8 4.6 — 50.3 5.1 — 28.6 4.0 — 3.3 7.3 — 93.1 3.6 3.3
“—” indicates not available. State did not participate in this part of data collection.1 Time-to-degree refers to time spent at the institution awarding the degree. Credits-to-degree
refers to credits attempted at the institution awarding the degree. Additional details by institutional category and by institution are available online.
2 States use a variety of terms for enrollment in college credits while in high school, including dual enrollment, early college, and concurrent enrollment.
Source: SREB-State Data Exchange.
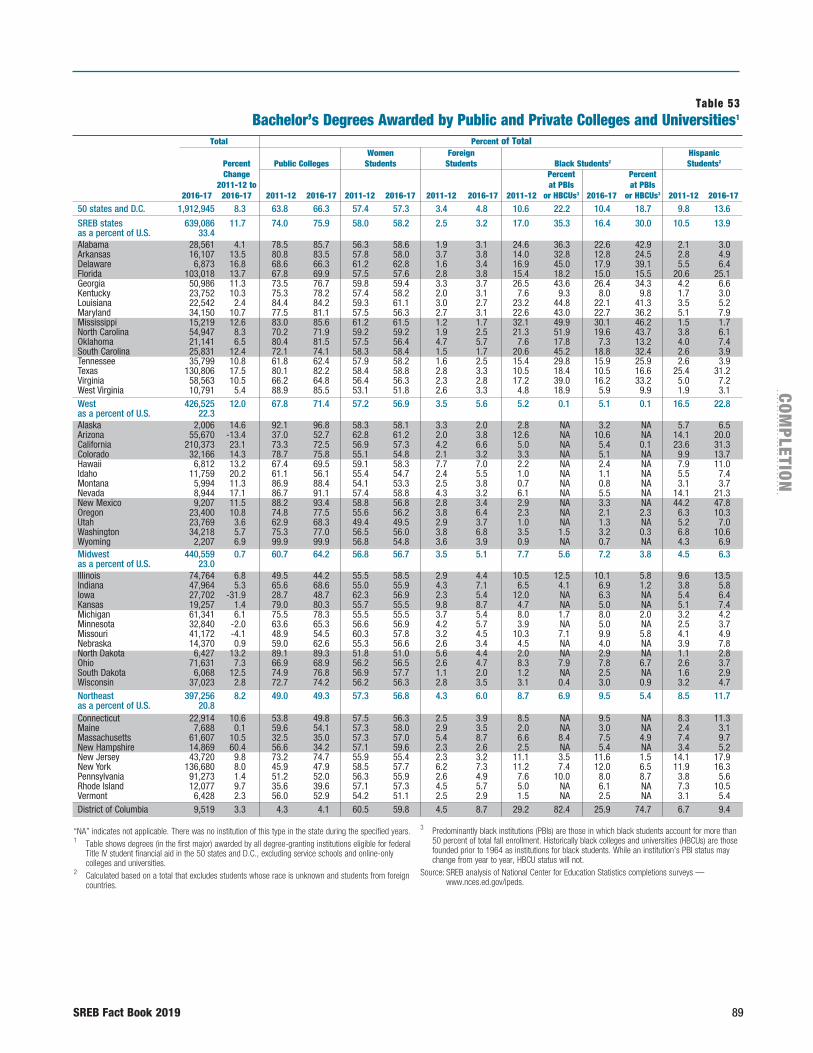
SREB Fact Book 2019 89
COM
PLETION
Table 53Bachelor’s Degrees Awarded by Public and Private Colleges and Universities1
Total Percent of Total Women Foreign Hispanic Percent Public Colleges Students Students Black Students2 Students2
Change Percent Percent 2011-12 to at PBIs at PBIs 2016-17 2016-17 2011-12 2016-17 2011-12 2016-17 2011-12 2016-17 2011-12 or HBCUs3 2016-17 or HBCUs3 2011-12 2016-17
50 states and D.C. 1,912,945 8.3 63.8 66.3 57.4 57.3 3.4 4.8 10.6 22.2 10.4 18.7 9.8 13.6
SREB states 639,086 11.7 74.0 75.9 58.0 58.2 2.5 3.2 17.0 35.3 16.4 30.0 10.5 13.9as a percent of U.S. 33.4 Alabama 28,561 4.1 78.5 85.7 56.3 58.6 1.9 3.1 24.6 36.3 22.6 42.9 2.1 3.0Arkansas 16,107 13.5 80.8 83.5 57.8 58.0 3.7 3.8 14.0 32.8 12.8 24.5 2.8 4.9Delaware 6,873 16.8 68.6 66.3 61.2 62.8 1.6 3.4 16.9 45.0 17.9 39.1 5.5 6.4Florida 103,018 13.7 67.8 69.9 57.5 57.6 2.8 3.8 15.4 18.2 15.0 15.5 20.6 25.1Georgia 50,986 11.3 73.5 76.7 59.8 59.4 3.3 3.7 26.5 43.6 26.4 34.3 4.2 6.6Kentucky 23,752 10.3 75.3 78.2 57.4 58.2 2.0 3.1 7.6 9.3 8.0 9.8 1.7 3.0Louisiana 22,542 2.4 84.4 84.2 59.3 61.1 3.0 2.7 23.2 44.8 22.1 41.3 3.5 5.2Maryland 34,150 10.7 77.5 81.1 57.5 56.3 2.7 3.1 22.6 43.0 22.7 36.2 5.1 7.9Mississippi 15,219 12.6 83.0 85.6 61.2 61.5 1.2 1.7 32.1 49.9 30.1 46.2 1.5 1.7North Carolina 54,947 8.3 70.2 71.9 59.2 59.2 1.9 2.5 21.3 51.9 19.6 43.7 3.8 6.1Oklahoma 21,141 6.5 80.4 81.5 57.5 56.4 4.7 5.7 7.6 17.8 7.3 13.2 4.0 7.4South Carolina 25,831 12.4 72.1 74.1 58.3 58.4 1.5 1.7 20.6 45.2 18.8 32.4 2.6 3.9Tennessee 35,799 10.8 61.8 62.4 57.9 58.2 1.6 2.5 15.4 29.8 15.9 25.9 2.6 3.9Texas 130,806 17.5 80.1 82.2 58.4 58.8 2.8 3.3 10.5 18.4 10.5 16.6 25.4 31.2Virginia 58,563 10.5 66.2 64.8 56.4 56.3 2.3 2.8 17.2 39.0 16.2 33.2 5.0 7.2West Virginia 10,791 5.4 88.9 85.5 53.1 51.8 2.6 3.3 4.8 18.9 5.9 9.9 1.9 3.1West 426,525 12.0 67.8 71.4 57.2 56.9 3.5 5.6 5.2 0.1 5.1 0.1 16.5 22.8as a percent of U.S. 22.3 Alaska 2,006 14.6 92.1 96.8 58.3 58.1 3.3 2.0 2.8 NA 3.2 NA 5.7 6.5Arizona 55,670 -13.4 37.0 52.7 62.8 61.2 2.0 3.8 12.6 NA 10.6 NA 14.1 20.0California 210,373 23.1 73.3 72.5 56.9 57.3 4.2 6.6 5.0 NA 5.4 0.1 23.6 31.3Colorado 32,166 14.3 78.7 75.8 55.1 54.8 2.1 3.2 3.3 NA 5.1 NA 9.9 13.7Hawaii 6,812 13.2 67.4 69.5 59.1 58.3 7.7 7.0 2.2 NA 2.4 NA 7.9 11.0Idaho 11,759 20.2 61.1 56.1 55.4 54.7 2.4 5.5 1.0 NA 1.1 NA 5.5 7.4Montana 5,994 11.3 86.9 88.4 54.1 53.3 2.5 3.8 0.7 NA 0.8 NA 3.1 3.7Nevada 8,944 17.1 86.7 91.1 57.4 58.8 4.3 3.2 6.1 NA 5.5 NA 14.1 21.3New Mexico 9,207 11.5 88.2 93.4 58.8 56.8 2.8 3.4 2.9 NA 3.3 NA 44.2 47.8Oregon 23,400 10.8 74.8 77.5 55.6 56.2 3.8 6.4 2.3 NA 2.1 2.3 6.3 10.3Utah 23,769 3.6 62.9 68.3 49.4 49.5 2.9 3.7 1.0 NA 1.3 NA 5.2 7.0Washington 34,218 5.7 75.3 77.0 56.5 56.0 3.8 6.8 3.5 1.5 3.2 0.3 6.8 10.6Wyoming 2,207 6.9 99.9 99.9 56.8 54.8 3.6 3.9 0.9 NA 0.7 NA 4.3 6.9Midwest 440,559 0.7 60.7 64.2 56.8 56.7 3.5 5.1 7.7 5.6 7.2 3.8 4.5 6.3as a percent of U.S. 23.0 Illinois 74,764 6.8 49.5 44.2 55.5 58.5 2.9 4.4 10.5 12.5 10.1 5.8 9.6 13.5Indiana 47,964 5.3 65.6 68.6 55.0 55.9 4.3 7.1 6.5 4.1 6.9 1.2 3.8 5.8Iowa 27,702 -31.9 28.7 48.7 62.3 56.9 2.3 5.4 12.0 NA 6.3 NA 5.4 6.4Kansas 19,257 1.4 79.0 80.3 55.7 55.5 9.8 8.7 4.7 NA 5.0 NA 5.1 7.4Michigan 61,341 6.1 75.5 78.3 55.5 55.5 3.7 5.4 8.0 1.7 8.0 2.0 3.2 4.2Minnesota 32,840 -2.0 63.6 65.3 56.6 56.9 4.2 5.7 3.9 NA 5.0 NA 2.5 3.7Missouri 41,172 -4.1 48.9 54.5 60.3 57.8 3.2 4.5 10.3 7.1 9.9 5.8 4.1 4.9Nebraska 14,370 0.9 59.0 62.6 55.3 56.6 2.6 3.4 4.5 NA 4.0 NA 3.9 7.8North Dakota 6,427 13.2 89.1 89.3 51.8 51.0 5.6 4.4 2.0 NA 2.9 NA 1.1 2.8Ohio 71,631 7.3 66.9 68.9 56.2 56.5 2.6 4.7 8.3 7.9 7.8 6.7 2.6 3.7South Dakota 6,068 12.5 74.9 76.8 56.9 57.7 1.1 2.0 1.2 NA 2.5 NA 1.6 2.9Wisconsin 37,023 2.8 72.7 74.2 56.2 56.3 2.8 3.5 3.1 0.4 3.0 0.9 3.2 4.7Northeast 397,256 8.2 49.0 49.3 57.3 56.8 4.3 6.0 8.7 6.9 9.5 5.4 8.5 11.7as a percent of U.S. 20.8 Connecticut 22,914 10.6 53.8 49.8 57.5 56.3 2.5 3.9 8.5 NA 9.5 NA 8.3 11.3Maine 7,688 0.1 59.6 54.1 57.3 58.0 2.9 3.5 2.0 NA 3.0 NA 2.4 3.1Massachusetts 61,607 10.5 32.5 35.0 57.3 57.0 5.4 8.7 6.6 8.4 7.5 4.9 7.4 9.7New Hampshire 14,869 60.4 56.6 34.2 57.1 59.6 2.3 2.6 2.5 NA 5.4 NA 3.4 5.2New Jersey 43,720 9.8 73.2 74.7 55.9 55.4 2.3 3.2 11.1 3.5 11.6 1.5 14.1 17.9New York 136,680 8.0 45.9 47.9 58.5 57.7 6.2 7.3 11.2 7.4 12.0 6.5 11.9 16.3Pennsylvania 91,273 1.4 51.2 52.0 56.3 55.9 2.6 4.9 7.6 10.0 8.0 8.7 3.8 5.6Rhode Island 12,077 9.7 35.6 39.6 57.1 57.3 4.5 5.7 5.0 NA 6.1 NA 7.3 10.5Vermont 6,428 2.3 56.0 52.9 54.2 51.1 2.5 2.9 1.5 NA 2.5 NA 3.1 5.4District of Columbia 9,519 3.3 4.3 4.1 60.5 59.8 4.5 8.7 29.2 82.4 25.9 74.7 6.7 9.4
“NA” indicates not applicable. There was no institution of this type in the state during the specified years.1 Table shows degrees (in the first major) awarded by all degree-granting institutions eligible for federal
Title IV student financial aid in the 50 states and D.C., excluding service schools and online-only colleges and universities.
2 Calculated based on a total that excludes students whose race is unknown and students from foreign countries.
3 Predominantly black institutions (PBIs) are those in which black students account for more than 50 percent of total fall enrollment. Historically black colleges and universities (HBCUs) are those founded prior to 1964 as institutions for black students. While an institution’s PBI status may change from year to year, HBCU status will not.
Source: SREB analysis of National Center for Education Statistics completions surveys — www.nces.ed.gov/ipeds.
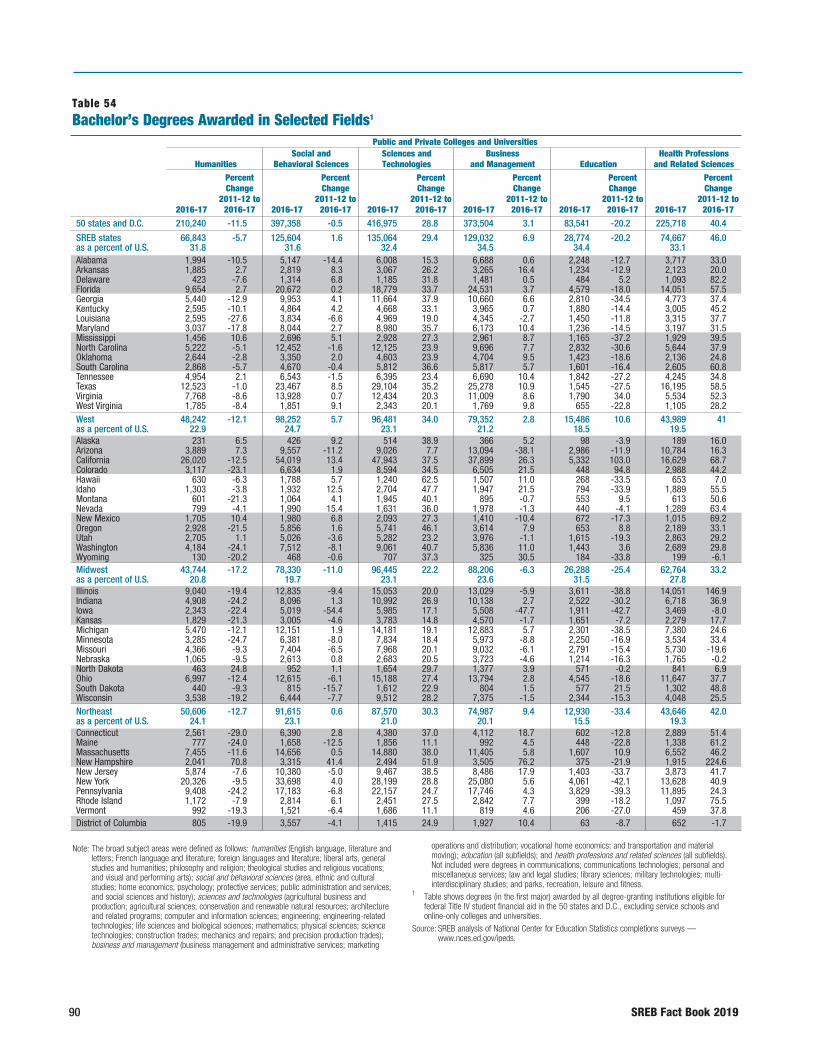
90 SREB Fact Book 2019
Table 54Bachelor’s Degrees Awarded in Selected Fields1
Public and Private Colleges and Universities Social and Sciences and Business Health Professions Humanities Behavioral Sciences Technologies and Management Education and Related Sciences
Percent Percent Percent Percent Percent Percent Change Change Change Change Change Change 2011-12 to 2011-12 to 2011-12 to 2011-12 to 2011-12 to 2011-12 to 2016-17 2016-17 2016-17 2016-17 2016-17 2016-17 2016-17 2016-17 2016-17 2016-17 2016-17 2016-17
50 states and D.C. 210,240 -11.5 397,358 -0.5 416,975 28.8 373,504 3.1 83,541 -20.2 225,718 40.4
SREB states 66,843 -5.7 125,604 1.6 135,064 29.4 129,032 6.9 28,774 -20.2 74,667 46.0as a percent of U.S. 31.8 31.6 32.4 34.5 34.4 33.1 Alabama 1,994 -10.5 5,147 -14.4 6,008 15.3 6,688 0.6 2,248 -12.7 3,717 33.0Arkansas 1,885 2.7 2,819 8.3 3,067 26.2 3,265 16.4 1,234 -12.9 2,123 20.0Delaware 423 -7.6 1,314 6.8 1,185 31.8 1,481 0.5 484 5.2 1,093 82.2Florida 9,654 2.7 20,672 0.2 18,779 33.7 24,531 3.7 4,579 -18.0 14,051 57.5Georgia 5,440 -12.9 9,953 4.1 11,664 37.9 10,660 6.6 2,810 -34.5 4,773 37.4Kentucky 2,595 -10.1 4,864 4.2 4,668 33.1 3,965 0.7 1,880 -14.4 3,005 45.2Louisiana 2,595 -27.6 3,834 -6.6 4,969 19.0 4,345 -2.7 1,450 -11.8 3,315 37.7Maryland 3,037 -17.8 8,044 2.7 8,980 35.7 6,173 10.4 1,236 -14.5 3,197 31.5Mississippi 1,456 10.6 2,696 5.1 2,928 27.3 2,961 8.7 1,165 -37.2 1,929 39.5North Carolina 5,222 -5.1 12,452 -1.6 12,125 23.9 9,696 7.7 2,832 -30.6 5,644 37.9Oklahoma 2,644 -2.8 3,350 2.0 4,603 23.9 4,704 9.5 1,423 -18.6 2,136 24.8South Carolina 2,868 -5.7 4,670 -0.4 5,812 36.6 5,817 5.7 1,601 -16.4 2,605 60.8Tennessee 4,954 2.1 6,543 -1.5 6,395 23.4 6,690 10.4 1,842 -27.2 4,245 34.8Texas 12,523 -1.0 23,467 8.5 29,104 35.2 25,278 10.9 1,545 -27.5 16,195 58.5Virginia 7,768 -8.6 13,928 0.7 12,434 20.3 11,009 8.6 1,790 34.0 5,534 52.3West Virginia 1,785 -8.4 1,851 9.1 2,343 20.1 1,769 9.8 655 -22.8 1,105 28.2West 48,242 -12.1 98,252 5.7 96,481 34.0 79,352 2.8 15,486 10.6 43,989 41as a percent of U.S. 22.9 24.7 23.1 21.2 18.5 19.5 Alaska 231 6.5 426 9.2 514 38.9 366 5.2 98 -3.9 189 16.0Arizona 3,889 7.3 9,557 -11.2 9,026 7.7 13,094 -38.1 2,986 -11.9 10,784 16.3California 26,020 -12.5 54,019 13.4 47,943 37.5 37,899 26.3 5,332 103.0 16,629 68.7Colorado 3,117 -23.1 6,634 1.9 8,594 34.5 6,505 21.5 448 94.8 2,988 44.2Hawaii 630 -6.3 1,788 5.7 1,240 62.5 1,507 11.0 268 -33.5 653 7.0Idaho 1,303 -3.8 1,932 12.5 2,704 47.7 1,947 21.5 794 -33.9 1,889 55.5Montana 601 -21.3 1,064 4.1 1,945 40.1 895 -0.7 553 9.5 613 50.6Nevada 799 -4.1 1,990 15.4 1,631 36.0 1,978 -1.3 440 -4.1 1,289 63.4New Mexico 1,705 10.4 1,980 6.8 2,093 27.3 1,410 -10.4 672 -17.3 1,015 69.2Oregon 2,928 -21.5 5,856 1.6 5,741 46.1 3,614 7.9 653 8.8 2,189 33.1Utah 2,705 1.1 5,026 -3.6 5,282 23.2 3,976 -1.1 1,615 -19.3 2,863 29.2Washington 4,184 -24.1 7,512 -8.1 9,061 40.7 5,836 11.0 1,443 3.6 2,689 29.8Wyoming 130 -20.2 468 -0.6 707 37.3 325 30.5 184 -33.8 199 -6.1Midwest 43,744 -17.2 78,330 -11.0 96,445 22.2 88,206 -6.3 26,288 -25.4 62,764 33.2as a percent of U.S. 20.8 19.7 23.1 23.6 31.5 27.8 Illinois 9,040 -19.4 12,835 -9.4 15,053 20.0 13,029 -5.9 3,611 -38.8 14,051 146.9Indiana 4,908 -24.2 8,096 1.3 10,992 26.9 10,138 2.7 2,522 -30.2 6,718 36.9Iowa 2,343 -22.4 5,019 -54.4 5,985 17.1 5,508 -47.7 1,911 -42.7 3,469 -8.0Kansas 1,829 -21.3 3,005 -4.6 3,783 14.8 4,570 -1.7 1,651 -7.2 2,279 17.7Michigan 5,470 -12.1 12,151 1.9 14,181 19.1 12,883 5.7 2,301 -38.5 7,380 24.6Minnesota 3,285 -24.7 6,381 -8.0 7,834 18.4 5,973 -8.8 2,250 -16.9 3,534 33.4Missouri 4,366 -9.3 7,404 -6.5 7,968 20.1 9,032 -6.1 2,791 -15.4 5,730 -19.6Nebraska 1,065 -9.5 2,613 0.8 2,683 20.5 3,723 -4.6 1,214 -16.3 1,765 -0.2North Dakota 463 24.8 952 1.1 1,654 29.7 1,377 3.9 571 -0.2 841 6.9Ohio 6,997 -12.4 12,615 -6.1 15,188 27.4 13,794 2.8 4,545 -18.6 11,647 37.7South Dakota 440 -9.3 815 -15.7 1,612 22.9 804 1.5 577 21.5 1,302 48.8Wisconsin 3,538 -19.2 6,444 -7.7 9,512 28.2 7,375 -1.5 2,344 -15.3 4,048 25.5Northeast 50,606 -12.7 91,615 0.6 87,570 30.3 74,987 9.4 12,930 -33.4 43,646 42.0as a percent of U.S. 24.1 23.1 21.0 20.1 15.5 19.3 Connecticut 2,561 -29.0 6,390 2.8 4,380 37.0 4,112 18.7 602 -12.8 2,889 51.4Maine 777 -24.0 1,658 -12.5 1,856 11.1 992 4.5 448 -22.8 1,338 61.2Massachusetts 7,455 -11.6 14,656 0.5 14,880 38.0 11,405 5.8 1,607 10.9 6,552 46.2New Hampshire 2,041 70.8 3,315 41.4 2,494 51.9 3,505 76.2 375 -21.9 1,915 224.6New Jersey 5,874 -7.6 10,380 -5.0 9,467 38.5 8,486 17.9 1,403 -33.7 3,873 41.7New York 20,326 -9.5 33,698 4.0 28,199 28.8 25,080 5.6 4,061 -42.1 13,628 40.9Pennsylvania 9,408 -24.2 17,183 -6.8 22,157 24.7 17,746 4.3 3,829 -39.3 11,895 24.3Rhode Island 1,172 -7.9 2,814 6.1 2,451 27.5 2,842 7.7 399 -18.2 1,097 75.5Vermont 992 -19.3 1,521 -6.4 1,686 11.1 819 4.6 206 -27.0 459 37.8District of Columbia 805 -19.9 3,557 -4.1 1,415 24.9 1,927 10.4 63 -8.7 652 -1.7
Note: The broad subject areas were defined as follows: humanities (English language, literature and letters; French language and literature; foreign languages and literature; liberal arts, general studies and humanities; philosophy and religion; theological studies and religious vocations; and visual and performing arts); social and behavioral sciences (area, ethnic and cultural studies; home economics; psychology; protective services; public administration and services; and social sciences and history); sciences and technologies (agricultural business and production; agricultural sciences; conservation and renewable natural resources; architecture and related programs; computer and information sciences; engineering; engineering-related technologies; life sciences and biological sciences; mathematics; physical sciences; science technologies; construction trades; mechanics and repairs; and precision production trades); business and management (business management and administrative services; marketing
operations and distribution; vocational home economics; and transportation and material moving); education (all subfields); and health professions and related sciences (all subfields). Not included were degrees in communications; communications technologies; personal and miscellaneous services; law and legal studies; library sciences; military technologies; multi- interdisciplinary studies; and parks, recreation, leisure and fitness.
1 Table shows degrees (in the first major) awarded by all degree-granting institutions eligible for federal Title IV student financial aid in the 50 states and D.C., excluding service schools and online-only colleges and universities.
Source: SREB analysis of National Center for Education Statistics completions surveys — www.nces.ed.gov/ipeds.
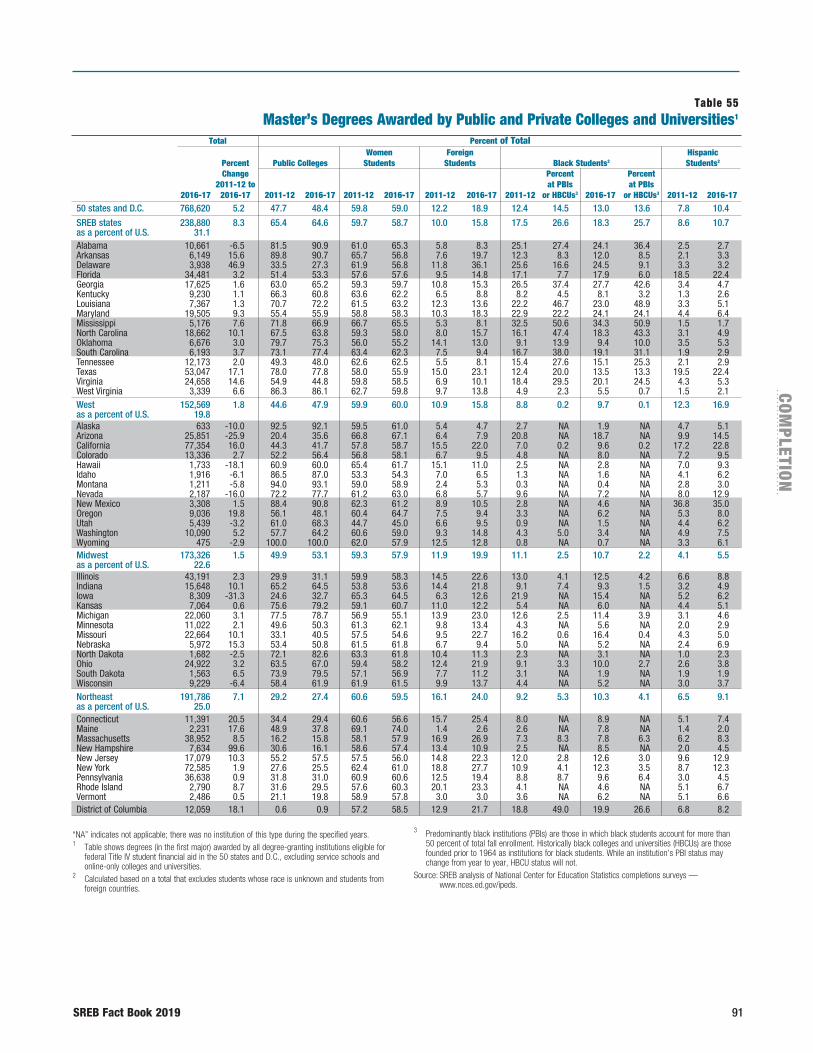
SREB Fact Book 2019 91
COM
PLETION
Table 55Master’s Degrees Awarded by Public and Private Colleges and Universities1
Total Percent of Total Women Foreign Hispanic Percent Public Colleges Students Students Black Students2 Students2
Change Percent Percent 2011-12 to at PBIs at PBIs 2016-17 2016-17 2011-12 2016-17 2011-12 2016-17 2011-12 2016-17 2011-12 or HBCUs3 2016-17 or HBCUs3 2011-12 2016-17
50 states and D.C. 768,620 5.2 47.7 48.4 59.8 59.0 12.2 18.9 12.4 14.5 13.0 13.6 7.8 10.4
SREB states 238,880 8.3 65.4 64.6 59.7 58.7 10.0 15.8 17.5 26.6 18.3 25.7 8.6 10.7as a percent of U.S. 31.1 Alabama 10,661 -6.5 81.5 90.9 61.0 65.3 5.8 8.3 25.1 27.4 24.1 36.4 2.5 2.7Arkansas 6,149 15.6 89.8 90.7 65.7 56.8 7.6 19.7 12.3 8.3 12.0 8.5 2.1 3.3Delaware 3,938 46.9 33.5 27.3 61.9 56.8 11.8 36.1 25.6 16.6 24.5 9.1 3.3 3.2Florida 34,481 3.2 51.4 53.3 57.6 57.6 9.5 14.8 17.1 7.7 17.9 6.0 18.5 22.4Georgia 17,625 1.6 63.0 65.2 59.3 59.7 10.8 15.3 26.5 37.4 27.7 42.6 3.4 4.7Kentucky 9,230 1.1 66.3 60.8 63.6 62.2 6.5 8.8 8.2 4.5 8.1 3.2 1.3 2.6Louisiana 7,367 1.3 70.7 72.2 61.5 63.2 12.3 13.6 22.2 46.7 23.0 48.9 3.3 5.1Maryland 19,505 9.3 55.4 55.9 58.8 58.3 10.3 18.3 22.9 22.2 24.1 24.1 4.4 6.4Mississippi 5,176 7.6 71.8 66.9 66.7 65.5 5.3 8.1 32.5 50.6 34.3 50.9 1.5 1.7North Carolina 18,662 10.1 67.5 63.8 59.3 58.0 8.0 15.7 16.1 47.4 18.3 43.3 3.1 4.9Oklahoma 6,676 3.0 79.7 75.3 56.0 55.2 14.1 13.0 9.1 13.9 9.4 10.0 3.5 5.3South Carolina 6,193 3.7 73.1 77.4 63.4 62.3 7.5 9.4 16.7 38.0 19.1 31.1 1.9 2.9Tennessee 12,173 2.0 49.3 48.0 62.6 62.5 5.5 8.1 15.4 27.6 15.1 25.3 2.1 2.9Texas 53,047 17.1 78.0 77.8 58.0 55.9 15.0 23.1 12.4 20.0 13.5 13.3 19.5 22.4Virginia 24,658 14.6 54.9 44.8 59.8 58.5 6.9 10.1 18.4 29.5 20.1 24.5 4.3 5.3West Virginia 3,339 6.6 86.3 86.1 62.7 59.8 9.7 13.8 4.9 2.3 5.5 0.7 1.5 2.1West 152,569 1.8 44.6 47.9 59.9 60.0 10.9 15.8 8.8 0.2 9.7 0.1 12.3 16.9as a percent of U.S. 19.8 Alaska 633 -10.0 92.5 92.1 59.5 61.0 5.4 4.7 2.7 NA 1.9 NA 4.7 5.1Arizona 25,851 -25.9 20.4 35.6 66.8 67.1 6.4 7.9 20.8 NA 18.7 NA 9.9 14.5California 77,354 16.0 44.3 41.7 57.8 58.7 15.5 22.0 7.0 0.2 9.6 0.2 17.2 22.8Colorado 13,336 2.7 52.2 56.4 56.8 58.1 6.7 9.5 4.8 NA 8.0 NA 7.2 9.5Hawaii 1,733 -18.1 60.9 60.0 65.4 61.7 15.1 11.0 2.5 NA 2.8 NA 7.0 9.3Idaho 1,916 -6.1 86.5 87.0 53.3 54.3 7.0 6.5 1.3 NA 1.6 NA 4.1 6.2Montana 1,211 -5.8 94.0 93.1 59.0 58.9 2.4 5.3 0.3 NA 0.4 NA 2.8 3.0Nevada 2,187 -16.0 72.2 77.7 61.2 63.0 6.8 5.7 9.6 NA 7.2 NA 8.0 12.9New Mexico 3,308 1.5 88.4 90.8 62.3 61.2 8.9 10.5 2.8 NA 4.6 NA 36.8 35.0Oregon 9,036 19.8 56.1 48.1 60.4 64.7 7.5 9.4 3.3 NA 6.2 NA 5.3 8.0Utah 5,439 -3.2 61.0 68.3 44.7 45.0 6.6 9.5 0.9 NA 1.5 NA 4.4 6.2Washington 10,090 5.2 57.7 64.2 60.6 59.0 9.3 14.8 4.3 5.0 3.4 NA 4.9 7.5Wyoming 475 -2.9 100.0 100.0 62.0 57.9 12.5 12.8 0.8 NA 0.7 NA 3.3 6.1Midwest 173,326 1.5 49.9 53.1 59.3 57.9 11.9 19.9 11.1 2.5 10.7 2.2 4.1 5.5as a percent of U.S. 22.6 Illinois 43,191 2.3 29.9 31.1 59.9 58.3 14.5 22.6 13.0 4.1 12.5 4.2 6.6 8.8Indiana 15,648 10.1 65.2 64.5 53.8 53.6 14.4 21.8 9.1 7.4 9.3 1.5 3.2 4.9Iowa 8,309 -31.3 24.6 32.7 65.3 64.5 6.3 12.6 21.9 NA 15.4 NA 5.2 6.2Kansas 7,064 0.6 75.6 79.2 59.1 60.7 11.0 12.2 5.4 NA 6.0 NA 4.4 5.1Michigan 22,060 3.1 77.5 78.7 56.9 55.1 13.9 23.0 12.6 2.5 11.4 3.9 3.1 4.6Minnesota 11,022 2.1 49.6 50.3 61.3 62.1 9.8 13.4 4.3 NA 5.6 NA 2.0 2.9Missouri 22,664 10.1 33.1 40.5 57.5 54.6 9.5 22.7 16.2 0.6 16.4 0.4 4.3 5.0Nebraska 5,972 15.3 53.4 50.8 61.5 61.8 6.7 9.4 5.0 NA 5.2 NA 2.4 6.9North Dakota 1,682 -2.5 72.1 82.6 63.3 61.8 10.4 11.3 2.3 NA 3.1 NA 1.0 2.3Ohio 24,922 3.2 63.5 67.0 59.4 58.2 12.4 21.9 9.1 3.3 10.0 2.7 2.6 3.8South Dakota 1,563 6.5 73.9 79.5 57.1 56.9 7.7 11.2 3.1 NA 1.9 NA 1.9 1.9Wisconsin 9,229 -6.4 58.4 61.9 61.9 61.5 9.9 13.7 4.4 NA 5.2 NA 3.0 3.7Northeast 191,786 7.1 29.2 27.4 60.6 59.5 16.1 24.0 9.2 5.3 10.3 4.1 6.5 9.1as a percent of U.S. 25.0 Connecticut 11,391 20.5 34.4 29.4 60.6 56.6 15.7 25.4 8.0 NA 8.9 NA 5.1 7.4Maine 2,231 17.6 48.9 37.8 69.1 74.0 1.4 2.6 2.6 NA 7.8 NA 1.4 2.0Massachusetts 38,952 8.5 16.2 15.8 58.1 57.9 16.9 26.9 7.3 8.3 7.8 6.3 6.2 8.3New Hampshire 7,634 99.6 30.6 16.1 58.6 57.4 13.4 10.9 2.5 NA 8.5 NA 2.0 4.5New Jersey 17,079 10.3 55.2 57.5 57.5 56.0 14.8 22.3 12.0 2.8 12.6 3.0 9.6 12.9New York 72,585 1.9 27.6 25.5 62.4 61.0 18.8 27.7 10.9 4.1 12.3 3.5 8.7 12.3Pennsylvania 36,638 0.9 31.8 31.0 60.9 60.6 12.5 19.4 8.8 8.7 9.6 6.4 3.0 4.5Rhode Island 2,790 8.7 31.6 29.5 57.6 60.3 20.1 23.3 4.1 NA 4.6 NA 5.1 6.7Vermont 2,486 0.5 21.1 19.8 58.9 57.8 3.0 3.0 3.6 NA 6.2 NA 5.1 6.6District of Columbia 12,059 18.1 0.6 0.9 57.2 58.5 12.9 21.7 18.8 49.0 19.9 26.6 6.8 8.2
“NA” indicates not applicable; there was no institution of this type during the specified years.1 Table shows degrees (in the first major) awarded by all degree-granting institutions eligible for
federal Title IV student financial aid in the 50 states and D.C., excluding service schools and online-only colleges and universities.
2 Calculated based on a total that excludes students whose race is unknown and students from foreign countries.
3 Predominantly black institutions (PBIs) are those in which black students account for more than 50 percent of total fall enrollment. Historically black colleges and universities (HBCUs) are those founded prior to 1964 as institutions for black students. While an institution’s PBI status may change from year to year, HBCU status will not.
Source: SREB analysis of National Center for Education Statistics completions surveys — www.nces.ed.gov/ipeds.
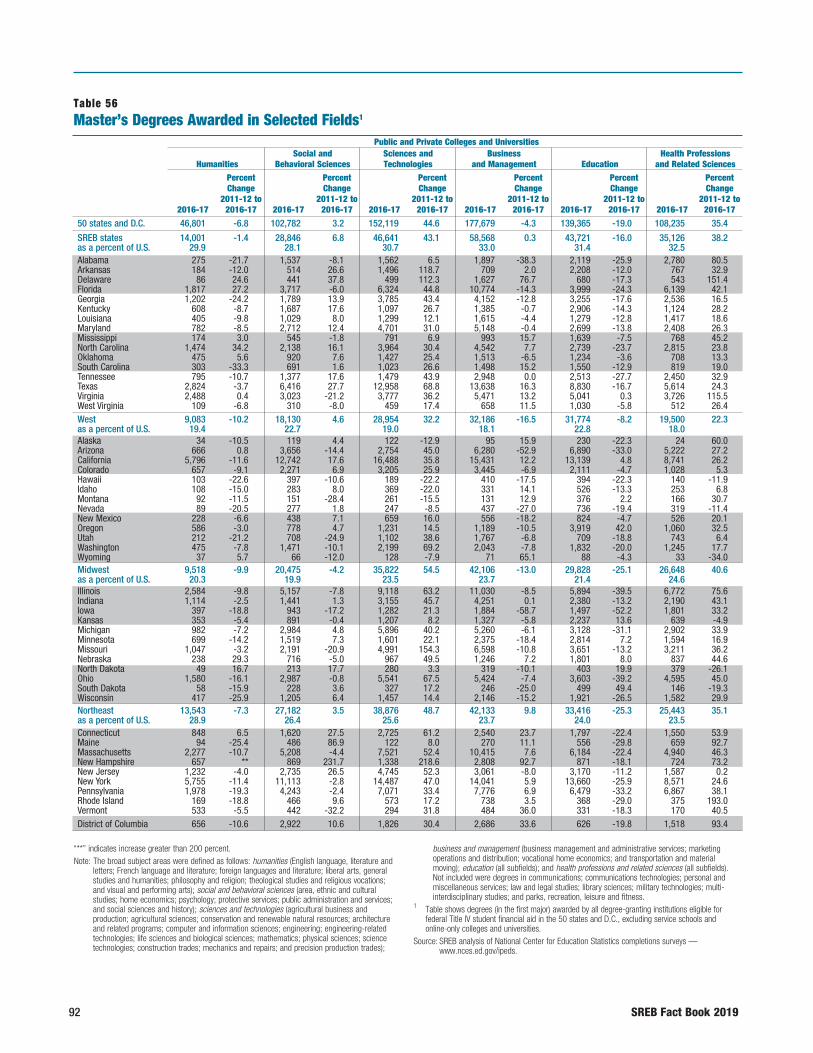
92 SREB Fact Book 2019
Table 56Master’s Degrees Awarded in Selected Fields1
Public and Private Colleges and Universities Social and Sciences and Business Health Professions Humanities Behavioral Sciences Technologies and Management Education and Related Sciences
Percent Percent Percent Percent Percent Percent Change Change Change Change Change Change 2011-12 to 2011-12 to 2011-12 to 2011-12 to 2011-12 to 2011-12 to 2016-17 2016-17 2016-17 2016-17 2016-17 2016-17 2016-17 2016-17 2016-17 2016-17 2016-17 2016-17
50 states and D.C. 46,801 -6.8 102,782 3.2 152,119 44.6 177,679 -4.3 139,365 -19.0 108,235 35.4
SREB states 14,001 -1.4 28,846 6.8 46,641 43.1 58,568 0.3 43,721 -16.0 35,126 38.2as a percent of U.S. 29.9 28.1 30.7 33.0 31.4 32.5 Alabama 275 -21.7 1,537 -8.1 1,562 6.5 1,897 -38.3 2,119 -25.9 2,780 80.5Arkansas 184 -12.0 514 26.6 1,496 118.7 709 2.0 2,208 -12.0 767 32.9Delaware 86 24.6 441 37.8 499 112.3 1,627 76.7 680 -17.3 543 151.4Florida 1,817 27.2 3,717 -6.0 6,324 44.8 10,774 -14.3 3,999 -24.3 6,139 42.1Georgia 1,202 -24.2 1,789 13.9 3,785 43.4 4,152 -12.8 3,255 -17.6 2,536 16.5Kentucky 608 -8.7 1,687 17.6 1,097 26.7 1,385 -0.7 2,906 -14.3 1,124 28.2Louisiana 405 -9.8 1,029 8.0 1,299 12.1 1,615 -4.4 1,279 -12.8 1,417 18.6Maryland 782 -8.5 2,712 12.4 4,701 31.0 5,148 -0.4 2,699 -13.8 2,408 26.3Mississippi 174 3.0 545 -1.8 791 6.9 993 15.7 1,639 -7.5 768 45.2North Carolina 1,474 34.2 2,138 16.1 3,964 30.4 4,542 7.7 2,739 -23.7 2,815 23.8Oklahoma 475 5.6 920 7.6 1,427 25.4 1,513 -6.5 1,234 -3.6 708 13.3South Carolina 303 -33.3 691 1.6 1,023 26.6 1,498 15.2 1,550 -12.9 819 19.0Tennessee 795 -10.7 1,377 17.6 1,479 43.9 2,948 0.0 2,513 -27.7 2,450 32.9Texas 2,824 -3.7 6,416 27.7 12,958 68.8 13,638 16.3 8,830 -16.7 5,614 24.3Virginia 2,488 0.4 3,023 -21.2 3,777 36.2 5,471 13.2 5,041 0.3 3,726 115.5West Virginia 109 -6.8 310 -8.0 459 17.4 658 11.5 1,030 -5.8 512 26.4West 9,083 -10.2 18,130 4.6 28,954 32.2 32,186 -16.5 31,774 -8.2 19,500 22.3as a percent of U.S. 19.4 22.7 19.0 18.1 22.8 18.0 Alaska 34 -10.5 119 4.4 122 -12.9 95 15.9 230 -22.3 24 60.0Arizona 666 0.8 3,656 -14.4 2,754 45.0 6,280 -52.9 6,890 -33.0 5,222 27.2California 5,796 -11.6 12,742 17.6 16,488 35.8 15,431 12.2 13,139 4.8 8,741 26.2Colorado 657 -9.1 2,271 6.9 3,205 25.9 3,445 -6.9 2,111 -4.7 1,028 5.3Hawaii 103 -22.6 397 -10.6 189 -22.2 410 -17.5 394 -22.3 140 -11.9Idaho 108 -15.0 283 8.0 369 -22.0 331 14.1 526 -13.3 253 6.8Montana 92 -11.5 151 -28.4 261 -15.5 131 12.9 376 2.2 166 30.7Nevada 89 -20.5 277 1.8 247 -8.5 437 -27.0 736 -19.4 319 -11.4New Mexico 228 -6.6 438 7.1 659 16.0 556 -18.2 824 -4.7 526 20.1Oregon 586 -3.0 778 4.7 1,231 14.5 1,189 -10.5 3,919 42.0 1,060 32.5Utah 212 -21.2 708 -24.9 1,102 38.6 1,767 -6.8 709 -18.8 743 6.4Washington 475 -7.8 1,471 -10.1 2,199 69.2 2,043 -7.8 1,832 -20.0 1,245 17.7Wyoming 37 5.7 66 -12.0 128 -7.9 71 65.1 88 -4.3 33 -34.0Midwest 9,518 -9.9 20,475 -4.2 35,822 54.5 42,106 -13.0 29,828 -25.1 26,648 40.6as a percent of U.S. 20.3 19.9 23.5 23.7 21.4 24.6 Illinois 2,584 -9.8 5,157 -7.8 9,118 63.2 11,030 -8.5 5,894 -39.5 6,772 75.6Indiana 1,114 -2.5 1,441 1.3 3,155 45.7 4,251 0.1 2,380 -13.2 2,190 43.1Iowa 397 -18.8 943 -17.2 1,282 21.3 1,884 -58.7 1,497 -52.2 1,801 33.2Kansas 353 -5.4 891 -0.4 1,207 8.2 1,327 -5.8 2,237 13.6 639 -4.9Michigan 982 -7.2 2,984 4.8 5,896 40.2 5,260 -6.1 3,128 -31.1 2,902 33.9Minnesota 699 -14.2 1,519 7.3 1,601 22.1 2,375 -18.4 2,814 7.2 1,594 16.9Missouri 1,047 -3.2 2,191 -20.9 4,991 154.3 6,598 -10.8 3,651 -13.2 3,211 36.2Nebraska 238 29.3 716 -5.0 967 49.5 1,246 7.2 1,801 8.0 837 44.6North Dakota 49 16.7 213 17.7 280 3.3 319 -10.1 403 19.9 379 -26.1Ohio 1,580 -16.1 2,987 -0.8 5,541 67.5 5,424 -7.4 3,603 -39.2 4,595 45.0South Dakota 58 -15.9 228 3.6 327 17.2 246 -25.0 499 49.4 146 -19.3Wisconsin 417 -25.9 1,205 6.4 1,457 14.4 2,146 -15.2 1,921 -26.5 1,582 29.9Northeast 13,543 -7.3 27,182 3.5 38,876 48.7 42,133 9.8 33,416 -25.3 25,443 35.1as a percent of U.S. 28.9 26.4 25.6 23.7 24.0 23.5 Connecticut 848 6.5 1,620 27.5 2,725 61.2 2,540 23.7 1,797 -22.4 1,550 53.9Maine 94 -25.4 486 86.9 122 8.0 270 11.1 556 -29.8 659 92.7Massachusetts 2,277 -10.7 5,208 -4.4 7,521 52.4 10,415 7.6 6,184 -22.4 4,940 46.3New Hampshire 657 ** 869 231.7 1,338 218.6 2,808 92.7 871 -18.1 724 73.2New Jersey 1,232 -4.0 2,735 26.5 4,745 52.3 3,061 -8.0 3,170 -11.2 1,587 0.2New York 5,755 -11.4 11,113 -2.8 14,487 47.0 14,041 5.9 13,660 -25.9 8,571 24.6Pennsylvania 1,978 -19.3 4,243 -2.4 7,071 33.4 7,776 6.9 6,479 -33.2 6,867 38.1Rhode Island 169 -18.8 466 9.6 573 17.2 738 3.5 368 -29.0 375 193.0Vermont 533 -5.5 442 -32.2 294 31.8 484 36.0 331 -18.3 170 40.5District of Columbia 656 -10.6 2,922 10.6 1,826 30.4 2,686 33.6 626 -19.8 1,518 93.4
“**” indicates increase greater than 200 percent.Note: The broad subject areas were defined as follows: humanities (English language, literature and
letters; French language and literature; foreign languages and literature; liberal arts, general studies and humanities; philosophy and religion; theological studies and religious vocations; and visual and performing arts); social and behavioral sciences (area, ethnic and cultural studies; home economics; psychology; protective services; public administration and services; and social sciences and history); sciences and technologies (agricultural business and production; agricultural sciences; conservation and renewable natural resources; architecture and related programs; computer and information sciences; engineering; engineering-related technologies; life sciences and biological sciences; mathematics; physical sciences; science technologies; construction trades; mechanics and repairs; and precision production trades);
business and management (business management and administrative services; marketing operations and distribution; vocational home economics; and transportation and material moving); education (all subfields); and health professions and related sciences (all subfields). Not included were degrees in communications; communications technologies; personal and miscellaneous services; law and legal studies; library sciences; military technologies; multi- interdisciplinary studies; and parks, recreation, leisure and fitness.
1 Table shows degrees (in the first major) awarded by all degree-granting institutions eligible for federal Title IV student financial aid in the 50 states and D.C., excluding service schools and online-only colleges and universities.
Source: SREB analysis of National Center for Education Statistics completions surveys — www.nces.ed.gov/ipeds.
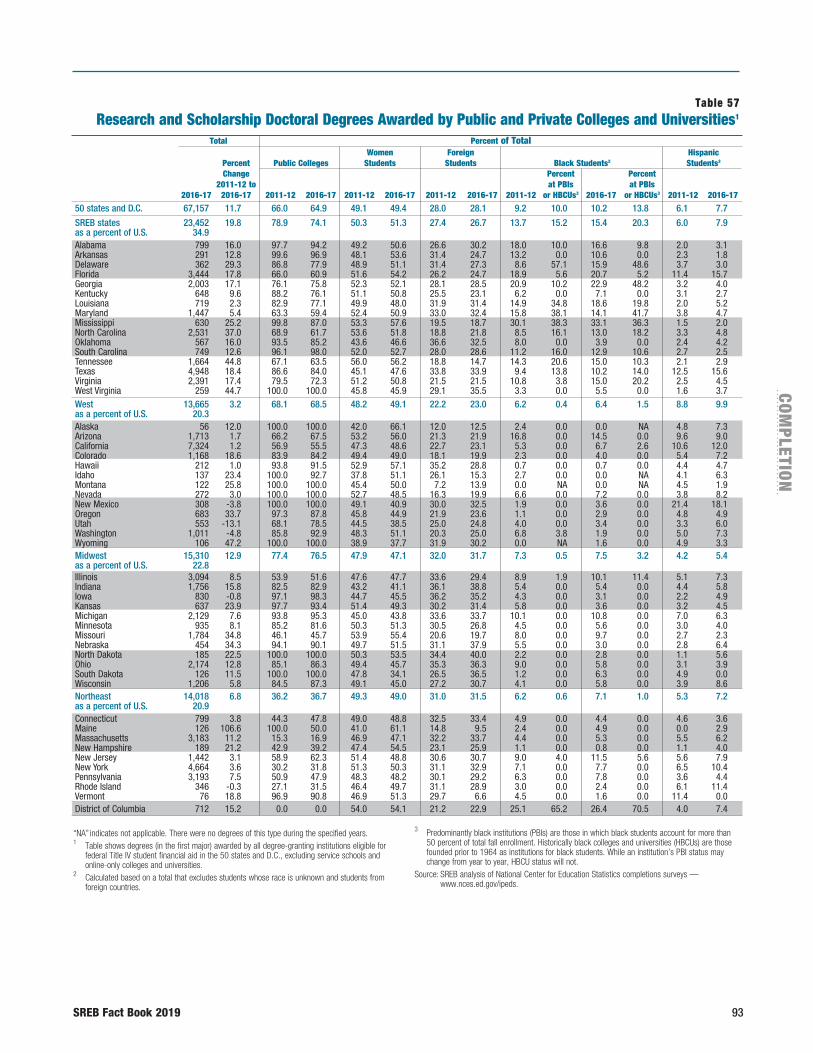
SREB Fact Book 2019 93
COM
PLETION
Table 57Research and Scholarship Doctoral Degrees Awarded by Public and Private Colleges and Universities1
Total Percent of Total Women Foreign Hispanic Percent Public Colleges Students Students Black Students2 Students2
Change Percent Percent 2011-12 to at PBIs at PBIs 2016-17 2016-17 2011-12 2016-17 2011-12 2016-17 2011-12 2016-17 2011-12 or HBCUs3 2016-17 or HBCUs3 2011-12 2016-17
50 states and D.C. 67,157 11.7 66.0 64.9 49.1 49.4 28.0 28.1 9.2 10.0 10.2 13.8 6.1 7.7
SREB states 23,452 19.8 78.9 74.1 50.3 51.3 27.4 26.7 13.7 15.2 15.4 20.3 6.0 7.9as a percent of U.S. 34.9 Alabama 799 16.0 97.7 94.2 49.2 50.6 26.6 30.2 18.0 10.0 16.6 9.8 2.0 3.1Arkansas 291 12.8 99.6 96.9 48.1 53.6 31.4 24.7 13.2 0.0 10.6 0.0 2.3 1.8Delaware 362 29.3 86.8 77.9 48.9 51.1 31.4 27.3 8.6 57.1 15.9 48.6 3.7 3.0Florida 3,444 17.8 66.0 60.9 51.6 54.2 26.2 24.7 18.9 5.6 20.7 5.2 11.4 15.7Georgia 2,003 17.1 76.1 75.8 52.3 52.1 28.1 28.5 20.9 10.2 22.9 48.2 3.2 4.0Kentucky 648 9.6 88.2 76.1 51.1 50.8 25.5 23.1 6.2 0.0 7.1 0.0 3.1 2.7Louisiana 719 2.3 82.9 77.1 49.9 48.0 31.9 31.4 14.9 34.8 18.6 19.8 2.0 5.2Maryland 1,447 5.4 63.3 59.4 52.4 50.9 33.0 32.4 15.8 38.1 14.1 41.7 3.8 4.7Mississippi 630 25.2 99.8 87.0 53.3 57.6 19.5 18.7 30.1 38.3 33.1 36.3 1.5 2.0North Carolina 2,531 37.0 68.9 61.7 53.6 51.8 18.8 21.8 8.5 16.1 13.0 18.2 3.3 4.8Oklahoma 567 16.0 93.5 85.2 43.6 46.6 36.6 32.5 8.0 0.0 3.9 0.0 2.4 4.2South Carolina 749 12.6 96.1 98.0 52.0 52.7 28.0 28.6 11.2 16.0 12.9 10.6 2.7 2.5Tennessee 1,664 44.8 67.1 63.5 56.0 56.2 18.8 14.7 14.3 20.6 15.0 10.3 2.1 2.9Texas 4,948 18.4 86.6 84.0 45.1 47.6 33.8 33.9 9.4 13.8 10.2 14.0 12.5 15.6Virginia 2,391 17.4 79.5 72.3 51.2 50.8 21.5 21.5 10.8 3.8 15.0 20.2 2.5 4.5West Virginia 259 44.7 100.0 100.0 45.8 45.9 29.1 35.5 3.3 0.0 5.5 0.0 1.6 3.7West 13,665 3.2 68.1 68.5 48.2 49.1 22.2 23.0 6.2 0.4 6.4 1.5 8.8 9.9as a percent of U.S. 20.3 Alaska 56 12.0 100.0 100.0 42.0 66.1 12.0 12.5 2.4 0.0 0.0 NA 4.8 7.3Arizona 1,713 1.7 66.2 67.5 53.2 56.0 21.3 21.9 16.8 0.0 14.5 0.0 9.6 9.0California 7,324 1.2 56.9 55.5 47.3 48.6 22.7 23.1 5.3 0.0 6.7 2.6 10.6 12.0Colorado 1,168 18.6 83.9 84.2 49.4 49.0 18.1 19.9 2.3 0.0 4.0 0.0 5.4 7.2Hawaii 212 1.0 93.8 91.5 52.9 57.1 35.2 28.8 0.7 0.0 0.7 0.0 4.4 4.7Idaho 137 23.4 100.0 92.7 37.8 51.1 26.1 15.3 2.7 0.0 0.0 NA 4.1 6.3Montana 122 25.8 100.0 100.0 45.4 50.0 7.2 13.9 0.0 NA 0.0 NA 4.5 1.9Nevada 272 3.0 100.0 100.0 52.7 48.5 16.3 19.9 6.6 0.0 7.2 0.0 3.8 8.2New Mexico 308 -3.8 100.0 100.0 49.1 40.9 30.0 32.5 1.9 0.0 3.6 0.0 21.4 18.1Oregon 683 33.7 97.3 87.8 45.8 44.9 21.9 23.6 1.1 0.0 2.9 0.0 4.8 4.9Utah 553 -13.1 68.1 78.5 44.5 38.5 25.0 24.8 4.0 0.0 3.4 0.0 3.3 6.0Washington 1,011 -4.8 85.8 92.9 48.3 51.1 20.3 25.0 6.8 3.8 1.9 0.0 5.0 7.3Wyoming 106 47.2 100.0 100.0 38.9 37.7 31.9 30.2 0.0 NA 1.6 0.0 4.9 3.3Midwest 15,310 12.9 77.4 76.5 47.9 47.1 32.0 31.7 7.3 0.5 7.5 3.2 4.2 5.4as a percent of U.S. 22.8 Illinois 3,094 8.5 53.9 51.6 47.6 47.7 33.6 29.4 8.9 1.9 10.1 11.4 5.1 7.3Indiana 1,756 15.8 82.5 82.9 43.2 41.1 36.1 38.8 5.4 0.0 5.4 0.0 4.4 5.8Iowa 830 -0.8 97.1 98.3 44.7 45.5 36.2 35.2 4.3 0.0 3.1 0.0 2.2 4.9Kansas 637 23.9 97.7 93.4 51.4 49.3 30.2 31.4 5.8 0.0 3.6 0.0 3.2 4.5Michigan 2,129 7.6 93.8 95.3 45.0 43.8 33.6 33.7 10.1 0.0 10.8 0.0 7.0 6.3Minnesota 935 8.1 85.2 81.6 50.3 51.3 30.5 26.8 4.5 0.0 5.6 0.0 3.0 4.0Missouri 1,784 34.8 46.1 45.7 53.9 55.4 20.6 19.7 8.0 0.0 9.7 0.0 2.7 2.3Nebraska 454 34.3 94.1 90.1 49.7 51.5 31.1 37.9 5.5 0.0 3.0 0.0 2.8 6.4North Dakota 185 22.5 100.0 100.0 50.3 53.5 34.4 40.0 2.2 0.0 2.8 0.0 1.1 5.6Ohio 2,174 12.8 85.1 86.3 49.4 45.7 35.3 36.3 9.0 0.0 5.8 0.0 3.1 3.9South Dakota 126 11.5 100.0 100.0 47.8 34.1 26.5 36.5 1.2 0.0 6.3 0.0 4.9 0.0Wisconsin 1,206 5.8 84.5 87.3 49.1 45.0 27.2 30.7 4.1 0.0 5.8 0.0 3.9 8.6Northeast 14,018 6.8 36.2 36.7 49.3 49.0 31.0 31.5 6.2 0.6 7.1 1.0 5.3 7.2as a percent of U.S. 20.9 Connecticut 799 3.8 44.3 47.8 49.0 48.8 32.5 33.4 4.9 0.0 4.4 0.0 4.6 3.6Maine 126 106.6 100.0 50.0 41.0 61.1 14.8 9.5 2.4 0.0 4.9 0.0 0.0 2.9Massachusetts 3,183 11.2 15.3 16.9 46.9 47.1 32.2 33.7 4.4 0.0 5.3 0.0 5.5 6.2New Hampshire 189 21.2 42.9 39.2 47.4 54.5 23.1 25.9 1.1 0.0 0.8 0.0 1.1 4.0New Jersey 1,442 3.1 58.9 62.3 51.4 48.8 30.6 30.7 9.0 4.0 11.5 5.6 5.6 7.9New York 4,664 3.6 30.2 31.8 51.3 50.3 31.1 32.9 7.1 0.0 7.7 0.0 6.5 10.4Pennsylvania 3,193 7.5 50.9 47.9 48.3 48.2 30.1 29.2 6.3 0.0 7.8 0.0 3.6 4.4Rhode Island 346 -0.3 27.1 31.5 46.4 49.7 31.1 28.9 3.0 0.0 2.4 0.0 6.1 11.4Vermont 76 18.8 96.9 90.8 46.9 51.3 29.7 6.6 4.5 0.0 1.6 0.0 11.4 0.0District of Columbia 712 15.2 0.0 0.0 54.0 54.1 21.2 22.9 25.1 65.2 26.4 70.5 4.0 7.4
“NA” indicates not applicable. There were no degrees of this type during the specified years.1 Table shows degrees (in the first major) awarded by all degree-granting institutions eligible for
federal Title IV student financial aid in the 50 states and D.C., excluding service schools and online-only colleges and universities.
2 Calculated based on a total that excludes students whose race is unknown and students from foreign countries.
3 Predominantly black institutions (PBIs) are those in which black students account for more than 50 percent of total fall enrollment. Historically black colleges and universities (HBCUs) are those founded prior to 1964 as institutions for black students. While an institution’s PBI status may change from year to year, HBCU status will not.
Source: SREB analysis of National Center for Education Statistics completions surveys — www.nces.ed.gov/ipeds.
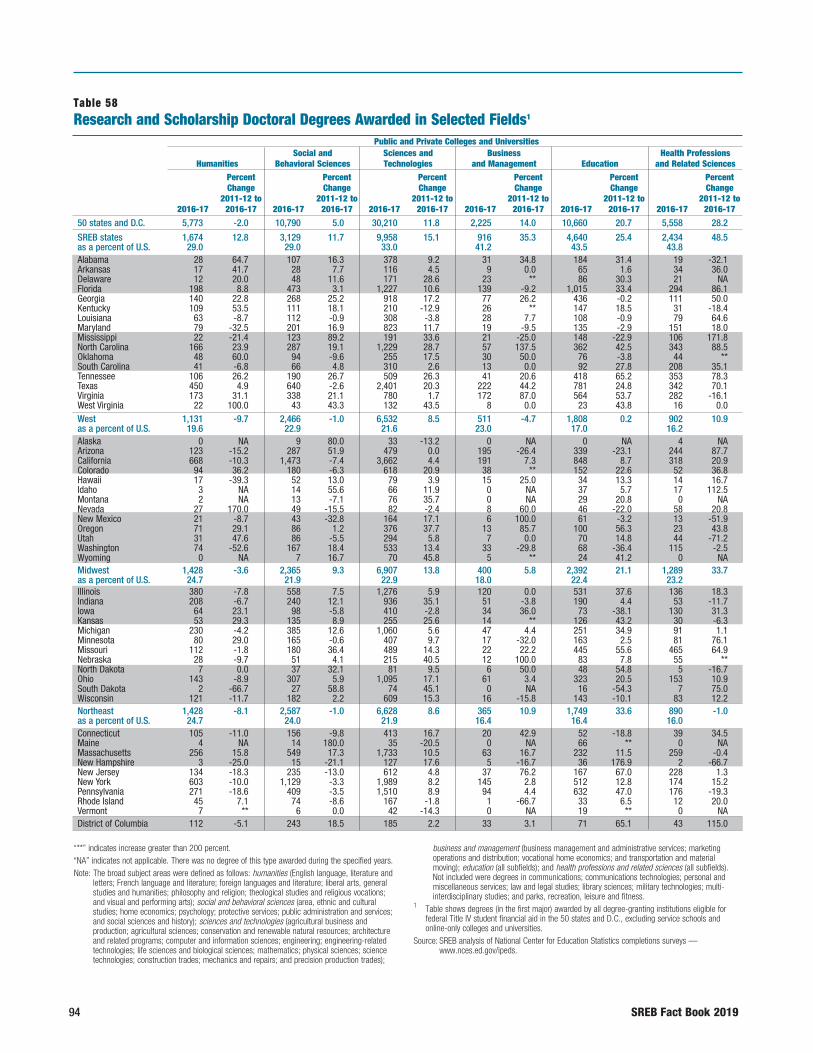
94 SREB Fact Book 2019
Table 58Research and Scholarship Doctoral Degrees Awarded in Selected Fields1
Public and Private Colleges and Universities Social and Sciences and Business Health Professions Humanities Behavioral Sciences Technologies and Management Education and Related Sciences
Percent Percent Percent Percent Percent Percent Change Change Change Change Change Change 2011-12 to 2011-12 to 2011-12 to 2011-12 to 2011-12 to 2011-12 to 2016-17 2016-17 2016-17 2016-17 2016-17 2016-17 2016-17 2016-17 2016-17 2016-17 2016-17 2016-17
50 states and D.C. 5,773 -2.0 10,790 5.0 30,210 11.8 2,225 14.0 10,660 20.7 5,558 28.2
SREB states 1,674 12.8 3,129 11.7 9,958 15.1 916 35.3 4,640 25.4 2,434 48.5as a percent of U.S. 29.0 29.0 33.0 41.2 43.5 43.8 Alabama 28 64.7 107 16.3 378 9.2 31 34.8 184 31.4 19 -32.1Arkansas 17 41.7 28 7.7 116 4.5 9 0.0 65 1.6 34 36.0Delaware 12 20.0 48 11.6 171 28.6 23 ** 86 30.3 21 NAFlorida 198 8.8 473 3.1 1,227 10.6 139 -9.2 1,015 33.4 294 86.1Georgia 140 22.8 268 25.2 918 17.2 77 26.2 436 -0.2 111 50.0Kentucky 109 53.5 111 18.1 210 -12.9 26 ** 147 18.5 31 -18.4Louisiana 63 -8.7 112 -0.9 308 -3.8 28 7.7 108 -0.9 79 64.6Maryland 79 -32.5 201 16.9 823 11.7 19 -9.5 135 -2.9 151 18.0Mississippi 22 -21.4 123 89.2 191 33.6 21 -25.0 148 -22.9 106 171.8North Carolina 166 23.9 287 19.1 1,229 28.7 57 137.5 362 42.5 343 88.5Oklahoma 48 60.0 94 -9.6 255 17.5 30 50.0 76 -3.8 44 **South Carolina 41 -6.8 66 4.8 310 2.6 13 0.0 92 27.8 208 35.1Tennessee 106 26.2 190 26.7 509 26.3 41 20.6 418 65.2 353 78.3Texas 450 4.9 640 -2.6 2,401 20.3 222 44.2 781 24.8 342 70.1Virginia 173 31.1 338 21.1 780 1.7 172 87.0 564 53.7 282 -16.1West Virginia 22 100.0 43 43.3 132 43.5 8 0.0 23 43.8 16 0.0West 1,131 -9.7 2,466 -1.0 6,532 8.5 511 -4.7 1,808 0.2 902 10.9as a percent of U.S. 19.6 22.9 21.6 23.0 17.0 16.2 Alaska 0 NA 9 80.0 33 -13.2 0 NA 0 NA 4 NAArizona 123 -15.2 287 51.9 479 0.0 195 -26.4 339 -23.1 244 87.7California 668 -10.3 1,473 -7.4 3,662 4.4 191 7.3 848 8.7 318 20.9Colorado 94 36.2 180 -6.3 618 20.9 38 ** 152 22.6 52 36.8Hawaii 17 -39.3 52 13.0 79 3.9 15 25.0 34 13.3 14 16.7Idaho 3 NA 14 55.6 66 11.9 0 NA 37 5.7 17 112.5Montana 2 NA 13 -7.1 76 35.7 0 NA 29 20.8 0 NANevada 27 170.0 49 -15.5 82 -2.4 8 60.0 46 -22.0 58 20.8New Mexico 21 -8.7 43 -32.8 164 17.1 6 100.0 61 -3.2 13 -51.9Oregon 71 29.1 86 1.2 376 37.7 13 85.7 100 56.3 23 43.8Utah 31 47.6 86 -5.5 294 5.8 7 0.0 70 14.8 44 -71.2Washington 74 -52.6 167 18.4 533 13.4 33 -29.8 68 -36.4 115 -2.5Wyoming 0 NA 7 16.7 70 45.8 5 ** 24 41.2 0 NAMidwest 1,428 -3.6 2,365 9.3 6,907 13.8 400 5.8 2,392 21.1 1,289 33.7as a percent of U.S. 24.7 21.9 22.9 18.0 22.4 23.2 Illinois 380 -7.8 558 7.5 1,276 5.9 120 0.0 531 37.6 136 18.3Indiana 208 -6.7 240 12.1 936 35.1 51 -3.8 190 4.4 53 -11.7Iowa 64 23.1 98 -5.8 410 -2.8 34 36.0 73 -38.1 130 31.3Kansas 53 29.3 135 8.9 255 25.6 14 ** 126 43.2 30 -6.3Michigan 230 -4.2 385 12.6 1,060 5.6 47 4.4 251 34.9 91 1.1Minnesota 80 29.0 165 -0.6 407 9.7 17 -32.0 163 2.5 81 76.1Missouri 112 -1.8 180 36.4 489 14.3 22 22.2 445 55.6 465 64.9Nebraska 28 -9.7 51 4.1 215 40.5 12 100.0 83 7.8 55 **North Dakota 7 0.0 37 32.1 81 9.5 6 50.0 48 54.8 5 -16.7Ohio 143 -8.9 307 5.9 1,095 17.1 61 3.4 323 20.5 153 10.9South Dakota 2 -66.7 27 58.8 74 45.1 0 NA 16 -54.3 7 75.0Wisconsin 121 -11.7 182 2.2 609 15.3 16 -15.8 143 -10.1 83 12.2Northeast 1,428 -8.1 2,587 -1.0 6,628 8.6 365 10.9 1,749 33.6 890 -1.0as a percent of U.S. 24.7 24.0 21.9 16.4 16.4 16.0 Connecticut 105 -11.0 156 -9.8 413 16.7 20 42.9 52 -18.8 39 34.5Maine 4 NA 14 180.0 35 -20.5 0 NA 66 ** 0 NAMassachusetts 256 15.8 549 17.3 1,733 10.5 63 16.7 232 11.5 259 -0.4New Hampshire 3 -25.0 15 -21.1 127 17.6 5 -16.7 36 176.9 2 -66.7New Jersey 134 -18.3 235 -13.0 612 4.8 37 76.2 167 67.0 228 1.3New York 603 -10.0 1,129 -3.3 1,989 8.2 145 2.8 512 12.8 174 15.2Pennsylvania 271 -18.6 409 -3.5 1,510 8.9 94 4.4 632 47.0 176 -19.3Rhode Island 45 7.1 74 -8.6 167 -1.8 1 -66.7 33 6.5 12 20.0Vermont 7 ** 6 0.0 42 -14.3 0 NA 19 ** 0 NADistrict of Columbia 112 -5.1 243 18.5 185 2.2 33 3.1 71 65.1 43 115.0
“**” indicates increase greater than 200 percent.“NA” indicates not applicable. There was no degree of this type awarded during the specified years.Note: The broad subject areas were defined as follows: humanities (English language, literature and
letters; French language and literature; foreign languages and literature; liberal arts, general studies and humanities; philosophy and religion; theological studies and religious vocations; and visual and performing arts); social and behavioral sciences (area, ethnic and cultural studies; home economics; psychology; protective services; public administration and services; and social sciences and history); sciences and technologies (agricultural business and production; agricultural sciences; conservation and renewable natural resources; architecture and related programs; computer and information sciences; engineering; engineering-related technologies; life sciences and biological sciences; mathematics; physical sciences; science technologies; construction trades; mechanics and repairs; and precision production trades);
business and management (business management and administrative services; marketing operations and distribution; vocational home economics; and transportation and material moving); education (all subfields); and health professions and related sciences (all subfields). Not included were degrees in communications; communications technologies; personal and miscellaneous services; law and legal studies; library sciences; military technologies; multi- interdisciplinary studies; and parks, recreation, leisure and fitness.
1 Table shows degrees (in the first major) awarded by all degree-granting institutions eligible for federal Title IV student financial aid in the 50 states and D.C., excluding service schools and online-only colleges and universities.
Source: SREB analysis of National Center for Education Statistics completions surveys — www.nces.ed.gov/ipeds.

SREB Fact Book 2019 95
COM
PLETION
Table 59Professional Practice Doctoral Degrees Awarded by Public and Private Colleges and Universities1
Total Percent of Total Women Foreign Hispanic Percent Public Colleges Students Students Black Students2 Students2
Change Percent Percent 2011-12 to at PBIs at PBIs 2016-17 2016-17 2011-12 2016-17 2011-12 2016-17 2011-12 2016-17 2011-12 or HBCUs3 2016-17 or HBCUs3 2011-12 2016-17
50 states and D.C. 108,332 1.5 41.9 43.7 52.4 55.1 2.3 2.9 6.8 19.1 7.2 44.7 6.2 8.0
SREB states 33,499 0.3 56.0 61.0 51.9 54.8 1.2 1.5 9.6 28.0 10.1 79.0 7.2 9.5as a percent of U.S. 30.9 Alabama 1,723 10.9 68.2 65.9 58.2 60.8 0.5 0.4 13.0 32.8 13.2 79.6 1.7 2.9Arkansas 731 11.6 91.3 88.4 48.5 49.4 0.2 0.5 9.1 0.0 4.6 0.0 2.6 2.9Delaware 56 -81.6 11.1 100.0 43.6 64.3 0.0 0.0 6.0 0.0 0.0 NA 2.0 11.1Florida 5,812 -8.8 38.3 51.1 55.4 57.7 2.3 2.4 9.6 31.5 12.0 50.4 15.0 21.4Georgia 2,822 11.0 40.9 40.8 51.4 55.1 0.8 2.3 11.7 13.8 13.8 163.4 3.1 5.7Kentucky 1,364 4.8 83.8 79.5 49.8 54.8 1.4 1.0 5.4 0.0 4.2 0.0 1.9 2.6Louisiana 1,752 -6.9 53.1 61.6 51.4 53.1 1.3 1.4 14.6 60.3 13.1 139.7 3.8 3.7Maryland 1,391 -3.9 88.0 81.2 55.0 57.3 1.4 2.7 10.6 2.7 16.4 146.3 4.2 5.7Mississippi 791 10.8 76.8 71.7 54.3 51.3 0.0 1.5 9.7 0.0 10.5 0.0 0.9 2.5North Carolina 2,537 0.1 40.5 48.7 52.5 56.2 0.7 1.3 11.5 34.3 12.2 68.5 4.0 4.6Oklahoma 1,140 -8.0 69.6 80.6 46.3 52.7 1.1 1.2 3.3 5.3 4.0 34.1 3.6 4.2South Carolina 1,072 14.2 71.8 70.6 47.8 51.5 0.5 0.7 7.1 0.0 9.6 50.0 1.3 4.1Tennessee 2,299 15.4 49.8 39.4 55.1 54.8 0.8 0.7 13.7 49.2 11.4 63.4 2.5 3.4Texas 6,063 3.0 65.3 71.9 51.6 52.6 1.1 1.2 7.0 30.5 6.8 65.2 14.5 17.0Virginia 2,972 -8.1 46.7 54.1 45.3 53.6 1.4 1.8 10.6 19.0 9.8 51.5 3.3 5.5West Virginia 974 20.7 86.9 85.8 49.3 52.1 0.6 0.9 3.0 0.0 3.3 0.0 1.9 2.4West 19,640 8.3 41.3 40.0 52.9 56.0 2.5 3.0 3.2 0.0 3.6 5.5 8.2 11.4as a percent of U.S. 18.1 Alaska 3 NA NA 0.0 NA 33.3 NA 0.0 NA NA 0.0 NA NA 0.0Arizona 1,697 15.7 45.7 47.3 49.9 54.0 1.8 2.9 3.3 0.0 3.2 0.0 6.9 9.7California 10,724 7.1 27.8 26.2 53.2 56.6 3.3 3.6 3.9 0.0 4.6 7.9 10.1 13.3Colorado 1,452 11.8 64.8 60.1 58.4 58.8 1.8 1.6 3.6 0.0 2.5 0.0 7.7 13.3Hawaii 325 0.6 92.0 88.6 56.3 56.9 2.5 2.8 0.3 0.0 1.3 0.0 2.5 5.4Idaho 235 6.8 100.0 99.6 34.1 48.9 0.9 4.3 1.5 0.0 3.2 0.0 4.4 6.9Montana 367 33.5 100.0 100.0 57.8 63.5 0.0 4.9 1.9 0.0 0.6 0.0 2.2 3.5Nevada 819 19.4 45.0 32.5 45.6 46.0 1.7 0.9 4.6 0.0 3.7 0.0 5.3 6.4New Mexico 343 16.7 100.0 100.0 54.8 54.2 0.0 1.2 3.3 0.0 2.1 0.0 29.7 39.8Oregon 1,417 1.9 36.4 33.0 53.8 56.1 2.3 4.0 1.0 0.0 1.9 0.0 3.0 6.0Utah 643 20.6 72.0 70.5 43.7 49.6 0.6 1.4 0.6 0.0 1.0 0.0 3.8 4.6Washington 1,489 -0.7 51.9 55.8 55.4 58.6 1.7 1.6 1.6 0.0 2.7 0.0 4.2 6.1Wyoming 126 0.8 100.0 100.0 52.0 57.9 0.8 1.6 0.0 NA 1.2 0.0 2.9 4.9Midwest 26,505 0.1 47.6 48.9 51.8 55.0 2.5 2.9 4.9 5.0 5.1 8.5 3.8 4.9as a percent of U.S. 24.5 Illinois 5,662 8.7 27.4 26.6 52.3 57.5 2.1 3.1 5.6 5.0 7.4 27.3 6.4 8.1Indiana 2,147 13.0 67.5 59.2 51.5 55.1 2.7 2.0 5.0 0.0 5.7 0.0 4.3 5.9Iowa 2,003 -5.0 31.1 30.0 48.8 50.1 1.0 0.8 2.3 0.0 2.4 0.0 3.5 5.5Kansas 979 4.4 87.6 88.9 52.7 54.0 1.1 0.8 3.0 0.0 3.2 0.0 4.0 5.3Michigan 3,459 -10.5 55.7 73.5 50.3 52.9 4.7 7.2 7.9 4.0 6.6 0.0 4.0 3.5Minnesota 1,891 -5.7 47.2 52.3 56.0 58.6 2.7 3.2 3.2 0.0 3.1 0.0 2.7 2.8Missouri 3,272 -1.9 25.1 28.3 50.1 52.3 3.2 3.1 3.7 0.0 4.4 0.0 2.5 4.1Nebraska 1,153 9.4 39.3 35.5 53.7 56.5 0.7 1.0 2.3 0.0 3.0 0.0 2.4 4.4North Dakota 334 1.5 88.8 81.7 58.4 60.2 3.6 1.5 0.7 0.0 1.0 0.0 0.7 1.3Ohio 3,814 -5.4 67.8 67.6 50.4 54.0 2.1 2.1 6.4 14.7 6.1 0.9 2.4 3.4South Dakota 269 12.1 100.0 99.3 59.6 55.8 0.0 0.4 0.0 NA 1.5 0.0 0.4 1.1Wisconsin 1,522 5.0 55.1 47.2 56.5 59.0 1.2 1.1 3.6 0.0 3.0 0.0 4.5 4.3Northeast 25,957 0.7 22.8 23.1 53.2 55.1 3.2 4.2 5.9 1.0 6.5 4.3 5.6 6.7as a percent of U.S. 24.0 Connecticut 1,435 21.2 38.9 31.4 52.1 58.8 2.8 2.6 5.1 0.0 7.0 0.0 6.9 6.3Maine 544 68.9 28.6 14.7 55.9 53.3 0.6 1.8 1.3 0.0 5.1 0.0 1.6 2.4Massachusetts 4,798 -4.7 4.7 6.4 55.7 58.5 5.0 6.5 6.3 0.0 7.5 0.0 5.8 7.1New Hampshire 243 -14.1 0.0 25.5 48.1 56.4 4.2 4.1 3.9 0.0 1.4 0.0 2.4 10.3New Jersey 1,690 -2.0 78.5 78.6 48.7 53.4 1.9 3.0 9.5 0.0 9.2 0.0 6.3 9.5New York 9,554 -6.2 15.1 16.1 52.2 52.4 3.7 5.7 6.6 2.4 6.4 8.9 6.7 7.8Pennsylvania 7,059 11.9 30.4 27.6 54.4 56.0 2.0 1.6 4.5 0.0 5.6 4.3 4.0 4.7Rhode Island 358 -10.1 35.2 32.4 52.0 58.4 0.8 2.8 3.1 0.0 6.0 0.0 4.8 10.3Vermont 276 -21.4 41.3 55.4 55.6 54.7 0.9 1.1 1.9 0.0 3.3 0.0 1.9 6.1District of Columbia 2,731 -7.1 3.2 2.6 52.3 54.9 4.1 4.9 21.6 61.6 21.9 88.3 7.3 7.3
“NA” indicates not applicable. There was no degree of this type awarded during the specified years.1 Table shows degrees (in the first major) awarded by all degree-granting institutions eligible for
federal Title IV student financial aid in the 50 states and D.C., excluding service schools and online-only colleges and universities.
2 Calculated based on a total that excludes students whose race is unknown and students from foreign countries.
3 Predominantly black institutions (PBIs) are those in which black students account for more than 50 percent of total fall enrollment. Historically black colleges and universities (HBCUs) are those founded prior to 1964 as institutions for black students. While an institution’s PBI status may change from year to year, HBCU status will not.
Source: SREB analysis of National Center for Education Statistics completions surveys — www.nces.ed.gov/ipeds.
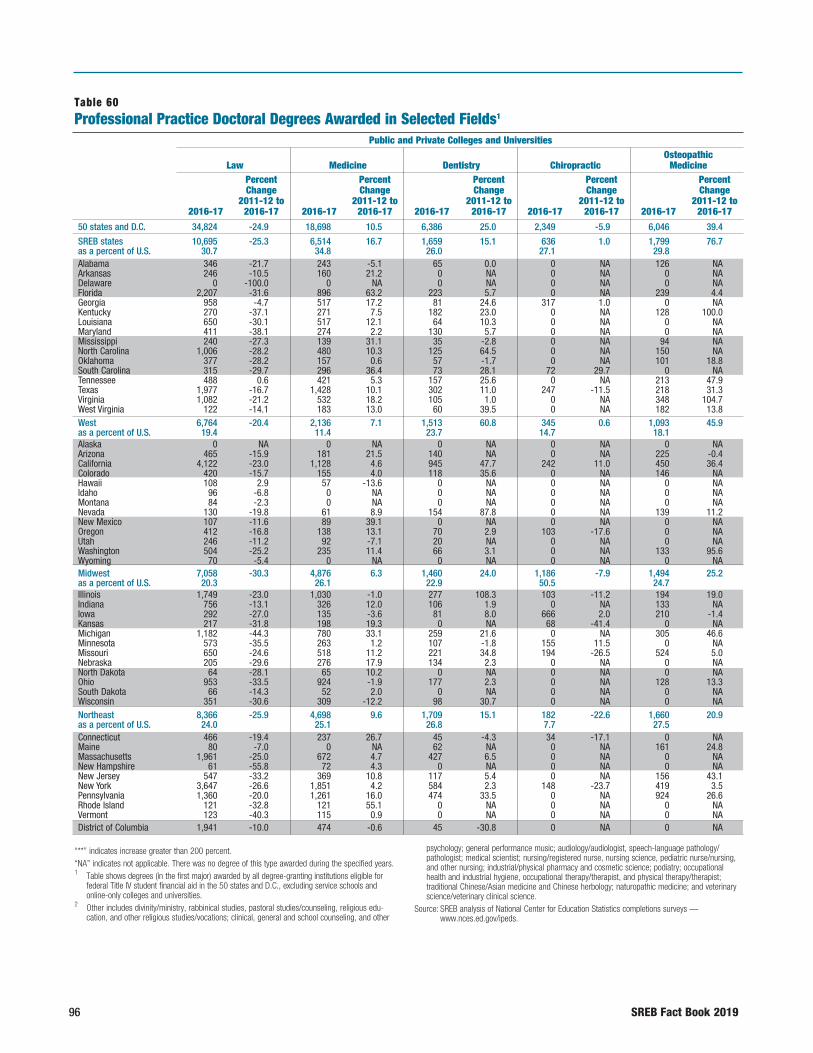
96 SREB Fact Book 2019
Table 60Professional Practice Doctoral Degrees Awarded in Selected Fields1
Osteopathic Law Medicine Dentistry Chiropractic Medicine Percent Percent Percent Percent Percent Change Change Change Change Change 2011-12 to 2011-12 to 2011-12 to 2011-12 to 2011-12 to 2016-17 2016-17 2016-17 2016-17 2016-17 2016-17 2016-17 2016-17 2016-17 2016-17
50 states and D.C. 34,824 -24.9 18,698 10.5 6,386 25.0 2,349 -5.9 6,046 39.4
SREB states 10,695 -25.3 6,514 16.7 1,659 15.1 636 1.0 1,799 76.7as a percent of U.S. 30.7 34.8 26.0 27.1 29.8 Alabama 346 -21.7 243 -5.1 65 0.0 0 NA 126 NAArkansas 246 -10.5 160 21.2 0 NA 0 NA 0 NADelaware 0 -100.0 0 NA 0 NA 0 NA 0 NAFlorida 2,207 -31.6 896 63.2 223 5.7 0 NA 239 4.4Georgia 958 -4.7 517 17.2 81 24.6 317 1.0 0 NAKentucky 270 -37.1 271 7.5 182 23.0 0 NA 128 100.0Louisiana 650 -30.1 517 12.1 64 10.3 0 NA 0 NAMaryland 411 -38.1 274 2.2 130 5.7 0 NA 0 NAMississippi 240 -27.3 139 31.1 35 -2.8 0 NA 94 NANorth Carolina 1,006 -28.2 480 10.3 125 64.5 0 NA 150 NAOklahoma 377 -28.2 157 0.6 57 -1.7 0 NA 101 18.8South Carolina 315 -29.7 296 36.4 73 28.1 72 29.7 0 NATennessee 488 0.6 421 5.3 157 25.6 0 NA 213 47.9Texas 1,977 -16.7 1,428 10.1 302 11.0 247 -11.5 218 31.3Virginia 1,082 -21.2 532 18.2 105 1.0 0 NA 348 104.7West Virginia 122 -14.1 183 13.0 60 39.5 0 NA 182 13.8West 6,764 -20.4 2,136 7.1 1,513 60.8 345 0.6 1,093 45.9as a percent of U.S. 19.4 11.4 23.7 14.7 18.1 Alaska 0 NA 0 NA 0 NA 0 NA 0 NAArizona 465 -15.9 181 21.5 140 NA 0 NA 225 -0.4California 4,122 -23.0 1,128 4.6 945 47.7 242 11.0 450 36.4Colorado 420 -15.7 155 4.0 118 35.6 0 NA 146 NAHawaii 108 2.9 57 -13.6 0 NA 0 NA 0 NAIdaho 96 -6.8 0 NA 0 NA 0 NA 0 NAMontana 84 -2.3 0 NA 0 NA 0 NA 0 NANevada 130 -19.8 61 8.9 154 87.8 0 NA 139 11.2New Mexico 107 -11.6 89 39.1 0 NA 0 NA 0 NAOregon 412 -16.8 138 13.1 70 2.9 103 -17.6 0 NAUtah 246 -11.2 92 -7.1 20 NA 0 NA 0 NAWashington 504 -25.2 235 11.4 66 3.1 0 NA 133 95.6Wyoming 70 -5.4 0 NA 0 NA 0 NA 0 NAMidwest 7,058 -30.3 4,876 6.3 1,460 24.0 1,186 -7.9 1,494 25.2as a percent of U.S. 20.3 26.1 22.9 50.5 24.7 Illinois 1,749 -23.0 1,030 -1.0 277 108.3 103 -11.2 194 19.0Indiana 756 -13.1 326 12.0 106 1.9 0 NA 133 NAIowa 292 -27.0 135 -3.6 81 8.0 666 2.0 210 -1.4Kansas 217 -31.8 198 19.3 0 NA 68 -41.4 0 NAMichigan 1,182 -44.3 780 33.1 259 21.6 0 NA 305 46.6Minnesota 573 -35.5 263 1.2 107 -1.8 155 11.5 0 NAMissouri 650 -24.6 518 11.2 221 34.8 194 -26.5 524 5.0Nebraska 205 -29.6 276 17.9 134 2.3 0 NA 0 NANorth Dakota 64 -28.1 65 10.2 0 NA 0 NA 0 NAOhio 953 -33.5 924 -1.9 177 2.3 0 NA 128 13.3South Dakota 66 -14.3 52 2.0 0 NA 0 NA 0 NAWisconsin 351 -30.6 309 -12.2 98 30.7 0 NA 0 NANortheast 8,366 -25.9 4,698 9.6 1,709 15.1 182 -22.6 1,660 20.9as a percent of U.S. 24.0 25.1 26.8 7.7 27.5 Connecticut 466 -19.4 237 26.7 45 -4.3 34 -17.1 0 NAMaine 80 -7.0 0 NA 62 NA 0 NA 161 24.8Massachusetts 1,961 -25.0 672 4.7 427 6.5 0 NA 0 NANew Hampshire 61 -55.8 72 4.3 0 NA 0 NA 0 NANew Jersey 547 -33.2 369 10.8 117 5.4 0 NA 156 43.1New York 3,647 -26.6 1,851 4.2 584 2.3 148 -23.7 419 3.5Pennsylvania 1,360 -20.0 1,261 16.0 474 33.5 0 NA 924 26.6Rhode Island 121 -32.8 121 55.1 0 NA 0 NA 0 NAVermont 123 -40.3 115 0.9 0 NA 0 NA 0 NADistrict of Columbia 1,941 -10.0 474 -0.6 45 -30.8 0 NA 0 NA
Public and Private Colleges and Universities
“**” indicates increase greater than 200 percent.“NA” indicates not applicable. There was no degree of this type awarded during the specified years.1 Table shows degrees (in the first major) awarded by all degree-granting institutions eligible for
federal Title IV student financial aid in the 50 states and D.C., excluding service schools and online-only colleges and universities.
2 Other includes divinity/ministry, rabbinical studies, pastoral studies/counseling, religious edu-cation, and other religious studies/vocations; clinical, general and school counseling, and other
psychology; general performance music; audiology/audiologist, speech-language pathology/pathologist; medical scientist; nursing/registered nurse, nursing science, pediatric nurse/nursing, and other nursing; industrial/physical pharmacy and cosmetic science; podiatry; occupational health and industrial hygiene, occupational therapy/therapist, and physical therapy/therapist; traditional Chinese/Asian medicine and Chinese herbology; naturopathic medicine; and veterinary science/veterinary clinical science.
Source: SREB analysis of National Center for Education Statistics completions surveys — www.nces.ed.gov/ipeds.
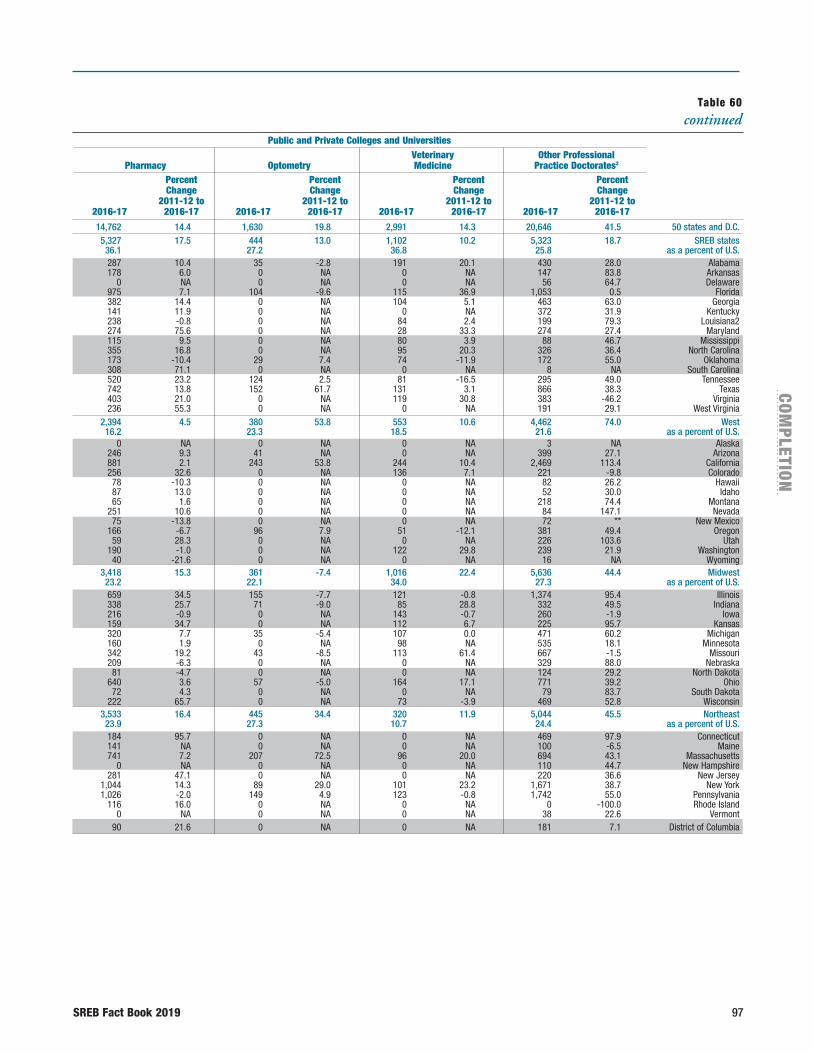
SREB Fact Book 2019 97
COM
PLETION
Veterinary Other Professional Pharmacy Optometry Medicine Practice Doctorates2 Percent Percent Percent Percent Change Change Change Change 2011-12 to 2011-12 to 2011-12 to 2011-12 to 2016-17 2016-17 2016-17 2016-17 2016-17 2016-17 2016-17 2016-17
Public and Private Colleges and Universities
Table 60continued
14,762 14.4 1,630 19.8 2,991 14.3 20,646 41.5 50 states and D.C. 5,327 17.5 444 13.0 1,102 10.2 5,323 18.7 SREB states 36.1 27.2 36.8 25.8 as a percent of U.S. 287 10.4 35 -2.8 191 20.1 430 28.0 Alabama 178 6.0 0 NA 0 NA 147 83.8 Arkansas 0 NA 0 NA 0 NA 56 64.7 Delaware 975 7.1 104 -9.6 115 36.9 1,053 0.5 Florida 382 14.4 0 NA 104 5.1 463 63.0 Georgia 141 11.9 0 NA 0 NA 372 31.9 Kentucky 238 -0.8 0 NA 84 2.4 199 79.3 Louisiana2 274 75.6 0 NA 28 33.3 274 27.4 Maryland 115 9.5 0 NA 80 3.9 88 46.7 Mississippi 355 16.8 0 NA 95 20.3 326 36.4 North Carolina 173 -10.4 29 7.4 74 -11.9 172 55.0 Oklahoma 308 71.1 0 NA 0 NA 8 NA South Carolina 520 23.2 124 2.5 81 -16.5 295 49.0 Tennessee 742 13.8 152 61.7 131 3.1 866 38.3 Texas 403 21.0 0 NA 119 30.8 383 -46.2 Virginia 236 55.3 0 NA 0 NA 191 29.1 West Virginia 2,394 4.5 380 53.8 553 10.6 4,462 74.0 West 16.2 23.3 18.5 21.6 as a percent of U.S. 0 NA 0 NA 0 NA 3 NA Alaska 246 9.3 41 NA 0 NA 399 27.1 Arizona 881 2.1 243 53.8 244 10.4 2,469 113.4 California 256 32.6 0 NA 136 7.1 221 -9.8 Colorado 78 -10.3 0 NA 0 NA 82 26.2 Hawaii 87 13.0 0 NA 0 NA 52 30.0 Idaho 65 1.6 0 NA 0 NA 218 74.4 Montana 251 10.6 0 NA 0 NA 84 147.1 Nevada 75 -13.8 0 NA 0 NA 72 ** New Mexico 166 -6.7 96 7.9 51 -12.1 381 49.4 Oregon 59 28.3 0 NA 0 NA 226 103.6 Utah 190 -1.0 0 NA 122 29.8 239 21.9 Washington 40 -21.6 0 NA 0 NA 16 NA Wyoming 3,418 15.3 361 -7.4 1,016 22.4 5,636 44.4 Midwest 23.2 22.1 34.0 27.3 as a percent of U.S. 659 34.5 155 -7.7 121 -0.8 1,374 95.4 Illinois 338 25.7 71 -9.0 85 28.8 332 49.5 Indiana 216 -0.9 0 NA 143 -0.7 260 -1.9 Iowa 159 34.7 0 NA 112 6.7 225 95.7 Kansas 320 7.7 35 -5.4 107 0.0 471 60.2 Michigan 160 1.9 0 NA 98 NA 535 18.1 Minnesota 342 19.2 43 -8.5 113 61.4 667 -1.5 Missouri 209 -6.3 0 NA 0 NA 329 88.0 Nebraska 81 -4.7 0 NA 0 NA 124 29.2 North Dakota 640 3.6 57 -5.0 164 17.1 771 39.2 Ohio 72 4.3 0 NA 0 NA 79 83.7 South Dakota 222 65.7 0 NA 73 -3.9 469 52.8 Wisconsin 3,533 16.4 445 34.4 320 11.9 5,044 45.5 Northeast 23.9 27.3 10.7 24.4 as a percent of U.S. 184 95.7 0 NA 0 NA 469 97.9 Connecticut 141 NA 0 NA 0 NA 100 -6.5 Maine 741 7.2 207 72.5 96 20.0 694 43.1 Massachusetts 0 NA 0 NA 0 NA 110 44.7 New Hampshire 281 47.1 0 NA 0 NA 220 36.6 New Jersey 1,044 14.3 89 29.0 101 23.2 1,671 38.7 New York 1,026 -2.0 149 4.9 123 -0.8 1,742 55.0 Pennsylvania 116 16.0 0 NA 0 NA 0 -100.0 Rhode Island 0 NA 0 NA 0 NA 38 22.6 Vermont 90 21.6 0 NA 0 NA 181 7.1 District of Columbia
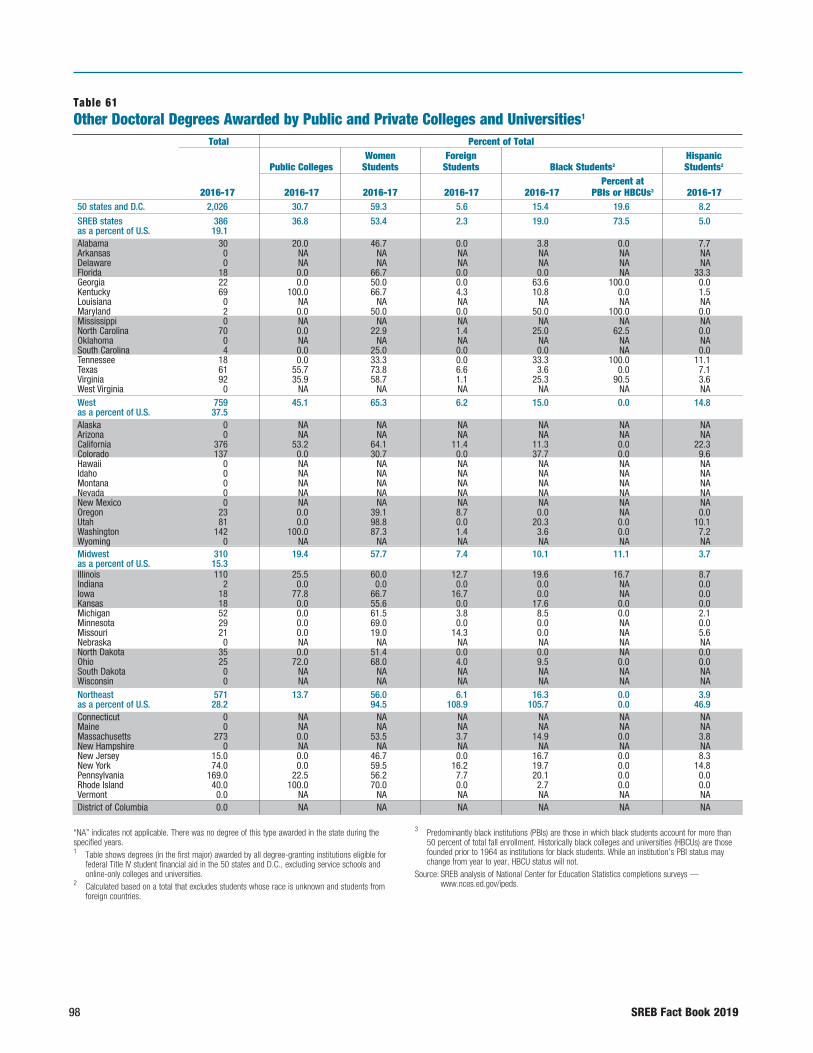
98 SREB Fact Book 2019
Table 61Other Doctoral Degrees Awarded by Public and Private Colleges and Universities1
Total Percent of Total Women Foreign Hispanic Public Colleges Students Students Black Students2 Students2
Percent at 2016-17 2016-17 2016-17 2016-17 2016-17 PBIs or HBCUs3 2016-17
50 states and D.C. 2,026 30.7 59.3 5.6 15.4 19.6 8.2
SREB states 386 36.8 53.4 2.3 19.0 73.5 5.0as a percent of U.S. 19.1 Alabama 30 20.0 46.7 0.0 3.8 0.0 7.7Arkansas 0 NA NA NA NA NA NADelaware 0 NA NA NA NA NA NAFlorida 18 0.0 66.7 0.0 0.0 NA 33.3Georgia 22 0.0 50.0 0.0 63.6 100.0 0.0Kentucky 69 100.0 66.7 4.3 10.8 0.0 1.5Louisiana 0 NA NA NA NA NA NAMaryland 2 0.0 50.0 0.0 50.0 100.0 0.0Mississippi 0 NA NA NA NA NA NANorth Carolina 70 0.0 22.9 1.4 25.0 62.5 0.0Oklahoma 0 NA NA NA NA NA NASouth Carolina 4 0.0 25.0 0.0 0.0 NA 0.0Tennessee 18 0.0 33.3 0.0 33.3 100.0 11.1Texas 61 55.7 73.8 6.6 3.6 0.0 7.1Virginia 92 35.9 58.7 1.1 25.3 90.5 3.6West Virginia 0 NA NA NA NA NA NAWest 759 45.1 65.3 6.2 15.0 0.0 14.8as a percent of U.S. 37.5 Alaska 0 NA NA NA NA NA NAArizona 0 NA NA NA NA NA NACalifornia 376 53.2 64.1 11.4 11.3 0.0 22.3Colorado 137 0.0 30.7 0.0 37.7 0.0 9.6Hawaii 0 NA NA NA NA NA NAIdaho 0 NA NA NA NA NA NAMontana 0 NA NA NA NA NA NANevada 0 NA NA NA NA NA NANew Mexico 0 NA NA NA NA NA NAOregon 23 0.0 39.1 8.7 0.0 NA 0.0Utah 81 0.0 98.8 0.0 20.3 0.0 10.1Washington 142 100.0 87.3 1.4 3.6 0.0 7.2Wyoming 0 NA NA NA NA NA NAMidwest 310 19.4 57.7 7.4 10.1 11.1 3.7as a percent of U.S. 15.3 Illinois 110 25.5 60.0 12.7 19.6 16.7 8.7Indiana 2 0.0 0.0 0.0 0.0 NA 0.0Iowa 18 77.8 66.7 16.7 0.0 NA 0.0Kansas 18 0.0 55.6 0.0 17.6 0.0 0.0Michigan 52 0.0 61.5 3.8 8.5 0.0 2.1Minnesota 29 0.0 69.0 0.0 0.0 NA 0.0Missouri 21 0.0 19.0 14.3 0.0 NA 5.6Nebraska 0 NA NA NA NA NA NANorth Dakota 35 0.0 51.4 0.0 0.0 NA 0.0Ohio 25 72.0 68.0 4.0 9.5 0.0 0.0South Dakota 0 NA NA NA NA NA NAWisconsin 0 NA NA NA NA NA NANortheast 571 13.7 56.0 6.1 16.3 0.0 3.9as a percent of U.S. 28.2 94.5 108.9 105.7 0.0 46.9Connecticut 0 NA NA NA NA NA NAMaine 0 NA NA NA NA NA NAMassachusetts 273 0.0 53.5 3.7 14.9 0.0 3.8New Hampshire 0 NA NA NA NA NA NANew Jersey 15.0 0.0 46.7 0.0 16.7 0.0 8.3New York 74.0 0.0 59.5 16.2 19.7 0.0 14.8Pennsylvania 169.0 22.5 56.2 7.7 20.1 0.0 0.0Rhode Island 40.0 100.0 70.0 0.0 2.7 0.0 0.0Vermont 0.0 NA NA NA NA NA NADistrict of Columbia 0.0 NA NA NA NA NA NA
“NA” indicates not applicable. There was no degree of this type awarded in the state during the specified years. 1 Table shows degrees (in the first major) awarded by all degree-granting institutions eligible for
federal Title IV student financial aid in the 50 states and D.C., excluding service schools and online-only colleges and universities.
2 Calculated based on a total that excludes students whose race is unknown and students from foreign countries.
3 Predominantly black institutions (PBIs) are those in which black students account for more than 50 percent of total fall enrollment. Historically black colleges and universities (HBCUs) are those founded prior to 1964 as institutions for black students. While an institution’s PBI status may change from year to year, HBCU status will not.
Source: SREB analysis of National Center for Education Statistics completions surveys — www.nces.ed.gov/ipeds.

SREB Fact Book 2019 99
AFFO
RD
AB
ILITY
Rising college costs continue
Nationwide, the average annual costs for an in-state undergraduate to attend a public four-year college reached $20,000 in 2017-18 — more than double the 1987-88 average. Since 2007-08, that amount increased by 27 percent. Over that period, average costs at public two-year colleges rose 25 percent to $10,300 for the 2017-18 school year. At non-public four-year colleges, average costs increased by 21 percent to $43,100 between 2007-08 and 2017-18. Costs at non-public two-year colleges hit $25,600, up less than 1 percent since 2007-08.
Annual Undergraduate Costs of College Attendance United States (in 2017-18 dollars)
Note: Costs of college attendance include tuition, required fees, room and board.
Source: SREB analysis of National Center for Education Statistics data.
$22,900
1987-88 1997-98 2017-182007-08
$15,200
$9,500
$6,600
$29,100
$11,700
$19,700
$6,900
$15,800
$8,200
$25,500
$35,500
$10,300
$20,000
$25,600
$43,100
Public 2-year colleges (+56%)
Public 4-year colleges(+112%)
Non-public 2-year colleges (+68%)
Non-public 4-year colleges (+88%)
College Affordability
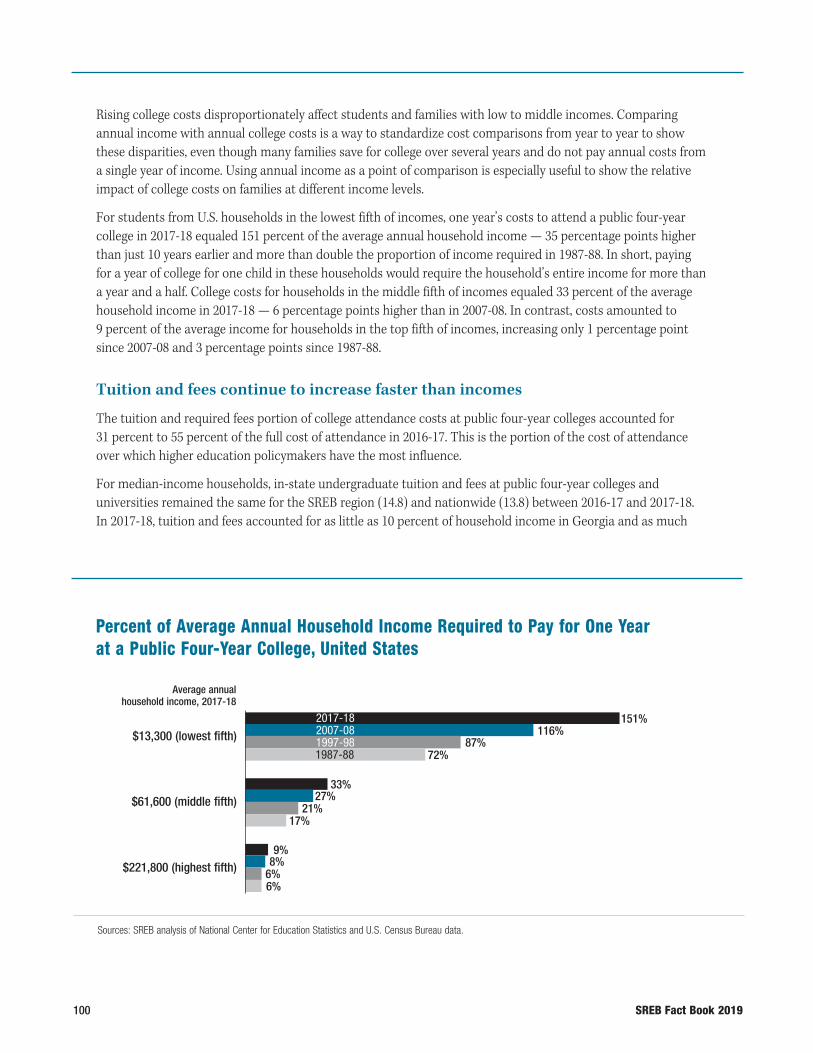
100 SREB Fact Book 2019
Rising college costs disproportionately affect students and families with low to middle incomes. Comparing annual income with annual college costs is a way to standardize cost comparisons from year to year to show these disparities, even though many families save for college over several years and do not pay annual costs from a single year of income. Using annual income as a point of comparison is especially useful to show the relative impact of college costs on families at different income levels.
For students from U.S. households in the lowest fifth of incomes, one year’s costs to attend a public four-year college in 2017-18 equaled 151 percent of the average annual household income — 35 percentage points higher than just 10 years earlier and more than double the proportion of income required in 1987-88. In short, paying for a year of college for one child in these households would require the household’s entire income for more than a year and a half. College costs for households in the middle fifth of incomes equaled 33 percent of the average household income in 2017-18 — 6 percentage points higher than in 2007-08. In contrast, costs amounted to 9 percent of the average income for households in the top fifth of incomes, increasing only 1 percentage point since 2007-08 and 3 percentage points since 1987-88.
Tuition and fees continue to increase faster than incomes
The tuition and required fees portion of college attendance costs at public four-year colleges accounted for 31 percent to 55 percent of the full cost of attendance in 2016-17. This is the portion of the cost of attendance over which higher education policymakers have the most influence.
For median-income households, in-state undergraduate tuition and fees at public four-year colleges and universities remained the same for the SREB region (14.8) and nationwide (13.8) between 2016-17 and 2017-18. In 2017-18, tuition and fees accounted for as little as 10 percent of household income in Georgia and as much
Percent of Average Annual Household Income Required to Pay for One Year at a Public Four-Year College, United States
Sources: SREB analysis of National Center for Education Statistics and U.S. Census Bureau data.
$13,300 (lowest fifth)
$61,600 (middle fifth)
$221,800 (highest fifth) 8%6%
9%
Average annual household income, 2017-18
6%
27%21%
33%
17%
116%87%
151%
72%
2017-182007-081997-981987-88
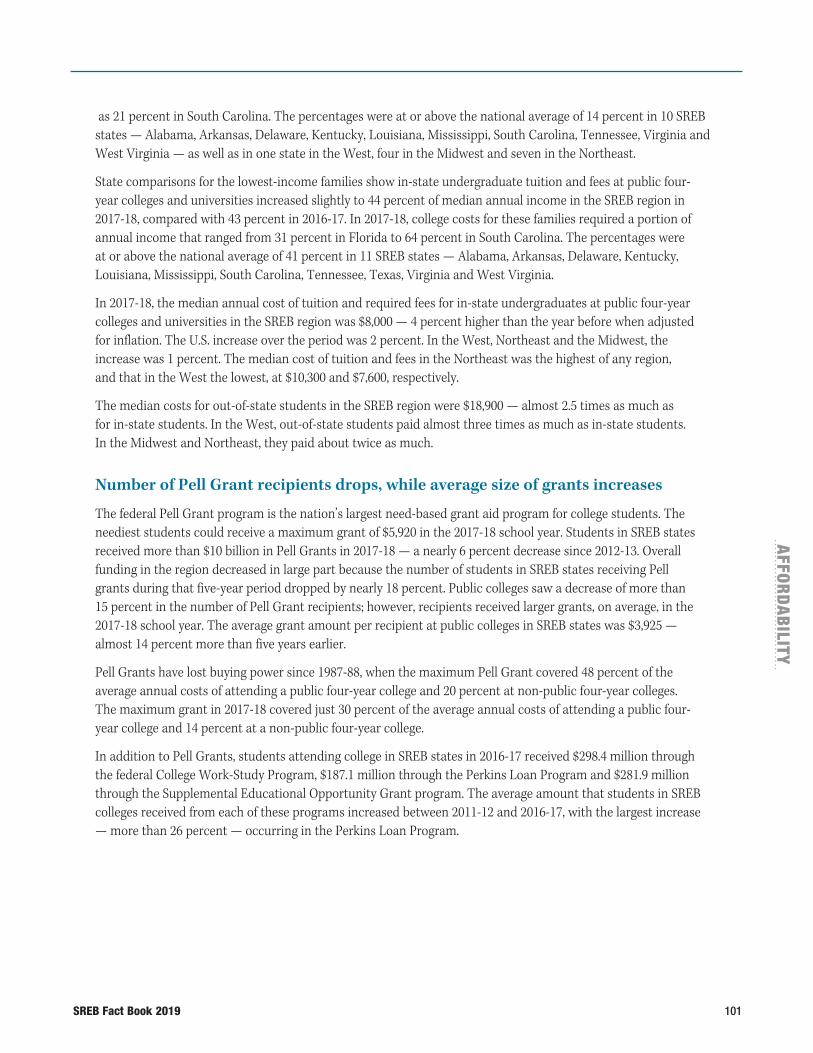
SREB Fact Book 2019 101
AFFO
RD
AB
ILITY
as 21 percent in South Carolina. The percentages were at or above the national average of 14 percent in 10 SREB states — Alabama, Arkansas, Delaware, Kentucky, Louisiana, Mississippi, South Carolina, Tennessee, Virginia and West Virginia — as well as in one state in the West, four in the Midwest and seven in the Northeast.
State comparisons for the lowest-income families show in-state undergraduate tuition and fees at public four- year colleges and universities increased slightly to 44 percent of median annual income in the SREB region in 2017-18, compared with 43 percent in 2016-17. In 2017-18, college costs for these families required a portion of annual income that ranged from 31 percent in Florida to 64 percent in South Carolina. The percentages were at or above the national average of 41 percent in 11 SREB states — Alabama, Arkansas, Delaware, Kentucky, Louisiana, Mississippi, South Carolina, Tennessee, Texas, Virginia and West Virginia.
In 2017-18, the median annual cost of tuition and required fees for in-state undergraduates at public four-year colleges and universities in the SREB region was $8,000 — 4 percent higher than the year before when adjusted for inflation. The U.S. increase over the period was 2 percent. In the West, Northeast and the Midwest, the increase was 1 percent. The median cost of tuition and fees in the Northeast was the highest of any region, and that in the West the lowest, at $10,300 and $7,600, respectively.
The median costs for out-of-state students in the SREB region were $18,900 — almost 2.5 times as much as for in-state students. In the West, out-of-state students paid almost three times as much as in-state students. In the Midwest and Northeast, they paid about twice as much.
Number of Pell Grant recipients drops, while average size of grants increases
The federal Pell Grant program is the nation’s largest need-based grant aid program for college students. The neediest students could receive a maximum grant of $5,920 in the 2017-18 school year. Students in SREB states received more than $10 billion in Pell Grants in 2017-18 — a nearly 6 percent decrease since 2012-13. Overall funding in the region decreased in large part because the number of students in SREB states receiving Pell grants during that five-year period dropped by nearly 18 percent. Public colleges saw a decrease of more than 15 percent in the number of Pell Grant recipients; however, recipients received larger grants, on average, in the 2017-18 school year. The average grant amount per recipient at public colleges in SREB states was $3,925 — almost 14 percent more than five years earlier.
Pell Grants have lost buying power since 1987-88, when the maximum Pell Grant covered 48 percent of the average annual costs of attending a public four-year college and 20 percent at non-public four-year colleges. The maximum grant in 2017-18 covered just 30 percent of the average annual costs of attending a public four- year college and 14 percent at a non-public four-year college.
In addition to Pell Grants, students attending college in SREB states in 2016-17 received $298.4 million through the federal College Work-Study Program, $187.1 million through the Perkins Loan Program and $281.9 million through the Supplemental Educational Opportunity Grant program. The average amount that students in SREB colleges received from each of these programs increased between 2011-12 and 2016-17, with the largest increase — more than 26 percent — occurring in the Perkins Loan Program.

102 SREB Fact Book 2019
SREB states continue to lead other regions in state scholarships and grants
State scholarships and grants in SREB states reached nearly $5.5 billion in 2016-17, accounting for nearly 43 percent of the nation’s total. From 2011-12 to 2016-17, need-based aid to undergraduate students in the SREB region increased 37 percent, compared to the national increase of 21 percent. SREB states accounted for 28 percent of the nation’s total state need-based financial aid for undergraduate students in 2016-17 and almost 86 percent of the total for state scholarships and grants not based on need.
Total student borrowing declines, but subsidized, unsubsidized and parent loans increase
Nationwide, the total amount borrowed to finance postsecondary education in 2012-13 equaled 84 percent of the total received through other types of financial aid (e.g., grants, work-study and tax benefits). In 2017-18, the amount borrowed dropped to 72 percent of the other types of aid. The total amount students and their parents borrowed peaked in 2011-12 and has since decreased by $9 billion, to under $106 billion in 2017-18. Despite the recent decrease in total loans, the amounts of financial aid both borrowed and received have grown substantially over the past 30 years. In 1987-88, students and their parents borrowed over $9 billion and received almost $12 billion in other financial aid. By 2017-18, borrowing was at almost $106 billion, and other forms of financial aid totaled more than $147 billion.
Federal loan programs supplied over $29 billion in loans to students in SREB states in 2017-18. The average amount received through Stafford subsidized loans was up over 2 percent from 2012-13 and averaged less than $3,700 per recipient. Average Stafford unsubsidized loan amounts increased nearly 5 percent during that same period and averaged over $6,700 per recipient. Parent Loans for Undergraduate Students (PLUS) grew by almost 7 percent and averaged more than $14,000 per recipient in the region.
Note: The maximum Pell award was $2,100 in 1985-86 and $5,920 in 2017-18.
Sources: SREB analysis of College Board and National Center for Education Statistics data.
Percent of Tuition, Fees, Room and Board Covered by Maximum Federal Pell Grant, United States
1987-88 2002-03 2017-181992-93 1997-98 2007-08 2012-13
Public 2-year colleges
69%
48%
20%16%
40%
63%
17%
41%
71%
14%
32%
62%58%
30%
14%
Public 4-year colleges
Non-public 4-year colleges14%
35%
65%
16%
62%
32%

SREB Fact Book 2019 103
AFFO
RD
AB
ILITY
The percentage of first-time, full-time, degree- or certificate-seeking freshman in SREB states who took out loans in their first year of college decreased 2 percentage points during the five-year period between 2011-12 and 2016-17. In 2016-17, 50 percent of these freshmen at public four-year institutions in the SREB region and in the nation took out loans that averaged $6,800 and $7,000, respectively. In SREB states, students’ loans were more than $600 larger on average than those taken out in 2011-12.
Twenty-one percent of first-time students at public two-year colleges in the SREB region took on debt in 2016-17, a rate less than half that of students at public four-year colleges. This percentage was nearly 5 percentage points lower than in 2011-12. The average loan disbursed to these students was just over $4,600, up $45 for the period.
Out-of-pocket costs 63 percent after scholarship and grant aid nationwide
Is a college education in the United States affordable? The answer depends on the cost of attendance (tuition and fees, room and board, books and supplies), the ability of students and their families to pay, and the amount of financial aid and scholarships available. In 2016-17, the average amount of grant and scholarship aid amounted to 37 percent of the total cost of attendance for full-time, degree- or certificate-seeking, beginning college students nationwide and 36 percent in the SREB region. That left a net price of 63 percent of the total cost nationwide and 64 percent in the SREB region, which must be covered using loans or cash. Loans help students and their families break the cost of college attendance into monthly payments and stretch it over multiple years, but they raise college costs in the long term by adding interest.
Source: SREB analysis of College Board data.
Grants, Work Study and Tax Benefits
Federal and Non-Federal Loans
1987-88 1997-98 2007-08 2017-18
Student Financial Aid and Loan Trends United States (in billions)
$147
$106
$91
$76
$32
$31 $12
$9

104 SREB Fact Book 2019
Nationwide, the average one-year cost for full-time, first-time degree- or certificate-seeking undergraduates paying in-state or in-district tuition at a public four-year college or university in 2016-17 was $22,600. Among U.S. regions, the cost of attendance for these students ranged from $22,000 in SREB states to $23,600 in the Northeast. Average scholarship and grant aid for these students ranged from $7,600 in the Midwest to $10,200 in the West. The resulting “net price” (what’s left for students and their families to pay after state and federal scholarships and grants) ranged from $12,900 in the West to $15,200 in the Northeast. Among SREB states, the gap between the cost of attendance and public grant and scholarship aid was lowest in West Virginia and highest in South Carolina, at $10,100 and $18,100, respectively. To meet this “net price,” students and their families had to turn to private grant aid, take out loans, raise the amounts they contributed, or find ways to cut expenses.
What Students and Their Families Pay1 Public Four-Year Colleges and Universities, 2016-17
1 For fall-term, full-time, first-time degree- or certificate-seeking undergraduates who paid in-state or in-district tuition and who received grant or scholarship aid from federal, state or local governments, or the institution.
Note: Because of rounding, Cost of Attendance might not equal the sum of Scholarship and Grant Aid plus Net Price After Aid.
Source: SREB analysis of National Center for Education Statistics student financial aid database.
50 states and D.C.West
Virginia
South Carolina
Maryland
Delaware
Alabama
TennesseeMississippi
KentuckyGeorgia
LouisianaTexas
OklahomaNorth Carolina
Florida
Arkansas West Virginia
$22,600$23,100
Midwest $22,400Northeast $23,600
SREB states $22,000
$26,000$25,900
$23,900$23,800
$23,500$23,400
$22,400
$22,300$21,600
$21,300$21,200$21,000
$20,700$20,400
$20,100$18,600
$10,200 $12,900$7,600 $14,800
$8,400 $15,200
$7,800 $14,200
$8,300 $17,700
$7,800 $18,100
$7,900 $16,000
$8,300 $15,500
$8,400 $14,200
$7,400 $16,100
$8,300 $15,100
$8,100 $14,300
$8,000 $14,300$7,200 $14,400
$7,700 $13,700
$8,900 $12,300
$7,200 $13,900
$8,400 $12,300
$6,400 $14,000
$6,700 $13,400
$8,500 $10,100
Scholarship and Grant Aid Net Price After AidCost of
Attendance
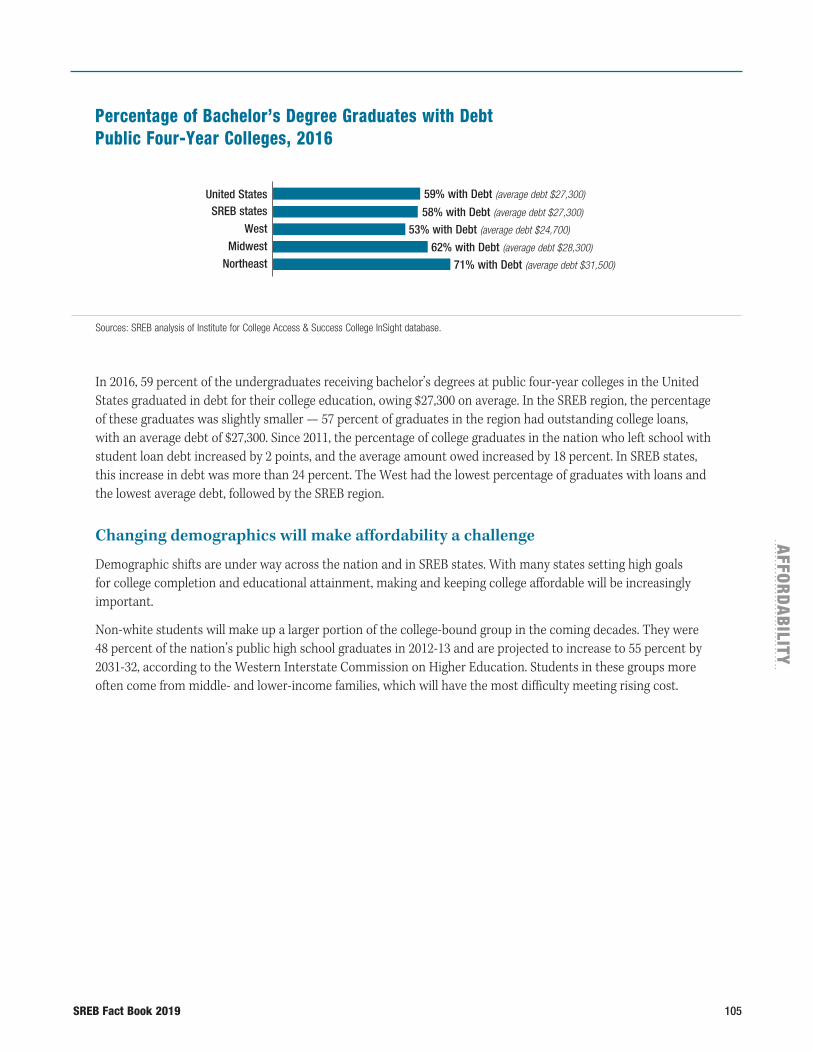
SREB Fact Book 2019 105
AFFO
RD
AB
ILITY
In 2016, 59 percent of the undergraduates receiving bachelor’s degrees at public four-year colleges in the United States graduated in debt for their college education, owing $27,300 on average. In the SREB region, the percentage of these graduates was slightly smaller — 57 percent of graduates in the region had outstanding college loans, with an average debt of $27,300. Since 2011, the percentage of college graduates in the nation who left school with student loan debt increased by 2 points, and the average amount owed increased by 18 percent. In SREB states, this increase in debt was more than 24 percent. The West had the lowest percentage of graduates with loans and the lowest average debt, followed by the SREB region.
Changing demographics will make affordability a challenge
Demographic shifts are under way across the nation and in SREB states. With many states setting high goals for college completion and educational attainment, making and keeping college affordable will be increasingly important.
Non-white students will make up a larger portion of the college-bound group in the coming decades. They were 48 percent of the nation’s public high school graduates in 2012-13 and are projected to increase to 55 percent by 2031-32, according to the Western Interstate Commission on Higher Education. Students in these groups more often come from middle- and lower-income families, which will have the most difficulty meeting rising cost.
Percentage of Bachelor’s Degree Graduates with Debt Public Four-Year Colleges, 2016
Sources: SREB analysis of Institute for College Access & Success College InSight database.
SREB states
West
Midwest
Northeast
58% with Debt (average debt $27,300)
United States 59% with Debt (average debt $27,300)
53% with Debt (average debt $24,700)
62% with Debt (average debt $28,300)
71% with Debt (average debt $31,500)
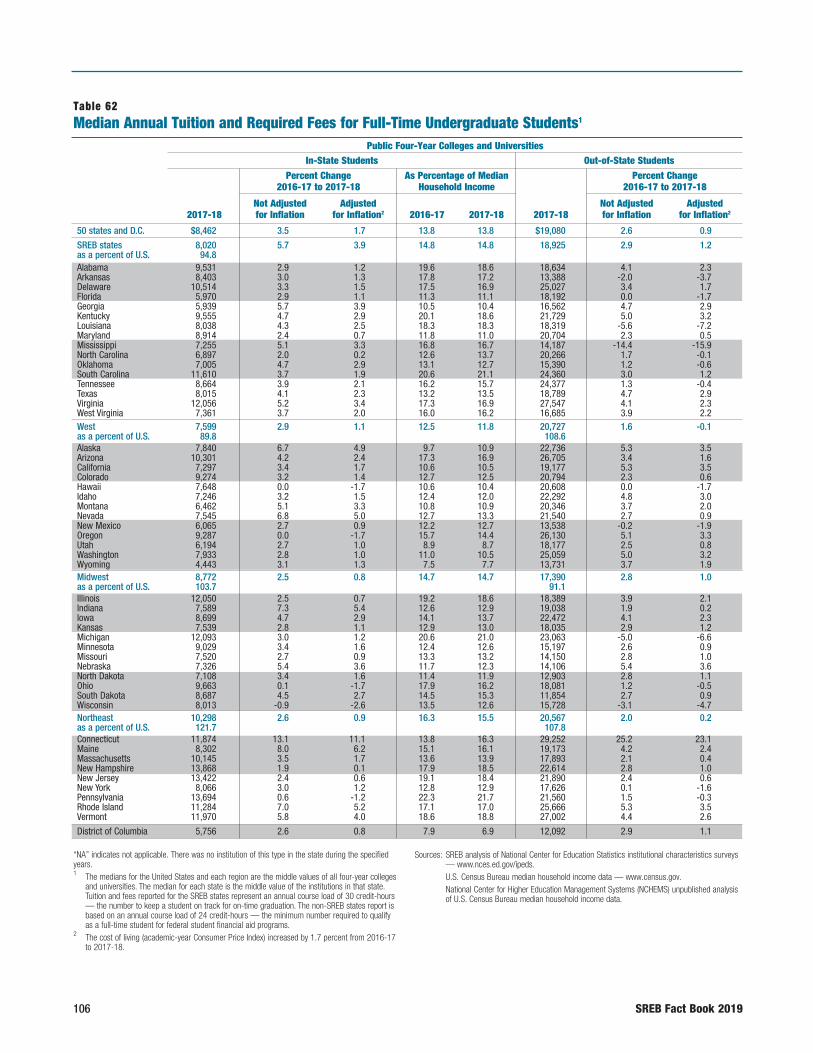
106 SREB Fact Book 2019
Table 62Median Annual Tuition and Required Fees for Full-Time Undergraduate Students1
50 states and D.C. $8,462 3.5 1.7 13.8 13.8 $19,080 2.6 0.9
SREB states 8,020 5.7 3.9 14.8 14.8 18,925 2.9 1.2as a percent of U.S. 94.8 Alabama 9,531 2.9 1.2 19.6 18.6 18,634 4.1 2.3Arkansas 8,403 3.0 1.3 17.8 17.2 13,388 -2.0 -3.7Delaware 10,514 3.3 1.5 17.5 16.9 25,027 3.4 1.7Florida 5,970 2.9 1.1 11.3 11.1 18,192 0.0 -1.7Georgia 5,939 5.7 3.9 10.5 10.4 16,562 4.7 2.9Kentucky 9,555 4.7 2.9 20.1 18.6 21,729 5.0 3.2Louisiana 8,038 4.3 2.5 18.3 18.3 18,319 -5.6 -7.2Maryland 8,914 2.4 0.7 11.8 11.0 20,704 2.3 0.5Mississippi 7,255 5.1 3.3 16.8 16.7 14,187 -14.4 -15.9North Carolina 6,897 2.0 0.2 12.6 13.7 20,266 1.7 -0.1Oklahoma 7,005 4.7 2.9 13.1 12.7 15,390 1.2 -0.6South Carolina 11,610 3.7 1.9 20.6 21.1 24,360 3.0 1.2Tennessee 8,664 3.9 2.1 16.2 15.7 24,377 1.3 -0.4Texas 8,015 4.1 2.3 13.2 13.5 18,789 4.7 2.9Virginia 12,056 5.2 3.4 17.3 16.9 27,547 4.1 2.3West Virginia 7,361 3.7 2.0 16.0 16.2 16,685 3.9 2.2West 7,599 2.9 1.1 12.5 11.8 20,727 1.6 -0.1as a percent of U.S. 89.8 108.6 Alaska 7,840 6.7 4.9 9.7 10.9 22,736 5.3 3.5Arizona 10,301 4.2 2.4 17.3 16.9 26,705 3.4 1.6California 7,297 3.4 1.7 10.6 10.5 19,177 5.3 3.5Colorado 9,274 3.2 1.4 12.7 12.5 20,794 2.3 0.6Hawaii 7,648 0.0 -1.7 10.6 10.4 20,608 0.0 -1.7Idaho 7,246 3.2 1.5 12.4 12.0 22,292 4.8 3.0Montana 6,462 5.1 3.3 10.8 10.9 20,346 3.7 2.0Nevada 7,545 6.8 5.0 12.7 13.3 21,540 2.7 0.9New Mexico 6,065 2.7 0.9 12.2 12.7 13,538 -0.2 -1.9Oregon 9,287 0.0 -1.7 15.7 14.4 26,130 5.1 3.3Utah 6,194 2.7 1.0 8.9 8.7 18,177 2.5 0.8Washington 7,933 2.8 1.0 11.0 10.5 25,059 5.0 3.2Wyoming 4,443 3.1 1.3 7.5 7.7 13,731 3.7 1.9Midwest 8,772 2.5 0.8 14.7 14.7 17,390 2.8 1.0as a percent of U.S. 103.7 91.1 Illinois 12,050 2.5 0.7 19.2 18.6 18,389 3.9 2.1Indiana 7,589 7.3 5.4 12.6 12.9 19,038 1.9 0.2Iowa 8,699 4.7 2.9 14.1 13.7 22,472 4.1 2.3Kansas 7,539 2.8 1.1 12.9 13.0 18,035 2.9 1.2Michigan 12,093 3.0 1.2 20.6 21.0 23,063 -5.0 -6.6Minnesota 9,029 3.4 1.6 12.4 12.6 15,197 2.6 0.9Missouri 7,520 2.7 0.9 13.3 13.2 14,150 2.8 1.0Nebraska 7,326 5.4 3.6 11.7 12.3 14,106 5.4 3.6North Dakota 7,108 3.4 1.6 11.4 11.9 12,903 2.8 1.1Ohio 9,663 0.1 -1.7 17.9 16.2 18,081 1.2 -0.5South Dakota 8,687 4.5 2.7 14.5 15.3 11,854 2.7 0.9Wisconsin 8,013 -0.9 -2.6 13.5 12.6 15,728 -3.1 -4.7Northeast 10,298 2.6 0.9 16.3 15.5 20,567 2.0 0.2as a percent of U.S. 121.7 107.8 Connecticut 11,874 13.1 11.1 13.8 16.3 29,252 25.2 23.1Maine 8,302 8.0 6.2 15.1 16.1 19,173 4.2 2.4Massachusetts 10,145 3.5 1.7 13.6 13.9 17,893 2.1 0.4New Hampshire 13,868 1.9 0.1 17.9 18.5 22,614 2.8 1.0New Jersey 13,422 2.4 0.6 19.1 18.4 21,890 2.4 0.6New York 8,066 3.0 1.2 12.8 12.9 17,626 0.1 -1.6Pennsylvania 13,694 0.6 -1.2 22.3 21.7 21,560 1.5 -0.3Rhode Island 11,284 7.0 5.2 17.1 17.0 25,666 5.3 3.5Vermont 11,970 5.8 4.0 18.6 18.8 27,002 4.4 2.6
District of Columbia 5,756 2.6 0.8 7.9 6.9 12,092 2.9 1.1
“NA” indicates not applicable. There was no institution of this type in the state during the specified years.1 The medians for the United States and each region are the middle values of all four-year colleges
and universities. The median for each state is the middle value of the institutions in that state. Tuition and fees reported for the SREB states represent an annual course load of 30 credit-hours — the number to keep a student on track for on-time graduation. The non-SREB states report is based on an annual course load of 24 credit-hours — the minimum number required to qualify as a full-time student for federal student financial aid programs.
2 The cost of living (academic-year Consumer Price Index) increased by 1.7 percent from 2016-17 to 2017-18.
Sources: SREB analysis of National Center for Education Statistics institutional characteristics surveys — www.nces.ed.gov/ipeds. U.S. Census Bureau median household income data — www.census.gov. National Center for Higher Education Management Systems (NCHEMS) unpublished analysis of U.S. Census Bureau median household income data.
In-State Students Out-of-State StudentsPublic Four-Year Colleges and Universities
Percent Change 2016-17 to 2017-18
As Percentage of Median Household Income
Percent Change 2016-17 to 2017-18
Not Adjusted for Inflation
2017-18
Adjusted for Inflation2
Not Adjusted for Inflation
2017-18
2016-17
2017-18
Adjusted for Inflation2
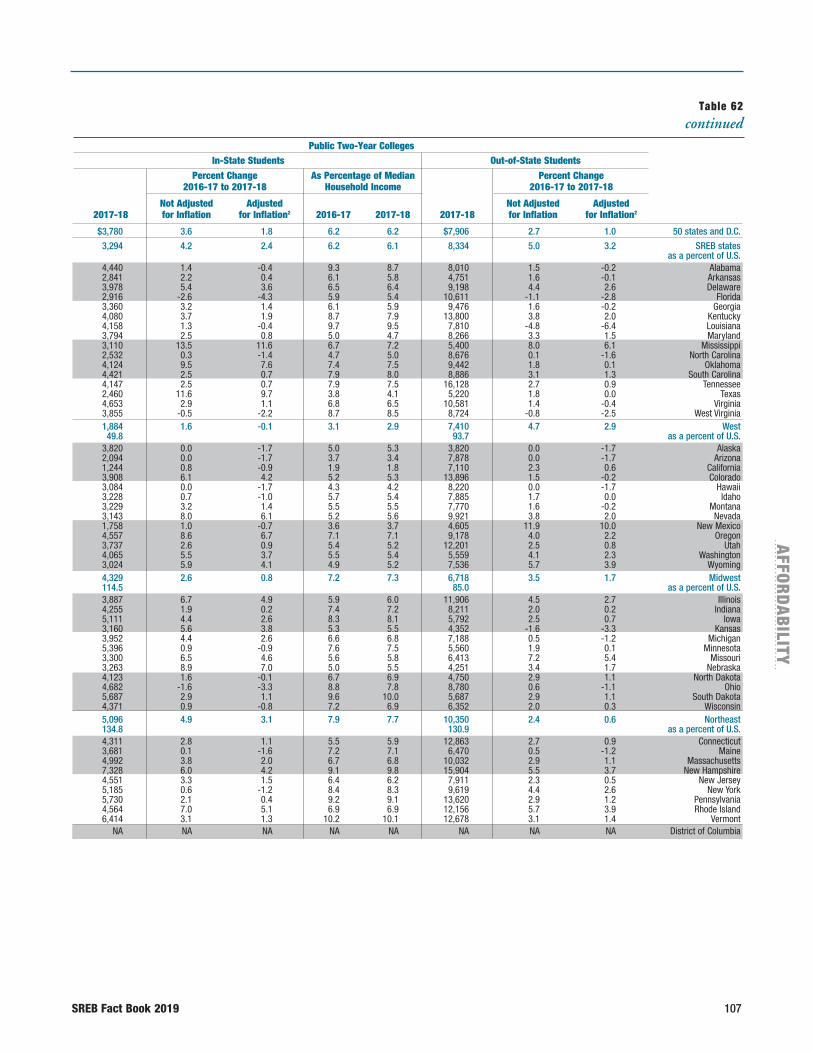
SREB Fact Book 2019 107
AFFO
RD
AB
ILITY
$3,780 3.6 1.8 6.2 6.2 $7,906 2.7 1.0 50 states and D.C.
3,294 4.2 2.4 6.2 6.1 8,334 5.0 3.2 SREB states as a percent of U.S. 4,440 1.4 -0.4 9.3 8.7 8,010 1.5 -0.2 Alabama 2,841 2.2 0.4 6.1 5.8 4,751 1.6 -0.1 Arkansas 3,978 5.4 3.6 6.5 6.4 9,198 4.4 2.6 Delaware 2,916 -2.6 -4.3 5.9 5.4 10,611 -1.1 -2.8 Florida 3,360 3.2 1.4 6.1 5.9 9,476 1.6 -0.2 Georgia 4,080 3.7 1.9 8.7 7.9 13,800 3.8 2.0 Kentucky 4,158 1.3 -0.4 9.7 9.5 7,810 -4.8 -6.4 Louisiana 3,794 2.5 0.8 5.0 4.7 8,266 3.3 1.5 Maryland 3,110 13.5 11.6 6.7 7.2 5,400 8.0 6.1 Mississippi 2,532 0.3 -1.4 4.7 5.0 8,676 0.1 -1.6 North Carolina 4,124 9.5 7.6 7.4 7.5 9,442 1.8 0.1 Oklahoma 4,421 2.5 0.7 7.9 8.0 8,886 3.1 1.3 South Carolina 4,147 2.5 0.7 7.9 7.5 16,128 2.7 0.9 Tennessee 2,460 11.6 9.7 3.8 4.1 5,220 1.8 0.0 Texas 4,653 2.9 1.1 6.8 6.5 10,581 1.4 -0.4 Virginia 3,855 -0.5 -2.2 8.7 8.5 8,724 -0.8 -2.5 West Virginia 1,884 1.6 -0.1 3.1 2.9 7,410 4.7 2.9 West 49.8 93.7 as a percent of U.S. 3,820 0.0 -1.7 5.0 5.3 3,820 0.0 -1.7 Alaska 2,094 0.0 -1.7 3.7 3.4 7,878 0.0 -1.7 Arizona 1,244 0.8 -0.9 1.9 1.8 7,110 2.3 0.6 California 3,908 6.1 4.2 5.2 5.3 13,896 1.5 -0.2 Colorado 3,084 0.0 -1.7 4.3 4.2 8,220 0.0 -1.7 Hawaii 3,228 0.7 -1.0 5.7 5.4 7,885 1.7 0.0 Idaho 3,229 3.2 1.4 5.5 5.5 7,770 1.6 -0.2 Montana 3,143 8.0 6.1 5.2 5.6 9,921 3.8 2.0 Nevada 1,758 1.0 -0.7 3.6 3.7 4,605 11.9 10.0 New Mexico 4,557 8.6 6.7 7.1 7.1 9,178 4.0 2.2 Oregon 3,737 2.6 0.9 5.4 5.2 12,201 2.5 0.8 Utah 4,065 5.5 3.7 5.5 5.4 5,559 4.1 2.3 Washington 3,024 5.9 4.1 4.9 5.2 7,536 5.7 3.9 Wyoming 4,329 2.6 0.8 7.2 7.3 6,718 3.5 1.7 Midwest 114.5 85.0 as a percent of U.S. 3,887 6.7 4.9 5.9 6.0 11,906 4.5 2.7 Illinois 4,255 1.9 0.2 7.4 7.2 8,211 2.0 0.2 Indiana 5,111 4.4 2.6 8.3 8.1 5,792 2.5 0.7 Iowa 3,160 5.6 3.8 5.3 5.5 4,352 -1.6 -3.3 Kansas 3,952 4.4 2.6 6.6 6.8 7,188 0.5 -1.2 Michigan 5,396 0.9 -0.9 7.6 7.5 5,560 1.9 0.1 Minnesota 3,300 6.5 4.6 5.6 5.8 6,413 7.2 5.4 Missouri 3,263 8.9 7.0 5.0 5.5 4,251 3.4 1.7 Nebraska 4,123 1.6 -0.1 6.7 6.9 4,750 2.9 1.1 North Dakota 4,682 -1.6 -3.3 8.8 7.8 8,780 0.6 -1.1 Ohio 5,687 2.9 1.1 9.6 10.0 5,687 2.9 1.1 South Dakota 4,371 0.9 -0.8 7.2 6.9 6,352 2.0 0.3 Wisconsin 5,096 4.9 3.1 7.9 7.7 10,350 2.4 0.6 Northeast 134.8 130.9 as a percent of U.S. 4,311 2.8 1.1 5.5 5.9 12,863 2.7 0.9 Connecticut 3,681 0.1 -1.6 7.2 7.1 6,470 0.5 -1.2 Maine 4,992 3.8 2.0 6.7 6.8 10,032 2.9 1.1 Massachusetts 7,328 6.0 4.2 9.1 9.8 15,904 5.5 3.7 New Hampshire 4,551 3.3 1.5 6.4 6.2 7,911 2.3 0.5 New Jersey 5,185 0.6 -1.2 8.4 8.3 9,619 4.4 2.6 New York 5,730 2.1 0.4 9.2 9.1 13,620 2.9 1.2 Pennsylvania 4,564 7.0 5.1 6.9 6.9 12,156 5.7 3.9 Rhode Island 6,414 3.1 1.3 10.2 10.1 12,678 3.1 1.4 Vermont NA NA NA NA NA NA NA NA District of Columbia
Table 62continued
In-State Students Out-of-State StudentsPublic Two-Year Colleges
Percent Change 2016-17 to 2017-18
As Percentage of Median Household Income
Percent Change 2016-17 to 2017-18
Not Adjusted for Inflation
2017-18
Adjusted for Inflation2
Not Adjusted for Inflation
2017-18
2016-17
2017-18
Adjusted for Inflation2
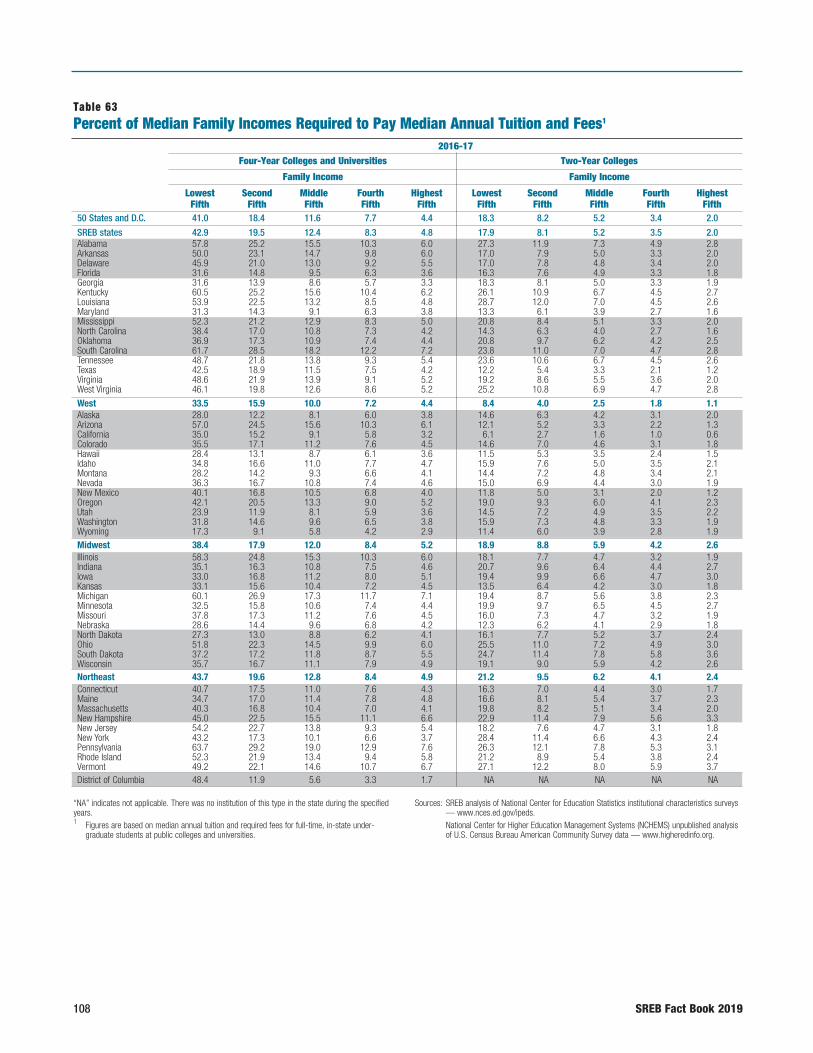
108 SREB Fact Book 2019
50 States and D.C. 41.0 18.4 11.6 7.7 4.4 18.3 8.2 5.2 3.4 2.0
SREB states 42.9 19.5 12.4 8.3 4.8 17.9 8.1 5.2 3.5 2.0Alabama 57.8 25.2 15.5 10.3 6.0 27.3 11.9 7.3 4.9 2.8Arkansas 50.0 23.1 14.7 9.8 6.0 17.0 7.9 5.0 3.3 2.0Delaware 45.9 21.0 13.0 9.2 5.5 17.0 7.8 4.8 3.4 2.0Florida 31.6 14.8 9.5 6.3 3.6 16.3 7.6 4.9 3.3 1.8Georgia 31.6 13.9 8.6 5.7 3.3 18.3 8.1 5.0 3.3 1.9Kentucky 60.5 25.2 15.6 10.4 6.2 26.1 10.9 6.7 4.5 2.7Louisiana 53.9 22.5 13.2 8.5 4.8 28.7 12.0 7.0 4.5 2.6Maryland 31.3 14.3 9.1 6.3 3.8 13.3 6.1 3.9 2.7 1.6Mississippi 52.3 21.2 12.9 8.3 5.0 20.8 8.4 5.1 3.3 2.0North Carolina 38.4 17.0 10.8 7.3 4.2 14.3 6.3 4.0 2.7 1.6Oklahoma 36.9 17.3 10.9 7.4 4.4 20.8 9.7 6.2 4.2 2.5South Carolina 61.7 28.5 18.2 12.2 7.2 23.8 11.0 7.0 4.7 2.8Tennessee 48.7 21.8 13.8 9.3 5.4 23.6 10.6 6.7 4.5 2.6Texas 42.5 18.9 11.5 7.5 4.2 12.2 5.4 3.3 2.1 1.2Virginia 48.6 21.9 13.9 9.1 5.2 19.2 8.6 5.5 3.6 2.0West Virginia 46.1 19.8 12.6 8.6 5.2 25.2 10.8 6.9 4.7 2.8
West 33.5 15.9 10.0 7.2 4.4 8.4 4.0 2.5 1.8 1.1Alaska 28.0 12.2 8.1 6.0 3.8 14.6 6.3 4.2 3.1 2.0Arizona 57.0 24.5 15.6 10.3 6.1 12.1 5.2 3.3 2.2 1.3California 35.0 15.2 9.1 5.8 3.2 6.1 2.7 1.6 1.0 0.6Colorado 35.5 17.1 11.2 7.6 4.5 14.6 7.0 4.6 3.1 1.8Hawaii 28.4 13.1 8.7 6.1 3.6 11.5 5.3 3.5 2.4 1.5Idaho 34.8 16.6 11.0 7.7 4.7 15.9 7.6 5.0 3.5 2.1Montana 28.2 14.2 9.3 6.6 4.1 14.4 7.2 4.8 3.4 2.1Nevada 36.3 16.7 10.8 7.4 4.6 15.0 6.9 4.4 3.0 1.9New Mexico 40.1 16.8 10.5 6.8 4.0 11.8 5.0 3.1 2.0 1.2Oregon 42.1 20.5 13.3 9.0 5.2 19.0 9.3 6.0 4.1 2.3Utah 23.9 11.9 8.1 5.9 3.6 14.5 7.2 4.9 3.5 2.2Washington 31.8 14.6 9.6 6.5 3.8 15.9 7.3 4.8 3.3 1.9Wyoming 17.3 9.1 5.8 4.2 2.9 11.4 6.0 3.9 2.8 1.9Midwest 38.4 17.9 12.0 8.4 5.2 18.9 8.8 5.9 4.2 2.6Illinois 58.3 24.8 15.3 10.3 6.0 18.1 7.7 4.7 3.2 1.9Indiana 35.1 16.3 10.8 7.5 4.6 20.7 9.6 6.4 4.4 2.7Iowa 33.0 16.8 11.2 8.0 5.1 19.4 9.9 6.6 4.7 3.0Kansas 33.1 15.6 10.4 7.2 4.5 13.5 6.4 4.2 3.0 1.8Michigan 60.1 26.9 17.3 11.7 7.1 19.4 8.7 5.6 3.8 2.3Minnesota 32.5 15.8 10.6 7.4 4.4 19.9 9.7 6.5 4.5 2.7Missouri 37.8 17.3 11.2 7.6 4.5 16.0 7.3 4.7 3.2 1.9Nebraska 28.6 14.4 9.6 6.8 4.2 12.3 6.2 4.1 2.9 1.8North Dakota 27.3 13.0 8.8 6.2 4.1 16.1 7.7 5.2 3.7 2.4Ohio 51.8 22.3 14.5 9.9 6.0 25.5 11.0 7.2 4.9 3.0South Dakota 37.2 17.2 11.8 8.7 5.5 24.7 11.4 7.8 5.8 3.6Wisconsin 35.7 16.7 11.1 7.9 4.9 19.1 9.0 5.9 4.2 2.6Northeast 43.7 19.6 12.8 8.4 4.9 21.2 9.5 6.2 4.1 2.4Connecticut 40.7 17.5 11.0 7.6 4.3 16.3 7.0 4.4 3.0 1.7Maine 34.7 17.0 11.4 7.8 4.8 16.6 8.1 5.4 3.7 2.3Massachusetts 40.3 16.8 10.4 7.0 4.1 19.8 8.2 5.1 3.4 2.0New Hampshire 45.0 22.5 15.5 11.1 6.6 22.9 11.4 7.9 5.6 3.3New Jersey 54.2 22.7 13.8 9.3 5.4 18.2 7.6 4.7 3.1 1.8New York 43.2 17.3 10.1 6.6 3.7 28.4 11.4 6.6 4.3 2.4Pennsylvania 63.7 29.2 19.0 12.9 7.6 26.3 12.1 7.8 5.3 3.1Rhode Island 52.3 21.9 13.4 9.4 5.8 21.2 8.9 5.4 3.8 2.4Vermont 49.2 22.1 14.6 10.7 6.7 27.1 12.2 8.0 5.9 3.7District of Columbia 48.4 11.9 5.6 3.3 1.7 NA NA NA NA NA
“NA” indicates not applicable. There was no institution of this type in the state during the specified years.1 Figures are based on median annual tuition and required fees for full-time, in-state under-
graduate students at public colleges and universities.
Sources: SREB analysis of National Center for Education Statistics institutional characteristics surveys — www.nces.ed.gov/ipeds. National Center for Higher Education Management Systems (NCHEMS) unpublished analysis of U.S. Census Bureau American Community Survey data — www.higheredinfo.org.
Table 63Percent of Median Family Incomes Required to Pay Median Annual Tuition and Fees1
Four-Year Colleges and Universities Two-Year Colleges2016-17
Family Income Family Income
Highest Fifth
Fourth Fifth
Middle Fifth
Second Fifth
Lowest Fifth
Highest Fifth
Fourth Fifth
Middle Fifth
Second Fifth
Lowest Fifth
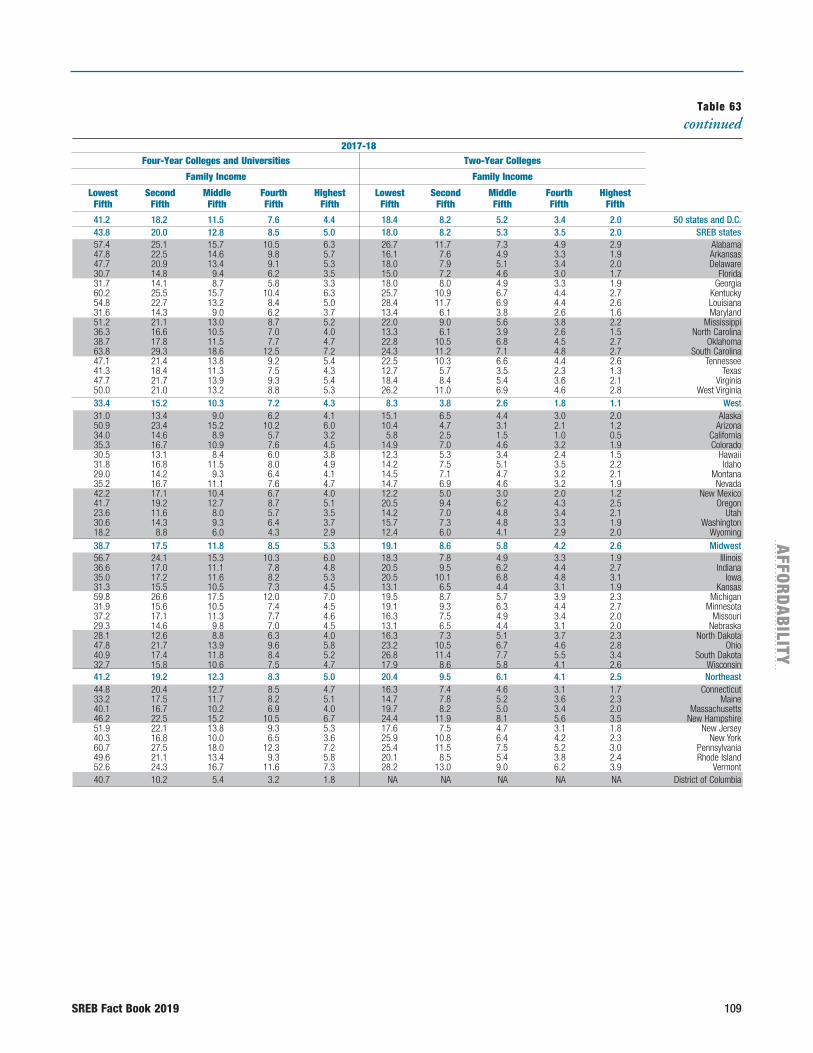
SREB Fact Book 2019 109
AFFO
RD
AB
ILITY
Table 63 continued
41.2 18.2 11.5 7.6 4.4 18.4 8.2 5.2 3.4 2.0 50statesandD.C. 43.8 20.0 12.8 8.5 5.0 18.0 8.2 5.3 3.5 2.0 SREBstates 57.4 25.1 15.7 10.5 6.3 26.7 11.7 7.3 4.9 2.9 Alabama 47.8 22.5 14.6 9.8 5.7 16.1 7.6 4.9 3.3 1.9 Arkansas 47.7 20.9 13.4 9.1 5.3 18.0 7.9 5.1 3.4 2.0 Delaware 30.7 14.8 9.4 6.2 3.5 15.0 7.2 4.6 3.0 1.7 Florida 31.7 14.1 8.7 5.8 3.3 18.0 8.0 4.9 3.3 1.9 Georgia 60.2 25.5 15.7 10.4 6.3 25.7 10.9 6.7 4.4 2.7 Kentucky 54.8 22.7 13.2 8.4 5.0 28.4 11.7 6.9 4.4 2.6 Louisiana 31.6 14.3 9.0 6.2 3.7 13.4 6.1 3.8 2.6 1.6 Maryland 51.2 21.1 13.0 8.7 5.2 22.0 9.0 5.6 3.8 2.2 Mississippi 36.3 16.6 10.5 7.0 4.0 13.3 6.1 3.9 2.6 1.5 NorthCarolina 38.7 17.8 11.5 7.7 4.7 22.8 10.5 6.8 4.5 2.7 Oklahoma 63.8 29.3 18.6 12.5 7.2 24.3 11.2 7.1 4.8 2.7 SouthCarolina 47.1 21.4 13.8 9.2 5.4 22.5 10.3 6.6 4.4 2.6 Tennessee 41.3 18.4 11.3 7.5 4.3 12.7 5.7 3.5 2.3 1.3 Texas 47.7 21.7 13.9 9.3 5.4 18.4 8.4 5.4 3.6 2.1 Virginia 50.0 21.0 13.2 8.8 5.3 26.2 11.0 6.9 4.6 2.8 WestVirginia 33.4 15.2 10.3 7.2 4.3 8.3 3.8 2.6 1.8 1.1 West 31.0 13.4 9.0 6.2 4.1 15.1 6.5 4.4 3.0 2.0 Alaska 50.9 23.4 15.2 10.2 6.0 10.4 4.7 3.1 2.1 1.2 Arizona 34.0 14.6 8.9 5.7 3.2 5.8 2.5 1.5 1.0 0.5 California 35.3 16.7 10.9 7.6 4.5 14.9 7.0 4.6 3.2 1.9 Colorado 30.5 13.1 8.4 6.0 3.8 12.3 5.3 3.4 2.4 1.5 Hawaii 31.8 16.8 11.5 8.0 4.9 14.2 7.5 5.1 3.5 2.2 Idaho 29.0 14.2 9.3 6.4 4.1 14.5 7.1 4.7 3.2 2.1 Montana 35.2 16.7 11.1 7.6 4.7 14.7 6.9 4.6 3.2 1.9 Nevada 42.2 17.1 10.4 6.7 4.0 12.2 5.0 3.0 2.0 1.2 NewMexico 41.7 19.2 12.7 8.7 5.1 20.5 9.4 6.2 4.3 2.5 Oregon 23.6 11.6 8.0 5.7 3.5 14.2 7.0 4.8 3.4 2.1 Utah 30.6 14.3 9.3 6.4 3.7 15.7 7.3 4.8 3.3 1.9 Washington 18.2 8.8 6.0 4.3 2.9 12.4 6.0 4.1 2.9 2.0 Wyoming 38.7 17.5 11.8 8.5 5.3 19.1 8.6 5.8 4.2 2.6 Midwest 56.7 24.1 15.3 10.3 6.0 18.3 7.8 4.9 3.3 1.9 Illinois 36.6 17.0 11.1 7.8 4.8 20.5 9.5 6.2 4.4 2.7 Indiana 35.0 17.2 11.6 8.2 5.3 20.5 10.1 6.8 4.8 3.1 Iowa 31.3 15.5 10.5 7.3 4.5 13.1 6.5 4.4 3.1 1.9 Kansas 59.8 26.6 17.5 12.0 7.0 19.5 8.7 5.7 3.9 2.3 Michigan 31.9 15.6 10.5 7.4 4.5 19.1 9.3 6.3 4.4 2.7 Minnesota 37.2 17.1 11.3 7.7 4.6 16.3 7.5 4.9 3.4 2.0 Missouri 29.3 14.6 9.8 7.0 4.5 13.1 6.5 4.4 3.1 2.0 Nebraska 28.1 12.6 8.8 6.3 4.0 16.3 7.3 5.1 3.7 2.3 NorthDakota 47.8 21.7 13.9 9.6 5.8 23.2 10.5 6.7 4.6 2.8 Ohio 40.9 17.4 11.8 8.4 5.2 26.8 11.4 7.7 5.5 3.4 SouthDakota 32.7 15.8 10.6 7.5 4.7 17.9 8.6 5.8 4.1 2.6 Wisconsin 41.2 19.2 12.3 8.3 5.0 20.4 9.5 6.1 4.1 2.5 Northeast 44.8 20.4 12.7 8.5 4.7 16.3 7.4 4.6 3.1 1.7 Connecticut 33.2 17.5 11.7 8.2 5.1 14.7 7.8 5.2 3.6 2.3 Maine 40.1 16.7 10.2 6.9 4.0 19.7 8.2 5.0 3.4 2.0 Massachusetts 46.2 22.5 15.2 10.5 6.7 24.4 11.9 8.1 5.6 3.5 NewHampshire 51.9 22.1 13.8 9.3 5.3 17.6 7.5 4.7 3.1 1.8 NewJersey 40.3 16.8 10.0 6.5 3.6 25.9 10.8 6.4 4.2 2.3 NewYork 60.7 27.5 18.0 12.3 7.2 25.4 11.5 7.5 5.2 3.0 Pennsylvania 49.6 21.1 13.4 9.3 5.8 20.1 8.5 5.4 3.8 2.4 RhodeIsland 52.6 24.3 16.7 11.6 7.3 28.2 13.0 9.0 6.2 3.9 Vermont 40.7 10.2 5.4 3.2 1.8 NA NA NA NA NA DistrictofColumbia
Four-Year Colleges and Universities Two-Year Colleges2017-18
Family Income Family Income
Highest Fifth
Fourth Fifth
Middle Fifth
Second Fifth
Lowest Fifth
Highest Fifth
Fourth Fifth
Middle Fifth
Second Fifth
Lowest Fifth

110 SREB Fact Book 2019
Table 64Median Annual Tuition and Required Fees for Full-Time Undergraduate Students at Public Universities, Colleges, and Technical Institutes or Colleges1
50 states and D.C. $10,568 $27,973 $9,763 $23,250 $8,271 $18,743 $7,970 $17,440SREB states 9,706 26,286 8,548 21,438 8,234 18,688 6,963 16,791as a percent of U.S. 91.8 94.0 87.6 92.2 99.5 99.7 87.4 96.3Alabama 10,874 28,870 9,304 20,256 8,692 16,276 9,544 18,268Arkansas 9,062 24,308 8,459 20,714 8,478 14,778 8,454 11,184Delaware 13,160 33,150 NA NA 7,868 16,904 NA NAFlorida 6,396 20,319 NA NA 5,776 18,658 5,970 20,949Georgia 10,465 27,182 12,418 33,014 6,352 17,169 5,735 16,196Kentucky 11,603 27,166 NA NA 9,366 19,144 8,184 19,638Louisiana 11,374 28,051 9,645 18,558 8,312 19,325 7,661 17,722Maryland 10,399 33,606 9,642 21,743 9,259 21,422 8,489 18,638Mississippi 8,300 22,358 7,621 18,314 NA NA 6,859 6,859North Carolina 8,128 24,908 6,973 23,250 6,897 19,416 5,183 16,791Oklahoma 8,901 24,110 NA NA 6,714 15,735 6,878 14,648South Carolina 13,489 34,010 NA NA 12,422 30,810 NA NATennessee 11,144 26,210 8,612 26,348 8,513 24,377 NA NATexas 10,123 23,609 7,651 21,396 7,769 18,148 6,387 17,440Virginia 13,230 32,768 20,287 43,670 10,729 24,970 NA NAWest Virginia 8,376 23,616 NA NA 7,798 17,856 NA NAWest 11,624 33,786 7,488 23,382 7,176 19,109 7,933 21,969as a percent of U.S. 110.0 120.8 76.7 100.6 86.8 102.0 99.5 126.0Alaska NA NA 7,910 23,382 6,870 19,494 NA NAArizona 11,208 29,901 10,541 22,185 8,917 18,523 10,301 26,038California 14,019 42,033 7,460 19,340 7,147 19,027 6,930 18,810Colorado 11,395 28,903 13,966 29,284 8,314 19,498 9,765 23,002Hawaii 11,754 33,786 NA NA NA NA NA NAIdaho NA NA 7,327 22,877 7,326 22,642 NA NAMontana NA NA 7,071 24,943 NA NA 6,486 20,346Nevada 7,602 21,637 NA NA NA NA NA NANew Mexico 6,955 21,530 NA NA 5,954 9,288 6,551 16,342Oregon 11,364 32,034 8,783 26,130 NA NA 9,243 25,142Utah 8,884 28,127 7,175 20,727 NA NA 6,194 17,774Washington 11,183 30,678 NA NA 7,506 22,936 10,911 35,475Wyoming NA NA 4,443 13,731 NA NA NA NAMidwest 10,563 26,549 9,809 21,464 9,078 17,294 7,859 15,586as a percent of U.S. 99.9 94.9 100.5 92.3 109.8 92.3 98.6 89.4Illinois 15,027 26,856 13,326 21,235 11,523 17,212 NA NAIndiana 10,263 31,820 9,334 25,942 7,723 18,042 7,207 19,038Iowa 8,801 26,541 NA NA 8,699 19,241 NA NAKansas 10,480 26,042 8,432 17,390 6,345 18,152 7,978 17,918Michigan 14,576 34,844 13,410 24,735 12,019 21,165 10,692 20,817Minnesota 14,417 26,603 NA NA 8,228 16,462 8,468 14,960Missouri 9,787 26,506 9,839 27,327 7,306 14,150 7,644 13,540Nebraska 8,978 24,278 NA NA 7,630 20,320 6,964 10,368North Dakota 8,546 20,572 8,447 20,047 NA NA 6,809 6,809Ohio 10,592 21,360 10,270 18,593 8,451 8,811 NA NASouth Dakota NA NA 8,607 11,854 NA NA 10,400 14,580Wisconsin 10,049 27,814 NA NA 9,456 17,423 7,946 15,982Northeast 14,638 28,418 14,085 31,865 10,225 20,186 9,038 17,682as a percent of U.S. 138.5 101.6 144.3 137.1 123.6 107.7 113.4 101.4Connecticut 14,880 36,948 NA NA 10,418 23,107 NA NAMaine NA NA 10,902 30,282 8,638 20,594 NA NAMassachusetts 15,411 33,477 14,314 32,425 10,278 16,706 9,818 15,898New Hampshire NA NA 18,067 32,637 13,770 22,230 NA NANew Jersey 14,638 30,579 15,492 30,972 12,804 20,842 12,627 20,705New York 9,490 24,403 NA NA 7,090 14,480 8,166 17,816Pennsylvania 18,436 30,642 12,146 17,271 11,078 20,861 10,840 15,586Rhode Island NA NA 13,792 30,042 8,776 21,289 NA NAVermont NA NA 17,740 41,356 NA NA NA NADistrict of Columbia NA NA NA NA 5,756 12,092 NA NA
“NA” indicates not applicable. There was no institution of this type in the state during the specified years.“NR” indicates not reported. Insufficient number of states reported to provide a median. “—” indicates not available.1 The medians for the United States and each region are the middle values of all four-year colleges
and universities. The median for each state is the middle value of the institutions in that state. Tuition and fees reported for the SREB states represent an annual course load of 30 credit-hours — the number to keep a student on track for on-time graduation. The non-SREB states report is based on a 12 credit-hours per term basis — the minimum number required to qualify as a full-time student for federal student financial aid programs.
2 SREB classifies four-year colleges into six categories based on number of degrees awarded and number of subjects in which degrees are awarded. (See Appendix A.)
Sources: SREB analysis of National Center for Education Statistics institutional characteristics surveys — www.nces.ed.gov/ipeds.
2017-18
SREB Categories of Universities and Colleges2
Four-Year
1 2 3 4
In-State Out-of-StateIn-State Out-of-State In-State Out-of-State In-State Out-of-State
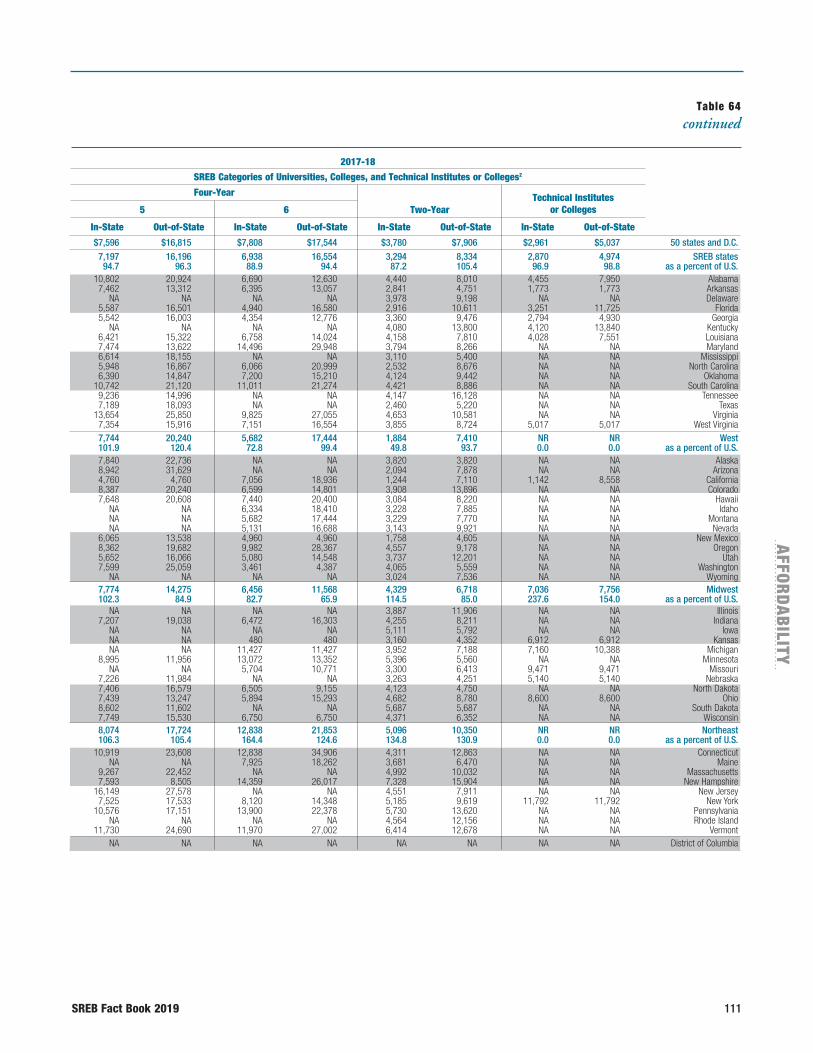
SREB Fact Book 2019 111
AFFO
RD
AB
ILITY
$7,596 $16,815 $7,808 $17,544 $3,780 $7,906 $2,961 $5,037 50 states and D.C. 7,197 16,196 6,938 16,554 3,294 8,334 2,870 4,974 SREB states 94.7 96.3 88.9 94.4 87.2 105.4 96.9 98.8 as a percent of U.S. 10,802 20,924 6,690 12,630 4,440 8,010 4,455 7,950 Alabama 7,462 13,312 6,395 13,057 2,841 4,751 1,773 1,773 Arkansas NA NA NA NA 3,978 9,198 NA NA Delaware 5,587 16,501 4,940 16,580 2,916 10,611 3,251 11,725 Florida 5,542 16,003 4,354 12,776 3,360 9,476 2,794 4,930 Georgia NA NA NA NA 4,080 13,800 4,120 13,840 Kentucky 6,421 15,322 6,758 14,024 4,158 7,810 4,028 7,551 Louisiana 7,474 13,622 14,496 29,948 3,794 8,266 NA NA Maryland 6,614 18,155 NA NA 3,110 5,400 NA NA Mississippi 5,948 16,867 6,066 20,999 2,532 8,676 NA NA North Carolina 6,390 14,847 7,200 15,210 4,124 9,442 NA NA Oklahoma 10,742 21,120 11,011 21,274 4,421 8,886 NA NA South Carolina 9,236 14,996 NA NA 4,147 16,128 NA NA Tennessee 7,189 18,093 NA NA 2,460 5,220 NA NA Texas 13,654 25,850 9,825 27,055 4,653 10,581 NA NA Virginia 7,354 15,916 7,151 16,554 3,855 8,724 5,017 5,017 West Virginia 7,744 20,240 5,682 17,444 1,884 7,410 NR NR West 101.9 120.4 72.8 99.4 49.8 93.7 0.0 0.0 as a percent of U.S. 7,840 22,736 NA NA 3,820 3,820 NA NA Alaska 8,942 31,629 NA NA 2,094 7,878 NA NA Arizona 4,760 4,760 7,056 18,936 1,244 7,110 1,142 8,558 California 8,387 20,240 6,599 14,801 3,908 13,896 NA NA Colorado 7,648 20,608 7,440 20,400 3,084 8,220 NA NA Hawaii NA NA 6,334 18,410 3,228 7,885 NA NA Idaho NA NA 5,682 17,444 3,229 7,770 NA NA Montana NA NA 5,131 16,688 3,143 9,921 NA NA Nevada 6,065 13,538 4,960 4,960 1,758 4,605 NA NA New Mexico 8,362 19,682 9,982 28,367 4,557 9,178 NA NA Oregon 5,652 16,066 5,080 14,548 3,737 12,201 NA NA Utah 7,599 25,059 3,461 4,387 4,065 5,559 NA NA Washington NA NA NA NA 3,024 7,536 NA NA Wyoming 7,774 14,275 6,456 11,568 4,329 6,718 7,036 7,756 Midwest 102.3 84.9 82.7 65.9 114.5 85.0 237.6 154.0 as a percent of U.S. NA NA NA NA 3,887 11,906 NA NA Illinois 7,207 19,038 6,472 16,303 4,255 8,211 NA NA Indiana NA NA NA NA 5,111 5,792 NA NA Iowa NA NA 480 480 3,160 4,352 6,912 6,912 Kansas NA NA 11,427 11,427 3,952 7,188 7,160 10,388 Michigan 8,995 11,956 13,072 13,352 5,396 5,560 NA NA Minnesota NA NA 5,704 10,771 3,300 6,413 9,471 9,471 Missouri 7,226 11,984 NA NA 3,263 4,251 5,140 5,140 Nebraska 7,406 16,579 6,505 9,155 4,123 4,750 NA NA North Dakota 7,439 13,247 5,894 15,293 4,682 8,780 8,600 8,600 Ohio 8,602 11,602 NA NA 5,687 5,687 NA NA South Dakota 7,749 15,530 6,750 6,750 4,371 6,352 NA NA Wisconsin 8,074 17,724 12,838 21,853 5,096 10,350 NR NR Northeast 106.3 105.4 164.4 124.6 134.8 130.9 0.0 0.0 as a percent of U.S. 10,919 23,608 12,838 34,906 4,311 12,863 NA NA Connecticut NA NA 7,925 18,262 3,681 6,470 NA NA Maine 9,267 22,452 NA NA 4,992 10,032 NA NA Massachusetts 7,593 8,505 14,359 26,017 7,328 15,904 NA NA New Hampshire 16,149 27,578 NA NA 4,551 7,911 NA NA New Jersey 7,525 17,533 8,120 14,348 5,185 9,619 11,792 11,792 New York 10,576 17,151 13,900 22,378 5,730 13,620 NA NA Pennsylvania NA NA NA NA 4,564 12,156 NA NA Rhode Island 11,730 24,690 11,970 27,002 6,414 12,678 NA NA Vermont NA NA NA NA NA NA NA NA District of Columbia
2017-18
SREB Categories of Universities, Colleges, and Technical Institutes or Colleges2
Four-Year
5 6 Two-YearTechnical Institutes
or Colleges
In-State Out-of-StateIn-State Out-of-State In-State Out-of-State In-State Out-of-State
Table 64continued

112 SREB Fact Book 2019
Table 65Federal Pell Grants1
50 states and D.C. $27,814,360 -10.3 $19,725,738 -5.0 $4,372,665 8.9 $3,715,957 -40.5
SREB states 10,625,686 -5.5 8,118,059 -3.9 1,420,824 14.4 1,086,804 -30.0as a percent of U.S. 38.2 41.2 32.5 29.2 Alabama 511,667 -8.7 375,159 -4.4 49,371 -0.8 87,137 -26.4Arkansas 270,862 -13.3 231,672 -16.7 29,216 16.8 9,974 5.4Delaware 64,944 5.3 44,279 11.6 17,223 3.7 3,442 -35.8Florida 2,015,743 -6.5 1,355,619 0.2 408,314 62.9 251,810 -54.5Georgia 927,698 -6.9 755,397 -0.7 92,669 -3.0 79,632 -43.3Kentucky 371,295 -15.8 277,045 -17.5 55,154 -4.3 39,096 -17.9Louisiana 422,840 3.0 342,737 3.8 26,028 -6.9 54,075 3.4Maryland 381,423 -7.8 317,374 -4.8 28,120 -10.5 35,930 -26.4Mississippi 341,609 -7.8 312,252 -7.8 25,456 -2.2 3,901 -34.1North Carolina 829,236 -10.4 691,777 -12.5 118,126 1.8 19,333 6.2Oklahoma 332,511 -3.2 251,357 -11.4 31,772 6.1 49,382 65.4South Carolina 370,709 -15.1 289,902 -18.3 70,908 5.6 9,898 -31.4Tennessee 549,629 -8.2 378,926 -9.5 99,996 -1.8 70,707 -9.9Texas 2,357,320 3.6 1,965,357 5.3 186,730 8.7 205,232 -13.7Virginia 680,183 -3.6 411,325 -5.3 168,953 4.0 99,905 -8.2West Virginia 198,016 -15.7 117,879 -15.6 12,789 2.6 67,349 -18.6West 7,206,866 -12.4 5,178,298 -0.1 650,243 22.0 1,378,325 -45.2as a percent of U.S. 25.9 26.3 14.9 37.1 Alaska 23,778 -40.9 21,504 -16.9 954 37.1 1,320 -90.3Arizona 955,604 -42.7 454,183 -3.5 2,327 -10.5 499,094 -58.2California 3,899,286 -1.1 3,076,853 11.9 257,568 4.9 564,865 -40.2Colorado 438,937 -10.2 276,930 -12.3 24,222 21.8 137,785 -10.0Hawaii 71,410 -14.7 56,536 -16.7 11,504 -12.7 3,370 25.7Idaho 177,074 -8.6 88,256 -30.8 80,427 43.9 8,392 -18.3Montana 62,272 -23.5 55,846 -23.9 4,725 -22.0 1,701 -14.6Nevada 143,338 7.2 123,713 6.8 3,463 66.9 16,162 2.3New Mexico 168,579 -24.2 160,588 -24.7 1,750 18.6 6,241 -20.2Oregon 293,295 -30.8 245,385 -30.1 26,670 -11.9 21,240 -50.1Utah 514,783 22.1 228,927 -3.3 196,436 66.4 89,420 34.2Washington 428,988 -12.5 362,676 -10.4 37,922 1.8 28,390 -41.0Wyoming 29,520 -33.0 26,901 -11.6 2,275 NA 345 -97.5Midwest 5,113,265 -23.5 3,542,030 -17.4 952,296 -10.3 618,938 -53.6as a percent of U.S. 18.4 18.0 21.8 16.7 Illinois 985,621 -19.1 566,299 -15.7 198,947 0.4 220,376 -36.7Indiana 490,361 -43.4 335,843 -26.6 100,134 4.8 54,384 -82.6Iowa 334,765 -20.8 261,101 32.8 60,551 -3.8 13,113 -92.0Kansas 248,677 -8.8 185,182 -11.3 32,749 -28.6 30,746 69.6Michigan 746,115 -26.6 587,518 -22.0 100,013 -44.9 58,584 -28.0Minnesota 425,049 -22.7 276,105 -19.6 60,329 0.7 88,615 -39.6Missouri 473,560 -22.1 299,165 -18.0 130,714 -14.3 43,681 -51.7Nebraska 135,199 -9.1 103,014 -7.9 28,980 0.6 3,205 -60.2North Dakota 45,790 -4.3 37,169 -5.2 7,455 0.1 1,166 -1.2Ohio 792,029 -21.3 566,789 -24.6 148,763 -8.6 76,477 -16.4South Dakota 73,542 -23.2 46,551 -11.3 6,456 -13.5 20,534 -42.6Wisconsin 362,557 -16.2 277,296 -18.2 77,204 31.2 8,057 -77.1Northeast 4,712,270 0.1 2,879,836 2.0 1,307,831 15.0 524,603 -29.8as a percent of U.S. 55.4 14.6 29.9 14.1 Connecticut 281,280 5.9 152,026 8.1 55,252 17.7 74,001 -5.2Maine 94,021 -12.6 68,796 -11.5 16,744 2.8 8,481 -37.3Massachusetts 488,401 -1.2 293,758 -1.8 174,372 10.2 20,271 -45.5New Hampshire 163,846 91.5 42,332 -5.7 119,303 294.0 2,211 -78.7New Jersey 662,123 2.0 493,949 4.0 90,157 19.4 78,017 -21.0New York 1,996,550 1.1 1,282,003 6.5 487,087 2.3 227,460 -22.8Pennsylvania 872,710 -11.1 466,044 -6.2 298,177 8.5 108,490 -48.3Rhode Island 112,507 7.2 56,828 4.1 50,732 9.6 4,948 20.4Vermont 40,833 -6.9 24,101 -18.2 16,008 21.7 724 -43.4District of Columbia 156,273 9.2 7,515 -23.2 41,471 7.4 107,287 13.3
1 Pell Grants generally are awarded only to undergraduate students who have not earned bachelor’s or advanced degrees. The amount a student may receive depends on the expected family contribution, the cost of attendance, whether the student attends full time or part time, and whether the student attends for a full academic year or less. The maximum award for the 2017-18 academic year was $5,920.
Sources: Office of Postsecondary Education, U.S. Department of Education: 2012-13 Award Year Grant Volume by School (2014), and 2017-18 Award Year Grant Volume by School (2018) — http://federalstudentaid.ed.gov/datacenter.
Amount (in thousands)
Total Public Colleges Private Colleges Proprietary Colleges
2017-18
Percent Change
2012-13 to 2017-18 2017-18
Percent Change
2012-13 to 2017-18 2017-18
Percent Change
2012-13 to 2017-18 2017-18
Percent Change
2012-13 to 2017-18
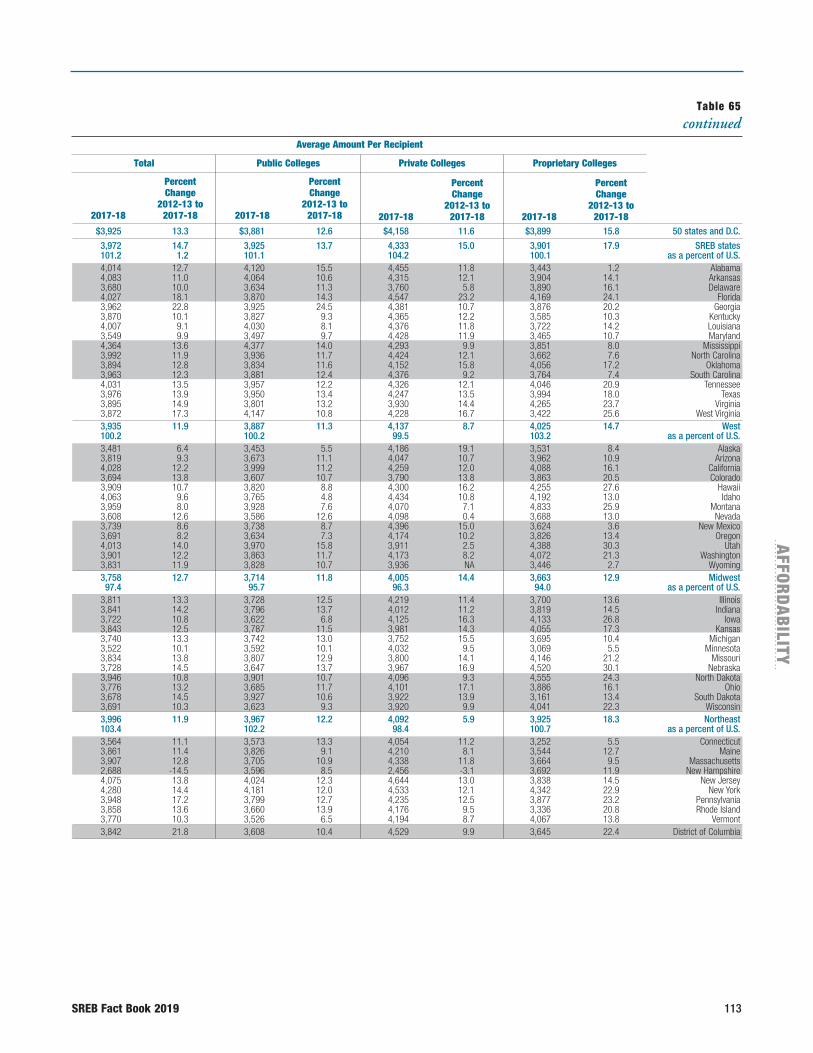
SREB Fact Book 2019 113
AFFO
RD
AB
ILITY
$3,925 13.3 $3,881 12.6 $4,158 11.6 $3,899 15.8 50 states and D.C.
3,972 14.7 3,925 13.7 4,333 15.0 3,901 17.9 SREB states 101.2 1.2 101.1 104.2 100.1 as a percent of U.S. 4,014 12.7 4,120 15.5 4,455 11.8 3,443 1.2 Alabama 4,083 11.0 4,064 10.6 4,315 12.1 3,904 14.1 Arkansas 3,680 10.0 3,634 11.3 3,760 5.8 3,890 16.1 Delaware 4,027 18.1 3,870 14.3 4,547 23.2 4,169 24.1 Florida 3,962 22.8 3,925 24.5 4,381 10.7 3,876 20.2 Georgia 3,870 10.1 3,827 9.3 4,365 12.2 3,585 10.3 Kentucky 4,007 9.1 4,030 8.1 4,376 11.8 3,722 14.2 Louisiana 3,549 9.9 3,497 9.7 4,428 11.9 3,465 10.7 Maryland 4,364 13.6 4,377 14.0 4,293 9.9 3,851 8.0 Mississippi 3,992 11.9 3,936 11.7 4,424 12.1 3,662 7.6 North Carolina 3,894 12.8 3,834 11.6 4,152 15.8 4,056 17.2 Oklahoma 3,963 12.3 3,881 12.4 4,376 9.2 3,764 7.4 South Carolina 4,031 13.5 3,957 12.2 4,326 12.1 4,046 20.9 Tennessee 3,976 13.9 3,950 13.4 4,247 13.5 3,994 18.0 Texas 3,895 14.9 3,801 13.2 3,930 14.4 4,265 23.7 Virginia 3,872 17.3 4,147 10.8 4,228 16.7 3,422 25.6 West Virginia 3,935 11.9 3,887 11.3 4,137 8.7 4,025 14.7 West 100.2 100.2 99.5 103.2 as a percent of U.S. 3,481 6.4 3,453 5.5 4,186 19.1 3,531 8.4 Alaska 3,819 9.3 3,673 11.1 4,047 10.7 3,962 10.9 Arizona 4,028 12.2 3,999 11.2 4,259 12.0 4,088 16.1 California 3,694 13.8 3,607 10.7 3,790 13.8 3,863 20.5 Colorado 3,909 10.7 3,820 8.8 4,300 16.2 4,255 27.6 Hawaii 4,063 9.6 3,765 4.8 4,434 10.8 4,192 13.0 Idaho 3,959 8.0 3,928 7.6 4,070 7.1 4,833 25.9 Montana 3,608 12.6 3,586 12.6 4,098 0.4 3,688 13.0 Nevada 3,739 8.6 3,738 8.7 4,396 15.0 3,624 3.6 New Mexico 3,691 8.2 3,634 7.3 4,174 10.2 3,826 13.4 Oregon 4,013 14.0 3,970 15.8 3,911 2.5 4,388 30.3 Utah 3,901 12.2 3,863 11.7 4,173 8.2 4,072 21.3 Washington 3,831 11.9 3,828 10.7 3,936 NA 3,446 2.7 Wyoming 3,758 12.7 3,714 11.8 4,005 14.4 3,663 12.9 Midwest 97.4 95.7 96.3 94.0 as a percent of U.S. 3,811 13.3 3,728 12.5 4,219 11.4 3,700 13.6 Illinois 3,841 14.2 3,796 13.7 4,012 11.2 3,819 14.5 Indiana 3,722 10.8 3,622 6.8 4,125 16.3 4,133 26.8 Iowa 3,843 12.5 3,787 11.5 3,981 14.3 4,055 17.3 Kansas 3,740 13.3 3,742 13.0 3,752 15.5 3,695 10.4 Michigan 3,522 10.1 3,592 10.1 4,032 9.5 3,069 5.5 Minnesota 3,834 13.8 3,807 12.9 3,800 14.1 4,146 21.2 Missouri 3,728 14.5 3,647 13.7 3,967 16.9 4,520 30.1 Nebraska 3,946 10.8 3,901 10.7 4,096 9.3 4,555 24.3 North Dakota 3,776 13.2 3,685 11.7 4,101 17.1 3,886 16.1 Ohio 3,678 14.5 3,927 10.6 3,922 13.9 3,161 13.4 South Dakota 3,691 10.3 3,623 9.3 3,920 9.9 4,041 22.3 Wisconsin 3,996 11.9 3,967 12.2 4,092 5.9 3,925 18.3 Northeast 103.4 102.2 98.4 100.7 as a percent of U.S. 3,564 11.1 3,573 13.3 4,054 11.2 3,252 5.5 Connecticut 3,861 11.4 3,826 9.1 4,210 8.1 3,544 12.7 Maine 3,907 12.8 3,705 10.9 4,338 11.8 3,664 9.5 Massachusetts 2,688 -14.5 3,596 8.5 2,456 -3.1 3,692 11.9 New Hampshire 4,075 13.8 4,024 12.3 4,644 13.0 3,838 14.5 New Jersey 4,280 14.4 4,181 12.0 4,533 12.1 4,342 22.9 New York 3,948 17.2 3,799 12.7 4,235 12.5 3,877 23.2 Pennsylvania 3,858 13.6 3,660 13.9 4,176 9.5 3,336 20.8 Rhode Island 3,770 10.3 3,526 6.5 4,194 8.7 4,067 13.8 Vermont 3,842 21.8 3,608 10.4 4,529 9.9 3,645 22.4 District of Columbia
Table 65continued
Average Amount Per Recipient
Total Public Colleges Private Colleges Proprietary Colleges
2017-18
Percent Change
2012-13 to 2017-18 2017-18
Percent Change
2012-13 to 2017-18 2017-18
Percent Change
2012-13 to 2017-18 2017-18
Percent Change
2012-13 to 2017-18
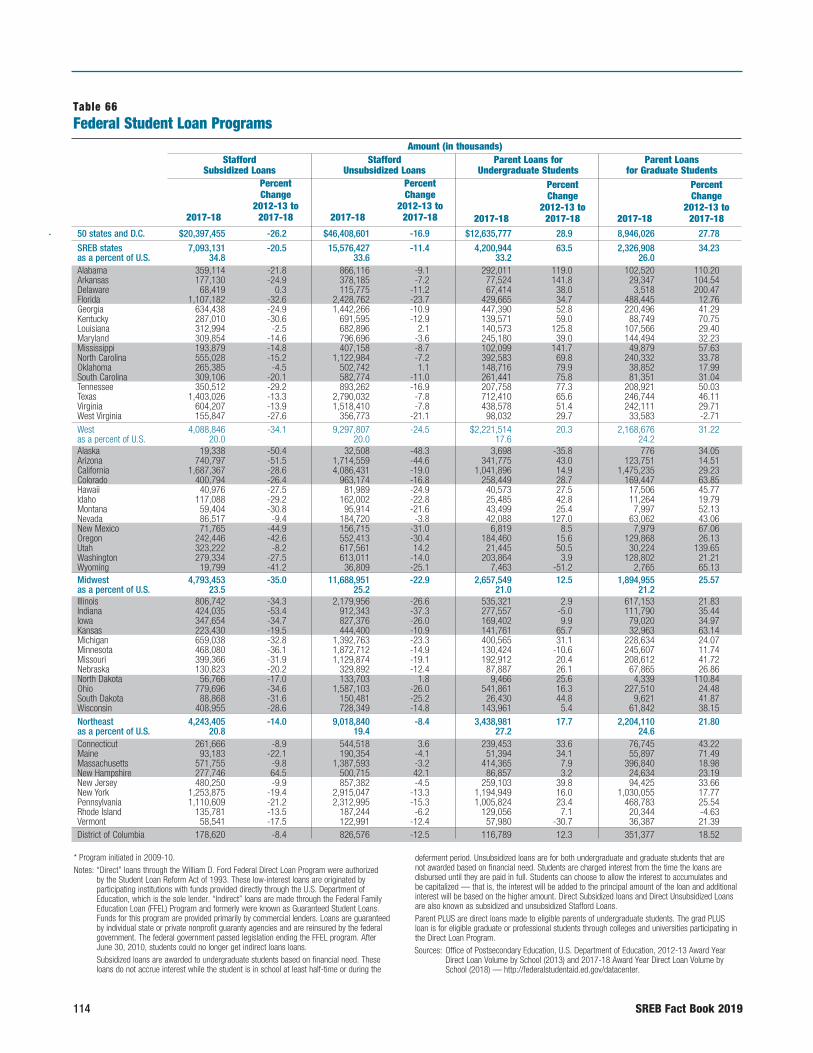
114 SREB Fact Book 2019
Table 66Federal Student Loan Programs
50 states and D.C. $20,397,455 -26.2 $46,408,601 -16.9 $12,635,777 28.9 8,946,026 27.78
SREB states 7,093,131 -20.5 15,576,427 -11.4 4,200,944 63.5 2,326,908 34.23as a percent of U.S. 34.8 33.6 33.2 26.0 Alabama 359,114 -21.8 866,116 -9.1 292,011 119.0 102,520 110.20Arkansas 177,130 -24.9 378,185 -7.2 77,524 141.8 29,347 104.54Delaware 68,419 0.3 115,775 -11.2 67,414 38.0 3,518 200.47Florida 1,107,182 -32.6 2,428,762 -23.7 429,665 34.7 488,445 12.76Georgia 634,438 -24.9 1,442,266 -10.9 447,390 52.8 220,496 41.29Kentucky 287,010 -30.6 691,595 -12.9 139,571 59.0 88,749 70.75Louisiana 312,994 -2.5 682,896 2.1 140,573 125.8 107,566 29.40Maryland 309,854 -14.6 796,696 -3.6 245,180 39.0 144,494 32.23Mississippi 193,879 -14.8 407,158 -8.7 102,099 141.7 49,879 57.63North Carolina 555,028 -15.2 1,122,984 -7.2 392,583 69.8 240,332 33.78Oklahoma 265,385 -4.5 502,742 1.1 148,716 79.9 38,852 17.99South Carolina 309,106 -20.1 582,774 -11.0 261,441 75.8 81,351 31.04Tennessee 350,512 -29.2 893,262 -16.9 207,758 77.3 208,921 50.03Texas 1,403,026 -13.3 2,790,032 -7.8 712,410 65.6 246,744 46.11Virginia 604,207 -13.9 1,518,410 -7.8 438,578 51.4 242,111 29.71West Virginia 155,847 -27.6 356,773 -21.1 98,032 29.7 33,583 -2.71West 4,088,846 -34.1 9,297,807 -24.5 $2,221,514 20.3 2,168,676 31.22as a percent of U.S. 20.0 20.0 17.6 24.2 Alaska 19,338 -50.4 32,508 -48.3 3,698 -35.8 776 34.05Arizona 740,797 -51.5 1,714,559 -44.6 341,775 43.0 123,751 14.51California 1,687,367 -28.6 4,086,431 -19.0 1,041,896 14.9 1,475,235 29.23Colorado 400,794 -26.4 963,174 -16.8 258,449 28.7 169,447 63.85Hawaii 40,976 -27.5 81,989 -24.9 40,573 27.5 17,506 45.77Idaho 117,088 -29.2 162,002 -22.8 25,485 42.8 11,264 19.79Montana 59,404 -30.8 95,914 -21.6 43,499 25.4 7,997 52.13Nevada 86,517 -9.4 184,720 -3.8 42,088 127.0 63,062 43.06New Mexico 71,765 -44.9 156,715 -31.0 6,819 8.5 7,979 67.06Oregon 242,446 -42.6 552,413 -30.4 184,460 15.6 129,868 26.13Utah 323,222 -8.2 617,561 14.2 21,445 50.5 30,224 139.65Washington 279,334 -27.5 613,011 -14.0 203,864 3.9 128,802 21.21Wyoming 19,799 -41.2 36,809 -25.1 7,463 -51.2 2,765 65.13Midwest 4,793,453 -35.0 11,688,951 -22.9 2,657,549 12.5 1,894,955 25.57as a percent of U.S. 23.5 25.2 21.0 21.2 Illinois 806,742 -34.3 2,179,956 -26.6 535,321 2.9 617,153 21.83Indiana 424,035 -53.4 912,343 -37.3 277,557 -5.0 111,790 35.44Iowa 347,654 -34.7 827,376 -26.0 169,402 9.9 79,020 34.97Kansas 223,430 -19.5 444,400 -10.9 141,761 65.7 32,963 63.14Michigan 659,038 -32.8 1,392,763 -23.3 400,565 31.1 228,634 24.07Minnesota 468,080 -36.1 1,872,712 -14.9 130,424 -10.6 245,607 11.74Missouri 399,366 -31.9 1,129,874 -19.1 192,912 20.4 208,612 41.72Nebraska 130,823 -20.2 329,892 -12.4 87,887 26.1 67,865 26.86North Dakota 56,766 -17.0 133,703 1.8 9,466 25.6 4,339 110.84Ohio 779,696 -34.6 1,587,103 -26.0 541,861 16.3 227,510 24.48South Dakota 88,868 -31.6 150,481 -25.2 26,430 44.8 9,621 41.87Wisconsin 408,955 -28.6 728,349 -14.8 143,961 5.4 61,842 38.15Northeast 4,243,405 -14.0 9,018,840 -8.4 3,438,981 17.7 2,204,110 21.80as a percent of U.S. 20.8 19.4 27.2 24.6 Connecticut 261,666 -8.9 544,518 3.6 239,453 33.6 76,745 43.22Maine 93,183 -22.1 190,354 -4.1 51,394 34.1 55,897 71.49Massachusetts 571,755 -9.8 1,387,593 -3.2 414,365 7.9 396,840 18.98New Hampshire 277,746 64.5 500,715 42.1 86,857 3.2 24,634 23.19New Jersey 480,250 -9.9 857,382 -4.5 259,103 39.8 94,425 33.66New York 1,253,875 -19.4 2,915,047 -13.3 1,194,949 16.0 1,030,055 17.77Pennsylvania 1,110,609 -21.2 2,312,995 -15.3 1,005,824 23.4 468,783 25.54Rhode Island 135,781 -13.5 187,244 -6.2 129,056 7.1 20,344 -4.63Vermont 58,541 -17.5 122,991 -12.4 57,980 -30.7 36,387 21.39District of Columbia 178,620 -8.4 826,576 -12.5 116,789 12.3 351,377 18.52
* Program initiated in 2009-10.Notes: “Direct” loans through the William D. Ford Federal Direct Loan Program were authorized by the Student Loan Reform Act of 1993. These low-interest loans are originated by participating institutions with funds provided directly through the U.S. Department of Education, which is the sole lender. “Indirect” loans are made through the Federal Family Education Loan (FFEL) Program and formerly were known as Guaranteed Student Loans. Funds for this program are provided primarily by commercial lenders. Loans are guaranteed by individual state or private nonprofit guaranty agencies and are reinsured by the federal government. The federal government passed legislation ending the FFEL program. After June 30, 2010, students could no longer get indirect loans loans. Subsidized loans are awarded to undergraduate students based on financial need. These loans do not accrue interest while the student is in school at least half-time or during the
deferment period. Unsubsidized loans are for both undergraduate and graduate students that are not awarded based on financial need. Students are charged interest from the time the loans are disbursed until they are paid in full. Students can choose to allow the interest to accumulates and be capitalized — that is, the interest will be added to the principal amount of the loan and additional interest will be based on the higher amount. Direct Subsidized loans and Direct Unsubsidized Loans are also known as subsidized and unsubsidized Stafford Loans.Parent PLUS are direct loans made to eligible parents of undergraduate students. The grad PLUS loan is for eligible graduate or professional students through colleges and universities participating in the Direct Loan Program.Sources: Office of Postsecondary Education, U.S. Department of Education, 2012-13 Award Year Direct Loan Volume by School (2013) and 2017-18 Award Year Direct Loan Volume by School (2018) — http://federalstudentaid.ed.gov/datacenter.
Amount (in thousands)Stafford
Subsidized Loans
2017-18
Percent Change
2012-13 to 2017-18 2017-18
Percent Change
2012-13 to 2017-18 2017-18
Percent Change
2012-13 to 2017-18 2017-18
Percent Change
2012-13 to 2017-18
Stafford Unsubsidized Loans
Parent Loans for Undergraduate Students
Parent Loans for Graduate Students

SREB Fact Book 2019 115
AFFO
RD
AB
ILITY
$3,733 0.9 $6,845 4.1 $15,121 8.6 $22,672 6.6 50 states and D.C.
3,695 2.2 6,679 4.5 14,039 6.6 20,502 5.1 SREB states 99.0 97.6 92.8 90.4 as a percent of U.S. 3,611 -0.1 6,625 5.3 15,931 10.5 17,549 5.1 Alabama 3,624 2.6 6,336 11.3 11,291 18.0 13,499 39.0 Arkansas 3,767 3.8 5,095 -5.1 18,810 5.7 17,858 32.7 Delaware 3,723 0.9 7,245 4.8 15,042 -3.5 23,006 2.2 Florida 3,642 3.2 6,760 9.9 14,630 -0.5 18,704 10.0 Georgia 3,584 0.7 6,713 9.4 11,782 16.7 17,936 23.4 Kentucky 3,517 -1.6 6,277 -2.7 12,170 -2.4 21,423 -2.1 Louisiana 3,736 3.0 7,224 5.8 15,902 7.0 21,943 9.3 Maryland 3,688 3.5 6,294 -0.5 12,734 9.4 18,872 -10.6 Mississippi 3,809 3.2 6,296 5.0 12,927 6.8 23,431 4.4 North Carolina 3,538 1.1 5,964 -2.0 14,451 14.5 18,164 -5.7 Oklahoma 3,718 4.1 5,848 4.0 15,190 6.1 20,077 -1.0 South Carolina 3,752 1.7 7,520 7.6 13,944 15.2 23,177 13.0 Tennessee 3,683 2.5 6,412 2.3 12,519 7.4 17,238 6.6 Texas 3,881 3.1 7,215 5.2 15,667 17.1 21,407 12.2 Virginia 3,613 11.1 6,249 10.9 14,421 13.1 16,953 -8.7 West Virginia 3,737 -0.5 7,194 3.7 16,291 12.5 23,486 8.0 West 100.1 105.1 107.7 103.6 as a percent of U.S. 3,609 0.8 5,526 1.5 12,751 30.0 8,254 42.6 Alaska 3,624 -1.0 6,654 -0.2 14,813 12.6 14,018 -21.5 Arizona 3,943 0.0 8,207 4.9 16,902 8.9 26,530 9.3 California 3,640 0.6 7,136 6.0 16,847 22.2 20,551 24.3 Colorado 3,800 3.1 6,770 0.5 17,413 30.7 18,160 44.1 Hawaii 3,776 4.0 5,566 10.9 12,983 20.0 17,601 31.4 Idaho 3,693 0.4 5,221 3.3 13,530 16.4 15,232 23.2 Montana 3,576 -4.9 7,453 5.3 15,571 10.9 37,559 33.6 Nevada 3,626 4.4 7,309 18.6 8,265 -19.1 13,570 29.6 New Mexico 3,657 -1.1 7,048 8.9 18,849 26.8 20,362 11.8 Oregon 3,356 -8.2 5,393 -8.4 11,649 -0.7 20,042 57.8 Utah 3,681 0.6 6,792 7.1 15,979 13.2 18,105 -2.9 Washington 3,365 3.9 5,291 12.0 12,585 -14.9 16,078 39.2 Wyoming 3,700 0.5 6,904 6.4 13,436 9.8 20,460 5.0 Midwest 99.1 100.8 88.9 90.2 as a percent of U.S. 3,897 -0.7 7,800 3.0 15,461 7.2 25,839 10.6 Illinois 3,590 -1.7 6,189 13.7 13,634 5.5 20,923 11.7 Indiana 3,617 -2.8 6,740 1.3 12,687 12.4 16,910 14.6 Iowa 3,647 2.8 6,096 4.8 13,064 24.7 16,326 25.9 Kansas 3,704 2.6 6,501 5.7 12,939 12.5 19,842 12.8 Michigan 3,592 -1.2 8,279 8.2 12,683 15.0 16,048 -19.8 Minnesota 3,773 2.9 7,835 8.4 12,107 11.4 20,832 5.4 Missouri 3,708 2.6 7,026 4.6 12,289 19.8 22,063 21.6 Nebraska 3,769 2.8 6,005 11.1 10,684 16.0 14,608 14.3 North Dakota 3,676 1.5 6,132 4.8 13,788 5.7 17,872 6.2 Ohio 3,682 3.0 5,187 3.8 9,306 29.6 18,646 8.6 South Dakota 3,645 -0.2 5,651 6.2 12,786 12.5 19,099 7.9 Wisconsin 3,824 0.3 6,505 2.0 17,403 9.6 26,067 9.6 Northeast 102.4 95.0 115.1 115.0 as a percent of U.S. 3,767 -0.4 6,266 7.4 17,145 10.3 21,497 15.5 Connecticut 3,716 1.6 6,216 12.1 14,884 14.3 25,224 31.2 Maine 3,977 1.3 7,229 3.3 19,205 5.3 28,472 13.1 Massachusetts 3,297 -15.6 4,881 -24.4 16,550 9.8 18,805 -24.4 New Hampshire 3,855 2.6 5,760 3.9 14,677 7.9 20,311 10.9 New Jersey 3,825 0.8 7,151 3.8 18,172 10.6 27,931 8.8 New York 3,889 1.9 6,446 4.0 16,852 12.4 23,998 10.7 Pennsylvania 3,947 4.4 4,748 3.5 17,727 6.4 22,605 1.5 Rhode Island 3,943 1.3 6,299 2.2 19,372 14.3 23,325 8.2 Vermont 3,905 3.4 10,960 -1.4 25,279 11.0 30,351 10.5 District of Columbia
Table 66continued
Average Amount Per RecipientStafford
Subsidized Loans
2017-18
Percent Change
2012-13 to 2017-18 2017-18
Percent Change
2012-13 to 2017-18 2017-18
Percent Change
2012-13 to 2017-18 2017-18
Percent Change
2012-13 to 2017-18
Stafford Unsubsidized Loans
Parent Loans for Undergraduate Students
Parent Loans for Graduate Students
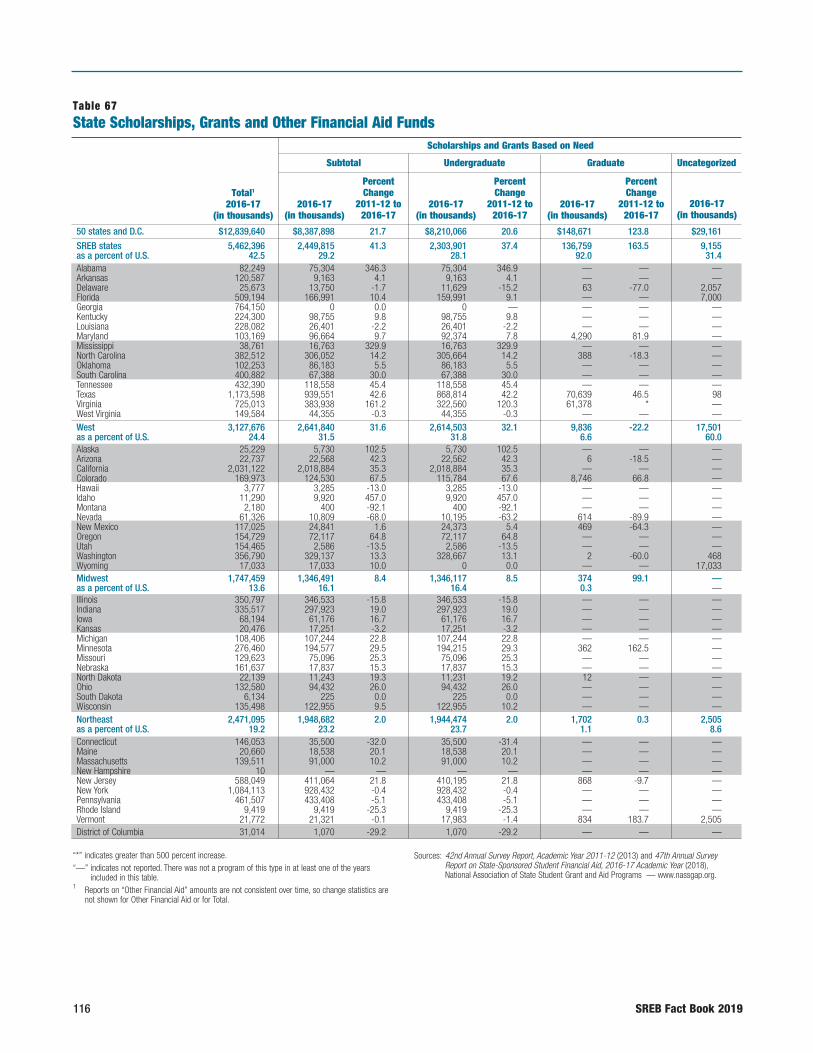
116 SREB Fact Book 2019
50 states and D.C. $12,839,640 $8,387,898 21.7 $8,210,066 20.6 $148,671 123.8 $29,161
SREB states 5,462,396 2,449,815 41.3 2,303,901 37.4 136,759 163.5 9,155as a percent of U.S. 42.5 29.2 28.1 92.0 31.4Alabama 82,249 75,304 346.3 75,304 346.9 — — —Arkansas 120,587 9,163 4.1 9,163 4.1 — — —Delaware 25,673 13,750 -1.7 11,629 -15.2 63 -77.0 2,057Florida 509,194 166,991 10.4 159,991 9.1 — — 7,000Georgia 764,150 0 0.0 0 — — — —Kentucky 224,300 98,755 9.8 98,755 9.8 — — —Louisiana 228,082 26,401 -2.2 26,401 -2.2 — — —Maryland 103,169 96,664 9.7 92,374 7.8 4,290 81.9 —Mississippi 38,761 16,763 329.9 16,763 329.9 — — —North Carolina 382,512 306,052 14.2 305,664 14.2 388 -18.3 —Oklahoma 102,253 86,183 5.5 86,183 5.5 — — —South Carolina 400,882 67,388 30.0 67,388 30.0 — — —Tennessee 432,390 118,558 45.4 118,558 45.4 — — —Texas 1,173,598 939,551 42.6 868,814 42.2 70,639 46.5 98Virginia 725,013 383,938 161.2 322,560 120.3 61,378 * —West Virginia 149,584 44,355 -0.3 44,355 -0.3 — — —West 3,127,676 2,641,840 31.6 2,614,503 32.1 9,836 -22.2 17,501as a percent of U.S. 24.4 31.5 31.8 6.6 60.0Alaska 25,229 5,730 102.5 5,730 102.5 — — —Arizona 22,737 22,568 42.3 22,562 42.3 6 -18.5 —California 2,031,122 2,018,884 35.3 2,018,884 35.3 — — —Colorado 169,973 124,530 67.5 115,784 67.6 8,746 66.8 —Hawaii 3,777 3,285 -13.0 3,285 -13.0 — — —Idaho 11,290 9,920 457.0 9,920 457.0 — — —Montana 2,180 400 -92.1 400 -92.1 — — —Nevada 61,326 10,809 -68.0 10,195 -63.2 614 -89.9 —New Mexico 117,025 24,841 1.6 24,373 5.4 469 -64.3 —Oregon 154,729 72,117 64.8 72,117 64.8 — — —Utah 154,465 2,586 -13.5 2,586 -13.5 — — —Washington 356,790 329,137 13.3 328,667 13.1 2 -60.0 468Wyoming 17,033 17,033 10.0 0 0.0 — — 17,033Midwest 1,747,459 1,346,491 8.4 1,346,117 8.5 374 99.1 —as a percent of U.S. 13.6 16.1 16.4 0.3 —Illinois 350,797 346,533 -15.8 346,533 -15.8 — — —Indiana 335,517 297,923 19.0 297,923 19.0 — — —Iowa 68,194 61,176 16.7 61,176 16.7 — — —Kansas 20,476 17,251 -3.2 17,251 -3.2 — — —Michigan 108,406 107,244 22.8 107,244 22.8 — — —Minnesota 276,460 194,577 29.5 194,215 29.3 362 162.5 —Missouri 129,623 75,096 25.3 75,096 25.3 — — —Nebraska 161,637 17,837 15.3 17,837 15.3 — — —North Dakota 22,139 11,243 19.3 11,231 19.2 12 — —Ohio 132,580 94,432 26.0 94,432 26.0 — — —South Dakota 6,134 225 0.0 225 0.0 — — —Wisconsin 135,498 122,955 9.5 122,955 10.2 — — —Northeast 2,471,095 1,948,682 2.0 1,944,474 2.0 1,702 0.3 2,505as a percent of U.S. 19.2 23.2 23.7 1.1 8.6Connecticut 146,053 35,500 -32.0 35,500 -31.4 — — —Maine 20,660 18,538 20.1 18,538 20.1 — — —Massachusetts 139,511 91,000 10.2 91,000 10.2 — — —New Hampshire 10 — — — — — — —New Jersey 588,049 411,064 21.8 410,195 21.8 868 -9.7 —New York 1,084,113 928,432 -0.4 928,432 -0.4 — — —Pennsylvania 461,507 433,408 -5.1 433,408 -5.1 — — —Rhode Island 9,419 9,419 -25.3 9,419 -25.3 — — —Vermont 21,772 21,321 -0.1 17,983 -1.4 834 183.7 2,505District of Columbia 31,014 1,070 -29.2 1,070 -29.2 — — —
“*” indicates greater than 500 percent increase.“—” indicates not reported. There was not a program of this type in at least one of the years
included in this table.1 Reports on “Other Financial Aid” amounts are not consistent over time, so change statistics are
not shown for Other Financial Aid or for Total.
Sources: 42nd Annual Survey Report, Academic Year 2011-12 (2013) and 47th Annual Survey Report on State-Sponsored Student Financial Aid, 2016-17 Academic Year (2018), National Association of State Student Grant and Aid Programs — www.nassgap.org.
Subtotal Undergraduate Graduate Uncategorized
Scholarships and Grants Based on Need
2016-17 (in thousands)
Percent Change
2011-12 to 2016-17
2016-17 (in thousands)
Percent Change
2011-12 to 2016-17
2016-17 (in thousands)
Percent Change
2011-12 to 2016-17
2016-17 (in thousands)
Table 67State Scholarships, Grants and Other Financial Aid Funds
Total1 2016-17
(in thousands)

SREB Fact Book 2019 117
AFFO
RD
AB
ILITY
$2,593,964 6.1 $2,544,506 6.3 $42,892 21.4 $6,566 $1,857,778 14.5 50 states and D.C. 2,222,728 4.5 2,178,156 4.0 $38,347 32.4 6,225 789,853 14.5 SREB states 85.7 85.6 89.4 95 42.5 as a percent of U.S. 6,779 159.2 4,855 163.3 1,924 149.5 — 166 0 Alabama 108,985 -25.6 102,188 -27.5 6,796 18.9 — 2,440 2.0 Arkansas 11,429 63.0 8,577 34.1 1,760 186.6 1,092 494 1.9 Delaware 229,216 -32.5 225,716 -33.1 — — 3,500 112,987 22.2 Florida 728,853 29.9 728,853 29.9 — — — 35,297 4.6 Georgia 123,001 17.3 123,001 17.3 — — — 2,545 1.1 Kentucky 201,681 17.4 200,767 17.8 914 -9.8 — — — Louisiana 3,487 -29.3 686 -83.2 1,168 — 1,633 3,017 2.9 Maryland 19,483 2.3 19,483 2.5 — — — 2,515 6.5 Mississippi 6,457 -89.2 6,144 -89.7 313 — — 70,003 18.3 North Carolina 11,785 6.4 11,752 7.2 33 26.4 — 4,286 4.2 Oklahoma 330,892 20.0 327,482 20.0 3,410 19.2 — 2,602 0.6 South Carolina 287,830 0.9 287,830 0.9 — — — 26,002 6.0 Tennessee — — — — — — — 234,047 19.9 Texas 94,295 22.1 72,641 22.1 21,654 22.1 — 246,780 34.0 Virginia 58,556 -1.9 58,181 -2.2 375 97.4 — 46,672 31.2 West Virginia 159,330 40.0 157,854 43.5 1,190 -0.3 286 326,507 10.6 West 6.1 6.2 2.8 4.4 17.6 as a percent of U.S. 11,265 276.0 11,265 276.0 — — — 8,235 32.6 Alaska — — — — — — — 169 0.7 Arizona 2,444 1.0 1,254 — 1,190 — — 9,794 0.5 California 5,788 1,485.7 5,788 * — — — 39,656 23.3 Colorado — — — — — — — 492 13.0 Hawaii 185 -95.9 185 -95.9 — — — 1,186 10.5 Idaho 929 -32.8 929 -32.8 — — — 851 39.0 Montana 32,021 40.1 32,021 40.1 — — — 18,496 30.2 Nevada 82,589 18.1 82,325 18.5 — — $264 9,595 8.2 New Mexico 22 -49.7 — — — — $22 82,590 53.4 Oregon 11,647 76.8 11,647 104.5 — — — 140,232 90.8 Utah 12,441 352.9 12,441 352.9 — — — 15,212 4.3 Washington — — — — — — — — — Wyoming 127,451 8.5 124,644 19.3 $2,807 -23.1 — 273,517 15.7 Midwest 4.9 4.9 6.5 14.7 as a percent of U.S. 981 -95.0 931 -94.1 50 -98.6 — 3,283 0.9 Illinois 5,903 -31.2 5,903 8,581.5 — — — 31,691 9.4 Indiana 5,216 0.4 5,216 0.4 — — — 1,802 2.6 Iowa — — — — — — — 3,225 15.8 Kansas 1,100 8.9 1,100 8.9 — — — 62 0.1 Michigan 1,560 0.7 1,110 * 450 3,117.2 — 80,323 29.1 Minnesota 54,526 47.2 54,526 47.2 — — — — — Missouri 2,580 — 2,135 — 445 — — 141,220 87.4 Nebraska 9,331 1.3 7,469 0.9 1,862 — — 1,565 7.1 North Dakota 37,253 10.0 37,253 10.0 — — — 896 0.7 Ohio 5,337 30.0 5,337 30.0 — — — 572 9.3 South Dakota 3,664 19.4 3,664 19.4 — — — 8,879 6.6 Wisconsin 54,512 1.2 53,908 3.0 549 -64.1 55 467,901 18.9 Northeast 2.1 2.1 1.3 0.8 25.2 as a percent of U.S. 214 -30.8 214 -30.8 — — — 110,339 75.5 Connecticut — — — — — — — 2,122 10.3 Maine 2,727 -61.8 2,727 -61.8 — — — 45,784 32.8 Massachusetts 10 — — — — — 10 — — New Hampshire 7,429 -46.2 7,429 -46.2 — — — 169,556 28.8 New Jersey 41,655 29.6 41,655 34.4 — — — 114,026 10.5 New York 2,407 497.2 1,813 — 549 49.5 45 25,693 5.6 Pennsylvania — — — — — — — — — Rhode Island 70 -21.6 70 -21.6 — — — 381 1.8 Vermont 29,944 -11.1 29,944 -11.1 — — — — — District of Columbia
Subtotal Undergraduate Graduate Uncategorized
Table 67 continued
Scholarships and Grants Not Based on Need Other Financial Aid1
2016-17 (in thousands)
Percent Change
2011-12 to 2016-17
2016-17 (in thousands)
Percent Change 2011-12
to2016-172016-17
(in thousands)
Percent Change
2011-12 to 2016-17
2016-17 (in thousands)
Percent of Total 2016-17
2016-17 (in thousands)
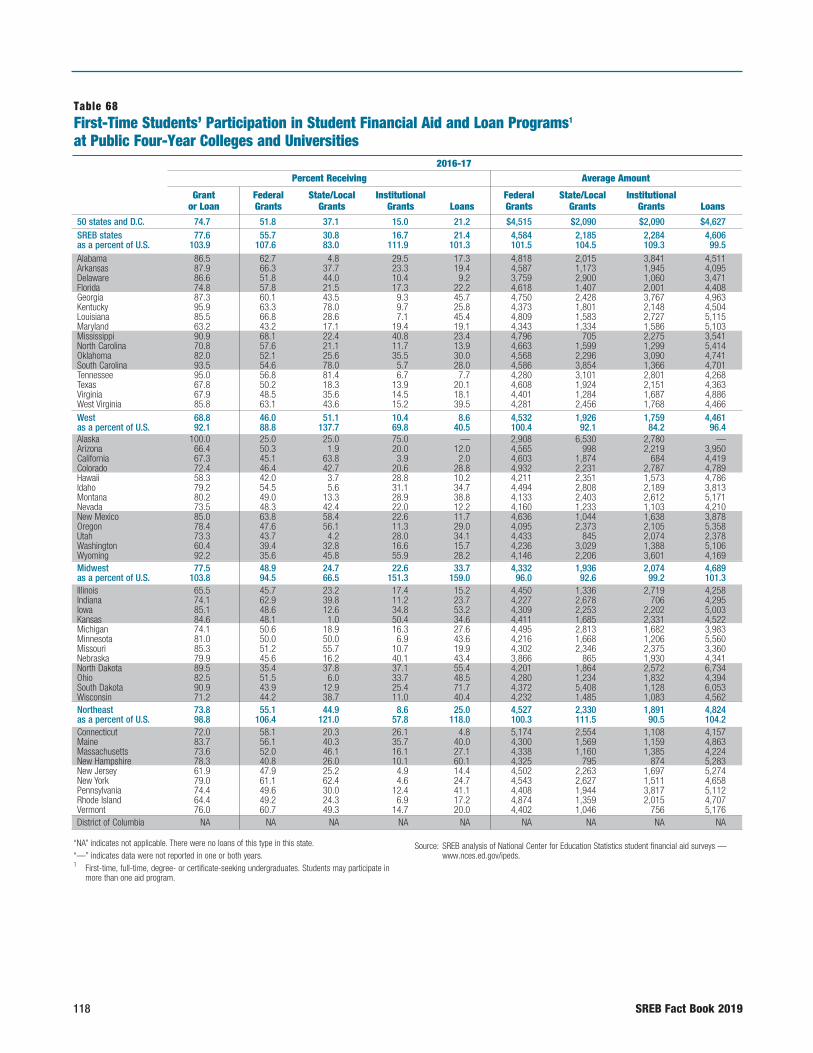
118 SREB Fact Book 2019
50 states and D.C. 74.7 51.8 37.1 15.0 21.2 $4,515 $2,090 $2,090 $4,627SREB states 77.6 55.7 30.8 16.7 21.4 4,584 2,185 2,284 4,606as a percent of U.S. 103.9 107.6 83.0 111.9 101.3 101.5 104.5 109.3 99.5Alabama 86.5 62.7 4.8 29.5 17.3 4,818 2,015 3,841 4,511Arkansas 87.9 66.3 37.7 23.3 19.4 4,587 1,173 1,945 4,095Delaware 86.6 51.8 44.0 10.4 9.2 3,759 2,900 1,060 3,471Florida 74.8 57.8 21.5 17.3 22.2 4,618 1,407 2,001 4,408Georgia 87.3 60.1 43.5 9.3 45.7 4,750 2,428 3,767 4,963Kentucky 95.9 63.3 78.0 9.7 25.8 4,373 1,801 2,148 4,504Louisiana 85.5 66.8 28.6 7.1 45.4 4,809 1,583 2,727 5,115Maryland 63.2 43.2 17.1 19.4 19.1 4,343 1,334 1,586 5,103Mississippi 90.9 68.1 22.4 40.8 23.4 4,796 705 2,275 3,541North Carolina 70.8 57.6 21.1 11.7 13.9 4,663 1,599 1,299 5,414Oklahoma 82.0 52.1 25.6 35.5 30.0 4,568 2,296 3,090 4,741South Carolina 93.5 54.6 78.0 5.7 28.0 4,586 3,854 1,366 4,701Tennessee 95.0 56.8 81.4 6.7 7.7 4,280 3,101 2,801 4,268Texas 67.8 50.2 18.3 13.9 20.1 4,608 1,924 2,151 4,363Virginia 67.9 48.5 35.6 14.5 18.1 4,401 1,284 1,687 4,886West Virginia 85.8 63.1 43.6 15.2 39.5 4,281 2,456 1,768 4,466West 68.8 46.0 51.1 10.4 8.6 4,532 1,926 1,759 4,461as a percent of U.S. 92.1 88.8 137.7 69.8 40.5 100.4 92.1 84.2 96.4Alaska 100.0 25.0 25.0 75.0 — 2,908 6,530 2,780 —Arizona 66.4 50.3 1.9 20.0 12.0 4,565 998 2,219 3,950California 67.3 45.1 63.8 3.9 2.0 4,603 1,874 684 4,419Colorado 72.4 46.4 42.7 20.6 28.8 4,932 2,231 2,787 4,789Hawaii 58.3 42.0 3.7 28.8 10.2 4,211 2,351 1,573 4,786Idaho 79.2 54.5 5.6 31.1 34.7 4,494 2,808 2,189 3,813Montana 80.2 49.0 13.3 28.9 38.8 4,133 2,403 2,612 5,171Nevada 73.5 48.3 42.4 22.0 12.2 4,160 1,233 1,103 4,210New Mexico 85.0 63.8 58.4 22.6 11.7 4,636 1,044 1,638 3,878Oregon 78.4 47.6 56.1 11.3 29.0 4,095 2,373 2,105 5,358Utah 73.3 43.7 4.2 28.0 34.1 4,433 845 2,074 2,378Washington 60.4 39.4 32.8 16.6 15.7 4,236 3,029 1,388 5,106Wyoming 92.2 35.6 45.8 55.9 28.2 4,146 2,206 3,601 4,169Midwest 77.5 48.9 24.7 22.6 33.7 4,332 1,936 2,074 4,689as a percent of U.S. 103.8 94.5 66.5 151.3 159.0 96.0 92.6 99.2 101.3Illinois 65.5 45.7 23.2 17.4 15.2 4,450 1,336 2,719 4,258Indiana 74.1 62.9 39.8 11.2 23.7 4,227 2,678 706 4,295Iowa 85.1 48.6 12.6 34.8 53.2 4,309 2,253 2,202 5,003Kansas 84.6 48.1 1.0 50.4 34.6 4,411 1,685 2,331 4,522Michigan 74.1 50.6 18.9 16.3 27.6 4,495 2,813 1,682 3,983Minnesota 81.0 50.0 50.0 6.9 43.6 4,216 1,668 1,206 5,560Missouri 85.3 51.2 55.7 10.7 19.9 4,302 2,346 2,375 3,360Nebraska 79.9 45.6 16.2 40.1 43.4 3,866 865 1,930 4,341North Dakota 89.5 35.4 37.8 37.1 55.4 4,201 1,864 2,572 6,734Ohio 82.5 51.5 6.0 33.7 48.5 4,280 1,234 1,832 4,394South Dakota 90.9 43.9 12.9 25.4 71.7 4,372 5,408 1,128 6,053Wisconsin 71.2 44.2 38.7 11.0 40.4 4,232 1,485 1,083 4,562Northeast 73.8 55.1 44.9 8.6 25.0 4,527 2,330 1,891 4,824as a percent of U.S. 98.8 106.4 121.0 57.8 118.0 100.3 111.5 90.5 104.2Connecticut 72.0 58.1 20.3 26.1 4.8 5,174 2,554 1,108 4,157Maine 83.7 56.1 40.3 35.7 40.0 4,300 1,569 1,159 4,863Massachusetts 73.6 52.0 46.1 16.1 27.1 4,338 1,160 1,385 4,224New Hampshire 78.3 40.8 26.0 10.1 60.1 4,325 795 874 5,283New Jersey 61.9 47.9 25.2 4.9 14.4 4,502 2,263 1,697 5,274New York 79.0 61.1 62.4 4.6 24.7 4,543 2,627 1,511 4,658Pennsylvania 74.4 49.6 30.0 12.4 41.1 4,408 1,944 3,817 5,112Rhode Island 64.4 49.2 24.3 6.9 17.2 4,874 1,359 2,015 4,707Vermont 76.0 60.7 49.3 14.7 20.0 4,402 1,046 756 5,176District of Columbia NA NA NA NA NA NA NA NA NA
“NA” indicates not applicable. There were no loans of this type in this state.“—” indicates data were not reported in one or both years.1 First-time, full-time, degree- or certificate-seeking undergraduates. Students may participate in
more than one aid program.
Source: SREB analysis of National Center for Education Statistics student financial aid surveys — www.nces.ed.gov/ipeds.
Table 68First-Time Students’ Participation in Student Financial Aid and Loan Programs1
at Public Four-Year Colleges and Universities
Percent Receiving Average Amount
Loans
Institutional Grants
State/Local Grants
Federal Grants
Loans
Institutional Grants
State/Local Grants
Federal Grants
2016-17
Grant or Loan
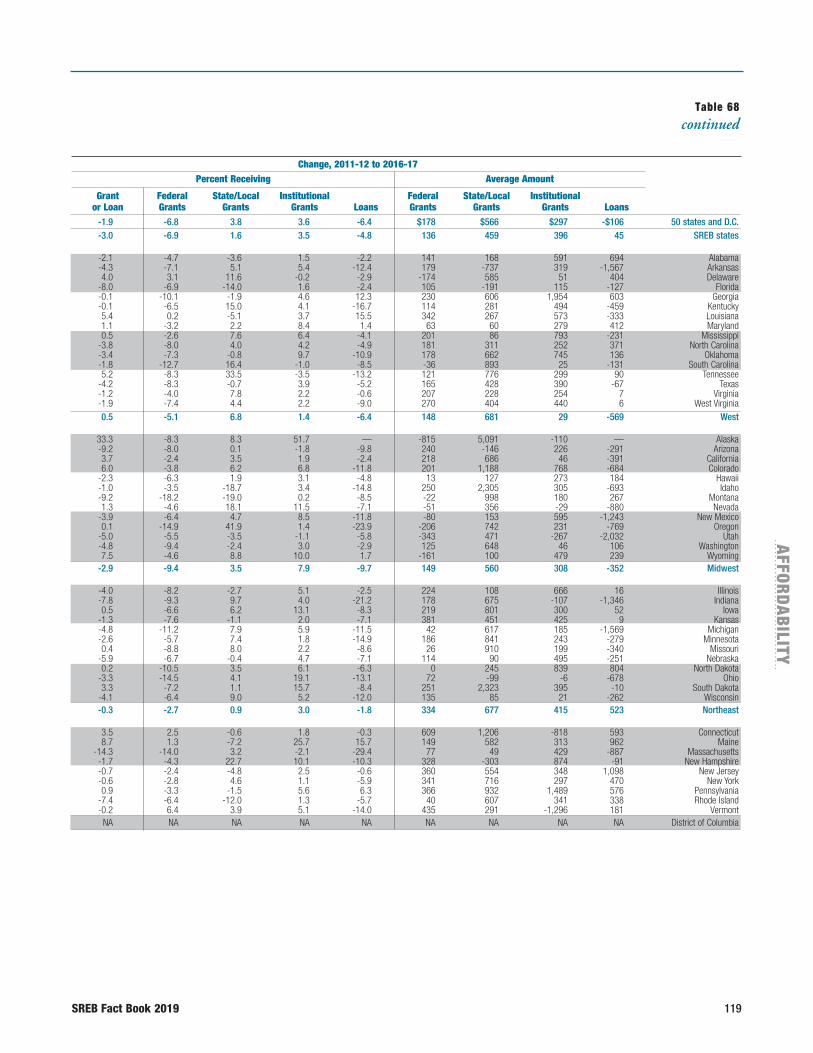
SREB Fact Book 2019 119
AFFO
RD
AB
ILITY
-1.9 -6.8 3.8 3.6 -6.4 $178 $566 $297 -$106 50 states and D.C. -3.0 -6.9 1.6 3.5 -4.8 136 459 396 45 SREB states -2.1 -4.7 -3.6 1.5 -2.2 141 168 591 694 Alabama -4.3 -7.1 5.1 5.4 -12.4 179 -737 319 -1,567 Arkansas 4.0 3.1 11.6 -0.2 -2.9 -174 585 51 404 Delaware -8.0 -6.9 -14.0 1.6 -2.4 105 -191 115 -127 Florida -0.1 -10.1 -1.9 4.6 12.3 230 606 1,954 603 Georgia -0.1 -6.5 15.0 4.1 -16.7 114 281 494 -459 Kentucky 5.4 0.2 -5.1 3.7 15.5 342 267 573 -333 Louisiana 1.1 -3.2 2.2 8.4 1.4 63 60 279 412 Maryland 0.5 -2.6 7.6 6.4 -4.1 201 86 793 -231 Mississippi -3.8 -8.0 4.0 4.2 -4.9 181 311 252 371 North Carolina -3.4 -7.3 -0.8 9.7 -10.9 178 662 745 136 Oklahoma -1.8 -12.7 16.4 -1.0 -8.5 -36 893 25 -131 South Carolina 5.2 -8.3 33.5 -3.5 -13.2 121 776 299 90 Tennessee -4.2 -8.3 -0.7 3.9 -5.2 165 428 390 -67 Texas -1.2 -4.0 7.8 2.2 -0.6 207 228 254 7 Virginia -1.9 -7.4 4.4 2.2 -9.0 270 404 440 6 West Virginia 0.5 -5.1 6.8 1.4 -6.4 148 681 29 -569 West 33.3 -8.3 8.3 51.7 — -815 5,091 -110 — Alaska -9.2 -8.0 0.1 -1.8 -9.8 240 -146 226 -291 Arizona 3.7 -2.4 3.5 1.9 -2.4 218 686 46 -391 California 6.0 -3.8 6.2 6.8 -11.8 201 1,188 768 -684 Colorado -2.3 -6.3 1.9 3.1 -4.8 13 127 273 184 Hawaii -1.0 -3.5 -18.7 3.4 -14.8 250 2,305 305 -693 Idaho -9.2 -18.2 -19.0 0.2 -8.5 -22 998 180 267 Montana 1.3 -4.6 18.1 11.5 -7.1 -51 356 -29 -880 Nevada -3.9 -6.4 4.7 8.5 -11.8 -80 153 595 -1,243 New Mexico 0.1 -14.9 41.9 1.4 -23.9 -206 742 231 -769 Oregon -5.0 -5.5 -3.5 -1.1 -5.8 -343 471 -267 -2,032 Utah -4.8 -9.4 -2.4 3.0 -2.9 125 648 46 106 Washington 7.5 -4.6 8.8 10.0 1.7 -161 100 479 239 Wyoming -2.9 -9.4 3.5 7.9 -9.7 149 560 308 -352 Midwest -4.0 -8.2 -2.7 5.1 -2.5 224 108 666 16 Illinois -7.8 -9.3 9.7 4.0 -21.2 178 675 -107 -1,346 Indiana 0.5 -6.6 6.2 13.1 -8.3 219 801 300 52 Iowa -1.3 -7.6 -1.1 2.0 -7.1 381 451 425 9 Kansas -4.8 -11.2 7.9 5.9 -11.5 42 617 185 -1,569 Michigan -2.6 -5.7 7.4 1.8 -14.9 186 841 243 -279 Minnesota 0.4 -8.8 8.0 2.2 -8.6 26 910 199 -340 Missouri -5.9 -6.7 -0.4 4.7 -7.1 114 90 495 -251 Nebraska 0.2 -10.5 3.5 6.1 -6.3 0 245 839 804 North Dakota -3.3 -14.5 4.1 19.1 -13.1 72 -99 -6 -678 Ohio 3.3 -7.2 1.1 15.7 -8.4 251 2,323 395 -10 South Dakota -4.1 -6.4 9.0 5.2 -12.0 135 85 21 -262 Wisconsin -0.3 -2.7 0.9 3.0 -1.8 334 677 415 523 Northeast 3.5 2.5 -0.6 1.8 -0.3 609 1,206 -818 593 Connecticut 8.7 1.3 -7.2 25.7 15.7 149 582 313 962 Maine -14.3 -14.0 3.2 -2.1 -29.4 77 49 429 -887 Massachusetts -1.7 -4.3 22.7 10.1 -10.3 328 -303 874 -91 New Hampshire -0.7 -2.4 -4.8 2.5 -0.6 360 554 348 1,098 New Jersey -0.6 -2.8 4.6 1.1 -5.9 341 716 297 470 New York 0.9 -3.3 -1.5 5.6 6.3 366 932 1,489 576 Pennsylvania -7.4 -6.4 -12.0 1.3 -5.7 40 607 341 338 Rhode Island -0.2 6.4 3.9 5.1 -14.0 435 291 -1,296 181 Vermont NA NA NA NA NA NA NA NA NA District of Columbia
Table 68continued
Percent Receiving Average Amount
Loans
Institutional Grants
State/Local Grants
Federal Grants
Loans
Institutional Grants
State/Local Grants
Federal Grants
Change, 2011-12 to 2016-17
Grant or Loan
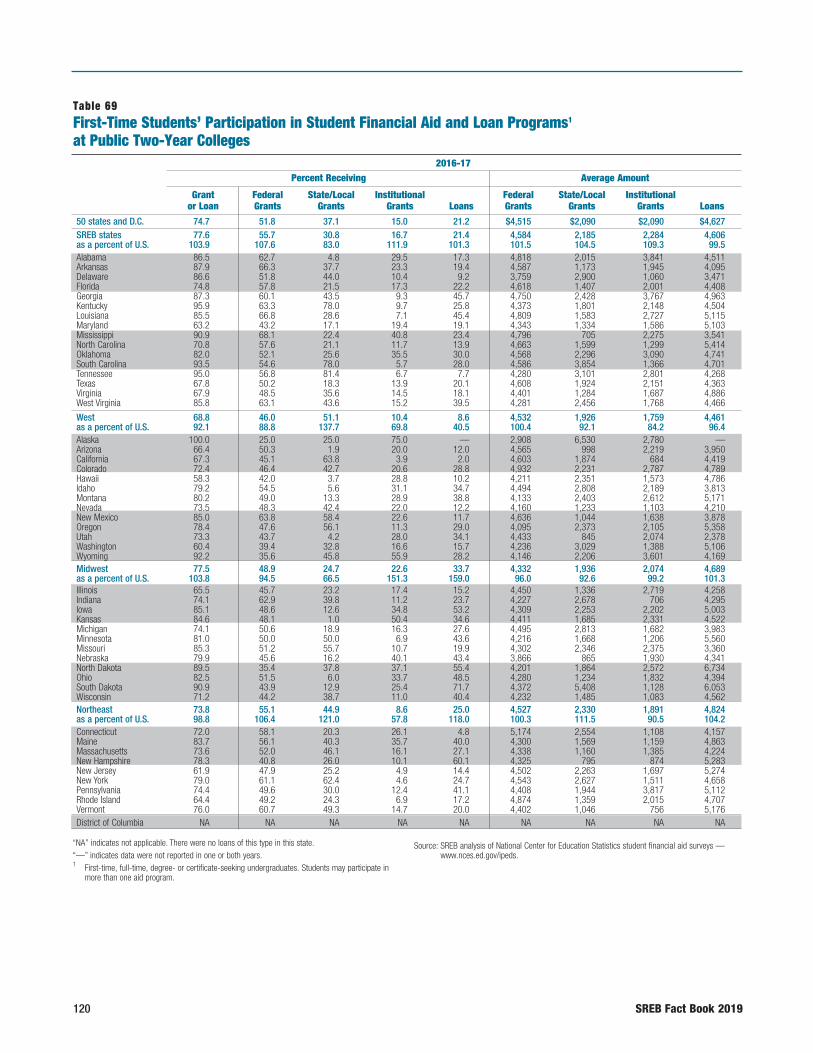
120 SREB Fact Book 2019
50 states and D.C. 74.7 51.8 37.1 15.0 21.2 $4,515 $2,090 $2,090 $4,627SREB states 77.6 55.7 30.8 16.7 21.4 4,584 2,185 2,284 4,606as a percent of U.S. 103.9 107.6 83.0 111.9 101.3 101.5 104.5 109.3 99.5Alabama 86.5 62.7 4.8 29.5 17.3 4,818 2,015 3,841 4,511Arkansas 87.9 66.3 37.7 23.3 19.4 4,587 1,173 1,945 4,095Delaware 86.6 51.8 44.0 10.4 9.2 3,759 2,900 1,060 3,471Florida 74.8 57.8 21.5 17.3 22.2 4,618 1,407 2,001 4,408Georgia 87.3 60.1 43.5 9.3 45.7 4,750 2,428 3,767 4,963Kentucky 95.9 63.3 78.0 9.7 25.8 4,373 1,801 2,148 4,504Louisiana 85.5 66.8 28.6 7.1 45.4 4,809 1,583 2,727 5,115Maryland 63.2 43.2 17.1 19.4 19.1 4,343 1,334 1,586 5,103Mississippi 90.9 68.1 22.4 40.8 23.4 4,796 705 2,275 3,541North Carolina 70.8 57.6 21.1 11.7 13.9 4,663 1,599 1,299 5,414Oklahoma 82.0 52.1 25.6 35.5 30.0 4,568 2,296 3,090 4,741South Carolina 93.5 54.6 78.0 5.7 28.0 4,586 3,854 1,366 4,701Tennessee 95.0 56.8 81.4 6.7 7.7 4,280 3,101 2,801 4,268Texas 67.8 50.2 18.3 13.9 20.1 4,608 1,924 2,151 4,363Virginia 67.9 48.5 35.6 14.5 18.1 4,401 1,284 1,687 4,886West Virginia 85.8 63.1 43.6 15.2 39.5 4,281 2,456 1,768 4,466
West 68.8 46.0 51.1 10.4 8.6 4,532 1,926 1,759 4,461as a percent of U.S. 92.1 88.8 137.7 69.8 40.5 100.4 92.1 84.2 96.4Alaska 100.0 25.0 25.0 75.0 — 2,908 6,530 2,780 —Arizona 66.4 50.3 1.9 20.0 12.0 4,565 998 2,219 3,950California 67.3 45.1 63.8 3.9 2.0 4,603 1,874 684 4,419Colorado 72.4 46.4 42.7 20.6 28.8 4,932 2,231 2,787 4,789Hawaii 58.3 42.0 3.7 28.8 10.2 4,211 2,351 1,573 4,786Idaho 79.2 54.5 5.6 31.1 34.7 4,494 2,808 2,189 3,813Montana 80.2 49.0 13.3 28.9 38.8 4,133 2,403 2,612 5,171Nevada 73.5 48.3 42.4 22.0 12.2 4,160 1,233 1,103 4,210New Mexico 85.0 63.8 58.4 22.6 11.7 4,636 1,044 1,638 3,878Oregon 78.4 47.6 56.1 11.3 29.0 4,095 2,373 2,105 5,358Utah 73.3 43.7 4.2 28.0 34.1 4,433 845 2,074 2,378Washington 60.4 39.4 32.8 16.6 15.7 4,236 3,029 1,388 5,106Wyoming 92.2 35.6 45.8 55.9 28.2 4,146 2,206 3,601 4,169Midwest 77.5 48.9 24.7 22.6 33.7 4,332 1,936 2,074 4,689as a percent of U.S. 103.8 94.5 66.5 151.3 159.0 96.0 92.6 99.2 101.3Illinois 65.5 45.7 23.2 17.4 15.2 4,450 1,336 2,719 4,258Indiana 74.1 62.9 39.8 11.2 23.7 4,227 2,678 706 4,295Iowa 85.1 48.6 12.6 34.8 53.2 4,309 2,253 2,202 5,003Kansas 84.6 48.1 1.0 50.4 34.6 4,411 1,685 2,331 4,522Michigan 74.1 50.6 18.9 16.3 27.6 4,495 2,813 1,682 3,983Minnesota 81.0 50.0 50.0 6.9 43.6 4,216 1,668 1,206 5,560Missouri 85.3 51.2 55.7 10.7 19.9 4,302 2,346 2,375 3,360Nebraska 79.9 45.6 16.2 40.1 43.4 3,866 865 1,930 4,341North Dakota 89.5 35.4 37.8 37.1 55.4 4,201 1,864 2,572 6,734Ohio 82.5 51.5 6.0 33.7 48.5 4,280 1,234 1,832 4,394South Dakota 90.9 43.9 12.9 25.4 71.7 4,372 5,408 1,128 6,053Wisconsin 71.2 44.2 38.7 11.0 40.4 4,232 1,485 1,083 4,562Northeast 73.8 55.1 44.9 8.6 25.0 4,527 2,330 1,891 4,824as a percent of U.S. 98.8 106.4 121.0 57.8 118.0 100.3 111.5 90.5 104.2Connecticut 72.0 58.1 20.3 26.1 4.8 5,174 2,554 1,108 4,157Maine 83.7 56.1 40.3 35.7 40.0 4,300 1,569 1,159 4,863Massachusetts 73.6 52.0 46.1 16.1 27.1 4,338 1,160 1,385 4,224New Hampshire 78.3 40.8 26.0 10.1 60.1 4,325 795 874 5,283New Jersey 61.9 47.9 25.2 4.9 14.4 4,502 2,263 1,697 5,274New York 79.0 61.1 62.4 4.6 24.7 4,543 2,627 1,511 4,658Pennsylvania 74.4 49.6 30.0 12.4 41.1 4,408 1,944 3,817 5,112Rhode Island 64.4 49.2 24.3 6.9 17.2 4,874 1,359 2,015 4,707Vermont 76.0 60.7 49.3 14.7 20.0 4,402 1,046 756 5,176District of Columbia NA NA NA NA NA NA NA NA NA
“NA” indicates not applicable. There were no loans of this type in this state. “—” indicates data were not reported in one or both years.1 First-time, full-time, degree- or certificate-seeking undergraduates. Students may participate in
more than one aid program.
Source: SREB analysis of National Center for Education Statistics student financial aid surveys — www.nces.ed.gov/ipeds.
Table 69First-Time Students’ Participation in Student Financial Aid and Loan Programs1
at Public Two-Year Colleges
Percent Receiving Average Amount
Loans
Institutional Grants
State/Local Grants
Federal Grants
Loans
Institutional Grants
State/Local Grants
Federal Grants
2016-17
Grant or Loan
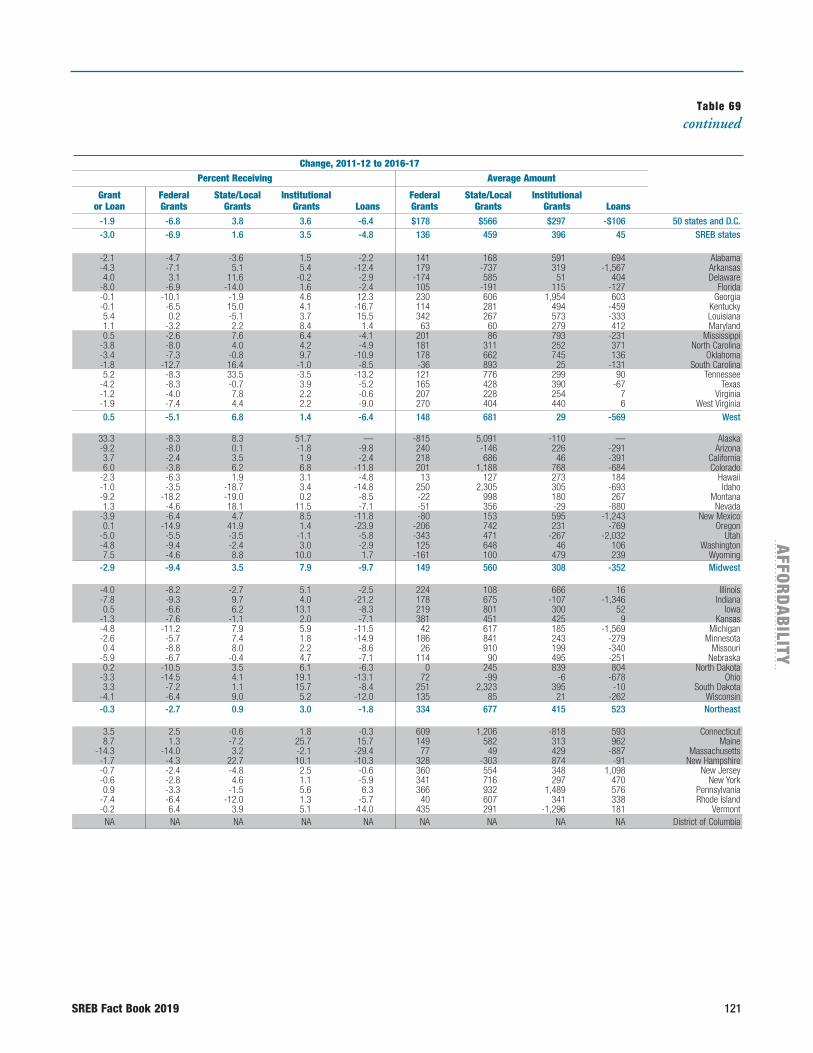
SREB Fact Book 2019 121
AFFO
RD
AB
ILITY
-1.9 -6.8 3.8 3.6 -6.4 $178 $566 $297 -$106 50 states and D.C. -3.0 -6.9 1.6 3.5 -4.8 136 459 396 45 SREB states -2.1 -4.7 -3.6 1.5 -2.2 141 168 591 694 Alabama -4.3 -7.1 5.1 5.4 -12.4 179 -737 319 -1,567 Arkansas 4.0 3.1 11.6 -0.2 -2.9 -174 585 51 404 Delaware -8.0 -6.9 -14.0 1.6 -2.4 105 -191 115 -127 Florida -0.1 -10.1 -1.9 4.6 12.3 230 606 1,954 603 Georgia -0.1 -6.5 15.0 4.1 -16.7 114 281 494 -459 Kentucky 5.4 0.2 -5.1 3.7 15.5 342 267 573 -333 Louisiana 1.1 -3.2 2.2 8.4 1.4 63 60 279 412 Maryland 0.5 -2.6 7.6 6.4 -4.1 201 86 793 -231 Mississippi -3.8 -8.0 4.0 4.2 -4.9 181 311 252 371 North Carolina -3.4 -7.3 -0.8 9.7 -10.9 178 662 745 136 Oklahoma -1.8 -12.7 16.4 -1.0 -8.5 -36 893 25 -131 South Carolina 5.2 -8.3 33.5 -3.5 -13.2 121 776 299 90 Tennessee -4.2 -8.3 -0.7 3.9 -5.2 165 428 390 -67 Texas -1.2 -4.0 7.8 2.2 -0.6 207 228 254 7 Virginia -1.9 -7.4 4.4 2.2 -9.0 270 404 440 6 West Virginia 0.5 -5.1 6.8 1.4 -6.4 148 681 29 -569 West 33.3 -8.3 8.3 51.7 — -815 5,091 -110 — Alaska -9.2 -8.0 0.1 -1.8 -9.8 240 -146 226 -291 Arizona 3.7 -2.4 3.5 1.9 -2.4 218 686 46 -391 California 6.0 -3.8 6.2 6.8 -11.8 201 1,188 768 -684 Colorado -2.3 -6.3 1.9 3.1 -4.8 13 127 273 184 Hawaii -1.0 -3.5 -18.7 3.4 -14.8 250 2,305 305 -693 Idaho -9.2 -18.2 -19.0 0.2 -8.5 -22 998 180 267 Montana 1.3 -4.6 18.1 11.5 -7.1 -51 356 -29 -880 Nevada -3.9 -6.4 4.7 8.5 -11.8 -80 153 595 -1,243 New Mexico 0.1 -14.9 41.9 1.4 -23.9 -206 742 231 -769 Oregon -5.0 -5.5 -3.5 -1.1 -5.8 -343 471 -267 -2,032 Utah -4.8 -9.4 -2.4 3.0 -2.9 125 648 46 106 Washington 7.5 -4.6 8.8 10.0 1.7 -161 100 479 239 Wyoming -2.9 -9.4 3.5 7.9 -9.7 149 560 308 -352 Midwest -4.0 -8.2 -2.7 5.1 -2.5 224 108 666 16 Illinois -7.8 -9.3 9.7 4.0 -21.2 178 675 -107 -1,346 Indiana 0.5 -6.6 6.2 13.1 -8.3 219 801 300 52 Iowa -1.3 -7.6 -1.1 2.0 -7.1 381 451 425 9 Kansas -4.8 -11.2 7.9 5.9 -11.5 42 617 185 -1,569 Michigan -2.6 -5.7 7.4 1.8 -14.9 186 841 243 -279 Minnesota 0.4 -8.8 8.0 2.2 -8.6 26 910 199 -340 Missouri -5.9 -6.7 -0.4 4.7 -7.1 114 90 495 -251 Nebraska 0.2 -10.5 3.5 6.1 -6.3 0 245 839 804 North Dakota -3.3 -14.5 4.1 19.1 -13.1 72 -99 -6 -678 Ohio 3.3 -7.2 1.1 15.7 -8.4 251 2,323 395 -10 South Dakota -4.1 -6.4 9.0 5.2 -12.0 135 85 21 -262 Wisconsin -0.3 -2.7 0.9 3.0 -1.8 334 677 415 523 Northeast 3.5 2.5 -0.6 1.8 -0.3 609 1,206 -818 593 Connecticut 8.7 1.3 -7.2 25.7 15.7 149 582 313 962 Maine -14.3 -14.0 3.2 -2.1 -29.4 77 49 429 -887 Massachusetts -1.7 -4.3 22.7 10.1 -10.3 328 -303 874 -91 New Hampshire -0.7 -2.4 -4.8 2.5 -0.6 360 554 348 1,098 New Jersey -0.6 -2.8 4.6 1.1 -5.9 341 716 297 470 New York 0.9 -3.3 -1.5 5.6 6.3 366 932 1,489 576 Pennsylvania -7.4 -6.4 -12.0 1.3 -5.7 40 607 341 338 Rhode Island -0.2 6.4 3.9 5.1 -14.0 435 291 -1,296 181 Vermont NA NA NA NA NA NA NA NA NA District of Columbia
Table 69continued
Percent Receiving Average Amount
Loans
Institutional Grants
State/Local Grants
Federal Grants
Loans
Institutional Grants
State/Local Grants
Federal Grants
Change, 2011-12 to 2016-17
Grant or Loan
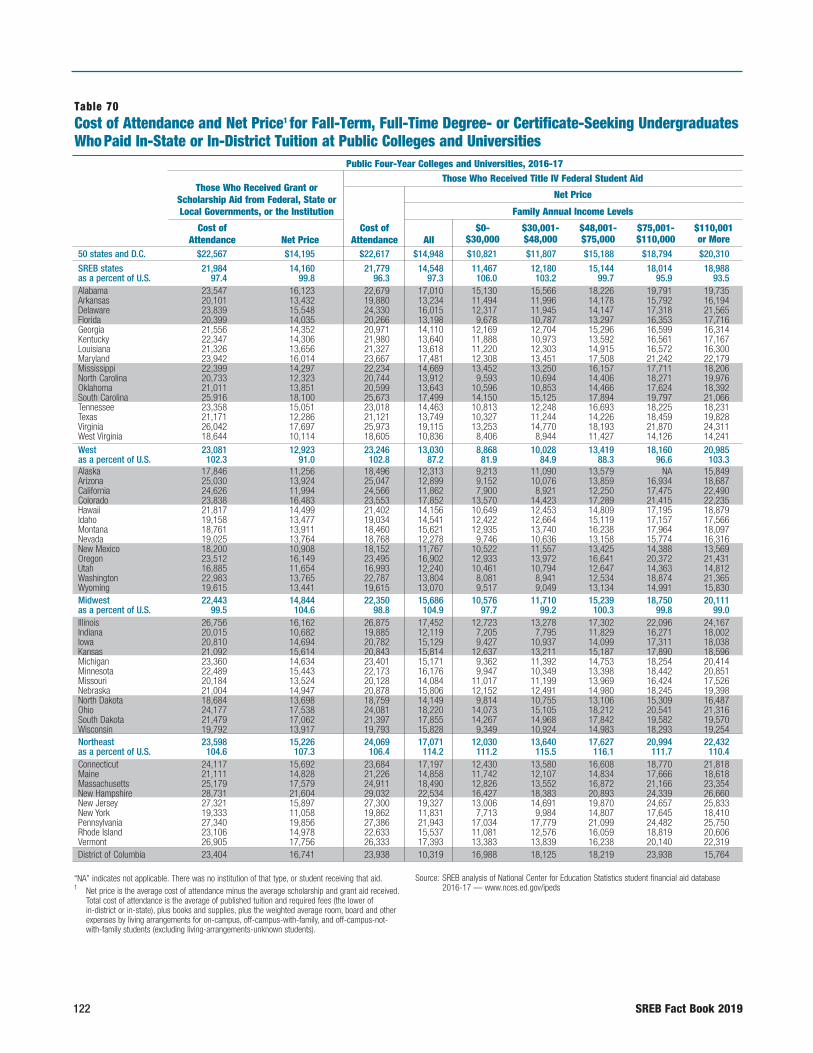
122 SREB Fact Book 2019
50 states and D.C. $22,567 $14,195 $22,617 $14,948 $10,821 $11,807 $15,188 $18,794 $20,310
SREB states 21,984 14,160 21,779 14,548 11,467 12,180 15,144 18,014 18,988as a percent of U.S. 97.4 99.8 96.3 97.3 106.0 103.2 99.7 95.9 93.5Alabama 23,547 16,123 22,679 17,010 15,130 15,566 18,226 19,791 19,735Arkansas 20,101 13,432 19,880 13,234 11,494 11,996 14,178 15,792 16,194Delaware 23,839 15,548 24,330 16,015 12,317 11,945 14,147 17,318 21,565Florida 20,399 14,035 20,266 13,198 9,678 10,787 13,297 16,353 17,716Georgia 21,556 14,352 20,971 14,110 12,169 12,704 15,296 16,599 16,314Kentucky 22,347 14,306 21,980 13,640 11,888 10,973 13,592 16,561 17,167Louisiana 21,326 13,656 21,327 13,618 11,220 12,303 14,915 16,572 16,300Maryland 23,942 16,014 23,667 17,481 12,308 13,451 17,508 21,242 22,179Mississippi 22,399 14,297 22,234 14,669 13,452 13,250 16,157 17,711 18,206North Carolina 20,733 12,323 20,744 13,912 9,593 10,694 14,406 18,271 19,976Oklahoma 21,011 13,851 20,599 13,643 10,596 10,853 14,466 17,624 18,392South Carolina 25,916 18,100 25,673 17,499 14,150 15,125 17,894 19,797 21,066Tennessee 23,358 15,051 23,018 14,463 10,813 12,248 16,693 18,225 18,231Texas 21,171 12,286 21,121 13,749 10,327 11,244 14,226 18,459 19,828Virginia 26,042 17,697 25,973 19,115 13,253 14,770 18,193 21,870 24,311West Virginia 18,644 10,114 18,605 10,836 8,406 8,944 11,427 14,126 14,241West 23,081 12,923 23,246 13,030 8,868 10,028 13,419 18,160 20,985as a percent of U.S. 102.3 91.0 102.8 87.2 81.9 84.9 88.3 96.6 103.3Alaska 17,846 11,256 18,496 12,313 9,213 11,090 13,579 NA 15,849Arizona 25,030 13,924 25,047 12,899 9,152 10,076 13,859 16,934 18,687California 24,626 11,994 24,566 11,862 7,900 8,921 12,250 17,475 22,490Colorado 23,838 16,483 23,553 17,852 13,570 14,423 17,289 21,415 22,235Hawaii 21,817 14,499 21,402 14,156 10,649 12,453 14,809 17,195 18,879Idaho 19,158 13,477 19,034 14,541 12,422 12,664 15,119 17,157 17,566Montana 18,761 13,911 18,460 15,621 12,935 13,740 16,238 17,964 18,097Nevada 19,025 13,764 18,768 12,278 9,746 10,636 13,158 15,774 16,316New Mexico 18,200 10,908 18,152 11,767 10,522 11,557 13,425 14,388 13,569Oregon 23,512 16,149 23,495 16,902 12,933 13,972 16,641 20,372 21,431Utah 16,885 11,654 16,993 12,240 10,461 10,794 12,647 14,363 14,812Washington 22,983 13,765 22,787 13,804 8,081 8,941 12,534 18,874 21,365Wyoming 19,615 13,441 19,615 13,070 9,517 9,049 13,134 14,991 15,830Midwest 22,443 14,844 22,350 15,686 10,576 11,710 15,239 18,750 20,111as a percent of U.S. 99.5 104.6 98.8 104.9 97.7 99.2 100.3 99.8 99.0Illinois 26,756 16,162 26,875 17,452 12,723 13,278 17,302 22,096 24,167Indiana 20,015 10,682 19,885 12,119 7,205 7,795 11,829 16,271 18,002Iowa 20,810 14,694 20,782 15,129 9,427 10,937 14,099 17,311 18,038Kansas 21,092 15,614 20,843 15,814 12,637 13,211 15,187 17,890 18,596Michigan 23,360 14,634 23,401 15,171 9,362 11,392 14,753 18,254 20,414Minnesota 22,489 15,443 22,173 16,176 9,947 10,349 13,398 18,442 20,851Missouri 20,184 13,524 20,128 14,084 11,017 11,199 13,969 16,424 17,526Nebraska 21,004 14,947 20,878 15,806 12,152 12,491 14,980 18,245 19,398North Dakota 18,684 13,698 18,759 14,149 9,814 10,755 13,106 15,309 16,487Ohio 24,177 17,538 24,081 18,220 14,073 15,105 18,212 20,541 21,316South Dakota 21,479 17,062 21,397 17,855 14,267 14,968 17,842 19,582 19,570Wisconsin 19,792 13,917 19,793 15,828 9,349 10,924 14,983 18,293 19,254Northeast 23,598 15,226 24,069 17,071 12,030 13,640 17,627 20,994 22,432as a percent of U.S. 104.6 107.3 106.4 114.2 111.2 115.5 116.1 111.7 110.4Connecticut 24,117 15,692 23,684 17,197 12,430 13,580 16,608 18,770 21,818Maine 21,111 14,828 21,226 14,858 11,742 12,107 14,834 17,666 18,618Massachusetts 25,179 17,579 24,911 18,490 12,826 13,552 16,872 21,166 23,354New Hampshire 28,731 21,604 29,032 22,534 16,427 18,383 20,893 24,339 26,660New Jersey 27,321 15,897 27,300 19,327 13,006 14,691 19,870 24,657 25,833New York 19,333 11,058 19,862 11,831 7,713 9,984 14,807 17,645 18,410Pennsylvania 27,340 19,856 27,386 21,943 17,034 17,779 21,099 24,482 25,750Rhode Island 23,106 14,978 22,633 15,537 11,081 12,576 16,059 18,819 20,606Vermont 26,905 17,756 26,333 17,393 13,383 13,839 16,238 20,140 22,319District of Columbia 23,404 16,741 23,938 10,319 16,988 18,125 18,219 23,938 15,764
“NA” indicates not applicable. There was no institution of that type, or student receiving that aid.1 Net price is the average cost of attendance minus the average scholarship and grant aid received.
Total cost of attendance is the average of published tuition and required fees (the lower of in-district or in-state), plus books and supplies, plus the weighted average room, board and other expenses by living arrangements for on-campus, off-campus-with-family, and off-campus-not-with-family students (excluding living-arrangements-unknown students).
Source: SREB analysis of National Center for Education Statistics student financial aid database 2016-17 — www.nces.ed.gov/ipeds
Table 70Cost of Attendance and Net Price1 for Fall-Term, Full-Time Degree- or Certificate-Seeking Undergraduates Who Paid In-State or In-District Tuition at Public Colleges and Universities
Public Four-Year Colleges and Universities, 2016-17Those Who Received Title IV Federal Student Aid
Net Price
Family Annual Income Levels
Cost of Attendance
All
Cost of Attendance
Net Price
$110,001 or More
$75,001- $110,000
$48,001- $75,000
$30,001- $48,000
$0- $30,000
Those Who Received Grant or Scholarship Aid from Federal, State or Local Governments, or the Institution

SREB Fact Book 2019 123
AFFO
RD
AB
ILITY
$12,209 $7,187 $12,357 $7,279 $6,233 $6,830 $8,952 $11,114 $11,449 50 states and D.C. 11,871 6,889 11,999 7,049 6,297 6,695 8,464 10,601 11,246 SREB states 97.2 95.9 97.1 96.8 101.0 98.0 94.6 95.4 98.2 as a percent of U.S. 11,361 6,192 11,443 6,284 5,694 6,261 7,871 10,276 10,688 Alabama 12,118 7,435 12,262 7,278 6,556 6,984 8,840 10,829 11,811 Arkansas 12,053 8,101 12,570 8,597 8,134 8,449 9,210 10,166 11,361 Delaware 11,373 6,451 11,381 6,811 6,202 6,734 8,560 10,642 10,939 Florida 11,626 6,673 11,790 7,333 6,096 7,054 8,589 10,606 10,618 Georgia 11,058 6,332 11,370 5,860 4,862 5,165 7,306 9,840 10,252 Kentucky 13,846 8,976 13,894 9,259 8,720 8,782 11,083 12,650 12,742 Louisiana 12,839 8,357 13,046 8,820 7,409 8,067 10,246 12,238 12,846 Maryland 10,622 5,761 10,709 5,375 4,860 5,208 7,165 8,978 9,539 Mississippi 12,463 7,859 12,402 7,522 7,135 7,506 8,152 10,373 11,948 North Carolina 13,318 8,128 13,776 8,428 7,337 7,665 10,130 12,046 12,652 Oklahoma 13,065 7,059 13,368 6,557 5,856 5,950 7,602 9,186 9,560 South Carolina 11,923 6,505 12,464 6,284 5,702 6,185 7,880 9,451 9,918 Tennessee 11,509 6,637 11,592 6,960 6,049 6,557 8,618 10,721 11,282 Texas 12,638 7,797 12,744 8,316 7,079 7,367 9,098 11,826 12,703 Virginia 11,529 6,264 11,713 7,014 6,401 6,274 8,208 10,414 11,078 West Virginia 12,215 7,271 12,318 6,378 5,682 6,367 8,558 10,643 9,380 West 100.0 101.2 99.7 87.6 91.2 93.2 95.6 95.8 81.9 as a percent of U.S. 20,600 7,451 20,600 7,451 7,451 0 NA NA NA Alaska 11,487 6,998 11,513 6,999 6,131 6,780 8,596 10,187 10,523 Arizona 12,190 7,220 12,292 5,655 5,286 5,724 8,221 9,546 6,959 California 15,391 9,285 15,261 9,613 8,008 8,835 10,879 13,732 14,544 Colorado 12,587 8,161 12,415 7,930 6,920 7,478 9,294 11,366 12,150 Hawaii 11,720 7,101 11,653 7,294 6,187 6,579 8,456 10,737 11,469 Idaho 13,008 8,533 13,025 9,203 7,973 8,413 10,357 12,102 12,234 Montana 12,348 8,491 12,116 7,464 6,942 6,929 8,635 11,057 11,703 Nevada 10,684 5,949 10,914 5,635 4,913 5,867 7,502 9,455 9,730 New Mexico 12,638 7,676 12,904 8,189 7,152 7,477 9,348 10,837 10,951 Oregon 12,802 8,957 12,567 8,790 8,678 8,123 8,816 10,710 11,295 Utah 12,714 6,943 12,711 6,851 5,473 6,573 8,673 11,836 12,379 Washington 11,010 6,320 11,402 6,724 5,240 5,539 7,627 9,722 9,671 Wyoming 12,200 7,570 12,447 8,227 6,783 7,257 9,339 11,306 11,819 Midwest 99.9 105.3 100.7 113.0 108.8 106.2 104.3 101.7 103.2 as a percent of U.S. 10,532 5,666 10,664 5,993 4,910 5,556 7,763 9,610 9,839 Illinois 12,487 6,424 12,438 7,025 6,099 6,426 9,215 11,487 12,292 Indiana 13,907 9,581 13,960 10,164 8,267 8,566 10,641 12,806 13,236 Iowa 13,001 8,812 13,250 9,199 7,722 8,139 10,093 12,022 12,270 Kansas 10,784 5,845 10,903 6,228 5,123 5,548 7,757 9,969 10,458 Michigan 15,744 10,877 15,706 11,661 9,908 10,284 11,800 14,179 15,512 Minnesota 11,145 6,620 11,673 7,059 6,295 6,673 8,351 9,421 9,873 Missouri 11,540 7,670 11,677 8,167 6,559 6,796 8,767 10,849 11,341 Nebraska 13,789 9,226 13,976 10,066 6,885 7,685 10,143 12,294 13,019 North Dakota 12,269 8,033 12,294 8,577 6,947 7,427 9,608 11,336 11,597 Ohio 15,622 11,099 15,612 12,607 10,449 10,679 13,288 14,664 14,930 South Dakota 13,477 8,687 13,373 9,508 7,598 7,931 10,437 12,673 13,131 Wisconsin 13,054 7,360 13,061 7,757 6,269 7,065 9,815 12,070 12,745 Northeast 106.9 102.4 105.7 106.6 100.6 103.4 109.6 108.6 111.3 as a percent of U.S. 11,294 6,212 11,326 6,432 6,323 5,993 6,455 8,519 10,858 Connecticut 14,706 9,706 14,555 9,891 8,127 8,585 11,361 13,710 14,240 Maine 12,909 8,123 12,802 8,489 7,189 7,768 9,395 11,738 12,577 Massachusetts 19,239 15,033 18,878 16,142 14,609 18,728 18,866 18,878 18,878 New Hampshire 13,009 7,761 12,940 8,298 7,411 7,522 9,941 12,161 12,674 New Jersey 12,845 6,644 12,883 6,718 4,886 6,201 9,641 11,913 12,663 New York 14,010 8,589 13,712 9,296 7,655 8,059 10,320 12,617 13,111 Pennsylvania 11,282 5,799 11,114 6,575 5,226 5,847 7,230 10,191 10,857 Rhode Island 15,565 10,586 15,706 11,012 10,341 10,128 11,249 14,835 15,706 Vermont NA NA NA NA NA NA NA NA NA District of Columbia
Table 70continued
Public Two-Year Colleges, 2016-17
Those Who Received Grant or Scholarship Aid from Federal, State or Local Governments, or the Institution
Those Who Received Title IV Federal Student Aid
Net Price
Family Annual Income Levels
Cost of Attendance
All
Cost of Attendance
Net Price
$110,001 or More
$75,001- $110,000
$48,001- $75,000
$30,001- $48,000
$0- $30,000
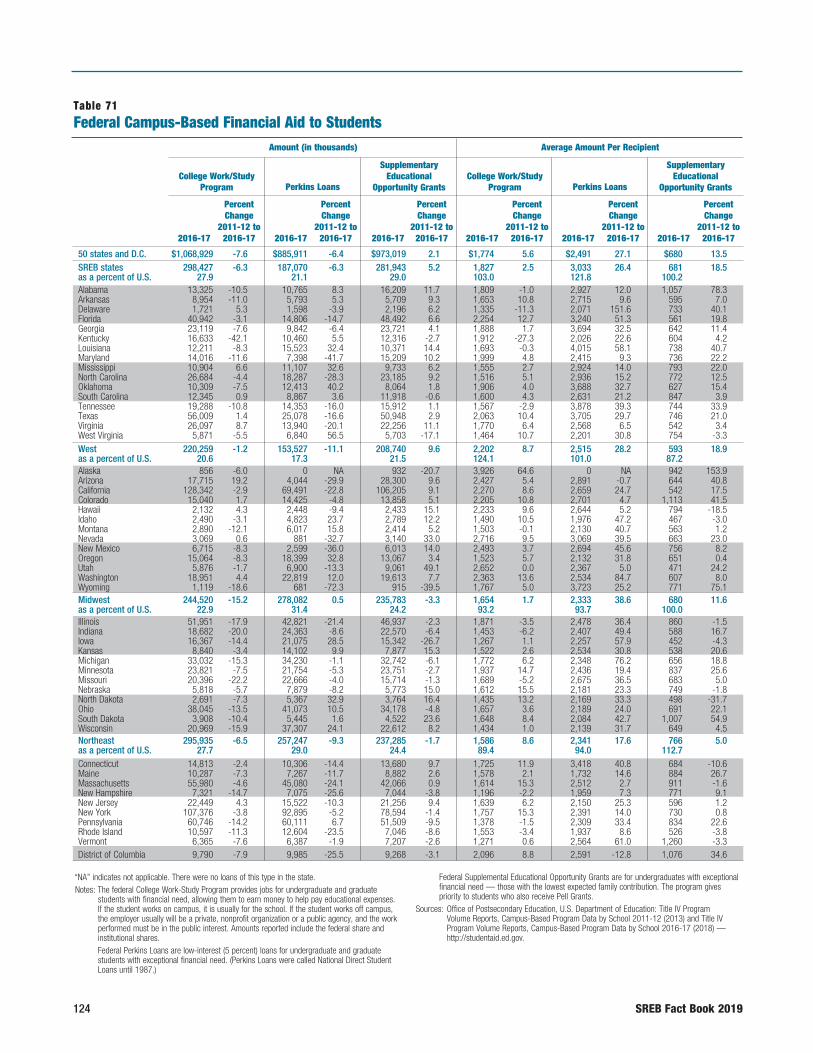
124 SREB Fact Book 2019
Table 71Federal Campus-Based Financial Aid to Students
50statesandD.C. $1,068,929 -7.6 $885,911 -6.4 $973,019 2.1 $1,774 5.6 $2,491 27.1 $680 13.5SREBstates 298,427 -6.3 187,070 -6.3 281,943 5.2 1,827 2.5 3,033 26.4 681 18.5asapercentofU.S. 27.9 21.1 29.0 103.0 121.8 100.2Alabama 13,325 -10.5 10,765 8.3 16,209 11.7 1,809 -1.0 2,927 12.0 1,057 78.3Arkansas 8,954 -11.0 5,793 5.3 5,709 9.3 1,653 10.8 2,715 9.6 595 7.0Delaware 1,721 5.3 1,598 -3.9 2,196 6.2 1,335 -11.3 2,071 151.6 733 40.1Florida 40,942 -3.1 14,806 -14.7 48,492 6.6 2,254 12.7 3,240 51.3 561 19.8Georgia 23,119 -7.6 9,842 -6.4 23,721 4.1 1,888 1.7 3,694 32.5 642 11.4Kentucky 16,633 -42.1 10,460 5.5 12,316 -2.7 1,912 -27.3 2,026 22.6 604 4.2Louisiana 12,211 -8.3 15,523 32.4 10,371 14.4 1,693 -0.3 4,015 58.1 738 40.7Maryland 14,016 -11.6 7,398 -41.7 15,209 10.2 1,999 4.8 2,415 9.3 736 22.2Mississippi 10,904 6.6 11,107 32.6 9,733 6.2 1,555 2.7 2,924 14.0 793 22.0NorthCarolina 26,684 -4.4 18,287 -28.3 23,185 9.2 1,516 5.1 2,936 15.2 772 12.5Oklahoma 10,309 -7.5 12,413 40.2 8,064 1.8 1,906 4.0 3,688 32.7 627 15.4SouthCarolina 12,345 0.9 8,867 3.6 11,918 -0.6 1,600 4.3 2,631 21.2 847 3.9Tennessee 19,288 -10.8 14,353 -16.0 15,912 1.1 1,567 -2.9 3,878 39.3 744 33.9Texas 56,009 1.4 25,078 -16.6 50,948 2.9 2,063 10.4 3,705 29.7 746 21.0Virginia 26,097 8.7 13,940 -20.1 22,256 11.1 1,770 6.4 2,568 6.5 542 3.4WestVirginia 5,871 -5.5 6,840 56.5 5,703 -17.1 1,464 10.7 2,201 30.8 754 -3.3West 220,259 -1.2 153,527 -11.1 208,740 9.6 2,202 8.7 2,515 28.2 593 18.9asapercentofU.S. 20.6 17.3 21.5 124.1 101.0 87.2Alaska 856 -6.0 0 NA 932 -20.7 3,926 64.6 0 NA 942 153.9Arizona 17,715 19.2 4,044 -29.9 28,300 9.6 2,427 5.4 2,891 -0.7 644 40.8California 128,342 -2.9 69,491 -22.8 106,205 9.1 2,270 8.6 2,659 24.7 542 17.5Colorado 15,040 1.7 14,425 -4.8 13,858 5.1 2,205 10.8 2,701 4.7 1,113 41.5Hawaii 2,132 4.3 2,448 -9.4 2,433 15.1 2,233 9.6 2,644 5.2 794 -18.5Idaho 2,490 -3.1 4,823 23.7 2,789 12.2 1,490 10.5 1,976 47.2 467 -3.0Montana 2,890 -12.1 6,017 15.8 2,414 5.2 1,503 -0.1 2,130 40.7 563 1.2Nevada 3,069 0.6 881 -32.7 3,140 33.0 2,716 9.5 3,069 39.5 663 23.0NewMexico 6,715 -8.3 2,599 -36.0 6,013 14.0 2,493 3.7 2,694 45.6 756 8.2Oregon 15,064 -8.3 18,399 32.8 13,067 3.4 1,523 5.7 2,132 31.8 651 0.4Utah 5,876 -1.7 6,900 -13.3 9,061 49.1 2,652 0.0 2,367 5.0 471 24.2Washington 18,951 4.4 22,819 12.0 19,613 7.7 2,363 13.6 2,534 84.7 607 8.0Wyoming 1,119 -18.6 681 -72.3 915 -39.5 1,767 5.0 3,723 25.2 771 75.1Midwest 244,520 -15.2 278,082 0.5 235,783 -3.3 1,654 1.7 2,333 38.6 680 11.6asapercentofU.S. 22.9 31.4 24.2 93.2 93.7 100.0Illinois 51,951 -17.9 42,821 -21.4 46,937 -2.3 1,871 -3.5 2,478 36.4 860 -1.5Indiana 18,682 -20.0 24,363 -8.6 22,570 -6.4 1,453 -6.2 2,407 49.4 588 16.7Iowa 16,367 -14.4 21,075 28.5 15,342 -26.7 1,267 1.1 2,257 57.9 452 -4.3Kansas 8,840 -3.4 14,102 9.9 7,877 15.3 1,522 2.6 2,534 30.8 538 20.6Michigan 33,032 -15.3 34,230 -1.1 32,742 -6.1 1,772 6.2 2,348 76.2 656 18.8Minnesota 23,821 -7.5 21,754 -5.3 23,751 -2.7 1,937 14.7 2,436 19.4 837 25.6Missouri 20,396 -22.2 22,666 -4.0 15,714 -1.3 1,689 -5.2 2,675 36.5 683 5.0Nebraska 5,818 -5.7 7,879 -8.2 5,773 15.0 1,612 15.5 2,181 23.3 749 -1.8NorthDakota 2,691 -7.3 5,367 32.9 3,764 16.4 1,435 13.2 2,169 33.3 498 -31.7Ohio 38,045 -13.5 41,073 10.5 34,178 -4.8 1,657 3.6 2,189 24.0 691 22.1SouthDakota 3,908 -10.4 5,445 1.6 4,522 23.6 1,648 8.4 2,084 42.7 1,007 54.9Wisconsin 20,969 -15.9 37,307 24.1 22,612 8.2 1,434 1.0 2,139 31.7 649 4.5Northeast 295,935 -6.5 257,247 -9.3 237,285 -1.7 1,586 8.6 2,341 17.6 766 5.0asapercentofU.S. 27.7 29.0 24.4 89.4 94.0 112.7Connecticut 14,813 -2.4 10,306 -14.4 13,680 9.7 1,725 11.9 3,418 40.8 684 -10.6Maine 10,287 -7.3 7,267 -11.7 8,882 2.6 1,578 2.1 1,732 14.6 884 26.7Massachusetts 55,980 -4.6 45,080 -24.1 42,066 0.9 1,614 15.3 2,512 2.7 911 -1.6NewHampshire 7,321 -14.7 7,075 -25.6 7,044 -3.8 1,196 -2.2 1,959 7.3 771 9.1NewJersey 22,449 4.3 15,522 -10.3 21,256 9.4 1,639 6.2 2,150 25.3 596 1.2NewYork 107,376 -3.8 92,895 -5.2 78,594 -1.4 1,757 15.3 2,391 14.0 730 0.8Pennsylvania 60,746 -14.2 60,111 6.7 51,509 -9.5 1,378 -1.5 2,309 33.4 834 22.6RhodeIsland 10,597 -11.3 12,604 -23.5 7,046 -8.6 1,553 -3.4 1,937 8.6 526 -3.8Vermont 6,365 -7.6 6,387 -1.9 7,207 -2.6 1,271 0.6 2,564 61.0 1,260 -3.3DistrictofColumbia 9,790 -7.9 9,985 -25.5 9,268 -3.1 2,096 8.8 2,591 -12.8 1,076 34.6
“NA” indicates not applicable. There were no loans of this type in the state.Notes: The federal College Work-Study Program provides jobs for undergraduate and graduate students with financial need, allowing them to earn money to help pay educational expenses. If the student works on campus, it is usually for the school. If the student works off campus, the employer usually will be a private, nonprofit organization or a public agency, and the work performed must be in the public interest. Amounts reported include the federal share and institutional shares. Federal Perkins Loans are low-interest (5 percent) loans for undergraduate and graduate students with exceptional financial need. (Perkins Loans were called National Direct Student Loans until 1987.)
Federal Supplemental Educational Opportunity Grants are for undergraduates with exceptional financial need — those with the lowest expected family contribution. The program gives priority to students who also receive Pell Grants.Sources: Office of Postsecondary Education, U.S. Department of Education: Title IV Program Volume Reports, Campus-Based Program Data by School 2011-12 (2013) and Title IV Program Volume Reports, Campus-Based Program Data by School 2016-17 (2018) — http://studentaid.ed.gov.
Amount (in thousands) Average Amount Per Recipient
College Work/Study Program
Perkins Loans
Supplementary Educational
Opportunity GrantsCollege Work/Study
Program
Perkins Loans
Supplementary Educational
Opportunity Grants
2016-17
Percent Change
2011-12 to 2016-172016-17
Percent Change
2011-12 to 2016-17 2016-17
Percent Change
2011-12 to 2016-17 2016-17
Percent Change
2011-12 to 2016-17 2016-17
Percent Change
2011-12 to 2016-17 2016-17
Percent Change
2011-12 to 2016-17
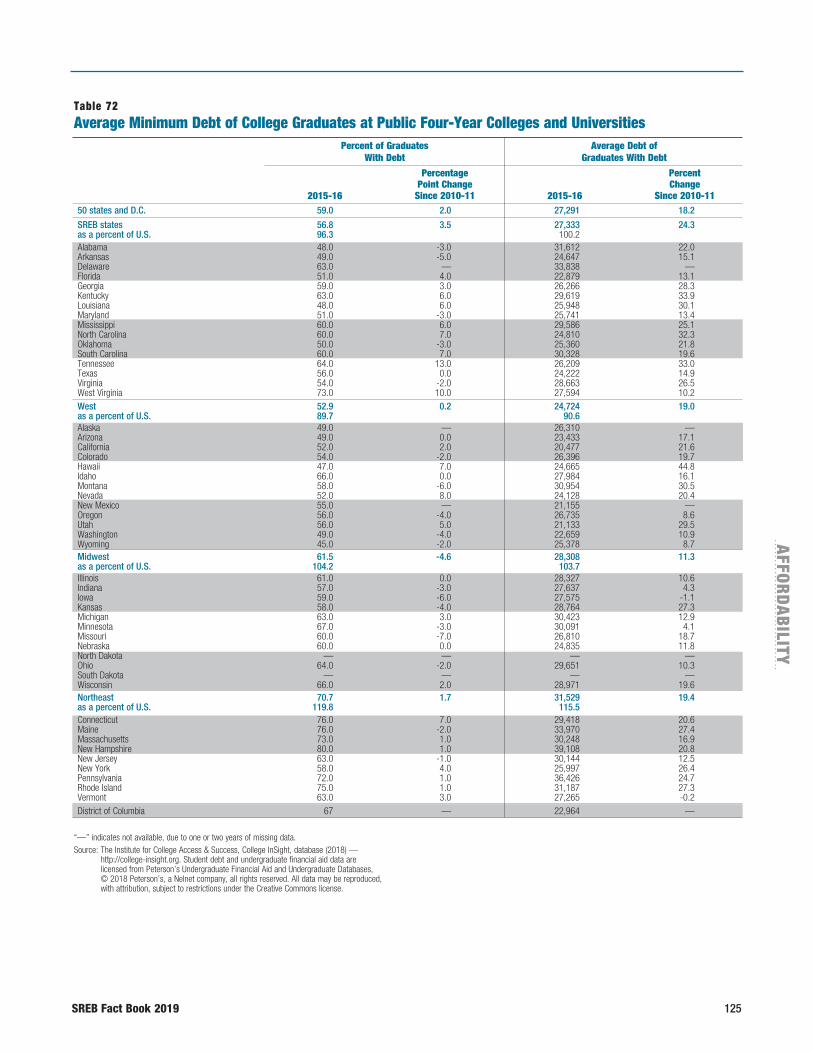
SREB Fact Book 2019 125
AFFO
RD
AB
ILITY
50 states and D.C. 59.0 2.0 27,291 18.2
SREB states 56.8 3.5 27,333 24.3as a percent of U.S. 96.3 100.2 Alabama 48.0 -3.0 31,612 22.0Arkansas 49.0 -5.0 24,647 15.1Delaware 63.0 — 33,838 —Florida 51.0 4.0 22,879 13.1Georgia 59.0 3.0 26,266 28.3Kentucky 63.0 6.0 29,619 33.9Louisiana 48.0 6.0 25,948 30.1Maryland 51.0 -3.0 25,741 13.4Mississippi 60.0 6.0 29,586 25.1North Carolina 60.0 7.0 24,810 32.3Oklahoma 50.0 -3.0 25,360 21.8South Carolina 60.0 7.0 30,328 19.6Tennessee 64.0 13.0 26,209 33.0Texas 56.0 0.0 24,222 14.9Virginia 54.0 -2.0 28,663 26.5West Virginia 73.0 10.0 27,594 10.2West 52.9 0.2 24,724 19.0as a percent of U.S. 89.7 90.6 Alaska 49.0 — 26,310 —Arizona 49.0 0.0 23,433 17.1California 52.0 2.0 20,477 21.6Colorado 54.0 -2.0 26,396 19.7Hawaii 47.0 7.0 24,665 44.8Idaho 66.0 0.0 27,984 16.1Montana 58.0 -6.0 30,954 30.5Nevada 52.0 8.0 24,128 20.4New Mexico 55.0 — 21,155 —Oregon 56.0 -4.0 26,735 8.6Utah 56.0 5.0 21,133 29.5Washington 49.0 -4.0 22,659 10.9Wyoming 45.0 -2.0 25,378 8.7Midwest 61.5 -4.6 28,308 11.3as a percent of U.S. 104.2 103.7 Illinois 61.0 0.0 28,327 10.6Indiana 57.0 -3.0 27,637 4.3Iowa 59.0 -6.0 27,575 -1.1Kansas 58.0 -4.0 28,764 27.3Michigan 63.0 3.0 30,423 12.9Minnesota 67.0 -3.0 30,091 4.1Missouri 60.0 -7.0 26,810 18.7Nebraska 60.0 0.0 24,835 11.8North Dakota — — — —Ohio 64.0 -2.0 29,651 10.3South Dakota — — — —Wisconsin 66.0 2.0 28,971 19.6Northeast 70.7 1.7 31,529 19.4as a percent of U.S. 119.8 115.5 Connecticut 76.0 7.0 29,418 20.6Maine 76.0 -2.0 33,970 27.4Massachusetts 73.0 1.0 30,248 16.9New Hampshire 80.0 1.0 39,108 20.8New Jersey 63.0 -1.0 30,144 12.5New York 58.0 4.0 25,997 26.4Pennsylvania 72.0 1.0 36,426 24.7Rhode Island 75.0 1.0 31,187 27.3Vermont 63.0 3.0 27,265 -0.2District of Columbia 67 — 22,964 —
“—” indicates not available, due to one or two years of missing data.Source: The Institute for College Access & Success, College InSight, database (2018) — http://college-insight.org. Student debt and undergraduate financial aid data are licensed from Peterson’s Undergraduate Financial Aid and Undergraduate Databases, © 2018 Peterson’s, a Nelnet company, all rights reserved. All data may be reproduced, with attribution, subject to restrictions under the Creative Commons license.
Table 72Average Minimum Debt of College Graduates at Public Four-Year Colleges and Universities
Percent of Graduates With Debt
Average Debt of Graduates With Debt
Percentage Point Change
Since 2010-112015-16
Percent Change
Since 2010-112015-16

Copies of the Fact Book on Higher Education are available from the SREB publications office. SREB continuously monitors new comparative data and makes them available on the SREB website: www.sreb.org. The website also features an online edition of the Fact Book with links to the latest updates of the tables and individual Featured Facts reports for each of the 16 SREB states.
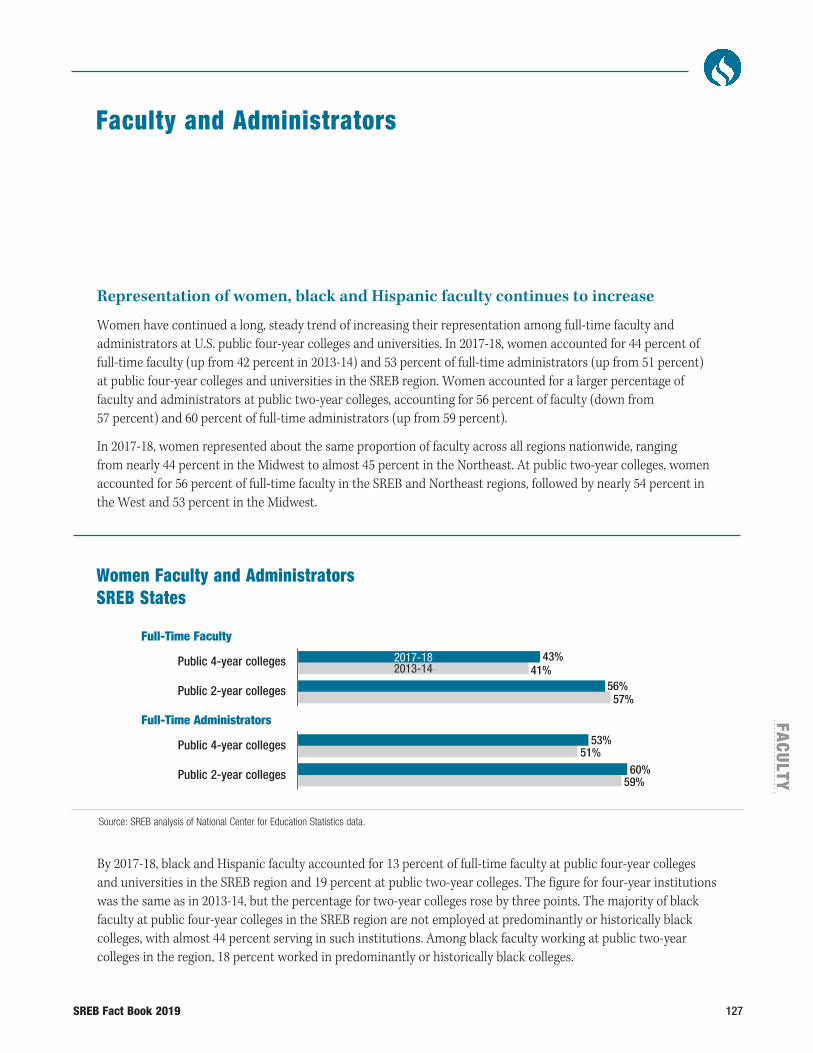
SREB Fact Book 2019 127
FACU
LTY
Representation of women, black and Hispanic faculty continues to increase
Women have continued a long, steady trend of increasing their representation among full-time faculty and administrators at U.S. public four-year colleges and universities. In 2017-18, women accounted for 44 percent of full-time faculty (up from 42 percent in 2013-14) and 53 percent of full-time administrators (up from 51 percent) at public four-year colleges and universities in the SREB region. Women accounted for a larger percentage of faculty and administrators at public two-year colleges, accounting for 56 percent of faculty (down from 57 percent) and 60 percent of full-time administrators (up from 59 percent).
In 2017-18, women represented about the same proportion of faculty across all regions nationwide, ranging from nearly 44 percent in the Midwest to almost 45 percent in the Northeast. At public two-year colleges, women accounted for 56 percent of full-time faculty in the SREB and Northeast regions, followed by nearly 54 percent in the West and 53 percent in the Midwest.
Faculty and Administrators
Women Faculty and Administrators SREB States
Source: SREB analysis of National Center for Education Statistics data.
56%57%
53%51%
60%59%
43%41%
2017-182013-14
Public 4-year colleges
Public 2-year colleges
Full-Time Faculty
Public 4-year colleges
Public 2-year colleges
Full-Time Administrators
By 2017-18, black and Hispanic faculty accounted for 13 percent of full-time faculty at public four-year colleges and universities in the SREB region and 19 percent at public two-year colleges. The figure for four-year institutions was the same as in 2013-14, but the percentage for two-year colleges rose by three points. The majority of black faculty at public four-year colleges in the SREB region are not employed at predominantly or historically black colleges, with almost 44 percent serving in such institutions. Among black faculty working at public two-year colleges in the region, 18 percent worked in predominantly or historically black colleges.
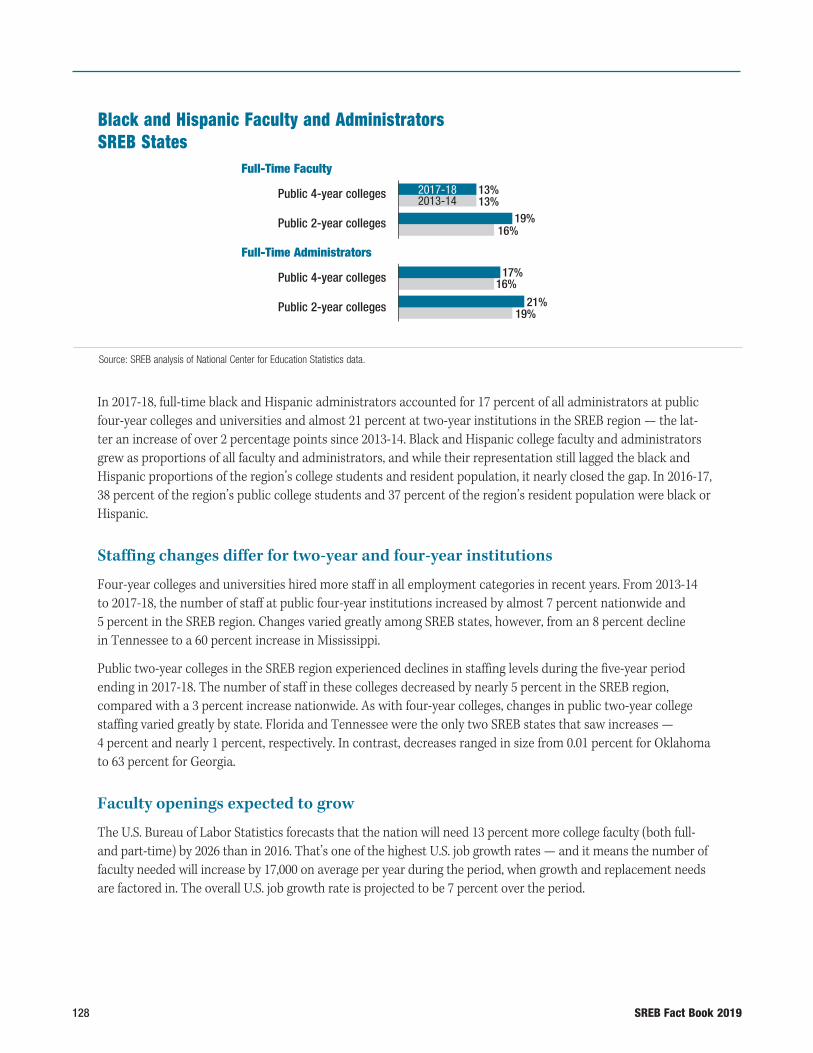
128 SREB Fact Book 2019
In 2017-18, full-time black and Hispanic administrators accounted for 17 percent of all administrators at public four-year colleges and universities and almost 21 percent at two-year institutions in the SREB region — the lat-ter an increase of over 2 percentage points since 2013-14. Black and Hispanic college faculty and administrators grew as proportions of all faculty and administrators, and while their representation still lagged the black and Hispanic proportions of the region’s college students and resident population, it nearly closed the gap. In 2016-17, 38 percent of the region’s public college students and 37 percent of the region’s resident population were black or Hispanic.
Staffing changes differ for two-year and four-year institutions
Four-year colleges and universities hired more staff in all employment categories in recent years. From 2013-14 to 2017-18, the number of staff at public four-year institutions increased by almost 7 percent nationwide and 5 percent in the SREB region. Changes varied greatly among SREB states, however, from an 8 percent decline in Tennessee to a 60 percent increase in Mississippi.
Public two-year colleges in the SREB region experienced declines in staffing levels during the five-year period ending in 2017-18. The number of staff in these colleges decreased by nearly 5 percent in the SREB region, compared with a 3 percent increase nationwide. As with four-year colleges, changes in public two-year college staffing varied greatly by state. Florida and Tennessee were the only two SREB states that saw increases — 4 percent and nearly 1 percent, respectively. In contrast, decreases ranged in size from 0.01 percent for Oklahoma to 63 percent for Georgia.
Faculty openings expected to grow
The U.S. Bureau of Labor Statistics forecasts that the nation will need 13 percent more college faculty (both full- and part-time) by 2026 than in 2016. That’s one of the highest U.S. job growth rates — and it means the number of faculty needed will increase by 17,000 on average per year during the period, when growth and replacement needs are factored in. The overall U.S. job growth rate is projected to be 7 percent over the period.
Black and Hispanic Faculty and Administrators SREB States
Source: SREB analysis of National Center for Education Statistics data.
Public 4-year colleges
Public 2-year colleges
Full-Time Faculty
Public 4-year colleges
Public 2-year colleges
Full-Time Administrators
19%16%
17%16%
21%19%
13%13%
2017-182013-14

SREB Fact Book 2019 129
FACU
LTY
Note: Includes both full- and part-time positions and openings due to growth and replacement needs.
Source: U.S. Bureau of Labor Statistics.
7% (1.9 million annual openings)
9% (166,000 annual openings)
16% (36,000 annual openings)
8% (36,000 annual openings)
13% (17,000 annual openings)
All jobs
Management, business and finance
Healthcare practitioners
P-12 teachers
Postsecondary teachers
Projected U.S. Job Growth2016 to 2026
Part-time faculty representation stable at four-year institutions, decreases at two-year
The trend among colleges and universities to hire part-time faculty and teaching/research assistants to meet their instructional demands appears to have stabilized or even slowed. In SREB states, part-time faculty and teaching/research assistants at public four-year colleges and universities made up 54 percent of total instructional staff in 2017-18 and in 2013-14. At public two-year colleges in the region, the percentage of part-time instructors decreased — from 69 percent of the teaching staff to 65 percent — over the same period.
The fact that part-time faculty and teaching/research assistants are a majority of the instructional staff does not mean they do a majority of the instruction, because part-time faculty members and teaching/research assistants typically do not teach as many classes as full-time faculty members. In addition, part-time faculty members generally do not have campus committee assignments or participate in student advising.
Part-Time Faculty SREB States
Note: At four-year colleges and universities, part-time faculty include teaching and research assistants.
Source: SREB analysis of National Center for Education Statistics data.
Public Four-Year Colleges and Universities Public Two-Year Colleges
2013-14 2017-18
Full Time 46%
Part Time 54%
Full Time 46%
Part Time 54%
2013-14 2017-18
Full Time 31%
Part Time 69%
Full Time 35%
Part Time 65%
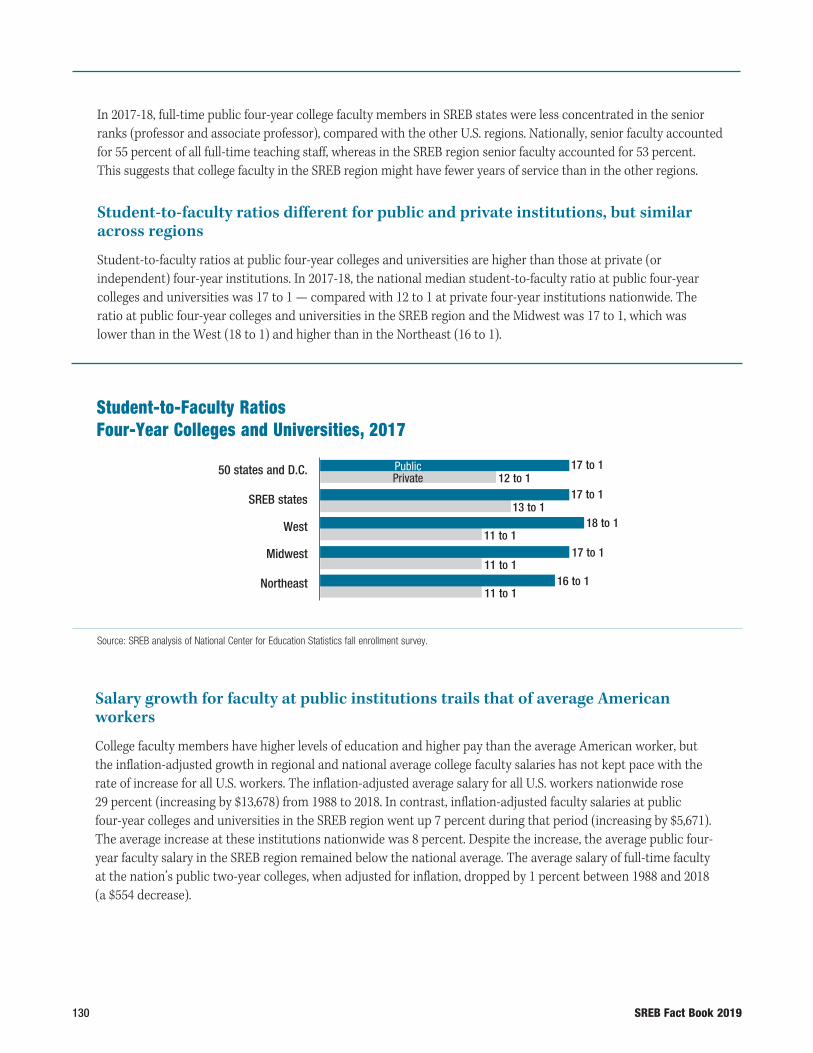
130 SREB Fact Book 2019
In 2017-18, full-time public four-year college faculty members in SREB states were less concentrated in the senior ranks (professor and associate professor), compared with the other U.S. regions. Nationally, senior faculty accounted for 55 percent of all full-time teaching staff, whereas in the SREB region senior faculty accounted for 53 percent. This suggests that college faculty in the SREB region might have fewer years of service than in the other regions.
Student-to-faculty ratios different for public and private institutions, but similar across regions
Student-to-faculty ratios at public four-year colleges and universities are higher than those at private (or independent) four-year institutions. In 2017-18, the national median student-to-faculty ratio at public four-year colleges and universities was 17 to 1 — compared with 12 to 1 at private four-year institutions nationwide. The ratio at public four-year colleges and universities in the SREB region and the Midwest was 17 to 1, which was lower than in the West (18 to 1) and higher than in the Northeast (16 to 1).
Student-to-Faculty Ratios Four-Year Colleges and Universities, 2017
Source: SREB analysis of National Center for Education Statistics fall enrollment survey.
17 to 113 to 1
18 to 111 to 1
17 to 111 to 1
16 to 111 to 1
17 to 112 to 1
PublicPrivate
50 states and D.C.
SREB states
West
Midwest
Northeast
Salary growth for faculty at public institutions trails that of average American workers
College faculty members have higher levels of education and higher pay than the average American worker, but the inflation-adjusted growth in regional and national average college faculty salaries has not kept pace with the rate of increase for all U.S. workers. The inflation-adjusted average salary for all U.S. workers nationwide rose 29 percent (increasing by $13,678) from 1988 to 2018. In contrast, inflation-adjusted faculty salaries at public four-year colleges and universities in the SREB region went up 7 percent during that period (increasing by $5,671). The average increase at these institutions nationwide was 8 percent. Despite the increase, the average public four-year faculty salary in the SREB region remained below the national average. The average salary of full-time faculty at the nation’s public two-year colleges, when adjusted for inflation, dropped by 1 percent between 1988 and 2018 (a $554 decrease).
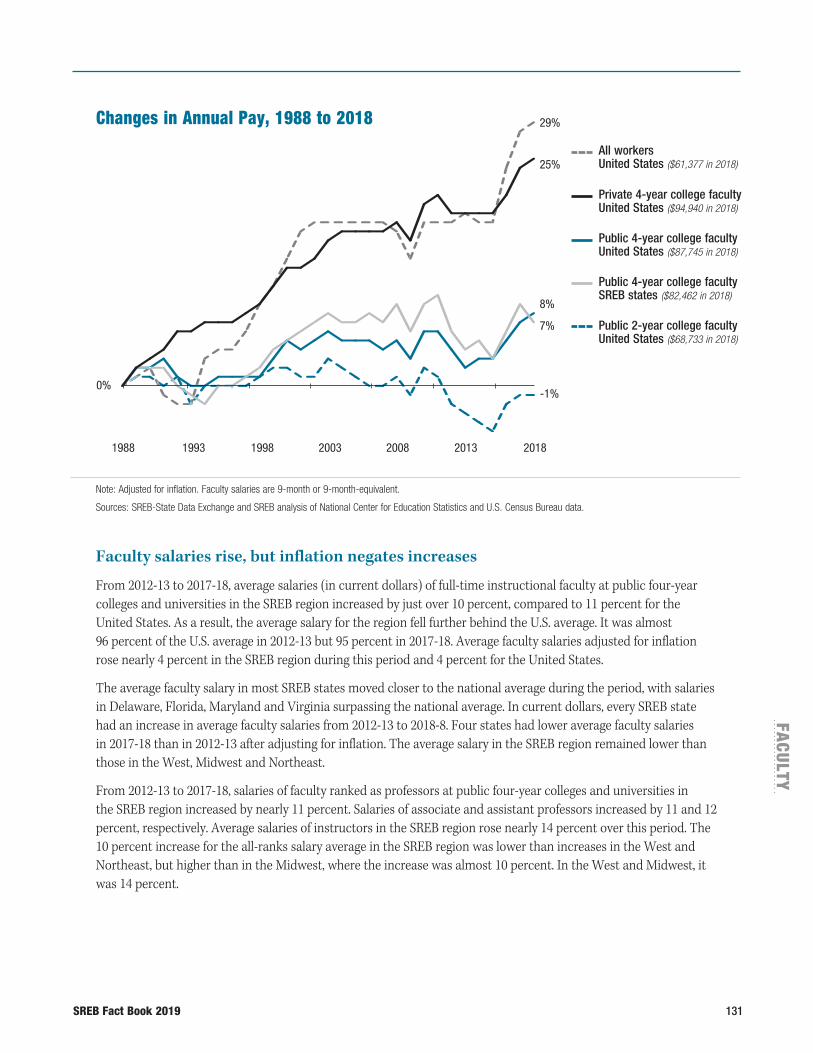
SREB Fact Book 2019 131
FACU
LTY
Faculty salaries rise, but inflation negates increases
From 2012-13 to 2017-18, average salaries (in current dollars) of full-time instructional faculty at public four-year colleges and universities in the SREB region increased by just over 10 percent, compared to 11 percent for the United States. As a result, the average salary for the region fell further behind the U.S. average. It was almost 96 percent of the U.S. average in 2012-13 but 95 percent in 2017-18. Average faculty salaries adjusted for inflation rose nearly 4 percent in the SREB region during this period and 4 percent for the United States.
The average faculty salary in most SREB states moved closer to the national average during the period, with salaries in Delaware, Florida, Maryland and Virginia surpassing the national average. In current dollars, every SREB state had an increase in average faculty salaries from 2012-13 to 2018-8. Four states had lower average faculty salaries in 2017-18 than in 2012-13 after adjusting for inflation. The average salary in the SREB region remained lower than those in the West, Midwest and Northeast.
From 2012-13 to 2017-18, salaries of faculty ranked as professors at public four-year colleges and universities in the SREB region increased by nearly 11 percent. Salaries of associate and assistant professors increased by 11 and 12 percent, respectively. Average salaries of instructors in the SREB region rose nearly 14 percent over this period. The 10 percent increase for the all-ranks salary average in the SREB region was lower than increases in the West and Northeast, but higher than in the Midwest, where the increase was almost 10 percent. In the West and Midwest, it was 14 percent.
Changes in Annual Pay, 1988 to 2018
Private 4-year college faculty United States ($94,940 in 2018)
Public 4-year college faculty SREB states ($82,462 in 2018)
Public 4-year college faculty United States ($87,745 in 2018)
1988 1993 1998 2003 2008 2013 2018
Note: Adjusted for inflation. Faculty salaries are 9-month or 9-month-equivalent.
Sources: SREB-State Data Exchange and SREB analysis of National Center for Education Statistics and U.S. Census Bureau data.
0%
29%
25%
8%
7%
-1%
All workers United States ($61,377 in 2018)
Public 2-year college faculty United States ($68,733 in 2018)
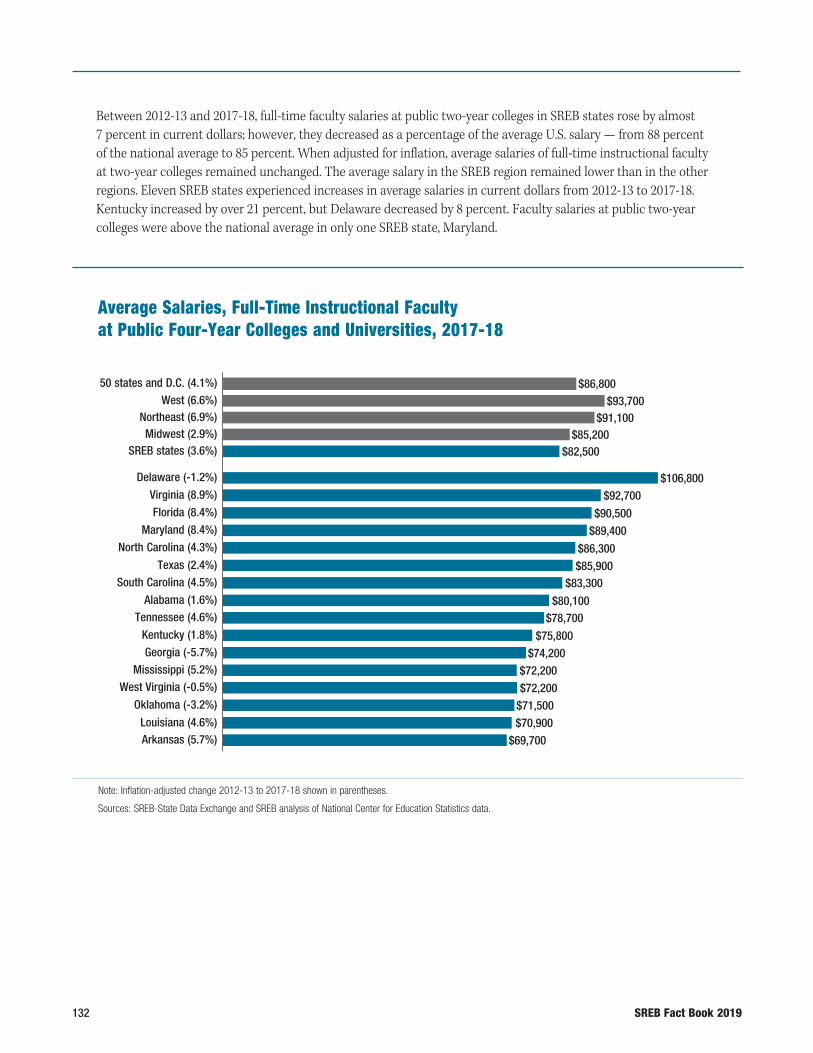
132 SREB Fact Book 2019
Between 2012-13 and 2017-18, full-time faculty salaries at public two-year colleges in SREB states rose by almost 7 percent in current dollars; however, they decreased as a percentage of the average U.S. salary — from 88 percent of the national average to 85 percent. When adjusted for inflation, average salaries of full-time instructional faculty at two-year colleges remained unchanged. The average salary in the SREB region remained lower than in the other regions. Eleven SREB states experienced increases in average salaries in current dollars from 2012-13 to 2017-18. Kentucky increased by over 21 percent, but Delaware decreased by 8 percent. Faculty salaries at public two-year colleges were above the national average in only one SREB state, Maryland.
Average Salaries, Full-Time Instructional Faculty at Public Four-Year Colleges and Universities, 2017-18
Note: Inflation-adjusted change 2012-13 to 2017-18 shown in parentheses.
Sources: SREB-State Data Exchange and SREB analysis of National Center for Education Statistics data.
50 states and D.C. (4.1%)West (6.6%)
Delaware (-1.2%)
Virginia (8.9%)
Florida (8.4%)
Maryland (8.4%)
North Carolina (4.3%)
Texas (2.4%)South Carolina (4.5%)
Alabama (1.6%)Tennessee (4.6%)
Kentucky (1.8%)Georgia (-5.7%)
Mississippi (5.2%)West Virginia (-0.5%)
Oklahoma (-3.2%)
Louisiana (4.6%)Arkansas (5.7%)
$86,800$93,700
Northeast (6.9%) $91,100Midwest (2.9%) $85,200
SREB states (3.6%) $82,500
$106,800$92,700
$90,500$89,400
$86,300$85,900
$83,300
$80,100$78,700
$75,800$74,200
$72,200$72,200
$71,500$70,900
$69,700
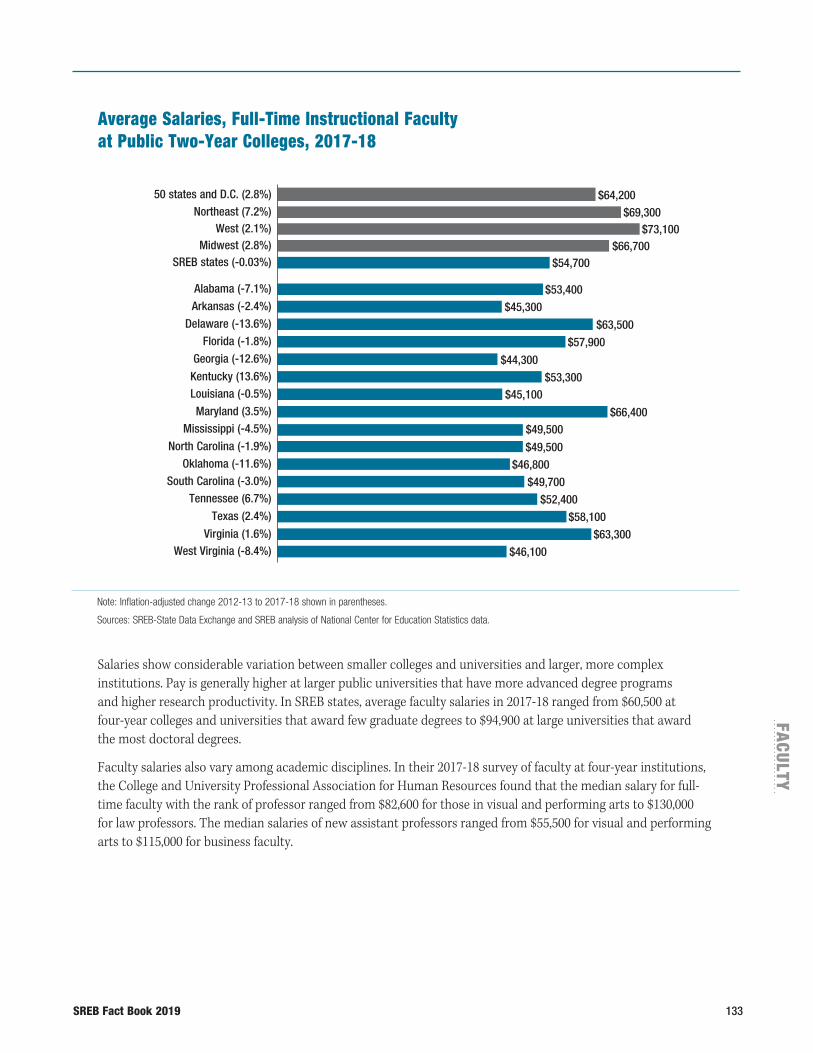
SREB Fact Book 2019 133
FACU
LTY
Average Salaries, Full-Time Instructional Faculty at Public Two-Year Colleges, 2017-18
Note: Inflation-adjusted change 2012-13 to 2017-18 shown in parentheses.
Sources: SREB-State Data Exchange and SREB analysis of National Center for Education Statistics data.
50 states and D.C. (2.8%)Northeast (7.2%)
Alabama (-7.1%)
Arkansas (-2.4%)
Delaware (-13.6%)
Florida (-1.8%)
Georgia (-12.6%)
Kentucky (13.6%)Louisiana (-0.5%)
Maryland (3.5%)Mississippi (-4.5%)
North Carolina (-1.9%)Oklahoma (-11.6%)
South Carolina (-3.0%)Tennessee (6.7%)
Texas (2.4%)
Virginia (1.6%)West Virginia (-8.4%)
$64,200$69,300
West (2.1%) $73,100Midwest (2.8%) $66,700
SREB states (-0.03%) $54,700
$53,400$45,300
$63,500$57,900
$44,300$53,300
$45,100
$66,400$49,500
$49,500$46,800
$49,700$52,400
$58,100$63,300
$46,100
Salaries show considerable variation between smaller colleges and universities and larger, more complex institutions. Pay is generally higher at larger public universities that have more advanced degree programs and higher research productivity. In SREB states, average faculty salaries in 2017-18 ranged from $60,500 at four-year colleges and universities that award few graduate degrees to $94,900 at large universities that award the most doctoral degrees.
Faculty salaries also vary among academic disciplines. In their 2017-18 survey of faculty at four-year institutions, the College and University Professional Association for Human Resources found that the median salary for full-time faculty with the rank of professor ranged from $82,600 for those in visual and performing arts to $130,000 for law professors. The median salaries of new assistant professors ranged from $55,500 for visual and performing arts to $115,000 for business faculty.
134 SREB Fact Book 2019
Senior administrator salaries vary considerably by area or academic discipline
The unweighted median salaries for top executive administrators varied by type of institution and the area of responsibility. Results of the College and University Professional Association for Human Resources survey of administrators found that the unweighted median salary for chief executive officers of single institutions was $313,500 in 2017-18 while the median salary for chief institutional research officers was $99,800. Among academic deans, median salaries ranged from $552,000 for deans of medicine to $113,000 for deans of mathematics.

SREB Fact Book 2019 135
FACU
LTY
Table 73Full-Time Faculty at Public Four-Year Colleges and Universities
Percent Percent of Total Percent of Percent of Change1 Black Faculty PBI/HBCU Faculty Total 2013-14 to 2013-14 2017-18 at PBIs or HBCUs3 Who Are Black 2017-18 2017-18 Women Black2 Hispanic2 Women Black2 Hispanic2 2013-14 2017-18 2013-14 2017-18
50 states and D.C. 391,310 8.8 42.3 5.4 4.3 44.2 5.4 4.9 31.2 27.7 57.5 52.4
SREB states 140,048 8.0 42.4 8.4 4.3 44.2 8.5 5.0 47.9 43.5 58.3 52.8as a percent of U.S. 35.8 Alabama 8,671 5.5 42.9 11.7 2.2 44.6 10.2 2.3 49.8 38.8 64.0 53.1Arkansas 4,136 4.9 44.7 6.9 2.0 46.4 7.9 2.4 38.0 42.0 61.6 59.5Delaware 1,440 6.5 40.2 9.8 3.2 44.7 10.7 3.7 64.6 64.2 35.9 38.0Florida 15,306 12.7 41.1 7.8 7.2 42.5 7.6 8.7 43.1 38.9 73.0 67.3Georgia 11,706 5.5 44.4 8.9 3.1 46.2 10.5 3.2 29.2 29.4 44.7 40.7Kentucky 7,343 7.2 42.7 5.1 2.2 44.6 5.3 2.4 10.6 11.4 24.6 32.8Louisiana 5,624 2.0 44.3 12.4 2.3 46.2 13.5 2.5 62.6 63.9 71.4 73.2Maryland 7,045 5.0 41.9 12.9 3.4 44.1 13.7 4.1 64.5 63.3 58.8 41.8Mississippi 4,661 27.3 43.6 17.2 2.0 45.4 15.0 2.3 73.8 62.2 68.4 63.4NorthCarolina 14,472 11.6 44.7 11.0 3.0 47.1 10.7 3.7 61.2 55.8 54.3 50.8Oklahoma 4,786 -1.3 40.0 4.6 2.5 42.6 3.5 2.7 50.8 39.5 59.8 50.8SouthCarolina 5,871 11.7 43.1 8.4 2.9 44.2 7.4 3.0 42.9 28.2 68.8 69.8Tennessee 6,381 -8.4 42.6 7.6 2.5 45.2 8.0 2.8 31.2 34.6 44.6 41.3Texas 24,725 12.5 41.4 6.2 9.7 42.8 6.3 10.8 43.7 39.7 65.7 63.6Virginia 13,952 6.8 40.7 6.7 2.8 42.5 6.8 3.1 43.3 36.2 59.2 57.3WestVirginia 3,929 6.2 40.7 3.4 1.4 42.2 3.4 1.5 23.1 18.0 13.9 12.2West 95,924 14.5 42.3 2.0 6.1 44.4 2.2 6.9 NA NA NA NAas a percent of U.S. 24.5 Alaska 1,682 -13.0 46.5 0.9 3.2 48.3 1.2 3.2 NA NA NA NAArizona 7,696 18.2 43.6 2.0 7.5 45.8 2.6 8.1 NA NA NA NACalifornia 38,420 22.6 40.3 3.0 7.5 42.9 3.2 8.5 NA NA NA NAColorado 13,055 20.5 45.9 1.5 5.6 48.0 1.5 5.8 NA NA NA NAHawaii 1,688 -8.3 43.4 1.6 2.5 44.5 1.6 2.5 NA NA NA NAIdaho 2,315 11.2 43.7 0.6 2.1 45.0 0.7 3.2 NA NA NA NAMontana 1,771 -6.6 40.2 0.3 1.4 41.1 0.4 2.1 NA NA NA NANevada 2,225 21.3 40.1 2.8 5.0 41.2 3.6 6.0 NA NA NA NANewMexico 3,358 0.6 46.0 2.0 15.3 47.7 1.5 16.1 NA NA NA NAOregon 5,380 13.5 43.5 1.1 4.5 46.2 1.4 5.3 NA NA NA NAUtah 6,861 -0.2 38.2 1.0 3.1 39.4 0.8 3.9 NA NA NA NAWashington 10,492 10.3 44.5 1.9 4.6 46.9 1.9 5.1 NA NA NA NAWyoming 981 -4.4 39.2 1.2 1.9 39.8 1.5 2.1 NA NA NA NAMidwest 98,569 5.3 41.8 4.0 3.1 43.7 4.0 3.4 7.3 4.7 43.6 37.7as a percent of U.S. 25.2 Illinois 10,030 -3.0 44.4 6.5 4.5 45.7 6.1 4.7 21.9 14.0 48.1 41.8Indiana 11,540 7.7 41.6 3.5 3.2 42.9 3.8 3.8 NA NA NA NAIowa 5,495 6.2 37.4 2.5 3.2 39.5 2.5 3.9 NA NA NA NAKansas 6,458 7.7 43.5 2.6 2.8 45.7 2.9 3.2 NA NA NA NAMichigan 19,493 4.7 41.8 4.8 3.3 43.6 4.9 3.5 NA NA NA NAMinnesota 7,907 6.4 41.4 2.5 2.9 44.2 2.5 3.2 NA NA NA NAMissouri 6,612 -0.9 42.4 4.4 2.3 44.7 4.5 3.1 20.5 15.4 29.6 26.9Nebraska 4,201 49.6 40.2 2.5 3.2 42.2 2.3 3.1 NA NA NA NANorthDakota 1,999 -0.9 43.5 1.3 1.1 44.8 1.4 1.2 NA NA NA NAOhio 14,093 8.0 41.1 4.9 2.7 43.8 5.0 3.1 9.2 7.2 58.1 46.5SouthDakota 1,673 9.3 45.5 0.7 1.7 44.4 1.5 2.0 NA NA NA NAWisconsin 9,068 -1.9 41.0 2.5 2.8 42.6 2.3 3.1 NA NA NA NANortheast 56,552 8.3 43.2 4.9 3.8 44.6 4.9 4.3 8.3 7.3 57.9 57.6as a percent of U.S. 14.5 Connecticut 3,629 1.5 42.3 4.2 4.2 43.9 4.3 5.1 NA NA NA NAMaine 1,188 -3.8 42.7 0.6 1.4 44.4 1.1 1.9 NA NA NA NAMassachusetts 5,105 8.8 45.7 4.3 3.3 47.4 4.4 4.0 NA NA NA NANewHampshire 1,205 8.6 43.2 1.8 2.2 47.1 1.4 3.0 NA NA NA NANewJersey 8,666 6.5 43.8 6.3 4.4 45.4 6.3 5.4 NA NA NA NANewYork 15,948 11.2 43.9 6.6 4.9 44.4 6.4 5.2 12.5 11.8 62.6 66.3Pennsylvania 18,078 8.8 41.7 4.0 3.0 43.1 4.1 3.3 13.6 9.9 52.6 47.2RhodeIsland 1,111 7.6 49.2 2.5 2.9 53.0 2.7 3.2 NA NA NA NAVermont 1,622 8.9 41.2 2.2 2.4 42.8 1.5 3.6 NA NA NA NADistrictofColumbia 217 -25.7 57.5 64.8 0.0 53.9 62.0 0.0 100.0 100.0 64.8 59.4
“NA” indicates not applicable. There was no institution of this type in the state during the specified years.
Notes: For this table to profile the same group as the faculty salary averages, figures include all full-time faculty at public four-year colleges and universities except those at specialized institutions. (See Appendix A for examples.)
SREB and the National Center for Education Statistics (NCES) treat two-year colleges awarding bachelor’s degrees differently. NCES classifies two-year colleges awarding bachelor’s degrees as four-year institutions. SREB classifies them as two-year colleges until they meet other criteria. (See Appendix A for definitions.)
1 States with very large percent increases or decreases reflect reclassifications of staff. (See table “Staff at Public Four-Year Colleges and Universities” and related database for further information.)
2 Calculated based on a total that excludes people whose race is unknown and people from foreign countries.
3 Predominantly black institutions (PBIs) are those in which black students account for more than 50 percent of total enrollment. Historically black colleges and universities (HBCUs) are those founded prior to 1964 as institutions for black students. While an institution’s PBI status may change from year to year, HBCU status will not.
Source: SREB analysis of National Center for Education Statistics fall staff surveys — www.nces.ed.gov/ipeds.
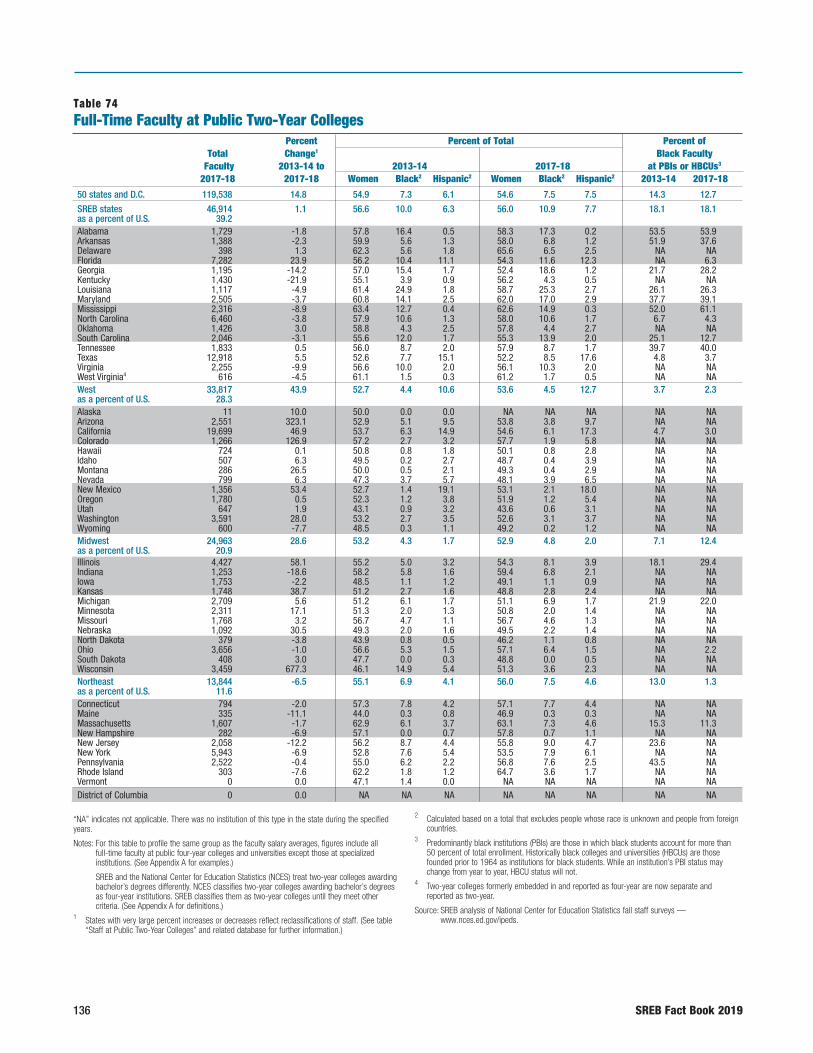
136 SREB Fact Book 2019
Table 74Full-Time Faculty at Public Two-Year Colleges
Percent Percent of Total Percent of Total Change1 Black Faculty Faculty 2013-14 to 2013-14 2017-18 at PBIs or HBCUs3 2017-18 2017-18 Women Black2 Hispanic2 Women Black2 Hispanic2 2013-14 2017-18
50 states and D.C. 119,538 14.8 54.9 7.3 6.1 54.6 7.5 7.5 14.3 12.7
SREB states 46,914 1.1 56.6 10.0 6.3 56.0 10.9 7.7 18.1 18.1as a percent of U.S. 39.2 Alabama 1,729 -1.8 57.8 16.4 0.5 58.3 17.3 0.2 53.5 53.9Arkansas 1,388 -2.3 59.9 5.6 1.3 58.0 6.8 1.2 51.9 37.6Delaware 398 1.3 62.3 5.6 1.8 65.6 6.5 2.5 NA NAFlorida 7,282 23.9 56.2 10.4 11.1 54.3 11.6 12.3 NA 6.3Georgia 1,195 -14.2 57.0 15.4 1.7 52.4 18.6 1.2 21.7 28.2Kentucky 1,430 -21.9 55.1 3.9 0.9 56.2 4.3 0.5 NA NALouisiana 1,117 -4.9 61.4 24.9 1.8 58.7 25.3 2.7 26.1 26.3Maryland 2,505 -3.7 60.8 14.1 2.5 62.0 17.0 2.9 37.7 39.1Mississippi 2,316 -8.9 63.4 12.7 0.4 62.6 14.9 0.3 52.0 61.1NorthCarolina 6,460 -3.8 57.9 10.6 1.3 58.0 10.6 1.7 6.7 4.3Oklahoma 1,426 3.0 58.8 4.3 2.5 57.8 4.4 2.7 NA NASouthCarolina 2,046 -3.1 55.6 12.0 1.7 55.3 13.9 2.0 25.1 12.7Tennessee 1,833 0.5 56.0 8.7 2.0 57.9 8.7 1.7 39.7 40.0Texas 12,918 5.5 52.6 7.7 15.1 52.2 8.5 17.6 4.8 3.7Virginia 2,255 -9.9 56.6 10.0 2.0 56.1 10.3 2.0 NA NAWestVirginia4 616 -4.5 61.1 1.5 0.3 61.2 1.7 0.5 NA NAWest 33,817 43.9 52.7 4.4 10.6 53.6 4.5 12.7 3.7 2.3as a percent of U.S. 28.3 Alaska 11 10.0 50.0 0.0 0.0 NA NA NA NA NAArizona 2,551 323.1 52.9 5.1 9.5 53.8 3.8 9.7 NA NACalifornia 19,699 46.9 53.7 6.3 14.9 54.6 6.1 17.3 4.7 3.0Colorado 1,266 126.9 57.2 2.7 3.2 57.7 1.9 5.8 NA NAHawaii 724 0.1 50.8 0.8 1.8 50.1 0.8 2.8 NA NAIdaho 507 6.3 49.5 0.2 2.7 48.7 0.4 3.9 NA NAMontana 286 26.5 50.0 0.5 2.1 49.3 0.4 2.9 NA NANevada 799 6.3 47.3 3.7 5.7 48.1 3.9 6.5 NA NANewMexico 1,356 53.4 52.7 1.4 19.1 53.1 2.1 18.0 NA NAOregon 1,780 0.5 52.3 1.2 3.8 51.9 1.2 5.4 NA NAUtah 647 1.9 43.1 0.9 3.2 43.6 0.6 3.1 NA NAWashington 3,591 28.0 53.2 2.7 3.5 52.6 3.1 3.7 NA NAWyoming 600 -7.7 48.5 0.3 1.1 49.2 0.2 1.2 NA NAMidwest 24,963 28.6 53.2 4.3 1.7 52.9 4.8 2.0 7.1 12.4as a percent of U.S. 20.9 Illinois 4,427 58.1 55.2 5.0 3.2 54.3 8.1 3.9 18.1 29.4Indiana 1,253 -18.6 58.2 5.8 1.6 59.4 6.8 2.1 NA NAIowa 1,753 -2.2 48.5 1.1 1.2 49.1 1.1 0.9 NA NAKansas 1,748 38.7 51.2 2.7 1.6 48.8 2.8 2.4 NA NAMichigan 2,709 5.6 51.2 6.1 1.7 51.1 6.9 1.7 21.9 22.0Minnesota 2,311 17.1 51.3 2.0 1.3 50.8 2.0 1.4 NA NAMissouri 1,768 3.2 56.7 4.7 1.1 56.7 4.6 1.3 NA NANebraska 1,092 30.5 49.3 2.0 1.6 49.5 2.2 1.4 NA NANorthDakota 379 -3.8 43.9 0.8 0.5 46.2 1.1 0.8 NA NAOhio 3,656 -1.0 56.6 5.3 1.5 57.1 6.4 1.5 NA 2.2SouthDakota 408 3.0 47.7 0.0 0.3 48.8 0.0 0.5 NA NAWisconsin 3,459 677.3 46.1 14.9 5.4 51.3 3.6 2.3 NA NANortheast 13,844 -6.5 55.1 6.9 4.1 56.0 7.5 4.6 13.0 1.3as a percent of U.S. 11.6 Connecticut 794 -2.0 57.3 7.8 4.2 57.1 7.7 4.4 NA NAMaine 335 -11.1 44.0 0.3 0.8 46.9 0.3 0.3 NA NAMassachusetts 1,607 -1.7 62.9 6.1 3.7 63.1 7.3 4.6 15.3 11.3NewHampshire 282 -6.9 57.1 0.0 0.7 57.8 0.7 1.1 NA NANewJersey 2,058 -12.2 56.2 8.7 4.4 55.8 9.0 4.7 23.6 NANewYork 5,943 -6.9 52.8 7.6 5.4 53.5 7.9 6.1 NA NAPennsylvania 2,522 -0.4 55.0 6.2 2.2 56.8 7.6 2.5 43.5 NARhodeIsland 303 -7.6 62.2 1.8 1.2 64.7 3.6 1.7 NA NAVermont 0 0.0 47.1 1.4 0.0 NA NA NA NA NADistrictofColumbia 0 0.0 NA NA NA NA NA NA NA NA
“NA” indicates not applicable. There was no institution of this type in the state during the specified years.
Notes: For this table to profile the same group as the faculty salary averages, figures include all full-time faculty at public four-year colleges and universities except those at specialized institutions. (See Appendix A for examples.)
SREB and the National Center for Education Statistics (NCES) treat two-year colleges awarding bachelor’s degrees differently. NCES classifies two-year colleges awarding bachelor’s degrees as four-year institutions. SREB classifies them as two-year colleges until they meet other criteria. (See Appendix A for definitions.)
1 States with very large percent increases or decreases reflect reclassifications of staff. (See table “Staff at Public Two-Year Colleges” and related database for further information.)
2 Calculated based on a total that excludes people whose race is unknown and people from foreign countries.
3 Predominantly black institutions (PBIs) are those in which black students account for more than 50 percent of total enrollment. Historically black colleges and universities (HBCUs) are those founded prior to 1964 as institutions for black students. While an institution’s PBI status may change from year to year, HBCU status will not.
4 Two-year colleges formerly embedded in and reported as four-year are now separate and reported as two-year.
Source: SREB analysis of National Center for Education Statistics fall staff surveys — www.nces.ed.gov/ipeds.
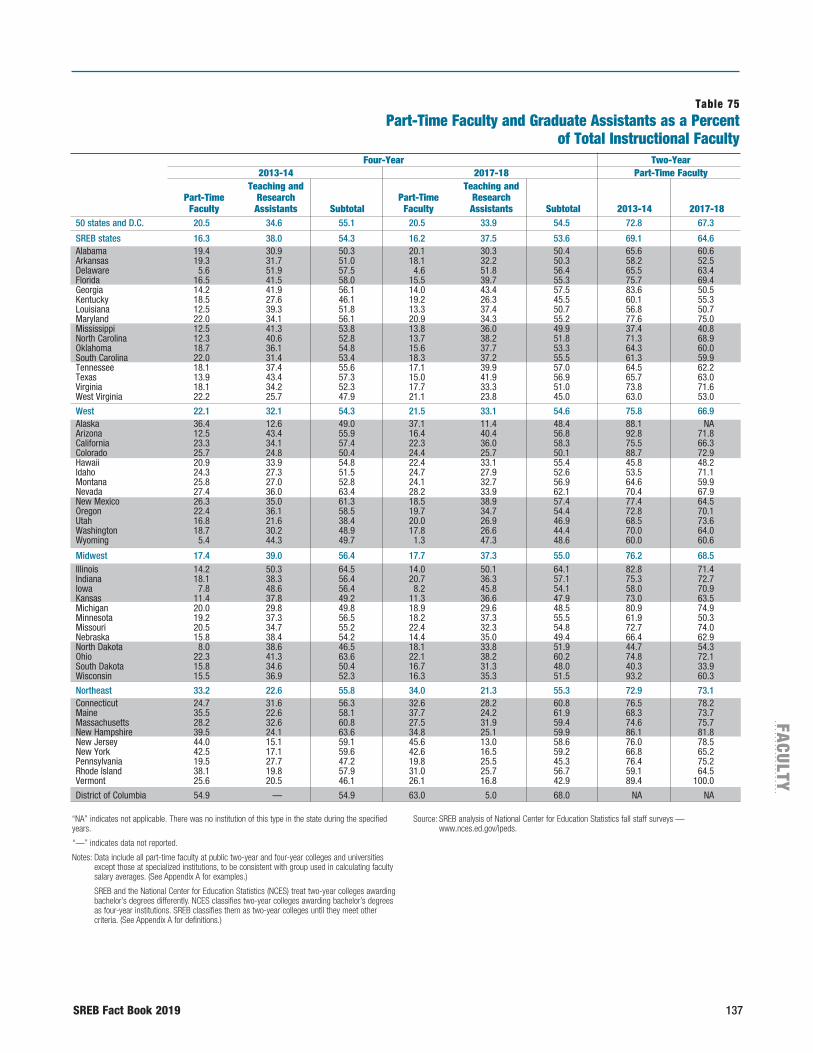
SREB Fact Book 2019 137
FACU
LTY
Table 75Part-Time Faculty and Graduate Assistants as a Percent
of Total Instructional Faculty Four-Year Two-Year 2013-14 2017-18 Part-Time Faculty Teaching and Teaching and Part-Time Research Part-Time Research Faculty Assistants Subtotal Faculty Assistants Subtotal 2013-14 2017-18
50 states and D.C. 20.5 34.6 55.1 20.5 33.9 54.5 72.8 67.3
SREB states 16.3 38.0 54.3 16.2 37.5 53.6 69.1 64.6 Alabama 19.4 30.9 50.3 20.1 30.3 50.4 65.6 60.6Arkansas 19.3 31.7 51.0 18.1 32.2 50.3 58.2 52.5Delaware 5.6 51.9 57.5 4.6 51.8 56.4 65.5 63.4Florida 16.5 41.5 58.0 15.5 39.7 55.3 75.7 69.4Georgia 14.2 41.9 56.1 14.0 43.4 57.5 83.6 50.5Kentucky 18.5 27.6 46.1 19.2 26.3 45.5 60.1 55.3Louisiana 12.5 39.3 51.8 13.3 37.4 50.7 56.8 50.7Maryland 22.0 34.1 56.1 20.9 34.3 55.2 77.6 75.0Mississippi 12.5 41.3 53.8 13.8 36.0 49.9 37.4 40.8NorthCarolina 12.3 40.6 52.8 13.7 38.2 51.8 71.3 68.9Oklahoma 18.7 36.1 54.8 15.6 37.7 53.3 64.3 60.0SouthCarolina 22.0 31.4 53.4 18.3 37.2 55.5 61.3 59.9Tennessee 18.1 37.4 55.6 17.1 39.9 57.0 64.5 62.2Texas 13.9 43.4 57.3 15.0 41.9 56.9 65.7 63.0Virginia 18.1 34.2 52.3 17.7 33.3 51.0 73.8 71.6WestVirginia 22.2 25.7 47.9 21.1 23.8 45.0 63.0 53.0
West 22.1 32.1 54.3 21.5 33.1 54.6 75.8 66.9Alaska 36.4 12.6 49.0 37.1 11.4 48.4 88.1 NAArizona 12.5 43.4 55.9 16.4 40.4 56.8 92.8 71.8California 23.3 34.1 57.4 22.3 36.0 58.3 75.5 66.3Colorado 25.7 24.8 50.4 24.4 25.7 50.1 88.7 72.9Hawaii 20.9 33.9 54.8 22.4 33.1 55.4 45.8 48.2Idaho 24.3 27.3 51.5 24.7 27.9 52.6 53.5 71.1Montana 25.8 27.0 52.8 24.1 32.7 56.9 64.6 59.9Nevada 27.4 36.0 63.4 28.2 33.9 62.1 70.4 67.9NewMexico 26.3 35.0 61.3 18.5 38.9 57.4 77.4 64.5Oregon 22.4 36.1 58.5 19.7 34.7 54.4 72.8 70.1Utah 16.8 21.6 38.4 20.0 26.9 46.9 68.5 73.6Washington 18.7 30.2 48.9 17.8 26.6 44.4 70.0 64.0Wyoming 5.4 44.3 49.7 1.3 47.3 48.6 60.0 60.6
Midwest 17.4 39.0 56.4 17.7 37.3 55.0 76.2 68.5 Illinois 14.2 50.3 64.5 14.0 50.1 64.1 82.8 71.4Indiana 18.1 38.3 56.4 20.7 36.3 57.1 75.3 72.7Iowa 7.8 48.6 56.4 8.2 45.8 54.1 58.0 70.9Kansas 11.4 37.8 49.2 11.3 36.6 47.9 73.0 63.5Michigan 20.0 29.8 49.8 18.9 29.6 48.5 80.9 74.9Minnesota 19.2 37.3 56.5 18.2 37.3 55.5 61.9 50.3Missouri 20.5 34.7 55.2 22.4 32.3 54.8 72.7 74.0Nebraska 15.8 38.4 54.2 14.4 35.0 49.4 66.4 62.9NorthDakota 8.0 38.6 46.5 18.1 33.8 51.9 44.7 54.3Ohio 22.3 41.3 63.6 22.1 38.2 60.2 74.8 72.1SouthDakota 15.8 34.6 50.4 16.7 31.3 48.0 40.3 33.9Wisconsin 15.5 36.9 52.3 16.3 35.3 51.5 93.2 60.3
Northeast 33.2 22.6 55.8 34.0 21.3 55.3 72.9 73.1 Connecticut 24.7 31.6 56.3 32.6 28.2 60.8 76.5 78.2Maine 35.5 22.6 58.1 37.7 24.2 61.9 68.3 73.7Massachusetts 28.2 32.6 60.8 27.5 31.9 59.4 74.6 75.7NewHampshire 39.5 24.1 63.6 34.8 25.1 59.9 86.1 81.8NewJersey 44.0 15.1 59.1 45.6 13.0 58.6 76.0 78.5NewYork 42.5 17.1 59.6 42.6 16.5 59.2 66.8 65.2Pennsylvania 19.5 27.7 47.2 19.8 25.5 45.3 76.4 75.2RhodeIsland 38.1 19.8 57.9 31.0 25.7 56.7 59.1 64.5Vermont 25.6 20.5 46.1 26.1 16.8 42.9 89.4 100.0
DistrictofColumbia 54.9 — 54.9 63.0 5.0 68.0 NA NA
“NA” indicates not applicable. There was no institution of this type in the state during the specified years.
“—” indicates data not reported.
Notes: Data include all part-time faculty at public two-year and four-year colleges and universities except those at specialized institutions, to be consistent with group used in calculating faculty salary averages. (See Appendix A for examples.)
SREB and the National Center for Education Statistics (NCES) treat two-year colleges awarding bachelor’s degrees differently. NCES classifies two-year colleges awarding bachelor’s degrees as four-year institutions. SREB classifies them as two-year colleges until they meet other criteria. (See Appendix A for definitions.)
Source: SREB analysis of National Center for Education Statistics fall staff surveys — www.nces.ed.gov/ipeds.
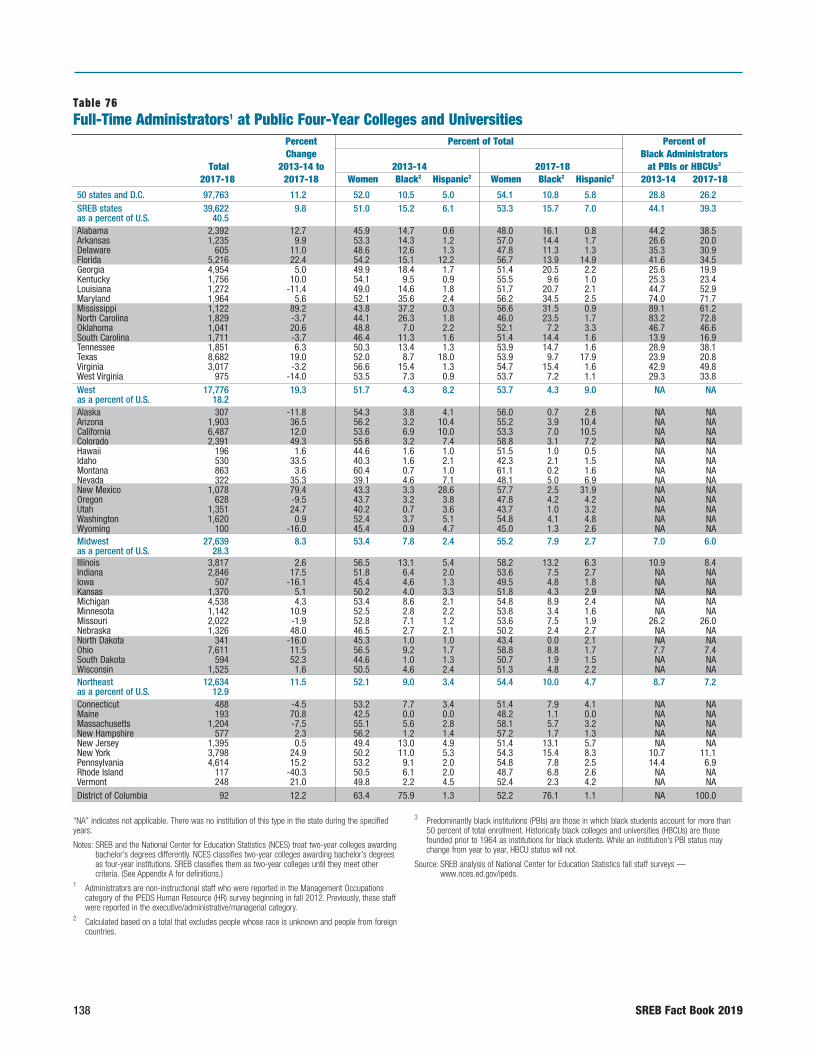
138 SREB Fact Book 2019
Table 76Full-Time Administrators1 at Public Four-Year Colleges and Universities
Percent Percent of Total Percent of Change Black Administrators Total 2013-14 to 2013-14 2017-18 at PBIs or HBCUs3 2017-18 2017-18 Women Black2 Hispanic2 Women Black2 Hispanic2 2013-14 2017-18
50 states and D.C. 97,763 11.2 52.0 10.5 5.0 54.1 10.8 5.8 28.8 26.2SREB states 39,622 9.8 51.0 15.2 6.1 53.3 15.7 7.0 44.1 39.3as a percent of U.S. 40.5 Alabama 2,392 12.7 45.9 14.7 0.6 48.0 16.1 0.8 44.2 38.5Arkansas 1,235 9.9 53.3 14.3 1.2 57.0 14.4 1.7 26.6 20.0Delaware 605 11.0 48.6 12.6 1.3 47.8 11.3 1.3 35.3 30.9Florida 5,216 22.4 54.2 15.1 12.2 56.7 13.9 14.9 41.6 34.5Georgia 4,954 5.0 49.9 18.4 1.7 51.4 20.5 2.2 25.6 19.9Kentucky 1,756 10.0 54.1 9.5 0.9 55.5 9.6 1.0 25.3 23.4Louisiana 1,272 -11.4 49.0 14.6 1.8 51.7 20.7 2.1 44.7 52.9Maryland 1,964 5.6 52.1 35.6 2.4 56.2 34.5 2.5 74.0 71.7Mississippi 1,122 89.2 43.8 37.2 0.3 56.6 31.5 0.9 89.1 61.2NorthCarolina 1,829 -3.7 44.1 26.3 1.8 46.0 23.5 1.7 83.2 72.8Oklahoma 1,041 20.6 48.8 7.0 2.2 52.1 7.2 3.3 46.7 46.6SouthCarolina 1,711 -3.7 46.4 11.3 1.6 51.4 14.4 1.6 13.9 16.9Tennessee 1,851 6.3 50.3 13.4 1.3 53.9 14.7 1.6 28.9 38.1Texas 8,682 19.0 52.0 8.7 18.0 53.9 9.7 17.9 23.9 20.8Virginia 3,017 -3.2 56.6 15.4 1.3 54.7 15.4 1.6 42.9 49.8WestVirginia 975 -14.0 53.5 7.3 0.9 53.7 7.2 1.1 29.3 33.8West 17,776 19.3 51.7 4.3 8.2 53.7 4.3 9.0 NA NAas a percent of U.S. 18.2 Alaska 307 -11.8 54.3 3.8 4.1 56.0 0.7 2.6 NA NAArizona 1,903 36.5 56.2 3.2 10.4 55.2 3.9 10.4 NA NACalifornia 6,487 12.0 53.6 6.9 10.0 53.3 7.0 10.5 NA NAColorado 2,391 49.3 55.6 3.2 7.4 58.8 3.1 7.2 NA NAHawaii 196 1.6 44.6 1.6 1.0 51.5 1.0 0.5 NA NAIdaho 530 33.5 40.3 1.6 2.1 42.3 2.1 1.5 NA NAMontana 863 3.6 60.4 0.7 1.0 61.1 0.2 1.6 NA NANevada 322 35.3 39.1 4.6 7.1 48.1 5.0 6.9 NA NANewMexico 1,078 79.4 43.3 3.3 28.6 57.7 2.5 31.9 NA NAOregon 628 -9.5 43.7 3.2 3.8 47.8 4.2 4.2 NA NAUtah 1,351 24.7 40.2 0.7 3.6 43.7 1.0 3.2 NA NAWashington 1,620 0.9 52.4 3.7 5.1 54.8 4.1 4.8 NA NAWyoming 100 -16.0 45.4 0.9 4.7 45.0 1.3 2.6 NA NAMidwest 27,639 8.3 53.4 7.8 2.4 55.2 7.9 2.7 7.0 6.0as a percent of U.S. 28.3 Illinois 3,817 2.6 56.5 13.1 5.4 58.2 13.2 6.3 10.9 8.4Indiana 2,846 17.5 51.8 6.4 2.0 53.6 7.5 2.7 NA NAIowa 507 -16.1 45.4 4.6 1.3 49.5 4.8 1.8 NA NAKansas 1,370 5.1 50.2 4.0 3.3 51.8 4.3 2.9 NA NAMichigan 4,538 4.3 53.4 8.6 2.1 54.8 8.9 2.4 NA NAMinnesota 1,142 10.9 52.5 2.8 2.2 53.8 3.4 1.6 NA NAMissouri 2,022 -1.9 52.8 7.1 1.2 53.6 7.5 1.9 26.2 26.0Nebraska 1,326 48.0 46.5 2.7 2.1 50.2 2.4 2.7 NA NANorthDakota 341 -16.0 45.3 1.0 1.0 43.4 0.0 2.1 NA NAOhio 7,611 11.5 56.5 9.2 1.7 58.8 8.8 1.7 7.7 7.4SouthDakota 594 52.3 44.6 1.0 1.3 50.7 1.9 1.5 NA NAWisconsin 1,525 1.6 50.5 4.6 2.4 51.3 4.8 2.2 NA NANortheast 12,634 11.5 52.1 9.0 3.4 54.4 10.0 4.7 8.7 7.2as a percent of U.S. 12.9 Connecticut 488 -4.5 53.2 7.7 3.4 51.4 7.9 4.1 NA NAMaine 193 70.8 42.5 0.0 0.0 48.2 1.1 0.0 NA NAMassachusetts 1,204 -7.5 55.1 5.6 2.8 58.1 5.7 3.2 NA NANewHampshire 577 2.3 56.2 1.2 1.4 57.2 1.7 1.3 NA NANewJersey 1,395 0.5 49.4 13.0 4.9 51.4 13.1 5.7 NA NANewYork 3,798 24.9 50.2 11.0 5.3 54.3 15.4 8.3 10.7 11.1Pennsylvania 4,614 15.2 53.2 9.1 2.0 54.8 7.8 2.5 14.4 6.9RhodeIsland 117 -40.3 50.5 6.1 2.0 48.7 6.8 2.6 NA NAVermont 248 21.0 49.8 2.2 4.5 52.4 2.3 4.2 NA NADistrictofColumbia 92 12.2 63.4 75.9 1.3 52.2 76.1 1.1 NA 100.0
“NA” indicates not applicable. There was no institution of this type in the state during the specified years.
Notes: SREB and the National Center for Education Statistics (NCES) treat two-year colleges awarding bachelor’s degrees differently. NCES classifies two-year colleges awarding bachelor’s degrees as four-year institutions. SREB classifies them as two-year colleges until they meet other criteria. (See Appendix A for definitions.)
1 Administrators are non-instructional staff who were reported in the Management Occupations category of the IPEDS Human Resource (HR) survey beginning in fall 2012. Previously, these staff were reported in the executive/administrative/managerial category.
2 Calculated based on a total that excludes people whose race is unknown and people from foreign countries.
3 Predominantly black institutions (PBIs) are those in which black students account for more than 50 percent of total enrollment. Historically black colleges and universities (HBCUs) are those founded prior to 1964 as institutions for black students. While an institution’s PBI status may change from year to year, HBCU status will not.
Source: SREB analysis of National Center for Education Statistics fall staff surveys — www.nces.ed.gov/ipeds.
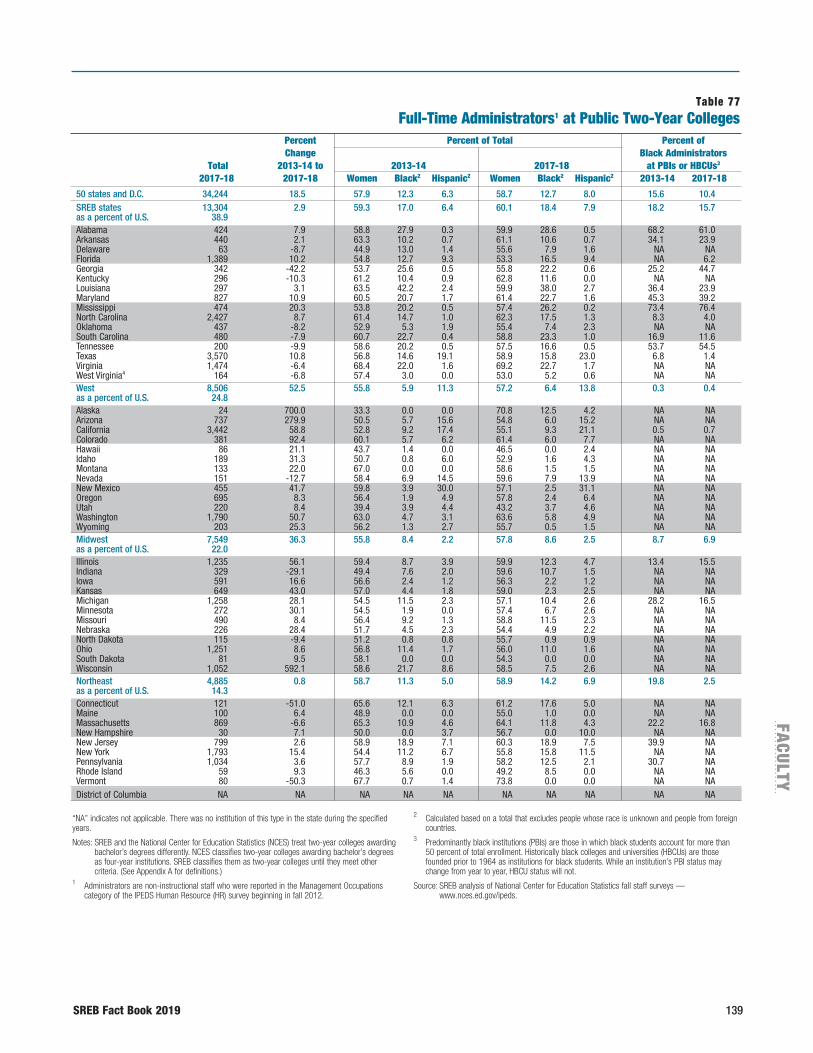
SREB Fact Book 2019 139
FACU
LTY
Table 77Full-Time Administrators1 at Public Two-Year Colleges
Percent Percent of Total Percent of Change Black Administrators Total 2013-14 to 2013-14 2017-18 at PBIs or HBCUs3 2017-18 2017-18 Women Black2 Hispanic2 Women Black2 Hispanic2 2013-14 2017-18
50 states and D.C. 34,244 18.5 57.9 12.3 6.3 58.7 12.7 8.0 15.6 10.4SREB states 13,304 2.9 59.3 17.0 6.4 60.1 18.4 7.9 18.2 15.7as a percent of U.S. 38.9 Alabama 424 7.9 58.8 27.9 0.3 59.9 28.6 0.5 68.2 61.0Arkansas 440 2.1 63.3 10.2 0.7 61.1 10.6 0.7 34.1 23.9Delaware 63 -8.7 44.9 13.0 1.4 55.6 7.9 1.6 NA NAFlorida 1,389 10.2 54.8 12.7 9.3 53.3 16.5 9.4 NA 6.2Georgia 342 -42.2 53.7 25.6 0.5 55.8 22.2 0.6 25.2 44.7Kentucky 296 -10.3 61.2 10.4 0.9 62.8 11.6 0.0 NA NALouisiana 297 3.1 63.5 42.2 2.4 59.9 38.0 2.7 36.4 23.9Maryland 827 10.9 60.5 20.7 1.7 61.4 22.7 1.6 45.3 39.2Mississippi 474 20.3 53.8 20.2 0.5 57.4 26.2 0.2 73.4 76.4NorthCarolina 2,427 8.7 61.4 14.7 1.0 62.3 17.5 1.3 8.3 4.0Oklahoma 437 -8.2 52.9 5.3 1.9 55.4 7.4 2.3 NA NASouthCarolina 480 -7.9 60.7 22.7 0.4 58.8 23.3 1.0 16.9 11.6Tennessee 200 -9.9 58.6 20.2 0.5 57.5 16.6 0.5 53.7 54.5Texas 3,570 10.8 56.8 14.6 19.1 58.9 15.8 23.0 6.8 1.4Virginia 1,474 -6.4 68.4 22.0 1.6 69.2 22.7 1.7 NA NAWestVirginia4 164 -6.8 57.4 3.0 0.0 53.0 5.2 0.6 NA NAWest 8,506 52.5 55.8 5.9 11.3 57.2 6.4 13.8 0.3 0.4as a percent of U.S. 24.8 Alaska 24 700.0 33.3 0.0 0.0 70.8 12.5 4.2 NA NAArizona 737 279.9 50.5 5.7 15.6 54.8 6.0 15.2 NA NACalifornia 3,442 58.8 52.8 9.2 17.4 55.1 9.3 21.1 0.5 0.7Colorado 381 92.4 60.1 5.7 6.2 61.4 6.0 7.7 NA NAHawaii 86 21.1 43.7 1.4 0.0 46.5 0.0 2.4 NA NAIdaho 189 31.3 50.7 0.8 6.0 52.9 1.6 4.3 NA NAMontana 133 22.0 67.0 0.0 0.0 58.6 1.5 1.5 NA NANevada 151 -12.7 58.4 6.9 14.5 59.6 7.9 13.9 NA NANewMexico 455 41.7 59.8 3.9 30.0 57.1 2.5 31.1 NA NAOregon 695 8.3 56.4 1.9 4.9 57.8 2.4 6.4 NA NAUtah 220 8.4 39.4 3.9 4.4 43.2 3.7 4.6 NA NAWashington 1,790 50.7 63.0 4.7 3.1 63.6 5.8 4.9 NA NAWyoming 203 25.3 56.2 1.3 2.7 55.7 0.5 1.5 NA NAMidwest 7,549 36.3 55.8 8.4 2.2 57.8 8.6 2.5 8.7 6.9as a percent of U.S. 22.0 Illinois 1,235 56.1 59.4 8.7 3.9 59.9 12.3 4.7 13.4 15.5Indiana 329 -29.1 49.4 7.6 2.0 59.6 10.7 1.5 NA NAIowa 591 16.6 56.6 2.4 1.2 56.3 2.2 1.2 NA NAKansas 649 43.0 57.0 4.4 1.8 59.0 2.3 2.5 NA NAMichigan 1,258 28.1 54.5 11.5 2.3 57.1 10.4 2.6 28.2 16.5Minnesota 272 30.1 54.5 1.9 0.0 57.4 6.7 2.6 NA NAMissouri 490 8.4 56.4 9.2 1.3 58.8 11.5 2.3 NA NANebraska 226 28.4 51.7 4.5 2.3 54.4 4.9 2.2 NA NANorthDakota 115 -9.4 51.2 0.8 0.8 55.7 0.9 0.9 NA NAOhio 1,251 8.6 56.8 11.4 1.7 56.0 11.0 1.6 NA NASouthDakota 81 9.5 58.1 0.0 0.0 54.3 0.0 0.0 NA NAWisconsin 1,052 592.1 58.6 21.7 8.6 58.5 7.5 2.6 NA NANortheast 4,885 0.8 58.7 11.3 5.0 58.9 14.2 6.9 19.8 2.5as a percent of U.S. 14.3 Connecticut 121 -51.0 65.6 12.1 6.3 61.2 17.6 5.0 NA NAMaine 100 6.4 48.9 0.0 0.0 55.0 1.0 0.0 NA NAMassachusetts 869 -6.6 65.3 10.9 4.6 64.1 11.8 4.3 22.2 16.8NewHampshire 30 7.1 50.0 0.0 3.7 56.7 0.0 10.0 NA NANewJersey 799 2.6 58.9 18.9 7.1 60.3 18.9 7.5 39.9 NANewYork 1,793 15.4 54.4 11.2 6.7 55.8 15.8 11.5 NA NAPennsylvania 1,034 3.6 57.7 8.9 1.9 58.2 12.5 2.1 30.7 NARhodeIsland 59 9.3 46.3 5.6 0.0 49.2 8.5 0.0 NA NAVermont 80 -50.3 67.7 0.7 1.4 73.8 0.0 0.0 NA NADistrictofColumbia NA NA NA NA NA NA NA NA NA NA
“NA” indicates not applicable. There was no institution of this type in the state during the specified years.
Notes: SREB and the National Center for Education Statistics (NCES) treat two-year colleges awarding bachelor’s degrees differently. NCES classifies two-year colleges awarding bachelor’s degrees as four-year institutions. SREB classifies them as two-year colleges until they meet other criteria. (See Appendix A for definitions.)
1 Administrators are non-instructional staff who were reported in the Management Occupations category of the IPEDS Human Resource (HR) survey beginning in fall 2012.
2 Calculated based on a total that excludes people whose race is unknown and people from foreign countries.
3 Predominantly black institutions (PBIs) are those in which black students account for more than 50 percent of total enrollment. Historically black colleges and universities (HBCUs) are those founded prior to 1964 as institutions for black students. While an institution’s PBI status may change from year to year, HBCU status will not.
Source: SREB analysis of National Center for Education Statistics fall staff surveys — www.nces.ed.gov/ipeds.
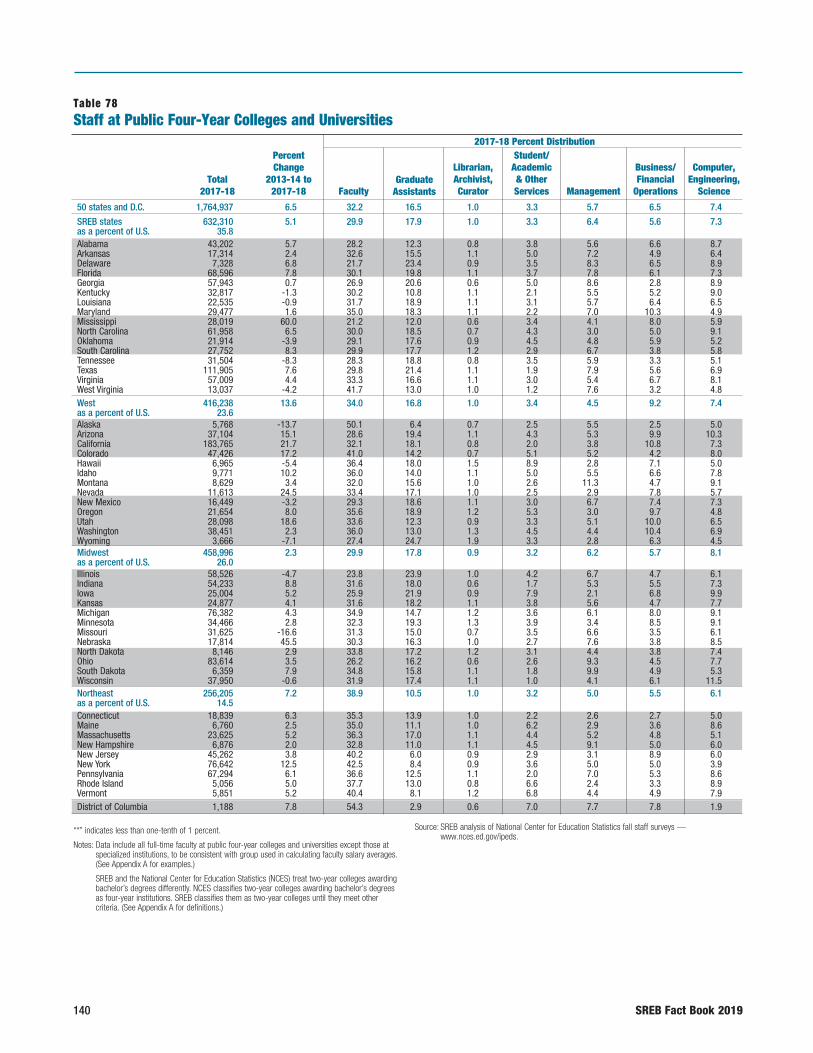
140 SREB Fact Book 2019
Table 78Staff at Public Four-Year Colleges and Universities
2017-18 Percent Distribution Percent Change Total 2013-14 to 2017-18 2017-18 50 states and D.C. 1,764,937 6.5 32.2 16.5 1.0 3.3 5.7 6.5 7.4
SREB states 632,310 5.1 29.9 17.9 1.0 3.3 6.4 5.6 7.3as a percent of U.S. 35.8 Alabama 43,202 5.7 28.2 12.3 0.8 3.8 5.6 6.6 8.7Arkansas 17,314 2.4 32.6 15.5 1.1 5.0 7.2 4.9 6.4Delaware 7,328 6.8 21.7 23.4 0.9 3.5 8.3 6.5 8.9Florida 68,596 7.8 30.1 19.8 1.1 3.7 7.8 6.1 7.3Georgia 57,943 0.7 26.9 20.6 0.6 5.0 8.6 2.8 8.9Kentucky 32,817 -1.3 30.2 10.8 1.1 2.1 5.5 5.2 9.0Louisiana 22,535 -0.9 31.7 18.9 1.1 3.1 5.7 6.4 6.5Maryland 29,477 1.6 35.0 18.3 1.1 2.2 7.0 10.3 4.9Mississippi 28,019 60.0 21.2 12.0 0.6 3.4 4.1 8.0 5.9NorthCarolina 61,958 6.5 30.0 18.5 0.7 4.3 3.0 5.0 9.1Oklahoma 21,914 -3.9 29.1 17.6 0.9 4.5 4.8 5.9 5.2SouthCarolina 27,752 8.3 29.9 17.7 1.2 2.9 6.7 3.8 5.8Tennessee 31,504 -8.3 28.3 18.8 0.8 3.5 5.9 3.3 5.1Texas 111,905 7.6 29.8 21.4 1.1 1.9 7.9 5.6 6.9Virginia 57,009 4.4 33.3 16.6 1.1 3.0 5.4 6.7 8.1WestVirginia 13,037 -4.2 41.7 13.0 1.0 1.2 7.6 3.2 4.8West 416,238 13.6 34.0 16.8 1.0 3.4 4.5 9.2 7.4as a percent of U.S. 23.6 Alaska 5,768 -13.7 50.1 6.4 0.7 2.5 5.5 2.5 5.0Arizona 37,104 15.1 28.6 19.4 1.1 4.3 5.3 9.9 10.3California 183,765 21.7 32.1 18.1 0.8 2.0 3.8 10.8 7.3Colorado 47,426 17.2 41.0 14.2 0.7 5.1 5.2 4.2 8.0Hawaii 6,965 -5.4 36.4 18.0 1.5 8.9 2.8 7.1 5.0Idaho 9,771 10.2 36.0 14.0 1.1 5.0 5.5 6.6 7.8Montana 8,629 3.4 32.0 15.6 1.0 2.6 11.3 4.7 9.1Nevada 11,613 24.5 33.4 17.1 1.0 2.5 2.9 7.8 5.7NewMexico 16,449 -3.2 29.3 18.6 1.1 3.0 6.7 7.4 7.3Oregon 21,654 8.0 35.6 18.9 1.2 5.3 3.0 9.7 4.8Utah 28,098 18.6 33.6 12.3 0.9 3.3 5.1 10.0 6.5Washington 38,451 2.3 36.0 13.0 1.3 4.5 4.4 10.4 6.9Wyoming 3,666 -7.1 27.4 24.7 1.9 3.3 2.8 6.3 4.5Midwest 458,996 2.3 29.9 17.8 0.9 3.2 6.2 5.7 8.1as a percent of U.S. 26.0 Illinois 58,526 -4.7 23.8 23.9 1.0 4.2 6.7 4.7 6.1Indiana 54,233 8.8 31.6 18.0 0.6 1.7 5.3 5.5 7.3Iowa 25,004 5.2 25.9 21.9 0.9 7.9 2.1 6.8 9.9Kansas 24,877 4.1 31.6 18.2 1.1 3.8 5.6 4.7 7.7Michigan 76,382 4.3 34.9 14.7 1.2 3.6 6.1 8.0 9.1Minnesota 34,466 2.8 32.3 19.3 1.3 3.9 3.4 8.5 9.1Missouri 31,625 -16.6 31.3 15.0 0.7 3.5 6.6 3.5 6.1Nebraska 17,814 45.5 30.3 16.3 1.0 2.7 7.6 3.8 8.5NorthDakota 8,146 2.9 33.8 17.2 1.2 3.1 4.4 3.8 7.4Ohio 83,614 3.5 26.2 16.2 0.6 2.6 9.3 4.5 7.7SouthDakota 6,359 7.9 34.8 15.8 1.1 1.8 9.9 4.9 5.3Wisconsin 37,950 -0.6 31.9 17.4 1.1 1.0 4.1 6.1 11.5Northeast 256,205 7.2 38.9 10.5 1.0 3.2 5.0 5.5 6.1as a percent of U.S. 14.5 Connecticut 18,839 6.3 35.3 13.9 1.0 2.2 2.6 2.7 5.0Maine 6,760 2.5 35.0 11.1 1.0 6.2 2.9 3.6 8.6Massachusetts 23,625 5.2 36.3 17.0 1.1 4.4 5.2 4.8 5.1NewHampshire 6,876 2.0 32.8 11.0 1.1 4.5 9.1 5.0 6.0NewJersey 45,262 3.8 40.2 6.0 0.9 2.9 3.1 8.9 6.0NewYork 76,642 12.5 42.5 8.4 0.9 3.6 5.0 5.0 3.9Pennsylvania 67,294 6.1 36.6 12.5 1.1 2.0 7.0 5.3 8.6RhodeIsland 5,056 5.0 37.7 13.0 0.8 6.6 2.4 3.3 8.9Vermont 5,851 5.2 40.4 8.1 1.2 6.8 4.4 4.9 7.9DistrictofColumbia 1,188 7.8 54.3 2.9 0.6 7.0 7.7 7.8 1.9
“*” indicates less than one-tenth of 1 percent.
Notes: Data include all full-time faculty at public four-year colleges and universities except those at specialized institutions, to be consistent with group used in calculating faculty salary averages. (See Appendix A for examples.)
SREB and the National Center for Education Statistics (NCES) treat two-year colleges awarding bachelor’s degrees differently. NCES classifies two-year colleges awarding bachelor’s degrees as four-year institutions. SREB classifies them as two-year colleges until they meet other criteria. (See Appendix A for definitions.)
Source: SREB analysis of National Center for Education Statistics fall staff surveys — www.nces.ed.gov/ipeds.
FacultyGraduate
Assistants
Librarian, Archivist, Curator
Student/ Academic& Other Services Management
Business/ Financial
Operations
Computer, Engineering,
Science

SREB Fact Book 2019 141
FACU
LTY
Table 78
continued
4.5 3.2 6.5 0.1 9.9 2.5 0.7 50 states and D.C.
4.6 2.5 6.6 0.1 11.1 3.0 0.6 SREB states 5.7 2.4 8.1 0.3 13.2 3.4 0.9 Alabama 5.3 0.6 5.7 0.2 11.5 3.5 0.6 Arkansas 6.2 1.0 6.1 0.4 9.1 2.3 1.8 Delaware 3.9 2.8 5.2 * 9.5 2.3 0.2 Florida 2.9 0.6 9.2 0.1 10.6 3.2 * Georgia 5.7 6.4 5.6 0.1 13.6 3.9 0.7 Kentucky 4.5 1.5 6.5 0.2 10.5 3.1 0.5 Louisiana 3.8 0.6 4.8 0.2 8.1 2.9 0.9 Maryland 3.5 21.5 5.5 0.2 10.9 2.6 0.7 Mississippi 3.8 2.0 6.7 0.1 12.2 4.3 0.3 North Carolina 5.5 0.8 6.8 0.1 14.2 3.7 0.9 Oklahoma 7.9 1.3 7.0 * 11.0 3.1 1.6 South Carolina 5.2 0.9 13.5 0.4 10.9 2.6 0.7 Tennessee 4.8 1.0 5.1 0.1 11.6 2.0 0.8 Texas 4.5 1.1 5.8 * 10.0 3.5 0.8 Virginia 6.5 1.0 7.2 * 8.8 3.5 0.4 West Virginia 4.7 2.5 5.4 0.2 8.2 2.1 0.7 West 3.1 0.3 1.8 1.9 16.5 3.2 0.5 Alaska 5.1 0.8 4.3 0.7 7.8 1.8 0.6 Arizona 5.1 3.4 6.0 * 7.9 1.8 0.8 California 2.8 4.2 4.9 0.1 7.0 2.2 0.5 Colorado 7.2 0.9 5.8 0.2 4.4 1.9 0.2 Hawaii 6.1 1.0 4.6 0.3 9.3 2.2 0.5 Idaho 4.9 1.8 7.6 0.2 6.3 2.2 0.6 Montana 6.0 5.6 4.3 0.2 11.1 2.2 0.2 Nevada 3.4 3.1 4.3 0.5 11.0 3.6 0.7 New Mexico 4.5 1.6 4.6 0.3 7.6 2.3 0.4 Oregon 5.4 4.3 5.0 0.2 10.5 2.4 0.4 Utah 3.6 4.4 5.1 * 7.5 2.2 0.7 Washington 6.2 3.7 6.6 0.8 7.3 2.9 1.8 Wyoming 4.6 4.6 7.0 0.1 8.8 2.2 0.7 Midwest 3.4 6.8 6.5 0.1 9.5 2.1 1.1 Illinois 4.3 2.1 9.5 0.1 11.0 2.3 0.6 Indiana 3.2 4.7 7.1 * 5.8 2.6 1.2 Iowa 4.6 3.7 5.7 0.1 9.7 3.1 0.4 Kansas 3.1 1.7 6.1 * 8.6 2.2 0.8 Michigan 4.9 1.7 5.5 0.2 7.4 2.2 0.3 Minnesota 6.7 4.0 6.5 0.2 12.2 3.0 0.7 Missouri 5.1 5.5 6.5 0.2 9.6 2.2 0.7 Nebraska 6.5 1.7 7.2 0.0 9.2 2.7 1.8 North Dakota 4.1 10.8 7.9 0.2 7.5 1.7 0.6 Ohio 6.5 0.6 6.6 0.3 9.9 1.9 0.6 South Dakota 8.2 2.1 6.5 * 7.3 2.1 0.8 Wisconsin 4.0 3.6 7.4 0.1 11.5 2.7 0.6 Northeast 3.4 9.5 6.0 0.1 14.7 3.6 0.2 Connecticut 6.9 0.5 9.4 0.1 11.8 2.5 0.5 Maine 5.0 0.9 8.4 * 8.8 2.1 1.0 Massachusetts 5.3 0.7 6.9 0.1 14.5 1.9 1.2 New Hampshire 3.8 6.8 8.4 * 9.9 2.9 0.1 New Jersey 3.7 3.0 7.5 * 12.9 2.8 0.8 New York 4.0 2.5 6.3 0.3 10.7 2.5 0.6 Pennsylvania 2.5 1.2 11.9 0.1 8.9 2.3 0.5 Rhode Island 4.1 0.8 6.5 0.2 11.8 2.6 0.3 Vermont 2.2 * 2.3 * 10.9 1.7 0.6 District of Columbia
2017-18 Percent DistributionCommunity
Service,Legal Arts,& Media
Healthcare Practitioners
and Technical Service
Sales and
Related
Office Administrative
andSupport
Natural Resources,
Constructions,Maintenance
Production Transportation,
Material Moving
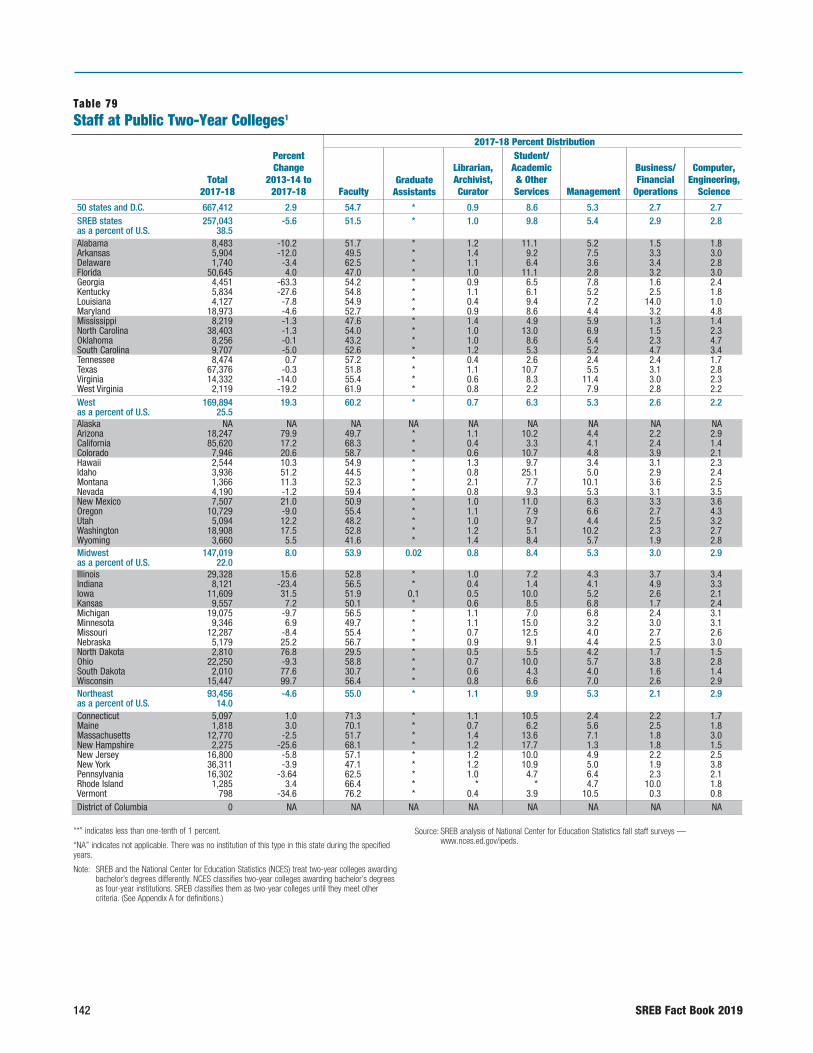
142 SREB Fact Book 2019
Table 79Staff at Public Two-Year Colleges1
2017-18 Percent Distribution Percent Change Total 2013-14 to 2017-18 2017-18 50 states and D.C. 667,412 2.9 54.7 * 0.9 8.6 5.3 2.7 2.7
SREB states 257,043 -5.6 51.5 * 1.0 9.8 5.4 2.9 2.8as a percent of U.S. 38.5 Alabama 8,483 -10.2 51.7 * 1.2 11.1 5.2 1.5 1.8Arkansas 5,904 -12.0 49.5 * 1.4 9.2 7.5 3.3 3.0Delaware 1,740 -3.4 62.5 * 1.1 6.4 3.6 3.4 2.8Florida 50,645 4.0 47.0 * 1.0 11.1 2.8 3.2 3.0Georgia 4,451 -63.3 54.2 * 0.9 6.5 7.8 1.6 2.4Kentucky 5,834 -27.6 54.8 * 1.1 6.1 5.2 2.5 1.8Louisiana 4,127 -7.8 54.9 * 0.4 9.4 7.2 14.0 1.0Maryland 18,973 -4.6 52.7 * 0.9 8.6 4.4 3.2 4.8Mississippi 8,219 -1.3 47.6 * 1.4 4.9 5.9 1.3 1.4NorthCarolina 38,403 -1.3 54.0 * 1.0 13.0 6.9 1.5 2.3Oklahoma 8,256 -0.1 43.2 * 1.0 8.6 5.4 2.3 4.7SouthCarolina 9,707 -5.0 52.6 * 1.2 5.3 5.2 4.7 3.4Tennessee 8,474 0.7 57.2 * 0.4 2.6 2.4 2.4 1.7Texas 67,376 -0.3 51.8 * 1.1 10.7 5.5 3.1 2.8Virginia 14,332 -14.0 55.4 * 0.6 8.3 11.4 3.0 2.3WestVirginia 2,119 -19.2 61.9 * 0.8 2.2 7.9 2.8 2.2West 169,894 19.3 60.2 * 0.7 6.3 5.3 2.6 2.2as a percent of U.S. 25.5 Alaska NA NA NA NA NA NA NA NA NAArizona 18,247 79.9 49.7 * 1.1 10.2 4.4 2.2 2.9California 85,620 17.2 68.3 * 0.4 3.3 4.1 2.4 1.4Colorado 7,946 20.6 58.7 * 0.6 10.7 4.8 3.9 2.1Hawaii 2,544 10.3 54.9 * 1.3 9.7 3.4 3.1 2.3Idaho 3,936 51.2 44.5 * 0.8 25.1 5.0 2.9 2.4Montana 1,366 11.3 52.3 * 2.1 7.7 10.1 3.6 2.5Nevada 4,190 -1.2 59.4 * 0.8 9.3 5.3 3.1 3.5NewMexico 7,507 21.0 50.9 * 1.0 11.0 6.3 3.3 3.6Oregon 10,729 -9.0 55.4 * 1.1 7.9 6.6 2.7 4.3Utah 5,094 12.2 48.2 * 1.0 9.7 4.4 2.5 3.2Washington 18,908 17.5 52.8 * 1.2 5.1 10.2 2.3 2.7Wyoming 3,660 5.5 41.6 * 1.4 8.4 5.7 1.9 2.8Midwest 147,019 8.0 53.9 0.02 0.8 8.4 5.3 3.0 2.9as a percent of U.S. 22.0 Illinois 29,328 15.6 52.8 * 1.0 7.2 4.3 3.7 3.4Indiana 8,121 -23.4 56.5 * 0.4 1.4 4.1 4.9 3.3Iowa 11,609 31.5 51.9 0.1 0.5 10.0 5.2 2.6 2.1Kansas 9,557 7.2 50.1 * 0.6 8.5 6.8 1.7 2.4Michigan 19,075 -9.7 56.5 * 1.1 7.0 6.8 2.4 3.1Minnesota 9,346 6.9 49.7 * 1.1 15.0 3.2 3.0 3.1Missouri 12,287 -8.4 55.4 * 0.7 12.5 4.0 2.7 2.6Nebraska 5,179 25.2 56.7 * 0.9 9.1 4.4 2.5 3.0NorthDakota 2,810 76.8 29.5 * 0.5 5.5 4.2 1.7 1.5Ohio 22,250 -9.3 58.8 * 0.7 10.0 5.7 3.8 2.8SouthDakota 2,010 77.6 30.7 * 0.6 4.3 4.0 1.6 1.4Wisconsin 15,447 99.7 56.4 * 0.8 6.6 7.0 2.6 2.9Northeast 93,456 -4.6 55.0 * 1.1 9.9 5.3 2.1 2.9as a percent of U.S. 14.0 Connecticut 5,097 1.0 71.3 * 1.1 10.5 2.4 2.2 1.7Maine 1,818 3.0 70.1 * 0.7 6.2 5.6 2.5 1.8Massachusetts 12,770 -2.5 51.7 * 1.4 13.6 7.1 1.8 3.0NewHampshire 2,275 -25.6 68.1 * 1.2 17.7 1.3 1.8 1.5NewJersey 16,800 -5.8 57.1 * 1.2 10.0 4.9 2.2 2.5NewYork 36,311 -3.9 47.1 * 1.2 10.9 5.0 1.9 3.8Pennsylvania 16,302 -3.64 62.5 * 1.0 4.7 6.4 2.3 2.1RhodeIsland 1,285 3.4 66.4 * * * 4.7 10.0 1.8Vermont 798 -34.6 76.2 * 0.4 3.9 10.5 0.3 0.8DistrictofColumbia 0 NA NA NA NA NA NA NA NA
“*” indicates less than one-tenth of 1 percent.
“NA” indicates not applicable. There was no institution of this type in this state during the specified years.
Note: SREB and the National Center for Education Statistics (NCES) treat two-year colleges awarding bachelor’s degrees differently. NCES classifies two-year colleges awarding bachelor’s degrees as four-year institutions. SREB classifies them as two-year colleges until they meet other criteria. (See Appendix A for definitions.)
Source: SREB analysis of National Center for Education Statistics fall staff surveys — www.nces.ed.gov/ipeds.
FacultyGraduate
Assistants
Librarian, Archivist, Curator
Student/ Academic& Other Services Management
Business/ Financial
Operations
Computer, Engineering,
Science

SREB Fact Book 2019 143
FACU
LTY
Table 79
continued
4.1 0.3 5.8 0.3 13.1 1.2 0.2 50 states and D.C. 4.2 0.3 5.7 0.3 14.2 1.6 0.3 SREB states 3.5 * 6.4 0.2 16.2 1.1 0.2 Alabama 4.4 * 6.5 0.3 12.8 1.9 0.2 Arkansas 3.3 * 6.4 * 8.6 2.0 * Delaware 4.7 0.2 6.9 0.3 17.6 2.0 0.3 Florida 2.8 0.6 7.7 0.1 14.1 1.3 * Georgia 5.8 0.2 7.1 * 15.4 * 0.1 Kentucky 0.9 * 4.2 * 6.4 1.5 0.1 Louisiana 4.4 0.2 5.0 0.3 12.5 2.5 0.4 Maryland 5.5 0.2 14.5 0.7 13.9 2.4 0.3 Mississippi 3.4 0.1 5.4 0.4 10.8 0.9 0.4 NorthCarolina 9.6 1.2 6.5 0.5 13.7 2.2 1.0 Oklahoma 6.5 0.6 4.5 * 14.1 1.8 0.2 SouthCarolina 6.8 2.4 4.7 * 18.1 1.2 0.1 Tennessee 3.6 0.1 4.5 0.3 15.1 1.3 0.2 Texas 2.0 0.1 3.9 * 10.5 2.2 0.2 Virginia 3.9 0.2 6.0 * 10.5 1.6 0.1 WestVirginia 3.3 0.2 5.2 0.2 12.8 0.9 0.2 West NA NA NA NA NA NA NA Alaska 5.3 0.4 4.8 * 17.9 0.9 0.25 Arizona 2.4 0.1 4.6 * 12.7 0.1 * California 4.0 * 4.9 0.3 7.8 1.3 0.7 Colorado 8.9 * 6.6 0.3 7.8 0.8 0.8 Hawaii 5.3 0.2 4.9 0.2 7.1 1.2 0.3 Idaho 3.0 0.1 7.1 0.7 9.2 1.5 0.1 Montana 3.0 0.4 4.2 * 9.4 1.5 0.1 Nevada 2.7 0.2 9.3 0.7 8.7 2.1 0.4 NewMexico 4.3 0.1 5.4 0.5 10.4 1.0 0.4 Oregon 6.1 0.2 7.0 1.4 14.3 1.7 0.3 Utah 2.7 0.2 5.4 0.4 14.2 2.7 0.2 Washington 6.4 0.2 9.6 0.2 19.6 1.5 0.7 Wyoming 5.4 0.3 6.4 0.7 11.7 0.9 0.2 Midwest 9.5 0.6 9.1 1.5 6.7 0.2 * Illinois 6.2 0.1 4.7 * 18.5 * * Indiana 4.5 * 7.1 0.7 14.0 0.9 0.5 Iowa 6.9 0.6 8.0 0.5 11.9 1.6 0.4 Kansas 3.8 * 6.3 0.1 11.7 0.9 0.2 Michigan 2.3 0.3 4.9 1.4 14.2 1.8 * Minnesota 3.5 0.2 6.4 1.0 9.8 1.0 0.2 Missouri 5.3 0.9 6.2 0.5 7.8 2.5 0.1 Nebraska 3.4 0.1 5.5 0.2 45.2 1.6 1.1 NorthDakota 4.9 0.5 4.7 0.2 6.8 0.9 0.1 Ohio 1.3 0.2 5.3 0.7 49.5 * 0.1 SouthDakota 3.7 0.2 5.0 0.4 13.1 0.9 0.2 Wisconsin 3.3 0.3 5.7 0.1 12.7 1.1 0.3 Northeast 1.5 * 3.5 * 5.0 0.6 0.1 Connecticut 2.6 * 4.8 * 4.4 1.3 * Maine 3.7 0.4 5.2 0.2 10.5 0.8 0.5 Massachusetts 0.0 * 4.3 * 3.7 0.4 * NewHampshire 3.6 0.5 5.7 0.1 11.0 1.2 0.2 NewJersey 3.9 0.4 6.6 0.1 17.4 1.4 0.5 NewYork 3.0 0.1 5.7 0.2 10.9 1.1 * Pennsylvania 0.3 * 4.0 * 11.1 1.6 * RhodeIsland 0.8 * * * 7.3 * * Vermont NA NA NA NA NA NA NA DistrictofColumbia
2017-18 Percent DistributionCommunity
Service,Legal Arts,& Media
Healthcare Practitioners
and Technical Service
Sales and
Related
Office Administrative
andSupport
Natural Resources,
Constructions,Maintenance
Production Transportation,
Material Moving
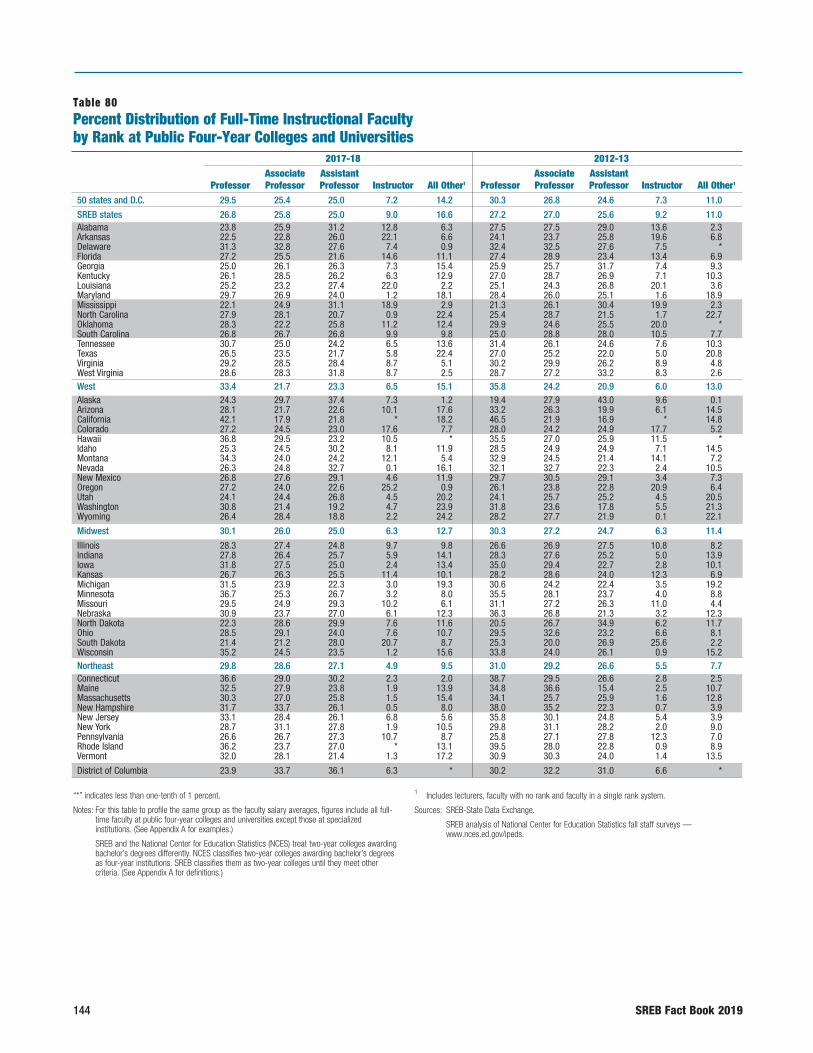
144 SREB Fact Book 2019
Table 80Percent Distribution of Full-Time Instructional Faculty by Rank at Public Four-Year Colleges and Universities
2017-18 2012-13 Associate Assistant Associate Assistant Professor Professor Professor Instructor All Other1 Professor Professor Professor Instructor All Other1
50 states and D.C. 29.5 25.4 25.0 7.2 14.2 30.3 26.8 24.6 7.3 11.0
SREB states 26.8 25.8 25.0 9.0 16.6 27.2 27.0 25.6 9.2 11.0Alabama 23.8 25.9 31.2 12.8 6.3 27.5 27.5 29.0 13.6 2.3Arkansas 22.5 22.8 26.0 22.1 6.6 24.1 23.7 25.8 19.6 6.8Delaware 31.3 32.8 27.6 7.4 0.9 32.4 32.5 27.6 7.5 *Florida 27.2 25.5 21.6 14.6 11.1 27.4 28.9 23.4 13.4 6.9Georgia 25.0 26.1 26.3 7.3 15.4 25.9 25.7 31.7 7.4 9.3Kentucky 26.1 28.5 26.2 6.3 12.9 27.0 28.7 26.9 7.1 10.3Louisiana 25.2 23.2 27.4 22.0 2.2 25.1 24.3 26.8 20.1 3.6Maryland 29.7 26.9 24.0 1.2 18.1 28.4 26.0 25.1 1.6 18.9Mississippi 22.1 24.9 31.1 18.9 2.9 21.3 26.1 30.4 19.9 2.3NorthCarolina 27.9 28.1 20.7 0.9 22.4 25.4 28.7 21.5 1.7 22.7Oklahoma 28.3 22.2 25.8 11.2 12.4 29.9 24.6 25.5 20.0 *SouthCarolina 26.8 26.7 26.8 9.9 9.8 25.0 28.8 28.0 10.5 7.7Tennessee 30.7 25.0 24.2 6.5 13.6 31.4 26.1 24.6 7.6 10.3Texas 26.5 23.5 21.7 5.8 22.4 27.0 25.2 22.0 5.0 20.8Virginia 29.2 28.5 28.4 8.7 5.1 30.2 29.9 26.2 8.9 4.8WestVirginia 28.6 28.3 31.8 8.7 2.5 28.7 27.2 33.2 8.3 2.6West 33.4 21.7 23.3 6.5 15.1 35.8 24.2 20.9 6.0 13.0Alaska 24.3 29.7 37.4 7.3 1.2 19.4 27.9 43.0 9.6 0.1Arizona 28.1 21.7 22.6 10.1 17.6 33.2 26.3 19.9 6.1 14.5California 42.1 17.9 21.8 * 18.2 46.5 21.9 16.9 * 14.8Colorado 27.2 24.5 23.0 17.6 7.7 28.0 24.2 24.9 17.7 5.2Hawaii 36.8 29.5 23.2 10.5 * 35.5 27.0 25.9 11.5 *Idaho 25.3 24.5 30.2 8.1 11.9 28.5 24.9 24.9 7.1 14.5Montana 34.3 24.0 24.2 12.1 5.4 32.9 24.5 21.4 14.1 7.2Nevada 26.3 24.8 32.7 0.1 16.1 32.1 32.7 22.3 2.4 10.5NewMexico 26.8 27.6 29.1 4.6 11.9 29.7 30.5 29.1 3.4 7.3Oregon 27.2 24.0 22.6 25.2 0.9 26.1 23.8 22.8 20.9 6.4Utah 24.1 24.4 26.8 4.5 20.2 24.1 25.7 25.2 4.5 20.5Washington 30.8 21.4 19.2 4.7 23.9 31.8 23.6 17.8 5.5 21.3Wyoming 26.4 28.4 18.8 2.2 24.2 28.2 27.7 21.9 0.1 22.1
Midwest 30.1 26.0 25.0 6.3 12.7 30.3 27.2 24.7 6.3 11.4
Illinois 28.3 27.4 24.8 9.7 9.8 26.6 26.9 27.5 10.8 8.2Indiana 27.8 26.4 25.7 5.9 14.1 28.3 27.6 25.2 5.0 13.9Iowa 31.8 27.5 25.0 2.4 13.4 35.0 29.4 22.7 2.8 10.1Kansas 26.7 26.3 25.5 11.4 10.1 28.2 28.6 24.0 12.3 6.9Michigan 31.5 23.9 22.3 3.0 19.3 30.6 24.2 22.4 3.5 19.2Minnesota 36.7 25.3 26.7 3.2 8.0 35.5 28.1 23.7 4.0 8.8Missouri 29.5 24.9 29.3 10.2 6.1 31.1 27.2 26.3 11.0 4.4Nebraska 30.9 23.7 27.0 6.1 12.3 36.3 26.8 21.3 3.2 12.3NorthDakota 22.3 28.6 29.9 7.6 11.6 20.5 26.7 34.9 6.2 11.7Ohio 28.5 29.1 24.0 7.6 10.7 29.5 32.6 23.2 6.6 8.1SouthDakota 21.4 21.2 28.0 20.7 8.7 25.3 20.0 26.9 25.6 2.2Wisconsin 35.2 24.5 23.5 1.2 15.6 33.8 24.0 26.1 0.9 15.2Northeast 29.8 28.6 27.1 4.9 9.5 31.0 29.2 26.6 5.5 7.7Connecticut 36.6 29.0 30.2 2.3 2.0 38.7 29.5 26.6 2.8 2.5Maine 32.5 27.9 23.8 1.9 13.9 34.8 36.6 15.4 2.5 10.7Massachusetts 30.3 27.0 25.8 1.5 15.4 34.1 25.7 25.9 1.6 12.8NewHampshire 31.7 33.7 26.1 0.5 8.0 38.0 35.2 22.3 0.7 3.9NewJersey 33.1 28.4 26.1 6.8 5.6 35.8 30.1 24.8 5.4 3.9NewYork 28.7 31.1 27.8 1.9 10.5 29.8 31.1 28.2 2.0 9.0Pennsylvania 26.6 26.7 27.3 10.7 8.7 25.8 27.1 27.8 12.3 7.0RhodeIsland 36.2 23.7 27.0 * 13.1 39.5 28.0 22.8 0.9 8.9Vermont 32.0 28.1 21.4 1.3 17.2 30.9 30.3 24.0 1.4 13.5
DistrictofColumbia 23.9 33.7 36.1 6.3 * 30.2 32.2 31.0 6.6 *
“*” indicates less than one-tenth of 1 percent.
Notes: For this table to profile the same group as the faculty salary averages, figures include all full-time faculty at public four-year colleges and universities except those at specialized institutions. (See Appendix A for examples.)
SREB and the National Center for Education Statistics (NCES) treat two-year colleges awarding bachelor’s degrees differently. NCES classifies two-year colleges awarding bachelor’s degrees as four-year institutions. SREB classifies them as two-year colleges until they meet other criteria. (See Appendix A for definitions.)
1 Includes lecturers, faculty with no rank and faculty in a single rank system.
Sources: SREB-State Data Exchange.
SREB analysis of National Center for Education Statistics fall staff surveys — www.nces.ed.gov/ipeds.
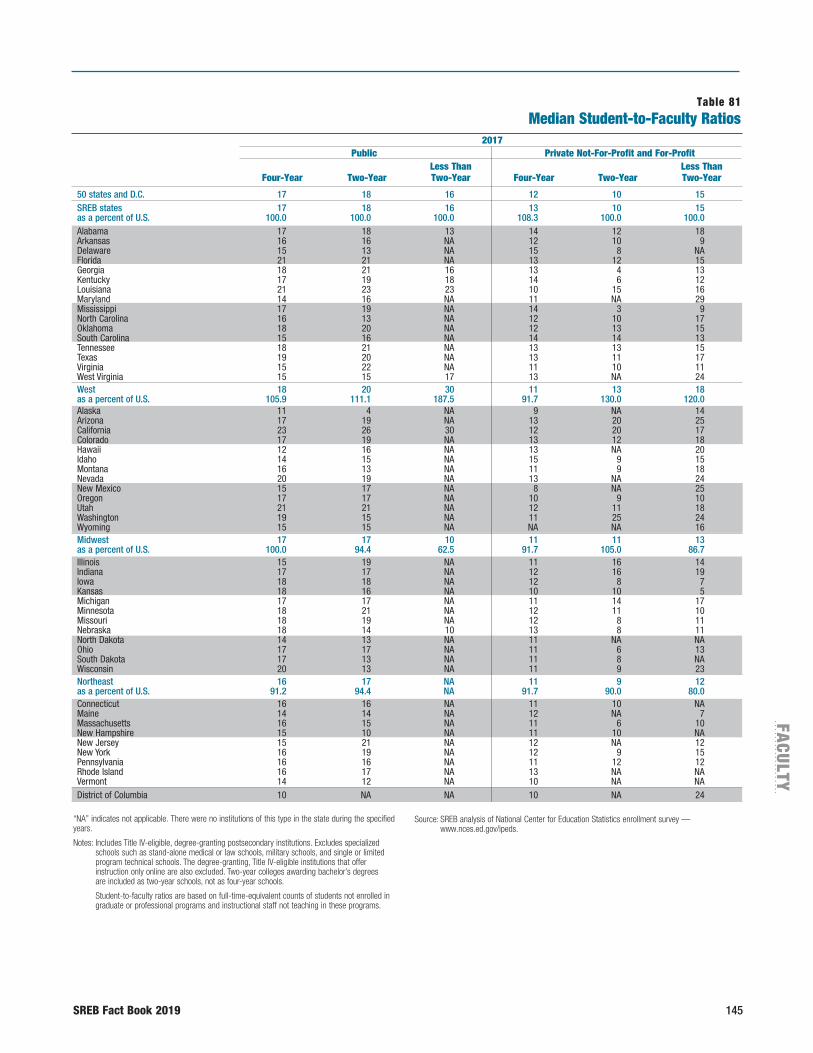
SREB Fact Book 2019 145
FACU
LTY
“NA” indicates not applicable. There were no institutions of this type in the state during the specified years.
Notes: Includes Title IV-eligible, degree-granting postsecondary institutions. Excludes specialized schools such as stand-alone medical or law schools, military schools, and single or limited program technical schools. The degree-granting, Title IV-eligible institutions that offer instruction only online are also excluded. Two-year colleges awarding bachelor’s degrees are included as two-year schools, not as four-year schools.
Student-to-faculty ratios are based on full-time-equivalent counts of students not enrolled in graduate or professional programs and instructional staff not teaching in these programs.
Source: SREB analysis of National Center for Education Statistics enrollment survey — www.nces.ed.gov/ipeds.
Table 81Median Student-to-Faculty Ratios
50 states and D.C. 17 18 16 12 10 15 SREB states 17 18 16 13 10 15 as a percent of U.S. 100.0 100.0 100.0 108.3 100.0 100.0 Alabama 17 18 13 14 12 18Arkansas 16 16 NA 12 10 9Delaware 15 13 NA 15 8 NAFlorida 21 21 NA 13 12 15Georgia 18 21 16 13 4 13Kentucky 17 19 18 14 6 12Louisiana 21 23 23 10 15 16Maryland 14 16 NA 11 NA 29Mississippi 17 19 NA 14 3 9NorthCarolina 16 13 NA 12 10 17Oklahoma 18 20 NA 12 13 15SouthCarolina 15 16 NA 14 14 13Tennessee 18 21 NA 13 13 15Texas 19 20 NA 13 11 17Virginia 15 22 NA 11 10 11WestVirginia 15 15 17 13 NA 24West 18 20 30 11 13 18 as a percent of U.S. 105.9 111.1 187.5 91.7 130.0 120.0 Alaska 11 4 NA 9 NA 14Arizona 17 19 NA 13 20 25California 23 26 30 12 20 17Colorado 17 19 NA 13 12 18Hawaii 12 16 NA 13 NA 20Idaho 14 15 NA 15 9 15Montana 16 13 NA 11 9 18Nevada 20 19 NA 13 NA 24NewMexico 15 17 NA 8 NA 25Oregon 17 17 NA 10 9 10Utah 21 21 NA 12 11 18Washington 19 15 NA 11 25 24Wyoming 15 15 NA NA NA 16Midwest 17 17 10 11 11 13 as a percent of U.S. 100.0 94.4 62.5 91.7 105.0 86.7 Illinois 15 19 NA 11 16 14Indiana 17 17 NA 12 16 19Iowa 18 18 NA 12 8 7Kansas 18 16 NA 10 10 5Michigan 17 17 NA 11 14 17Minnesota 18 21 NA 12 11 10Missouri 18 19 NA 12 8 11Nebraska 18 14 10 13 8 11NorthDakota 14 13 NA 11 NA NAOhio 17 17 NA 11 6 13SouthDakota 17 13 NA 11 8 NAWisconsin 20 13 NA 11 9 23Northeast 16 17 NA 11 9 12 as a percent of U.S. 91.2 94.4 NA 91.7 90.0 80.0 Connecticut 16 16 NA 11 10 NAMaine 14 14 NA 12 NA 7Massachusetts 16 15 NA 11 6 10NewHampshire 15 10 NA 11 10 NANewJersey 15 21 NA 12 NA 12NewYork 16 19 NA 12 9 15Pennsylvania 16 16 NA 11 12 12RhodeIsland 16 17 NA 13 NA NAVermont 14 12 NA 10 NA NADistrictofColumbia 10 NA NA 10 NA 24
2017 Public Private Not-For-Profit and For-Profit Less Than Less Than Four-Year Two-Year Two-Year Four-Year Two-Year Two-Year
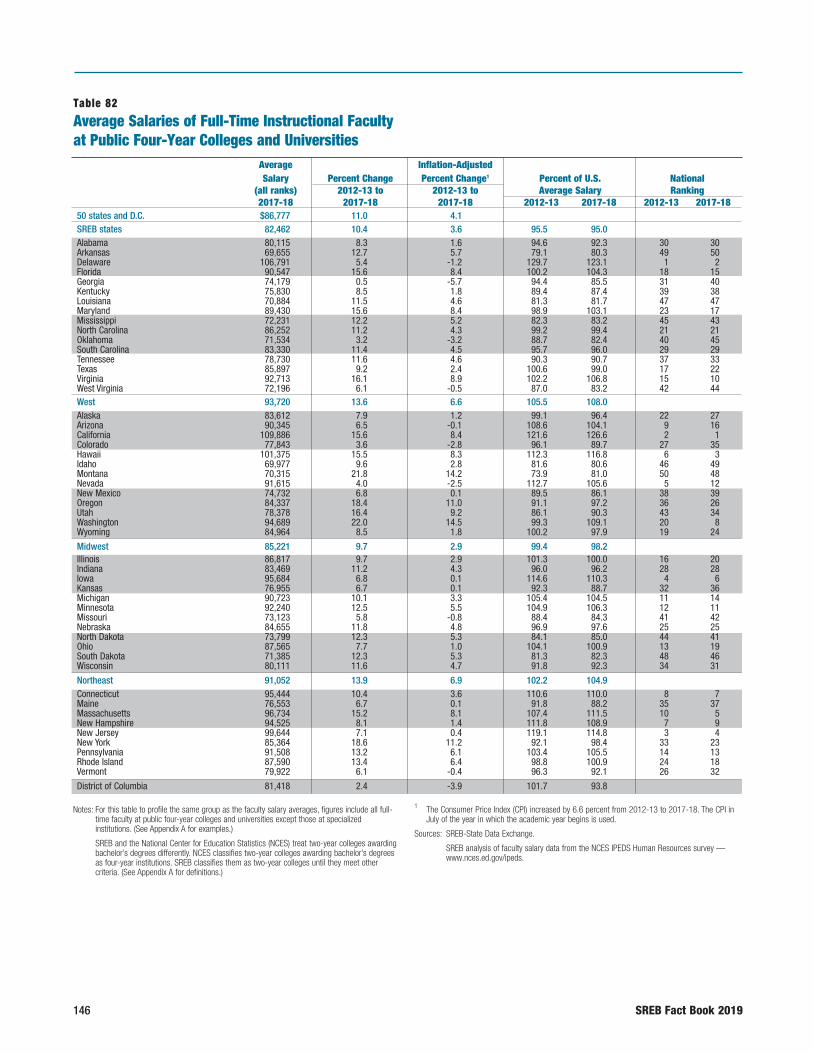
146 SREB Fact Book 2019
Table 82
Average Salaries of Full-Time Instructional Faculty at Public Four-Year Colleges and Universities
Average Inflation-Adjusted Salary Percent Change Percent Change1 Percent of U.S. National (all ranks) 2012-13 to 2012-13 to Average Salary Ranking 2017-18 2017-18 2017-18 2012-13 2017-18 2012-13 2017-18
50 states and D.C. $86,777 11.0 4.1 SREB states 82,462 10.4 3.6 95.5 95.0 Alabama 80,115 8.3 1.6 94.6 92.3 30 30Arkansas 69,655 12.7 5.7 79.1 80.3 49 50Delaware 106,791 5.4 -1.2 129.7 123.1 1 2Florida 90,547 15.6 8.4 100.2 104.3 18 15Georgia 74,179 0.5 -5.7 94.4 85.5 31 40Kentucky 75,830 8.5 1.8 89.4 87.4 39 38Louisiana 70,884 11.5 4.6 81.3 81.7 47 47Maryland 89,430 15.6 8.4 98.9 103.1 23 17Mississippi 72,231 12.2 5.2 82.3 83.2 45 43NorthCarolina 86,252 11.2 4.3 99.2 99.4 21 21Oklahoma 71,534 3.2 -3.2 88.7 82.4 40 45SouthCarolina 83,330 11.4 4.5 95.7 96.0 29 29Tennessee 78,730 11.6 4.6 90.3 90.7 37 33Texas 85,897 9.2 2.4 100.6 99.0 17 22Virginia 92,713 16.1 8.9 102.2 106.8 15 10WestVirginia 72,196 6.1 -0.5 87.0 83.2 42 44West 93,720 13.6 6.6 105.5 108.0 Alaska 83,612 7.9 1.2 99.1 96.4 22 27Arizona 90,345 6.5 -0.1 108.6 104.1 9 16California 109,886 15.6 8.4 121.6 126.6 2 1Colorado 77,843 3.6 -2.8 96.1 89.7 27 35Hawaii 101,375 15.5 8.3 112.3 116.8 6 3Idaho 69,977 9.6 2.8 81.6 80.6 46 49Montana 70,315 21.8 14.2 73.9 81.0 50 48Nevada 91,615 4.0 -2.5 112.7 105.6 5 12NewMexico 74,732 6.8 0.1 89.5 86.1 38 39Oregon 84,337 18.4 11.0 91.1 97.2 36 26Utah 78,378 16.4 9.2 86.1 90.3 43 34Washington 94,689 22.0 14.5 99.3 109.1 20 8Wyoming 84,964 8.5 1.8 100.2 97.9 19 24
Midwest 85,221 9.7 2.9 99.4 98.2 Illinois 86,817 9.7 2.9 101.3 100.0 16 20Indiana 83,469 11.2 4.3 96.0 96.2 28 28Iowa 95,684 6.8 0.1 114.6 110.3 4 6Kansas 76,955 6.7 0.1 92.3 88.7 32 36Michigan 90,723 10.1 3.3 105.4 104.5 11 14Minnesota 92,240 12.5 5.5 104.9 106.3 12 11Missouri 73,123 5.8 -0.8 88.4 84.3 41 42Nebraska 84,655 11.8 4.8 96.9 97.6 25 25NorthDakota 73,799 12.3 5.3 84.1 85.0 44 41Ohio 87,565 7.7 1.0 104.1 100.9 13 19SouthDakota 71,385 12.3 5.3 81.3 82.3 48 46Wisconsin 80,111 11.6 4.7 91.8 92.3 34 31
Northeast 91,052 13.9 6.9 102.2 104.9 Connecticut 95,444 10.4 3.6 110.6 110.0 8 7Maine 76,553 6.7 0.1 91.8 88.2 35 37Massachusetts 96,734 15.2 8.1 107.4 111.5 10 5NewHampshire 94,525 8.1 1.4 111.8 108.9 7 9NewJersey 99,644 7.1 0.4 119.1 114.8 3 4NewYork 85,364 18.6 11.2 92.1 98.4 33 23Pennsylvania 91,508 13.2 6.1 103.4 105.5 14 13RhodeIsland 87,590 13.4 6.4 98.8 100.9 24 18Vermont 79,922 6.1 -0.4 96.3 92.1 26 32
DistrictofColumbia 81,418 2.4 -3.9 101.7 93.8
Notes: For this table to profile the same group as the faculty salary averages, figures include all full-time faculty at public four-year colleges and universities except those at specialized institutions. (See Appendix A for examples.)
SREB and the National Center for Education Statistics (NCES) treat two-year colleges awarding bachelor’s degrees differently. NCES classifies two-year colleges awarding bachelor’s degrees as four-year institutions. SREB classifies them as two-year colleges until they meet other criteria. (See Appendix A for definitions.)
1 The Consumer Price Index (CPI) increased by 6.6 percent from 2012-13 to 2017-18. The CPI in July of the year in which the academic year begins is used.
Sources: SREB-State Data Exchange.
SREB analysis of faculty salary data from the NCES IPEDS Human Resources survey — www.nces.ed.gov/ipeds.

SREB Fact Book 2019 147
FACU
LTY
Table 83
Average Salaries of Full-Time Instructional Faculty at Public Two-Year Colleges and Technical Institutes or Colleges
50 states and D.C. $64,200 9.6 2.8 $46,405 NA NA
SREB states 54,681 6.6 0.0 87.6 85.2 $41,490 -1.7 -7.8Alabama 53,387 -0.9 -7.1 92.0 83.2 52,519 3.3 -3.2Arkansas 45,328 4.1 -2.4 74.3 70.6 NA NA NADelaware 63,506 -7.9 -13.6 117.7 98.9 NA NA NAFlorida 57,859 4.7 -1.8 94.4 90.1 NA NA NAGeorgia 44,345 -6.8 -12.6 81.2 69.1 40,693 -2.1 -8.2Kentucky 53,290 21.1 13.6 75.1 83.0 47,601 16.8 9.5Louisiana 45,120 6.1 -0.5 72.6 70.3 40,800 5.5 -1.1Maryland 66,377 10.4 3.5 102.6 103.4 NA NA NAMississippi 49,527 1.8 -4.5 83.1 77.1 NA NA NANorthCarolina 49,549 4.6 -1.9 80.9 77.2 NA NA NAOklahoma 46,777 -5.7 -11.6 84.7 72.9 NA NA NASouthCarolina 49,720 3.4 -3.0 82.1 77.4 NA NA NATennessee 52,369 13.7 6.7 78.6 81.6 NA NA NATexas 58,069 9.2 2.4 90.8 90.5 NA NA NAVirginia 63,288 8.3 1.6 99.7 98.6 NA NA NAWestVirginia 46,120 -2.3 -8.4 80.6 71.8 48,933 NA NAWest 73,087 8.9 2.1 114.6 113.8 97,596 NA NAAlaska 67,459 5.5 -1.0 109.1 105.1 NA NA NAArizona 62,594 -6.5 -12.3 114.2 97.5 NA NA NACalifornia 81,682 10.1 3.2 126.7 127.2 97,596 NA NAColorado 57,746 17.5 10.2 83.9 89.9 NA NA NAHawaii 74,475 12.9 5.9 112.6 116.0 NA NA NAIdaho 53,443 9.8 3.0 83.1 83.2 NA NA NAMontana 47,045 12.7 5.7 71.3 73.3 NA NA NANevada 63,673 4.0 -2.4 104.5 99.2 NA NA NANewMexico 51,513 8.5 1.8 81.0 80.2 NA NA NAOregon 65,394 9.4 2.6 102.1 101.9 NA NA NAUtah 55,537 14.5 7.4 82.8 86.5 NA NA NAWashington 61,016 10.2 3.3 94.5 95.0 NA NA NAWyoming 57,520 -0.9 -7.1 99.1 89.6 NA NA NA
Midwest 66,708 9.6 2.8 103.9 103.9 43,694 NA NAIllinois 76,605 11.2 4.3 117.6 119.3 NA NA NAIndiana 51,564 19.7 12.2 73.6 80.3 NA NA NAIowa 58,292 12.6 5.6 88.4 90.8 NA NA NAKansas 51,405 10.3 3.5 79.5 80.1 NA NA NAMichigan 76,018 7.3 0.6 120.9 118.4 NA NA NAMinnesota 69,919 17.4 10.1 101.7 108.9 NA NA NAMissouri 55,398 11.1 4.2 85.2 86.3 NA NA NANebraska 53,393 5.0 -1.5 86.8 83.2 43,694 NA NANorthDakota 53,046 10.4 3.5 82.0 82.6 NA NA NAOhio 65,762 11.7 4.8 100.5 102.4 NA NA NASouthDakota 52,910 21.8 14.2 74.2 82.4 NA NA NAWisconsin 77,166 8.6 1.9 121.3 120.2 NA NA NANortheast 69,299 14.3 7.2 103.5 107.9 NA NA NAConnecticut 70,816 12.0 5.0 107.9 110.3 NA NA NAMaine 56,828 8.7 1.9 89.3 88.5 NA NA NAMassachusetts 64,864 17.9 10.5 93.9 101.0 NA NA NANewHampshire 56,586 21.1 13.6 79.8 88.1 NA NA NANewJersey 67,178 1.1 -5.2 113.5 104.6 NA NA NANewYork 75,725 23.7 16.0 104.5 118.0 NA NA NAPennsylvania 62,322 5.7 -0.9 100.7 97.1 NA NA NARhodeIsland 62,278 1.6 -4.7 104.6 97.0 NA NA NAVermont NA NA NA NA NA NA NA NA
DistrictofColumbia NA NA NA NA NA NA NA NA
“NA” indicates not applicable. There was no institution of this type in the state during the specified years.
“—” indicates not available.
Notes: For this table to profile the same group as the faculty salary averages, figures include all full-time faculty at public two-year colleges and technical institutes except those at specialized institutions. (See Appendix A for examples.)
SREB and the National Center for Education Statistics (NCES) treat two-year colleges awarding bachelor’s degrees differently. NCES classifies two-year colleges awarding bachelor’s degrees as four-year institutions. SREB classifies them as two-year colleges until they meet other criteria. (See Appendix A for definitions.)
1 The Consumer Price Index (CPI) increased by 6.6 percent from 2012-13 to 2017-18. The CPI in July of the year in which the academic year begins is used.
Source: SREB analysis of National Center for Education Statistics Human Resources survey — www.nces.ed.gov/ipeds.
Two-Year Colleges Technical Institutes or Colleges
Average Salary (all ranks)
Percent Change 2012-13 to 2017-18
Percent Change 2012-13 to 2017-18
Percent of U.S. Average
2017-18 2012-13Current Dollars
Inflation Adjusted1 2017-18
Current Dollars
Inflation Adjusted1
Average Salary (all ranks)
2017-18
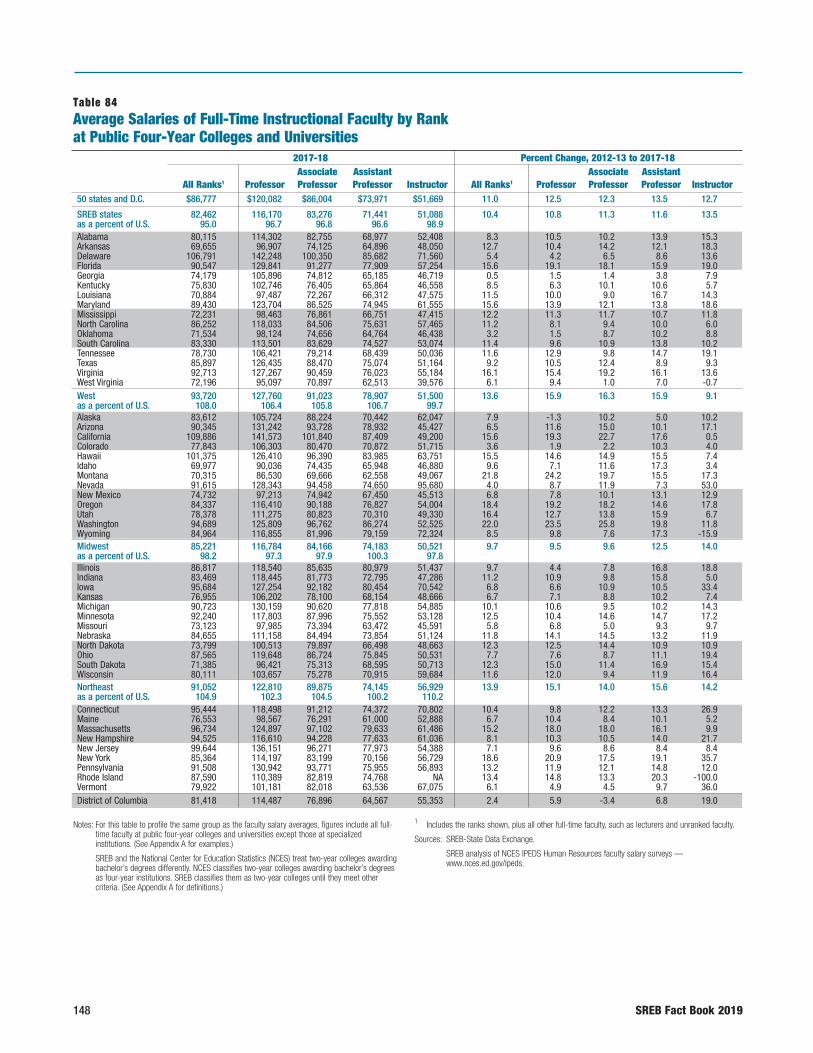
148 SREB Fact Book 2019
Table 84Average Salaries of Full-Time Instructional Faculty by Rank at Public Four-Year Colleges and Universities
50 states and D.C. $86,777 $120,082 $86,004 $73,971 $51,669 11.0 12.5 12.3 13.5 12.7
SREB states 82,462 116,170 83,276 71,441 51,088 10.4 10.8 11.3 11.6 13.5as a percent of U.S. 95.0 96.7 96.8 96.6 98.9 Alabama 80,115 114,302 82,755 68,977 52,408 8.3 10.5 10.2 13.9 15.3Arkansas 69,655 96,907 74,125 64,896 48,050 12.7 10.4 14.2 12.1 18.3Delaware 106,791 142,248 100,350 85,682 71,560 5.4 4.2 6.5 8.6 13.6Florida 90,547 129,841 91,277 77,909 57,254 15.6 19.1 18.1 15.9 19.0Georgia 74,179 105,896 74,812 65,185 46,719 0.5 1.5 1.4 3.8 7.9Kentucky 75,830 102,746 76,405 65,864 46,558 8.5 6.3 10.1 10.6 5.7Louisiana 70,884 97,487 72,267 66,312 47,575 11.5 10.0 9.0 16.7 14.3Maryland 89,430 123,704 86,525 74,945 61,555 15.6 13.9 12.1 13.8 18.6Mississippi 72,231 98,463 76,861 66,751 47,415 12.2 11.3 11.7 10.7 11.8NorthCarolina 86,252 118,033 84,506 75,631 57,465 11.2 8.1 9.4 10.0 6.0Oklahoma 71,534 98,124 74,656 64,764 46,438 3.2 1.5 8.7 10.2 8.8SouthCarolina 83,330 113,501 83,629 74,527 53,074 11.4 9.6 10.9 13.8 10.2Tennessee 78,730 106,421 79,214 68,439 50,036 11.6 12.9 9.8 14.7 19.1Texas 85,897 126,435 88,470 75,074 51,164 9.2 10.5 12.4 8.9 9.3Virginia 92,713 127,267 90,459 76,023 55,184 16.1 15.4 19.2 16.1 13.6WestVirginia 72,196 95,097 70,897 62,513 39,576 6.1 9.4 1.0 7.0 -0.7West 93,720 127,760 91,023 78,907 51,500 13.6 15.9 16.3 15.9 9.1as a percent of U.S. 108.0 106.4 105.8 106.7 99.7 Alaska 83,612 105,724 88,224 70,442 62,047 7.9 -1.3 10.2 5.0 10.2Arizona 90,345 131,242 93,728 78,932 45,427 6.5 11.6 15.0 10.1 17.1California 109,886 141,573 101,840 87,409 49,200 15.6 19.3 22.7 17.6 0.5Colorado 77,843 106,303 80,470 70,872 51,715 3.6 1.9 2.2 10.3 4.0Hawaii 101,375 126,410 96,390 83,985 63,751 15.5 14.6 14.9 15.5 7.4Idaho 69,977 90,036 74,435 65,948 46,880 9.6 7.1 11.6 17.3 3.4Montana 70,315 86,530 69,666 62,558 49,067 21.8 24.2 19.7 15.5 17.3Nevada 91,615 128,343 94,458 74,650 95,680 4.0 8.7 11.9 7.3 53.0NewMexico 74,732 97,213 74,942 67,450 45,513 6.8 7.8 10.1 13.1 12.9Oregon 84,337 116,410 90,188 76,827 54,004 18.4 19.2 18.2 14.6 17.8Utah 78,378 111,275 80,823 70,310 49,330 16.4 12.7 13.8 15.9 6.7Washington 94,689 125,809 96,762 86,274 52,525 22.0 23.5 25.8 19.8 11.8Wyoming 84,964 116,855 81,996 79,159 72,324 8.5 9.8 7.6 17.3 -15.9Midwest 85,221 116,784 84,166 74,183 50,521 9.7 9.5 9.6 12.5 14.0as a percent of U.S. 98.2 97.3 97.9 100.3 97.8 Illinois 86,817 118,540 85,635 80,979 51,437 9.7 4.4 7.8 16.8 18.8Indiana 83,469 118,445 81,773 72,795 47,286 11.2 10.9 9.8 15.8 5.0Iowa 95,684 127,254 92,182 80,454 70,542 6.8 6.6 10.9 10.5 33.4Kansas 76,955 106,202 78,100 68,154 48,666 6.7 7.1 8.8 10.2 7.4Michigan 90,723 130,159 90,620 77,818 54,885 10.1 10.6 9.5 10.2 14.3Minnesota 92,240 117,803 87,996 75,552 53,128 12.5 10.4 14.6 14.7 17.2Missouri 73,123 97,985 73,394 63,472 45,591 5.8 6.8 5.0 9.3 9.7Nebraska 84,655 111,158 84,494 73,854 51,124 11.8 14.1 14.5 13.2 11.9NorthDakota 73,799 100,513 79,897 66,498 48,663 12.3 12.5 14.4 10.9 10.9Ohio 87,565 119,648 86,724 75,845 50,531 7.7 7.6 8.7 11.1 19.4SouthDakota 71,385 96,421 75,313 68,595 50,713 12.3 15.0 11.4 16.9 15.4Wisconsin 80,111 103,657 75,278 70,915 59,684 11.6 12.0 9.4 11.9 16.4Northeast 91,052 122,810 89,875 74,145 56,929 13.9 15.1 14.0 15.6 14.2as a percent of U.S. 104.9 102.3 104.5 100.2 110.2 Connecticut 95,444 118,498 91,212 74,372 70,802 10.4 9.8 12.2 13.3 26.9Maine 76,553 98,567 76,291 61,000 52,888 6.7 10.4 8.4 10.1 5.2Massachusetts 96,734 124,897 97,102 79,633 61,486 15.2 18.0 18.0 16.1 9.9NewHampshire 94,525 116,610 94,228 77,633 61,036 8.1 10.3 10.5 14.0 21.7NewJersey 99,644 136,151 96,271 77,973 54,388 7.1 9.6 8.6 8.4 8.4NewYork 85,364 114,197 83,199 70,156 56,729 18.6 20.9 17.5 19.1 35.7Pennsylvania 91,508 130,942 93,771 75,955 56,893 13.2 11.9 12.1 14.8 12.0RhodeIsland 87,590 110,389 82,819 74,768 NA 13.4 14.8 13.3 20.3 -100.0Vermont 79,922 101,181 82,018 63,536 67,075 6.1 4.9 4.5 9.7 36.0DistrictofColumbia 81,418 114,487 76,896 64,567 55,353 2.4 5.9 -3.4 6.8 19.0
2017-18 Percent Change, 2012-13 to 2017-18 Associate Assistant Associate Assistant All Ranks1 Professor Professor Professor Instructor All Ranks1 Professor Professor Professor Instructor
Notes: For this table to profile the same group as the faculty salary averages, figures include all full-time faculty at public four-year colleges and universities except those at specialized institutions. (See Appendix A for examples.)
SREB and the National Center for Education Statistics (NCES) treat two-year colleges awarding bachelor’s degrees differently. NCES classifies two-year colleges awarding bachelor’s degrees as four-year institutions. SREB classifies them as two-year colleges until they meet other criteria. (See Appendix A for definitions.)
1 Includes the ranks shown, plus all other full-time faculty, such as lecturers and unranked faculty.
Sources: SREB-State Data Exchange.
SREB analysis of NCES IPEDS Human Resources faculty salary surveys — www.nces.ed.gov/ipeds.
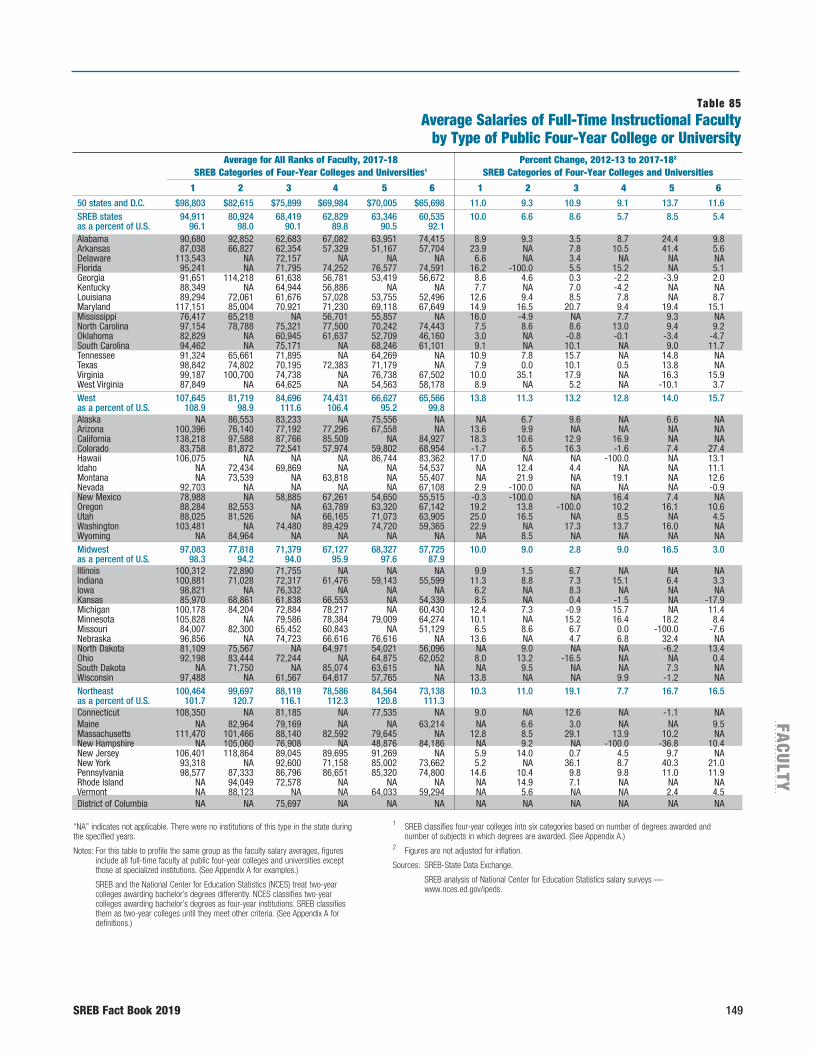
SREB Fact Book 2019 149
FACU
LTY
50 states and D.C. $98,803 $82,615 $75,899 $69,984 $70,005 $65,698 11.0 9.3 10.9 9.1 13.7 11.6SREB states 94,911 80,924 68,419 62,829 63,346 60,535 10.0 6.6 8.6 5.7 8.5 5.4as a percent of U.S. 96.1 98.0 90.1 89.8 90.5 92.1 Alabama 90,680 92,852 62,683 67,082 63,951 74,415 8.9 9.3 3.5 8.7 24.4 9.8Arkansas 87,038 66,827 62,354 57,329 51,167 57,704 23.9 NA 7.8 10.5 41.4 5.6Delaware 113,543 NA 72,157 NA NA NA 6.6 NA 3.4 NA NA NAFlorida 95,241 NA 71,795 74,252 76,577 74,591 16.2 -100.0 5.5 15.2 NA 5.1Georgia 91,651 114,218 61,638 56,781 53,419 56,672 8.6 4.6 0.3 -2.2 -3.9 2.0Kentucky 88,349 NA 64,944 56,886 NA NA 7.7 NA 7.0 -4.2 NA NALouisiana 89,294 72,061 61,676 57,028 53,755 52,496 12.6 9.4 8.5 7.8 NA 8.7Maryland 117,151 85,004 70,921 71,230 69,118 67,649 14.9 16.5 20.7 9.4 19.4 15.1Mississippi 76,417 65,218 NA 56,701 55,857 NA 16.0 -4.9 NA 7.7 9.3 NANorthCarolina 97,154 78,788 75,321 77,500 70,242 74,443 7.5 8.6 8.6 13.0 9.4 9.2Oklahoma 82,829 NA 60,945 61,637 52,709 46,160 3.0 NA -0.8 -0.1 -3.4 -4.7SouthCarolina 94,462 NA 75,171 NA 68,246 61,101 9.1 NA 10.1 NA 9.0 11.7Tennessee 91,324 65,661 71,895 NA 64,269 NA 10.9 7.8 15.7 NA 14.8 NATexas 98,842 74,802 70,195 72,383 71,179 NA 7.9 0.0 10.1 0.5 13.8 NAVirginia 99,187 100,700 74,738 NA 76,738 67,502 10.0 35.1 17.9 NA 16.3 15.9WestVirginia 87,849 NA 64,625 NA 54,563 58,178 8.9 NA 5.2 NA -10.1 3.7West 107,645 81,719 84,696 74,431 66,627 65,566 13.8 11.3 13.2 12.8 14.0 15.7as a percent of U.S. 108.9 98.9 111.6 106.4 95.2 99.8 Alaska NA 86,553 83,233 NA 75,556 NA NA 6.7 9.6 NA 6.6 NAArizona 100,396 76,140 77,192 77,296 67,558 NA 13.6 9.9 NA NA NA NACalifornia 138,218 97,588 87,766 85,509 NA 84,927 18.3 10.6 12.9 16.9 NA NAColorado 83,758 81,872 72,541 57,974 59,802 68,954 -1.7 6.5 16.3 -1.6 7.4 27.4Hawaii 106,075 NA NA NA 86,744 83,362 17.0 NA NA -100.0 NA 13.1Idaho NA 72,434 69,869 NA NA 54,537 NA 12.4 4.4 NA NA 11.1Montana NA 73,539 NA 63,818 NA 55,407 NA 21.9 NA 19.1 NA 12.6Nevada 92,703 NA NA NA NA 67,108 2.9 -100.0 NA NA NA -0.9NewMexico 78,988 NA 58,885 67,261 54,650 55,515 -0.3 -100.0 NA 16.4 7.4 NAOregon 88,284 82,553 NA 63,789 63,320 67,142 19.2 13.8 -100.0 10.2 16.1 10.6Utah 88,025 81,526 NA 66,165 71,073 63,905 25.0 16.5 NA 8.5 NA 4.5Washington 103,481 NA 74,480 89,429 74,720 59,365 22.9 NA 17.3 13.7 16.0 NAWyoming NA 84,964 NA NA NA NA NA 8.5 NA NA NA NAMidwest 97,083 77,818 71,379 67,127 68,327 57,725 10.0 9.0 2.8 9.0 16.5 3.0as a percent of U.S. 98.3 94.2 94.0 95.9 97.6 87.9 Illinois 100,312 72,890 71,755 NA NA NA 9.9 1.5 6.7 NA NA NAIndiana 100,881 71,028 72,317 61,476 59,143 55,599 11.3 8.8 7.3 15.1 6.4 3.3Iowa 98,821 NA 76,332 NA NA NA 6.2 NA 8.3 NA NA NAKansas 85,970 68,861 61,838 66,553 NA 54,339 8.5 NA 0.4 -1.5 NA -17.9Michigan 100,178 84,204 72,884 78,217 NA 60,430 12.4 7.3 -0.9 15.7 NA 11.4Minnesota 105,828 NA 79,586 78,384 79,009 64,274 10.1 NA 15.2 16.4 18.2 8.4Missouri 84,007 82,300 65,452 60,843 NA 51,129 6.5 8.6 6.7 0.0 -100.0 -7.6Nebraska 96,856 NA 74,723 66,616 76,616 NA 13.6 NA 4.7 6.8 32.4 NANorthDakota 81,109 75,567 NA 64,971 54,021 56,096 NA 9.0 NA NA -6.2 13.4Ohio 92,198 83,444 72,244 NA 64,875 62,052 8.0 13.2 -16.5 NA NA 0.4SouthDakota NA 71,750 NA 85,074 63,615 NA NA 9.5 NA NA 7.3 NAWisconsin 97,488 NA 61,567 64,617 57,765 NA 13.8 NA NA 9.9 -1.2 NANortheast 100,464 99,697 88,119 78,586 84,564 73,138 10.3 11.0 19.1 7.7 16.7 16.5as a percent of U.S. 101.7 120.7 116.1 112.3 120.8 111.3 Connecticut 108,350 NA 81,185 NA 77,535 NA 9.0 NA 12.6 NA -1.1 NAMaine NA 82,964 79,169 NA NA 63,214 NA 6.6 3.0 NA NA 9.5Massachusetts 111,470 101,466 88,140 82,592 79,645 NA 12.8 8.5 29.1 13.9 10.2 NANewHampshire NA 105,060 76,908 NA 48,876 84,186 NA 9.2 NA -100.0 -36.8 10.4NewJersey 106,401 118,864 89,045 89,695 91,269 NA 5.9 14.0 0.7 4.5 9.7 NANewYork 93,318 NA 92,600 71,158 85,002 73,662 5.2 NA 36.1 8.7 40.3 21.0Pennsylvania 98,577 87,333 86,796 86,651 85,320 74,800 14.6 10.4 9.8 9.8 11.0 11.9RhodeIsland NA 94,049 72,578 NA NA NA NA 14.9 7.1 NA NA NAVermont NA 88,123 NA NA 64,033 59,294 NA 5.6 NA NA 2.4 4.5DistrictofColumbia NA NA 75,697 NA NA NA NA NA NA NA NA NA
Table 85Average Salaries of Full-Time Instructional Faculty
by Type of Public Four-Year College or University Average for All Ranks of Faculty, 2017-18 Percent Change, 2012-13 to 2017-182 SREB Categories of Four-Year Colleges and Universities1 SREB Categories of Four-Year Colleges and Universities
1 2 3 4 5 6 1 2 3 4 5 6
“NA” indicates not applicable. There were no institutions of this type in the state during the specified years.
Notes: For this table to profile the same group as the faculty salary averages, figures include all full-time faculty at public four-year colleges and universities except those at specialized institutions. (See Appendix A for examples.)
SREB and the National Center for Education Statistics (NCES) treat two-year colleges awarding bachelor’s degrees differently. NCES classifies two-year colleges awarding bachelor’s degrees as four-year institutions. SREB classifies them as two-year colleges until they meet other criteria. (See Appendix A for definitions.)
1 SREB classifies four-year colleges into six categories based on number of degrees awarded and number of subjects in which degrees are awarded. (See Appendix A.)
2 Figures are not adjusted for inflation.
Sources: SREB-State Data Exchange.
SREB analysis of National Center for Education Statistics salary surveys — www.nces.ed.gov/ipeds.
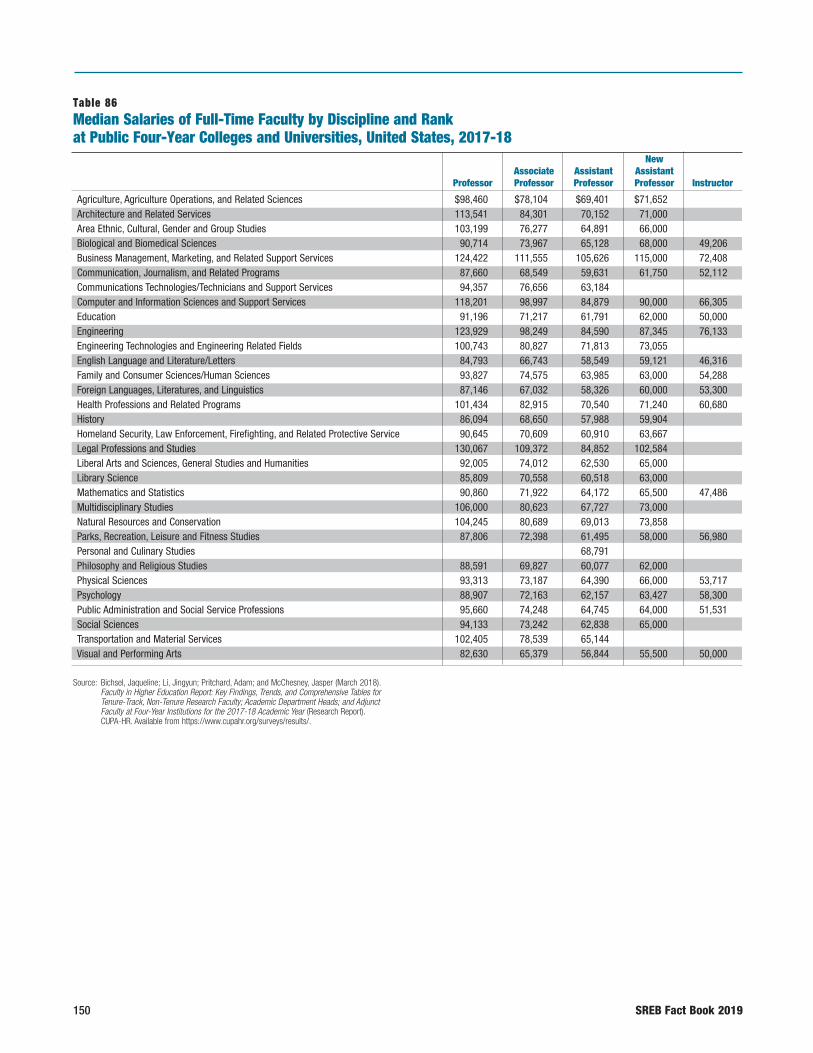
150 SREB Fact Book 2019
Table 86Median Salaries of Full-Time Faculty by Discipline and Rank at Public Four-Year Colleges and Universities, United States, 2017-18
New Associate Assistant Assistant Professor Professor Professor Professor Instructor
Agriculture, Agriculture Operations, and Related Sciences $98,460 $78,104 $69,401 $71,652 Architecture and Related Services 113,541 84,301 70,152 71,000 Area Ethnic, Cultural, Gender and Group Studies 103,199 76,277 64,891 66,000 Biological and Biomedical Sciences 90,714 73,967 65,128 68,000 49,206Business Management, Marketing, and Related Support Services 124,422 111,555 105,626 115,000 72,408Communication, Journalism, and Related Programs 87,660 68,549 59,631 61,750 52,112Communications Technologies/Technicians and Support Services 94,357 76,656 63,184 Computer and Information Sciences and Support Services 118,201 98,997 84,879 90,000 66,305Education 91,196 71,217 61,791 62,000 50,000Engineering 123,929 98,249 84,590 87,345 76,133Engineering Technologies and Engineering Related Fields 100,743 80,827 71,813 73,055 English Language and Literature/Letters 84,793 66,743 58,549 59,121 46,316Family and Consumer Sciences/Human Sciences 93,827 74,575 63,985 63,000 54,288Foreign Languages, Literatures, and Linguistics 87,146 67,032 58,326 60,000 53,300Health Professions and Related Programs 101,434 82,915 70,540 71,240 60,680History 86,094 68,650 57,988 59,904 Homeland Security, Law Enforcement, Firefighting, and Related Protective Service 90,645 70,609 60,910 63,667 Legal Professions and Studies 130,067 109,372 84,852 102,584 Liberal Arts and Sciences, General Studies and Humanities 92,005 74,012 62,530 65,000 Library Science 85,809 70,558 60,518 63,000 Mathematics and Statistics 90,860 71,922 64,172 65,500 47,486Multidisciplinary Studies 106,000 80,623 67,727 73,000 Natural Resources and Conservation 104,245 80,689 69,013 73,858 Parks, Recreation, Leisure and Fitness Studies 87,806 72,398 61,495 58,000 56,980Personal and Culinary Studies 68,791 Philosophy and Religious Studies 88,591 69,827 60,077 62,000 Physical Sciences 93,313 73,187 64,390 66,000 53,717Psychology 88,907 72,163 62,157 63,427 58,300Public Administration and Social Service Professions 95,660 74,248 64,745 64,000 51,531Social Sciences 94,133 73,242 62,838 65,000 Transportation and Material Services 102,405 78,539 65,144 Visual and Performing Arts 82,630 65,379 56,844 55,500 50,000
Source: Bichsel, Jaqueline; Li, Jingyun; Pritchard, Adam; and McChesney, Jasper (March 2018). Faculty in Higher Education Report: Key Findings, Trends, and Comprehensive Tables for Tenure-Track, Non-Tenure Research Faculty; Academic Department Heads; and Adjunct Faculty at Four-Year Institutions for the 2017-18 Academic Year (Research Report). CUPA-HR. Available from https://www.cupahr.org/surveys/results/.

SREB Fact Book 2019 151
FACU
LTY
Table 87Unweighted Median Salary by Classification All Institutions
All Institutions Number of Number of Doctoral Master’s Baccalaureate Associate’s Median Incumbents Institutions
“*” indicates four cases or fewer.
Source: Bichsel, Jaqueline; Li, Jingyun; Pritchard, Adam; and McChesney, Jasper (March 2018). Faculty in Higher Education Report: Key Findings, Trends, and Comprehensive Tables for Tenure-Track, Non-Tenure Research Faculty; Academic Department Heads; and Adjunct Faculty at Four-Year Institutions for the 2017-18 Academic Year (Research Report). CUPA-HR. Available from https://www.cupahr.org/surveys/results/.
Top Executive OfficersChief Executive Officer/Single Institution $466,981 $300,000 $310,000 $203,560 $313,504 942 915Chief Academic Affairs Officer/Provost 340,000 195,000 180,350 134,269 194,018 920 888Chief Business Officer 289,170 189,350 184,083 137,043 194,108 675 668Chief Development/Advancement Officer 290,366 170,027 172,568 108,045 180,000 771 760Chief Enrollment Management Officer 200,000 150,166 148,571 101,983 160,000 651 636Chief Financial Officer 268,786 161,140 170,000 132,294 180,000 771 760Chief Human Resources Officer 190,992 111,395 101,959 111,616 121,448 846 835Chief Information/IT Officer 227,721 137,112 122,800 116,978 144,921 783 771Chief Institutional Planning Officer 200,850 129,250 112,673 108,171 139,283 140 132Chief Institutional Research Officer 134,354 93,603 88,164 93,454 99,803 669 645Chief Library Officer 178,541 97,974 85,000 82,852 105,852 635 619Chief Public Relations/Communications Officer 183,500 109,542 105,285 94,384 121,771 521 509Chief Student Affairs/Student Life Officer 221,450 149,999 136,460 119,924 154,752 771 745
Academic DeansDean, Agriculture 267,680 141,966 * * 250,008 51 51Dean, Architecture 236,737 147,740 * * 230,000 61 60Dean, Liberal Arts 212,000 144,303 125,864 113,725 140,439 163 121Dean, Arts and Sciences 248,223 144,999 131,479 98,954 160,708 425 393Dean, Business 316,060 179,685 139,570 103,050 200,000 540 531Dean, Computer and Information Sciences 285,000 187,321 * * 200,000 31 31Dean, Education 215,000 137,899 100,242 93,782 158,602 420 403Dean, Engineering 300,074 200,862 179,200 105,295 270,438 222 212Dean, Fine Arts 204,434 142,000 111,925 102,889 158,364 118 117Dean, Graduate School 196,325 135,000 123,699 * 163,317 225 222Dean, Humanities 223,289 137,241 98,500 101,134 132,600 118 107Dean, Communications/Journalism/Media 236,763 156,256 * * 201,151 70 69Dean, Law 340,000 280,318 * * 330,000 127 123Dean, Library Science 198,170 125,529 * 97,956 147,425 88 88Dean, Mathematics 216,839 140,000 * 107,790 113,144 28 26Dean, Medicine 589,802 406,240 * * 552,387 66 63Dean, Nursing 245,573 134,000 109,254 100,499 154,592 229 224Dean, Sciences 260,500 148,072 107,060 102,167 154,020 189 185Dean, Social Sciences 233,602 142,012 97,870 100,106 137,111 98 92Dean, Social Work 238,465 129,661 * * 230,065 46 46Dean, Undergraduate Programs 198,005 119,005 113,823 * 140,000 86 81
Institutional Administrators Bursar 99,807 71,440 65,149 79,109 77,263 471 464Chief Budget Officer 143,644 109,486 110,000 97,772 122,400 394 385Chief Student Admissions Officer 127,913 91,553 92,544 74,176 98,894 714 642Chief Student Financial Aid Officer 118,292 85,474 82,583 78,141 90,000 880 849Chief Student Registrar/Records Officer 117,300 83,640 75,823 74,819 86,949 844 818Chief Faculty Affairs Officer 195,004 137,124 125,481 113,887 175,550 108 104

Copies of the Fact Book on Higher Education are available from the SREB publications office. SREB continuously monitors new comparative data and makes them available on the SREB website: www.sreb.org. The website also features an online edition of the Fact Book with links to the latest updates of the tables and individual Featured Facts reports for each of the 16 SREB states.
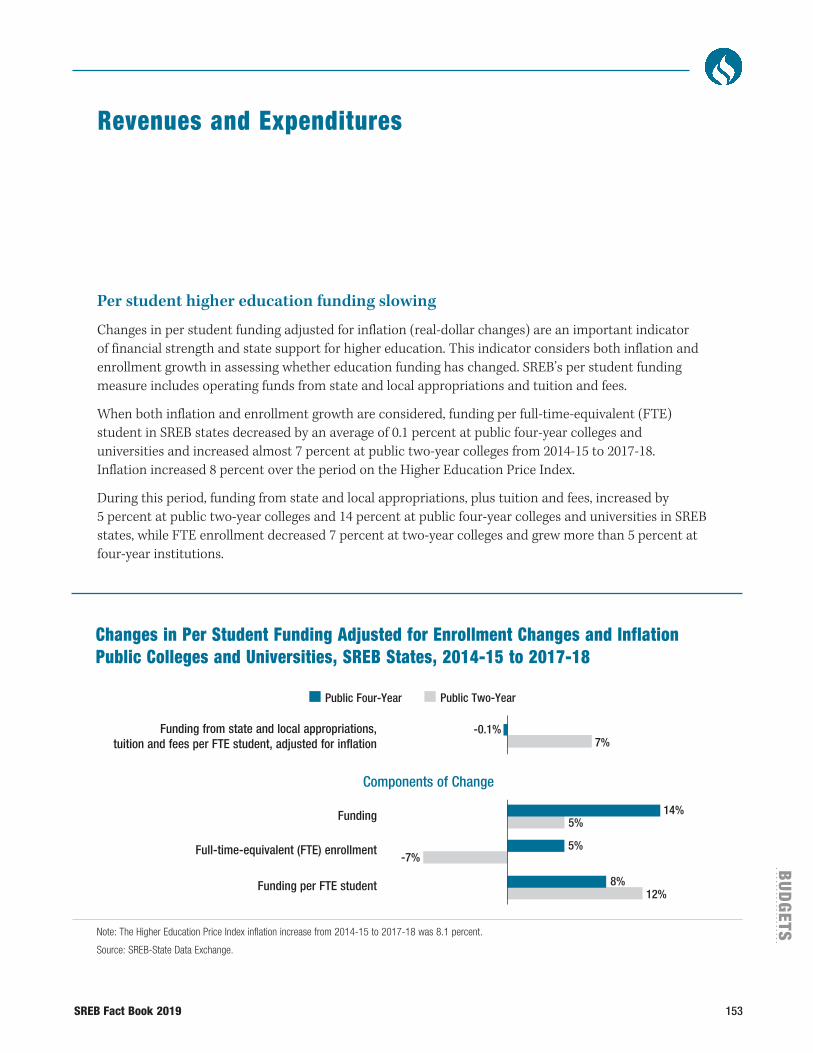
SREB Fact Book 2019 153
BU
DG
ETS
Revenues and Expenditures
Per student higher education funding slowing
Changes in per student funding adjusted for inflation (real-dollar changes) are an important indicator of financial strength and state support for higher education. This indicator considers both inflation and enrollment growth in assessing whether education funding has changed. SREB’s per student funding measure includes operating funds from state and local appropriations and tuition and fees.
When both inflation and enrollment growth are considered, funding per full-time-equivalent (FTE) student in SREB states decreased by an average of 0.1 percent at public four-year colleges and universities and increased almost 7 percent at public two-year colleges from 2014-15 to 2017-18. Inflation increased 8 percent over the period on the Higher Education Price Index.
During this period, funding from state and local appropriations, plus tuition and fees, increased by 5 percent at public two-year colleges and 14 percent at public four-year colleges and universities in SREB states, while FTE enrollment decreased 7 percent at two-year colleges and grew more than 5 percent at four-year institutions.
Changes in Per Student Funding Adjusted for Enrollment Changes and Inflation Public Colleges and Universities, SREB States, 2014-15 to 2017-18
Note: The Higher Education Price Index inflation increase from 2014-15 to 2017-18 was 8.1 percent.
Source: SREB-State Data Exchange.
-0.1%7%
14%5%
5%-7%
8%12%
Funding from state and local appropriations, tuition and fees per FTE student, adjusted for inflation
Funding
Full-time-equivalent (FTE) enrollment
Funding per FTE student
Public Four-Year Public Two-Year
Components of Change
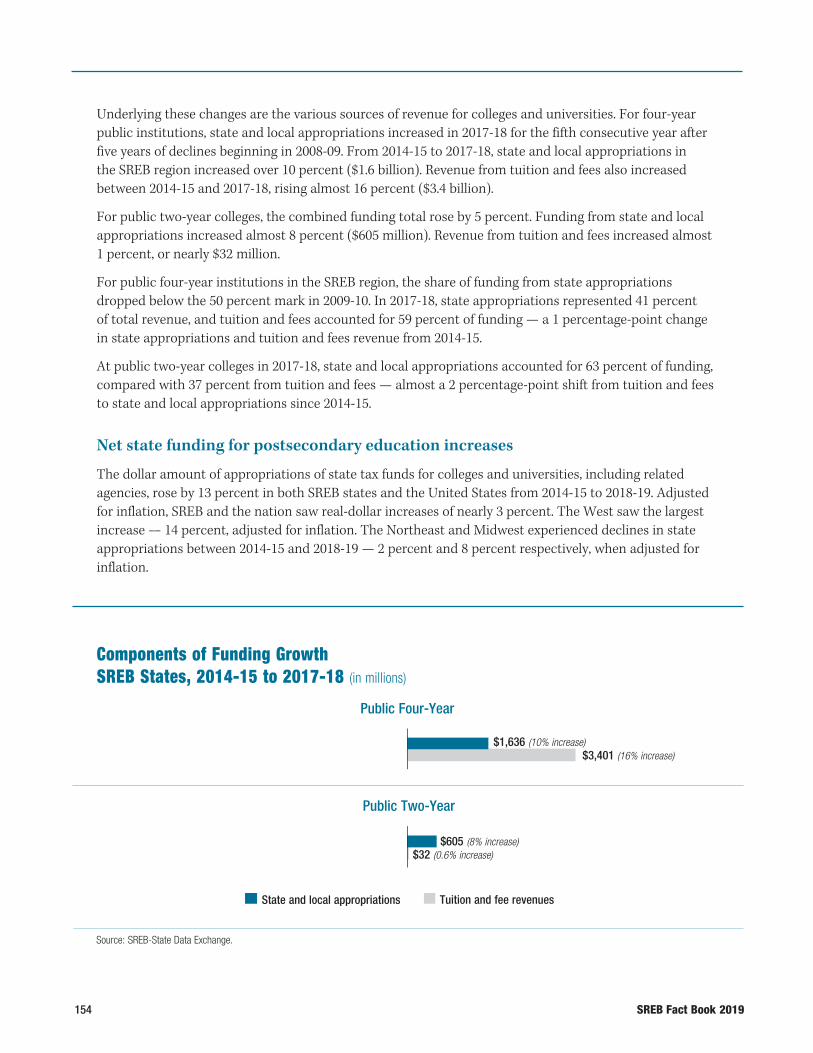
154 SREB Fact Book 2019
Underlying these changes are the various sources of revenue for colleges and universities. For four-year public institutions, state and local appropriations increased in 2017-18 for the fifth consecutive year after five years of declines beginning in 2008-09. From 2014-15 to 2017-18, state and local appropriations in the SREB region increased over 10 percent ($1.6 billion). Revenue from tuition and fees also increased between 2014-15 and 2017-18, rising almost 16 percent ($3.4 billion).
For public two-year colleges, the combined funding total rose by 5 percent. Funding from state and local appropriations increased almost 8 percent ($605 million). Revenue from tuition and fees increased almost 1 percent, or nearly $32 million.
For public four-year institutions in the SREB region, the share of funding from state appropriations dropped below the 50 percent mark in 2009-10. In 2017-18, state appropriations represented 41 percent of total revenue, and tuition and fees accounted for 59 percent of funding — a 1 percentage-point change in state appropriations and tuition and fees revenue from 2014-15.
At public two-year colleges in 2017-18, state and local appropriations accounted for 63 percent of funding, compared with 37 percent from tuition and fees — almost a 2 percentage-point shift from tuition and fees to state and local appropriations since 2014-15.
Net state funding for postsecondary education increases
The dollar amount of appropriations of state tax funds for colleges and universities, including related agencies, rose by 13 percent in both SREB states and the United States from 2014-15 to 2018-19. Adjusted for inflation, SREB and the nation saw real-dollar increases of nearly 3 percent. The West saw the largest increase — 14 percent, adjusted for inflation. The Northeast and Midwest experienced declines in state appropriations between 2014-15 and 2018-19 — 2 percent and 8 percent respectively, when adjusted for inflation.
Components of Funding Growth SREB States, 2014-15 to 2017-18 (in millions)
Source: SREB-State Data Exchange.
$1,636 (10% increase)
$605 (8% increase)$32 (0.6% increase)
Public Four-Year
Public Two-Year
State and local appropriations Tuition and fee revenues
$3,401 (16% increase)
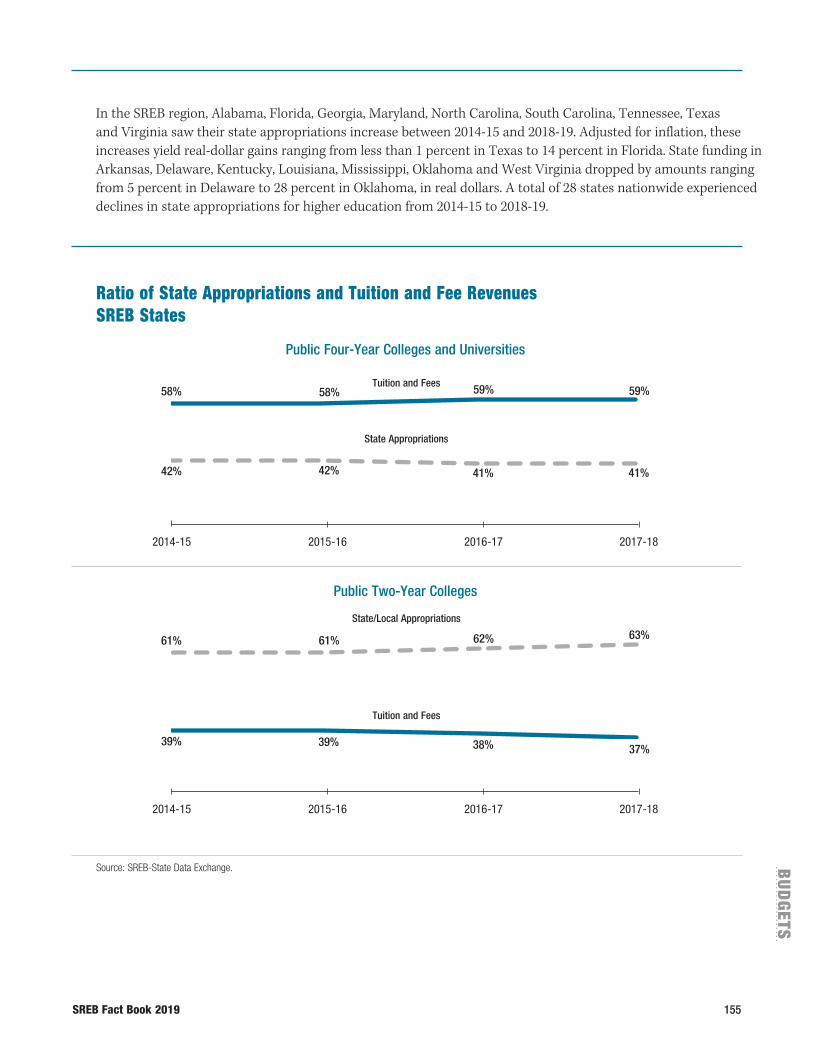
SREB Fact Book 2019 155
BU
DG
ETS
Source: SREB-State Data Exchange.
Ratio of State Appropriations and Tuition and Fee RevenuesSREB States
State Appropriations
Tuition and Fees58%
42%
59%
41%
59%
41%
58%
42%
2014-15 2015-16 2016-17 2017-18
2014-15 2015-16 2016-17 2017-18
Public Two-Year Colleges
Public Four-Year Colleges and Universities
State/Local Appropriations
Tuition and Fees
61%
39%
62% 63%
37% 38%
61%
39%
In the SREB region, Alabama, Florida, Georgia, Maryland, North Carolina, South Carolina, Tennessee, Texas and Virginia saw their state appropriations increase between 2014-15 and 2018-19. Adjusted for inflation, these increases yield real-dollar gains ranging from less than 1 percent in Texas to 14 percent in Florida. State funding in Arkansas, Delaware, Kentucky, Louisiana, Mississippi, Oklahoma and West Virginia dropped by amounts ranging from 5 percent in Delaware to 28 percent in Oklahoma, in real dollars. A total of 28 states nationwide experienced declines in state appropriations for higher education from 2014-15 to 2018-19.
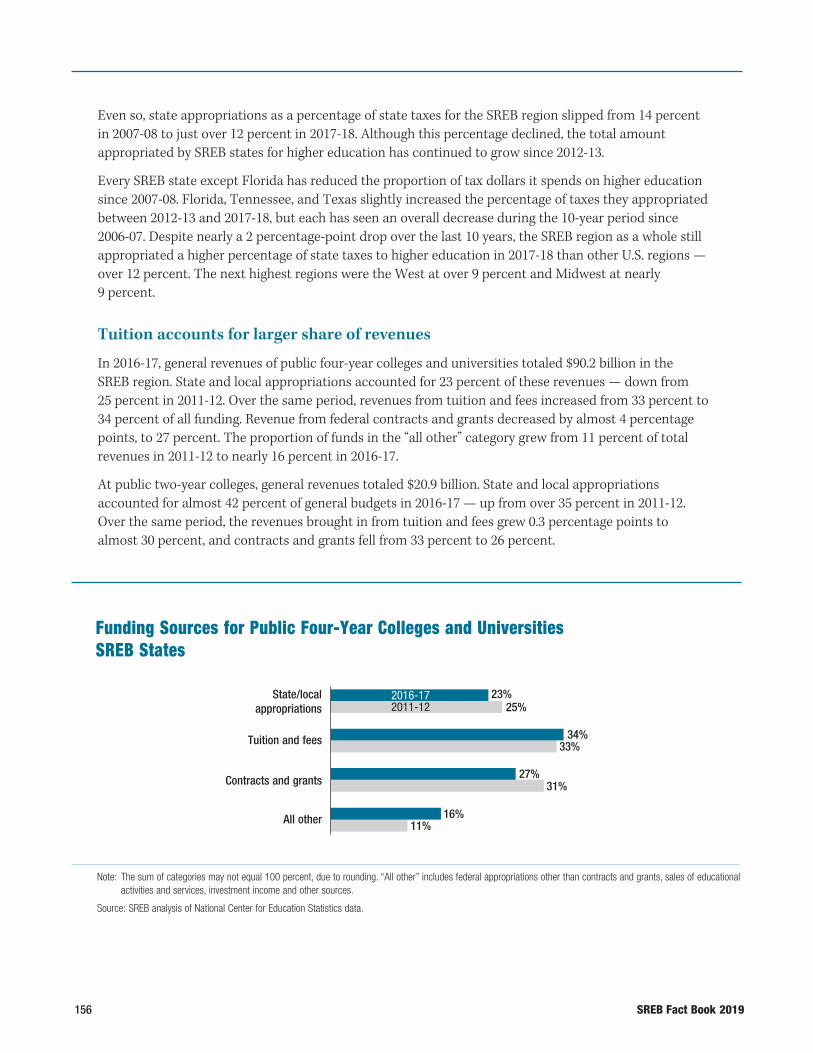
156 SREB Fact Book 2019
Even so, state appropriations as a percentage of state taxes for the SREB region slipped from 14 percent in 2007-08 to just over 12 percent in 2017-18. Although this percentage declined, the total amount appropriated by SREB states for higher education has continued to grow since 2012-13.
Every SREB state except Florida has reduced the proportion of tax dollars it spends on higher education since 2007-08. Florida, Tennessee, and Texas slightly increased the percentage of taxes they appropriated between 2012-13 and 2017-18, but each has seen an overall decrease during the 10-year period since 2006-07. Despite nearly a 2 percentage-point drop over the last 10 years, the SREB region as a whole still appropriated a higher percentage of state taxes to higher education in 2017-18 than other U.S. regions — over 12 percent. The next highest regions were the West at over 9 percent and Midwest at nearly 9 percent.
Tuition accounts for larger share of revenues
In 2016-17, general revenues of public four-year colleges and universities totaled $90.2 billion in the SREB region. State and local appropriations accounted for 23 percent of these revenues — down from 25 percent in 2011-12. Over the same period, revenues from tuition and fees increased from 33 percent to 34 percent of all funding. Revenue from federal contracts and grants decreased by almost 4 percentage points, to 27 percent. The proportion of funds in the “all other” category grew from 11 percent of total revenues in 2011-12 to nearly 16 percent in 2016-17.
At public two-year colleges, general revenues totaled $20.9 billion. State and local appropriations accounted for almost 42 percent of general budgets in 2016-17 — up from over 35 percent in 2011-12. Over the same period, the revenues brought in from tuition and fees grew 0.3 percentage points to almost 30 percent, and contracts and grants fell from 33 percent to 26 percent.
Funding Sources for Public Four-Year Colleges and Universities SREB States
Note: The sum of categories may not equal 100 percent, due to rounding. “All other” includes federal appropriations other than contracts and grants, sales of educational activities and services, investment income and other sources.
Source: SREB analysis of National Center for Education Statistics data.
27%31%
16%11%
25%2016-17State/local
appropriations
Tuition and fees
Contracts and grants
All other
23%
33%34%
2011-12
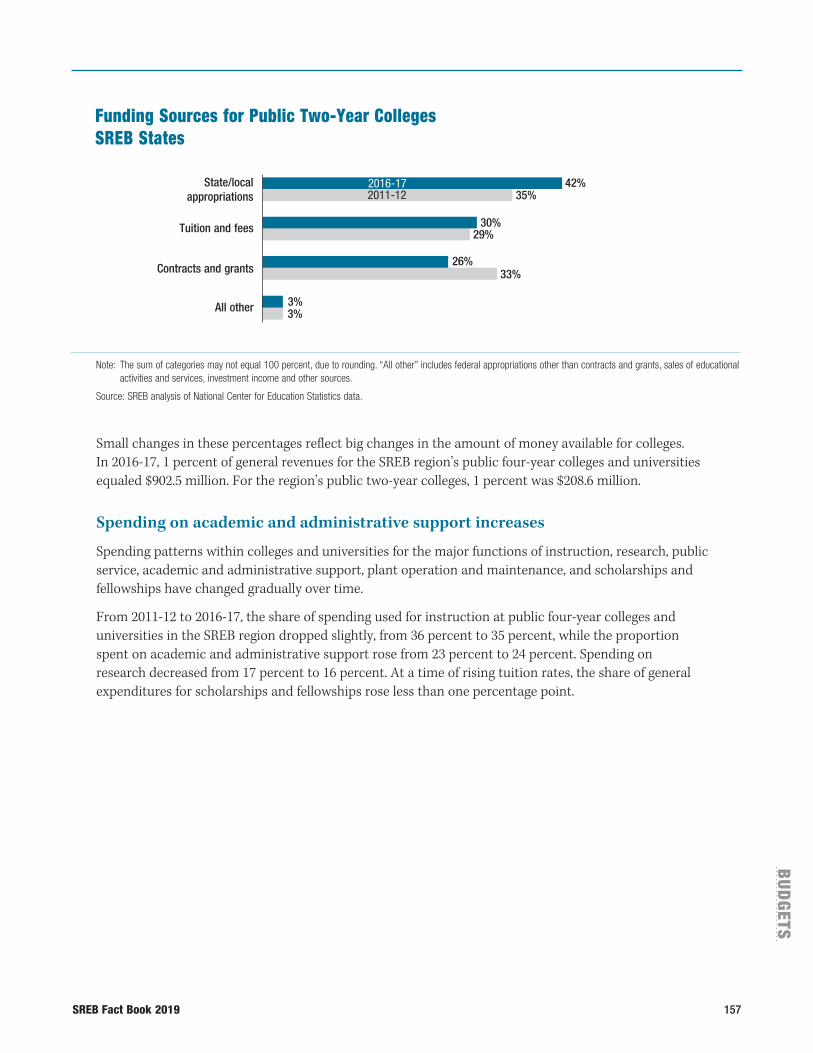
SREB Fact Book 2019 157
BU
DG
ETS
Small changes in these percentages reflect big changes in the amount of money available for colleges.In 2016-17, 1 percent of general revenues for the SREB region’s public four-year colleges and universities equaled $902.5 million. For the region’s public two-year colleges, 1 percent was $208.6 million.
Spending on academic and administrative support increases
Spending patterns within colleges and universities for the major functions of instruction, research, public service, academic and administrative support, plant operation and maintenance, and scholarships and fellowships have changed gradually over time.
From 2011-12 to 2016-17, the share of spending used for instruction at public four-year colleges and universities in the SREB region dropped slightly, from 36 percent to 35 percent, while the proportion spent on academic and administrative support rose from 23 percent to 24 percent. Spending on research decreased from 17 percent to 16 percent. At a time of rising tuition rates, the share of general expenditures for scholarships and fellowships rose less than one percentage point.
Funding Sources for Public Two-Year Colleges SREB States
Note: The sum of categories may not equal 100 percent, due to rounding. “All other” includes federal appropriations other than contracts and grants, sales of educational activities and services, investment income and other sources.
Source: SREB analysis of National Center for Education Statistics data.
26%33%
3%3%
35%2016-172011-12
State/local appropriations
Tuition and fees
Contracts and grants
All other
42%
29%30%
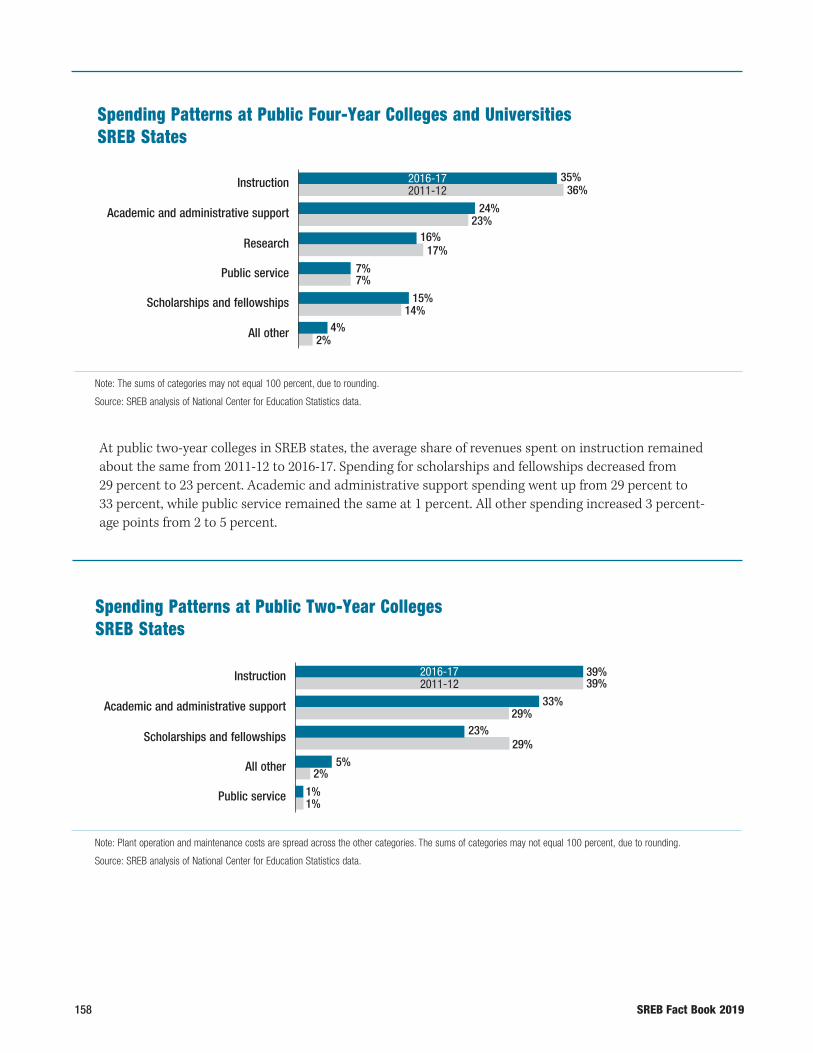
158 SREB Fact Book 2019
At public two-year colleges in SREB states, the average share of revenues spent on instruction remained about the same from 2011-12 to 2016-17. Spending for scholarships and fellowships decreased from 29 percent to 23 percent. Academic and administrative support spending went up from 29 percent to 33 percent, while public service remained the same at 1 percent. All other spending increased 3 percent-age points from 2 to 5 percent.
Spending Patterns at Public Four-Year Colleges and Universities SREB States
Note: The sums of categories may not equal 100 percent, due to rounding.
Source: SREB analysis of National Center for Education Statistics data.
16%17%
7%7%
15%14%
4%2%
Instruction
Academic and administrative support
Research
Public service
Scholarships and fellowships
All other
36%2016-172011-12
35%
23%24%
Spending Patterns at Public Two-Year CollegesSREB States
Note: Plant operation and maintenance costs are spread across the other categories. The sums of categories may not equal 100 percent, due to rounding.
Source: SREB analysis of National Center for Education Statistics data.
23%29%
5%2%
1%1%
39%2016-172011-12
39%
29%33%
Instruction
Academic and administrative support
Scholarships and fellowships
All other
Public service
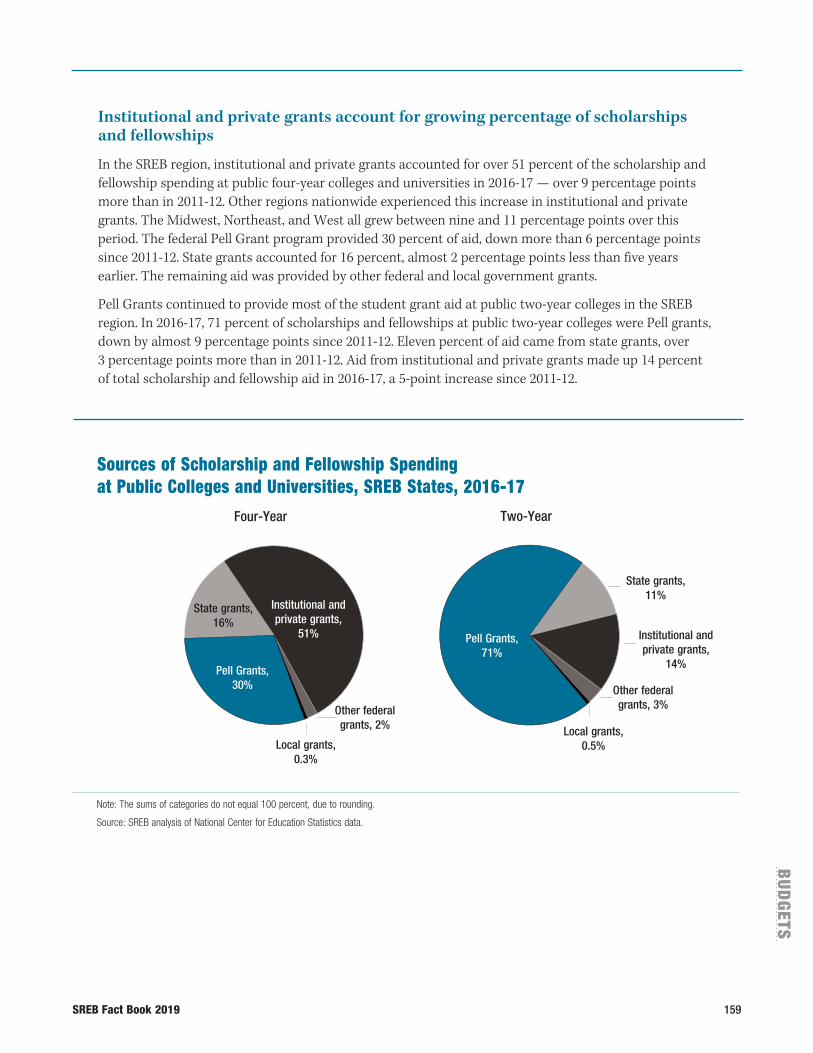
SREB Fact Book 2019 159
BU
DG
ETS
Institutional and private grants account for growing percentage of scholarships and fellowships
In the SREB region, institutional and private grants accounted for over 51 percent of the scholarship and fellowship spending at public four-year colleges and universities in 2016-17 — over 9 percentage points more than in 2011-12. Other regions nationwide experienced this increase in institutional and private grants. The Midwest, Northeast, and West all grew between nine and 11 percentage points over this period. The federal Pell Grant program provided 30 percent of aid, down more than 6 percentage points since 2011-12. State grants accounted for 16 percent, almost 2 percentage points less than five years earlier. The remaining aid was provided by other federal and local government grants.
Pell Grants continued to provide most of the student grant aid at public two-year colleges in the SREB region. In 2016-17, 71 percent of scholarships and fellowships at public two-year colleges were Pell grants, down by almost 9 percentage points since 2011-12. Eleven percent of aid came from state grants, over 3 percentage points more than in 2011-12. Aid from institutional and private grants made up 14 percent of total scholarship and fellowship aid in 2016-17, a 5-point increase since 2011-12.
Sources of Scholarship and Fellowship Spending at Public Colleges and Universities, SREB States, 2016-17
Note: The sums of categories do not equal 100 percent, due to rounding.
Source: SREB analysis of National Center for Education Statistics data.
Pell Grants, 71%
Other federal grants, 3%
Local grants, 0.5%
Institutional and private grants,
51%
Pell Grants, 30%
State grants, 16%
Local grants, 0.3%
Other federal grants, 2%
Four-Year Two-Year
Institutional and private grants,
14%
State grants, 11%
160 SREB Fact Book 2019
Federal R&D funding fluctuates nationwide while R&D spending grows
Federal support for research and development (R&D) peaked in 2008-09, decreased until 2012-13, and has since fluctuated from year to year. From 2010-11 to 2015-16, the amount of federal funding for R&D increased in two regions — by 8 percent in SREB states and 0.6 percent in the Northeast. The Midwest decreased 5 percent and the West decreased 0.6 percent. Thirty-one universities in the SREB region were still among the nation’s top 100 recipients of federal research and development support.
University spending on research and development related to funding from the federal government has increased in recent years. On average, total spending for universities in the top 10 increased by 22 percent between 2011-12 and 2016-17; the increase was lower for the nation, at 14 percent. Thirty universities in SREB states rank in the top 100 institutions nationwide on research and development spending.
In 2016-17, federal funds accounted for over 53 percent of the $75.1 billion spent for R&D at universities nationwide and 52 percent of the nearly $24.8 billion total spent in SREB states. The remaining portions of R&D spending in the region came mostly from institutions’ own budgets (25 percent), state and local governments (8 percent), business (6 percent) and non-profit sources (6 percent).
In the Northeast, university R&D expenditures were $17.8 billion, of which 54 percent was federal. The next highest was the West, where spending was $16.6 billion, of which 56 percent was federal. Spending in the Midwest totaled $14.7 billion, of which 51 percent was federal.
The value of endowments increases
The growth in the market values of U.S. universities’ endowments has increased from 2017 to 2018. The market value of the top 100 endowments in the nation increased by over 10 percent — representing a paper gain of $472.9 billion. Two of the nation’s 10 largest college and university endowments in 2018 were in the SREB region: the University of Texas System and the Texas A&M University System. The University of Texas System’s endowment of $30.9 billion in 2018 was ranked second in size, below Harvard. The Texas A&M endowment was eighth, with a value of $13.5 billion.
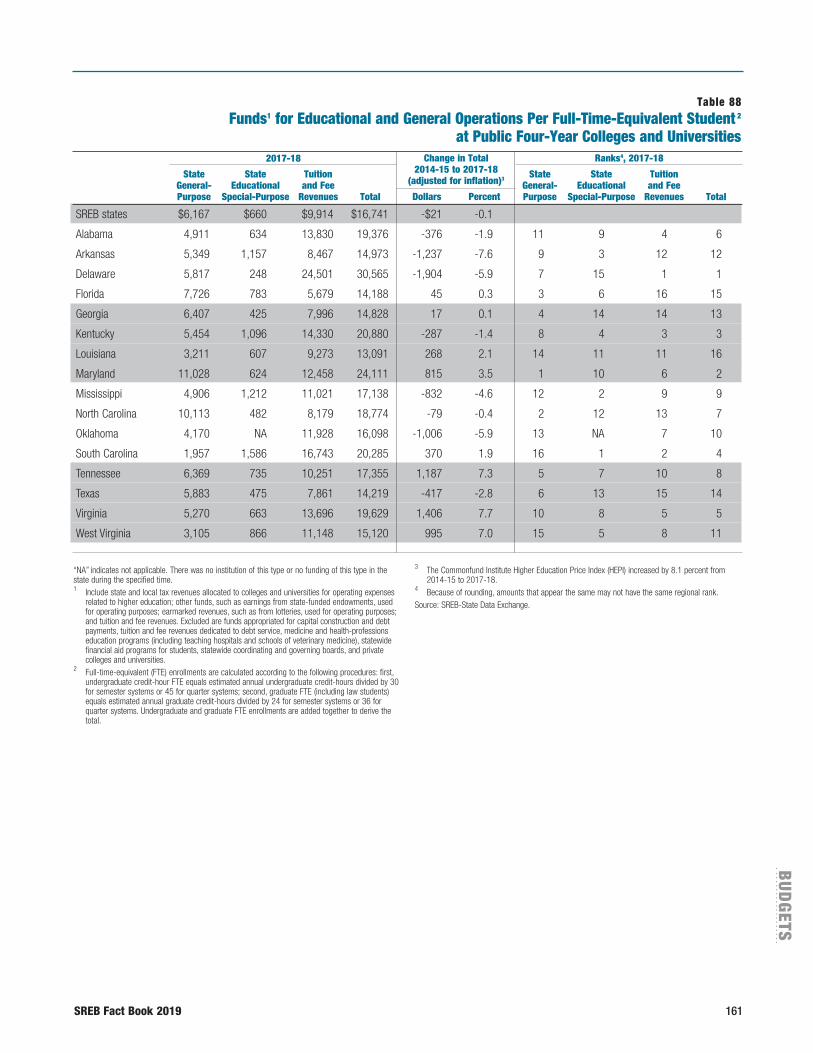
SREB Fact Book 2019 161
BU
DG
ETS
“NA” indicates not applicable. There was no institution of this type or no funding of this type in the state during the specified time.1 Include state and local tax revenues allocated to colleges and universities for operating expenses
related to higher education; other funds, such as earnings from state-funded endowments, used for operating purposes; earmarked revenues, such as from lotteries, used for operating purposes; and tuition and fee revenues. Excluded are funds appropriated for capital construction and debt payments, tuition and fee revenues dedicated to debt service, medicine and health-professions education programs (including teaching hospitals and schools of veterinary medicine), statewide financial aid programs for students, statewide coordinating and governing boards, and private colleges and universities.
2 Full-time-equivalent (FTE) enrollments are calculated according to the following procedures: first, undergraduate credit-hour FTE equals estimated annual undergraduate credit-hours divided by 30 for semester systems or 45 for quarter systems; second, graduate FTE (including law students) equals estimated annual graduate credit-hours divided by 24 for semester systems or 36 for quarter systems. Undergraduate and graduate FTE enrollments are added together to derive the total.
3 The Commonfund Institute Higher Education Price Index (HEPI) increased by 8.1 percent from 2014-15 to 2017-18.
4 Because of rounding, amounts that appear the same may not have the same regional rank.Source: SREB-State Data Exchange.
SREB states $6,167 $660 $9,914 $16,741 -$21 -0.1
Alabama 4,911 634 13,830 19,376 -376 -1.9 11 9 4 6
Arkansas 5,349 1,157 8,467 14,973 -1,237 -7.6 9 3 12 12
Delaware 5,817 248 24,501 30,565 -1,904 -5.9 7 15 1 1
Florida 7,726 783 5,679 14,188 45 0.3 3 6 16 15
Georgia 6,407 425 7,996 14,828 17 0.1 4 14 14 13
Kentucky 5,454 1,096 14,330 20,880 -287 -1.4 8 4 3 3
Louisiana 3,211 607 9,273 13,091 268 2.1 14 11 11 16
Maryland 11,028 624 12,458 24,111 815 3.5 1 10 6 2
Mississippi 4,906 1,212 11,021 17,138 -832 -4.6 12 2 9 9
North Carolina 10,113 482 8,179 18,774 -79 -0.4 2 12 13 7
Oklahoma 4,170 NA 11,928 16,098 -1,006 -5.9 13 NA 7 10
South Carolina 1,957 1,586 16,743 20,285 370 1.9 16 1 2 4
Tennessee 6,369 735 10,251 17,355 1,187 7.3 5 7 10 8
Texas 5,883 475 7,861 14,219 -417 -2.8 6 13 15 14
Virginia 5,270 663 13,696 19,629 1,406 7.7 10 8 5 5
West Virginia 3,105 866 11,148 15,120 995 7.0 15 5 8 11
State Educational
Special-Purpose
State General- Purpose
Tuition and Fee
Revenues
Total
State Educational
Special-Purpose
State General- Purpose
Tuition and Fee
Revenues
Total
Table 88Funds1 for Educational and General Operations Per Full-Time-Equivalent Student 2
at Public Four-Year Colleges and Universities2017-18 Ranks4, 2017-18Change in Total
2014-15 to 2017-18
(adjusted for inflation)3
Dollars
Percent
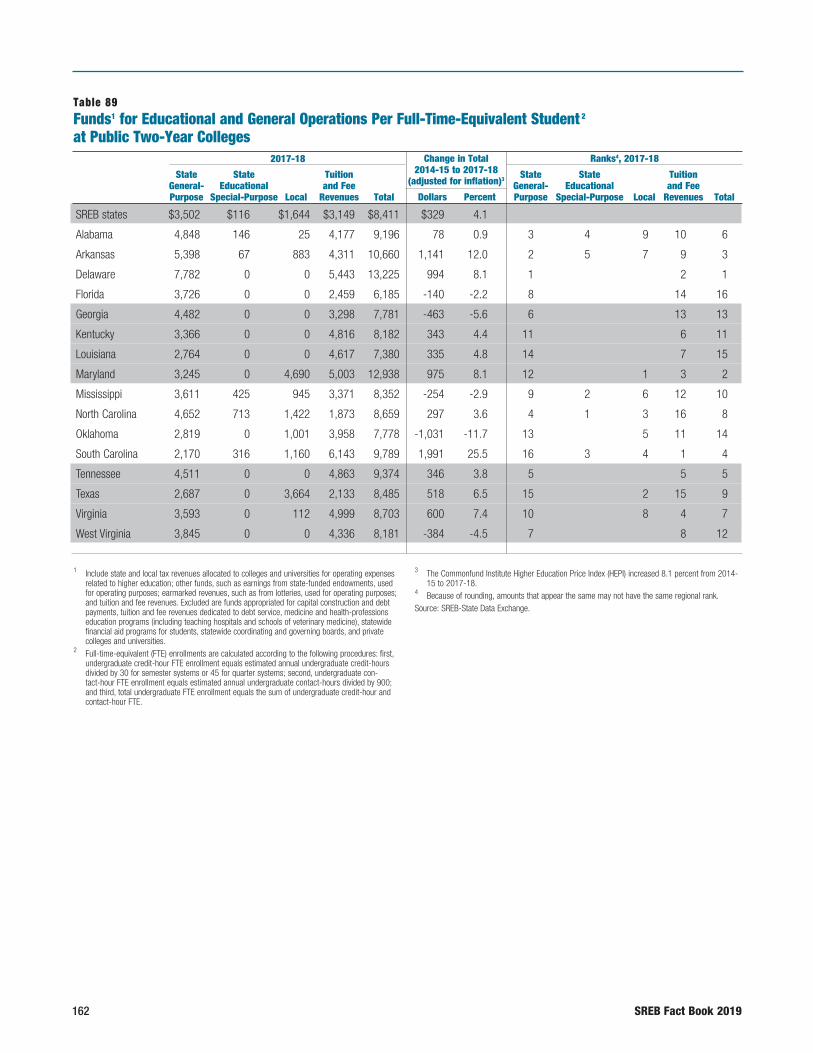
162 SREB Fact Book 2019
1 Include state and local tax revenues allocated to colleges and universities for operating expenses related to higher education; other funds, such as earnings from state-funded endowments, used for operating purposes; earmarked revenues, such as from lotteries, used for operating purposes; and tuition and fee revenues. Excluded are funds appropriated for capital construction and debt payments, tuition and fee revenues dedicated to debt service, medicine and health-professions education programs (including teaching hospitals and schools of veterinary medicine), statewide financial aid programs for students, statewide coordinating and governing boards, and private colleges and universities.
2 Full-time-equivalent (FTE) enrollments are calculated according to the following procedures: first, undergraduate credit-hour FTE enrollment equals estimated annual undergraduate credit-hours divided by 30 for semester systems or 45 for quarter systems; second, undergraduate con-tact-hour FTE enrollment equals estimated annual undergraduate contact-hours divided by 900; and third, total undergraduate FTE enrollment equals the sum of undergraduate credit-hour and contact-hour FTE.
3 The Commonfund Institute Higher Education Price Index (HEPI) increased 8.1 percent from 2014-15 to 2017-18.
4 Because of rounding, amounts that appear the same may not have the same regional rank.Source: SREB-State Data Exchange.
SREB states $3,502 $116 $1,644 $3,149 $8,411 $329 4.1
Alabama 4,848 146 25 4,177 9,196 78 0.9 3 4 9 10 6
Arkansas 5,398 67 883 4,311 10,660 1,141 12.0 2 5 7 9 3
Delaware 7,782 0 0 5,443 13,225 994 8.1 1 2 1
Florida 3,726 0 0 2,459 6,185 -140 -2.2 8 14 16
Georgia 4,482 0 0 3,298 7,781 -463 -5.6 6 13 13
Kentucky 3,366 0 0 4,816 8,182 343 4.4 11 6 11
Louisiana 2,764 0 0 4,617 7,380 335 4.8 14 7 15
Maryland 3,245 0 4,690 5,003 12,938 975 8.1 12 1 3 2
Mississippi 3,611 425 945 3,371 8,352 -254 -2.9 9 2 6 12 10
North Carolina 4,652 713 1,422 1,873 8,659 297 3.6 4 1 3 16 8
Oklahoma 2,819 0 1,001 3,958 7,778 -1,031 -11.7 13 5 11 14
South Carolina 2,170 316 1,160 6,143 9,789 1,991 25.5 16 3 4 1 4
Tennessee 4,511 0 0 4,863 9,374 346 3.8 5 5 5
Texas 2,687 0 3,664 2,133 8,485 518 6.5 15 2 15 9
Virginia 3,593 0 112 4,999 8,703 600 7.4 10 8 4 7
West Virginia 3,845 0 0 4,336 8,181 -384 -4.5 7 8 12
State Educational
Special-Purpose
State General- Purpose
Tuition and Fee
Revenues
Total
Local
Table 89Funds1 for Educational and General Operations Per Full-Time-Equivalent Student 2 at Public Two-Year Colleges
2017-18 Ranks4, 2017-18Change in Total 2014-15 to 2017-18
(adjusted for inflation)3 State Educational
Special-Purpose
State General- Purpose
Tuition and Fee
Revenues
Total
Local
Dollars
Percent
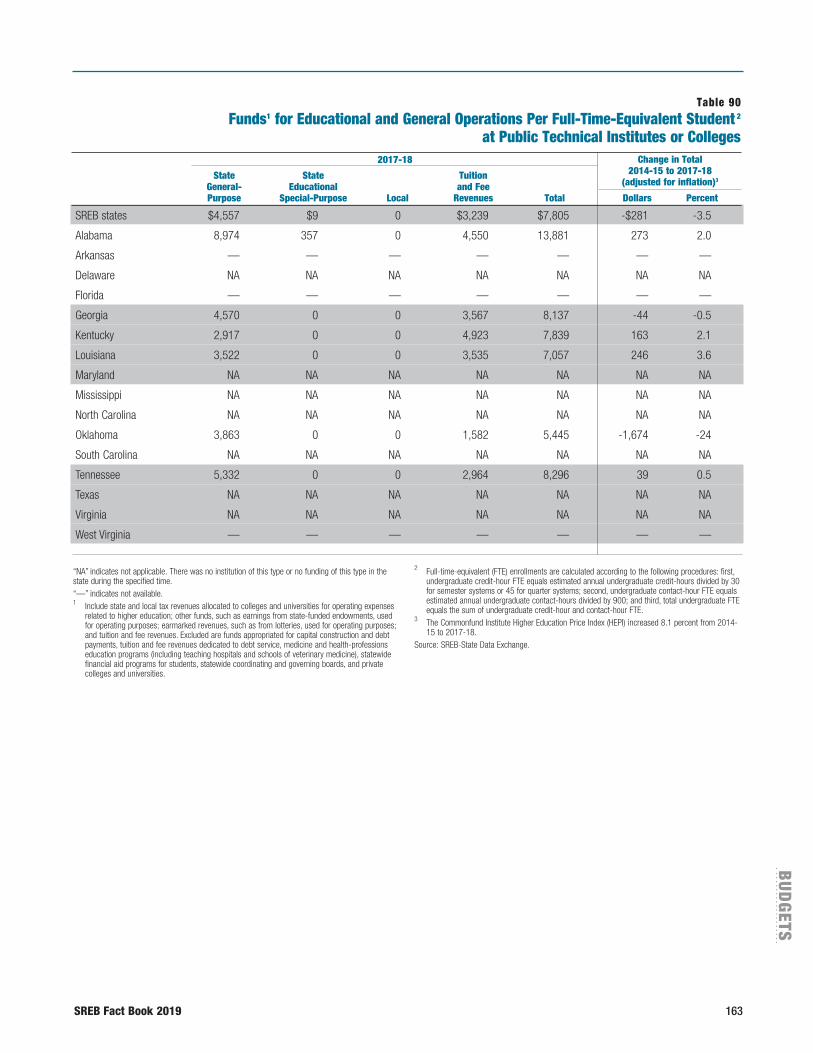
SREB Fact Book 2019 163
BU
DG
ETS
“NA” indicates not applicable. There was no institution of this type or no funding of this type in the state during the specified time.“—” indicates not available.1 Include state and local tax revenues allocated to colleges and universities for operating expenses
related to higher education; other funds, such as earnings from state-funded endowments, used for operating purposes; earmarked revenues, such as from lotteries, used for operating purposes; and tuition and fee revenues. Excluded are funds appropriated for capital construction and debt payments, tuition and fee revenues dedicated to debt service, medicine and health-professions education programs (including teaching hospitals and schools of veterinary medicine), statewide financial aid programs for students, statewide coordinating and governing boards, and private colleges and universities.
2 Full-time-equivalent (FTE) enrollments are calculated according to the following procedures: first, undergraduate credit-hour FTE equals estimated annual undergraduate credit-hours divided by 30 for semester systems or 45 for quarter systems; second, undergraduate contact-hour FTE equals estimated annual undergraduate contact-hours divided by 900; and third, total undergraduate FTE equals the sum of undergraduate credit-hour and contact-hour FTE.
3 The Commonfund Institute Higher Education Price Index (HEPI) increased 8.1 percent from 2014-15 to 2017-18.
Source: SREB-State Data Exchange.
SREB states $4,557 $9 0 $3,239 $7,805 -$281 -3.5
Alabama 8,974 357 0 4,550 13,881 273 2.0
Arkansas — — — — — — —
Delaware NA NA NA NA NA NA NA
Florida — — — — — — —
Georgia 4,570 0 0 3,567 8,137 -44 -0.5
Kentucky 2,917 0 0 4,923 7,839 163 2.1
Louisiana 3,522 0 0 3,535 7,057 246 3.6
Maryland NA NA NA NA NA NA NA
Mississippi NA NA NA NA NA NA NA
North Carolina NA NA NA NA NA NA NA
Oklahoma 3,863 0 0 1,582 5,445 -1,674 -24
South Carolina NA NA NA NA NA NA NA
Tennessee 5,332 0 0 2,964 8,296 39 0.5
Texas NA NA NA NA NA NA NA
Virginia NA NA NA NA NA NA NA
West Virginia — — — — — — —
Table 90Funds1 for Educational and General Operations Per Full-Time-Equivalent Student 2
at Public Technical Institutes or Colleges2017-18 Change in Total
2014-15 to 2017-18
(adjusted for inflation)3State Educational
Special-Purpose
State General- Purpose
Tuition and Fee
Revenues
Total
Local
Dollars
Percent
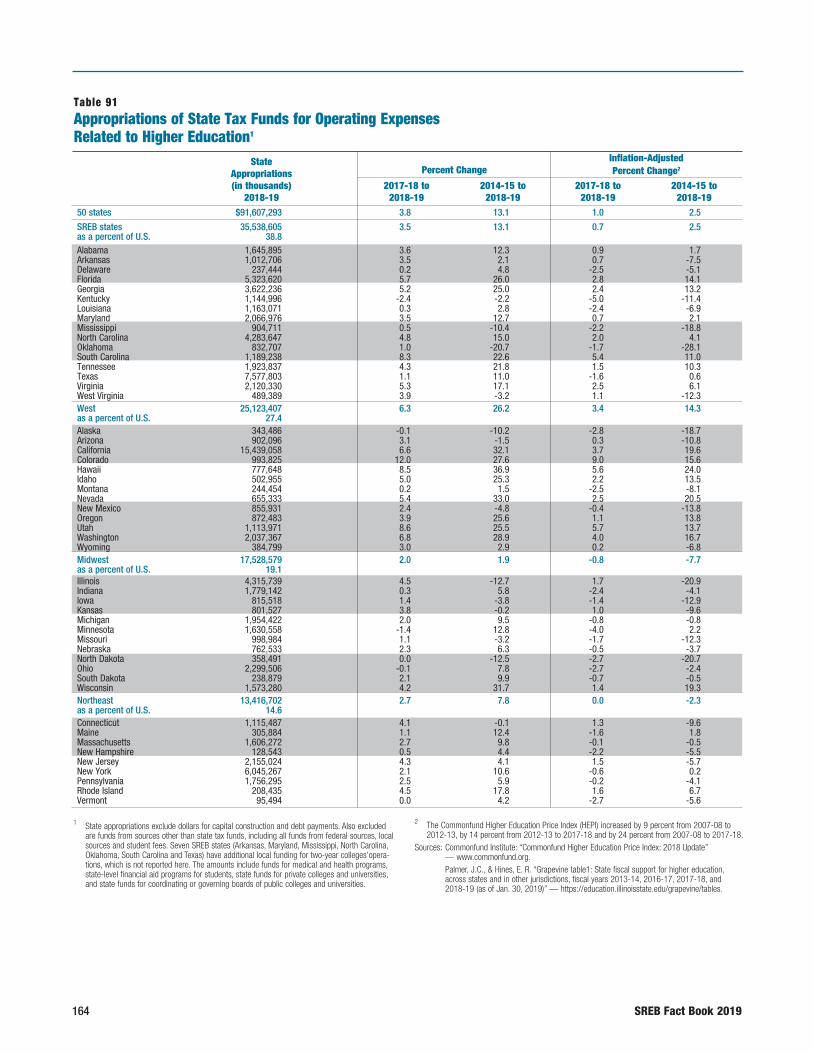
164 SREB Fact Book 2019
50 states $91,607,293 3.8 13.1 1.0 2.5
SREB states 35,538,605 3.5 13.1 0.7 2.5as a percent of U.S. 38.8 Alabama 1,645,895 3.6 12.3 0.9 1.7Arkansas 1,012,706 3.5 2.1 0.7 -7.5Delaware 237,444 0.2 4.8 -2.5 -5.1Florida 5,323,620 5.7 26.0 2.8 14.1Georgia 3,622,236 5.2 25.0 2.4 13.2Kentucky 1,144,996 -2.4 -2.2 -5.0 -11.4Louisiana 1,163,071 0.3 2.8 -2.4 -6.9Maryland 2,066,976 3.5 12.7 0.7 2.1Mississippi 904,711 0.5 -10.4 -2.2 -18.8North Carolina 4,283,647 4.8 15.0 2.0 4.1Oklahoma 832,707 1.0 -20.7 -1.7 -28.1South Carolina 1,189,238 8.3 22.6 5.4 11.0Tennessee 1,923,837 4.3 21.8 1.5 10.3Texas 7,577,803 1.1 11.0 -1.6 0.6Virginia 2,120,330 5.3 17.1 2.5 6.1West Virginia 489,389 3.9 -3.2 1.1 -12.3West 25,123,407 6.3 26.2 3.4 14.3as a percent of U.S. 27.4 Alaska 343,486 -0.1 -10.2 -2.8 -18.7Arizona 902,096 3.1 -1.5 0.3 -10.8California 15,439,058 6.6 32.1 3.7 19.6Colorado 993,825 12.0 27.6 9.0 15.6Hawaii 777,648 8.5 36.9 5.6 24.0Idaho 502,955 5.0 25.3 2.2 13.5Montana 244,454 0.2 1.5 -2.5 -8.1Nevada 655,333 5.4 33.0 2.5 20.5New Mexico 855,931 2.4 -4.8 -0.4 -13.8Oregon 872,483 3.9 25.6 1.1 13.8Utah 1,113,971 8.6 25.5 5.7 13.7Washington 2,037,367 6.8 28.9 4.0 16.7Wyoming 384,799 3.0 2.9 0.2 -6.8Midwest 17,528,579 2.0 1.9 -0.8 -7.7as a percent of U.S. 19.1 Illinois 4,315,739 4.5 -12.7 1.7 -20.9Indiana 1,779,142 0.3 5.8 -2.4 -4.1Iowa 815,518 1.4 -3.8 -1.4 -12.9Kansas 801,527 3.8 -0.2 1.0 -9.6Michigan 1,954,422 2.0 9.5 -0.8 -0.8Minnesota 1,630,558 -1.4 12.8 -4.0 2.2Missouri 998,984 1.1 -3.2 -1.7 -12.3Nebraska 762,533 2.3 6.3 -0.5 -3.7North Dakota 358,491 0.0 -12.5 -2.7 -20.7Ohio 2,299,506 -0.1 7.8 -2.7 -2.4South Dakota 238,879 2.1 9.9 -0.7 -0.5Wisconsin 1,573,280 4.2 31.7 1.4 19.3Northeast 13,416,702 2.7 7.8 0.0 -2.3as a percent of U.S. 14.6 Connecticut 1,115,487 4.1 -0.1 1.3 -9.6Maine 305,884 1.1 12.4 -1.6 1.8Massachusetts 1,606,272 2.7 9.8 -0.1 -0.5New Hampshire 128,543 0.5 4.4 -2.2 -5.5New Jersey 2,155,024 4.3 4.1 1.5 -5.7New York 6,045,267 2.1 10.6 -0.6 0.2Pennsylvania 1,756,295 2.5 5.9 -0.2 -4.1Rhode Island 208,435 4.5 17.8 1.6 6.7Vermont 95,494 0.0 4.2 -2.7 -5.6
1 State appropriations exclude dollars for capital construction and debt payments. Also excluded are funds from sources other than state tax funds, including all funds from federal sources, local sources and student fees. Seven SREB states (Arkansas, Maryland, Mississippi, North Carolina, Oklahoma, South Carolina and Texas) have additional local funding for two-year colleges’opera-tions, which is not reported here. The amounts include funds for medical and health programs, state-level financial aid programs for students, state funds for private colleges and universities, and state funds for coordinating or governing boards of public colleges and universities.
2 The Commonfund Higher Education Price Index (HEPI) increased by 9 percent from 2007-08 to 2012-13, by 14 percent from 2012-13 to 2017-18 and by 24 percent from 2007-08 to 2017-18.
Sources: Commonfund Institute: “Commonfund Higher Education Price Index: 2018 Update” — www.commonfund.org. Palmer, J.C., & Hines, E. R. “Grapevine table1: State fiscal support for higher education, across states and in other jurisdictions, fiscal years 2013-14, 2016-17, 2017-18, and 2018-19 (as of Jan. 30, 2019)” — https://education.illinoisstate.edu/grapevine/tables.
2017-18 to 2018-19
2014-15 to 2018-19
2017-18 to 2018-19
2014-15 to 2018-19
Table 91Appropriations of State Tax Funds for Operating Expenses Related to Higher Education1
State Appropriations (in thousands)
2018-19
Inflation-Adjusted Percent Change2
Percent Change
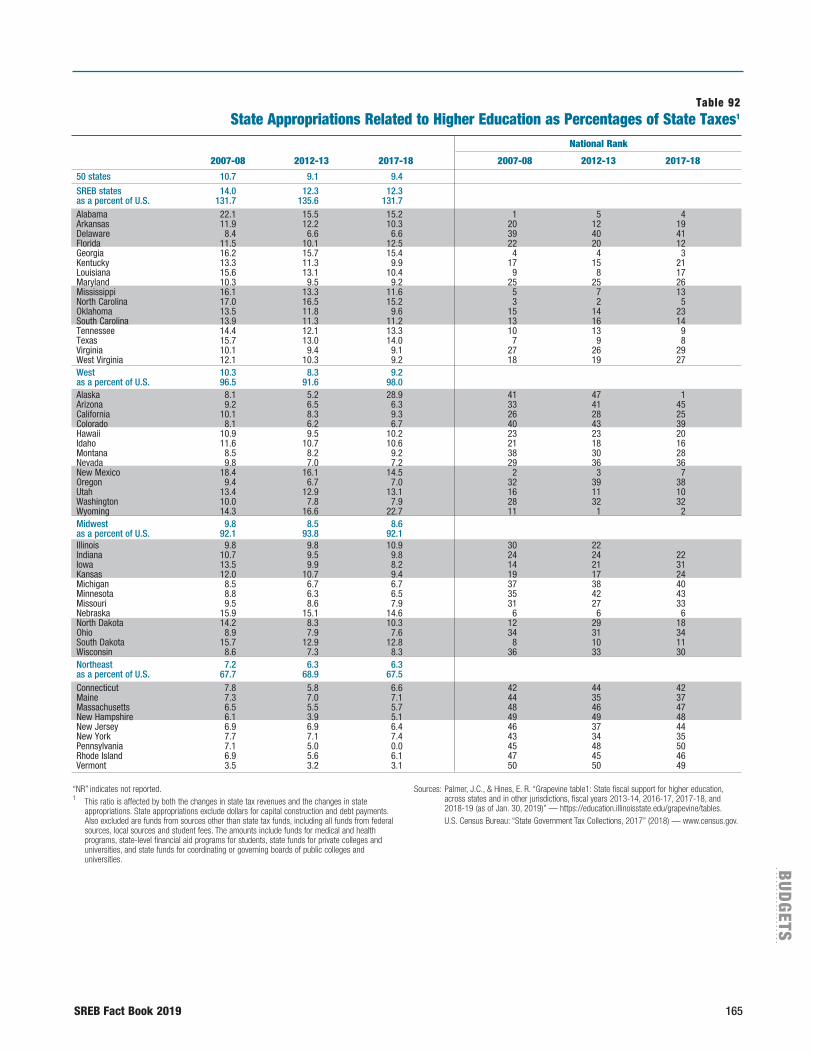
SREB Fact Book 2019 165
BU
DG
ETS
50 states 10.7 9.1 9.4
SREB states 14.0 12.3 12.3 as a percent of U.S. 131.7 135.6 131.7 Alabama 22.1 15.5 15.2 1 5 4Arkansas 11.9 12.2 10.3 20 12 19Delaware 8.4 6.6 6.6 39 40 41Florida 11.5 10.1 12.5 22 20 12Georgia 16.2 15.7 15.4 4 4 3Kentucky 13.3 11.3 9.9 17 15 21Louisiana 15.6 13.1 10.4 9 8 17Maryland 10.3 9.5 9.2 25 25 26Mississippi 16.1 13.3 11.6 5 7 13North Carolina 17.0 16.5 15.2 3 2 5Oklahoma 13.5 11.8 9.6 15 14 23South Carolina 13.9 11.3 11.2 13 16 14Tennessee 14.4 12.1 13.3 10 13 9Texas 15.7 13.0 14.0 7 9 8Virginia 10.1 9.4 9.1 27 26 29West Virginia 12.1 10.3 9.2 18 19 27West 10.3 8.3 9.2 as a percent of U.S. 96.5 91.6 98.0 Alaska 8.1 5.2 28.9 41 47 1Arizona 9.2 6.5 6.3 33 41 45California 10.1 8.3 9.3 26 28 25Colorado 8.1 6.2 6.7 40 43 39Hawaii 10.9 9.5 10.2 23 23 20Idaho 11.6 10.7 10.6 21 18 16Montana 8.5 8.2 9.2 38 30 28Nevada 9.8 7.0 7.2 29 36 36New Mexico 18.4 16.1 14.5 2 3 7Oregon 9.4 6.7 7.0 32 39 38Utah 13.4 12.9 13.1 16 11 10Washington 10.0 7.8 7.9 28 32 32Wyoming 14.3 16.6 22.7 11 1 2Midwest 9.8 8.5 8.6 as a percent of U.S. 92.1 93.8 92.1 Illinois 9.8 9.8 10.9 30 22 Indiana 10.7 9.5 9.8 24 24 22Iowa 13.5 9.9 8.2 14 21 31Kansas 12.0 10.7 9.4 19 17 24Michigan 8.5 6.7 6.7 37 38 40Minnesota 8.8 6.3 6.5 35 42 43Missouri 9.5 8.6 7.9 31 27 33Nebraska 15.9 15.1 14.6 6 6 6North Dakota 14.2 8.3 10.3 12 29 18Ohio 8.9 7.9 7.6 34 31 34South Dakota 15.7 12.9 12.8 8 10 11Wisconsin 8.6 7.3 8.3 36 33 30Northeast 7.2 6.3 6.3 as a percent of U.S. 67.7 68.9 67.5 Connecticut 7.8 5.8 6.6 42 44 42Maine 7.3 7.0 7.1 44 35 37Massachusetts 6.5 5.5 5.7 48 46 47New Hampshire 6.1 3.9 5.1 49 49 48New Jersey 6.9 6.9 6.4 46 37 44New York 7.7 7.1 7.4 43 34 35Pennsylvania 7.1 5.0 0.0 45 48 50Rhode Island 6.9 5.6 6.1 47 45 46Vermont 3.5 3.2 3.1 50 50 49
“NR” indicates not reported.1 This ratio is affected by both the changes in state tax revenues and the changes in state
appropriations. State appropriations exclude dollars for capital construction and debt payments. Also excluded are funds from sources other than state tax funds, including all funds from federal sources, local sources and student fees. The amounts include funds for medical and health programs, state-level financial aid programs for students, state funds for private colleges and universities, and state funds for coordinating or governing boards of public colleges and universities.
Sources: Palmer, J.C., & Hines, E. R. “Grapevine table1: State fiscal support for higher education, across states and in other jurisdictions, fiscal years 2013-14, 2016-17, 2017-18, and 2018-19 (as of Jan. 30, 2019)” — https://education.illinoisstate.edu/grapevine/tables. U.S. Census Bureau: “State Government Tax Collections, 2017” (2018) — www.census.gov.
2012-13 2017-182007-08 2012-13 2017-182007-08
Table 92State Appropriations Related to Higher Education as Percentages of State Taxes1
National Rank
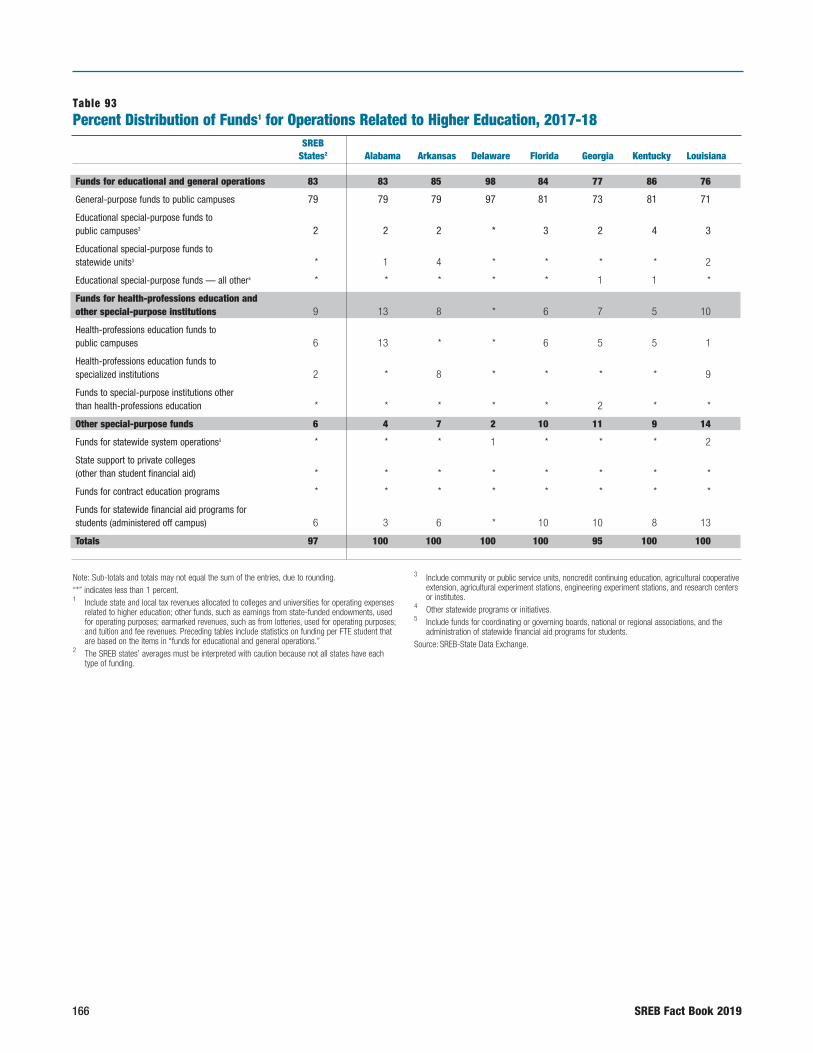
166 SREB Fact Book 2019
Note: Sub-totals and totals may not equal the sum of the entries, due to rounding.“*” indicates less than 1 percent.1 Include state and local tax revenues allocated to colleges and universities for operating expenses
related to higher education; other funds, such as earnings from state-funded endowments, used for operating purposes; earmarked revenues, such as from lotteries, used for operating purposes; and tuition and fee revenues. Preceding tables include statistics on funding per FTE student that are based on the items in “funds for educational and general operations.”
2 The SREB states’ averages must be interpreted with caution because not all states have each type of funding.
3 Include community or public service units, noncredit continuing education, agricultural cooperative extension, agricultural experiment stations, engineering experiment stations, and research centers or institutes.
4 Other statewide programs or initiatives.5 Include funds for coordinating or governing boards, national or regional associations, and the
administration of statewide financial aid programs for students.Source: SREB-State Data Exchange.
Table 93Percent Distribution of Funds1 for Operations Related to Higher Education, 2017-18
Funds for educational and general operations 83 83 85 98 84 77 86 76
General-purpose funds to public campuses 79 79 79 97 81 73 81 71
Educational special-purpose funds to public campuses3 2 2 2 * 3 2 4 3
Educational special-purpose funds to statewide units3 * 1 4 * * * * 2
Educational special-purpose funds — all other4 * * * * * 1 1 *
Funds for health-professions education and other special-purpose institutions 9 13 8 * 6 7 5 10
Health-professions education funds to public campuses 6 13 * * 6 5 5 1
Health-professions education funds to specialized institutions 2 * 8 * * * * 9
Funds to special-purpose institutions other than health-professions education * * * * * 2 * *
Other special-purpose funds 6 4 7 2 10 11 9 14
Funds for statewide system operations5 * * * 1 * * * 2
State support to private colleges (other than student financial aid) * * * * * * * *
Funds for contract education programs * * * * * * * *
Funds for statewide financial aid programs for students (administered off campus) 6 3 6 * 10 10 8 13
Totals 97 100 100 100 100 95 100 100
SREB States2 Alabama Arkansas Delaware Florida Georgia Kentucky Louisiana
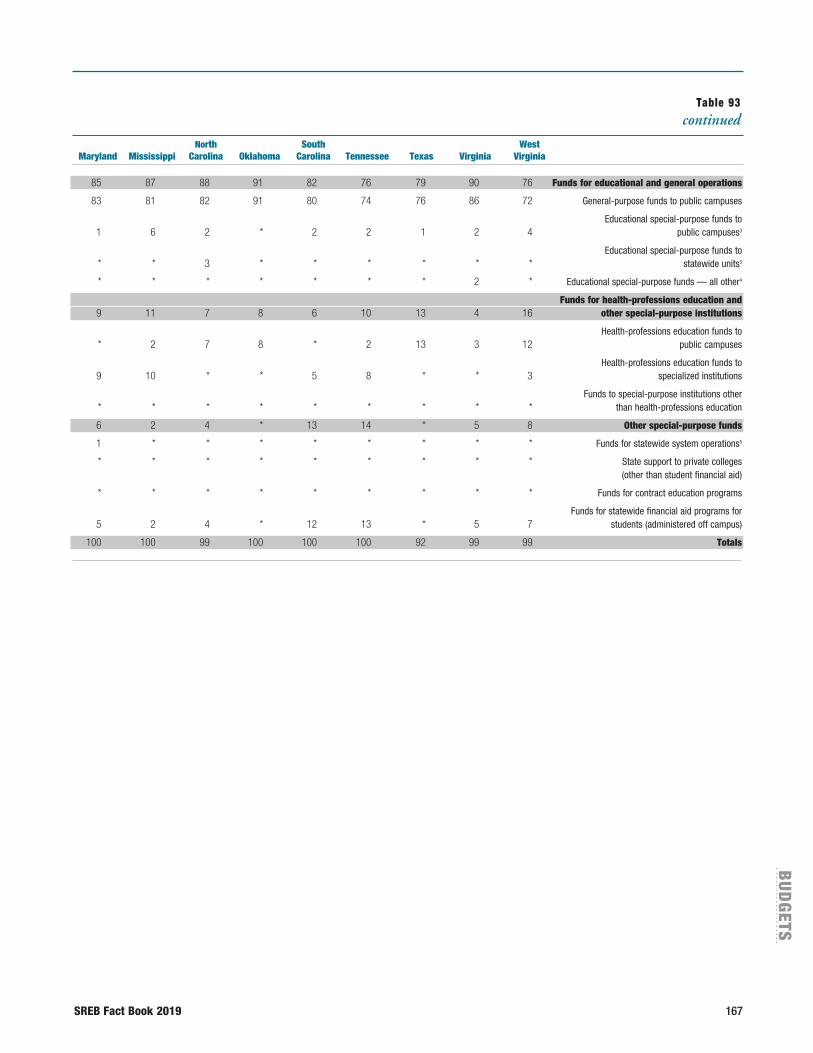
SREB Fact Book 2019 167
BU
DG
ETS
Table 93continued
85 87 88 91 82 76 79 90 76 Funds for educational and general operations
83 81 82 91 80 74 76 86 72 General-purpose funds to public campuses
Educational special-purpose funds to 1 6 2 * 2 2 1 2 4 public campuses3
Educational special-purpose funds to * * 3 * * * * * * statewide units3
* * * * * * * 2 * Educational special-purpose funds — all other4
Funds for health-professions education and 9 11 7 8 6 10 13 4 16 other special-purpose institutions
Health-professions education funds to * 2 7 8 * 2 13 3 12 public campuses
Health-professions education funds to 9 10 * * 5 8 * * 3 specialized institutions
Funds to special-purpose institutions other * * * * * * * * * than health-professions education
6 2 4 * 13 14 * 5 8 Other special-purpose funds
1 * * * * * * * * Funds for statewide system operations5
* * * * * * * * * State support to private colleges (other than student financial aid)
* * * * * * * * * Funds for contract education programs
Funds for statewide financial aid programs for 5 2 4 * 12 13 * 5 7 students (administered off campus)
100 100 99 100 100 100 92 99 99 Totals
North South West Maryland Mississippi Carolina Oklahoma Carolina Tennessee Texas Virginia Virginia

168 SREB Fact Book 2019
Table 94Percent Distribution of Revenues1 at Public Four-Year Colleges and Universities
50 states and D.C. 36.3 21.0 0.2 14.8 12.1 15.6 0.7 1.3 0.1 -3.86 0.42 -3.9
SREB states 34.4 22.8 * 14.3 12.9 15.5 1.2 -2.0 -0.1 -3.7 * 4.5Alabama 42.8 20.0 0.0 15.4 6.9 14.9 6.1 -3.4 0.0 -2.0 -0.8 *Arkansas 35.6 25.2 0.3 14.0 16.0 8.9 6.2 -2.2 * -5.8 -1.0 2.8Delaware 40.8 28.4 0.0 23.1 0.0 7.7 -14.8 12.0 0.0 7.4 -11.6 7.1Florida 31.5 30.8 0.0 16.3 18.0 3.4 0.8 3.0 0.0 -3.6 0.4 -0.6Georgia 36.6 27.3 0.0 19.3 11.6 5.2 1.2 1.2 0.0 -3.4 0.4 0.5Kentucky 39.4 18.3 0.6 13.7 10.8 17.2 3.6 -4.8 0.1 -3.5 -0.3 4.8Louisiana 40.0 19.0 0.0 12.9 21.9 6.3 9.5 -7.9 0.0 -4.2 5.5 -2.9Maryland 34.9 27.7 0.0 17.4 9.9 10.1 * 1.5 0.0 -3.4 -0.2 2.0Mississippi 38.1 27.8 0.0 17.9 8.6 7.6 8.9 -3.3 0.0 -5.0 -0.9 0.2North Carolina 29.5 32.6 0.0 17.0 12.1 8.8 2.7 -4.1 0.0 -3.3 0.2 4.5Oklahoma 38.5 19.7 0.1 13.3 16.9 11.5 6.1 -7.1 0.1 -2.0 0.8 2.1South Carolina 49.5 12.5 * 12.4 15.2 10.5 1.8 0.9 0.0 -3.7 0.9 0.1Tennessee 38.3 24.8 0.2 13.6 15.0 8.1 2.4 1.3 * -4.8 -0.7 1.8Texas 25.8 18.6 0.0 11.4 12.8 31.5 -1.9 -3.1 -0.1 -3.8 -0.9 9.9Virginia 42.1 19.4 0.0 14.0 8.7 15.9 -0.8 -1.2 0.0 -4.1 -0.4 6.5West Virginia 46.8 19.8 0.0 12.3 15.3 5.8 6.0 -4.9 0.0 -3.3 2.5 -0.3West 34.9 18.1 0.3 17.8 13.5 15.5 1.2 1.2 0.3 -4.5 1.1 0.7Alaska 21.6 44.8 0.0 21.3 8.4 3.9 2.4 -0.7 0.0 9.3 -0.9 -10.2Arizona 53.0 12.7 * 15.4 10.3 8.6 7.6 -5.3 0.0 -6.4 0.9 3.3California 31.6 19.7 0.0 15.7 13.6 19.3 0.6 3.0 0.0 -3.5 0.7 -0.8Colorado 48.3 0.5 0.9 22.0 18.6 9.7 2.4 0.1 0.9 -5.4 2.0 0.2Hawaii 28.7 25.8 0.0 22.7 20.5 2.3 1.4 2.5 0.0 -7.2 3.6 -0.2Idaho 37.1 33.2 0.0 15.6 9.6 4.5 0.7 5.0 0.0 -5.7 * *Montana 37.9 23.2 * 19.9 8.1 10.9 -1.0 2.5 0.0 -3.8 1.1 1.2Nevada 33.3 28.2 0.0 14.8 10.9 12.8 -2.5 -2.5 0.0 -3.6 2.1 6.5New Mexico 19.6 28.5 5.3 21.8 11.6 13.2 1.9 1.8 5.3 -2.1 1.7 -8.6Oregon 37.4 13.9 0.3 21.7 16.1 10.4 -1.3 1.9 0.1 -6.2 4.8 0.7Utah 30.2 22.5 0.0 18.1 10.0 19.1 -0.1 -0.5 0.0 -6.6 -0.3 7.5Washington 33.4 13.9 0.0 23.1 13.1 16.5 -2.0 2.4 0.0 -8.2 1.2 6.5Wyoming 16.0 41.7 0.0 10.9 14.6 16.8 0.8 -4.5 0.0 2.3 -0.7 2.1Midwest 39.2 16.8 0.1 13.6 10.8 19.5 -0.6 -3.2 * -4.2 0.6 7.4Illinois 31.6 6.9 0.0 12.4 6.9 42.2 -0.3 -11.8 0.0 -3.3 0.2 15.3Indiana 45.2 20.4 0.1 13.0 9.3 12.0 1.4 -1.3 -0.1 -2.8 1.0 1.8Iowa 38.4 20.3 0.0 17.6 10.2 13.4 4.0 -0.7 0.0 -4.8 1.6 -0.1Kansas 37.0 22.7 1.7 15.3 10.0 13.3 5.7 -2.2 0.7 -3.3 -0.4 -0.5Michigan 41.8 12.1 0.0 15.2 8.2 22.8 -6.0 -2.6 0.0 -5.7 0.2 14.2Minnesota 34.9 21.7 0.0 13.7 20.5 9.2 -1.0 0.6 0.0 -4.0 2.5 2.0Missouri 45.5 23.1 0.0 11.3 8.6 11.6 1.8 -1.5 0.0 -3.2 -1.1 3.9Nebraska 27.8 30.2 0.0 13.9 19.4 8.7 0.6 -1.3 0.0 -4.3 3.5 1.6North Dakota 35.7 29.5 0.6 14.1 8.2 11.9 0.9 2.2 0.2 -5.7 -0.4 2.8Ohio 46.4 17.7 0.0 10.6 10.3 15.0 -3.3 -1.5 0.0 -5.2 -0.1 10.1South Dakota 38.5 25.8 0.0 15.1 9.4 11.2 4.8 3.4 0.0 -9.4 3.0 -1.7Wisconsin 32.0 15.7 0.0 16.0 17.5 18.7 1.3 -2.5 0.0 -3.0 2.7 1.5Northeast 40.1 30.0 0.4 11.8 9.5 8.1 1.3 -0.4 * -2.6 -0.3 2.0Connecticut 37.5 38.8 0.0 9.6 5.5 8.5 0.7 1.9 0.0 -2.5 -0.6 0.5Maine 41.6 28.4 0.0 12.6 7.5 9.9 0.9 1.5 0.0 -2.6 -1.9 2.2Massachusetts 39.1 26.0 0.0 12.1 6.3 16.5 2.0 2.5 0.0 -3.3 -0.6 -0.6New Hampshire 63.2 10.2 0.0 11.9 7.8 7.0 1.6 2.9 0.0 -1.8 -1.9 -0.8New Jersey 44.2 25.1 0.0 11.2 11.6 7.9 2.0 -2.9 0.0 -2.4 0.1 3.4New York 31.5 37.8 1.1 12.5 11.4 5.6 1.8 -1.4 * -2.6 -0.2 2.3Pennsylvania 55.9 22.8 0.0 8.8 7.6 4.9 0.5 0.4 0.0 -1.5 -0.5 1.0Rhode Island 57.9 19.6 0.0 15.9 5.8 0.8 3.5 2.6 0.0 -3.9 -1.8 -0.4Vermont 56.9 7.3 0.0 15.2 9.7 10.9 -2.6 -1.8 0.0 -5.7 1.9 8.2District of Columbia 24.0 51.4 0.0 15.0 4.5 5.1 3.9 4.1 0.0 -1.9 -5.1 -0.9
“*” indicates less than 0.05.1 Educational and general operating revenues consist of total revenues for current operations minus
revenues from auxiliary enterprises, hospitals and independent operations. Auxiliary enterprises are essentially self-supporting operations that exist to furnish a service to students, faculty or staff and that charge a fee that is directly related to, although not necessarily equal to, the cost of the service. Examples are residence halls, food services, college stores and intercollegiate athletics. Independent operations are essentially independent institutes or centers affiliated with a college or university, such as a formally designated Federally Funded Research and Development Center.
2 Includes state and local government contracts and grants and private gifts and grants.
3 Includes federal appropriations (other than contracts and grants), sales of educational activities and services, endowment and investment income, and other sources.
Source: SREB analysis of National Center for Education Statistics finance survey — www.nces.ed.gov/ipeds.
2016-17 Percentage-Point Change, 2011-12 to 2016-17
All Other3
Appropriations Contracts and GrantsTuition
and Fees State Local Federal Other2
All Other3
Appropriations Contracts and GrantsTuition
and Fees State Local Federal Other2

SREB Fact Book 2019 169
BU
DG
ETS
Table 95Percent Distribution of Revenues1 at Public Two-Year Colleges
50 states and D.C. 26.7 25.0 18.0 17.7 8.5 4.2 -1.4 2.3 2.9 -6.8 2.5 0.5
SREB states 29.7 28.4 13.2 20.9 5.2 2.5 0.3 2.7 3.7 -7.2 0.7 -0.2Alabama 32.2 35.9 0.4 25.4 4.6 1.6 0.9 6.5 0.2 -6.4 1.5 -2.7Arkansas 26.5 34.2 5.4 24.6 8.0 1.4 2.2 4.4 1.0 -9.4 1.5 0.2Delaware 35.8 39.4 0.0 13.3 11.5 0.0 2.7 4.1 0.0 -4.6 2.9 -5.1Florida 30.4 36.5 0.0 24.9 6.4 1.8 -1.7 6.8 0.0 -6.6 0.9 0.5Georgia 40.2 27.5 0.0 25.3 5.2 1.8 10.3 -1.2 0.0 -8.0 2.1 -3.2Kentucky 37.0 20.8 0.0 30.1 9.6 2.6 4.3 -0.3 0.0 -2.6 2.9 -4.3Louisiana 41.1 20.9 0.0 32.0 4.1 2.0 9.8 -5.9 0.0 -3.1 0.5 -1.3Maryland 30.7 21.3 27.5 13.2 2.9 4.3 -2.6 2.6 4.9 -4.7 -0.7 0.6Mississippi 24.8 29.8 8.4 26.0 8.8 2.3 4.4 3.4 1.4 -11.4 1.4 0.7North Carolina 18.1 46.0 11.1 19.8 3.2 1.8 -1.0 6.0 1.9 -7.1 -0.2 0.5Oklahoma 29.0 24.9 10.1 24.7 5.1 6.1 3.0 -3.0 2.1 -2.3 0.9 -0.7South Carolina 40.6 16.9 7.5 20.6 12.3 2.1 0.3 6.1 1.2 -9.7 2.4 -0.3Tennessee 35.5 29.0 0.0 20.1 13.4 1.9 -1.8 4.0 0.0 -8.3 5.5 0.6Texas 26.4 20.1 30.3 17.5 2.9 2.7 0.4 -0.2 5.4 -6.7 0.1 1.0Virginia 43.1 32.2 0.2 19.6 1.9 3.0 -0.1 7.5 * -5.2 * -2.2West Virginia 28.8 27.8 0.0 23.2 9.9 10.3 2.9 1.6 -0.4 -1.7 -0.6 -1.8West 18.5 23.7 22.7 15.7 13.3 6.2 -2.2 -1.8 3.7 -6.7 5.5 1.5Alaska NA NA NA NA NA NA NA NA NA NA NA NAArizona 22.9 3.2 49.9 18.6 3.0 2.5 -1.6 -1.2 7.5 -5.6 0.1 0.8California 12.9 24.8 26.3 14.9 15.1 6.2 -1.2 -4.8 3.7 -6.9 7.8 1.4Colorado 54.2 1.4 7.0 16.5 11.8 9.1 1.4 -0.3 -3.1 -7.1 5.0 4.2Hawaii 23.3 39.0 0.0 16.3 19.1 2.4 -2.5 2.6 0.0 -5.2 4.9 0.2Idaho 26.1 27.9 13.0 20.5 5.5 7.1 -4.7 12.2 6.1 -16.8 1.2 2.0Montana 18.7 22.1 8.6 37.5 4.7 8.4 -1.6 5.4 2.2 -6.0 0.4 -0.3Nevada 30.6 42.5 0.0 19.6 2.8 4.5 1.2 1.0 0.0 -4.7 0.4 2.1New Mexico 14.4 29.9 24.3 21.5 4.4 5.6 0.2 3.5 5.6 -5.7 -2.2 -1.4Oregon 26.9 18.4 22.1 18.3 8.7 5.7 -1.6 -1.2 6.5 -5.4 3.3 -1.6Utah 35.1 45.1 0.0 14.6 2.0 3.3 -1.9 10.7 0.0 -8.8 0.1 -0.1Washington 27.9 29.5 0.0 13.1 20.5 9.0 -2.8 1.1 0.0 -5.0 2.6 4.1Wyoming 16.2 40.6 15.6 10.9 9.4 7.3 0.2 -0.2 -0.5 -4.8 2.2 3.0Midwest 28.2 23.5 21.4 15.7 7.3 3.8 -2.0 7.0 0.4 -7.5 1.6 0.6Illinois 23.9 13.1 31.8 12.3 15.6 3.4 -2.6 2.8 2.8 -6.5 3.5 0.1Indiana 32.6 39.4 0.0 18.7 7.5 1.8 1.0 12.5 0.0 -12.6 -0.7 -0.2Iowa 29.3 24.8 14.9 15.7 4.8 10.5 -2.0 5.5 3.1 -8.6 -0.6 2.7Kansas 24.2 19.7 32.4 14.3 3.1 6.3 * 1.2 2.7 -7.1 0.4 2.8Michigan 31.2 19.1 27.1 15.8 3.1 3.7 -0.8 6.1 3.1 -9.7 0.6 0.6Minnesota 37.8 34.9 0.0 18.8 6.7 1.8 -5.7 7.9 0.0 -4.8 2.6 0.1Missouri 30.0 19.2 18.8 23.6 4.8 3.6 0.3 5.0 3.7 -9.8 -0.6 1.5Nebraska 18.5 23.2 39.3 13.8 2.0 3.2 -3.5 1.9 8.8 -7.4 0.3 -0.1North Dakota 26.2 31.3 0.0 24.0 8.7 9.7 -1.5 3.3 0.0 -3.5 1.2 0.4Ohio 36.6 30.5 9.8 17.4 2.8 3.0 -0.6 6.5 1.8 -8.7 0.7 0.4South Dakota 34.8 12.3 0.0 32.5 14.7 5.7 -7.5 -2.7 0.0 6.4 0.4 3.4Wisconsin 18.3 33.2 27.5 12.8 5.9 2.2 -1.7 25.4 -20.7 -3.8 1.4 -0.6Northeast 36.5 22.1 12.7 17.7 7.2 3.8 -0.4 2.9 1.4 -3.8 0.5 -0.6Connecticut 31.3 46.3 0.0 16.1 3.6 2.7 -3.1 5.3 0.0 -1.5 -1.1 0.4Maine 28.4 37.0 0.0 24.4 7.6 2.6 1.5 6.0 0.0 -3.4 -5.2 1.1Massachusetts 37.3 35.6 0.0 18.0 6.6 2.5 -1.7 5.9 0.0 -4.8 0.7 -0.1New Hampshire 47.7 32.4 0.0 13.7 2.6 3.6 -7.1 7.8 0.0 -2.7 0.1 1.9New Jersey 44.7 9.8 15.2 20.5 5.7 4.0 1.7 0.9 2.5 -3.0 -0.1 -1.9New York 32.1 18.4 19.7 16.2 9.8 3.8 -0.1 1.5 2.1 -4.2 1.2 -0.5Pennsylvania 41.6 20.5 9.4 18.7 4.1 5.7 0.8 1.9 0.6 -3.3 0.2 -0.2Rhode Island 36.9 35.9 0.0 19.6 4.8 2.8 -1.0 3.8 0.0 -2.0 2.8 -3.6Vermont 58.6 13.0 0.0 23.5 3.9 0.9 -0.6 2.1 0.0 -4.3 2.9 -0.1District of Columbia NA NA NA NA NA NA NA NA NA NA NA NA
“*” indicates less than 0.05 percent.“NA” indicates not applicable. There was no institution of this type in the state during the specified time.1 Educational and general operating revenues consist of total revenues for current operations minus
revenues from auxiliary enterprises, hospitals and independent operations. Auxiliary enterprises are essentially self-supporting operations that exist to furnish a service to students, faculty or staff and that charge a fee that is directly related to, although not necessarily equal to, the cost of the service. Examples are residence halls, food services, college stores and intercollegiate athletics. Independent operations are essentially independent institutes or centers affiliated with a college or university, such as a formally designated Federally Funded Research and Development Center.
2 Includes state and local government contracts and grants and private gifts and grants.3 Includes federal appropriations (other than contracts and grants), sales of educational activities
and services, endowment and investment income, and other sources. Source: SREB analysis of National Center for Education Statistics finance survey — www.nces.ed.gov/ipeds.
2016-17 Percentage-Point Change, 2011-12 to 2016-17
All Other3
Appropriations Contracts and GrantsTuition
and Fees State Local Federal Other2
All Other3
Appropriations Contracts and GrantsTuition
and Fees State Local Federal Other2

170 SREB Fact Book 2019
Table 96Percent Distribution of Spending1 at Public Four-Year Colleges and Universities
50 states and D.C. 35.5 15.3 6.1 25.2 14.0 4.0 -0.5 -2.0 -0.4 0.7 -0.1 2.3
SREB states 35.0 15.9 6.8 24.1 14.5 3.6 -0.8 -1.2 -0.3 1.0 0.1 1.2Alabama 32.2 13.1 8.4 29.1 16.4 0.8 -1.9 -1.2 -0.7 1.2 2.8 -0.1Arkansas 31.3 13.0 8.2 26.2 17.8 3.5 0.9 0.2 -3.5 2.0 -1.2 1.7Delaware 39.6 9.3 2.2 30.5 18.4 0.0 1.0 -5.5 -2.8 9.5 4.3 -6.5Florida 31.4 17.5 9.4 22.8 15.6 3.4 -1.1 -0.7 2.4 1.8 -1.4 -1.0Georgia 32.0 23.5 5.6 25.8 12.0 1.1 -0.7 0.1 -1.0 1.4 -0.4 0.6Kentucky 27.2 11.6 20.2 24.6 15.6 0.7 -2.1 -2.1 1.3 1.6 1.1 0.1Louisiana 34.6 13.9 12.3 24.9 14.5 -0.2 0.3 -2.5 0.3 1.8 1.9 -1.9Maryland 31.3 22.2 3.6 28.9 10.0 3.9 -0.8 -2.9 -0.8 1.6 0.3 2.6Mississippi 32.0 16.5 7.4 24.4 18.8 1.0 0.3 -0.4 -0.3 -0.4 2.7 -2.0North Carolina 39.4 16.2 5.4 23.2 14.8 0.9 -2.0 0.3 -0.5 2.1 -0.1 0.2Oklahoma 39.9 12.9 5.9 21.0 17.2 3.1 -0.6 -0.3 -2.0 -1.1 1.1 2.8South Carolina 35.6 15.2 7.0 23.5 17.6 1.2 -0.4 -1.7 0.3 1.0 0.1 0.7Tennessee 39.4 10.2 6.2 25.0 17.3 1.9 1.5 -1.0 -1.2 0.9 -2.1 1.9Texas 37.4 15.2 4.3 22.2 12.4 8.5 -0.6 -2.0 -0.5 0.3 -0.1 3.0Virginia 38.9 17.8 3.8 24.2 14.6 0.8 -0.2 -1.6 -0.1 0.8 1.0 0.2West Virginia 32.3 9.2 5.3 22.9 16.7 13.7 -4.9 -3.2 -1.7 -3.0 1.6 11.1West 33.3 17.2 5.2 24.9 13.7 5.6 -0.2 -3.9 -0.3 1.1 -1.0 4.4Alaska 33.0 21.7 7.8 29.1 6.1 2.4 -1.1 -1.2 1.9 0.3 -0.2 0.2Arizona 30.3 15.2 3.2 26.1 18.9 6.3 -2.9 -4.8 -1.4 1.7 1.4 6.0California 33.1 17.1 2.1 26.6 15.0 6.1 * -3.4 -0.4 0.2 -1.5 5.1Colorado 35.2 18.6 4.3 20.5 10.9 10.5 -2.8 -4.9 -2.6 1.4 -1.1 10.0Hawaii 35.7 21.6 5.5 17.4 11.0 8.8 3.2 -11.7 1.3 -0.4 0.9 6.8Idaho 37.9 12.8 5.9 25.0 14.1 4.3 0.3 -2.4 -0.2 3.0 -2.9 2.2Montana 30.9 21.9 7.5 25.6 12.4 1.5 0.5 -0.9 1.4 * -2.1 1.1Nevada 40.9 9.9 5.4 29.5 12.5 1.8 -2.3 -0.6 -0.6 3.4 -0.5 0.6New Mexico 24.8 17.4 25.0 13.7 10.1 9.0 -0.1 -4.4 4.4 -0.5 -1.3 1.9Oregon 33.4 17.1 7.6 28.7 9.7 3.4 -0.6 -4.4 0.3 4.0 -1.0 1.7Utah 27.3 13.3 25.2 20.6 10.6 3.0 0.1 -1.9 1.8 1.0 -2.2 1.2Washington 40.0 20.5 2.0 24.0 12.7 0.7 2.8 -5.7 0.1 2.9 -0.4 0.2Wyoming 33.7 15.4 8.2 22.6 11.5 8.6 -3.7 -5.0 0.2 0.2 -0.3 8.6Midwest 36.5 15.4 6.6 25.0 13.2 3.4 -0.7 -1.7 -0.4 0.4 0.2 2.2Illinois 39.2 12.2 8.6 25.7 13.9 0.3 0.9 -1.9 -1.5 1.7 1.1 -0.2Indiana 43.4 10.6 6.0 25.3 14.4 0.3 0.2 -1.0 -1.1 1.8 0.3 -0.2Iowa 30.2 22.2 8.1 24.9 12.8 1.8 -1.9 -1.0 -0.3 0.3 1.7 1.3Kansas 38.2 21.0 6.6 21.7 9.4 3.0 2.8 -1.3 -0.6 -3.3 0.2 2.2Michigan 34.9 16.0 6.5 22.5 14.7 5.4 -2.6 -2.3 0.1 -0.5 0.3 4.9Minnesota 26.9 19.1 6.7 28.8 10.4 8.1 -2.4 -2.0 -0.6 -1.4 -0.8 7.1Missouri 40.2 7.7 7.5 24.0 18.5 2.1 -0.7 -1.7 0.2 0.5 0.3 1.4Nebraska 35.8 19.9 6.2 20.7 11.7 5.8 -0.7 -1.2 -2.1 0.2 -0.2 4.0North Dakota 41.5 16.6 7.3 25.7 6.9 1.9 * -3.8 -0.5 4.4 -1.5 1.5Ohio 39.7 12.1 5.0 27.5 14.3 1.5 -0.4 -1.5 0.8 1.4 -0.7 0.4South Dakota 35.9 13.6 7.3 31.6 10.7 0.9 2.8 -2.4 -1.0 3.5 -1.2 -1.7Wisconsin 30.0 24.3 5.5 23.2 8.5 8.5 -1.0 -0.9 -0.9 -0.9 0.4 3.2Northeast 39.4 9.0 4.8 29.6 14.4 2.8 0.2 -1.8 -0.3 * 0.7 1.2Connecticut 37.7 7.0 4.0 25.6 13.2 12.5 -0.7 -1.7 -2.1 -6.9 -0.4 11.8Maine 29.6 11.9 9.4 31.2 18.0 0.0 -2.1 -0.3 -1.0 2.2 1.4 -0.2Massachusetts 34.5 13.3 12.1 26.8 11.4 2.0 1.0 -2.0 -1.6 0.5 1.6 0.4New Hampshire 35.4 15.3 1.3 25.7 21.6 0.7 -0.8 -6.8 * 3.0 3.9 0.6New Jersey 35.4 10.7 5.9 31.9 13.1 3.0 -5.4 -3.3 1.3 5.5 0.1 1.8New York 44.6 7.2 2.0 29.5 15.0 1.7 3.2 -1.1 -0.4 -1.6 1.0 -1.1Pennsylvania 45.8 0.4 2.5 36.7 14.6 0.0 1.5 -0.1 0.3 -0.1 -1.6 *Rhode Island 30.3 15.8 1.8 29.1 23.1 0.0 1.7 -3.5 -0.2 -1.1 3.0 0.0Vermont 30.7 11.6 9.8 27.1 17.5 3.3 -1.3 -1.6 0.4 -1.9 2.0 2.5District of Columbia 27.7 3.6 1.7 35.4 14.3 17.3 -13.2 -1.3 -1.3 5.3 -2.5 13.0
“*” indicates less than 0.05 percent or percentage-point change. 1 Educational and general operating spending consists of current operating spending minus the
spending of auxiliary enterprises, hospitals and independent operations. Auxiliary enterprises are essentially self-supporting operations that exist to furnish a service to students, faculty or staff and that charge a fee that is directly related to, although not necessarily equal to, the cost of the service. Examples are residence halls, food services, college stores and intercollegiate athletics. Independent operations are essentially independent institutes or centers affiliated with a college or university, such as a formally designated Federally Funded Research and Development Center.
2 Starting with the 2013 Fact Book, amounts for operation/maintenance of plant, depreciation, interest and some other non-operating expenditures formerly reported in “All Other” are distribut-ed across instruction, research and public service.
3 Includes academic support (such as libraries), student services (such as counseling and placement centers) and institutional support (such as the general administrative offices).
Source: SREB analysis of National Center for Education Statistics finance survey — www.nces.ed.gov/ipeds.
2016-17 Percentage-Point Change, 2011-12 to 2016-17
All Other2
Instruction2
Research2
Public
Service2
Academic and
Administrative Support3
Scholarships and
FellowshipsAll
Other2
Instruction2
Research2
Public
Service2
Academic and
Administrative Support3
Scholarships and
Fellowships
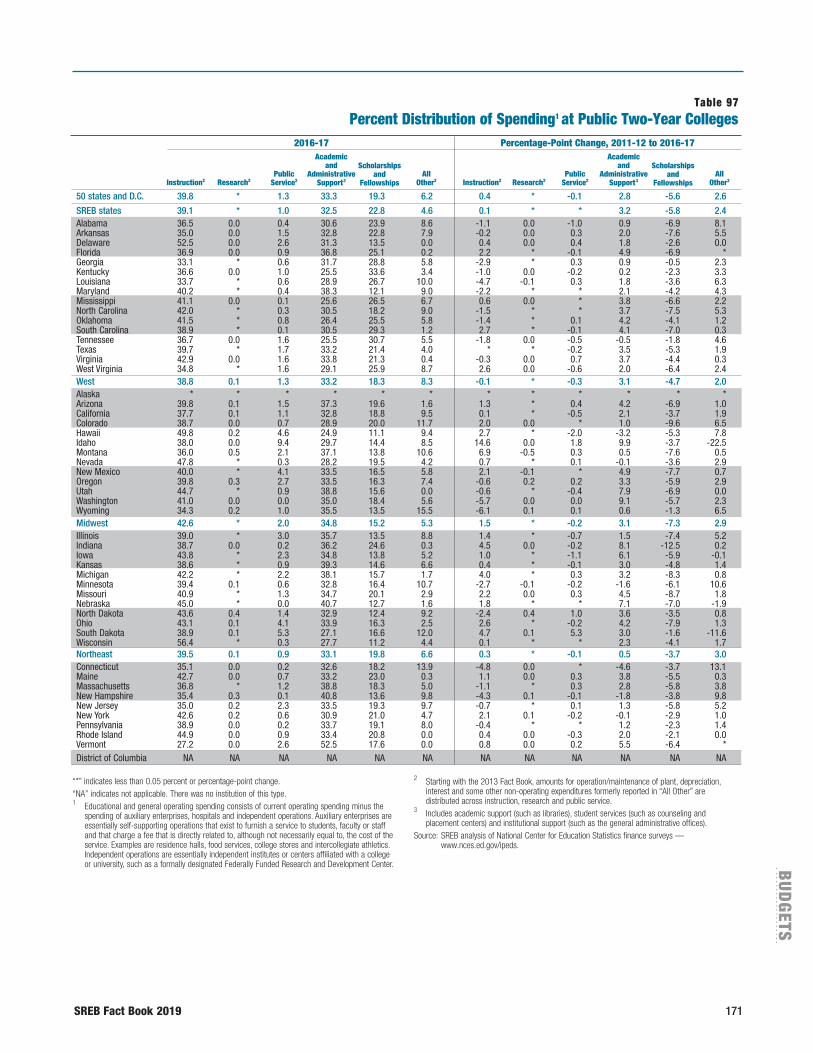
SREB Fact Book 2019 171
BU
DG
ETS
Table 97Percent Distribution of Spending1 at Public Two-Year Colleges
50 states and D.C. 39.8 * 1.3 33.3 19.3 6.2 0.4 * -0.1 2.8 -5.6 2.6
SREB states 39.1 * 1.0 32.5 22.8 4.6 0.1 * * 3.2 -5.8 2.4Alabama 36.5 0.0 0.4 30.6 23.9 8.6 -1.1 0.0 -1.0 0.9 -6.9 8.1Arkansas 35.0 0.0 1.5 32.8 22.8 7.9 -0.2 0.0 0.3 2.0 -7.6 5.5Delaware 52.5 0.0 2.6 31.3 13.5 0.0 0.4 0.0 0.4 1.8 -2.6 0.0Florida 36.9 0.0 0.9 36.8 25.1 0.2 2.2 * -0.1 4.9 -6.9 *Georgia 33.1 * 0.6 31.7 28.8 5.8 -2.9 * 0.3 0.9 -0.5 2.3Kentucky 36.6 0.0 1.0 25.5 33.6 3.4 -1.0 0.0 -0.2 0.2 -2.3 3.3Louisiana 33.7 * 0.6 28.9 26.7 10.0 -4.7 -0.1 0.3 1.8 -3.6 6.3Maryland 40.2 * 0.4 38.3 12.1 9.0 -2.2 * * 2.1 -4.2 4.3Mississippi 41.1 0.0 0.1 25.6 26.5 6.7 0.6 0.0 * 3.8 -6.6 2.2North Carolina 42.0 * 0.3 30.5 18.2 9.0 -1.5 * * 3.7 -7.5 5.3Oklahoma 41.5 * 0.8 26.4 25.5 5.8 -1.4 * 0.1 4.2 -4.1 1.2South Carolina 38.9 * 0.1 30.5 29.3 1.2 2.7 * -0.1 4.1 -7.0 0.3Tennessee 36.7 0.0 1.6 25.5 30.7 5.5 -1.8 0.0 -0.5 -0.5 -1.8 4.6Texas 39.7 * 1.7 33.2 21.4 4.0 * * -0.2 3.5 -5.3 1.9Virginia 42.9 0.0 1.6 33.8 21.3 0.4 -0.3 0.0 0.7 3.7 -4.4 0.3West Virginia 34.8 * 1.6 29.1 25.9 8.7 2.6 0.0 -0.6 2.0 -6.4 2.4West 38.8 0.1 1.3 33.2 18.3 8.3 -0.1 * -0.3 3.1 -4.7 2.0Alaska * * * * * * * * * * * *Arizona 39.8 0.1 1.5 37.3 19.6 1.6 1.3 * 0.4 4.2 -6.9 1.0California 37.7 0.1 1.1 32.8 18.8 9.5 0.1 * -0.5 2.1 -3.7 1.9Colorado 38.7 0.0 0.7 28.9 20.0 11.7 2.0 0.0 * 1.0 -9.6 6.5Hawaii 49.8 0.2 4.6 24.9 11.1 9.4 2.7 * -2.0 -3.2 -5.3 7.8Idaho 38.0 0.0 9.4 29.7 14.4 8.5 14.6 0.0 1.8 9.9 -3.7 -22.5Montana 36.0 0.5 2.1 37.1 13.8 10.6 6.9 -0.5 0.3 0.5 -7.6 0.5Nevada 47.8 * 0.3 28.2 19.5 4.2 0.7 * 0.1 -0.1 -3.6 2.9New Mexico 40.0 * 4.1 33.5 16.5 5.8 2.1 -0.1 * 4.9 -7.7 0.7Oregon 39.8 0.3 2.7 33.5 16.3 7.4 -0.6 0.2 0.2 3.3 -5.9 2.9Utah 44.7 * 0.9 38.8 15.6 0.0 -0.6 * -0.4 7.9 -6.9 0.0Washington 41.0 0.0 0.0 35.0 18.4 5.6 -5.7 0.0 0.0 9.1 -5.7 2.3Wyoming 34.3 0.2 1.0 35.5 13.5 15.5 -6.1 0.1 0.1 0.6 -1.3 6.5Midwest 42.6 * 2.0 34.8 15.2 5.3 1.5 * -0.2 3.1 -7.3 2.9Illinois 39.0 * 3.0 35.7 13.5 8.8 1.4 * -0.7 1.5 -7.4 5.2Indiana 38.7 0.0 0.2 36.2 24.6 0.3 4.5 0.0 -0.2 8.1 -12.5 0.2Iowa 43.8 * 2.3 34.8 13.8 5.2 1.0 * -1.1 6.1 -5.9 -0.1Kansas 38.6 * 0.9 39.3 14.6 6.6 0.4 * -0.1 3.0 -4.8 1.4Michigan 42.2 * 2.2 38.1 15.7 1.7 4.0 * 0.3 3.2 -8.3 0.8Minnesota 39.4 0.1 0.6 32.8 16.4 10.7 -2.7 -0.1 -0.2 -1.6 -6.1 10.6Missouri 40.9 * 1.3 34.7 20.1 2.9 2.2 0.0 0.3 4.5 -8.7 1.8Nebraska 45.0 * 0.0 40.7 12.7 1.6 1.8 * * 7.1 -7.0 -1.9North Dakota 43.6 0.4 1.4 32.9 12.4 9.2 -2.4 0.4 1.0 3.6 -3.5 0.8Ohio 43.1 0.1 4.1 33.9 16.3 2.5 2.6 * -0.2 4.2 -7.9 1.3South Dakota 38.9 0.1 5.3 27.1 16.6 12.0 4.7 0.1 5.3 3.0 -1.6 -11.6Wisconsin 56.4 * 0.3 27.7 11.2 4.4 0.1 * * 2.3 -4.1 1.7Northeast 39.5 0.1 0.9 33.1 19.8 6.6 0.3 * -0.1 0.5 -3.7 3.0Connecticut 35.1 0.0 0.2 32.6 18.2 13.9 -4.8 0.0 * -4.6 -3.7 13.1Maine 42.7 0.0 0.7 33.2 23.0 0.3 1.1 0.0 0.3 3.8 -5.5 0.3Massachusetts 36.8 * 1.2 38.8 18.3 5.0 -1.1 * 0.3 2.8 -5.8 3.8New Hampshire 35.4 0.3 0.1 40.8 13.6 9.8 -4.3 0.1 -0.1 -1.8 -3.8 9.8New Jersey 35.0 0.2 2.3 33.5 19.3 9.7 -0.7 * 0.1 1.3 -5.8 5.2New York 42.6 0.2 0.6 30.9 21.0 4.7 2.1 0.1 -0.2 -0.1 -2.9 1.0Pennsylvania 38.9 0.0 0.2 33.7 19.1 8.0 -0.4 * * 1.2 -2.3 1.4Rhode Island 44.9 0.0 0.9 33.4 20.8 0.0 0.4 0.0 -0.3 2.0 -2.1 0.0Vermont 27.2 0.0 2.6 52.5 17.6 0.0 0.8 0.0 0.2 5.5 -6.4 *District of Columbia NA NA NA NA NA NA NA NA NA NA NA NA
“*” indicates less than 0.05 percent or percentage-point change.“NA” indicates not applicable. There was no institution of this type.1 Educational and general operating spending consists of current operating spending minus the
spending of auxiliary enterprises, hospitals and independent operations. Auxiliary enterprises are essentially self-supporting operations that exist to furnish a service to students, faculty or staff and that charge a fee that is directly related to, although not necessarily equal to, the cost of the service. Examples are residence halls, food services, college stores and intercollegiate athletics. Independent operations are essentially independent institutes or centers affiliated with a college or university, such as a formally designated Federally Funded Research and Development Center.
2 Starting with the 2013 Fact Book, amounts for operation/maintenance of plant, depreciation, interest and some other non-operating expenditures formerly reported in “All Other” are distributed across instruction, research and public service.
3 Includes academic support (such as libraries), student services (such as counseling and placement centers) and institutional support (such as the general administrative offices).
Source: SREB analysis of National Center for Education Statistics finance surveys — www.nces.ed.gov/ipeds.
2016-17 Percentage-Point Change, 2011-12 to 2016-17
All Other2
Instruction2
Research2
Public
Service2
Academic and
Administrative Support3
Scholarships and
FellowshipsAll
Other2
Instruction2
Research2
Public
Service2
Academic and
Administrative Support3
Scholarships and
Fellowships
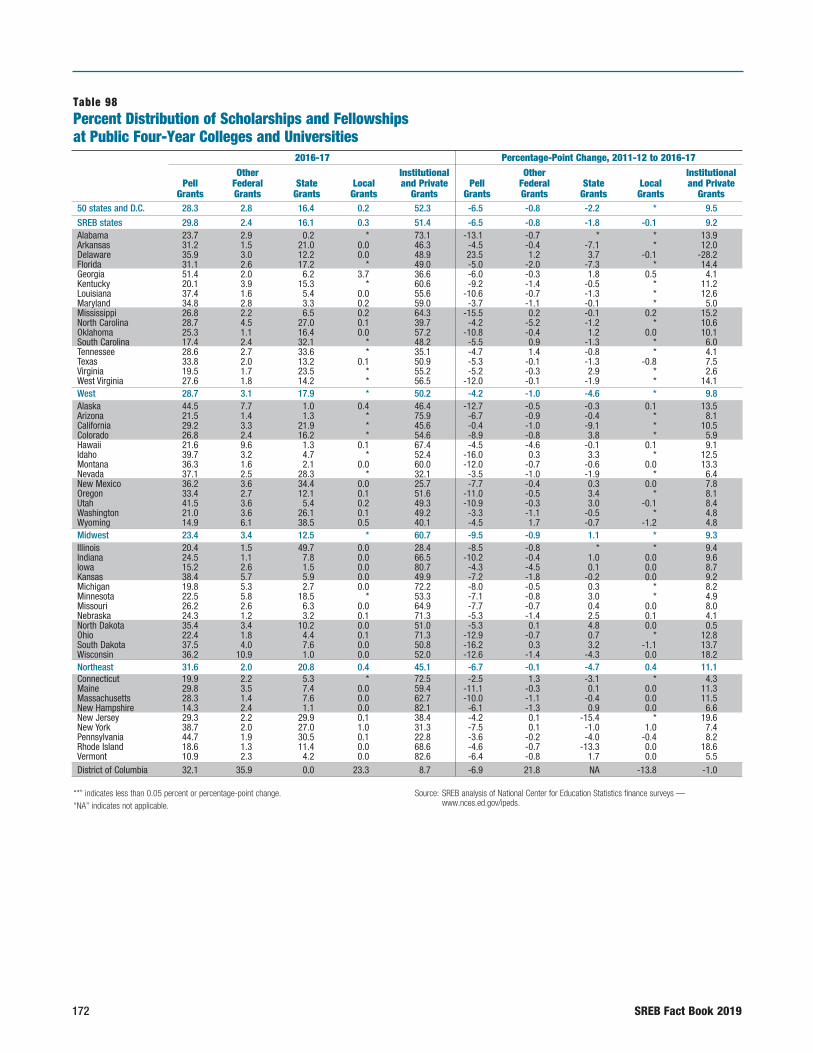
172 SREB Fact Book 2019
Table 98Percent Distribution of Scholarships and Fellowships at Public Four-Year Colleges and Universities
50 states and D.C. 28.3 2.8 16.4 0.2 52.3 -6.5 -0.8 -2.2 * 9.5
SREB states 29.8 2.4 16.1 0.3 51.4 -6.5 -0.8 -1.8 -0.1 9.2Alabama 23.7 2.9 0.2 * 73.1 -13.1 -0.7 * * 13.9Arkansas 31.2 1.5 21.0 0.0 46.3 -4.5 -0.4 -7.1 * 12.0Delaware 35.9 3.0 12.2 0.0 48.9 23.5 1.2 3.7 -0.1 -28.2Florida 31.1 2.6 17.2 * 49.0 -5.0 -2.0 -7.3 * 14.4Georgia 51.4 2.0 6.2 3.7 36.6 -6.0 -0.3 1.8 0.5 4.1Kentucky 20.1 3.9 15.3 * 60.6 -9.2 -1.4 -0.5 * 11.2Louisiana 37.4 1.6 5.4 0.0 55.6 -10.6 -0.7 -1.3 * 12.6Maryland 34.8 2.8 3.3 0.2 59.0 -3.7 -1.1 -0.1 * 5.0Mississippi 26.8 2.2 6.5 0.2 64.3 -15.5 0.2 -0.1 0.2 15.2North Carolina 28.7 4.5 27.0 0.1 39.7 -4.2 -5.2 -1.2 * 10.6Oklahoma 25.3 1.1 16.4 0.0 57.2 -10.8 -0.4 1.2 0.0 10.1South Carolina 17.4 2.4 32.1 * 48.2 -5.5 0.9 -1.3 * 6.0Tennessee 28.6 2.7 33.6 * 35.1 -4.7 1.4 -0.8 * 4.1Texas 33.8 2.0 13.2 0.1 50.9 -5.3 -0.1 -1.3 -0.8 7.5Virginia 19.5 1.7 23.5 * 55.2 -5.2 -0.3 2.9 * 2.6West Virginia 27.6 1.8 14.2 * 56.5 -12.0 -0.1 -1.9 * 14.1West 28.7 3.1 17.9 * 50.2 -4.2 -1.0 -4.6 * 9.8Alaska 44.5 7.7 1.0 0.4 46.4 -12.7 -0.5 -0.3 0.1 13.5Arizona 21.5 1.4 1.3 * 75.9 -6.7 -0.9 -0.4 * 8.1California 29.2 3.3 21.9 * 45.6 -0.4 -1.0 -9.1 * 10.5Colorado 26.8 2.4 16.2 * 54.6 -8.9 -0.8 3.8 * 5.9Hawaii 21.6 9.6 1.3 0.1 67.4 -4.5 -4.6 -0.1 0.1 9.1Idaho 39.7 3.2 4.7 * 52.4 -16.0 0.3 3.3 * 12.5Montana 36.3 1.6 2.1 0.0 60.0 -12.0 -0.7 -0.6 0.0 13.3Nevada 37.1 2.5 28.3 * 32.1 -3.5 -1.0 -1.9 * 6.4New Mexico 36.2 3.6 34.4 0.0 25.7 -7.7 -0.4 0.3 0.0 7.8Oregon 33.4 2.7 12.1 0.1 51.6 -11.0 -0.5 3.4 * 8.1Utah 41.5 3.6 5.4 0.2 49.3 -10.9 -0.3 3.0 -0.1 8.4Washington 21.0 3.6 26.1 0.1 49.2 -3.3 -1.1 -0.5 * 4.8Wyoming 14.9 6.1 38.5 0.5 40.1 -4.5 1.7 -0.7 -1.2 4.8Midwest 23.4 3.4 12.5 * 60.7 -9.5 -0.9 1.1 * 9.3Illinois 20.4 1.5 49.7 0.0 28.4 -8.5 -0.8 * * 9.4Indiana 24.5 1.1 7.8 0.0 66.5 -10.2 -0.4 1.0 0.0 9.6Iowa 15.2 2.6 1.5 0.0 80.7 -4.3 -4.5 0.1 0.0 8.7Kansas 38.4 5.7 5.9 0.0 49.9 -7.2 -1.8 -0.2 0.0 9.2Michigan 19.8 5.3 2.7 0.0 72.2 -8.0 -0.5 0.3 * 8.2Minnesota 22.5 5.8 18.5 * 53.3 -7.1 -0.8 3.0 * 4.9Missouri 26.2 2.6 6.3 0.0 64.9 -7.7 -0.7 0.4 0.0 8.0Nebraska 24.3 1.2 3.2 0.1 71.3 -5.3 -1.4 2.5 0.1 4.1North Dakota 35.4 3.4 10.2 0.0 51.0 -5.3 0.1 4.8 0.0 0.5Ohio 22.4 1.8 4.4 0.1 71.3 -12.9 -0.7 0.7 * 12.8South Dakota 37.5 4.0 7.6 0.0 50.8 -16.2 0.3 3.2 -1.1 13.7Wisconsin 36.2 10.9 1.0 0.0 52.0 -12.6 -1.4 -4.3 0.0 18.2Northeast 31.6 2.0 20.8 0.4 45.1 -6.7 -0.1 -4.7 0.4 11.1Connecticut 19.9 2.2 5.3 * 72.5 -2.5 1.3 -3.1 * 4.3Maine 29.8 3.5 7.4 0.0 59.4 -11.1 -0.3 0.1 0.0 11.3Massachusetts 28.3 1.4 7.6 0.0 62.7 -10.0 -1.1 -0.4 0.0 11.5New Hampshire 14.3 2.4 1.1 0.0 82.1 -6.1 -1.3 0.9 0.0 6.6New Jersey 29.3 2.2 29.9 0.1 38.4 -4.2 0.1 -15.4 * 19.6New York 38.7 2.0 27.0 1.0 31.3 -7.5 0.1 -1.0 1.0 7.4Pennsylvania 44.7 1.9 30.5 0.1 22.8 -3.6 -0.2 -4.0 -0.4 8.2Rhode Island 18.6 1.3 11.4 0.0 68.6 -4.6 -0.7 -13.3 0.0 18.6Vermont 10.9 2.3 4.2 0.0 82.6 -6.4 -0.8 1.7 0.0 5.5District of Columbia 32.1 35.9 0.0 23.3 8.7 -6.9 21.8 NA -13.8 -1.0
“*” indicates less than 0.05 percent or percentage-point change.“NA” indicates not applicable.
Source: SREB analysis of National Center for Education Statistics finance surveys — www.nces.ed.gov/ipeds.
2016-17 Percentage-Point Change, 2011-12 to 2016-17
Institutional and Private
Grants
Local Grants
State
Grants
Other Federal Grants
Pell
Grants
Institutional and Private
Grants
Local Grants
State
Grants
Other Federal Grants
Pell
Grants
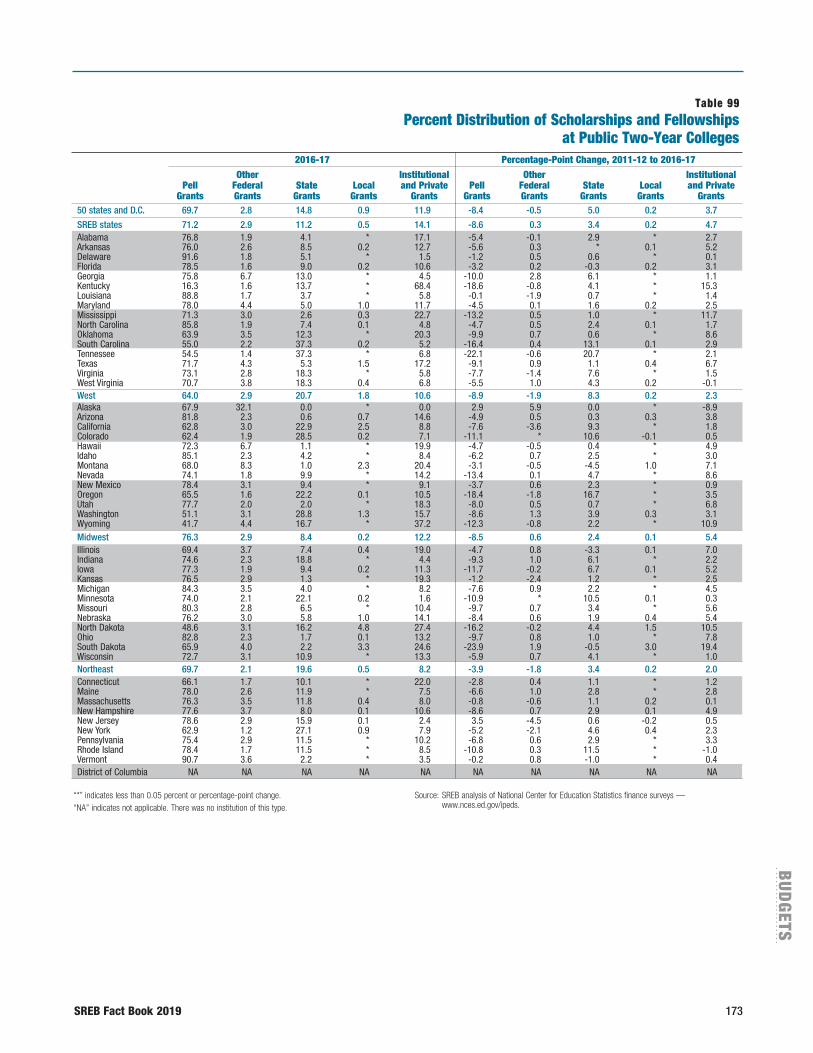
SREB Fact Book 2019 173
BU
DG
ETS
Table 99Percent Distribution of Scholarships and Fellowships
at Public Two-Year Colleges
50 states and D.C. 69.7 2.8 14.8 0.9 11.9 -8.4 -0.5 5.0 0.2 3.7
SREB states 71.2 2.9 11.2 0.5 14.1 -8.6 0.3 3.4 0.2 4.7Alabama 76.8 1.9 4.1 * 17.1 -5.4 -0.1 2.9 * 2.7Arkansas 76.0 2.6 8.5 0.2 12.7 -5.6 0.3 * 0.1 5.2Delaware 91.6 1.8 5.1 * 1.5 -1.2 0.5 0.6 * 0.1Florida 78.5 1.6 9.0 0.2 10.6 -3.2 0.2 -0.3 0.2 3.1Georgia 75.8 6.7 13.0 * 4.5 -10.0 2.8 6.1 * 1.1Kentucky 16.3 1.6 13.7 * 68.4 -18.6 -0.8 4.1 * 15.3Louisiana 88.8 1.7 3.7 * 5.8 -0.1 -1.9 0.7 * 1.4Maryland 78.0 4.4 5.0 1.0 11.7 -4.5 0.1 1.6 0.2 2.5Mississippi 71.3 3.0 2.6 0.3 22.7 -13.2 0.5 1.0 * 11.7North Carolina 85.8 1.9 7.4 0.1 4.8 -4.7 0.5 2.4 0.1 1.7Oklahoma 63.9 3.5 12.3 * 20.3 -9.9 0.7 0.6 * 8.6South Carolina 55.0 2.2 37.3 0.2 5.2 -16.4 0.4 13.1 0.1 2.9Tennessee 54.5 1.4 37.3 * 6.8 -22.1 -0.6 20.7 * 2.1Texas 71.7 4.3 5.3 1.5 17.2 -9.1 0.9 1.1 0.4 6.7Virginia 73.1 2.8 18.3 * 5.8 -7.7 -1.4 7.6 * 1.5West Virginia 70.7 3.8 18.3 0.4 6.8 -5.5 1.0 4.3 0.2 -0.1West 64.0 2.9 20.7 1.8 10.6 -8.9 -1.9 8.3 0.2 2.3Alaska 67.9 32.1 0.0 * 0.0 2.9 5.9 0.0 * -8.9Arizona 81.8 2.3 0.6 0.7 14.6 -4.9 0.5 0.3 0.3 3.8California 62.8 3.0 22.9 2.5 8.8 -7.6 -3.6 9.3 * 1.8Colorado 62.4 1.9 28.5 0.2 7.1 -11.1 * 10.6 -0.1 0.5Hawaii 72.3 6.7 1.1 * 19.9 -4.7 -0.5 0.4 * 4.9Idaho 85.1 2.3 4.2 * 8.4 -6.2 0.7 2.5 * 3.0Montana 68.0 8.3 1.0 2.3 20.4 -3.1 -0.5 -4.5 1.0 7.1Nevada 74.1 1.8 9.9 * 14.2 -13.4 0.1 4.7 * 8.6New Mexico 78.4 3.1 9.4 * 9.1 -3.7 0.6 2.3 * 0.9Oregon 65.5 1.6 22.2 0.1 10.5 -18.4 -1.8 16.7 * 3.5Utah 77.7 2.0 2.0 * 18.3 -8.0 0.5 0.7 * 6.8Washington 51.1 3.1 28.8 1.3 15.7 -8.6 1.3 3.9 0.3 3.1Wyoming 41.7 4.4 16.7 * 37.2 -12.3 -0.8 2.2 * 10.9Midwest 76.3 2.9 8.4 0.2 12.2 -8.5 0.6 2.4 0.1 5.4Illinois 69.4 3.7 7.4 0.4 19.0 -4.7 0.8 -3.3 0.1 7.0Indiana 74.6 2.3 18.8 * 4.4 -9.3 1.0 6.1 * 2.2Iowa 77.3 1.9 9.4 0.2 11.3 -11.7 -0.2 6.7 0.1 5.2Kansas 76.5 2.9 1.3 * 19.3 -1.2 -2.4 1.2 * 2.5Michigan 84.3 3.5 4.0 * 8.2 -7.6 0.9 2.2 * 4.5Minnesota 74.0 2.1 22.1 0.2 1.6 -10.9 * 10.5 0.1 0.3Missouri 80.3 2.8 6.5 * 10.4 -9.7 0.7 3.4 * 5.6Nebraska 76.2 3.0 5.8 1.0 14.1 -8.4 0.6 1.9 0.4 5.4North Dakota 48.6 3.1 16.2 4.8 27.4 -16.2 -0.2 4.4 1.5 10.5Ohio 82.8 2.3 1.7 0.1 13.2 -9.7 0.8 1.0 * 7.8South Dakota 65.9 4.0 2.2 3.3 24.6 -23.9 1.9 -0.5 3.0 19.4Wisconsin 72.7 3.1 10.9 * 13.3 -5.9 0.7 4.1 * 1.0Northeast 69.7 2.1 19.6 0.5 8.2 -3.9 -1.8 3.4 0.2 2.0Connecticut 66.1 1.7 10.1 * 22.0 -2.8 0.4 1.1 * 1.2Maine 78.0 2.6 11.9 * 7.5 -6.6 1.0 2.8 * 2.8Massachusetts 76.3 3.5 11.8 0.4 8.0 -0.8 -0.6 1.1 0.2 0.1New Hampshire 77.6 3.7 8.0 0.1 10.6 -8.6 0.7 2.9 0.1 4.9New Jersey 78.6 2.9 15.9 0.1 2.4 3.5 -4.5 0.6 -0.2 0.5New York 62.9 1.2 27.1 0.9 7.9 -5.2 -2.1 4.6 0.4 2.3Pennsylvania 75.4 2.9 11.5 * 10.2 -6.8 0.6 2.9 * 3.3Rhode Island 78.4 1.7 11.5 * 8.5 -10.8 0.3 11.5 * -1.0Vermont 90.7 3.6 2.2 * 3.5 -0.2 0.8 -1.0 * 0.4District of Columbia NA NA NA NA NA NA NA NA NA NA
“*” indicates less than 0.05 percent or percentage-point change.“NA” indicates not applicable. There was no institution of this type.
Source: SREB analysis of National Center for Education Statistics finance surveys — www.nces.ed.gov/ipeds.
2016-17 Percentage-Point Change, 2011-12 to 2016-17
Institutional and Private
Grants
Local Grants
State
Grants
Other Federal Grants
Pell
Grants
Institutional and Private
Grants
Local Grants
State
Grants
Other Federal Grants
Pell
Grants
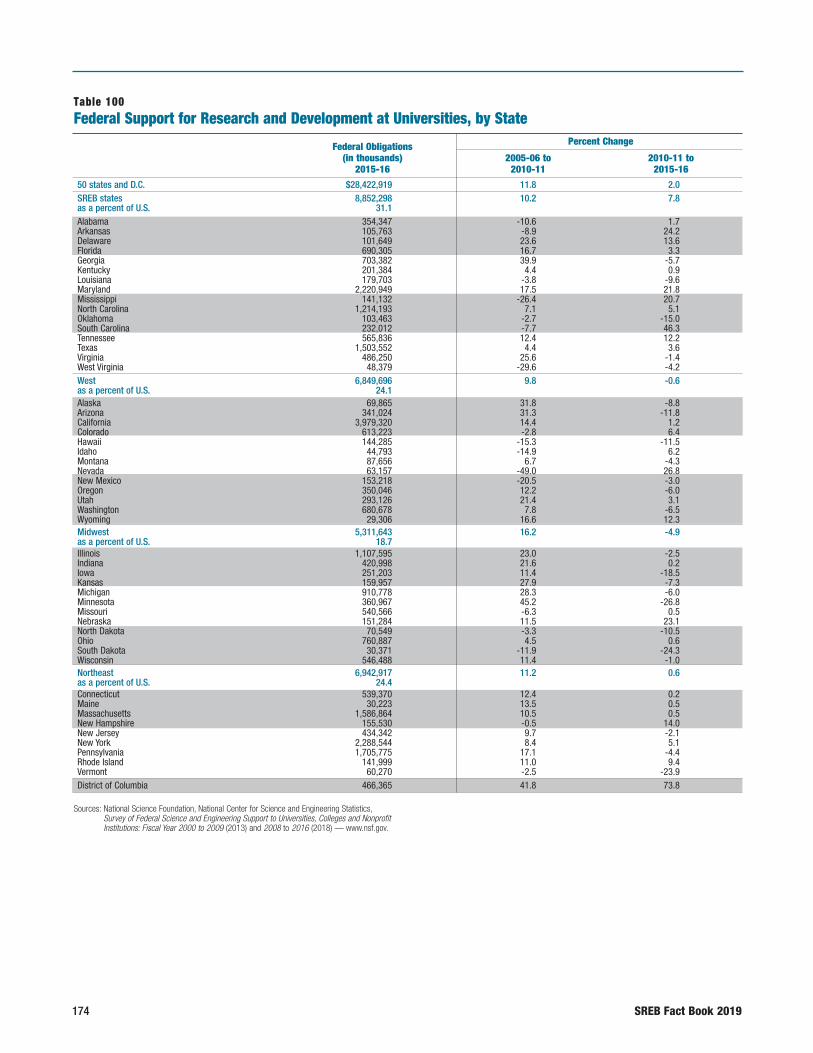
174 SREB Fact Book 2019
50 states and D.C. $28,422,919 11.8 2.0SREB states 8,852,298 10.2 7.8as a percent of U.S. 31.1 Alabama 354,347 -10.6 1.7Arkansas 105,763 -8.9 24.2Delaware 101,649 23.6 13.6Florida 690,305 16.7 3.3Georgia 703,382 39.9 -5.7Kentucky 201,384 4.4 0.9Louisiana 179,703 -3.8 -9.6Maryland 2,220,949 17.5 21.8Mississippi 141,132 -26.4 20.7North Carolina 1,214,193 7.1 5.1Oklahoma 103,463 -2.7 -15.0South Carolina 232,012 -7.7 46.3Tennessee 565,836 12.4 12.2Texas 1,503,552 4.4 3.6Virginia 486,250 25.6 -1.4West Virginia 48,379 -29.6 -4.2West 6,849,696 9.8 -0.6as a percent of U.S. 24.1 Alaska 69,865 31.8 -8.8Arizona 341,024 31.3 -11.8California 3,979,320 14.4 1.2Colorado 613,223 -2.8 6.4Hawaii 144,285 -15.3 -11.5Idaho 44,793 -14.9 6.2Montana 87,656 6.7 -4.3Nevada 63,157 -49.0 26.8New Mexico 153,218 -20.5 -3.0Oregon 350,046 12.2 -6.0Utah 293,126 21.4 3.1Washington 680,678 7.8 -6.5Wyoming 29,306 16.6 12.3Midwest 5,311,643 16.2 -4.9as a percent of U.S. 18.7 Illinois 1,107,595 23.0 -2.5Indiana 420,998 21.6 0.2Iowa 251,203 11.4 -18.5Kansas 159,957 27.9 -7.3Michigan 910,778 28.3 -6.0Minnesota 360,967 45.2 -26.8Missouri 540,566 -6.3 0.5Nebraska 151,284 11.5 23.1North Dakota 70,549 -3.3 -10.5Ohio 760,887 4.5 0.6South Dakota 30,371 -11.9 -24.3Wisconsin 546,488 11.4 -1.0Northeast 6,942,917 11.2 0.6as a percent of U.S. 24.4 Connecticut 539,370 12.4 0.2Maine 30,223 13.5 0.5Massachusetts 1,586,864 10.5 0.5New Hampshire 155,530 -0.5 14.0New Jersey 434,342 9.7 -2.1New York 2,288,544 8.4 5.1Pennsylvania 1,705,775 17.1 -4.4Rhode Island 141,999 11.0 9.4Vermont 60,270 -2.5 -23.9District of Columbia 466,365 41.8 73.8
Sources: National Science Foundation, National Center for Science and Engineering Statistics, Survey of Federal Science and Engineering Support to Universities, Colleges and Nonprofit Institutions: Fiscal Year 2000 to 2009 (2013) and 2008 to 2016 (2018) — www.nsf.gov.
Table 100Federal Support for Research and Development at Universities, by State
Percent ChangeFederal Obligations (in thousands)
2015-162005-06 to
2010-112010-11 to
2015-16
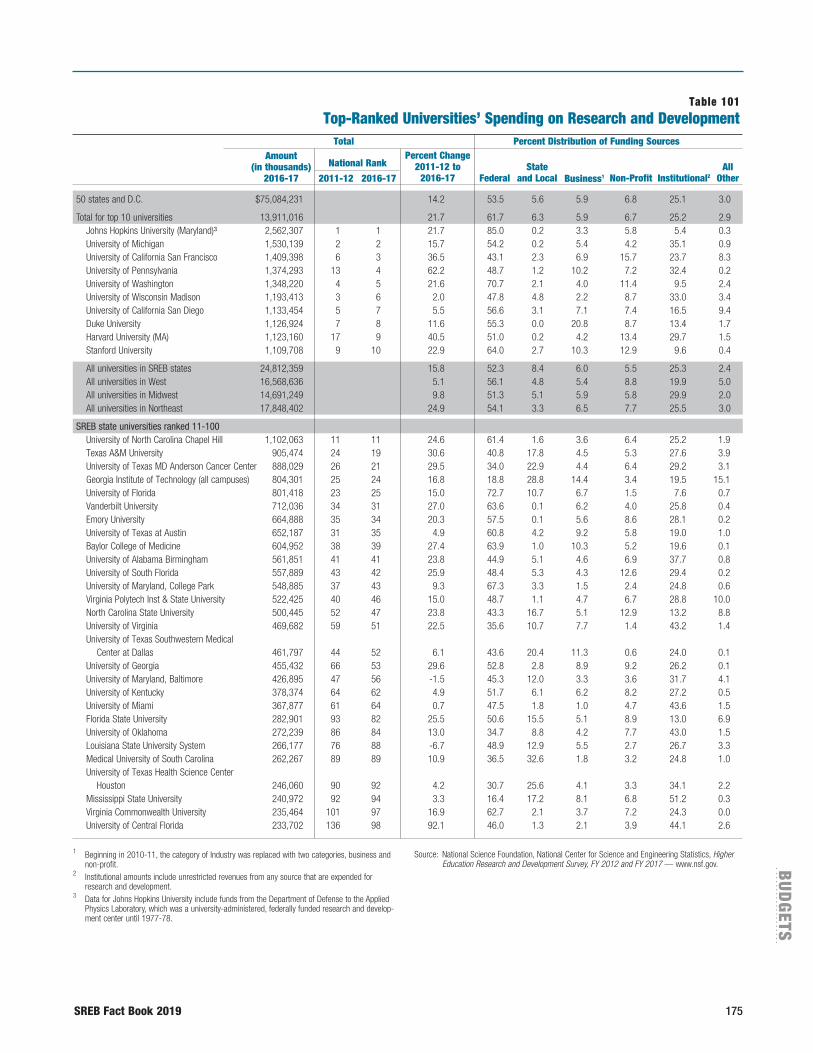
SREB Fact Book 2019 175
BU
DG
ETS
Table 101Top-Ranked Universities’ Spending on Research and Development
Total Percent Distribution of Funding Sources
All Other
State and Local
National RankAmount
(in thousands) 2016-17
Percent Change 2011-12 to
2016-17 Federal Business1 Non-Profit Institutional22011-12 2016-17
1 Beginning in 2010-11, the category of Industry was replaced with two categories, business and non-profit.
2 Institutional amounts include unrestricted revenues from any source that are expended for research and development.
3 Data for Johns Hopkins University include funds from the Department of Defense to the Applied Physics Laboratory, which was a university-administered, federally funded research and develop-ment center until 1977-78.
Source: National Science Foundation, National Center for Science and Engineering Statistics, Higher Education Research and Development Survey, FY 2012 and FY 2017 — www.nsf.gov.
50 states and D.C. $75,084,231 14.2 53.5 5.6 5.9 6.8 25.1 3.0
Total for top 10 universities 13,911,016 21.7 61.7 6.3 5.9 6.7 25.2 2.9Johns Hopkins University (Maryland)³ 2,562,307 1 1 21.7 85.0 0.2 3.3 5.8 5.4 0.3University of Michigan 1,530,139 2 2 15.7 54.2 0.2 5.4 4.2 35.1 0.9University of California San Francisco 1,409,398 6 3 36.5 43.1 2.3 6.9 15.7 23.7 8.3University of Pennsylvania 1,374,293 13 4 62.2 48.7 1.2 10.2 7.2 32.4 0.2University of Washington 1,348,220 4 5 21.6 70.7 2.1 4.0 11.4 9.5 2.4University of Wisconsin Madison 1,193,413 3 6 2.0 47.8 4.8 2.2 8.7 33.0 3.4University of California San Diego 1,133,454 5 7 5.5 56.6 3.1 7.1 7.4 16.5 9.4Duke University 1,126,924 7 8 11.6 55.3 0.0 20.8 8.7 13.4 1.7Harvard University (MA) 1,123,160 17 9 40.5 51.0 0.2 4.2 13.4 29.7 1.5Stanford University 1,109,708 9 10 22.9 64.0 2.7 10.3 12.9 9.6 0.4
All universities in SREB states 24,812,359 15.8 52.3 8.4 6.0 5.5 25.3 2.4All universities in West 16,568,636 5.1 56.1 4.8 5.4 8.8 19.9 5.0All universities in Midwest 14,691,249 9.8 51.3 5.1 5.9 5.8 29.9 2.0All universities in Northeast 17,848,402 24.9 54.1 3.3 6.5 7.7 25.5 3.0
SREB state universities ranked 11-100 University of North Carolina Chapel Hill 1,102,063 11 11 24.6 61.4 1.6 3.6 6.4 25.2 1.9Texas A&M University 905,474 24 19 30.6 40.8 17.8 4.5 5.3 27.6 3.9University of Texas MD Anderson Cancer Center 888,029 26 21 29.5 34.0 22.9 4.4 6.4 29.2 3.1Georgia Institute of Technology (all campuses) 804,301 25 24 16.8 18.8 28.8 14.4 3.4 19.5 15.1University of Florida 801,418 23 25 15.0 72.7 10.7 6.7 1.5 7.6 0.7Vanderbilt University 712,036 34 31 27.0 63.6 0.1 6.2 4.0 25.8 0.4Emory University 664,888 35 34 20.3 57.5 0.1 5.6 8.6 28.1 0.2University of Texas at Austin 652,187 31 35 4.9 60.8 4.2 9.2 5.8 19.0 1.0Baylor College of Medicine 604,952 38 39 27.4 63.9 1.0 10.3 5.2 19.6 0.1University of Alabama Birmingham 561,851 41 41 23.8 44.9 5.1 4.6 6.9 37.7 0.8University of South Florida 557,889 43 42 25.9 48.4 5.3 4.3 12.6 29.4 0.2University of Maryland, College Park 548,885 37 43 9.3 67.3 3.3 1.5 2.4 24.8 0.6Virginia Polytech Inst & State University 522,425 40 46 15.0 48.7 1.1 4.7 6.7 28.8 10.0North Carolina State University 500,445 52 47 23.8 43.3 16.7 5.1 12.9 13.2 8.8University of Virginia 469,682 59 51 22.5 35.6 10.7 7.7 1.4 43.2 1.4University of Texas Southwestern Medical Center at Dallas 461,797 44 52 6.1 43.6 20.4 11.3 0.6 24.0 0.1University of Georgia 455,432 66 53 29.6 52.8 2.8 8.9 9.2 26.2 0.1University of Maryland, Baltimore 426,895 47 56 -1.5 45.3 12.0 3.3 3.6 31.7 4.1University of Kentucky 378,374 64 62 4.9 51.7 6.1 6.2 8.2 27.2 0.5University of Miami 367,877 61 64 0.7 47.5 1.8 1.0 4.7 43.6 1.5Florida State University 282,901 93 82 25.5 50.6 15.5 5.1 8.9 13.0 6.9University of Oklahoma 272,239 86 84 13.0 34.7 8.8 4.2 7.7 43.0 1.5Louisiana State University System 266,177 76 88 -6.7 48.9 12.9 5.5 2.7 26.7 3.3Medical University of South Carolina 262,267 89 89 10.9 36.5 32.6 1.8 3.2 24.8 1.0University of Texas Health Science Center Houston 246,060 90 92 4.2 30.7 25.6 4.1 3.3 34.1 2.2Mississippi State University 240,972 92 94 3.3 16.4 17.2 8.1 6.8 51.2 0.3Virginia Commonwealth University 235,464 101 97 16.9 62.7 2.1 3.7 7.2 24.3 0.0University of Central Florida 233,702 136 98 92.1 46.0 1.3 2.1 3.9 44.1 2.6

176 SREB Fact Book 2019
Total to all universities $28,506,601 2.0 Total to top 100 universities $23,487,867 1.7 Total to top 10 universities $6,655,855 7.6
1 Johns Hopkins University (Maryland)1 1,805,420 3 University of Washington 590,186 2 University of Michigan 625,643 4 University of California-San Diego 554,478 5 University of California-San Francisco 547,197 6 Columbia University (New York) 522,581 7 Stanford University (California) 513,877 8 University of Pennsylvania 512,082 9 University of Pittsburgh (Pennsylvania) 493,568 10 University of California-Los Angeles 490,824
Total to universities in SREB states ranked 11 to 100 7,019,934 42.1
11 Duke University (North Carolina) 467,848 12 University of North Carolina at Chapel Hill 452,366 18 Vanderbilt University (Tennessee) 379,809 24 Emory University (Georgia) 320,631 27 University of Texas at Austin 279,005 32 University of Alabama at Birmingham 247,440 36 Baylor College of Medicine (Texas) 234,126 38 University of Florida 227,681 41 University of Maryland, College Park 210,115 47 University of Virginia (main campus) 170,947 51 University of Texas Southwestern Medical Center at Dallas 161,793 52 Georgia Institute of Technology (all campuses) 156,854 55 Texas A&M University (main campus) 152,758 56 University of Maryland, Baltimore 152,021 58 University of Miami (Florida) 146,419 63 University of Kentucky (all campuses) 129,103 66 University of Texas Anderson Cancer Center 119,083 67 North Carolina State University 117,180 69 Virginia Tech 111,791 70 Wake Forest University (North Carolina) 111,755 75 Medical University of South Carolina 106,360 80 University of Delaware 95,579 85 Florida State University 90,911 86 University of Georgia 90,218 90 University of South Florida 84,517 91 University of Texas Health Science Center at Houston 84,281 92 Louisiana State University and A&M College (all campuses) 81,726 94 Virginia Commonwealth University 80,255 97 University of Texas Medical Branch at Galveston 76,735 98 University of Arkansas Medical Science Campus 75,210
Total to universities in West ranked 11 to 100 5,872,251 82.7
14 University of Colorado (all campuses) 438,548 23 University of Southern California 325,150 28 University of California-Davis 278,726 31 University of California-Berkeley 261,097 35 The Scripps Research Institute (California) 238,648 40 University of Utah 210,756 43 Oregon Health Sciences University 187,199
Table 102
Federal Support for Research and Development at Universities, Top 100 Percent National Federal Obligations Change Rank (in thousands) 2010-11 to 2015-16 2015-16 2015-16
1 Data for Johns Hopkins University include funds from the Department of Defense to the Applied Physics Laboratory, which was a university-administered, federally funded research and develop-ment center until 1977-78.
Source: National Science Foundation, National Center for Science and Engineering Statistics, Survey of Federal Science and Engineering Support to Universities, Colleges and Nonprofit Institutions: Fiscal Year 2008 to 2016 (2018) — www.nsf.gov.

SREB Fact Book 2019 177
BU
DG
ETS
44 University of Arizona 185,962 50 University of California-Irvine 167,846 53 California Institute of Technology 154,529 62 Arizona State University-Main Campus 131,292 72 Colorado State University 109,491 77 University of New Mexico 99,834 79 Oregon State University 96,667 81 University of California-Santa Barbara 95,388 83 University of Hawaii (all campuses) 92,955 93 Washington State University 80,343
Total to universities in Midwest ranked 11 to 100 $4,329,158 23.2
16 University of Wisconsin-Madison 411,833 17 Washington University in St. Louis (Missouri) 408,897 19 Northwestern University (Illinois) 367,408 21 University of Minnesota (all campuses) 349,514 26 Case Western Reserve University (Ohio) 290,270 33 Ohio State University (all campuses) 246,198 34 University of Illinois-Champaign-Urbana 242,707 42 University of Chicago (Illinois) 209,139 46 Michigan State University 171,263 48 University of Iowa 169,765 54 Purdue University (Indiana) (all campuses) 153,568 61 University of Illinois-Chicago 133,214 64 Indiana University - Purdue University - Indianapolis) 127,033 76 University of Kansas 103,892 87 Medical College of Wisconsin 89,839 95 Indiana University-Bloomington 77,263 96 Iowa State University 77,181 100 Wayne State University (Michigan) 74,534
Total to universities in Northeast ranked 11 to 100 5,884,304 19.4
13 Harvard University (Massachusetts) 448,052 15 Yale University (Connecticut) 425,576 20 Pennsylvania State University (all campuses) 362,034 22 Massachusetts Institute of Technology 340,593 25 Cornell University (New York) 303,589 29 Mount Sinai School of Medicine (CUNY) 277,187 30 New York University 272,971 37 Rutgers State University of New Jersey 231,293 39 Boston University (Massachusetts) 223,233 49 University of Rochester (New York) 168,545 57 University of Massachusetts-Worcester (Medical School) 149,018 59 Princeton University (New Jersey) 144,145 60 Albert Einstein College of Medicine 142,469 68 Dartmouth College (New Hampshire) 116,331 71 Carnegie Mellon University (Pennsylvania) 110,746 73 Brown University (Rhode Island) 108,874 74 University of Connecticut 106,800 78 Temple University (Pennsylvania) 99,396 82 SUNY at Stony Brook (New York) (all campuses) 93,112 84 Woods Hole Oceanographic Institute (Massachusetts) 92,258 88 Tufts University (Massachusetts) 86,564 99 Northeastern University 74,546
Percent National Federal Obligations Change Rank (in thousands) 2010-11 to 2015-16 2015-16 2015-16
Table 102continued
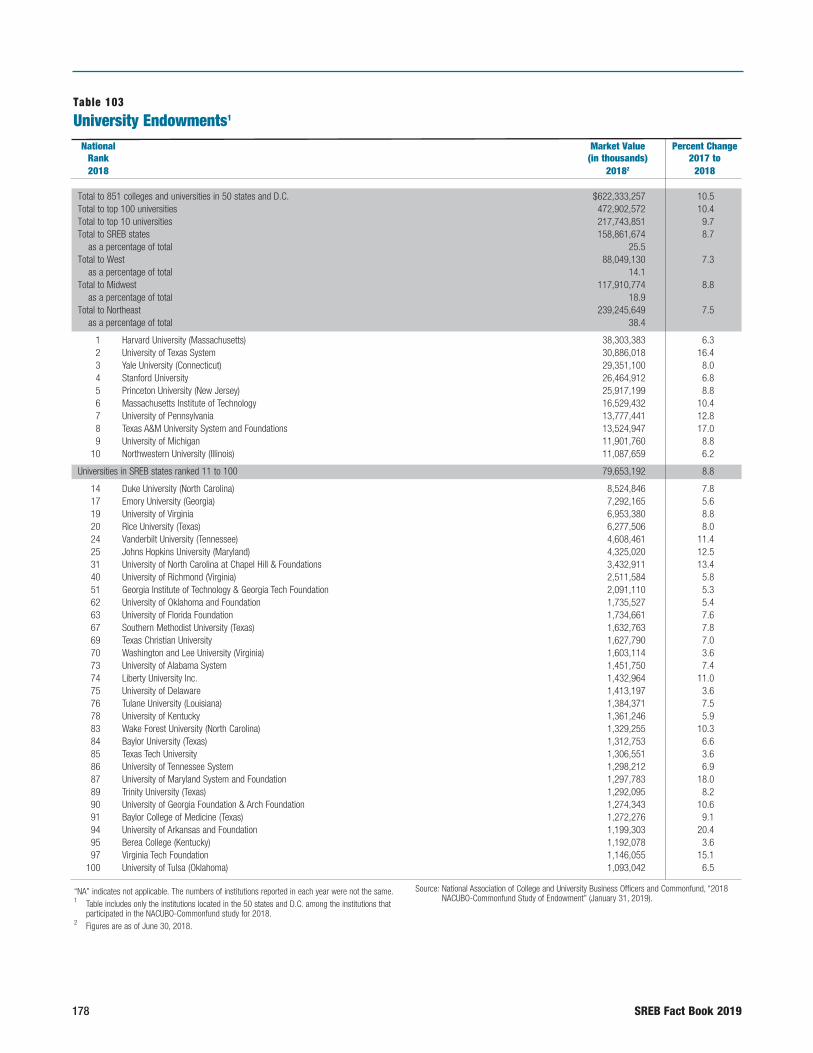
178 SREB Fact Book 2019
“NA” indicates not applicable. The numbers of institutions reported in each year were not the same.1 Table includes only the institutions located in the 50 states and D.C. among the institutions that
participated in the NACUBO-Commonfund study for 2018. 2 Figures are as of June 30, 2018.
Source: National Association of College and University Business Officers and Commonfund, “2018 NACUBO-Commonfund Study of Endowment” (January 31, 2019).
National Market Value Percent Change Rank (in thousands) 2017 to 2018 20182 2018
Table 103
University Endowments1
Total to 851 colleges and universities in 50 states and D.C. $622,333,257 10.5Total to top 100 universities 472,902,572 10.4Total to top 10 universities 217,743,851 9.7Total to SREB states 158,861,674 8.7 as a percentage of total 25.5 Total to West 88,049,130 7.3 as a percentage of total 14.1 Total to Midwest 117,910,774 8.8 as a percentage of total 18.9 Total to Northeast 239,245,649 7.5 as a percentage of total 38.4
1 Harvard University (Massachusetts) 38,303,383 6.3 2 University of Texas System 30,886,018 16.4 3 Yale University (Connecticut) 29,351,100 8.0 4 Stanford University 26,464,912 6.8 5 Princeton University (New Jersey) 25,917,199 8.8 6 Massachusetts Institute of Technology 16,529,432 10.4 7 University of Pennsylvania 13,777,441 12.8 8 Texas A&M University System and Foundations 13,524,947 17.0 9 University of Michigan 11,901,760 8.8 10 Northwestern University (Illinois) 11,087,659 6.2
Universities in SREB states ranked 11 to 100 79,653,192 8.8
14 Duke University (North Carolina) 8,524,846 7.8 17 Emory University (Georgia) 7,292,165 5.6 19 University of Virginia 6,953,380 8.8 20 Rice University (Texas) 6,277,506 8.0 24 Vanderbilt University (Tennessee) 4,608,461 11.4 25 Johns Hopkins University (Maryland) 4,325,020 12.5 31 University of North Carolina at Chapel Hill & Foundations 3,432,911 13.4 40 University of Richmond (Virginia) 2,511,584 5.8 51 Georgia Institute of Technology & Georgia Tech Foundation 2,091,110 5.3 62 University of Oklahoma and Foundation 1,735,527 5.4 63 University of Florida Foundation 1,734,661 7.6 67 Southern Methodist University (Texas) 1,632,763 7.8 69 Texas Christian University 1,627,790 7.0 70 Washington and Lee University (Virginia) 1,603,114 3.6 73 University of Alabama System 1,451,750 7.4 74 Liberty University Inc. 1,432,964 11.0 75 University of Delaware 1,413,197 3.6 76 Tulane University (Louisiana) 1,384,371 7.5 78 University of Kentucky 1,361,246 5.9 83 Wake Forest University (North Carolina) 1,329,255 10.3 84 Baylor University (Texas) 1,312,753 6.6 85 Texas Tech University 1,306,551 3.6 86 University of Tennessee System 1,298,212 6.9 87 University of Maryland System and Foundation 1,297,783 18.0 89 Trinity University (Texas) 1,292,095 8.2 90 University of Georgia Foundation & Arch Foundation 1,274,343 10.6 91 Baylor College of Medicine (Texas) 1,272,276 9.1 94 University of Arkansas and Foundation 1,199,303 20.4 95 Berea College (Kentucky) 1,192,078 3.6 97 Virginia Tech Foundation 1,146,055 15.1 100 University of Tulsa (Oklahoma) 1,093,042 6.5
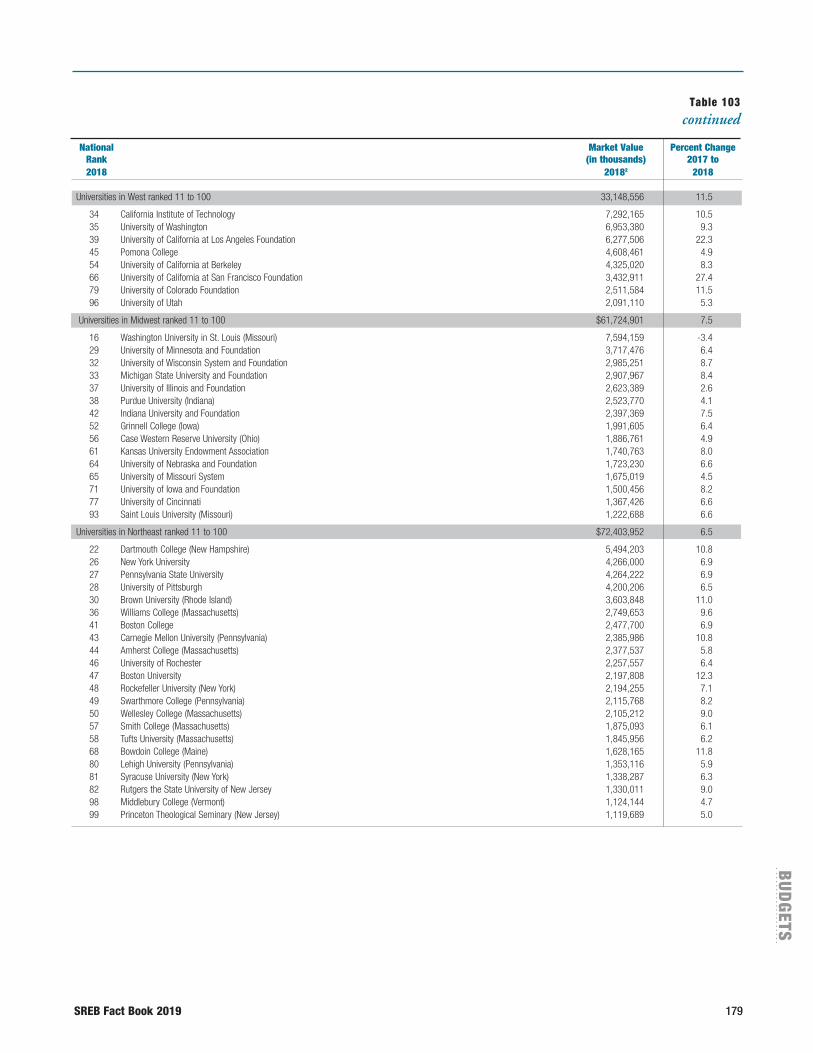
SREB Fact Book 2019 179
BU
DG
ETS
Universities in West ranked 11 to 100 33,148,556 11.5
34 California Institute of Technology 7,292,165 10.5 35 University of Washington 6,953,380 9.3 39 University of California at Los Angeles Foundation 6,277,506 22.3 45 Pomona College 4,608,461 4.9 54 University of California at Berkeley 4,325,020 8.3 66 University of California at San Francisco Foundation 3,432,911 27.4 79 University of Colorado Foundation 2,511,584 11.5 96 University of Utah 2,091,110 5.3
Universities in Midwest ranked 11 to 100 $61,724,901 7.5
16 Washington University in St. Louis (Missouri) 7,594,159 -3.4 29 University of Minnesota and Foundation 3,717,476 6.4 32 University of Wisconsin System and Foundation 2,985,251 8.7 33 Michigan State University and Foundation 2,907,967 8.4 37 University of Illinois and Foundation 2,623,389 2.6 38 Purdue University (Indiana) 2,523,770 4.1 42 Indiana University and Foundation 2,397,369 7.5 52 Grinnell College (Iowa) 1,991,605 6.4 56 Case Western Reserve University (Ohio) 1,886,761 4.9 61 Kansas University Endowment Association 1,740,763 8.0 64 University of Nebraska and Foundation 1,723,230 6.6 65 University of Missouri System 1,675,019 4.5 71 University of Iowa and Foundation 1,500,456 8.2 77 University of Cincinnati 1,367,426 6.6 93 Saint Louis University (Missouri) 1,222,688 6.6
Universities in Northeast ranked 11 to 100 $72,403,952 6.5
22 Dartmouth College (New Hampshire) 5,494,203 10.8 26 New York University 4,266,000 6.9 27 Pennsylvania State University 4,264,222 6.9 28 University of Pittsburgh 4,200,206 6.5 30 Brown University (Rhode Island) 3,603,848 11.0 36 Williams College (Massachusetts) 2,749,653 9.6 41 Boston College 2,477,700 6.9 43 Carnegie Mellon University (Pennsylvania) 2,385,986 10.8 44 Amherst College (Massachusetts) 2,377,537 5.8 46 University of Rochester 2,257,557 6.4 47 Boston University 2,197,808 12.3 48 Rockefeller University (New York) 2,194,255 7.1 49 Swarthmore College (Pennsylvania) 2,115,768 8.2 50 Wellesley College (Massachusetts) 2,105,212 9.0 57 Smith College (Massachusetts) 1,875,093 6.1 58 Tufts University (Massachusetts) 1,845,956 6.2 68 Bowdoin College (Maine) 1,628,165 11.8 80 Lehigh University (Pennsylvania) 1,353,116 5.9 81 Syracuse University (New York) 1,338,287 6.3 82 Rutgers the State University of New Jersey 1,330,011 9.0 98 Middlebury College (Vermont) 1,124,144 4.7 99 Princeton Theological Seminary (New Jersey) 1,119,689 5.0
National Market Value Percent Change Rank (in thousands) 2017 to 2018 20182 2018
Table 103continued
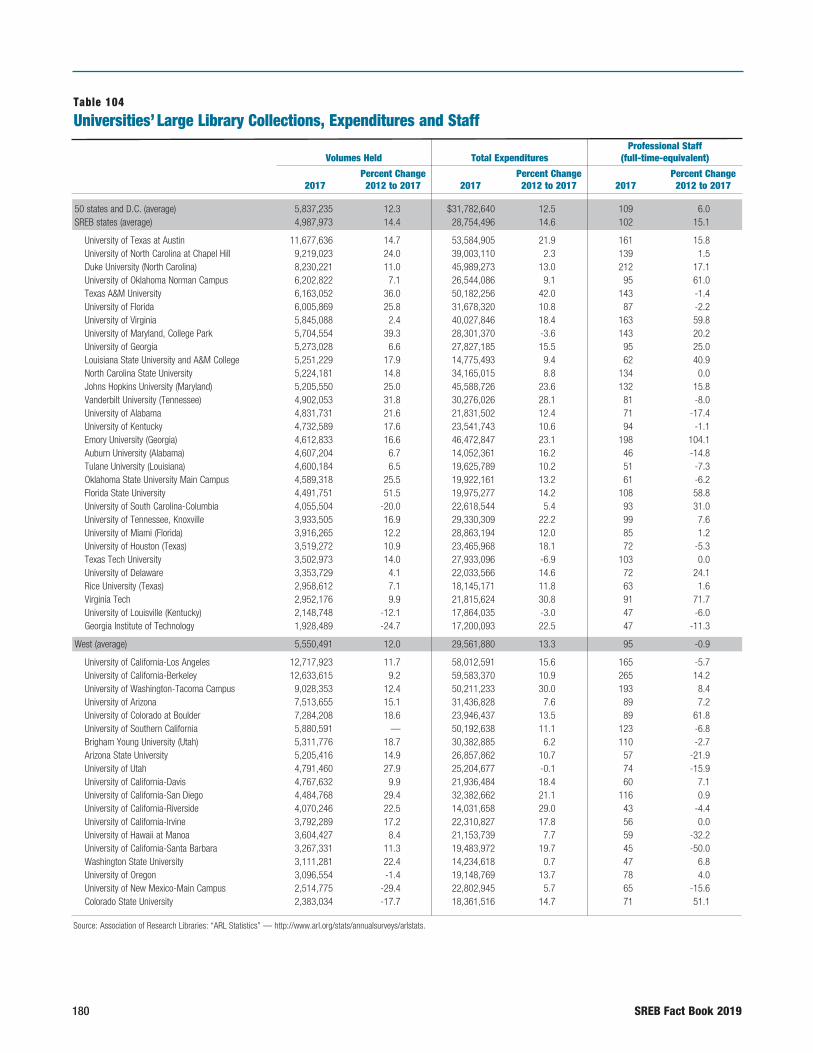
180 SREB Fact Book 2019
50 states and D.C. (average) 5,837,235 12.3 $31,782,640 12.5 109 6.0SREB states (average) 4,987,973 14.4 28,754,496 14.6 102 15.1
University of Texas at Austin 11,677,636 14.7 53,584,905 21.9 161 15.8University of North Carolina at Chapel Hill 9,219,023 24.0 39,003,110 2.3 139 1.5Duke University (North Carolina) 8,230,221 11.0 45,989,273 13.0 212 17.1University of Oklahoma Norman Campus 6,202,822 7.1 26,544,086 9.1 95 61.0Texas A&M University 6,163,052 36.0 50,182,256 42.0 143 -1.4University of Florida 6,005,869 25.8 31,678,320 10.8 87 -2.2University of Virginia 5,845,088 2.4 40,027,846 18.4 163 59.8University of Maryland, College Park 5,704,554 39.3 28,301,370 -3.6 143 20.2University of Georgia 5,273,028 6.6 27,827,185 15.5 95 25.0Louisiana State University and A&M College 5,251,229 17.9 14,775,493 9.4 62 40.9North Carolina State University 5,224,181 14.8 34,165,015 8.8 134 0.0Johns Hopkins University (Maryland) 5,205,550 25.0 45,588,726 23.6 132 15.8Vanderbilt University (Tennessee) 4,902,053 31.8 30,276,026 28.1 81 -8.0University of Alabama 4,831,731 21.6 21,831,502 12.4 71 -17.4University of Kentucky 4,732,589 17.6 23,541,743 10.6 94 -1.1Emory University (Georgia) 4,612,833 16.6 46,472,847 23.1 198 104.1Auburn University (Alabama) 4,607,204 6.7 14,052,361 16.2 46 -14.8Tulane University (Louisiana) 4,600,184 6.5 19,625,789 10.2 51 -7.3Oklahoma State University Main Campus 4,589,318 25.5 19,922,161 13.2 61 -6.2Florida State University 4,491,751 51.5 19,975,277 14.2 108 58.8University of South Carolina-Columbia 4,055,504 -20.0 22,618,544 5.4 93 31.0University of Tennessee, Knoxville 3,933,505 16.9 29,330,309 22.2 99 7.6University of Miami (Florida) 3,916,265 12.2 28,863,194 12.0 85 1.2University of Houston (Texas) 3,519,272 10.9 23,465,968 18.1 72 -5.3Texas Tech University 3,502,973 14.0 27,933,096 -6.9 103 0.0University of Delaware 3,353,729 4.1 22,033,566 14.6 72 24.1Rice University (Texas) 2,958,612 7.1 18,145,171 11.8 63 1.6Virginia Tech 2,952,176 9.9 21,815,624 30.8 91 71.7University of Louisville (Kentucky) 2,148,748 -12.1 17,864,035 -3.0 47 -6.0Georgia Institute of Technology 1,928,489 -24.7 17,200,093 22.5 47 -11.3
West (average) 5,550,491 12.0 29,561,880 13.3 95 -0.9
University of California-Los Angeles 12,717,923 11.7 58,012,591 15.6 165 -5.7University of California-Berkeley 12,633,615 9.2 59,583,370 10.9 265 14.2University of Washington-Tacoma Campus 9,028,353 12.4 50,211,233 30.0 193 8.4University of Arizona 7,513,655 15.1 31,436,828 7.6 89 7.2University of Colorado at Boulder 7,284,208 18.6 23,946,437 13.5 89 61.8University of Southern California 5,880,591 — 50,192,638 11.1 123 -6.8Brigham Young University (Utah) 5,311,776 18.7 30,382,885 6.2 110 -2.7Arizona State University 5,205,416 14.9 26,857,862 10.7 57 -21.9University of Utah 4,791,460 27.9 25,204,677 -0.1 74 -15.9University of California-Davis 4,767,632 9.9 21,936,484 18.4 60 7.1University of California-San Diego 4,484,768 29.4 32,382,662 21.1 116 0.9University of California-Riverside 4,070,246 22.5 14,031,658 29.0 43 -4.4University of California-Irvine 3,792,289 17.2 22,310,827 17.8 56 0.0University of Hawaii at Manoa 3,604,427 8.4 21,153,739 7.7 59 -32.2University of California-Santa Barbara 3,267,331 11.3 19,483,972 19.7 45 -50.0Washington State University 3,111,281 22.4 14,234,618 0.7 47 6.8University of Oregon 3,096,554 -1.4 19,148,769 13.7 78 4.0University of New Mexico-Main Campus 2,514,775 -29.4 22,802,945 5.7 65 -15.6Colorado State University 2,383,034 -17.7 18,361,516 14.7 71 51.1
Source: Association of Research Libraries: “ARL Statistics” — http://www.arl.org/stats/annualsurveys/arlstats.
Table 104
Universities’ Large Library Collections, Expenditures and Staff
2017
Percent Change 2012 to 2017
2017
Percent Change 2012 to 2017
2017
Percent Change 2012 to 2017
Professional Staff (full-time-equivalent)
Total Expenditures
Volumes Held
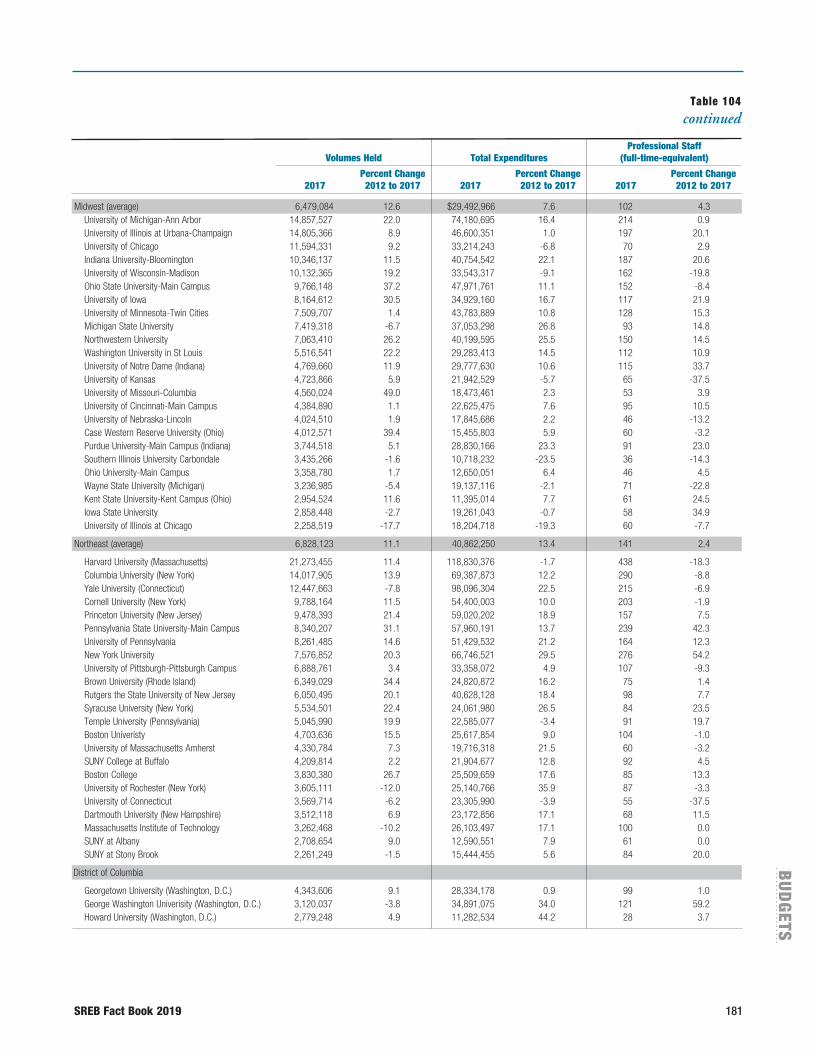
SREB Fact Book 2019 181
BU
DG
ETS
Table 104continued
2017
Percent Change 2012 to 2017
2017
Percent Change 2012 to 2017
2017
Percent Change 2012 to 2017
Professional Staff (full-time-equivalent)
Total Expenditures
Volumes Held
Midwest (average) 6,479,084 12.6 $29,492,966 7.6 102 4.3 University of Michigan-Ann Arbor 14,857,527 22.0 74,180,695 16.4 214 0.9University of Illinois at Urbana-Champaign 14,805,366 8.9 46,600,351 1.0 197 20.1University of Chicago 11,594,331 9.2 33,214,243 -6.8 70 2.9Indiana University-Bloomington 10,346,137 11.5 40,754,542 22.1 187 20.6University of Wisconsin-Madison 10,132,365 19.2 33,543,317 -9.1 162 -19.8Ohio State University-Main Campus 9,766,148 37.2 47,971,761 11.1 152 -8.4University of Iowa 8,164,612 30.5 34,929,160 16.7 117 21.9University of Minnesota-Twin Cities 7,509,707 1.4 43,783,889 10.8 128 15.3Michigan State University 7,419,318 -6.7 37,053,298 26.8 93 14.8Northwestern University 7,063,410 26.2 40,199,595 25.5 150 14.5Washington University in St Louis 5,516,541 22.2 29,283,413 14.5 112 10.9University of Notre Dame (Indiana) 4,769,660 11.9 29,777,630 10.6 115 33.7University of Kansas 4,723,866 5.9 21,942,529 -5.7 65 -37.5University of Missouri-Columbia 4,560,024 49.0 18,473,461 2.3 53 3.9University of Cincinnati-Main Campus 4,384,890 1.1 22,625,475 7.6 95 10.5University of Nebraska-Lincoln 4,024,510 1.9 17,845,686 2.2 46 -13.2Case Western Reserve University (Ohio) 4,012,571 39.4 15,455,803 5.9 60 -3.2Purdue University-Main Campus (Indiana) 3,744,518 5.1 28,830,166 23.3 91 23.0Southern Illinois University Carbondale 3,435,266 -1.6 10,718,232 -23.5 36 -14.3Ohio University-Main Campus 3,358,780 1.7 12,650,051 6.4 46 4.5Wayne State University (Michigan) 3,236,985 -5.4 19,137,116 -2.1 71 -22.8Kent State University-Kent Campus (Ohio) 2,954,524 11.6 11,395,014 7.7 61 24.5Iowa State University 2,858,448 -2.7 19,261,043 -0.7 58 34.9University of Illinois at Chicago 2,258,519 -17.7 18,204,718 -19.3 60 -7.7
Northeast (average) 6,828,123 11.1 40,862,250 13.4 141 2.4
Harvard University (Massachusetts) 21,273,455 11.4 118,830,376 -1.7 438 -18.3Columbia University (New York) 14,017,905 13.9 69,387,873 12.2 290 -8.8Yale University (Connecticut) 12,447,663 -7.8 98,096,304 22.5 215 -6.9Cornell University (New York) 9,788,164 11.5 54,400,003 10.0 203 -1.9Princeton University (New Jersey) 9,478,393 21.4 59,020,202 18.9 157 7.5Pennsylvania State University-Main Campus 8,340,207 31.1 57,960,191 13.7 239 42.3University of Pennsylvania 8,261,485 14.6 51,429,532 21.2 164 12.3New York University 7,576,852 20.3 66,746,521 29.5 276 54.2University of Pittsburgh-Pittsburgh Campus 6,888,761 3.4 33,358,072 4.9 107 -9.3Brown University (Rhode Island) 6,349,029 34.4 24,820,872 16.2 75 1.4Rutgers the State University of New Jersey 6,050,495 20.1 40,628,128 18.4 98 7.7Syracuse University (New York) 5,534,501 22.4 24,061,980 26.5 84 23.5Temple University (Pennsylvania) 5,045,990 19.9 22,585,077 -3.4 91 19.7Boston Univeristy 4,703,636 15.5 25,617,854 9.0 104 -1.0University of Massachusetts Amherst 4,330,784 7.3 19,716,318 21.5 60 -3.2SUNY College at Buffalo 4,209,814 2.2 21,904,677 12.8 92 4.5Boston College 3,830,380 26.7 25,509,659 17.6 85 13.3University of Rochester (New York) 3,605,111 -12.0 25,140,766 35.9 87 -3.3University of Connecticut 3,569,714 -6.2 23,305,990 -3.9 55 -37.5Dartmouth University (New Hampshire) 3,512,118 6.9 23,172,856 17.1 68 11.5Massachusetts Institute of Technology 3,262,468 -10.2 26,103,497 17.1 100 0.0SUNY at Albany 2,708,654 9.0 12,590,551 7.9 61 0.0SUNY at Stony Brook 2,261,249 -1.5 15,444,455 5.6 84 20.0
District of Columbia
Georgetown University (Washington, D.C.) 4,343,606 9.1 28,334,178 0.9 99 1.0George Washington Univerisity (Washington, D.C.) 3,120,037 -3.8 34,891,075 34.0 121 59.2Howard University (Washington, D.C.) 2,779,248 4.9 11,282,534 44.2 28 3.7

Copies of the Fact Book on Higher Education are available from the SREB publications office. SREB continuously monitors new comparative data and makes them available on the SREB website: www.sreb.org. The website also features an online edition of the Fact Book with links to the latest updates of the tables and individual Featured Facts reports for each of the 16 SREB states.
SREB Fact Book 2019 183
Throughout its 49-year history, the SREB-State Data Exchange has recognized the importance of reporting comparative data by institutional category. States have very different mixes of institutional types; therefore, comparisons by institutional category can support the analysis of statewide aggregate data.
Designed to be used for interstate statistical comparisons, the SREB method groups postsecondary education institutions into categories based on their resource requirements. Factors used to determine requirements include size (number of degrees awarded and full-time-equivalent enrollment), role (types of degrees awarded), breadth of program offerings (number of program areas in which degrees are granted) and comprehensiveness (distribution of degrees across program areas). Other factors, such as cost differences among programs or externally-funded research, are not considered relevant to determining resource requirements.
The SREB-State Data Exchange recognizes that methods of grouping institutions may serve different purposes. For example, in funding formulas for colleges and universities, states take additional characteristics into account in forming comparison groups. The SREB-State Data Exchange assists states in analyzing groups across states by making the institution-level data from its survey available on SREB’s website. In addition, many SREB publications report results using the categories listed in this appendix.
For most four-year institutions, category assignments are based on program completion data from the previous academic year. For two-year colleges, technical colleges and technical institutes, SREB uses the estimated full-time-equivalent enrollment data for the current academic year. The classifications reported here are from the 2017-18 SREB-State Data Exchange and are based upon 2016-17 program completion data and 2017-18 estimated full-time-equivalent enrollments.
Before it can be reclassified into a different category, an institution must meet the criteria of that category for three consecutive years.
Appendix A SREB-State Data ExchangeDefinitions of Institutional Categories and Listing of Public Four-Year Institutions, Two-Year Colleges, Technical Colleges and Technical Institutes
184 SREB Fact Book 2019
Four-Year 1: Institutions awarding at least 100 research and scholar- ship doctoral degrees that are distributed among at least 10 CIP categories (two-digit classification), with no more than 50 percent in any one category.
AL Auburn University AL University of Alabama AR University of Arkansas, FayettevilleDE University of DelawareFL Florida Atlantic UniversityFL Florida International UniversityFL Florida State University FL University of Central FloridaFL University of FloridaFL University of South Florida GA Georgia State University GA University of GeorgiaKY University of KentuckyKY University of LouisvilleLA Louisiana State University and A&M CollegeMD University of Maryland, College ParkMS Mississippi State UniversityMS University of MississippiMS1
MS University of Southern MississippiNC North Carolina State University NC University of North Carolina at Chapel Hill NC University of North Carolina at CharlotteNC University of North Carolina at GreensboroOK Oklahoma State University Main CampusOK University of Oklahoma Norman CampusSC Clemson UniversitySC University of South Carolina – ColumbiaTN University of MemphisTN University of Tennessee, KnoxvilleTX Texas A&M University TX Texas Tech University TX University of HoustonTX University of North TexasTX University of Texas at ArlingtonTX University of Texas at AustinTX University of Texas at DallasTX University of Texas at San AntonioVA George Mason UniversityVA Old Dominion UniversityVA University of Virginia
VA Virginia Commonwealth UniversityVA Virginia TechWV West Virginia University
Four-Year 2: Institutions awarding at least 30 research and scholar- ship doctoral degrees that are distributed among at least five CIP categories (two-digit classification).
AL University of Alabama at BirminghamAL1
AL University of Alabama in HuntsvilleAR University of Arkansas at Little RockAR1
GA Georgia Institute of TechnologyLA Louisiana Tech UniversityLA University of Louisiana at LafayetteLA University of New OrleansMD Morgan State UniversityMD University of Maryland, Baltimore CountyMS Jackson State UniversityNC East Carolina UniversityTN East Tennessee State UniversityTN Middle Tennessee State UniversityTN1 TN Tennessee State UniversityTX Texas State UniversityTX Texas Woman’s UniversityTX1
TX University of Texas at El PasoTX2
VA College of William and Mary
Four-Year 3: Institutions awarding at least 100 master’s, education specialist, postmaster’s, or research and scholarship doctoral degrees — with master’s, education specialist and post-master’s degrees distributed among at least 10 CIP categories (two-digit classification).
AL Alabama Agricultural and Mechanical UniversityAL Jacksonville State University AL Troy UniversityAL University of South AlabamaAL2
AL University of North AlabamaAR Arkansas State UniversityAR Arkansas Tech UniversityAR University of Central Arkansas DE Delaware State UniversityFL Florida Agricultural & Mechanical UniversityFL University of North Florida

SREB Fact Book 2019 185
FL University of West FloridaGA Georgia Southern UniversityGA Kennesaw State UniversityGA University of West GeorgiaGA Valdosta State UniversityKY Eastern Kentucky University KY Morehead State UniversityKY Murray State University KY Northern Kentucky UniversityKY Western Kentucky University LA McNeese State UniversityLA1
LA Southeastern Louisiana UniversityLA Southern University and A&M College
at Baton RougeLA University of Louisiana at MonroeMD Towson UniversityMD University of BaltimoreNC Appalachian State University NC North Carolina A&T State UniversityNC1
NC North Carolina Central University NC University of North Carolina at WilmingtonNC Western Carolina University OK Northeastern State UniversityOK University of Central OklahomaSC College of CharlestonSC The Citadel, the Military College of South
CarolinaSC Winthrop University TN Austin Peay State UniversityTN Tennessee Technological UniversityTN University of Tennessee at ChattanoogaTX Angelo State UniversityTX Lamar UniversityTX Midwestern State UniversityTX Prairie View A&M UniversityTX Sam Houston State University TX Stephen F. Austin State UniversityTX Sul Ross State UniversityTX Tarleton State UniversityTX Texas A&M International UniversityTX Texas A&M University – CommerceTX Texas A&M University – Corpus Christi TX Texas A&M University – KingsvilleTX Texas Southern UniversityTX3
TX University of Houston – Clear Lake
TX University of Texas – Rio Grande ValleyTX University of Texas at TylerTX University of Texas of the Permian BasinTX West Texas A&M UniversityVA James Madison UniversityVA1
VA Longwood UniversityVA Norfolk State UniversityVA Radford UniversityVA University of Mary WashingtonVA Virginia State UniversityWV Marshall University
Four-Year 4: Institutions awarding at least 30 master’s, education specialist, postmaster’s or doctoral degrees — with master’s, education specialist and post-master’s degrees distributed among at least five CIP categories (two-digit classification).
AL Alabama State UniversityAL Auburn University at MontgomeryAR Henderson State UniversityAR Southern Arkansas UniversityFL Florida Gulf Coast UniversityGA Albany State University GA Armstrong Atlantic State UniversityGA Augusta UniversityGA Clayton State UniversityGA Columbus State UniversityGA Fort Valley State UniversityGA Georgia College and State UniversityGA Georgia Southwestern State UniversityGA1
GA University of North GeorgiaKY Kentucky State UniversityLA Grambling State UniversityLA Louisiana State University in ShreveportLA Nicholls State UniversityLA Northwestern State UniversityMD Bowie State UniversityMD Frostburg State UniversityMD Salisbury UniversityMD University of Maryland Eastern ShoreMS Alcorn State UniversityMS Delta State UniversityMS Mississippi Valley State UniversityNC Fayetteville State University

186 SREB Fact Book 2019
OK Southeastern Oklahoma State UniversityOK Southwestern Oklahoma State UniversityOK1
TX Texas A&M University – Central TexasTX Texas A&M University – TexarkanaTX University of Houston – Victoria
Four-Year 5: Institutions awarding at least 30 master’s, education spe-cialist, postmaster’s or doctoral degrees.
AL University of MontevalloAL University of West AlabamaAR University of Arkansas at MonticelloAR2
GA Savannah State UniversityLA Southern University at New OrleansMD Coppin State UniversityMS Mississippi University for WomenNC University of North Carolina at PembrokeNC Winston-Salem State UniversityOK Cameron University OK East Central University OK Langston UniversityOK Northwestern Oklahoma State University SC Coastal Carolina UniversitySC1
SC Francis Marion University SC South Carolina State UniversityTN University of Tennessee at MartinTX Sul Ross State University – Rio Grande CollegeTX4
TX Texas A&M University at GalvestonTX Texas A&M University – San AntonioTX University of Houston – DowntownTX5
VA Christopher Newport UniversityVA2
WV Concord UniversityWV Fairmont State UniversityWV Shepherd UniversityWV West Liberty University
Four-Year 6: Institutions awarding at least 100 bachelor’s degrees that are distributed among at least five CIP categories (two-digit classification) with bachelor’s degrees being at least 30 per-cent of the total awards (including certificates) and awarding fewer than 30 master’s, education specialist, postmaster’s or doctoral degrees.
AL Athens State UniversityAR University of Arkansas – Fort Smith
AR University of Arkansas at Pine BluffAR3
FL New College of FloridaGA College of Coastal GeorgiaGA Dalton State CollegeGA Georgia Gwinnett CollegeGA Middle Georgia State CollegeLA Louisiana State University at AlexandriaMD Saint Mary’s College of MarylandMD1
NC Elizabeth City State UniversityNC University of North Carolina at AshevilleOK Oklahoma Panhandle State University OK Rogers State UniversityOK University of Science and Arts of OklahomaSC Lander UniversitySC University of South Carolina – AikenSC University of South Carolina – BeaufortSC University of South Carolina – UpstateVA University of Virginia’s College at WiseWV Bluefield State College WV Glenville State College WV West Virginia State UniversityWV West Virginia University Institute of Technology
Specialized: Special-purpose institutions that offer specialized degree programs. These may include medical or health science centers and, in some instances, stand-alone law schools, fine arts schools, engineering schools, military academies or other occupational specialty institutions.
AL Marion Military Institute AR University of Arkansas for Medical Sciences LA Louisiana State University Health Sciences
Center – New Orleans LA Louisiana State University Health Sciences
Center – Shreveport MD University of Maryland University College MD University of Maryland, Baltimore MS University of Mississippi Medical Center NC North Carolina School of the Arts SC Medical University of South CarolinaTN University of Tennessee Health Science CenterTX Texas A&M Health Science CenterTX Texas Tech University Health Sciences CenterTX University of North Texas at Dallas
SREB Fact Book 2019 187
TX University of North Texas Health Science Center at Fort Worth
TX University of Texas Health Science Center at Houston
TX University of Texas Health Science Center at San Antonio
TX University of Texas MD Anderson Cancer CenterTX University of Texas Medical Branch at GalvestonTX University of Texas Southwestern Medical Center at
DallasVA Virginia Military InstituteWV Greenbrier Practical School of NursingWV Mingo Extended Learning CenterWV Randolph Technical CenterWV Summers County School of NursingWV West Virginia School of Osteopathic MedicineWV Wood County School of Practical Nursing Two-Year With Bachelor’s: Institutions awarding primarily associate degrees and offering college transfer courses; some bachelor’s degrees are awarded.
FL Broward CollegeFL Chipola CollegeFL College of Central FloridaFL Daytona State CollegeFL Eastern Florida State CollegeFL1
FL Florida Gateway CollegeFL Florida SouthWestern State CollegeFL Florida State College at JacksonvilleFL Gulf Coast State CollegeFL Indian River State CollegeFL Lake-Sumter Community CollegeFL2
FL Miami-Dade CollegeFL Northwest Florida State CollegeFL Palm Beach State CollegeFL Pensacola State CollegeFL Polk State CollegeFL Santa Fe CollegeFL Seminole State College of FloridaFL South Florida State CollegeFL3
FL St. Johns River State CollegeFL St. Petersburg CollegeFL State College of Florida, Manatee – SarasotaFL Valencia College
GA Abraham Baldwin Agricultural CollegeGA2
GA Atlanta Metropolitan State CollegeGA Darton State CollegeGA3
GA East Georgia State CollegeGA Georgia Highlands CollegeGA4
GA Gordon State CollegeGA5
GA South Georgia State CollegeOK Oklahoma State University Technical Branch –
OkmulgeeOK Oklahoma State University – Oklahoma CityTX Brazosport CollegeTX Midland CollegeTX South Texas CollegeWV Potomac State College of West Virginia
UniversityWV West Virginia University at Parkersburg
Two-Year 1: Institutions awarding associate degrees and college transfer courses, with FTE enrollment of 5,000 or more. Some certificates and diplomas also may be awarded.
AL Jefferson State Community CollegeAL John C. Calhoun State Community College AR Northwest Arkansas Community CollegeAR Pulaski Technical CollegeAR4
FL Hillsborough Community College FL Pasco-Hernando State CollegeFL4
FL Tallahassee Community College GA Georgia Perimeter CollegeGA6
KY Bluegrass Community and Technical CollegeKY Jefferson Community and Technical CollegeLA Baton Rouge Community CollegeLA Bossier Parish Community CollegeLA2
LA Delgado Community CollegeMD Anne Arundel Community College MD College of Southern MarylandMD2
MD Community College of Baltimore CountyMD Howard Community CollegeMD Montgomery CollegeMD Prince George’s Community College MS Hinds Community CollegeMS Holmes Community CollegeMS3
MS Itawamba Community CollegeMS4
MS Mississippi Gulf Coast Community CollegeMS Northwest Mississippi Community College
188 SREB Fact Book 2019
NC Asheville-Buncombe Technical Community College
NC Cape Fear Community CollegeNC Central Piedmont Community College NC Fayetteville Technical Community CollegeNC Forsyth Technical Community CollegeNC Guilford Technical Community CollegeNC Pitt Community CollegeNC Rowan-Cabarrus Community CollegeNC2
NC Wake Technical Community CollegeOK Oklahoma City Community CollegeOK Tulsa Community CollegeSC Greenville Technical College SC Horry-Georgetown Technical CollegeSC Midlands Technical College SC Tri-County Technical CollegeSC2
SC Trident Technical College TN Chattanooga State Technical Community College TN Nashville State Technical Community CollegeTN Pellissippi State Technical Community CollegeTN Southwest Tennessee Community CollegeTN Volunteer State Community CollegeTX Amarillo College TX Austin Community College TX Blinn College TX Brookhaven College (DCCCD)TX Central Texas College TX Collin County Community College DistrictTX Del Mar College TX Eastfield College (DCCCD)TX El Centro College (DCCCD)TX El Paso County Community College DistrictTX Houston Community CollegeTX Laredo Community College TX Lone Star College System DistrictTX McLennan Community CollegeTX Navarro CollegeTX North Central Texas Community CollegeTX North Lake College (DCCCD)TX Northwest Vista College (ACCD)TX Palo Alto College (ACCD)TX Richland College (DCCCD)TX San Antonio College (ACCD)TX San Jacinto CollegeTX South Plains College TX St. Philip’s College (ACCD)
TX Tarrant County CollegeTX Trinity Valley Community CollegeTX Tyler Junior College VA J.S. Reynolds Community CollegeVA John Tyler Community CollegeVA Northern Virginia Community College VA Thomas Nelson Community CollegeVA Tidewater Community College Two-Year 2: Institutions awarding associate degrees and college transfer courses, with FTE enrollment of 2,000 to 4,999. Some certificates and diplomas also may be awarded.
AL Bevill State Community CollegeAL Bishop State Community CollegeAL Gadsden State Community CollegeAL George C. Wallace State Community College –
DothanAL James H. Faulkner State Community CollegeAL Lawson State Community CollegeAL Northwest – Shoals Community CollegeAL Shelton State Community CollegeAL Southern Union State Community CollegeAL Wallace Community College – HancevilleAR Arkansas State University – BeebeDE Delaware Technical and Community College –
TerryDE1
KY Ashland Community and Technical CollegeKY1
KY Big Sandy Community and Technical CollegeKY Elizabethtown Community and Technical
CollegeKY Maysville Community and Technical CollegeKY Owensboro Community and Technical CollegeKY Somerset Community and Technical CollegeKY West Kentucky Community and Technical
CollegeLA Louisiana Delta Community CollegeLA South Louisiana Community CollegeLA Southern University in ShreveportMD Allegany College of MarylandMD3
MD Baltimore City Community CollegeMD Carroll Community CollegeMD Frederick Community College MD Hagerstown Community CollegeMD Harford Community College MS Copiah-Lincoln Community College
SREB Fact Book 2019 189
MS East Central Community CollegeMS East Mississippi Community College MS Jones County Junior College MS Meridian Community CollegeMS Mississippi Delta Community CollegeMS Northeast Mississippi Community CollegeMS Pearl River Community CollegeNC Alamance Community CollegeNC Caldwell Community College & Technical
InstituteNC Catawba Valley Community CollegeNC Central Carolina Community CollegeNC Cleveland Community CollegeNC Coastal Carolina Community CollegeNC Craven Community College NC Davidson County Community College NC Durham Technical Community CollegeNC Edgecombe Community CollegeNC3
NC Gaston CollegeNC Johnston Community CollegeNC Lenoir Community College NC Mitchell Community College NC Nash Community CollegeNC Randolph Community CollegeNC Richmond Community CollegeNC Robeson Community CollegeNC4
NC Sandhills Community College NC Stanly Community CollegeNC Surry Community College NC Vance-Granville Community College NC Wayne Community CollegeNC Wilkes Community College OK Northern Oklahoma CollegeOK Rose State CollegeSC Central Carolina Technical College SC Florence-Darlington Technical CollegeSC3
SC Orangeburg-Calhoun Technical CollegeSC4
SC Piedmont Technical CollegeSC Spartanburg Community CollegeSC York Technical CollegeTN Cleveland State Community College TN Columbia State Community College TN Jackson State Community College TN Motlow State Community College TN Northeast State Technical Community CollegeTN Roane State Community College
TN Walters State Community College TX Alvin Community College TX Angelina College TX Cedar Valley College (DCCCD)TX Cisco Junior CollegeTX Coastal Bend CollegeTX College of the MainlandTX Grayson County College TX Hill CollegeTX Howard College (HCCCD)TX Kilgore CollegeTX Lamar Institute of TechnologyTX Lee CollegeTX6 TX Mountain View College (DCCCD)TX7
TX Northeast Texas Community CollegeTX Odessa CollegeTX Paris Junior CollegeTX Southwest Texas Junior College TX Temple College TX Texarkana College TX Texas Southmost CollegeTX Texas State Technical College – Harlingen TX Texas State Technical College – WacoTX Vernon CollegeTX Victoria College TX Weatherford College TX Wharton County Junior College VA Blue Ridge Community CollegeVA Central Virginia Community CollegeVA Danville Community CollegeVA3
VA Germanna Community College VA Lord Fairfax Community College VA New River Community CollegeVA Piedmont Virginia Community CollegeVA Southwest Virginia Community CollegeVA Virginia Highlands Community College
Two-Year 3: Institutions awarding associate degrees and college transfer courses, with FTE enrollment of less than 2,000. Some certificates and diplomas also may be awarded.
AL Alabama Southern Community CollegeAL Central Alabama Community CollegeAL Chattahoochee Valley State Community
College
190 SREB Fact Book 2019
AL Enterprise State Community CollegeAL George C. Wallace State Community College –
SelmaAL Jefferson Davis Community CollegeAL Lurleen B. Wallace Community CollegeAL Northeast Alabama State Community CollegeAL3
AL Snead State Community CollegeAR Arkansas Northeastern CollegeAR Arkansas State University Mid-SouthAR Arkansas State University Mountain HomeAR Arkansas State University – NewportAR Black River Technical CollegeAR College of the OuachitasAR Cossatot Community College of the University of
ArkansasAR East Arkansas Community College AR National Park CollegeAR5
AR North Arkansas CollegeAR Ozarka CollegeAR Phillips Community College of the University of
ArkansasAR Rich Mountain Community College AR South Arkansas Community CollegeAR Southeast Arkansas CollegeAR Southern Arkansas University TechAR University of Arkansas Community College at
BatesvilleAR University of Arkansas Community College at
HopeAR University of Arkansas Community College at
MorriltonFL Florida Keys Community CollegeFL5
FL North Florida Community CollegeFL6
GA Bainbridge State CollegeGA7
KY Hazard Community and Technical CollegeKY Henderson Community College KY Hopkinsville Community CollegeKY2
KY Madisonville Community CollegeKY3
KY Southeast Kentucky Community and Technical CollegeKY4
LA Louisiana Delta Community CollegeLA South Louisiana Community CollegeLA Southern University in ShreveportMD Cecil Community College MD Chesapeake College
MD Garrett College MD Wor-Wic Community CollegeMS Coahoma Community College MS Southwest Mississippi Community College NC Beaufort County Community CollegeNC Bladen Community CollegeNC Blue Ridge Community CollegeNC Brunswick Community CollegeNC Carteret Community CollegeNC College of the AlbemarleNC Halifax Community College NC Haywood Community CollegeNC Isothermal Community CollegeNC James Sprunt Community CollegeNC Martin Community College NC Mayland Community CollegeNC McDowell Technical Community CollegeNC Montgomery Community CollegeNC Pamlico Community CollegeNC Piedmont Community CollegeNC Roanoke-Chowan Community CollegeNC Rockingham Community CollegeNC Sampson Community CollegeNC South Piedmont Community CollegeNC5
NC Southeastern Community CollegeNC Southwestern Community CollegeNC6
NC Tri-County Community College NC Western Piedmont Community CollegeNC7
NC Wilson Technical Community CollegeOK Carl Albert State CollegeOK Connors State CollegeOK Eastern Oklahoma State College OK Murray State CollegeOK Northeastern Oklahoma A&M CollegeOK Redlands Community CollegeOK Seminole State CollegeOK Western Oklahoma State CollegeSC Aiken Technical CollegeSC Denmark Technical CollegeSC Northeastern Technical CollegeSC Technical College of the Low CountrySC University of South Carolina – LancasterSC University of South Carolina – SalkehatchieSC University of South Carolina – SumterSC University of South Carolina – Union
SREB Fact Book 2019 191
SC Williamsburg Technical College TN Dyersburg State Community CollegeTX Clarendon College TX Frank Phillips College TX Galveston College TX Lamar State College – OrangeTX Lamar State College – Port ArthurTX Northeast Lakeview College (ACCD)TX Panola CollegeTX Ranger College TX Southwest Collegiate Institute for the Deaf
(HCCCD)TX Texas State Technical College – Fort BendTX Texas State Technical College – MarshallTX Texas State Technical College – North TexasTX Texas State Technical College – West TexasTX Western Texas College VA D.S. Lancaster Community CollegeVA Eastern Shore Community College VA Mountain Empire Community CollegeVA Patrick Henry Community CollegeVA4
VA Paul D. Camp Community College VA Rappahannock Community CollegeVA Richard Bland College VA Southwest Virginia Community CollegeVA Virginia Highlands Community College VA Wytheville Community CollegeVA5
WV Blue Ridge Community & Technical CollegeWV1
WV BridgeValley Community & Technical CollegeWV Eastern West Virginia Community & Technical
CollegeWV Mountwest Community & Technical CollegeWV New River Community & Technical CollegeWV Pierpont Community & Technical CollegeWV Southern West Virginia Community & Technical
College WV West Virginia Northern Community College
Technical Institute or College 1: Institutions awarding vocational-technical certificates and diplomas, with FTE enrollment of 1,000 or more. Some vocational-technical associate degrees also may be awarded.
AL Trenholm State Technical CollegeGA Albany Technical College
GA Athens Technical CollegeGA Atlanta Technical CollegeGA Augusta Technical CollegeGA Central Georgia Technical CollegeGA Chattahoochee Technical CollegeGA Coastal Pines Technical CollegeGA Columbus Technical CollegeGA Georgia Northwestern Technical CollegeGA Georgia Piedmont Technical College GA Gwinnett Technical CollegeGA Lanier Technical CollegeGA North Georgia Technical CollegeGA Oconee Fall Line Technical CollegeGA8
GA Ogeechee Technical CollegeGA Savannah Technical CollegeGA South Georgia Technical CollegeGA Southeastern Technical CollegeGA Southern Crescent Technical CollegeGA Southern Regional Technical CollegeGA West Georgia Technical CollegeGA Wiregrass Georgia Technical CollegeKY Gateway Community and Technical CollegeKY Southcentral Kentucky Community and
Technical CollegeLA Central LA Technical CollegeLA L.E. Fletcher Technical Community CollegeLA Northshore Technical CollegeLA Northwest LA Technical CollegeLA3
LA South Central LA Technical CollegeLA Sowela Technical Community CollegeOK Canadian Valley Technology Center OK Francis Tuttle Technology Center OK Tulsa Technology Center – Lemley CampusTN Tennessee Technology Center at ChattanoogaTN2
Technical Institute or College 2: Institutions awarding vocational-technical certificates and diplomas, with FTE enrollment of less than 1,000. Some vocational-technical associate degrees also may be awarded.
AL J.F. Drake State Technical CollegeAL J.F. Ingram State Technical College AL Reid State Technical College OK Autry Technology Center OK Caddo Kiowa Technology Center
192 SREB Fact Book 2019
OK Central Technology Center OK Chisholm Trail Technology Center OK Eastern Oklahoma County Technology Center OK Gordon Cooper Technology Center OK Great Plains Technology CenterOK Green Country Technology Center OK High Plains Technology Center OK Indian Capital Technology Center – Muskogee OK Indian Capital Technology Center – Sallisaw OK Indian Capital Technology Center – Stilwell OK Indian Capital Technology Center – Tahlequah OK Kiamichi Technology Center – Atoka OK Kiamichi Technology Center – Durant OK Kiamichi Technology Center – Hugo OK Kiamichi Technology Center – Idabel OK Kiamichi Technology Center – McAlester OK Kiamichi Technology Center – Poteau OK Kiamichi Technology Center – Spiro OK Kiamichi Technology Center – Stigler OK Kiamichi Technology Center – Talihina OK Meridian Technology Center OK Metro Technology CentersOK2 OK Mid-America Technology Center OK Mid-Del Technology Center OK Moore Norman Technology CenterOK3
OK Northeast Technology Center – Afton OK Northeast Technology Center – ClaremoreOK Northeast Technology Center – Kansas OK Northeast Technology Center – Pryor OK Northwest Technology Center – Alva OK Northwest Technology Center – Fairview OK Pioneer Technology Center OK Pontotoc Technology Center OK Red River Technology Center OK Southern Oklahoma Technology Center OK Southwest Technology Center OK Tri County Technology Center OK Tulsa County Area Voc Tech School Dist 18 –
Peoria OK Tulsa Technology Center – Broken Arrow
CampusOK Tulsa Technology Center – Owasso OK Tulsa Technology Center – Riverside Campus OK Tulsa Technology Center – Sand Springs OK Wes Watkins Technology Center
OK Western Technology Center TN Tennessee Technology Center at AthensTN Tennessee Technology Center at CovingtonTN Tennessee Technology Center at CrossvilleTN Tennessee Technology Center at CrumpTN Tennessee Technology Center at DicksonTN Tennessee Technology Center at ElizabethtonTN Tennessee Technology Center at HarrimanTN Tennessee Technology Center at HartsvilleTN Tennessee Technology Center at HohenwaldTN Tennessee Technology Center at JacksboroTN Tennessee Technology Center at JacksonTN Tennessee Technology Center at KnoxvilleTN Tennessee Technology Center at LivingstonTN Tennessee Technology Center at McKenzieTN Tennessee Technology Center at McMinnvilleTN Tennessee Technology Center at MemphisTN Tennessee Technology Center at MorristownTN Tennessee Technology Center at MurfreesboroTN Tennessee Technology Center at NashvilleTN Tennessee Technology Center at NewbernTN Tennessee Technology Center at OneidaTN Tennessee Technology Center at ParisTN Tennessee Technology Center at PulaskiTN Tennessee Technology Center at RipleyTN Tennessee Technology Center at ShelbyvilleTN Tennessee Technology Center at Whiteville
Technical Institute or College — Size Unknown:Institutions awarding vocational-technical certificates and diplomas whose FTE enrollment was not reported. Some vocational-technical associate degrees also may be awarded.
WV Academy of Careers and Technology (Raleigh County)
WV Benjamin Franklin Vocational Center WV Boone County Career & Technical Center WV Cabell County Career Technology CenterWV Carver Vocational Center WV Fayette Institute of TechnologyWV Fred W. Eberle Technical Center WV Garnet Career Center WV James Rumsey Technical InstituteWV John D. Rockefeller IV Career Center

SREB Fact Book 2019 193
WV Marion County Vocational-Technical CenterWV McDowell County Vocational-Technical Center WV Mercer County Vocational-Technical CenterWV Mineral County Vocational- Technical Center WV Monongalia County Technical Education Center
WV Putnam Career and Technical CenterWV Ralph R. Willis Career and Technical CenterWV Roane-Jackson Technical CenterWV South Branch Career & Technical CenterWV United Technical CenterWV Wyoming County
KY3 Reclassified: Met the criteria for Two-Year 3 in 2015-16, 2016-17, and 2017-18.
KY4 Reclassified: Met the criteria for Two-Year 3 in 2015-16, 2016-17, and 2017-18.
LA1 Reclassified: Met the criteria for Four-Year 3 in 2015-16, 2016-17, and 2017-18.
LA2 Met the criteria for Two-Year 2 in 2017-18.LA3 Met the criteria for Technical Institute or College 2
in 2017-18. MD1 Met the criteria for Four-Year 5 in 2017-18.MD2 Met the criteria for Two-Year 2 in 2017-18.MD2 Met the criteria for Two-Year 3 in 2016-17 and 2017-18.MS1 Reclassified: Met the criteria for Four-Year 1 in 2015-16,
2016-17, and 2017-18.MS2 Met the criteria for Four-Year 4 in 2017-18.MS3 Reclassified: Met the criteria for Two-Year 1 in 2015-16,
2016-17, and 2017-18.MS4 Met the criteria for Two-Year 2 in 2017-18.NC1 Met the criteria for Four-Year 2 in 2016-17 and 2017-18.NC2 Met the criteria for Two-Year 2 in 2016-17 and 2017-18.NC3 Met the criteria for Two-Year 3 in 2016-17 and 2017-18.NC4 Met the criteria for Two-Year 3 in 2016-17 and 2017-18.NC5 Met the criteria for Two-Year 2 in 2016-17 and 2017-18.NC6 Met the criteria for Two-Year 2 in 2016-17 and 2017-18.NC7 Reclassified: Met the criteria for Two-Year 3 in 2015-16,
2016-17, and 2017-18.OK1 Reclassified: Met the criteria for Four-Year 4 in 2015-16,
2016-17, and 2017-18.OK2 Reclassified: Met the criteria for Technical Institute or College
2 in 2015-16, 2016-17, and 2017-18.OK3 Met the criteria for Technical Institute or College 1 in
2017-18.SC1 Met the criteria for Four-Year 4 in 2016-17 and 2017-18.SC2 Met the criteria for Two-Year 2 in 2016-17 and 2017-18.SC3 Reclassified: Met the criteria for Two-Year 2 in 2015-16,
2016-17, and 2017-18.
AL1 Met the criteria for Four-Year 1 in 2016-17 and 2017-18.AL2 Met the criteria for Four-Year 2 in 2016-17 and 2017-18.AL3 Reclassified: Met the criteria for Two-Year 3 in 2015-16, 2016-
17, and 2017-18.AR1 Met the criteria for Four-Year 3 in 2017-18.AR2 Met the criteria for Four-Year 4 in 2017-18. AR3 Met the criteria for Four-Year 5 in 2016-17 and 2017-18. AR4 Met the criteria for Two-Year 2 in 2016-17 and 2017-18. AR5 Reclassified: Met the criteria for Two-Year 3 in 2015-16, 2016-
17, and 2017-18. DE1 Met the criteria for Two-Year 1 in 2017-18.FL1 Reclassified: Met the criteria for Two-Year with Bachelor’s
in 2015-16, 2016-17, and 2017-18. FL2 Reclassified: Met the criteria for Two-Year with Bachelor’s
in 2015-16, 2016-17, and 2017-18.FL3 Reclassified: Met the criteria for Two-Year with Bachelor’s
in 2015-16, 2016-17, and 2017-18. FL4 Met the criteria for Two-Year with Bachelor’s in 2016-17 and
2017-18. FL5 Met the criteria for Two-Year 1 in 2017-18.FL6 Met the criteria for Two-Year 1 in 2017-18. GA1 Reclassified: Met the criteria for Four-Year 4 in 2015-16, 2016-
17, and 2017-18.GA2 Met the criteria for Four-Year 6 in 2017-18. GA3 Met the criteria for Two-Year 3 in 2017-18. GA4 Reclassified: Met the criteria for Two-Year with Bachelor’s
in 2015-16, 2016-17, and 2017-18. GA5 Met the criteria for Four-Year 6 in 2017-18. GA6 Met the criteria for Two-Year 3 in 2017-18. GA7 Met the criteria for Two-Year with Bachelor’s in 2017-18. GA8 Met the criteria for Technical Institute or College 2 in
2017-18. KY1 Met the criteria for Two-Year 3 in 2017-18.KY2 Reclassified: Met the criteria for Two-Year 3 in 2015-16, 2016-
17, and 2017-18.
194 SREB Fact Book 2019
SC4 Met the criteria for Two-Year 3 in 2016-17 and 2017-18.TN1 Reclassified: Met the criteria for Four-Year 2 in 2015-16,
2016-17, and 2017-18.TN2 Met the criteria for Technical Institute or College 2 in
2017-18.TX1 Met the criteria for Four-Year 1 in 2016-17 and 2017-18.TX2 Met the criteria for Four-Year 1 in 2017-18.TX3 Met the criteria for Four-Year 2 in 2016-17 and 2017-18.TX4 Met the criteria for Four-Year 6 in 2017-18.TX5 Met the criteria for Four-Year 4 in 2017-18.
TX6 Met the criteria for Two-Year 1 in 2016-17 and 2017-18.TX7 Met the criteria for Two-Year 1 in 2016-17 and 2017-18.VA1 Met the criteria for Four-Year 2 in 2017-18.VA2 Met the criteria for Four-Year 4 in 2016-17 and 2017-18.VA3 Met the criteria for Two-Year 3 in 2016-17 and 2017-18. VA4 Reclassified: Met the criteria for Two-Year 3 in 2015-16,
2016-17, and 2017-18.VA5 Reclassified: Met the criteria for Two-Year 3 in 2015-16,
2016-17, and 2017-18.WV1 Met the criteria for Two-Year 2 in 2017-18.
SREB Fact Book 2019 195
The following is a list of the agency heads for the SREB states’ postsecondary education agencies that reported comparative data on colleges, universities, technical colleges and technical institutes in the 2017-18 SREB-State Data Exchange. For 49 years, the SREB-State Data Exchange has annually collected comparative data on higher education. The support and cooperation of these agencies is vital to the success of the Data Exchange.
AlabamaJim Purcell, Executive DirectorAlabama Commission on Higher EducationP.O. Box 302000Montgomery, AL 36104Phone: (334) 242-2139Email: [email protected]: www.ache.edu
ArkansasMaria Markham, Director Arkansas Department of Higher Education 423 Main Street, Suite 400 Little Rock, AR 72201-3801 Phone: (501) 371-2030 Email: [email protected] Website: www.adhe.edu
DelawareShana Payne, DirectorDelaware Higher Education OfficeThe Townsend Building401 Federal Street, Suite 2 Dover, DE 19901-3639Phone: (302) 735-4120Email: [email protected] Website: www.doe.k12.de.us
FloridaMarshall Kriser III, Chancellor State University System of Florida Board of Governors Turlington Building 325 West Gaines Street, Suite 1614 Tallahassee, FL 32399-0400 Phone: (850) 245-0466 Email: [email protected] Website: www.flbog.org
Kathryn Hebda, Chancellor Division of Florida Colleges Turlington Building 325 West Gaines Street, Room 1514 Tallahassee, FL 32399-6533 Phone: (850) 245-0407 Email: [email protected] Website: www.fldoe.org
Appendix B SREB-State Data Exchange Agency Heads
196 SREB Fact Book 2019
GeorgiaSteve Wrigley, Chancellor Board of Regents of the University System of Georgia 270 Washington Street S.W. Atlanta, GA 30334-1450 Phone: (404) 962-3000 Email: [email protected] Website: www.usg.edu
Matt Arthur, CommissionerTechnical College System of Georgia1800 Century Place, Suite 400Atlanta, GA 30345-4304Phone: (404) 679-1601Email: [email protected] Website: www.tcsg.edu
KentuckyAaron Thompson, PresidentKentucky Council on Postsecondary Education1024 Capital Center Drive, Suite 320Frankfort, KY 40601-8204Phone: (502) 573-1555Email: [email protected] Website: www.cpe.ky.gov
LouisianaKim Hunter Reed, Commissioner of Higher EducationLouisiana Board of Regents1201 N. Third St., Suite 6-200Baton Rouge, LA 70802-5243Phone: (225) 342-4253Email: [email protected] Website: www.regents.la.gov
MarylandJames D. Fielder Jr., Secretary of Higher EducationMaryland Higher Education Commission6 North Liberty Street, 10th FloorBaltimore, MD 21201-3705Phone: (410) 767-3300Email: [email protected] Website: www.mhec.state.md.us
MississippiAlfred Rankins Jr., Commissioner Mississippi State Institutions of Higher Learning 3825 Ridgewood Road, Suite 915 Jackson, MS 39211-6453 Phone: (601) 432-6198 Email: [email protected] Website: www.ihl.state.ms.us
Andrea Mayfield, Executive DirectorMississippi Community College Board3825 Ridgewood RoadJackson, MS 39211-6453Phone: (601) 432-6684Email: [email protected] Website: www.mccb.edu
North CarolinaWilliam L. Roper, Interim PresidentUniversity of North Carolina System 910 Raleigh RoadP.O. Box 2688Chapel Hill, NC 27514-3916Phone: (919) 962-6983Email: [email protected] Website: www.northcarolina.edu
Peter Hans, PresidentNorth Carolina Community College System200 West Jones StreetRaleigh, NC 27603-1379Phone: (919) 807-6951Email: [email protected] Website: www.nccommunitycolleges.edu
SREB Fact Book 2019 197
OklahomaGlen D. Johnson, ChancellorOklahoma State Regents for Higher EducationP.O. Box 108850Oklahoma City, OK 73101-8850Phone: (405) 225-9120Email: [email protected] Website: www.okhighered.org
Marcie Mack, State DirectorOklahoma Department of Career and Technology Education1500 West 7th AvenueStillwater, OK 74074-4398Phone: (405) 743-5430Email: [email protected] Website: www.okcareertech.org
South CarolinaRusty L. Monhollon, President and Executive DirectorSouth Carolina Commission on Higher Education1122 Lady Street, Suite 300Columbia, SC 29201-3218Phone: (803) 737-2260Website: www.che.sc.gov
TennesseeMike Krause, Interim President and Executive Director Tennessee Higher Education Commission404 James Robertson Parkway, Suite 1900Nashville, TN 37243-0820Phone: (615) 741-7561Email: [email protected] Website: www.tn.gov
TexasRaymund A. Paredes, CommissionerTexas Higher Education Coordinating BoardP.O. Box 12788Austin, TX 78711-2788Phone: (512) 427-6101Email: [email protected] Website: www.thecb.state.tx.us
VirginiaPeter Blake, DirectorState Council of Higher Education for VirginiaJames Monroe Building101 North 14th Street, 10th floorRichmond, VA 23219-3665Phone: (804) 225-2611Email: [email protected] Website: www.schev.edu
West VirginiaCarolyn Long, Interim ChancellorWest Virginia Higher Education Policy Commission 1018 Kanawha Boulevard East, Suite 700 Charleston, WV 25301-2841Phone: (304) 558-0699Email: [email protected] Website: www.wvhepc.edu
Sarah Armstrong Tucker, ChancellorCommunity and Technical College System of West Virginia1018 Kanawha Boulevard East, Suite 700Charleston, WV 25301-2841Phone: (304) 558-0265Email: [email protected] Website: www.wvctcs.org
Deanna Canterbury-Penn, CoordinatorOffice of Career Technical Education West Virginia Department of Education 1900 Kanawha Boulevard EastBuilding 6, Room 221Charleston, WV 25305-0009Phone: (304) 558-2348Email:[email protected]: www.wvde.state.wv.us

Copies of the Fact Book on Higher Education are available from the SREB publications office. SREB continuously monitors new comparative data and makes them available on the SREB website: www.sreb.org. The website also features an online edition of the Fact Book with links to the latest updates of the tables and individual Featured Facts reports for each of the 16 SREB states.

Continued from inside front cover
Enrollment at four-year institutions was almost flat in the nation and in SREB states increased about 2 percent between 2012 and 2017 while two-year college enrollment dropped 11 percent nationwide and 10 percent in the SREB region. This drop at two-year colleges is troubling because these institutions enroll more non-traditional-age students. These adult students might need more job retraining to meet advancing skill demands in the workplace.
Students who entered college in fall 2011 as first-time, full-time, bachelor’s degree seeking students had a 78 percent progression rate as of 2016-17 — a 2 percentage-point increase over the last five years. First-time, full-time, degree- or certificate-seeking students who enrolled in two-year colleges in fall 2014 in the SREB region had a 57 percent progression rate by 2016-17, a 6 percentage-point increase over those who entered in fall 2009. If these rates continue to rise, they will lead to higher completion rates.
College affordability challenges efforts to raise education attainment levels
Keeping college affordable remains a challenge for SREB states. Many factors, including tuition and fees, student financial aid, state support of higher education, and family income affect college costs. The data indicate that most students and their families continue to struggle with paying for college.
The median annual tuition and fees for the SREB region increased between 2016-17 and 2017-18. These costs for in-state undergraduates at public four-year institutions totaled $8,000, an increase of 4 percent over the year before, adjusting for inflation. The increase nationwide was 2 percent.
Pell grant dollars awarded to students in the region dropped 6 percent. The number of Pell Grant recipients in the SREB region dropped by 18 percent, including a 16 percent drop at public colleges. Pell grants pay $3,972 on average in the SREB region and a maximum of $5,920; they boost a family’s ability to pay for college, but they are insufficient by themselves to cover costs. SREB states led other regions in overall state scholarships and grants. State financial aid in SREB states reached nearly $5.5 billion in 2016-17 — 43 percent of the nation’s total. In SREB states, need-based state scholarships totaled $2.4 billion, 29 percent of the U.S. total need-based aid. Non-need based state scholarships totaled $2.2 billion, 86 percent of the nation’s total non-need based aid.
Nationwide student loans represent a lower percentage of total student aid than grants and scholarships. Student borrowing peaked in 2011-12 and has since decreased by $9 billion dollars to under $106 billion. Federal loans provided $29 billion in loans for students in SREB states.
Postsecondary education, as always, will need to continue to prepare individuals for high-skills positions. But it will also need to play a more intentional role in helping more students develop middle-skills than it has in the past. Forecasters say that automation will launch at least as many jobs requiring education beyond high school — but not necessarily leading to a college-level degree — as it eliminates. As Unprepared and Unaware points out, no one needs to lose a job, but nearly everyone will need to learn new, more challenging skills for the jobs that will become available. Postsecondary institutions are key for most students, regardless of age and experience, in preparing for the future workforce. Postsecondary institutions are the key for most students and adults.
The Workforce ChallengeImproving Education to Meet the Region’s Workforce Challenge
SREB Fact Book 2019

Southern Regional Education Board592 10th St., N.W.Atlanta, GA 30318-5776(404) 875-9211
SREB.org
June 2019 (19E04)