Embed Size (px)
Citation preview

EniFact Book2018

MissionWe are an energy company.We are working to build a future where everyone can access energy resources efficiently and sustainably. Our work is based on passion and innovation, on our unique strengths and skills, on the quality of our people and in recognising that diversity across all aspects of our operations and organisation is something to be cherished. We believe in the value of long term partnerships with the countries and communities where we operate.

EniFact Book2018
Eni’s Fact Book is a supplement to Eni’s Annual Report and is designed to provide supplemental financial and operating information. It contains certain forward-looking statements regarding capital expenditure, dividends, allocation of future cash flow from operations, evolution of financial structure, future operating performance, targets of production and sale growth, execution of projects. By their nature, forward-looking statements involve risks and uncertainties because they relate to events and depend on circumstances that will or may occur in the future. Actual results may differ from those expressed in such statements, depending on a variety of factors, including the timing of bringing new oil&gas fields on stream; management’s ability in carrying out industrial plans and in succeeding in commercial transactions; future levels of industry product supply; demand and pricing of oil, gas and refined products; operational problems; general economic conditions; geopolitical factors including international tensions, social and political instability, changes in the economic and legal frameworks in Eni’s Countries of operations, regulation of the oil&gas industry, power generation and environmental field, development and use of new technologies; changes in public expectations and other changes in business conditions; the actions of competitors.


Contents
T A B L E S8 7 |
Eni at a glance 4
Main data 6
Exploration & Production 11
Gas & Power 63
Refining & Marketing and Chemicals 72
Financial data 87
Employees 101
Quarterly information 102
EUROPE E&P G&P R&M&C
Austria • •Belgium • •Cyprus •Czech Republic •Denmark •France • •Germany • •Greece • •Greenland •Hungary •Ireland •Italy • • •Luxembourg •Montenegro •Norway •Poland •Romania •Slovakia •Slovenia •Spain • •Sweden •Switzerland • •the Netherlands • •the United Kingdom • • •Turkey • •
ASIA AND OCEANIA E&P G&P R&M&C
Australia •Bahrain •China • • •India • • •Indonesia • •Iraq •Japan •Kazakhstan •Kuwait •Lebanon •Myanmar •Oman • •Pakistan • •Russia • • •Saudi Arabia •Singapore • •South Korea • •Taiwan •the United Arab Emirates • •Timor Leste •Turkmenistan •Vietnam •
AFRICA E&P G&P R&M&C
Algeria •Angola •Congo • •Egypt • • •Gabon • •Ghana • •Ivory Coast •Kenya •Libya • •Morocco •Mozambique •Nigeria •South Africa •Tunisia • • •
AMERICA E&P G&P R&M&C
Argentina •Canada •Ecuador • •Mexico •the United States • • •Venezuela • •ENI OPERATES IN 67 COUNTRIES

E N I A T A G L A N C E4
ENI AT A GLANCE
2018: year of outstanding financial and industrial results achieved thanks to the implementation of our strategy.
2018 results were driven by our successful exploration activity supported by the “dual exploration” strategy allowing Eni to early monetize discoveries, to achieve efficiency through the optimization of hydrocarbon reserves time-to-market, the breakeven decrease in downstream businesses and the financial discipline on spending. The optimization of existing portfolio, the geographical diversification strategy and the improved balance of assets portfolio along the value chain through a robust growth in the Middle East, together with our commitment in promoting local development, in environmental protection and in fostering Eni’s expertise and technologies, enabled Eni to seize synergies and growth opportunities.
The outstanding financial results of the year were achieved against a backdrop of highly volatile Brent prices, due to signs of weakening global growth, oversupply, uncertainty tied to the commercial dispute between the USA and China, the Brexit, as well as geopolitical issues.
ENI GROUP2018 2017 2016 2015 2014
Operating profit (loss) (€ million) 9,983 8,012 2,157 (3,076) 8,965
Adjusted operating profit (loss) 11,240 5,803 2,315 5,708 12,337
Net cash flow from operations 13,647 10,117 7,673 12,875 14,469
TRIR (Total recordableinjury rate)
(total recordable injuries/worked hours) x 1,000,000 0.35 0.33 0.35 0.45 0.71
Leverage 0.16 0.23 0.28 0.29 0.21
€11.24 BLN+94% vs. 2017GROUP ADJUSTED OPERATING PROFIT
€13.45 BLN+35% vs. 2017ADJUSTED NET CASH FLOWFROM OPERATIONS
€8.29 BLN-24% vs. 2017NET BORROWINGS
-6% vs. 2017UPSTREAM GHG INTENSITY INDEX
0.35 TRIRAMONG THE LOWEST LEVELCOMPARED TO THE AVERAGEOF THE INDUSTRY
0.16 leverageTHE LOWEST LEVEL IN THE LAST 12 YEARS
52$/barrel2018 CASH NEUTRALITY
Exploration & Production
Gas & Power
Refining & Marketing and Chemicals
ADJUSTED OPERATING PROFIT (€ bln)
100%
80%
60%
40%
20%
0
-20%
PROFITABLE AND DISCIPLINED GROWTH
12.3
2014
5.7
2015
2.3
2016
5.8
2017
11.2
2018
Hydrocarbon production (kboe/d)
Cash flow per boe ($/boe)
E&P capex (€ bln)
10.2
7.9
1,851
2014 2015 2016 2017 2018
1,598
30.1
20.9
12.9
20.2
22.5

En
i Fa
ct B
oo
k 2
018
E N I A T A G L A N C E 5
2018 results Target Actual 2018 - New plan 2019-2021 2018-2021 plan
620 mmboe Discovered resources 2.5 bboe 2 bboe
2.5% vs. 2017 at constant prices CAGR hydrocarbon production ~3.5% 3.5%
25 $/barrel Upstream new projects breakeven 25 $/barrel 30 $/barrel
8.8 MTPA LNG contracted volumes @ 2025 16 MTPA 14 MTPA
3 $/barrel Refining long-term breakeven margin 1.5 $/barrel 3 $/barrel
GHG upstream emissive intensity index -6% Decarbonization strategy Zero upstream carbon footprint
by 2030
€8.29 BLN-24% vs. 2017NET BORROWINGS
Thanks to the deep transformation process started in 2014, Eni today, after years of oil market downturn, owns a sustainable financialstructure and is resilient to the volatility of scenario as never before. Through the strict implementation of our strategic guidelines Eni wasable to combine growth, profitability and soundness of financial position, achieving record hydrocarbon production at 1.85 million boe/d in2018, reducing net borrowings to €8.3 billion, with a leverage of 0.16, the lowest level in the last 12 years, among the best in the industry,thus distributing €16.2 billion of dividend in last five years, on the backdrop of a challenging trading environment.
OUR TRANSFORMATION AND OUR TARGETS
The efficient and resilient growth will be supported by a strategy aimed at increasing integration of businesses, geographic diversification of the activities and rebalancing of the upstream vs. mid-downstream business through those actions already taken or characterized by an advanced maturity level and soundness. Eni also pursues a strategy targeted to the long-term carbon neutrality through a defined path, in addition, Eni, confirming its tradition, will also continue to promote local development.
FIANANCIAL SOUNDNESS DIVIDENDS PAID
2014 2015 2016
2017 2018
30
20
10
18
12
6
2014 2015 2016 2017 2018
Net borrowings (€ bln)
Leverage (%)
€16.2 billionin the last 5 years
VOLATILE TRADING ENVIRONMENT
1.329
99
3.2
99
1.181
71
71
3.7
2014 2015 2016 2017 2018
Brent dated crude oil ($/bbl) EUR/USD
2014 2015 2016 2017 2018
Brent dated crude oil ($/bbl) SERM ($/bbl)
1.85million boe/dNEW RECORD IN HYDROCARBON PRODUCTION
+110%
vs. 2017UPSTREAM PROFITABILITY
+154%vs. 2017G&P PROFITABILITY

M A I N D A T A6
KEY FINANCIAL DATA(*)
(€ million) 2018 2017 2016 2015 2014Net sales from operations 75,822 66,919 55,762 72,286 98,218
of which: Exploration & Production 25,744 19,525 16,089 21,436 28,488
Gas & Power 55,690 50,623 40,961 52,096 73,434
Refining & Marketing and Chemicals 25,216 22,107 18,733 22,639 28,994
Corporate and other activities 1,589 1,462 1,343 1,468 1,429Impact of unrealized intragroup profit elimination and consolidation adjustments (32,417) (26,798) (21,364) (25,353) (34,127)
Operating profit (loss) 9,983 8,012 2,157 (3,076) 8,965
of which: Exploration & Production 10,214 7,651 2,567 (959) 10,727
Gas & Power 629 75 (391) (1,258) 64
Refining & Marketing and Chemicals (380) 981 723 (1,567) (2,811)
Corporate and other activities (691) (668) (681) (497) (518)
Impact of unrealized intragroup profit elimination 211 (27) (61) 1,205 1,503
Operating profit (loss) 9,983 8,012 2,157 (3,076) 8,965
Exclusion of special items 1,161 (1,990) 333 7,648 1,912
Exclusion of inventory holding (gains) losses 96 (219) (175) 1,136 1,460
Adjusted operating profit (loss)(a) 11,240 5,803 2,315 5,708 12,337
of which: Exploration & Production 10,850 5,173 2,494 4,182 11,679
Gas & Power 543 214 (390) (126) 168
Refining & Marketing and Chemicals 380 991 583 695 (412)
Corporate and other activities (606) (542) (452) (369) (443)Impact of unrealized intragroup profit elimination and consolidation adjustments 73 (33) 80 1,326 1,345
Net profit (loss)(b) 4,126 3,374 (1,464) (8,778) 1,303
of which: continuing operations 4,126 3,374 (1,051) (7,952) 1,720
discontinuing operations (413) (826) (417)
Adjusted net profit (loss)(a)(b) 4,583 2,379 (340) 803 3,723
Net cash flow from operating activities 13,647 10,117 7,673 12,875 14,469
Net cash flow from operating activities - standalone(a) 13,647 10,117 7,673 12,155 13,544
Capital expenditure 9,119 8,681 9,180 10,741 11,178
Shareholders' equity including non-controlling interests at year end 51,073 48,079 53,086 57,409 65,641
Net borrowings at year end 8,289 10,916 14,776 16,871 13,685
Leverage 0.16 0.23 0.28 0.29 0.21
Net capital employed at year end 59,362 58,995 67,862 74,280 79,326
of which: Exploration & Production 50,358 49,801 57,910 53,968 51,061
Gas & Power 3,143 3,394 4,100 5,803 9,031
Refining & Marketing and Chemicals 7,371 7,440 6,981 6,986 9,711
(*) Pertaining to continuing operations. (a) Non-GAAP measures. 2014-2015 results are calculated on a standalone basis, i.e. by excluding the results of Saipem earned from both third parties and the Group’s continuing operations, therefore determining its deconsolidation.(b) Attributable to Eni’s shareholders.
KEY MARKET INDICATORS
2018 2017 2016 2015 2014Average price of Brent dated crude oil in US dollars(a) ($/barrel) 71.04 54.27 43.69 52.46 98.99
Average EUR/USD exchange rate(b) 1.181 1.130 1.107 1.110 1.329
Average price of Brent dated crude oil (€) 60.15 48.03 39.47 47.26 74.48
Standard Eni Refining Margin (SERM)(c) ($) 3.7 5.0 4.2 8.3 3.2
TTF (€/kcm) 243 183 148 210 221
PSV (€/kcm) 260 211 168 234 246
(a) Source: Platt’s Oilgram.(b) Source: BCE.(c) Source: In $/BBL FOB Mediterranean Brent dated crude oil. Source: Eni calculations. Approximates the margin of Eni’s refining system in consideration of material balances and refineries’ product yields.
MAIN DATA
M A I N D A T AE
ni F
ac
t Bo
ok
20
187
SELECTED OPERATING DATA(*)
2018 2017 2016 2015 2014
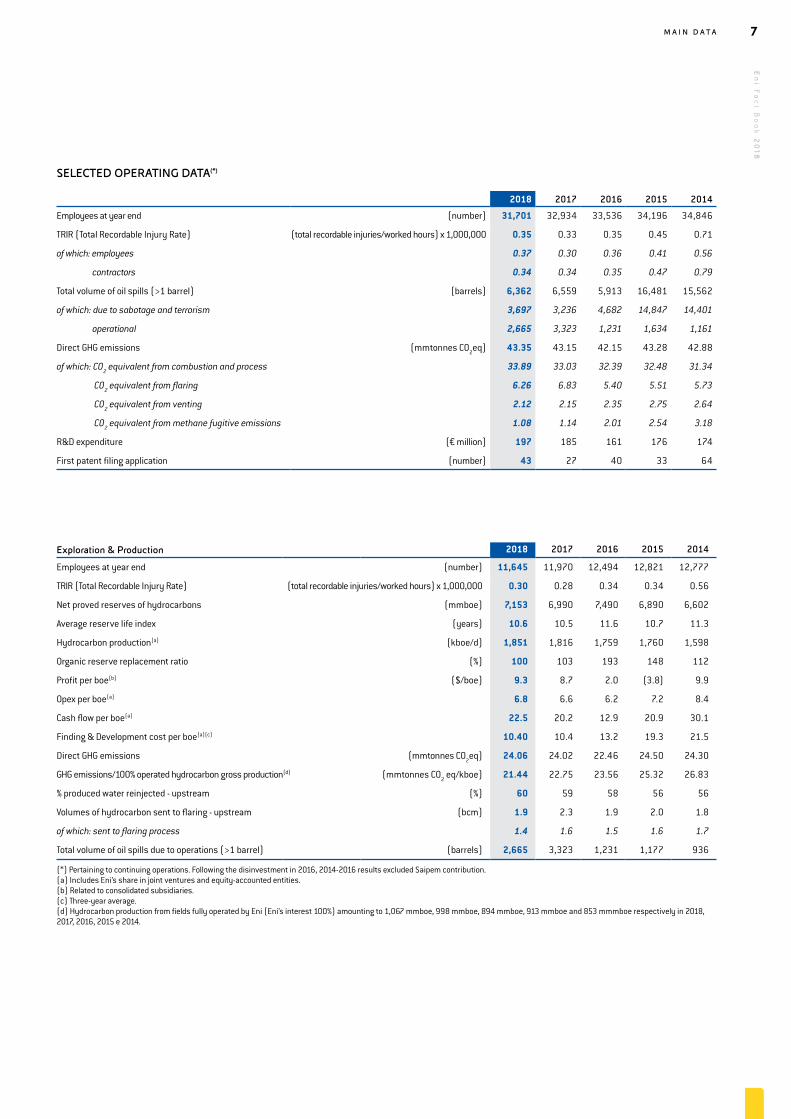
Employees at year end (number) 31,701 32,934 33,536 34,196 34,846
TRIR (Total Recordable Injury Rate) (total recordable injuries/worked hours) x 1,000,000 0.35 0.33 0.35 0.45 0.71
of which: employees 0.37 0.30 0.36 0.41 0.56
contractors 0.34 0.34 0.35 0.47 0.79
Total volume of oil spills (>1 barrel) (barrels) 6,362 6,559 5,913 16,481 15,562
of which: due to sabotage and terrorism 3,697 3,236 4,682 14,847 14,401
operational 2,665 3,323 1,231 1,634 1,161
Direct GHG emissions (mmtonnes CO2eq) 43.35 43.15 42.15 43.28 42.88
of which: CO2 equivalent from combustion and process 33.89 33.03 32.39 32.48 31.34
CO2 equivalent from flaring 6.26 6.83 5.40 5.51 5.73
CO2 equivalent from venting 2.12 2.15 2.35 2.75 2.64
CO2 equivalent from methane fugitive emissions 1.08 1.14 2.01 2.54 3.18
R&D expenditure (€ million) 197 185 161 176 174
First patent filing application (number) 43 27 40 33 64
Exploration & Production 2018 2017 2016 2015 2014
Employees at year end (number) 11,645 11,970 12,494 12,821 12,777
TRIR (Total Recordable Injury Rate) (total recordable injuries/worked hours) x 1,000,000 0.30 0.28 0.34 0.34 0.56
Net proved reserves of hydrocarbons (mmboe) 7,153 6,990 7,490 6,890 6,602
Average reserve life index (years) 10.6 10.5 11.6 10.7 11.3
Hydrocarbon production(a) (kboe/d) 1,851 1,816 1,759 1,760 1,598
Organic reserve replacement ratio (%) 100 103 193 148 112
Profit per boe(b) ($/boe) 9.3 8.7 2.0 (3.8) 9.9
Opex per boe(a) 6.8 6.6 6.2 7.2 8.4
Cash flow per boe(a) 22.5 20.2 12.9 20.9 30.1
Finding & Development cost per boe(a)(c) 10.40 10.4 13.2 19.3 21.5
Direct GHG emissions (mmtonnes CO2eq) 24.06 24.02 22.46 24.50 24.30
GHG emissions/100% operated hydrocarbon gross production(d) (mmtonnes CO2 eq/kboe) 21.44 22.75 23.56 25.32 26.83
% produced water reinjected - upstream (%) 60 59 58 56 56
Volumes of hydrocarbon sent to flaring - upstream (bcm) 1.9 2.3 1.9 2.0 1.8
of which: sent to flaring process 1.4 1.6 1.5 1.6 1.7
Total volume of oil spills due to operations (>1 barrel) (barrels) 2,665 3,323 1,231 1,177 936
(*) Pertaining to continuing operations. Following the disinvestment in 2016, 2014-2016 results excluded Saipem contribution.(a) Includes Eni’s share in joint ventures and equity-accounted entities. (b) Related to consolidated subsidiaries. (c) Three-year average. (d) Hydrocarbon production from fields fully operated by Eni (Eni’s interest 100%) amounting to 1,067 mmboe, 998 mmboe, 894 mmboe, 913 mmboe and 853 mmmboe respectively in 2018, 2017, 2016, 2015 e 2014.

M A I N D A T A8
Refining & Marketing and Chemicals 2018 2017 2016 2015 2014
Employees at year end (number) 11,136 10,916 10,858 10,995 11,884
TRIR (Total Recordable Injury Rate) (total recordable injuries/worked hours) x 1,000,000 0.56 0.62 0.38 1.07 1.51
Total volume of oil spills due to operations (>1 barrel) (barrels) 1,069 289 134 427 225
Direct GHG emissions (mmtonnes CO2eq) 8.19 7.82 8.50 8.19 8.45
SOx emissions (sulphur oxide) (ktonnes SO2eq) 4.80 5.18 4.35 6.17 6.84
Refinery throughputs on own account (mmtonnes) 23.23 24.02 24.52 26.41 25.03
Retail market share in Italy (%) 24.0 24.3 24.3 24.5 25.5
Retail sales of petroleum products in Europe (mmtonnes) 8.39 8.54 8.59 8.89 9.21
Service stations in Europe at year end (number) 5,448 5,544 5,622 5,846 6,220
Average throughput of service stations in Europe (kliters) 1,776 1,783 1,742 1,754 1,725
Balanced capacity of refineries (kbbl/d) 548 548 548 548 617
Capacity of biorefineries (ktonnes/year) 360 360 360 360 360
Production of biofuels (ktonnes) 219 206 191 179 105
GHG emissions/products (crude oil and semifinished) processed in refineries (tonnes CO2eq/kt) 253 258 278 253 301
Production of petrochemical products (ktonnes) 9,483 8,955 8,809 8,670 7,926
Sales of petrochemical products 4,938 4,646 4,745 4,813 4,681
Average chemical plant utilization rate (%) 76 73 72 73 71
Gas & Power 2018 2017 2016 2015 2014
Employees at year end (number) 3,040 4,313 4,261 4,484 4,561
TRIR (Total Recordable Injury Rate) (total recordable injuries/worked hours) x 1,000,000 0.56 0.37 0.29 0.89 0.82
Worldwide gas sales (bcm) 76.71 80.83 86.31 87.72 86.11
of which: Italy 39.03 37.43 38.43 38.44 34.04
outside Italy 37.68 43.40 47.88 52.44 52.27
LNG sales 10.3 8.3 8.1 9.0 8.9
Retail customers in Italy (million) 7.7 7.7 7.7 7.8 7.9
Direct GHG emissions (mmtonnes CO2eq) 11.08 11.30 11.17 10.57 10.12
GHG emissions/kWheq (EniPower) (gCO2eq/kWheq) 402 395 398 409 409
Installed capacity power plants (GW) 4.7 4.7 4.7 4.9 4.9
Electricity produced (TWh) 21.62 22.42 21.78 20.69 19.55
Electricity sold 37.07 35.33 37.05 34.88 33.58

M A I N D A T AE
ni F
ac
t Bo
ok
20
189
Share data
2018 2017 2016 2015 2014
Net profit (loss)(a)(b) (€) 1.15 0.94 (0.29) (2.21) 0.48
Dividend pertaining to the year 0.83 0.80 0.80 0.80 1.12
Dividend to Eni's shareholders pertaining to the year(c) (€ million) 2,989 2,881 2.,881 2,880 4,037
Cash dividend to Eni’s shareholders 2,954 2,880 2,881 3,457 4,006
Cash flow (€) 3.79 2.81 2.13 3.58 4.01
Dividend yield(d) (%) 5.9 5.7 5.4 5.7 7.6
Net profit (loss) per ADR(b)(e) ($) 2.72 2.12 (0.65) (4.90) 1.27
Dividend per ADR(e) 1.96 1.81 1.77 1.77 2.65
Cash flow per ADR(e) 8.95 6.35 4.72 7.95 10.66
Dividend yield per ADR(d)(e) (%) 5.9 5.7 5.4 5.7 7.6
Pay-out 72 85 (197) (33) 310
Number of shares at period-end (million) 3,601.1 3,601.1 3,634.2 3,634.2 3,634.2
Weighted average number of shares outstanding(f) (fully diluted) 3,601.1 3,601.1 3,601.1 3,601.1 3,610.4
Total Shareholders Return (TSR) (%) 4.8 (5.6) 19.2 1.1 (11.9)
(a) Calculated on the average number of Eni shares outstanding during the year.(b) Pertaining to Eni’s shareholders.(c) The amount of dividends for the year 2018 is based on the Board’s proposal.(d) Ratio between dividend of the year and average share price in December.(e) One ADR represents 2 shares. Net profit, dividends and cash flow data were converted using average exchange rates. Dividends data were converted at the Noon Buying Rate of the pay-out date.(f) Calculated by excluding own shares in portfolio.
Share information
2018 2017 2016 2015 2014
Share price - Milan Stock Exchange
High (€) 16.76 15.72 15.47 17.43 20.41
Low 13.33 12.96 10.93 13.14 13.29
Average 15.25 14.16 13.42 15.47 17.83
Year end 13.75 13.80 15.47 13.80 14.51
ADR price(a) - New York Stock Exchange
High ($) 40.09 34.09 33.33 39.29 55.30
Low 30.00 29.54 25.00 29.28 32.81
Average 35.98 31.98 29.74 34.31 47.37
Year end 31.50 33.19 32.24 29.80 34.91
Average daily exchanged shares (million shares) 12.99 13.89 18.41 20.30 17.21
Value (€ million) 197 197 246 312 304
Weighted average number of shares outstanding(b) (million shares) 3,601.1 3,601.1 3,601.1 3,601.1 3,610.4
Market capitalization(c)
EUR (billion) 50.0 50.2 56.2 50.2 52.4
USD 57.3 60.2 59.3 55.7 63.6
(a) One ADR represents 2 Eni’s shares.(b) Excluding treasury shares.(c) Number of outstanding shares by reference price at period end.
Data on Eni share placement
2001 1998 1997 1996 1995
Offer price (€/share) 13.60 11.80 9.90 7.40 5.42
Number of share placed (million shares) 200.1 608.1 728.4 647.5 601.9
of which: through bonus share 39.6 24.4 15.0 1.9
Percentage of share capital(a) (%) 5.0 15.2 18.2 16.2 15.0
Proceeds (€ million) 2,721 6,714 6,869 4,596 3,254
(a) Refers to share capital at December 31, 2018.
ENI SHARE PERFORMANCE

M A I N D A T A10
SHAREHOLDERS DISTRIBUTION BY GEOGRAPHIC AREA(*)
44.2%
9.3%
1.7%
17.9%
19.1%
7.8%
(*) As of January 11, 2019.
Rest of worldItalyUK and IrelandUSA and CanadaOtherRest of Europe
CLASS OF SHAREHOLDERS(*)
30.1%
11.1%0.8%
0.9%57.1%
(*) As of January 11, 2019.
Retail investorPublic holding
Treasury sharesOther
Institutional shareholders
20
8
10
12
14
16
18
30
40
50
€
2017 2018 May 6,2019
2017 2018 May 6,2019Eni
EniSource: Eni calculations based on BLOOMBERG data.
Source: Eni calculations based on BLOOMBERG data.
Indexed FTSE MIBto Eni share price
Indexed S&P 500 to Eni ADR price
Indexed Euro Stoxxto Eni share price
ENI SHARE PRICE IN MILAN(December 31, 2015 - May 6, 2019)
ENI ADR PRICE IN NEW YORK(December 31, 2015 - May 6, 2019)
USD
0.801.10
2013
Dividend (€/share)
(a) Refer to: BP, Chevron, Repsol, ExxonMobil, Royal Dutch Shell and Total.
Eni’s dividend yield (%)
Dividend yield - average of Oil & Gas petroleum companies(a) (%)
6.5
4.5 5.1
7.6 6.1
5.7
1.120.80 0.80 0.83
2016 2017 2018
0.86
201920152014
5.3
5.4
5.7 5.9
5.05.4
DIVIDEND PER SHARE

E X P L O R A T I O N & P R O D U C T I O NE
ni F
ac
t Bo
ok
20
1811
EXPLORATION& PRODUCTION
SELECTED OPERATING DATA
2018 2017 2016 2015 2014TRIR (Total Recordable Injury Rate) (recordable injuries/worked hours) x 1,000,000 0.30 0.28 0.34 0.34 0.56of which: employees 0.29 0.23 0.34 0.22 0.20
contractors 0.30 0.30 0.34 0.39 0.68Net sales from operations(a) (€ million) 25,744 19,525 16,089 21,436 28,488Operating profit (loss) 10,214 7,651 2,567 (959) 10,727Adjusted operating profit (loss) 10,850 5,173 2,494 4,182 11,679Adjusted net profit (loss) 4,955 2,724 508 991 4,569Capital expenditure 7,901 7,739 8,254 9,980 10,156Profit per boe(b) ($/boe) 9.3 8.7 2.0 (3.8) 9.9Opex per boe(c) 6.8 6.6 6.2 7.2 8.4Cash Flow per boe(c) 22.5 20.2 12.9 20.9 30.1Finding & Development cost per boe(c)(d) 10.4 10.4 13.2 19.3 21.5Average hydrocarbon realizations 47.48 35.06 29.14 36.47 65.49Hydrocarbon production(c) (kboe/d) 1,851 1,816 1,759 1,760 1,598Estimated net proved hydrocarbon reserves (mmboe) 7,153 6,990 7,490 6,890 6,602Reserves life index (years) 10.6 10.5 11.6 10.7 11.3Organic reserves replacement ratio (%) 100 103 193 148 112Employees at period end (number) 11,645 11,970 12,494 12,821 12,777Total volume of oil spills (>1 barrel) (barrels) 1,595 3,022 1,097 1,177 936Produced water re-injected (%) 60 59 58 56 56Direct GHG emissions (mmtonnes CO2eq) 24.06 24.02 22.46 24.50 24.30
GHG emissions/100% operated hydrocarbon gross production(e) (mmtonnes CO2eq/kboe) 21.44 22.75 23.56 25.32 26.83
(a) Before elimination of intragroup sales. (b) Related to consolidated subsidiaries. (c) Includes Eni’s share in joint ventures and equity-accounted entities. (d) Three-year average. (e) Hydrocarbon production from fields fully operated by Eni (Eni’s interest 100%) amounting to 1,067 mmboe, 998 mmboe, 894 mmboe, 913 mmboe and 853 mmboe respectively in 2018, 2017, 2016, 2015 and 2014.
PERFORMANCE OF THE YEAR
●Total recordable injury rate (TRIR) was 0.30, a level that is in the lowest range of the industry average; confirming Eni’s commitment to awareness and dissemination of the safety culture, achieving a reduction of 46% compared to 2014.
●Emissions from flaring were down by 8% from 2017 due to the achievement of the zero flaring configuration in the Burun field in Turkmenistan and the reduction of emergency flaring. This result confirms that we are well on track on our longterm target of zero routine flaring in 2025. In 2018, capital expenditure of flaring down projects was €39 million, in particular in Nigeria and Libya.
●Upstream GHG intensity index was positive with a reduction of 6% from 2017 and 20% from 2014. We achieved these results leveraging on the reduction of emissions from flaring, the gas production of the Zohr field in Egypt and the Jangkrik field in Indonesia as well as an increase production of Goliat field in Norway, which is an asset with lower intensity emission than the upstream average. This performance is in line with the target of 43% reduction in 2025 compared to 2014.
●Water reinjection was 60% in 2018, leveraging on the ongoing programs in certain operational plants, in particular in Egypt and Ecuador.
●In 2018, the E&P segment recorded the best result of the last four years, with an adjusted operating profit more than doubled compared to 2017. This performance reflected more than proportionally strong trend registered in hydrocarbons price scenario in the first ten months of 2018 (a rise of 31% in price of the Brent market benchmark in dollar term) and production growth, which was boosted by a larger weight of barrels with a higher profit per boe.
●Oil and natural gas production was a record level of 1.851 million boe/d, up by 2.5% from 2017 net of price effects. Start-ups and ramp-ups added more than 300 kboe/d to the production level of 2018.
●Net proved reserves at December 31, 2018 amounted to 7.15 bboe based on a reference Brent price of $71.4 per barrel. The all sources replacement ratio was 124%, 100% of organic replacement ratio (105% net of price effects); 131% three-year average organic replacement ratio. The reserves life index was 10.6 years (10.5 years in 2017).

E X P L O R A T I O N & P R O D U C T I O N12
PORTFOLIO MANAGEMENT
●Signed strategic agreements with the United Arab Emirates, Oman and Bahrain. In particular, the agreements reached in the United Arab Emirates and Oman include exploration, development and production of oil and gas fields, offshore and onshore. The agreement with Bahrain will create further exploration offshore opportunities. Technological innovation, scientific expertise, accelerated start-up and collaboration with host Countries allowed Eni to expand its footprint in a strategic area of the energy industry development:
- signed two Concession Agreements related to the acquisition of a 5% participating interest in the Lower Zakum oil field and a 10% participating interest in the Umm Shaif and Nasr oil, condensates and natural gas fields, in the offshore of Abu Dhabi, with duration of 40 years;
- awarded a 25% interest of the Ghasha offshore concession in the Abu Dhabi. The concession includes Hal, Ghasha, Dalma gas fields and certain offshore fields in the Al Dhafra area. Production start-up is expected in 2022. In January 2019, Eni was awarded the operatorship of the Block 1 and 2 with a 70% interest, located offshore of the Country;
- awarded the offshore exploration Block 47 in Oman and signed a Head of Agreement for the exploration Block 77, located onshore of the Country. Eni will operate both blocks with a 90% interest and 50% interest, respectively;
- signed a Memorandum of Understanding with the National Oil and Gas Authority of the Kingdom of Bahrain (NOGA). The agreement includes an exploration program for the offshore Block 1, an area still largely unexplored, located in the offshore northern territorial area of the Country;
- awarded three onshore exploration concessions in the Emirate of Sharjah.
●Dual Exploration Model:
- disposal of 10% interest of the Shorouk concession in Egypt, where is located the supergiant gas Zohr field, to Mubadala Petroleum, an United Arab Emirates oil company;
- farm-out of part of Eni’s interest in the Nour exploration license in Egypt to BP and Mubadala companies. These companies purchased a 25% interest and 20% interest, respectively;
- finalized swap agreements of stake in explorations assets located in Mexico with Lukoil company;
- signed an agreement to divest a 35% interest in the Area 1 license, where 2.1 billion of boe in place discovered, to Qatar Petroleum oil company.
●Strengthened the upstream activity in Norway with the the business combination between Eni Norge and Point Resources, leading to the creation of Vår Energi, an equity-accounted joint venture (Eni’s interest 69.6%) that will develop the activities of the two partners in Norway targeting a production plateau of 250 kboe/d in 2023.
EXPLORATION ACTIVITY
●Exploration activity is also a distinctive approach of Eni’s upstream model, ensuring a large amount of resources at low costs, flexibility in the short-term and fueling growth over the long term. In 2018 additions to the Company’s reserve backlog were 620 million boe of new equity resources. Main discoveries or appraisal activities were in Egypt, Cyprus, Norway, Angola, Nigeria, Mexico and Indonesia. The overall commercial success rate was 66% net to Eni, best performance of the last eighteen years.
● Finalized an agreement with BP and National Oil Company in Libya to boost exploration activities in the Country. The agreement strengthened the parties’ commitment to social development in the Country through the implementation of specific education and technical training programs.
●Awarded a 40% interest of the Blocks 4 and 9 located in the offshore Lebanon.
●Awarded a 100% interest of 124 exploration licenses located in the Eastern North Slope in Alaska with high mineral potential and nearby to existing production facilities.
●Signed the contract for the exploration and development rights of the offshore block A5-A, in the deep offshore of Zambesi. Eni was awarded the operatorship of the block with a 59.5% interest.
●Awarded a 65% interest in the Area 24 license and a 75% interst in the Area 28 license located in offshore Mexico. Eni operates both licenses.
●Replacing portfolio of exploration leases in the year, added approximately 29,300 square kilometers of new acreage.
E X P L O R A T I O N & P R O D U C T I O NE
ni F
ac
t Bo
ok
20
1813
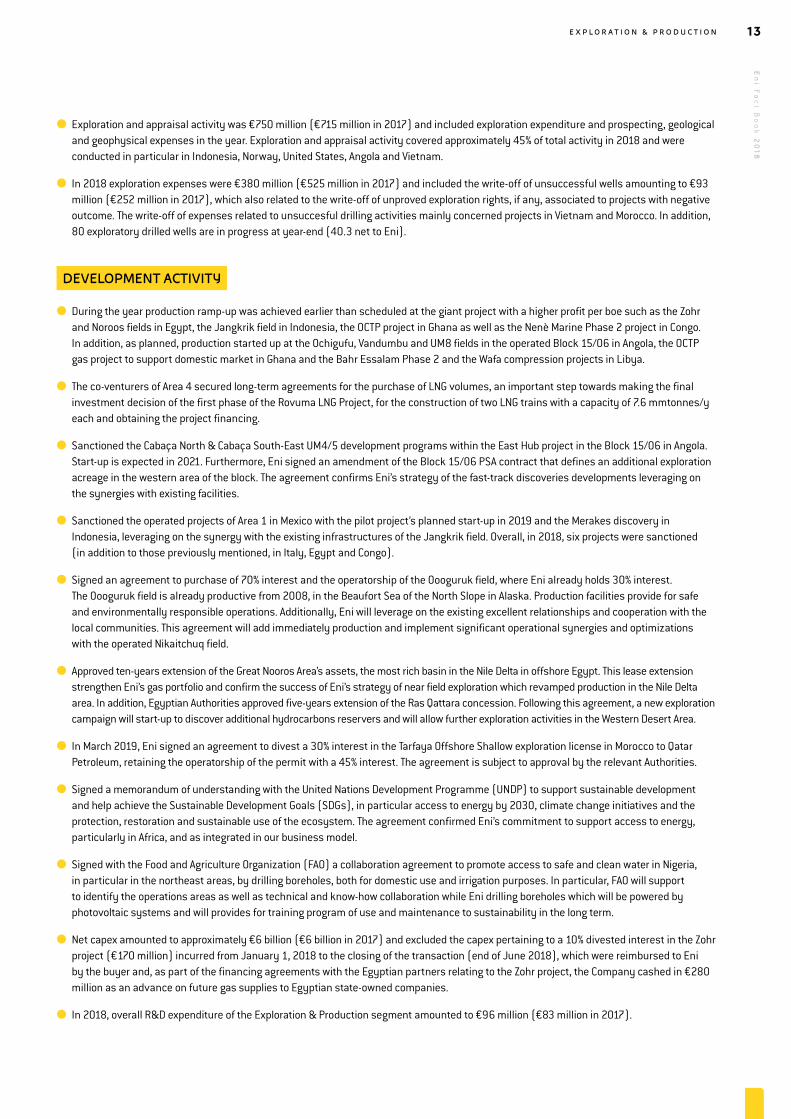
●Exploration and appraisal activity was €750 million (€715 million in 2017) and included exploration expenditure and prospecting, geological and geophysical expenses in the year. Exploration and appraisal activity covered approximately 45% of total activity in 2018 and were conducted in particular in Indonesia, Norway, United States, Angola and Vietnam.
● In 2018 exploration expenses were €380 million (€525 million in 2017) and included the write-off of unsuccessful wells amounting to €93 million (€252 million in 2017), which also related to the write-off of unproved exploration rights, if any, associated to projects with negative outcome. The write-off of expenses related to unsuccesful drilling activities mainly concerned projects in Vietnam and Morocco. In addition, 80 exploratory drilled wells are in progress at year-end (40.3 net to Eni).
DEVELOPMENT ACTIVITY
●During the year production ramp-up was achieved earlier than scheduled at the giant project with a higher profit per boe such as the Zohr and Noroos fields in Egypt, the Jangkrik field in Indonesia, the OCTP project in Ghana as well as the Nenè Marine Phase 2 project in Congo. In addition, as planned, production started up at the Ochigufu, Vandumbu and UM8 fields in the operated Block 15/06 in Angola, the OCTP gas project to support domestic market in Ghana and the Bahr Essalam Phase 2 and the Wafa compression projects in Libya.
● The co-venturers of Area 4 secured long-term agreements for the purchase of LNG volumes, an important step towards making the final investment decision of the first phase of the Rovuma LNG Project, for the construction of two LNG trains with a capacity of 7.6 mmtonnes/y each and obtaining the project financing.
●Sanctioned the Cabaça North & Cabaça South-East UM4/5 development programs within the East Hub project in the Block 15/06 in Angola. Start-up is expected in 2021. Furthermore, Eni signed an amendment of the Block 15/06 PSA contract that defines an additional exploration acreage in the western area of the block. The agreement confirms Eni’s strategy of the fast-track discoveries developments leveraging on the synergies with existing facilities.
●Sanctioned the operated projects of Area 1 in Mexico with the pilot project’s planned start-up in 2019 and the Merakes discovery in Indonesia, leveraging on the synergy with the existing infrastructures of the Jangkrik field. Overall, in 2018, six projects were sanctioned (in addition to those previously mentioned, in Italy, Egypt and Congo).
●Signed an agreement to purchase of 70% interest and the operatorship of the Oooguruk field, where Eni already holds 30% interest. The Oooguruk field is already productive from 2008, in the Beaufort Sea of the North Slope in Alaska. Production facilities provide for safe and environmentally responsible operations. Additionally, Eni will leverage on the existing excellent relationships and cooperation with the local communities. This agreement will add immediately production and implement significant operational synergies and optimizations with the operated Nikaitchuq field.
● Approved ten-years extension of the Great Nooros Area’s assets, the most rich basin in the Nile Delta in offshore Egypt. This lease extension strengthen Eni’s gas portfolio and confirm the success of Eni’s strategy of near field exploration which revamped production in the Nile Delta area. In addition, Egyptian Authorities approved five-years extension of the Ras Qattara concession. Following this agreement, a new exploration campaign will start-up to discover additional hydrocarbons reservers and will allow further exploration activities in the Western Desert Area.
● In March 2019, Eni signed an agreement to divest a 30% interest in the Tarfaya Offshore Shallow exploration license in Morocco to Qatar Petroleum, retaining the operatorship of the permit with a 45% interest. The agreement is subject to approval by the relevant Authorities.
●Signed a memorandum of understanding with the United Nations Development Programme (UNDP) to support sustainable development and help achieve the Sustainable Development Goals (SDGs), in particular access to energy by 2030, climate change initiatives and the protection, restoration and sustainable use of the ecosystem. The agreement confirmed Eni’s commitment to support access to energy, particularly in Africa, and as integrated in our business model.
●Signed with the Food and Agriculture Organization (FAO) a collaboration agreement to promote access to safe and clean water in Nigeria, in particular in the northeast areas, by drilling boreholes, both for domestic use and irrigation purposes. In particular, FAO will support to identify the operations areas as well as technical and know-how collaboration while Eni drilling boreholes which will be powered by photovoltaic systems and will provides for training program of use and maintenance to sustainability in the long term.
●Net capex amounted to approximately €6 billion (€6 billion in 2017) and excluded the capex pertaining to a 10% divested interest in the Zohr project (€170 million) incurred from January 1, 2018 to the closing of the transaction (end of June 2018), which were reimbursed to Eni by the buyer and, as part of the financing agreements with the Egyptian partners relating to the Zohr project, the Company cashed in €280 million as an advance on future gas supplies to Egyptian state-owned companies.
● In 2018, overall R&D expenditure of the Exploration & Production segment amounted to €96 million (€83 million in 2017).

E X P L O R A T I O N & P R O D U C T I O N14
ITALYEni has been operating in Italy since 1926. In 2018, Eni’s oil and gas production amounted to 138 kboe/d. Eni’s activities in Italy are deployed in the Adriatic and Ionian Seas, the Central Southern Apennines, mainland and offshore Sicily and the Po Valley, on a total developed and undeveloped acreage of 18,833 square kilometers (14,987 square kilometers net to Eni). Eni’s exploration and development activities in Italy are regulated by concession contracts (48 operated onshore and 62 operated offshore) and exploration licenses (11 onshore and 9 offshore).
Adriatic and Ionian SeasProduction Fields in the Adriatic and Ionian Seas accounted for 40% of Eni’s domestic production in 2018, mainly gas. Main operated fields are Barbara, Cervia/Arianna, Annamaria, Clara NW (Eni's interest 51%), Luna, Angela, Hera Lacinia, and Bonaccia. Production is operated by means of 68 fixed platforms (4 of these are manned) installed on the main fields, to which satellite fields are linked by underwater infrastructures. Production is carried by sealine to the mainland where it is input in the national gas network. The system is subject continuously to rigorous safety control, maintenance activities and production optimization.Development Development activities concerned: (i) maintenance and production optimization in the Adriatic offshore; and (ii) within the agreement with the Municipality of Ravenna, planned activities in the field of the environmental protection projects. In addition, during the first half of 2018, as planned, school-work alternation projects and first-level apprenticeship were completed.
Central Southern ApenninesProduction Eni is the operator of the Val d’Agri concession (Eni’s interest 60.77%) in the Basilicata Region in Southern Italy. Production from the Monte Alpi, Monte Enoc and Cerro Falcone fields which accounts for 46% of Eni’s domestic production, is treated by the Viggiano Oil Center.Development A digital transformation program of the Viggiano Oil Center was launched. Leveraging on the digital technologies developed by Eni, the project plans to upgrade and increase monitoring processes of plant and environmental safety in site to improve operational performance.During the year, five projects were completed, reaching a total of 35 projects of the 42 planned projects as part of the 2014 Addendum to the agreement memorandum with the Basilicata Region, which provides environmental and social initiatives as well as sustainable development programs. In the first half of the year, as planned, school-work alternation projects and first-level apprenticeship were completed. Activities defined by the Gas Agreement progressed with a grant to support the energy consumption in the Municipalities of Val d’Agri and for energy efficiency programs.
SicilyProduction Eni operates 12 production concessions onshore and 3 offshore in Sicily. The main operated fields are Gela, Tresauro (Eni's interest 45%), Giaurone, Fiumetto, Prezioso and Bronte, which in 2018 accounted for approximately 9% of Eni’s production in Italy. Development Following the Memorandum of Understanding for the Gela area, signed with the Ministry of Economic Development in November 2014, the Argo and Cassiopea offshore (Eni’s interest 60%) development projects progressed. The optimized project, to reduce significantly the environmental impact, provides the transportation of natural gas produced by offshore wells through a pipeline to a new onshore treatment and compression plant, that will be realized in certain reclaimed area of the Gela Refinery. In addition, within the framework of sustainable local development programs defined by Memorandum of Understanding and in agreement with the Municipality of Gela and the Sicily Region were: (i) school-work alternation projects, first-level apprenticeship, programs to reduce school drop-out as well as university scholarship progressed; and (ii) signed an agreement for the project “Safety food in Gela” to support vulnerable groups through a public-private partnership between Eni, the Municipality of Gela and the Rete del Banco Alimentare NGO.
REST OF EUROPE
NorwayIn December 2018 it was finalized the business combination between Point Resources AS and Eni Norge AS, fully-owned by HitecVision and Eni respectively, with the creation of Vår Energi AS, an equity-accounted joint venture. The exchange rate of shares was established so that Eni and the Point Reources shareholders would retain participation interests of 69.6% and 30.4% respectively, in the combined entity. The governance of the new entity is designed to establish joint control of the two shareholders over the combined entity. The transaction intends to strengthen Eni’s operational structure in the Country and the increase/diversification of the asset portfolios which will ensure a production growth higher than the current portfolio. The combined entity will be a leading Norwegian exploration & production company, built on the existing organizations and leveraging on complementary strengths. The portfolio of the combined company will have 17 producing oil and gas field with a wide geographical reach, from the Barents Sea to the North Sea, thanks to the entry of new assets, including the fields in production of Balder & Ringhorne (Eni’s interest 69.6%), Ringhorne East (Eni’s interest 53.85%), Boyla (Eni’s interest 13.92%), Brage (Eni’s interest 8.53%) and Snorre (Eni’s interest 0.7%). The company will have reserves and resources of more than 1,250 mmboe. Production is expected to achieve 250 kboe/d in 2023 after developing more than 500 mmboe in ten existing assets, with a breakeven price of less than 30 $/bbl. In total, the company plans to invest more than $8 billion over the
ACTIVITY AREAS Maps of the E&P activity areas are available on eni.com/Publications

E X P L O R A T I O N & P R O D U C T I O NE
ni F
ac
t Bo
ok
20
1815
next five years to bring these projects on stream, revitalize older fields and explore for new resources. Finally, Eni will retain a first offer right in case the Norwegian private equity funds, managed by HitecVision, decide to divest their interest in the venture. In 2019 Vår Energi awarded 13 exploration licenses: (i) the operatorship of two licenses in the North Sea and of two licenses in the Barents Sea; and (ii) the interest of five licenses in the North Sea and of four licenses in the Norway Sea. Exploration activities yielded positive results with: (i) delineation well of the Cape Vulture oil and gas discovery in the PL 128/128D license (Eni’s interest 8%), nearby to the production facilities of the Norne field (Eni’s interest 4.8%). The results of the well confirm the commerciality of the discovery with recoverable volumes between 50 and 70 million boe; (ii) new oil discovery in the PL 532 license (Eni’s interest 20.88%). The well is located nearby to the Johan Castberg developing project in the area and Eni estimates the resources in place of oil and gas to be between 50 and 60 million boe; (iii) the Goliat West oil well in the PL 229 license (Eni’s interest 45.24%), increasing the estimated reserves of the Goliat production field; and (iv) an oil and gas discovery in the PL 869 which is participated by Vår Energi AS with a 20% interest. Development activities concerned: (i) the Trestakk project (Eni’s interest 5,5%), with start-up expected in 2019 and a production of 4 million boe net to Eni; and (ii) the Johan Castberg development project which was sanctioned in June 2018. Start-up is expected in 2022.
United KingdomEni has been present in the United Kingdom since 1964. Eni’s activities are carried out in the British section of the North Sea and the Irish Sea, on a total developed and undeveloped acreage of 4,628 square kilometers (4,018 square kilometers net to Eni). In 2018, Eni’s net production of oil and gas averaged 58 kboe/d.Exploration and production activities in the UK are regulated by concession contracts.Production Eni holds interests in 4 production areas of which the Liverpool Bay is operated by Eni with a 100% interest and Hewett Area is operated with an 89.3% interest. The other non-operated fields are Elgin/Franklin (Eni’s interest 21.87%), Glenelg (Eni’s interest 8%), J Block and Jasmine (Eni’s interest 33%) as well as Jade (Eni’s interest 7%).Development Development activities mainly concerned: (i) two infilling wells drilled in Elgin/Franklin fields, one in production from September and the second one to be completed in 2019; and (ii) two infilling wells in Joanne and Jasmine fields, both of them in production since May and September, moreover a workover activity started and was completed at the beginning of 2019.Exploration Eni holds interest in 34 exploration licenses, 29 of these are operated, with interest ranging from 9% to 100%.
NORTH AFRICA
AlgeriaEni has been present in Algeria since 1981. In 2018, Eni’s oil and gas production averaged 85 kboe/d. Developed and undeveloped
acreage of Eni’s interests was 3,470 square kilometers (1,155 square kilometers net to Eni).Operated activities are located in the Bir Rebaa desert, in the Central-Eastern area of the Country in the following operated exploration and production assets: (i) Blocks 403a/d (Eni’s interest from 65% to 100%); (ii) Block ROM North (Eni’s interest 35%); (iii) Blocks 401a/402a (Eni’s interest 55%); (iv) Block 403 (Eni’s interest 50%); and (v) Block 405b (Eni’s interest 75%). In addition, Eni holds interest in the non-operated Block 404 and Block 208 with a 12.25% stake.Exploration and production activities in Algeria are regulated byProduction Sharing Agreements (PSAs) and concession contracts. In April 2018, Eni signed a framework agreement with Sonatrach to revamp exploration and development program in the Berkine area and to continue a collaboration in the R&D sector. In particular: (i) in July 2018 defined an agreement for upgrading existing facilities of the BRN fields in the Block 403 and of the MLE fields in the Block 405b leveraging on synergies with the new forthcoming facilities. The agreement also includes the construction of a pipeline to link the BRN fields with MLE assets, targeting to transform the area in a gas hub; and (ii) in October 2018 signed an agreement to assign to Eni a 49% interest in the Sif Fatima II, Zemlet El Arbi and Ourhoud II concessions, in the North Berkine basin. Management plans an exploration campaign and fast-track development of the estimated reserves of 75 mmboe net to Eni. The production start-up is planned in the third quarter of 2019 leveraging on the completion of the BRN-MLE pipeline that will link the BRN associated gas as well as associated gas and condensates of the Berkine North development project to the MLE treatment facilities. In addition, Eni and Total signed two partnership agreements for an exploration campaign in the offshore Algeria. In particular, in December 2018, two exploration permits were assigned to launch a seismic data acquisition in 2019.
Blocks 403a/d and ROM NorthProduction Production in Blocks 403a/d and ROM North comes mainly from the HBN and ROM and satellites fields and represented approximately 18% of Eni’s production in Algeria in 2018. Production from ROM and satellites (ZEA, ZEK and REC) is treated at the ROM Central Production Facilities (CPF) and sent to the BRN treatment plant for final treatment, while production from the HBN field is treated at the HBNS oil center operated by the Groupment Berkine.Development Development activities concerned production optimization, in particular at the ROM North field.
Blocks 401a/402aProduction Production in Blocks 401a/402a comes mainly from the ROD/SFNE and satellites fields and accounted for approximately 16% of Eni’s production in Algeria in 2018. Development Development activities concerned production optimization at the ROD field.
Block 403Production The main fields in Block 403 are BRN, BRW and BRSW, which accounted for approximately 7% of Eni’s production in Algeria in 2018.

E X P L O R A T I O N & P R O D U C T I O N16
Block 404Production The main fields in Block 404 are HBN and HBNS fields, which accounted for approximately 20% of Eni’s production in Algeria in 2018.Development Development activities concerned production optimization.
Block 405bProduction Production in Block 405b comes from the MLE-CAFC project and accounted for approximately 18% of Eni’s production in the Country in 2018. Four export pipelines link it to the national grid system.Development Development activities concerned drilling activities at the CAFC Oil and MLE projects, as well as upgrading activity of existing treatment facilities.
Block 208Production The El-Merk field is the main production project in the Block 208 and accounted for approximately 21% of Eni’s production in Algeria in 2018. Production is treated by means of a gas treatment plant for approximately 600 mmcf/d and two oil trains for 65 kbbl/d each.Development Activities concerned progress in the development program of the El Merk field with the drilling of production and water injection wells.
LibyaEni started operations in Libya in 1959. Developed and undeveloped acreage were 26,636 square kilometers (13,294 square kilometers net to Eni). Production activity is carried out in the Mediterranean Sea near Tripoli and in the Libyan Desert area and includes six contractual areas. Onshore contract areas are: (i) Area A, consisting in the former concession 82 (Eni’s interest 50%); (ii) Area B, former concessions 100 (Bu-Attifel field) and the NC 125 Block (Eni’s interest 50%); (iii) Area E, with El Feel field (Eni’s interest 33.3%); (iv) Area F, with Block 118 (Eni’s interest 50%); and (v) Area D with Block NC 169 that feeds the Western Libyan Gas Project (Eni’s interest 50%). Offshore contract areas are: (i) Area C, with the Bouri oil field (Eni’s interest 50%); and (ii) Area D, with Block NC 41 that feed the Western Libyan Gas Project.In 2018, Eni’s production in Libya was 302 kboe/d. In the last months the Country reported a resurgence of socio-political instability coupled with internal clashes. Management is closely monitoring the situation and is evaluating any possible measure to safeguard safety of personnel and security of plants and production infrastructures. For further information on this matter, see Risk factors of the Annual Report 2018.Exploration and production activities in Libya are regulated by Exploration and Production Sharing Agreement contracts (EPSA). The rights to produce of Eni’s assets in Libya will expire in 2038 for Area C, in 2041 for Area E, in 2042 for Area A and B as well as in 2043 for Area D. Development During the year, development activities concerned: (i) production start-up of the Bahr Essalam Phase 2 (Eni’s interest 50%) offshore project where the planned activities progressed and the
completion is expected in the second quarter of 2019. The development plan provided for drilling ten wells, out of which seven were completed and started up in 2018, as well as upgrading the existing facilities to increase production capacity; (ii) upgrading of gas treatment plants at the Mellitah area and Sabratha platform; and (iii) production optimization plan in the Wafa field. The activity provided for drilling additional wells and the construction of new compression units. In particular, the infilling wells campaign started in 2018: a first gas well was completed in November 2018 and a second one in March 2019. The project is expected to be completed in 2019.Following the Memorandum of Understanding signed in 2017 topromote health and education initiatives of local communities,two starting programs were defined: (i) support to the local HealthAuthorities, in particular with a renovation program of the hospital in the Jalo area, technical assistance and medical training initiatives; and (ii) the construction of a pipeline for the desalination plant in the Zuara area to provide drinking water to local communities.In December 2018, Eni signed a Memorandum of Understanding with the GECOL national power company and NOC oil state company that includes the start-up of a rehabilitation project for power plants to support access to energy for local communities. In addition, other Eni’s programs to support local communities progressed. In particular: (i) initiatives in the field of health, water and access to energy nearby to the Bu-Attifel and the El Feel production areas; (ii) health and Oil & Gas training program; and (iii) renovation and construction of facilities for social purposes as well as drugs supplies.Exploration In 2018, Eni finalized an agreement with NOC oil state company and BP to award a 42.5% interest and the operatorship in the BP contractual areas, in particular in the onshore areas A and B and in the offshore area C. The agreement provides for a revamp exploration and development activities in the Country leveraging on Eni’s facilities existing in the areas. In addition, the agreement strengthens the partnership in the social development initiatives through implementation of education and training programs.
TunisiaEni has been present in Tunisia since 1961. In 2018, Eni’s production amounted to 9 kboe/d. Eni’s activities are located mainly in the Southern Desert areas and in the Mediterranean offshore facing Hammamet, over a developed and undeveloped acreage of 3,600 square kilometers (1,558 square kilometers net to Eni). Exploration and production in this Country are regulated by concessions.Production Production mainly comes from the following operated fields: Maamoura and Baraka offshore fields (Eni’s interest 49%); Adam (Eni's interest 25%), Oued Zar (Eni's interest 50% ), Djebel Grouz (Eni's interest 50%), MLD (Eni’s interest 50%) and El Borma (Eni’s interest 50%) onshore fields.Development Development activities concerned production optimization at the producing concessions to mitigate mature fields declines.

E X P L O R A T I O N & P R O D U C T I O NE
ni F
ac
t Bo
ok
20
1817
EGYPT Eni has been present in Egypt since 1954. In 2018, Eni’s share of production in this Country amounted to 300 kboe/d and accounted for approximately 16% of Eni’s total annual hydrocarbon production. Developed and undeveloped acreage in Egypt was 15,903 square kilometers (5,248 square kilometers net to Eni).Eni’s main producing operated activities are located in: (i) the Shorouk block (Eni's interest 50%) in the Mediterranean Offshore with the giant Zohr gas field; (ii) the Sinai concession, mainly in the Belayim Marine-Land and Abu Rudeis fields (Eni's interest 100%); (iii) the Western Desert in the Melehia (Eni’s interest 76%), Ras Qattara (Eni’s interest 75%) and West Abu Gharadig (Eni's interest 45%) concessions; and (iv) Ashrafi (Eni’s interest 50%), Baltim (Eni’s interest 50%), Nile Delta (Eni’s interest 75%), North Port Said (Eni’s interest 100%), North Razzak (Eni’s interest 100%) and Temsah (Eni’s interest 50%) concessions. Furthermore Eni participates in the Ras el Barr (Eni's interest 50%) and South Ghara (Eni's interest 25%) concessions.Exploration and production activities in Egypt are regulated by Production Sharing Agreements.In August 2018, Egyptian Authority approved the following agreements: (i) Eni was awarded an 85% interest in the Nour exploration license in the eastern offshore Nile Delta. In December 2018, Eni divested a 20% and 25% interest of Nour license to Mubadala Petroleum and BP, respectively. Currently Eni holds 40% interest; (ii) ten years extension from 2021 of the Nile Delta concession which includes Abu Madi West concession with Nooros producing field; (iii) an extension of exploration campaign in the El Qar’a permit (Enis’ interest 75%), which is located in the Great Nooros sizeable producing area; (iv) five years extension of the Ras Qattara concession in the Western Desert; and (v) an extension of the Faramid development lease.Exploration activities yielded positive results with: (i) the Faramid-S1X gas well in the East Obayed concession (Eni’s interest 100%); (ii) the A-2X and B1-X oil discoveries and the A-1X gas and condensates discovery in the South West Meleiha concession (Eni's interest 100%); and (iii) the Nour-1 gas well in the Nour exploration license.
Shorouk blockIn June 2018, Eni completed the disposal of a 10% interest of the Zohr project to Mubadala Petroleum, for a cash consideration of $934 million.In September 2018, one-year earlier than scheduled, the Zohr project achieved the targeted production plateau of 365 kboe/d (110 kboe/d net to Eni) with the completion of the drilling activities and the construction and commisioning of the planned four gas treatment units onshore in addition to the one started at the end of 2017, which increased available treatment capacity to more than 2.1 bcf/d. Management plans to step up the production plateau to 3.2 bcf/d during 2019 by building and commissioning other three gas treatment units and by drilling three additional production wells to reach 13 production wells.Within the social responsibility initiatives are currently being implemented the programs defined by the MoU signed in 2017.
The agreement, which integrates the development activities of the Zohr project, defines two action programs, to be implemented in four years. The first included the renovation of the El Garabaa hospital, located nearby the Zohr onshore production facilities and the supply of necessary medical equipment. The planned activities were completed in May 2018. The second project, for an overall expense of $20 million, includes certain socio-economic and health programs to support local communities in the Zohr and Port Said areas. The program defined with the stakeholders and the the local Authorities three main areas: (i) aquaculture and fisheries, in particular the construction of a fish district. The activities started up during 2018; (ii) health care projects. A first project was defined in agreement with the Ministry of Health and includes the construction of a Primary Health Care Center which will provide health services to approximately 60,000 people in the Port Said area. The completion is expected in 2019. In addition, the project provides for the construction of the identified facilities and also further initiatives of health training and prevention; and (iii) programs to support youth, in particular the construction of a youth center with completion expected in 2019.
SinaiProduction Production for the year amounted to 66 kbbl/d (44 kbbl/d net to Eni) and mainly comes from the Belayim Marine and Belayim Land fields.Development During the year, infilling activities and production optimization were performed to mitigate mature fields declines. Furthermore, the water reinjection project is completed in the area, achieving the zero water discharge.
North Port SaidProduction Production for the year amounted to approximately 20 kboe/d (approximately 15 kboe/d net to Eni), approximately 90 mmcf/d of natural gas and approximately 2 kbbl/d of condensates.Part of the production of this concession is supplied to the United Gas Derivatives Co (Eni’s interest 33.33%) with a treatment capacity of 1.3 bcf/d of natural gas and a yearly production of approximately 133 ktonnes of propane, 72 ktonnes of LPG and approximately 1 mmbbl of condensates.
BaltimProduction In 2018, production amounted to approximately 18 kboe/d (approximately 6 kboe/d net to Eni); approximately 70 mmcf/d of natural gas and 3 kbbl/d of condensates. Development Development activities concerned the Baltim South West project in the offshore of the Country. The project sanctioned in 2018 and start-up is expected during 2019.
Nile DeltaProduction Production comes mainly from the Nidoco NW and satellites fields as part of the Great Nooros Area project, in the Abu Madi West concession; in 2018 produced 213 kboe/d (105 kboe/d net to Eni).

E X P L O R A T I O N & P R O D U C T I O N18
Development Development activities concerned the completion and start-up of two additional productive wells of the Nooros field and the construction of a pipeline for transporting gas to the treatment plan of El Gamil. The completion of the activities is expected in 2019.Exploration In February 2019, Eni was awarded the operatorship with a 50% interest in the West Sherbean block in the onshore of the Nile Delta nearby to the Nooros producing fields. In case of exploration success, the development activities will benefit from the existing facilities.
Ras el BarrProduction In 2018, the production amounted to 40 kboe/d (15 kboe/d net to Eni), mainly gas from Ha’py and Seth fields.
El TemsahProduction This concession includes the Tuna, Temsah and Denise fields. Production in 2018 amounted to approximately 47 kboe/d (approximately 12 kboe/d net to Eni); approximately 230 mmcf/d of natural gas and approximately 3 kbbl/d of condensates net to Eni.
Western DesertProduction This area includes Meleiha, Ras Qattara and West Abu Gharadig concessions and in 2018 the production amounted to approximately 49 kboe/d (approximately 24 kboe/d net to Eni).In 2018 were performed infilling activities and production optimization. Exploration In February 2019, Eni was awarded a 100% interest in the South East Siwa onshore block.
SUB-SAHARAN AFRICA
AngolaEni has been present in Angola since 1980. In 2018, Eni’s production averaged 146 kboe/d. Eni’s activities are concentrated in the conventional and deep offshore, over a developed and undeveloped acreage of 21,441 square kilometers (5,303 square kilometers net to Eni).The main Eni’s asset in Angola is the Block 15/06 (Eni operator with a 36.84% interest) with the West Hub and the East Hub projects.Eni participates in other producing blocks: (i) Block 0 in Cabinda offshore (Eni’s interest 9.8%) north of the Angolan coast; (ii) Development Areas in the Block 3 and 3/05-A (Eni’s interest 12%) offshore of the Country; (iii) Development Areas in the Block 14 (Eni’s interest 20%) in the deep offshore west of Block 0; (iv) the Lianzi Development Area in the Block 14 K/A IMI (Eni’s interest 10%); and (v) Development Areas in the Block 15 (Eni’s interest 20%) in the deep offshore.Exploration and production activities in Angola are regulated by concessions and PSAs.Eni continues its commitment to support socio-economic development in the southern region of the Country, in Huila and
Namibe area. In particular, activities progressed with: (i) access to energy from renewable sources and to water; (ii) health initiatives through awareness projects of local communities, staff training programs, energy supplies for the Health Centers and Hospitals, also in the Luanda area; and (iii) scholarship programs. In 2018 activities concerned: (i) start-up of initiatives to support the agricultural development by means of the training centers; (ii) mine removal programs of certain areas to increase safety, to guarantee land for agricultural use and to improve resilience and stability of the local communities; and (iii) the “Luanda refinery reliability improvement and gasoline production” project. The activities include the development of specific solutions to improve the reliability of the Luanda refinery, to increase the fuel production through the installation of new production units, processes optimization and staff training. During the year a first unplanned maintenance was performed and the training program started.
Block 15/06Production Production comes from the West Hub and the East Hub projects that in 2018 produced 155 kboe/d. The development program plans to hook up the blocks discoveries to two FPSO in order to support production plateau.In November 2018, Eni signed an amendment of the Block 15/06 PSA contract that defines an additional exploration acreage in the western area of the block. The agreement confirms Eni’s near-field strategy for a fast-track development of exploration successes leveraging on existing production facilities.Development Development activities mainly concerned the two producing projects in the area. In particular, activity of the West Hub project included: (i) production ramp-up of the Ochigufu field was achieved with a production plateau of 25 kbbl/d; and (ii) production start-up of the Vandumbu field. In the East Hub project development activities concerned: (i) production start-up of UM8 field with the linkage to existing FPSO in the area; (ii) upgrading of certain production facilities; and (iii) the Cabaça North & Cabaça South-East UM4/5 projects were sanctioned; the development plan provides for the drilling of three productive wells, two water injection wells and the connection to the existing production facilities in the area. Start-up is expected in 2021.Exploration Exploration activities yielded positive results with: (i) the Kalimba and Afoxé oil discoveries in the East Hub project area with an estimated resources of 400-500 mmbbl of oil in place; and (ii) the Agogo oil discovery in the West Hub project area with an estimated resources of 450-650 mmbbl of oil in place. The development of the discoveries will leverage on synergies withexisting facilities.
Block 0Production Block 0 is divided into Areas A and B. In 2018, production from this block amounted to approximately 283 kbbl/d (approximately 28 kbbl/d net to Eni). Oil production from Area A, deriving mainly from the Takula, Malongo and Mafumeira fields amounted to 19 kbbl/d net to Eni. Production of Area B derives

E X P L O R A T I O N & P R O D U C T I O NE
ni F
ac
t Bo
ok
20
1819
mainly from the Bomboco, Kokongo, Lomba, N’Dola, Nemba and Sanha fields, and amounted to 9 kbbl/d net to Eni. Associated gas of the area was delivered via the Congo River Crossing pipeline to the A-LNG liquefaction plant (see below) and partially supplied to the domestic market, for the power generation in Cabinda.Development Planned drilling activities were completed at the Mafumeira Sul production project.
Block 3 and 3/05-AProduction Block 3 is divided into three production offshore areas. Oil production is treated at the Palanca terminal and delivered to storage vessel unit and then exported. In 2018, production from this area amounted to approximately 25 kbbl/d (2 kbbl/d net to Eni).
Block 14Production In 2018, Development Areas in Block 14 produced approximately 84 kbbl/d (12 kbbl/d net to Eni). Its main fields are Landana and Tombua as well as Benguela-Belize/Lobito-Tomboco and Lianzi. Associated gas of the area was delivered via the Congo River Crossing pipeline to the A-LNG liquefaction plant (see below).
Block 15Production The block produced approximately 256 kbbl/d (32 kbbl/d net to Eni) in 2018. Its main fields are: (i) the Hungo/Chocalho, started up in 2004 and Marimba started up in 2007 as part of phase A of the global development plan of the Kizomba reserves; (ii) the Kissanje/Dikanza, started-up in 2005 as part of Phase Kizomba B; (iii) Saxi/Batuque and Mondo, started-up in 2008 and operated by two added FPSO units; (iv) Clochas and Mavacola, started-up in 2012 as part of Kizomba Satellites Phase 1; and (v) Bavuca, Kakocha and Mondo South, started-up in 2015 as part of Kizomba Satellites Phase 2.
The LNG business in Angola Eni holds a 13.6% interest of the Angola LNG (A-LNG) which runs the plant, located in Soyo, with treatment capacity of approximately 350 bcf/year of feed gas and a liquefaction capacity of 5.2 mmtonnes/y of LNG. In 2018 production net to Eni averaged approximately 20 kboe/d.
CongoEni has been present in Congo since 1968. In 2018, production averaged 92 kboe/d net to Eni. Eni’s activities are concentrated in the conventional and deep offshore facing Pointe-Noire and onshore Koilou region over a developed and undeveloped acreage of 2,750 square kilometers (1,471 square kilometers net to Eni).Exploration and production activities in Congo are regulated by Production Sharing Agreements.Production Eni’s main operated producing interests in Congo are the Nené Marine and Litchendjili (Eni’s interest 65%), Zatchi (Eni’s interest 55,25%), Loango (Eni’s interest 42.5%), Ikalou (Eni’s interest 100%), Djambala (Eni’s interest 50%), Foukanda and Mwafi (Eni’s interest 58%), Kitina (Eni’s interest 52%), Awa Paloukou
(Eni’s interest 90%), M’Boundi (Eni’s interest 82%), Kouakouala (Eni’s interest 74.25%), Zingali and Loufika (Eni’s interest 100%) fields with an overall production of approximately 96 kboe/d (74 kbbl/d net to Eni). Other relevant non-operated producing areas are represented by a 35% interest in the Pointe Noire Grand Fond and Likouala permits, with an overall production of approximately 51 kboe/d (18 kboe/d).Development Development activity carried out in 2018 was related to: (i) the Nené Marine Phase 2A producing project in the Marine XII block with the completion of drilling activities and the installation of a sealine for the connection to the Litchendjili field production platform in the Marine XII block; (ii) the completion of engineering activities of the Nené Marine Phase 2B project. The project was sanctioned in December 2018; (iii) activities to increase the power generation of the CEC plant (Eni’s interest 20%) up to 170 MW. Additional gas supply will be ensured by the production of the Marine XII block; and (iv) the water reinjection project of the Loango and Zatchi operated production fields.The activities of the second phase of the Project Integrated Hinda (PIH) progressed, aiming to improve life condition of local communities. The project includes several initiatives to support socio-economic development, access to water, access to energy, education and health service. In particular, in 2018, the programs concerned: (i) the completion of the CATREP agricultural development project with a training program of 14 agricultural cooperatives, that was supported also by the World Food Program; (ii) renovation and construction of multicultural centers; (iii) scholarship programs, in particular in the Pointe Noire area through the supply of educational material and renovation initiatives; and (iv) programs to strengthen the Primary Health Care services at the Health Centers and others operating in the area, in particular in the maternal and child sphere. In addition, the construction of a training and research center on renewable energy progressed in Oyo, in the north of the Country.
GhanaEni has been present in Ghana since 2009. Developed and undeveloped acreage in deep offshore was 1,353 square kilometers (579 square kilometers net to Eni). Eni is the operator with a 44.44% interest of the Offshore Cape Three Points (OCTP) permit which is regulated by a concession agreement and also operates the offshore exploration license Cape Three Points Block 4 (Eni’s interest 42.47%). Production In 2018, production averaged 18 kboe/d net to Eni and comes from the OCTP project. In 2018, the non-associated gas production started up at the OCTP project. The gas production is sent to an onshore treatment plant to feed the national grid. The OCTP project is the only non-associated gas development project in deep water entirely dedicated to the domestic market in Sub-Saharan Africa. This project will ensure at least 15 years of reliable gas supply with an affordable price, significantly supporting the access to energy and economic development of the Country. The project has been developed in

E X P L O R A T I O N & P R O D U C T I O N20
compliance with the highest environmental requirements, zero gas flaring and produced water reinjection.Eni progressed its commitment to improve the living condition of local communities, with training, economic diversification, acces to water and health services initiatives. In 2018, primary education, waste management and access to water projects started up in the western area of the Country. In particular, a well was drilled and a treatment and purification water-system was completed to supply water for approximately 5,000 people located in the Bakanta, Krisan and Sanzule communities. Within the partnership with United Nations Development Programme, certain activities are being designed to reduce the CO2 emissions in the medium-term by means of combating deforestation, access to energy and energy efficiency programs.
MozambiqueEni has been present in Mozambique since 2006, following the award of the exploration license relating to Area 4 offshore the Rovuma Basin block, located in the north of the Country.The Rovuma Basin represents a new frontier in oil and gas industry thanks to extraordinary gas discoveries made during intense only three-year exploration campaign. To date, resource base reached 85 Tcf.In October 2018, Eni signed the contract for the exploration and development rights of the offshore block A5-A, in the deep offshore of Zambesi. Eni was awarded the operatorship of the block with a 59.5% interest. In March 2019, Eni signed a farm out agreement with Qatar Petroleum to divest a 25.5% interest in the block A5-A. The transaction is subjected by approval of the relevant Authority. The exclusive rights of exploration, development and production of Area 4 are assigned to the company Mozambique Rovuma Venture (MRV) − co-owned by Eni and ExxonMobil, each with an interest of 35.7% and by CNPC which holds the remaining 28.6% interest – in participation with the state company ENH, Galp and Kogas. The development activities of the Area 4 (Eni’s interest 25%) concerned the Coral field, operated by Eni, and the Mamba Complex discoveries where Eni operates upstream development phase and Exxon Mobil lead the construction and operation of natural gas liquefaction facilities onshore.Development activities of the Coral South project provide for the installation of a floating unit for the treatment, liquefaction, storage and export of natural gas (FLNG) with a capacity of approximately 3.4 mmtonnes/y fed by 6 subsea wells and start-up expected in 2022. The LNG produced will be sold by Eni and its partners in Area 4 (CNPC and Exxon Mobil via the Mozambique Rovuma Venture SpA operating company) to BP under a long-term contract for a period of twenty years with an additional ten years’ option. Within the Mamba Complex discoveries, the Rovuma LNG project provides for the development of the straddling reserves of Area 1 according to its independent industrial plan, coordinated with the operator of Area 1 (Andarko). The development project will include also a part of non-straddling reserves. The project provides the construction of two onshore LNG trains with capacity of approximately 7.6 mmtonnes/y each, feed by 24 subsea wells, the gas treatment, the liquefaction, the storage and the export of LNG.
In July 2018, the plan of development (PoD) was submitted to the relevant Authorities for their initial review. The activities progressed with the finalization of the PoD, of preliminary long-term agreements for the purchase of LNG volumes and the project financing. The Final Investment Decision (FID) is expected in 2019 with start-up in 2024.In 2018, Eni’s programs to support the local communities of the Country progressed with, in partcicular: (i) the scholarship programs in Pemba, also by means of ordinary and extraordinary schools maintenance activities and training initiatives also with an Oil & Gas training programs; and (ii) health care initiatives, coordinated with the Country’s health Authorities, in the Maputo, Pemba and Palma area, by means of specific initiatives on prevention, facilities constructions and medical equipment supplies, particularly in the Cabo Delgado area.
NigeriaEni has been present in Nigeria since 1962. In 2018, Eni’s oil and gas production averaged 100 kboe/d, over a developed and undeveloped acreage of 30,769 square kilometers (7,722 square kilometers net to Eni). In the development/production phase Eni operates onshore Oil Mining Leases (OML) 60, 61, 62 and 63 (Eni’s interest 20%) and offshore OML 125 (Eni’s interest 100%) and OPL 245 (Eni’s interest 50%), holding interests in OML 118 (Eni’s interest 12.5%) and OML 116 Service Contract. As partner of SPDC JV, the largest joint venture in the Country, Eni also holds a 5% interest in 17 onshore blocks and in 1 conventional offshore block and with a 12.86% interest in 2 conventional offshore blocks.In the exploration phase Eni operates offshore OML 134 (Eni’s interest 100%), OPL 2009 (Eni’s interest 49%), and onshore OPL 282 (Eni’s interest 90%) and OPL 135 (Eni’s interest 48%). Eni also holds a 12.5% interest in OML 135.In February 2018, Eni signed with the Food and Agriculture Organization (FAO) a collaboration agreement to foster access to safe and clean water in Nigeria, mainly in the north-east areas, by drilling boreholes powered with photovoltaic systems, both for domestic use and irrigation purposes.Eni’s programs to support local communities progressed with: (i) acces to energy and to water initiatives; (ii) economic programs for diversification purposes, in particular with the Green River Project; (iii) professional training and scholarship programs; and (iv) renovation and construction of health centers and supply of medical equipment.Exploration and production activities in Nigeria are regulated mainly by Production Sharing Agreements and concession contracts as well as a service contract where Eni acts as contractor for State-owned Company.
Blocks OMLs 60, 61, 62 e 63Production Onshore four licenses produced approximately 44 kboe/d net to Eni in 2018. Liquid and gas production is supported by the NGL plant at Obiafu-Obrikom with a treatment capacity of approximately 1 bcf/d and by the oil tanker terminal at Brass with a storage capacity

E X P L O R A T I O N & P R O D U C T I O NE
ni F
ac
t Bo
ok
20
1821
of approximately 3,5 mmbbl. A large portion of the gas reserves of these four OMLs is destined to supply the Bonny Island liquefaction plant (see below). Another portion of gas production is employed in firing the combined cycle power plant at Okpai with a 480 MW generation capacity. In 2018, supplies to this power station were an overall amount of approximately 35 mmcf/d.Development Development activities mainly included: (i) workover and rigless activities to support current production as well as maintenance and restoration of damaged facilities due to sabotage and bunkering; (ii) the completion of the water injection project of the Ebocha field, achieving a produced water reinjection capacity of approximately 30 kbbl/day; and (iii) the phase 2 activities of the Okpai plant to double the installed power capacity.
Block OML 118Production The Bonga oil field produced over 13 kboe/d net to Eni in 2018. Production is supported by an FPSO unit with a 225 kboe/d treatment capacity and a 2 mmboe storage capacity. Associated gas is carried to a collection platform on the EA field and, from there, is delivered to the Bonny liquefaction plant.Development Development activities mainly concerned the drilling activities to increase production and workover activities to mitigate mature field decline.
Block OML 125Production Production derived mainly from the Abo field which yielded approximately 12 kboe/d net to Eni in 2018. Production is supported by an FPSO unit with a 40 kboe/d capacity and an 800 kboe storage capacity.Development Development activities mainly concerned the drilling activities to increase production and workover activities to mitigate mature field decline of the Abo field.
SPDC Joint Venture (NASE)Production In 2018, production from the SPDC JV amounted to approximately 29 kboe/d.Development The development activities mainly concerned associated gas program of Forkados Yokri Integrated Project in the OML 43 block (Eni’s interest 5%) as well as Gbaran phase 2A/2B and SSAGS project in the OML 28 block (Eni’s interest 5%). Gas production will be sold to the local market.Exploration Exploration activities yielded positive results with the EPU-05 deep offshore gas discovery in the Gbaran-Kolo Creek-Epu (Eni’s interest 5%) area.
The LNG business in NigeriaEni holds a 10.4% interest in the Nigeria LNG Ltd joint venture, which runs the Bonny liquefaction plant located in the Eastern Niger Delta. The plant has a treatment capacity of approximately 1,236 bcf/y of feed gas corresponding to a production of 22 mmtonnes/y of LNG. Natural gas supplies to the plant are currently provided under gas supply agreements from the SPDC JV, TEPNG JV and the NAOC JV (Eni's interest 20%). In 2018, the Bonny liquefaction plant
processed approximately 1,130 bcf. LNG production is sold under long-term contracts and exported to the United States, Asian and European markets by the Bonny Gas Transport fleet, wholly owned by Nigeria LNG.
KAZAKHSTAN
Eni has been present in Kazakhstan since 1992, over a developed and undeveloped acreage of 6,281 square kilometers (1,543 square kilometers net to Eni). Eni is co-operator of the Karachaganak field and partner in the North Caspian Sea Production Sharing Agreement (NCSPSA). Eni cooperates with state company KazMunayGas (KMG) the Isatay block (Eni’s interest 50%) located in the Kazakh sector of the Caspian Sea. The Isatay block is estimated to have significant potential oil resources.
KashaganEni holds a 16.81% interest in the North Caspian Sea Production Sharing Agreement (NCSPSA). The NCSPSA defines terms and conditions for the exploration and development of the giant Kashagan field, which was discovered in the Northern section of the contractual area in the year 2000 over an area extending for 4,600 square kilometers. The NCSPSA expires at the end of 2041.Production In 2018, production of the Kashagan field averaged 303 kbbl/d of liquids (50 kbbl net to Eni) and 451 mmcf/d of natural gas (74.6 mmcf/d net to Eni). The treated gas is delivered to the national gas marketing and transportation company (KazTransGas) and the remaining volume was utilized as fuel gas for internal use. The remaining untreated gas volume (approximately 30%) is reinjected in the reservoir. The liquid production is stabilized at Bolashak facilities and exported to Western markets through the Caspian Pipeline Consortium (Eni’s interest 2%) and the Atyrau-Samara pipeline. Development In 2019, Experimental Program development of the field is expected to lead to plateau oil production capacity of about 370 kbbl/d, on a 100% basis. Additional phases of development are being studied, which contemplate increasing gas injection capacity, the conversion of production wells into injection wells and the upgrading of the existing facilities. Within the agreements with local Authorities, training program progressed for Kazakh resources in the Oil & Gas sector, in addition to the realization of infrastructures with social purpose.
KarachaganakLocated onshore in West Kazakhstan, Karachaganak (Eni’s interest 29.25%) is a liquid and gas giant field. Operations are conducted by the Karachaganak Petroleum Operating consortium (KPO) and are regulated by a PSA. Eni and Shell are co-operators of the venture.Production In 2018, production of the Karachaganak field averaged 240 kbbl/d of liquids (44 kbbl/d net to Eni) and 998 mmcf/d of natural gas (190.6 mmcf/d net to Eni).

E X P L O R A T I O N & P R O D U C T I O N22
This field is developed by producing liquids from the deeper layers of the reservoir. The gas is marketed (about 50%) at the Russian gas plant in Orenburg and the remaining volumes is utilized for reinjecting in the higher layers and the production of fuel gas. Approximately 95% of liquid production are stabilized at the Karachaganak Processing Complex (KPC) and exported to Western markets through the Caspian Pipeline Consortium and the Atyrau-Samara pipeline. The remaining volumes of non-stabilized liquid production was marketed at the Russian terminal in Orenburg until September 2018, when the purchase agreement expired.Development Within the gas treatment expansion projects of the Karachaganak field, the Karachaganak Process Center Debottlenecking project was sanctioned. Activities progressed with completion expected in 2020. Additional reinjection capacity will be ensured by installing a new reinjection facility in addition to the existing ones. Eni continues its commitment to support local communities in the nearby area of the Karachaganak field. In particular, activities focused on: (i) professional training; and (ii) realization of kindergartens and schools, maintenance of bridges and roads, construction of sport centers.
REST OF ASIA
IndonesiaEni has been present in Indonesia since 2001. In 2018, Eni’s production mainly composed of gas, amounted to 72 kboe/d. Activities are concentrated in the Eastern offshore of East Kalimantan, offshore Sumatra, and offshore and onshore of West Timor and West Papua, over a developed and undeveloped acreage of 30,173 square kilometers (23,769 square kilometers net to Eni); in total, Eni holds interests in 13 blocks.Development and production activities are regulated by PSAs.In 2018, within the portfolio rationalization, Eni divested entire interest in the Sanga Sanga permit.Ongoing initiatives and projects progressed in the field ofenvironmental protection, health care and educational system tosupport local communities located in the operated areas of theEastern Kalimantan, Papua and North Sumatra.In 2018, the following programs were launched: (i) to promote access to energy and to water for the local communities; and (ii) training agricultural activities. In addition, health initiatives were defined.Production Production derives mainly from the operated Muara Bakau block (Eni's interest 55%) where Jangkrik gas field started up. Production in the Jangkrik gas project is ensured by means of ten subsea wells linked to the Floating Production Unit (FPU). Natural gas production is processed by the FPU and then delivered by pipeline to the onshore plant, which is linked to the East Kalimantan transport system to feed Bontang liquefaction plant. The LNG is sold under long-term contracts, partly to state company Pertamina and to Eni, which will sell over the Asiatic market.Development Development activities concerned the offshore Merakes gas project in the operated East Sepinggan block
(Eni's interest 85%). In December 2018, the development plan was sanctioned by relevant Authorities. The project provides for the drilling of five subsea wells, which will be linked to the Floating Production Unit (FPU) of the Jangkrik producing fields. Natural gas production will be processed by the FPU and then delivered by pipeline to the onshore plant, linked to the East Kalimantan transport system to feed Bontang liquefaction plant or will be sold on a spot basis in the domestic market. Start-up is expected in 2020.Exploration Exploration activities yielded positive results with the Merakes East discovery in the operated East Sepinggan block.In May 2018, Eni was awarded a 100% interest in the East Ganalexploration block in the deep offshore Kutei area nearby the Muara Bakau block.
IraqEni has been present in Iraq since 2009 and is performing development activities over a developed acreage of 1,074 square kilometers (446 square kilometers net to Eni).Development and production activities are regulated by a technical service contract.Production Production comes from Zubair oil field (Eni’s interest 41.6%) with a production of 34 kbbl/d net to Eni in 2018.Development Development activities concerned the execution of an additional development phase of the ERP (Enhanced Redevelopment Plan) for the Zubair field, to achieve a production plateau of 700 KBBL/d. This phase also contemplates utilization of the associated gas for power generation. The production capacity and relevant facilities to treat the targeted production plateau have been already installed; the field reserves will be progressively put into production by drilling additional productive wells over the next few years.
PakistanEni has been present in Pakistan since 2000. In 2018, Eni’s production mainly composed of gas amounted to 106 mmcf/d, over a developed and undeveloped acreage of 14,876 square kilometers (5,786 square kilometers net to Eni).Exploration and production activities in Pakistan are regulated by concessions (onshore) and PSAs (offshore).Production Eni’s main operated permits are Bhit/Bhadra (Eni's interest 40%) and Kadanwari (Eni's interest 18.42%). Furthermore Eni participates in the Latif (Eni’s interest 33.3%), Zamzama (Eni's interest 17.75%) and Sawan (Eni's interest 23.7%).Development Development activities concerned productionoptimization through drilling activities of new wells, optimization of onshore existing facilities and rigless activity of productive wells to mitigate the natural fields production decline.
TurkmenistanEni started its activities in Turkmenistan with the purchase of the British company Burren Energy plc in 2008. Activities are focused on the onshore Nebit Dag Area in the Western part of the Country, over a developed acreage of 200 square kilometers (180 square

E X P L O R A T I O N & P R O D U C T I O NE
ni F
ac
t Bo
ok
20
1823
kilometers net to Eni), in four areas. In 2018, Eni’s production averaged 11 kboe/d. Exploration and production activities in Turkmenistan are regulated by PSAs.Production Production derives mainly from the Burun oil field. Oil production is shipped to the Turkmenbashi refinery plant. Eni receives, by means of a swap arrangement with the Turkmen Authorities, an equivalent amount of oil at the Okarem terminal, close to the South coast of the Caspian Sea. Eni’s entitlement is sold FOB. Associated natural gas is used for gas lift system. The remaining amount is delivered to the national oil company Turkmenneft, via national grid.Development Drilling activities of new wells and workover program represent main activities currently performed in the area to mitigate the natural field production declines.
United Arab EmiratesIn 2018, assets acquisition campaign was launched by Eni targeting to expand footprint in the Country. In particular, the following acquisitions of exploration and production assets in Abu Dhabi were finalized: (i) in March 2018, Eni signed two Concession Agreements related to the acquisition of a 5% participating interest in the Lower Zakum oil field and a 10% participating interest in the Umm Shaif and Nasr oil, condensates and natural gas fields, in the offshore of Abu Dhabi, for a consideration of $875 million with duration of 40 years; (ii) in November 2018, Eni was awarded a 25% interest of the Ghasha offshore concession with duration of 40 years. The concession includes Hail, Ghasha, Dalma gas fields and certain offshore fields in the Al Dhafra area. Production start-up is expected in 2022; and (iii) in January 2019, Eni was awarded the operatorship of the Block 1 and 2 with a 70% interest, located offshore Abu Dhabi. The exploration commitment for the first phase consists in exploration studies for the Block 1 and the drilling of two exploration wells and two appraisal wells in the Block 2.In January 2019 Eni was awarded three onshore exploration concessions in the Emirate of Sharjah: (i) the operatorship with a 75% interest in the concession Area A and C; and (ii) a 50% interest in the concession Area B. The exploration commitment of the first phase includes the drilling of one exploration well and exploration studies in concessions Area A and B as well as exploration studies in Area C. Furthermore, in April 2019, Eni acquired an offshore exploration concession in the Emirate of Ras al Khaimah, awarded the operatorship with a 90% share in the Area A.
AMERICAS
EcuadorEni has been present in Ecuador since 1988. Operations are performed in Block 10 (Eni’s interest 100%) located in the Oriente Basin, in the Amazon Forest, over a developed acreage of 1,985 square kilometers net to Eni. In 2018, Eni’s production averaged 12 kbbl/d.
Exploration and production activities in Ecuador are regulated by a service contract.Production Production deriving from the Villano oil field, started in 1999, is processed by a Central Production Facility and transported to storage facility in the Pacific Coast through a pipeline network.
MexicoEni has been present in Mexico since 2015, over a undeveloped acreage of 4,387 square kilometers (3,000 square kilometers net to Eni). Eni’s activities are concentrated in the Gulf of Mexico. Eni is operator of: (i) the offshore Area 1 license (Eni’s interest 100%) where the development activities of the Amoca, Miztón and Tecoalli discoveries progressed; and (ii) the Area 10 (Eni’s interest 100%), the Area 14 (Eni’s interest 60%) and the Area 7 (Eni’s interest 45%) exploration licenses located in the Sureste basin.In 2018, Eni signed the following agreements: (i) with the Lukoil company to swap interest in three exploration licenses. In particular, based on the agreement Eni will divest its 20% interest in Area 10 and Area 14 licenses and purchases a 40% interest in Area 12 license operated by Lukoil; and (ii) to divest its 35% interest of the Area 1 to Qatar Petroleum Company. The agreements are subject to approval by the relevant Authorities.Furthermore, in 2018, Eni was awarded the operatorship with a 65% interest of the Area 24 offshore license and with 75% of the Area 28 license.Exploration and production activities in Mexico are regulated by PSA and concession contract for the Area 24 license.Development In July 2018, the plan of development for the Amoca, Mitzón and Tecoalli discoveries, located in the Area 1, was approved by the Mexican Authorithies. The phased approach for the development plan includes an early production start-up in 2019 through the installation of a production platform and the realization of facilities to connect the platform to an onshore existing treatment plant, with a production of 8 kbbl/d. The full field development envisages a phased installation of three additional platforms and a FPSO, which will increase the production capacity up to 90 kbbl/d in 2021. In 2018, certain initiatives to support local communities were implemented and held events with local stakeholders nearby to the license areas in development of Area 1. In addition, the first Local Development Plan was finalized, in agreement with the local Authorities, concerning the future programs to support the communities.
United StatesEni has been present in the United States since 1968. Activities are performed in the Gulf of Mexico, Alaska, and in Texas onshore, over a developed and undeveloped acreage of 3,122 square kilometers (2,191 square kilometers net to Eni). In 2018, Eni’s oil and gas production was 56 kboe/d. Exploration and production activities in the United States are regulated by concessions.

E X P L O R A T I O N & P R O D U C T I O N24
Gulf of MexicoEni holds interests in 62 exploration and production blocks in the shallow and deep offshore of the Gulf of Mexico, of which 26 are operated by Eni. Production The main operated fields are Allegheny and Appaloosa (Eni’s interest 100%), Pegasus (Eni’s interest 85%), Longhorn, Devils Towers and Triton (Eni’s interest 75%). Eni also holds interests in Europa (Eni’s interest 32%), Medusa (Eni’s interest 25%), Lucius (Eni’s interest 8.5%), K2 (Eni’s interest 13.4%), Frontrunner (Eni’s interest 37.5%) and Heidelberg (Eni’s interest 12.5%) fields. In 2018, production amounted to 35 kboe/d net to Eni.Development Development activities concerned the Lucius Subsequent Development with the drilling and completion of three submarine productive wells, which will be linked to the production platform of the Lucius field and upgrading of existing facilities.
TexasProduction Production comes from the Alliance area (Eni’s interest 27.5%), in the Fort Worth Basin. This asset includes unconventional gas reserves (shale gas). In 2018, Eni’s production amounted to approximately 4 kboe/d.
AlaskaEni holds interests in 166 exploration and development blocks in Alaska.In August 2018, Eni was awarded a 100% interest of 124 licenses in Alaska. The exploration licenses are located in the Eastern North Slope in Alaska with high mineral potential and nearby to existing production facilities.In December 2018, Eni signed an agreement to purchase of 70% interest and the operatorship of the Oooguruk field, where Eni already holds 30% interest. The agreement has been finalized in 2019.Production The main fields are Nikaitchuq (Eni operator with a 100% interest) and Oooguruk fields with a 2018 overall net production of 17 kbbl/d.
VenezuelaEni has been present in Venezuela since 1998. In 2018, Eni’s production averaged 48 kboe/d. Activity is concentrated both offshore (Gulf of Venezuela and Gulf of Paria) and onshore in the Orinoco Oil Belt, over a developed and undeveloped acreage of 2,804 square kilometers (1,066 square kilometers net to Eni).Production Eni’s production comes from the Perla gas field in the Gulf of Venezuela (Eni's interest 50%), the Junin 5 oil field (Eni’s interest 40%) located in the Orinoco Oil Belt and from the Corocoro oil field (Eni’s interest 26%) in the Gulfo de Paria.
Exploration Eni is also participating with a 19.5% interest in Petrolera Güiria for oil exploration and with a 40% interest in Punta Pescador and Gulfo de Paria Ovest for gas exploration, both located offshore in the eastern Venezuela.
AUSTRALIA AND OCEANIA
AustraliaEni has been present in Australia since 2001. In 2018, Eni’s production of oil and natural gas averaged 23 kboe/d. Activities are focused on deep offshore fields, over a developed and undeveloped acreage of 5,751 square kilometers (3,757 square kilometers net to Eni).The main production blocks in which Eni holds interests are WA-33-L (Eni’s interest 100%) and JPDA 03-13 (Eni’s interest 10.99%). In the appraisal and development phase, Eni holds interests in NT/RL8 (Eni’s interest 100%) and NT/RL7 (Eni operator with a 65% interest). In addition, Eni holds interest in 4 exploration licenses, of which 1 in the JPDA.Exploration and production activities in Australia are regulated by concession agreements, whereas in the cooperation zone between Timor Leste and Australia (JDPA) they are regulated by PSAs.
Block WA-33-LProduction The Blacktip gas field started-up in 2009 and produced approximately 23 bcf/y in 2018 (12 kboe/d). The project is supported by a production platform and carried by a 108-kilometer long pipeline to an onshore treatment plant with a capacity of 42 bcf/y. Natural gas extracted from this field is sold under a 25-year contract to supply a power plant, signed with Australian society Power & Water Utility Co.
Block JPDA 03-13Production The liquids and gas Bayu Undan field started-up in 2004 and produced 116 kboe/d (11 kboe/d net to Eni) in 2018. Liquid production is supported by three treatment platforms and an FSO unit. Production of natural gas is carried by a 500-kilometer long pipeline and is treated at the Darwin liquefaction plant which has a capacity of 3.6 mmtonnes/y of LNG (equivalent to approximately 177 bcf/y of feed gas). LNG is sold to Japanese power generation companies under long-term contracts.Development The Bayu Undan Phase 3b project was completed. The project included drilling and completion of three new wells aiming to increase the liquids production and to support LNG production.

E X P L O R A T I O N & P R O D U C T I O NE
ni F
ac
t Bo
ok
20
1825
Movements in net proved hydrocarbons reserves
(mmboe) Italy
Rest
of E
urop
e
Nort
h Af
rica
Egyp
t
Sub-
Saha
ran
Afric
a
Kaza
khst
an
Rest
of A
sia
Amer
ica
Aust
ralia
and
Oc
eani
a
Tota
l
2018
Consolidated subsidiaries
Reserves at December 31, 2017 422 525 1,052 1,078 1,436 1,150 427 203 137 6,430
of which: developed 350 360 532 463 856 891 238 176 101 3,967
undeveloped 72 165 520 615 580 259 189 27 36 2,463
Purchase of minerals in place 332 332
Revisions of previous estimates 40 15 114 431 34 (32) (39) 31 (4) 590
Improved recovery 7 6 13
Extensions and discoveries 16 14 39 100 169
Production (50) (71) (144) (110) (123) (52) (65) (27) (8) (650)
Sales of minerals in place (363) (160) (5) (528)
Reserves at December 31, 2018 428 106 1,022 1,246 1,361 1,066 700 302 125 6,356
Equity-accounted entities
Reserves at December 31, 2017 14 75 1 470 560
of which: developed 14 20 1 359 394
undeveloped 55 111 166
Purchase of minerals in place 363 363
Revisions of previous estimates 1 (100) (99)
Improved recovery
Extensions and discoveries
Production (1) (7) (18) (26)
Sales of minerals in place (1) (1)
Reserves at December 31, 2018 363 14 68 352 797
Reserves at December 31, 2018 428 469 1,036 1,246 1,429 1,066 700 654 125 7,153
Developed 336 304 596 764 912 925 403 517 87 4,844
consolidated subsidiaries 336 99 582 764 895 925 403 170 87 4,261
equity-accounted entities 205 14 17 347 583
Undeveloped 92 165 440 482 517 141 297 137 38 2,309
consolidated subsidiaries 92 7 440 482 466 141 297 132 38 2,095
equity-accounted entities 158 51 5 214
Reserves life index (year) 8.6 6.6 7.1 11.3 11.0 20.5 10.8 14.5 15.6 10.6
Reserves replacement ratio, organic (%) 112 21 79 398 37 9 69 100
Reserves replacement ratio, all sources 112 21 79 253 37 518 58 124

E X P L O R A T I O N & P R O D U C T I O N26
Movements in net proved hydrocarbons reserves
(mmboe) Italy
Rest
of E
urop
e
Nort
h Af
rica
Egyp
t
Sub-
Saha
ran
Afric
a
Kaza
khst
an
Rest
of A
sia
Amer
ica
Aust
ralia
and
Oc
eani
a
Tota
l
2017
Consolidated subsidiaries
Reserves at December 31, 2016 354 426 1,139 1,293 1,317 1,221 491 227 145 6,613
of which: developed 287 374 605 352 809 966 175 205 111 3,884
undeveloped 67 52 534 941 508 255 316 22 34 2,729
Purchase of minerals in place 2 2
Revisions of previous estimates 117 59 86 198 56 (23) (35) 8 466
Improved recovery 1 2 7 10 20
Extensions and discoveries 108 12 355 4 4 483
Production (49) (69) (175) (84) (119) (48) (43) (36) (8) (631)
Sales of minerals in place (348) (175) (523)
Reserves at December 31, 2017 422 525 1,052 1,078 1,436 1,150 427 203 137 6,430
Equity-accounted entities
Reserves at December 31, 2016 14 82 2 779 877
of which: developed 14 26 2 349 391
undeveloped 56 430 486
Purchase of minerals in place
Revisions of previous estimates 1 (286) (285)
Improved recovery
Extensions and discoveries
Production (1) (7) (1) (23) (32)
Sales of minerals in place
Reserves at December 31, 2017 14 75 1 470 560
Reserves at December 31, 2017 422 525 1,066 1,078 1,511 1,150 428 673 137 6,990
Developed 350 360 546 463 876 891 239 535 101 4,361
consolidated subsidiaries 350 360 532 463 856 891 238 176 101 3,967
equity-accounted entities 14 20 1 359 394
Undeveloped 72 165 520 615 635 259 189 138 36 2,629
consolidated subsidiaries 72 165 520 615 580 259 189 27 36 2,463
equity-accounted entities 55 111 166
Reserves life index (year) 8.6 7.6 6.1 12.8 12.0 24.0 9.7 11.4 17.1 10.5
Reserves replacement ratio, organic (%) 239 243 51 258 326 (48) (48) (464) 103
Reserves replacement ratio, all sources 239 243 51 (156) 189 (48) (48) (464) 25

E X P L O R A T I O N & P R O D U C T I O NE
ni F
ac
t Bo
ok
20
1827
Movements in net proved hydrocarbons reserves
(mmboe) Italy
Rest
of E
urop
e
Nort
h Af
rica
Egyp
t
Sub-
Saha
ran
Afric
a
Kaza
khst
an
Rest
of A
sia
Amer
ica
Aust
ralia
and
Oc
eani
a
Tota
l
2016
Consolidated subsidiaries
Reserves at December 31, 2015 465 495 1,194 500 1,282 1,198 422 269 150 5,975
of which: developed 362 404 630 380 764 689 159 217 115 3,720
undeveloped 103 91 564 120 518 509 263 52 35 2,255
Purchase of minerals in place
Revisions of previous estimates (62) 1 110 (20) 157 63 111 1 4 365
Improved recovery 1 1 2
Extensions and discoveries 2 1 881 3 887
Production (49) (73) (167) (68) (122) (40) (45) (43) (9) (616)
Sales of minerals in place
Reserves at December 31, 2016 354 426 1,139 1,293 1,317 1,221 491 227 145 6,613
Equity-accounted entities
Reserves at December 31, 2015 14 87 4 810 915
of which: developed 14 22 2 265 303
undeveloped 65 2 545 612
Purchase of minerals in place
Revisions of previous estimates 1 (2) (9) (10)
Improved recovery
Extensions and discoveries
Production (1) (3) (2) (22) (28)
Sales of minerals in place
Reserves at December 31, 2016 14 82 2 779 877
Reserves at December 31, 2016 354 426 1,153 1,293 1,399 1,221 493 1,006 145 7,490
Developed 287 374 619 352 835 966 177 554 111 4,275
consolidated subsidiaries 287 374 605 352 809 966 175 205 111 3,884
equity-accounted entities 14 26 2 349 391
Undeveloped 67 52 534 941 564 255 316 452 34 3,215
consolidated subsidiaries 67 52 534 941 508 255 316 22 34 2,729
equity-accounted entities 56 430 486
Reserves life index (year) 7.2 5.8 6.9 19.0 11.2 30.5 10.5 15.5 16.1 11.6
Reserves replacement ratio, organic (%) (127) 5 67 1,266 124 158 243 (12) 44 193
Reserves replacement ratio, all sources (127) 5 67 1,266 124 158 243 (12) 44 193

E X P L O R A T I O N & P R O D U C T I O N28
Movements in net proved hydrocarbons reserves
(mmboe) Italy
Rest
of E
urop
e
Nort
h Af
rica
Sub-
Saha
ran
Afric
a
Kaza
khst
an
Rest
of A
sia
Amer
ica
Aust
ralia
and
Oc
eani
a
Tota
l
2015
Consolidated subsidiaries
Reserves at December 31, 2014 (mmboe) 503 544 1,740 1,239 1,069 285 232 160 5,772
of which: developed 401 335 904 702 589 112 188 135 3,366
undeveloped 102 209 836 537 480 173 44 25 2,406
Purchase of minerals in place
Revisions of previous estimates 23 19 168 169 164 163 76 (1) 781
Improved recovery 2 2
Extensions and discoveries 1 24 14 21 6 66
Production (62) (68) (240) (124) (35) (47) (44) (9) (629)
Sales of minerals in place (16) (1) (17)
Reserves at December 31, 2015 465 495 1,694 1,282 1,198 422 269 150 5,975
Equity-accounted entities
Reserves at December 31, 2014 16 81 5 728 830
of which: developed 15 23 3 26 67
undeveloped 1 58 2 702 763
Purchase of minerals in place
Revisions of previous estimates 6 1 91 98
Improved recovery
Extensions and discoveries
Production (2) (2) (9) (13)
Sales of minerals in place
Reserves at December 31, 2015 14 87 4 810 915
Reserves at December 31, 2015 465 495 1,708 1,369 1,198 426 1,079 150 6,890
Developed 362 404 1,024 786 689 161 482 115 4,023
consolidated subsidiaries 362 404 1,010 764 689 159 217 115 3,720
equity-accounted entities 14 22 2 265 303
Undeveloped 103 91 684 583 509 265 597 35 2,867
consolidated subsidiaries 103 91 684 518 509 263 52 35 2,255
equity-accounted entities 65 2 545 612
Reserves life index (year) 7.5 7.3 7.1 11.0 34.5 8.6 20.1 16.0 10.7
Reserves replacement ratio, organic (%) 38 28 80 153 473 375 324 148
Reserves replacement ratio, all sources 38 28 80 139 473 375 322 145

E X P L O R A T I O N & P R O D U C T I O NE
ni F
ac
t Bo
ok
20
1829
Movements in net proved hydrocarbons reserves
(mmboe) Italy
Rest
of E
urop
e
Nort
h Af
rica
Sub-
Saha
ran
Afric
a
Kaza
khst
an
Rest
of A
sia
Amer
ica
Aust
ralia
and
Oc
eani
a
Tota
l
2014
Consolidated subsidiaries
Reserves at December 31, 2013 499 557 1,783 1,155 1,035 263 240 176 5,708
of which: developed 408 343 1,003 701 566 90 153 123 3,387
undeveloped 91 214 780 454 469 173 87 53 2,321
Purchase of minerals in place 4 4
Revisions of previous estimates 68 53 154 110 64 45 26 (7) 513
Improved recovery 3 1 2 6
Extensions and discoveries 1 1 5 98 11 8 124
Production (65) (70) (205) (118) (32) (34) (42) (9) (575)
Sales of minerals in place (1) (7) (8)
Reserves at December 31, 2014 503 544 1,740 1,239 1,069 285 232 160 5,772
Equity-accounted entities
Reserves at December 31, 2013 19 75 7 726 827
of which: developed 19 3 18 40
undeveloped 75 4 708 787
Purchase of minerals in place
Revisions of previous estimates (1) 7 5 11
Improved recovery
Extensions and discoveries
Production (2) (1) (2) (3) (8)
Sales of minerals in place
Reserves at December 31, 2014 16 81 5 728 830
Reserves at December 31, 2014 503 544 1,756 1,320 1,069 290 960 160 6,602
Developed 401 335 919 725 589 115 214 135 3,433
consolidated subsidiaries 401 335 904 702 589 112 188 135 3,366
equity-accounted entities 15 23 3 26 67
Undeveloped 102 209 837 595 480 175 746 25 3,169
consolidated subsidiaries 102 209 836 537 480 173 44 25 2,406
equity-accounted entities 1 58 2 702 763
Reserves life index (year) 7.7 7.8 8.5 11.1 33.4 8.1 21.3 17.8 11.3
Reserves replacement ratio, organic (%) 106 77 78 182 206 156 87 112
Reserves replacement ratio, all sources 106 81 78 176 206 156 87 112

E X P L O R A T I O N & P R O D U C T I O N30
Movements in net proved liquids reserves
(mmbbl) Italy
Rest
of E
urop
e
Nort
h Af
rica
Egyp
t
Sub-
Saha
ran
Afric
a
Kaza
khst
an
Rest
of A
sia
Amer
ica
Aust
ralia
and
Oc
eani
a
Tota
l
2018
Consolidated subsidiaries
Reserves at December 31, 2017 215 360 476 280 764 766 232 162 7 3,262
of which: developed 169 219 306 203 546 547 81 144 5 2,220
undeveloped 46 141 170 77 218 219 151 18 2 1,042
Purchase of minerals in place 319 319
Revisions of previous estimates 15 6 73 21 30 (27) (54) 23 (1) 86
Improved recovery 7 6 13
Extensions and discoveries 13 1 86 100
Production (22) (40) (56) (28) (89) (35) (28) (19) (1) (318)
Sales of minerals in place (278) (1) (279)
Reserves at December 31, 2018 208 48 493 279 718 704 476 252 5 3,183
Equity-accounted entities
Reserves at December 31, 2017 12 12 136 160
of which: developed 12 6 25 43
undeveloped 6 111 117
Purchase of minerals in place 297 297
Revisions of previous estimates 1 (96) (95)
Improved recovery
Extensions and discoveries
Production (1) (1) (3) (5)
Sales of minerals in place
Reserves at December 31, 2018 297 11 12 37 357
Reserves at December 31, 2018 208 345 504 279 730 704 476 289 5 3,540
Developed 156 198 328 153 559 587 252 175 5 2,413
consolidated subsidiaries 156 44 317 153 551 587 252 143 5 2,208
equity-accounted entities 154 11 8 32 205
Undeveloped 52 147 176 126 171 117 224 114 1,127
consolidated subsidiaries 52 4 176 126 167 117 224 109 975
equity-accounted entities 143 4 5 152

E X P L O R A T I O N & P R O D U C T I O NE
ni F
ac
t Bo
ok
20
1831
Movements in net proved liquids reserves
(mmbbl) Italy
Rest
of E
urop
e
Nort
h Af
rica
Egyp
t
Sub-
Saha
ran
Afric
a
Kaza
khst
an
Rest
of A
sia
Amer
ica
Aust
ralia
and
Oc
eani
a
Tota
l
2017
Consolidated subsidiaries
Reserves at December 31, 2016 176 264 454 281 809 767 307 163 9 3,230
of which: developed 132 228 287 205 507 556 124 143 8 2,190
undeveloped 44 36 167 76 302 211 183 20 1 1,040
Purchase of minerals in place 2 2
Revisions of previous estimates 59 29 73 21 31 29 (69) 19 (1) 191
Improved recovery 1 6 7 9 23
Extensions and discoveries 103 1 18 4 3 129
Production (20) (37) (58) (26) (90) (30) (19) (23) (1) (304)
Sales of minerals in place (3) (6) (9)
Reserves at December 31, 2017 215 360 476 280 764 766 232 162 7 3,262
Equity-accounted entities
Reserves at December 31, 2016 13 15 140 168
of which: developed 13 8 22 43
undeveloped 7 118 125
Purchase of minerals in place
Revisions of previous estimates (2) 1 (1)
Improved recovery
Extensions and discoveries
Production (1) (1) (5) (7)
Sales of minerals in place
Reserves at December 31, 2017 12 12 136 160
Reserves at December 31, 2017 215 360 488 280 776 766 232 298 7 3,422
Developed 169 219 318 203 552 547 81 169 5 2,263
consolidated subsidiaries 169 219 306 203 546 547 81 144 5 2,220
equity-accounted entities 12 6 25 43
Undeveloped 46 141 170 77 224 219 151 129 2 1,159
consolidated subsidiaries 46 141 170 77 218 219 151 18 2 1,042
equity-accounted entities 6 111 117

E X P L O R A T I O N & P R O D U C T I O N32
Movements in net proved liquids reserves
(mmbbl) Italy
Rest
of E
urop
e
Nort
h Af
rica
Egyp
t
Sub-
Saha
ran
Afric
a
Kaza
khst
an
Rest
of A
sia
Amer
ica
Aust
ralia
and
Oc
eani
a
Tota
l
2016
Consolidated subsidiaries
Reserves at December 31, 2015 228 305 494 327 787 771 262 189 9 3,372
of which: developed 171 237 312 230 511 355 126 149 9 2,100
undeveloped 57 68 182 97 276 416 136 40 1,272
Purchase of minerals in place
Revisions of previous estimates (35) (4) 19 (26) 113 20 73 (1) 1 160
Improved recovery 1 1 2
Extensions and discoveries 2 1 8 11
Production (17) (40) (61) (28) (91) (24) (28) (25) (1) (315)
Sales of minerals in place
Reserves at December 31, 2016 176 264 454 281 809 767 307 163 9 3,230
Equity-accounted entities
Reserves at December 31, 2015 13 16 158 187
of which: developed 13 6 29 48
undeveloped 10 129 139
Purchase of minerals in place
Revisions of previous estimates 1 (1) (13) (13)
Improved recovery
Extensions and discoveries
Production (1) (5) (6)
Sales of minerals in place
Reserves at December 31, 2016 13 15 140 168
Reserves at December 31, 2016 176 264 467 281 824 767 307 303 9 3,398
Developed 132 228 300 205 515 556 124 165 8 2,233
consolidated subsidiaries 132 228 287 205 507 556 124 143 8 2,190
equity-accounted entities 13 8 22 43
Undeveloped 44 36 167 76 309 211 183 138 1 1,165
consolidated subsidiaries 44 36 167 76 302 211 183 20 1 1,040
equity-accounted entities 7 118 125

E X P L O R A T I O N & P R O D U C T I O NE
ni F
ac
t Bo
ok
20
1833
Movements in net proved liquids reserves
(mmbbl) Italy
Rest
of E
urop
e
Nort
h Af
rica
Sub-
Saha
ran
Afric
a
Kaza
khst
an
Rest
of A
sia
Amer
ica
Aust
ralia
and
Oc
eani
a
Tota
l
2015
Consolidated subsidiaries
Reserves at December 31, 2014 243 331 776 739 697 131 147 13 3,077
of which: developed 184 174 521 470 306 64 116 12 1,847
undeveloped 59 157 255 269 391 67 31 1 1,230
Purchase of minerals in place
Revisions of previous estimates 10 5 139 143 94 159 64 (2) 612
Improved recovery 2 2
Extensions and discoveries 2 14 6 22
Production (25) (31) (98) (93) (20) (28) (28) (2) (325)
Sales of minerals in place (16) (16)
Reserves at December 31, 2015 228 305 821 787 771 262 189 9 3,372
Equity-accounted entities
Reserves at December 31, 2014 14 17 1 117 149
of which: developed 13 7 26 46
undeveloped 1 10 1 91 103
Purchase of minerals in place
Revisions of previous estimates (1) 45 44
Improved recovery
Extensions and discoveries
Production (1) (1) (4) (6)
Sales of minerals in place
Reserves at December 31, 2015 13 16 158 187
Reserves at December 31, 2015 228 305 834 803 771 262 347 9 3,559
Developed 171 237 555 517 355 126 178 9 2,148
consolidated subsidiaries 171 237 542 511 355 126 149 9 2,100
equity-accounted entities 13 6 29 48
Undeveloped 57 68 279 286 416 136 169 1,411
consolidated subsidiaries 57 68 279 276 416 136 40 1,272
equity-accounted entities 10 129 139

E X P L O R A T I O N & P R O D U C T I O N34
Movements in net proved liquids reserves
(mmbbl) Italy
Rest
of E
urop
e
Nort
h Af
rica
Sub-
Saha
ran
Afric
a
Kaza
khst
an
Rest
of A
sia
Amer
ica
Aust
ralia
and
Oc
eani
a
Tota
l
2014
Consolidated subsidiaries
Reserves at December 31, 2013 220 330 830 723 679 128 147 22 3,079
of which: developed 177 179 561 465 295 38 96 20 1,831
undeveloped 43 151 269 258 384 90 51 2 1,248
Purchase of minerals in place 1 1
Revisions of previous estimates 49 35 32 70 35 16 22 (7) 252
Improved recovery 3 1 2 6
Extensions and discoveries 1 2 36 5 44
Production (27) (34) (91) (84) (19) (13) (27) (2) (297)
Sales of minerals in place (1) (7) (8)
Reserves at December 31, 2014 243 331 776 739 697 131 147 13 3,077
Equity-accounted entities
Reserves at December 31, 2013 16 15 1 116 148
of which: developed 16 19 35
undeveloped 15 1 97 113
Purchase of minerals in place
Revisions of previous estimates (1) 3 5 7
Improved recovery
Extensions and discoveries
Production (1) (1) (4) (6)
Sales of minerals in place
Reserves at December 31, 2014 14 17 1 117 149
Reserves at December 31, 2014 243 331 790 756 697 132 264 13 3,226
Developed 184 174 534 477 306 64 142 12 1,893
consolidated subsidiaries 184 174 521 470 306 64 116 12 1,847
equity-accounted entities 13 7 26 46
Undeveloped 59 157 256 279 391 68 122 1 1,333
consolidated subsidiaries 59 157 255 269 391 67 31 1 1,230
equity-accounted entities 1 10 1 91 103

E X P L O R A T I O N & P R O D U C T I O NE
ni F
ac
t Bo
ok
20
1835
Movements in net proved natural gas reserves
(bcf) Italy
Rest
of E
urop
e
Nort
h Af
rica
Egyp
t
Sub-
Saha
ran
Afric
a
Kaza
khst
an
Rest
of A
sia
Amer
ica
Aust
ralia
and
Oc
eani
a
Tota
l
2018
Consolidated subsidiaries
Reserves at December 31, 2017 1,131 896 3,145 4,351 3,660 2,108 1,065 225 709 17,290
of which: developed 987 771 1,233 1,421 1,693 1,878 862 171 519 9,535
undeveloped 144 125 1,912 2,930 1,967 230 203 54 190 7,755
Purchase of minerals in place 69 69
Revisions of previous estimates 138 50 219 2,238 23 (22) 81 45 (16) 2,756
Improved recovery
Extensions and discoveries 86 7 205 76 374
Production (156) (162) (474) (445) (184) (97) (201) (43) (42) (1,804)
Sales of minerals in place (464) (869) (2) (26) (1,361)
Reserves at December 31, 2018 1,199 320 2,890 5,275 3,506 1,989 1,217 277 651 17,324
Equity-accounted entities
Reserves at December 31, 2017 14 349 1,819 2,182
of which: developed 14 83 1,819 1,916
undeveloped 266 266
Purchase of minerals in place 360 360
Revisions of previous estimates 2 (6) (22) (26)
Improved recovery
Extensions and discoveries
Production (2) (33) (81) (116)
Sales of minerals in place (19) (19)
Reserves at December 31, 2018 360 14 310 1,716 2,400
Reserves at December 31, 2018 1,199 680 2,904 5,275 3,816 1,989 1,217 1,993 651 19,724
Developed 980 576 1,461 3,331 1,928 1,846 822 1,870 452 13,266
consolidated subsidiaries 980 300 1,447 3,331 1,871 1,846 822 154 452 11,203
equity-accounted entities 276 14 57 1,716 2,063
Undeveloped 219 104 1,443 1,944 1,888 143 395 123 199 6,458
consolidated subsidiaries 219 20 1,443 1,944 1,635 143 395 123 199 6,121
equity-accounted entities 84 253 337

E X P L O R A T I O N & P R O D U C T I O N36
Movements in net proved natural gas reserves
(bcf) Italy
Rest
of E
urop
e
Nort
h Af
rica
Egyp
t
Sub-
Saha
ran
Afric
a
Kaza
khst
an
Rest
of A
sia
Amer
ica
Aust
ralia
and
Oc
eani
a
Tota
l
2017
Consolidated subsidiaries
Reserves at December 31, 2016 977 878 3,738 5,520 2,767 2,485 1,003 353 741 18,462
of which: developed 845 801 1,732 799 1,651 2,239 280 338 559 9,244
undeveloped 132 77 2,006 4,721 1,116 246 723 15 182 9,218
Purchase of minerals in place 1 1
Revisions of previous estimates 315 163 66 969 134 (281) 188 (61) 6 1,499
Improved recovery (19) (19)
Extensions and discoveries 29 64 1,839 4 1,936
Production (161) (174) (640) (315) (162) (96) (126) (71) (38) (1,783)
Sales of minerals in place (1,887) (919) (2,806)
Reserves at December 31, 2017 1,131 896 3,145 4,351 3,660 2,108 1,065 225 709 17,290
Equity-accounted entities
Reserves at December 31, 2016 15 368 4 3,484 3,871
of which: developed 15 104 4 1,782 1,905
undeveloped 264 1,702 1,966
Purchase of minerals in place
Revisions of previous estimates 13 (1,565) (1,552)
Improved recovery
Extensions and discoveries
Production (1) (32) (4) (100) (137)
Sales of minerals in place
Reserves at December 31, 2017 14 349 1,819 2,182
Reserves at December 31, 2017 1,131 896 3,159 4,351 4,009 2,108 1,065 2,044 709 19,472
Developed 987 771 1,247 1,421 1,776 1,878 862 1,990 519 11,451
consolidated subsidiaries 987 771 1,233 1,421 1,693 1,878 862 171 519 9,535
equity-accounted entities 14 83 1,819 1,916
Undeveloped 144 125 1,912 2,930 2,233 230 203 54 190 8,021
consolidated subsidiaries 144 125 1,912 2,930 1,967 230 203 54 190 7,755
equity-accounted entities 266 266
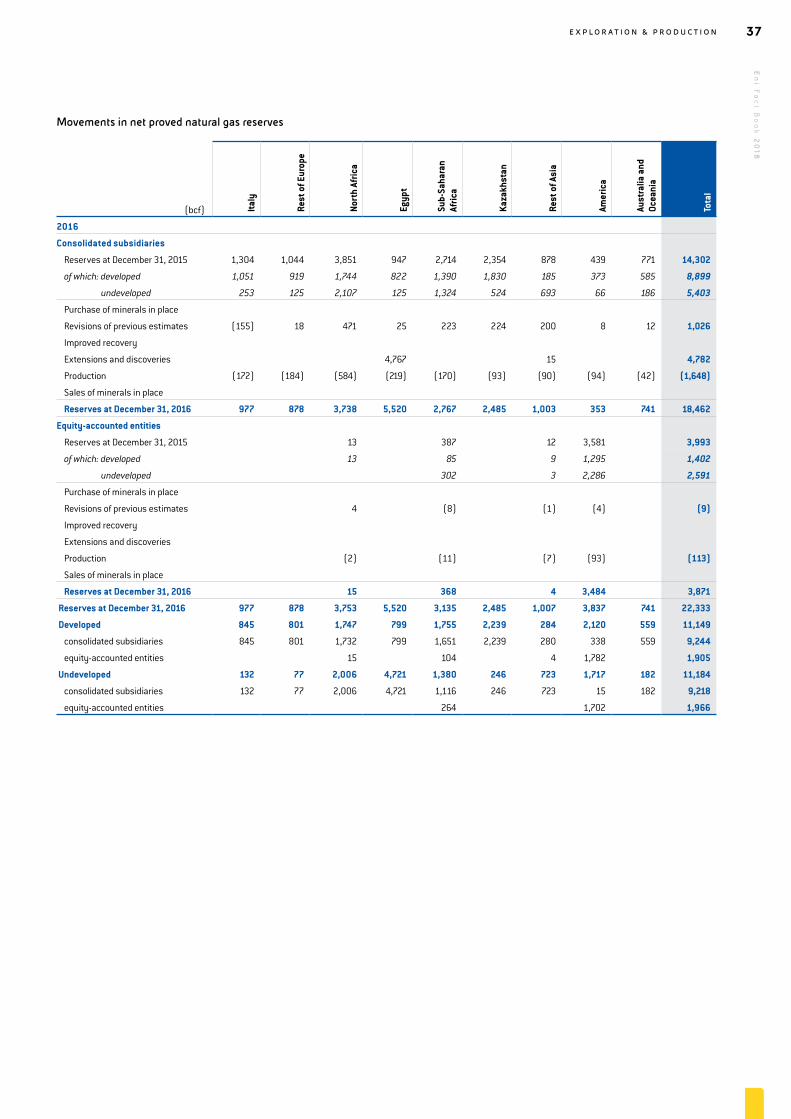
E X P L O R A T I O N & P R O D U C T I O NE
ni F
ac
t Bo
ok
20
1837
Movements in net proved natural gas reserves
(bcf) Italy
Rest
of E
urop
e
Nort
h Af
rica
Egyp
t
Sub-
Saha
ran
Afric
a
Kaza
khst
an
Rest
of A
sia
Amer
ica
Aust
ralia
and
Oc
eani
a
Tota
l
2016
Consolidated subsidiaries
Reserves at December 31, 2015 1,304 1,044 3,851 947 2,714 2,354 878 439 771 14,302
of which: developed 1,051 919 1,744 822 1,390 1,830 185 373 585 8,899
undeveloped 253 125 2,107 125 1,324 524 693 66 186 5,403
Purchase of minerals in place
Revisions of previous estimates (155) 18 471 25 223 224 200 8 12 1,026
Improved recovery
Extensions and discoveries 4,767 15 4,782
Production (172) (184) (584) (219) (170) (93) (90) (94) (42) (1,648)
Sales of minerals in place
Reserves at December 31, 2016 977 878 3,738 5,520 2,767 2,485 1,003 353 741 18,462
Equity-accounted entities
Reserves at December 31, 2015 13 387 12 3,581 3,993
of which: developed 13 85 9 1,295 1,402
undeveloped 302 3 2,286 2,591
Purchase of minerals in place
Revisions of previous estimates 4 (8) (1) (4) (9)
Improved recovery
Extensions and discoveries
Production (2) (11) (7) (93) (113)
Sales of minerals in place
Reserves at December 31, 2016 15 368 4 3,484 3,871
Reserves at December 31, 2016 977 878 3,753 5,520 3,135 2,485 1,007 3,837 741 22,333
Developed 845 801 1,747 799 1,755 2,239 284 2,120 559 11,149
consolidated subsidiaries 845 801 1,732 799 1,651 2,239 280 338 559 9,244
equity-accounted entities 15 104 4 1,782 1,905
Undeveloped 132 77 2,006 4,721 1,380 246 723 1,717 182 11,184
consolidated subsidiaries 132 77 2,006 4,721 1,116 246 723 15 182 9,218
equity-accounted entities 264 1,702 1,966

E X P L O R A T I O N & P R O D U C T I O N38
Movements in net proved natural gas reserves
(bcf) Italy
Rest
of E
urop
e
Nort
h Af
rica
Sub-
Saha
ran
Afric
a
Kaza
khst
an
Rest
of A
sia
Amer
ica
Aust
ralia
and
Oc
eani
a
Tota
l
2015
Consolidated subsidiaries
Reserves at December 31, 2014 1,432 1,171 5,291 2,744 2,049 846 468 807 14,808
of which: developed 1,192 887 2,110 1,271 1,553 261 393 675 8,342
undeveloped 240 284 3,181 1,473 496 585 75 132 6,466
Purchase of minerals in place
Revisions of previous estimates 68 74 163 145 385 24 69 5 933
Improved recovery
Extensions and discoveries 4 124 114 242
Production (200) (201) (780) (171) (80) (106) (94) (41) (1,673)
Sales of minerals in place (4) (4) (8)
Reserves at December 31, 2015 1,304 1,044 4,798 2,714 2,354 878 439 771 14,302
Equity-accounted entities
Reserves at December 31, 2014 15 351 18 3,353 3,737
of which: developed 15 89 10 6 120
undeveloped 262 8 3,347 3,617
Purchase of minerals in place
Revisions of previous estimates 36 3 253 292
Improved recovery
Extensions and discoveries
Production (2) (9) (25) (36)
Sales of minerals in place
Reserves at December 31, 2015 13 387 12 3,581 3,993
Reserves at December 31, 2015 1,304 1,044 4,811 3,101 2,354 890 4,020 771 18,295
Developed 1,051 919 2,579 1,475 1,830 194 1,668 585 10,301
consolidated subsidiaries 1,051 919 2,566 1,390 1,830 185 373 585 8,899
equity-accounted entities 13 85 9 1,295 1,402
Undeveloped 253 125 2,232 1,626 524 696 2,352 186 7,994
consolidated subsidiaries 253 125 2,232 1,324 524 693 66 186 5,403
equity-accounted entities 302 3 2,286 2,591

E X P L O R A T I O N & P R O D U C T I O NE
ni F
ac
t Bo
ok
20
1839
Movements in net proved natural gas reserves
(bcf) Italy
Rest
of E
urop
e
Nort
h Af
rica
Sub-
Saha
ran
Afric
a
Kaza
khst
an
Rest
of A
sia
Amer
ica
Aust
ralia
and
Oc
eani
a
Tota
l
2014
Consolidated subsidiaries
Reserves at December 31, 2013 1,532 1,247 5,231 2,374 1,957 744 509 848 14,442
of which: developed 1,266 904 2,432 1,295 1,488 286 310 561 8,542
undeveloped 266 343 2,799 1,079 469 458 199 287 5,900
Purchase of minerals in place 21 21
Revisions of previous estimates 113 99 668 214 165 156 23 (1) 1,437
Improved recovery
Extensions and discoveries 19 341 59 16 435
Production (213) (195) (627) (185) (73) (113) (80) (40) (1,526)
Sales of minerals in place (1) (1)
Reserves at December 31, 2014 1,432 1,171 5,291 2,744 2,049 846 468 807 14,808
Equity-accounted entities
Reserves at December 31, 2013 15 330 28 3,353 3,726
of which: developed 15 14 5 34
undeveloped 330 14 3,348 3,692
Purchase of minerals in place
Revisions of previous estimates 2 25 (2) 25
Improved recovery
Extensions and discoveries
Production (2) (4) (8) (14)
Sales of minerals in place
Reserves at December 31, 2014 15 351 18 3,353 3,737
Reserves at December 31, 2014 1,432 1,171 5,306 3,095 2,049 864 3,821 807 18,545
Developed 1,192 887 2,125 1,360 1,553 271 399 675 8,462
consolidated subsidiaries 1,192 887 2,110 1,271 1,553 261 393 675 8,342
equity-accounted entities 15 89 10 6 120
Undeveloped 240 284 3,181 1,735 496 593 3,422 132 10,083
consolidated subsidiaries 240 284 3,181 1,473 496 585 75 132 6,466
equity-accounted entities 262 8 3,347 3,617

E X P L O R A T I O N & P R O D U C T I O N40
Hydrocarbons production(a)
Consolidated subsidiaries (kboe/d) 2018 2017 2016 2015 2014
Italy 138 134 133 169 179
Rest of Europe 194 189 201 185 190
Croatia 2 3 5 4 7
Norway 134 129 133 105 112
United Kingdom 58 57 63 76 71
North Africa 392 479 458 469 356
Algeria 85 90 98 96 109
Libya 302 384 353 365 239
Tunisia 5 5 7 8 8
Egypt 300 230 185 189 206
Sub-Saharan Africa 337 327 333 341 323
Angola 127 126 118 101 82
Congo 92 83 98 103 106
Ghana 18 9
Nigeria 100 109 117 137 135
Kazakhstan 143 132 111 95 88
Rest of Asia 177 116 123 130 93
China 1 2 2 3 4
India 1 1
Indonesia 71 38 12 12 11
Iran 22 1
Iraq 34 43 67 40 21
Pakistan 20 24 32 41 45
Turkmenistan 11 9 10 11 10
United Arab Emirates 40
Americas 75 99 116 122 115
Ecuador 12 12 10 11 12
Trinidad & Tobago 7 10 13 13 11
United States 56 77 93 98 92
Australia and Oceania 23 22 24 26 26
Australia 23 22 24 26 26
1,779 1,728 1,684 1,726 1,576
Equity-accounted entities
Angola 19 20 6 2
Indonesia 1 3 4 5 5
Tunisia 4 4 4 4 5
Venezuela 48 61 61 25 10
72 88 75 34 22
Total 1,851 1,816 1,759 1,760 1,598
(a) Includes volumes of hydrocarbons consumed in operations (119, 97, 88, 73 and 81 kboe/d in 2018, 2017, 2016, 2015 and 2014 respectively).

E X P L O R A T I O N & P R O D U C T I O NE
ni F
ac
t Bo
ok
20
1841
Liquids production
Consolidated subsidiaries (kbbl/d) 2018 2017 2016 2015 2014
Italy 60 53 47 69 73
Rest of Europe 113 102 109 85 93
Croatia
Norway 89 81 86 57 62
United Kingdom 24 21 23 28 31
North Africa 154 158 165 172 160
Algeria 65 68 77 79 83
Libya 86 87 84 89 73
Tunisia 3 3 4 4 4
Egypt 77 72 76 96 88
Sub-Saharan Africa 244 247 247 256 231
Angola 111 119 108 96 75
Congo 65 63 71 78 80
Ghana 15 8
Nigeria 53 57 68 82 76
Kazakhstan 94 83 65 56 52
Rest of Asia 77 53 78 77 36
China 1 2 2 3 4
Indonesia 3 3 3 2 1
Iran 22 1
Iraq 28 40 64 40 21
Pakistan
Turkmenistan 6 8 9 10 9
United Arab Emirates 39
Americas 52 63 69 75 74
Ecuador 12 12 10 11 12
United States 40 51 59 64 62
Australia and Oceania 2 2 3 5 6
Australia 2 2 3 5 6
873 833 859 891 813
Equity-accounted entities
Angola 3 3 1
Indonesia 1 1 1 1
Tunisia 3 3 3 4 4
Venezuela 8 12 14 12 10
14 19 19 17 15
Total 887 852 878 908 828

E X P L O R A T I O N & P R O D U C T I O N42
Natural gas production
Consolidated subsidiaries (mmcf/d) 2018 2017 2016 2015 2014
Italy 426.2 441.6 471.2 546.6 583.8
Rest of Europe 444.9 476.4 501.8 551.8 535.2
Croatia 11.4 16.9 26.5 21.2 38.2
Norway 241.8 265.4 258.3 264.6 274.2
United Kingdom 191.7 194.1 217.0 266.0 222.8
North Africa 1,299.1 1,753.0 1,594.8 1,627.9 1,069.1
Algeria 105.5 117.2 115.5 94.1 141.3
Libya 1,180.3 1,623.1 1,464.8 1,517.3 911.2
Tunisia 13.3 12.7 14.5 16.5 16.6
Egypt 1,218.5 862.7 597.4 510.1 649.8
Sub-Saharan Africa 505.4 444.3 464.3 468.3 507.5
Angola 84.2 45.9 49.0 31.6 38.3
Congo 150.3 112.6 148.5 136.8 145.1
Ghana 19.3 2.7
Nigeria 251.6 283.1 266.8 299.9 324.1
Kazakhstan 265.2 263.7 254.0 218.3 200.7
Rest of Asia 550.7 345.9 245.8 289.8 310.4
China 0.1
India 2.6 3.7
Indonesia 376.5 188.8 48.5 54.8 52.6
Iraq 36.7 19.6 19.2
Pakistan 106.1 131.5 172.1 226.4 248.2
Turkmenistan 27.2 5.9 6.0 6.0 5.9
United Arab Emirates 4.2
Americas 118.9 194.0 256.4 257.1 217.8
Trinidad & Tobago 35.7 55.4 69.7 70.4 60.3
United States 83.2 138.6 186.7 186.7 157.5
Australia and Oceania 114.3 105.0 113.9 111.8 110.5
Australia 114.3 105.0 113.9 111.8 110.5
4,943.2 4,886.6 4,499.6 4,581.7 4,184.8
Equity-accounted entities
Angola 89.2 89.0 29.1 0.9 10.3
Indonesia 2.2 11.0 18.8 24.1 23.2
Tunisia 4.4 4.1 4.9 5.2 5.3
Venezuela 221.7 270.5 254.8 68.9 0.8
317.5 374.6 307.6 99.1 39.6
Total 5,260.7 5,261.2 4,807.2 4,680.8 4,224.4
Oil and natural gas production sold
2018 2017 2016 2015 2014Oil and natural gas production (mmboe) 675.6 662.7 643.8 642.4 583.1
Change in inventories other (7.1) (5.2) (3.1) (1.9) (4.2)
Own consumption of hydrocarbons (43.5) (35.2) (32.1) (26.4) (29.4)
Oil and natural gas production sold(a) 625.0 622.3 608.6 614.1 549.5
Oil (mmbbl) 319.97 308.34 320.13 330.12 299.78
- of which to R&M 221.33 216.55 216.24 201.92 184.74
Natural gas (bcf) 1,665 1,713 1,574 1,560 1,371
- of which to G&P 349 344 347 394 371
(a) Includes 25.1 mmboe of equity-accounted entities production sold in 2018 (27.3, 24, 11.4 and 6.1 mmboe in 2017, 2016, 2015 and 2014, respectively).

E X P L O R A T I O N & P R O D U C T I O NE
ni F
ac
t Bo
ok
20
1843
Principal oil and natural gas interests at December 31, 2018
Com
men
cem
ent
of o
pera
tions
Num
ber o
f in
tere
sts
Gros
s de
velo
ped(a
)(b)
ac
reag
e
Net
deve
lope
d(a)(
b)
acre
age
Gros
s un
deve
lope
d(a)
acre
age
Net
unde
velo
ped(a
)
acre
age
Type
s of
fie
lds/
acre
age
Num
ber o
fpr
oduc
ing
field
s
Num
ber o
fot
her fi
elds
EUROPE 317 13,757 9,409 58,376 36,923 101 97 Italy 1926 140 9,962 8,303 8,871 6,684 Onshore/Offshore 72 56 Rest of Europe 177 3,795 1,106 49,505 30,239 29 41
Cyprus 2013 6 22,790 17,111 Offshore Greenland 2013 2 4,890 1,909 Offshore Montenegro 2016 1 1,228 614 Offshore Norway 1965 106 2,886 492 9,630 2,136 Offshore 19 39 Portugal 2014 3 4,547 3,182 Offshore United Kingdom 1964 57 909 614 3,719 3,404 Offshore 10 2 Other Countries 2 2,701 1,883 Offshore
AFRICA 261 46,263 11,844 258,232 153,855 273 123 North Africa 64 8,846 3,640 48,760 30,292 68 27
Algeria 1981 42 3,283 1,124 187 31 Onshore 34 9 Libya 1959 11 1,963 958 24,673 12,336 Onshore/Offshore 11 15 Morocco 2016 1 23,900 17,925 Offshore Tunisia 1961 10 3,600 1,558 Onshore/Offshore 23 3
Egypt 1954 53 5,423 2,018 10,480 3,230 Onshore/Offshore 40 23 Sub-Saharan Africa 144 31,994 6,186 198,992 120,333 165 73
Angola 1980 58 8,200 1,064 13,241 4,239 Onshore/Offshore 60 25 Congo 1968 25 1,430 843 1,320 628 Onshore/Offshore 23 3 Gabon 2008 4 4,107 4,107 Onshore/Offshore 1 Ghana 2009 3 226 100 1,127 479 Offshore 1 Ivory Coast 2015 3 4,010 2,905 Offshore Kenya 2012 6 50,677 43,948 Offshore Mozambique 2007 6 3,911 978 Offshore 6 Nigeria 1962 34 22,138 4,179 8,631 3,543 Onshore/Offshore 81 38 South Africa 2014 1 65,505 26,202 Offshore Other Countries 4 46,463 33,304 Onshore
ASIA 61 13,024 3,368 285,289 178,046 24 22 Kazakhstan 1992 7 2,391 442 3,890 1,101 Onshore/Offshore 2 4 Rest of Asia 54 10,633 2,926 281,399 176,945 22 18
China 1984 7 77 13 5,215 5,215 Offshore 5 India 2005 1 13,110 5,244 Offshore Indonesia 2001 13 2,943 1,198 27,230 22,571 Onshore/Offshore 2 9 Iraq 2009 1 1,074 446 Onshore 1 Lebanon 2018 2 3,653 1,461 Offshore Myanmar 2014 4 24,080 13,558 Onshore/Offshore Oman 2017 1 90,760 77,146 Offshore Pakistan 2000 12 3,390 872 11,486 4,914 Onshore/Offshore 9 Russia 2007 2 53,930 17,975 Offshore Timor Leste 2006 1 1,538 1,230 Offshore Turkmenistan 2008 1 200 180 Onshore 2 United Arab Emirates 2018 3 2,949 217 5,020 1,255 Offshore 3 9 Vietnam 2013 5 30,777 23,132 Offshore Other Countries 1 14,600 3,244 Offshore
AMERICAS 252 4,419 3,056 12,543 6,247 42 15 Ecuador 1988 1 1,985 1,985 Onshore 1 2 Mexico 2015 8 4,387 3,000 Offshore 3 United States 1968 230 1,173 574 1,949 1,617 Onshore/Offshore 38 8 Venezuela 1998 6 1,261 497 1,543 569 Onshore/Offshore 3 1 Other Countries 7 4,664 1,061 Offshore 1
AUSTRALIA AND OCEANIA 11 1,140 709 4,611 3,048 2 4 Australia 2001 11 1,140 709 4,611 3,048 Offshore 2 4
Total 902 78,603 28,386 619,051 378,119 442 261
(a) Square kilometers.(b) Developed acreage refers to those leases in which at least a portion of the area is in production or encompasses proved developed reserves.

E X P L O R A T I O N & P R O D U C T I O N44
Average realizations
2018 2017 2016 2015 2014
Liquids ($/bbl)Consolidated subsidiaries
Equity-accounted
entitiesConsolidated subsidiaries
Equity-accounted
entitiesConsolidated subsidiaries
Equity-accounted
entitiesConsolidated subsidiaries
Equity-accounted
entitiesConsolidated subsidiaries
Equity-accounted
entitiesItaly 61.58 46.51 33.19 43.46 87.80Rest of Europe 64.51 47.81 39.97 45.88 88.80North Africa 65.95 17.92 52.68 17.95 42.37 17.93 46.66 18.03 88.99 17.94Egypt 62.97 46.06 33.05Sub-Saharan Africa 68.76 39.48 53.66 38.34 41.92 49.91 93.45Kazakhstan 66.78 50.62 39.61 48.26 91.86Rest of Asia 68.35 49.86 48.94 44.43 36.89 34.95 40.10 27.89 77.99 65.90Americas 57.22 54.86 44.24 41.49 34.86 32.39 43.36 38.18 79.13 81.48Australia and Oceania 68.72 49.36 37.96 45.84 91.61
65.79 45.19 50.33 38.65 39.33 30.85 46.46 35.15 88.90 70.56Natural gas ($/kcf)Italy 8.37 6.45 4.93 6.92 8.74Rest of Europe 7.99 5.81 4.49 6.30 8.49North Africa 4.97 3.58 2.96 2.63 3.10 1.85 4.69 3.78 8.08 6.08Egypt 4.85 4.19 3.82Sub-Saharan Africa 2.38 9.50 1.87 7.34 1.41 1.49 2.12Kazakhstan 0.77 0.58 0.34 0.47 0.62Rest of Asia 6.11 9.32 3.75 6.06 3.50 5.92 4.83 9.27 6.18 15.64Americas 2.38 4.28 2.35 4.19 1.94 4.17 2.20 4.24 3.96Australia and Oceania 4.80 4.05 3.60 5.07 7.46
5.17 5.59 3.62 4.64 3.20 4.25 4.54 5.30 6.83 14.13Hydrocarbons ($/boe)Italy 53.01 39.96 29.27 40.36 64.80Rest of Europe 56.07 40.51 33.27 40.21 67.87North Africa 43.34 18.14 28.62 17.35 26.52 16.27 34.61 18.60 65.36 21.43Egypt 36.22 30.64 26.29Sub-Saharan Africa 58.59 48.79 44.85 39.65 35.08 40.92 73.18Kazakhstan 46.98 34.60 24.52 30.02 57.20Rest of Asia 50.98 50.64 36.69 36.76 31.18 32.76 35.18 49.42 52.75 83.12Americas 46.63 28.59 33.31 26.50 25.45 24.95 31.71 30.72 59.94 81.48Australia and Oceania 28.99 25.29 22.00 31.51 52.46
48.04 33.63 35.39 28.30 29.30 25.05 36.54 31.95 65.36 72.19
ENI's GROUP 2018 2017 2016 2015 2014Liquids ($/bbl) 65.47 50.06 39.18 46.30 88.71Natural gas ($/kcf) 5.20 3.69 3.27 4.55 6.87Hydrocarbon ($/boe) 47.48 35.06 29.14 36.47 65.49
Net developed and undeveloped acreage
(square kilometers) 2018 2017 2016 2015 2014Europe 46,332 51,206 45,380 45,123 44,842Italy 14,987 16,380 16,767 16,975 17,297Rest of Europe 31,345 34,826 28,613 28,148 27,545Africa 165,699 161,981 152,676 157,441 159,341North Africa 33,932 25,797 18,727 16,031 16,747Egypt 5,248 9,192 10,665 9,668 4,946Sub-Saharan Africa 126,519 126,992 123,284 131,742 137,648Asia 181,414 184,029 109,761 117,183 109,237Kazakhstan 1,543 1,543 869 869 869Rest of Asia 179,871 182,486 108,892 116,314 108,368Americas 9,303 6,641 5,696 6,628 7,943Australia and Oceania 3,757 11,061 10,383 16,333 13,376Total 406,505 414,918 323,896 342,708 334,739

E X P L O R A T I O N & P R O D U C T I O NE
ni F
ac
t Bo
ok
20
1845
Exploratory wells activity
Wells completed(a) Wells in progress at of Dec.31(b)
2018 2017 2016 2015 2014 2018
(units) Prod
ucti
ve
Dry(c
)
Prod
ucti
ve
Dry(c
)
Prod
ucti
ve
Dry(c
)
Prod
ucti
ve
Dry(c
)
Prod
ucti
ve
Dry(c
)
Gros
s
Net
Italy 1.8 1.0 0.6 1.0 0.5
Rest of Europe 0.5 1.2 1.3 0.1 0.4 2.2 4.3 12.0 3.5
North Africa 0.5 0.5 0.5 1.0 1.0 3.5 4.3 8.0 7.0
Egypt 1.7 1.5 2.5 5.4 5.5 0.8 3.3 4.8 11.0 8.9
Sub-Saharan Africa 0.4 2.9 0.3 0.1 1.1 0.6 2.9 7.3 7.3 31.0 15.1
Kazakhstan 6.0 1.0
Rest of Asia 2.2 2.6 0.9 3.4 1.3 4.3 8.0 2.5
Americas 4.0 0.5 1.0 1.0 0.3 2.0 1.4 2.0 1.5
Australia and Oceania 0.9 1.0 0.3
10.1 5.1 7.6 7.0 6.2 6.2 4.9 14.6 14.1 23.1 80.0 40.3
Productive oil and gas wells(d)
2018
Oil wells Natural gas wells
(units) Gross Net Gross Net
Italy 202.0 157.0 479.0 415.9
Rest of Europe 477.0 86.5 135.0 65.3
North Africa 592.0 242.8 116.0 63.2
Egypt 1,194.0 508.3 147.0 48.3
Sub-Saharan Africa 2,747.0 550.4 181.0 23.0
Kazakhstan 200.0 55.1
Rest of Asia 955.0 336.7 167.0 62.0
Americas 270.0 132.1 284.0 81.7
Australia and Oceania 3.0 1.2 21.0 7.1
6,640.0 2,070.1 1,530.0 766.5
Development wells activity
Wells completed(a) Wells in progress at of Dec.31
2018 2017 2016 2015 2014 2018
(units) Prod
ucti
ve
Dry(c
)
Prod
ucti
ve
Dry(c
)
Prod
ucti
ve
Dry(c
)
Prod
ucti
ve
Dry(c
)
Prod
ucti
ve
Dry(c
)
Gros
s
Net
Italy 3.0 2.6 4.0 6.0 12.5
Rest of Europe 2.8 0.3 2.7 0.2 5.6 10.2 0.1 9.8 1.0 16.0 1.3
North Africa 9.6 0.5 5.1 6.2 0.7 4.5 54.5 1.0 3.0 1.4
Egypt 30.7 49.7 2.3 32.4 0.5 26.0 2.8 5.0 2.1
Sub-Saharan Africa 7.3 0.1 8.6 21.2 0.2 22.0 2.5 31.6 6.0 2.5
Kazakhstan 0.9 1.2 4.6 4.7 1.5 1.0 0.3
Rest of Asia 21.9 15.0 0.2 31.6 0.5 29.7 5.9 54.2 1.6 7.0 3.0
Americas 2.3 3.1 9.9 1.3 17.4 0.1 22.1 0.7
Australia and Oceania 0.8 0.5 0.1 0.4
79.3 0.9 88.0 2.7 115.5 3.2 121.0 11.4 186.3 4.7 38.0 10.6
(a) Number of wells net to Eni. (b) Includes temporary suspended wells pending further evaluation. (c) A dry well is an exploratory, development, or extension well that proves to be incapable of producing either oil or gas sufficient quantities to justify completion as an oil or gas well. (d) Includes 1,445 gross (420.8 net) multiple completion wells (more than one producing into the same well bore). Productive wells are producing wells and wells capable of production. One or more completions in the same bore hole are counted as one well.

E X P L O R A T I O N & P R O D U C T I O N46
Results of operations from oil and gas producing activities(a)
(€ million) Italy
Rest
of E
urop
e
Nort
h Af
rica
Egup
t
Sub-
Saha
ran
Afric
a
Kaza
khst
an
Rest
of A
sia
Amer
ica
Aust
ralia
an
d Oc
eani
a
Tota
l
2018
Consolidated subsidiaries
Revenues:
- sales to consolidated entities 2,120 2,740 1,277 4,701 1,140 1,902 934 4 14,818
- sales to third parties 494 3,741 3,207 830 769 493 50 190 9,774
Total revenues 2,120 3,234 5,018 3,207 5,531 1,909 2,395 984 194 24,592
Operations costs (410) (630) (413) (354) (1,016) (405) (227) (250) (48) (3,753)
- of which production costs (402) (488) (363) (343) (974) (269) (220) (234) (48) (3,341)
- of which transportation costs (8) (142) (50) (11) (42) (136) (7) (16) (412)
Production taxes (171) (243) (435) (191) (6) (1,046)
Exploration expenses (25) (85) (48) (22) (44) (3) (79) (69) (5) (380)
D.D. & A. and Provision for abandonment(b) (281) (664) (582) (795) (2,490) (387) (941) (594) (67) (6,801)
Other income (expenses) (442) (193) (101) (239) (1,126) (67) (135) (54) (2,357)
Pretax income from producing activities 791 1,662 3,631 1,797 420 1,047 822 17 68 10,255
Income taxes (170) (1,070) (2,494) (542) (264) (308) (678) 7 (26) (5,545)Results of operations from E&P activities of consolidated subsidiaries 621 592 1,137 1,255 156 739 144 24 42 4,710
Equity-accounted entities
Revenues:
- sales to consolidated entities
- sales to third parties 15 257 6 420 698
Total revenues 15 257 6 420 698
Operations costs (8) (62) (2) (38) (110)
- of which production costs (7) (34) (2) (36) (79)
- of which transportation costs (1) (28) (2) (31)
Production taxes (3) (26) (114) (143)
Exploration expenses (6) (235) (241)
D.D. & A. and Provision for abandonment (1) 224 (3) (222) (2)
Other income (expenses) (1) 2 (27) (25) (122) (173)
Pretax income from producing activities (7) 5 366 (259) (76) 29
Income taxes (3) (2) (35) (40)Results of operations from E&P activities of equity-accounted entities (7) 2 366 (261) (111) (11)
(a) Results of operations from oil and gas producing activities represent only those revenues and expenses directly associated with such activities, including operating overheads. These amounts do not include any allocation of interest expenses or general corporate overheads and, therefore, are not necessarily indicative of the contributions to consolidated net earnings of Eni. Related income taxes are calculated by applying the local income tax rates to the pre-tax income from production activities. Eni is party to certain Production Sharing Agreements (PSAs), whereby a portion of Eni’s share of oil and gas production is withheld and sold by its joint venture partners which are state owned entities, with proceeds being remitted to the state to meet Eni’s PSA related tax liabilities. Revenue and income taxes include such taxes owed by Eni but paid by state-owned entities out of Eni’s share of oil and gas production.(b) Includes asset net impairment amounting to €726 million.

E X P L O R A T I O N & P R O D U C T I O NE
ni F
ac
t Bo
ok
20
1847
Results of operations from oil and gas producing activities
(€ million) Italy
Rest
of E
urop
e
Nort
h Af
rica
Egup
t
Sub-
Saha
ran
Afric
a
Kaza
khst
an
Rest
of A
sia
Amer
ica
Aust
ralia
an
d Oc
eani
a
Tota
l
2017
Consolidated subsidiaries
Revenues:
- sales to consolidated entities 1,619 1,897 1,056 3,888 681 911 932 3 10,987
- sales to third parties 481 3,184 2,128 547 713 291 96 168 7,608
Total revenues 1,619 2,378 4,240 2,128 4,435 1,394 1,202 1,028 171 18,595
Operations costs (337) (687) (504) (314) (986) (396) (206) (312) (48) (3,790)
- of which production costs (332) (523) (455) (303) (952) (271) (202) (258) (48) (3,344)
- of which transportation costs (5) (164) (49) (11) (34) (125) (4) (54) (446)
Production taxes (130) (200) (331) (11) (5) (677)
Exploration expenses (26) (122) (22) (191) (60) (61) (39) (4) (525)
D.D. & A. and Provision for abandonment(a) (465) (838) (679) (767) (2,063) (289) (765) (577) (59) (6,502)
Other income (expenses) 1,563 (141) (162) 690 (716) (221) (84) (342) 2 589
Pretax income from producing activities 2,224 590 2,673 1,546 279 488 75 (242) 57 7,690
Income taxes (299) (216) (1,978) (214) (38) (223) (67) (38) (23) (3,096)Results of operations from E&P activities of consolidated subsidiaries 1,925 374 695 1,332 241 265 8 (280) 34 4,594
Equity-accounted entities
Revenues:
- sales to consolidated entities
- sales to third parties 14 129 22 517 682
Total revenues 14 129 22 517 682
Operations costs (8) (37) (9) (40) (94)
- of which production costs (6) (19) (9) (39) (73)
- of which transportation costs (2) (18) (1) (21)
Production taxes (2) (8) (146) (156)
Exploration expenses (1) (13) (14)
D.D. & A. and Provision for abandonment (1) (54) (13) (271) (339)
Other income (expenses) (2) (2) 26 3 (199) (174)
Pretax income from producing activities (3) 1 56 (10) (139) (95)
Income taxes (1) (4) (20) (25)Results of operations from E&P activities of equity-accounted entities (3) 56 (14) (159) (120)
(a) Includes asset net reversal amounting to €158 million.

E X P L O R A T I O N & P R O D U C T I O N48
Results of operations from oil and gas producing activities
(€ million) Italy
Rest
of E
urop
e
Nort
h Af
rica
Egup
t
Sub-
Saha
ran
Afric
a
Kaza
khst
an
Rest
of A
sia
Amer
ica
Aust
ralia
an
d Oc
eani
a
Tota
l
2016
Consolidated subsidiaries
Revenues:
- sales to consolidated entities 1,217 1,673 932 9 3,178 252 1,027 833 4 9,125
- sales to third parties 432 2,841 1,471 485 606 114 102 165 6,216
Total revenues 1,217 2,105 3,773 1,480 3,663 858 1,141 935 169 15,341
Operations costs (311) (599) (451) (356) (968) (269) (215) (325) (49) (3,543)
- of which production costs (307) (436) (404) (343) (929) (177) (212) (262) (49) (3,119)
- of which transportation costs (4) (163) (47) (13) (39) (92) (3) (63) (424)
Production taxes (96) (176) (282) (17) (5) (576)
Exploration expenses (35) (40) (45) (42) (142) (39) (28) (3) (374)
D.D. & A. and Provision for abandonment(a) (923) (943) (675) (691) (1,093) (129) (952) (480) (67) (5,953)
Other income (expenses) (342) (232) (201) (265) (917) (57) (130) (120) (8) (2,272)
Pretax income from producing activities (490) 291 2,225 126 261 403 (212) (18) 37 2,623
Income taxes 159 (1) (1,618) (89) 97 (139) 32 (9) (9) (1,577)Results of operations from E&P activities of consolidated subsidiaries (331) 290 607 37 358 264 (180) (27) 28 1,046
Equity-accounted entities
Revenues:
- sales to consolidated entities
- sales to third parties 15 36 493 544
Total revenues 15 36 493 544
Operations costs (9) (10) (54) (73)
- of which production costs (7) (10) (51) (68)
- of which transportation costs (2) (3) (5)
Production taxes (3) (121) (124)
Exploration expenses (13) (13)
D.D. & A. and Provision for abandonment (1) (26) (32) (240) (299)
Other income (expenses) (3) (1) (26) (16) (25) (71)
Pretax income from producing activities (3) 1 (52) (35) 53 (36)
Income taxes (2) (6) (162) (170)Results of operations from E&P activities of equity-accounted entities (3) (1) (52) (41) (109) (206)
(a) Includes asset net reversal amounting to €700 million.

E X P L O R A T I O N & P R O D U C T I O NE
ni F
ac
t Bo
ok
20
1849
Results of operations from oil and gas producing activities
(€ million) Italy
Rest
of E
urop
e
Nort
h Af
rica
Sub-
Saha
ran
Afric
a
Kaza
khst
an
Rest
of A
sia
Amer
ica
Aust
ralia
an
d Oc
eani
a
Tota
l
2015
Consolidated subsidiaries
Revenues:
- sales to consolidated entities 2,124 1,828 1,403 3,514 231 628 1,118 29 10,875
- sales to third parties 501 5,681 914 659 854 131 226 8,966
Total revenues 2,124 2,329 7,084 4,428 890 1,482 1,249 255 19,841
Operations costs (403) (642) (948) (1,099) (239) (235) (453) (108) (4,127)
Production taxes (184) (240) (405) (30) (9) (868)
Exploration expenses (35) (205) (164) (216) (210) (35) (6) (871)
D.D. & A. and Provision for abandonment(a) (750) (2,022) (2,938) (3,835) (109) (1,491) (1,775) (111) (13,031)
Other income (expenses) (215) (142) (564) (290) (156) (282) (9) (23) (1,681)
Pretax income from producing activities 537 (682) 2,230 (1,417) 386 (766) (1,023) (2) (737)
Income taxes (182) 589 (2,148) 272 (142) 90 406 (25) (1,140)Results of operations from E&P activities of consolidated subsidiaries 355 (93) 82 (1,145) 244 (676) (617) (27) (1,877)
Equity-accounted entities
Revenues:
- sales to consolidated entities
- sales to third parties 19 68 248 335
Total revenues 19 68 248 335
Operations costs (9) (13) (49) (71)
Production taxes (3) (82) (85)
Exploration expenses (16) (16)
D.D. & A. and Provision for abandonment (1) (3) (432) (77) (78) (591)
Other income (expenses) (3) (1) (35) (6) (48) (93)
Pretax income from producing activities (4) 3 (467) (44) (9) (521)
Income taxes (3) 8 (29) (24)Results of operations from E&P activities of equity-accounted entities (4) (467) (36) (38) (545)
(a) Includes asset impairments amounting to €5,051 million.

E X P L O R A T I O N & P R O D U C T I O N50
Results of operations from oil and gas producing activities
(€ million) Italy
Rest
of E
urop
e
Nort
h Af
rica
Sub-
Saha
ran
Afric
a
Kaza
khst
an
Rest
of A
sia
Amer
ica
Aust
ralia
and
Oc
eani
a
Tota
l
2014
Consolidated subsidiaries
Revenues:
- sales to consolidated entities 3,028 2,721 2,010 4,716 346 589 1,691 67 15,168
- sales to third parties 596 7,415 1,369 976 774 129 299 11,558
Total revenues 3,028 3,317 9,425 6,085 1,322 1,363 1,820 366 26,726
Operations costs (423) (687) (694) (935) (208) (223) (357) (124) (3,651)
Production taxes (293) (291) (648) (33) (15) (1,280)
Exploration expenses (36) (245) (72) (681) (204) (171) (69) (1,478)
D.D. & A. and Provision for abandonment(a) (819) (1,082) (1,330) (1,985) (90) (860) (1,295) (175) (7,636)
Other income (expenses) (184) (96) (773) (358) (251) (124) (78) (30) (1,894)
Pretax income from producing activities 1,273 1,207 6,265 1,478 773 (81) (81) (47) 10,787
Income taxes (503) (785) (3,992) (1,155) (291) (102) 29 43 (6,756)Results of operations from E&P activities of consolidated subsidiaries 770 422 2,273 323 482 (183) (52) (4) 4,031
Equity-accounted entities
Revenues:
- sales to consolidated entities
- sales to third parties 19 87 232 338
Total revenues 19 87 232 338
Operations costs (11) (11) (27) (49)
Production taxes (3) (94) (97)
Exploration expenses (1) (2) (31) (1) (35)
D.D. & A. and Provision for abandonment (1) (2) (40) (60) (103)
Other income (expenses) (1) 1 (32) (3) (41) (76)
Pretax income from producing activities (3) 2 (32) 2 9 (22)
Income taxes (2) (23) (18) (43)
Results of operations from E&P activities of equity-accounted entities (3) (32) (21) (9) (65)
(a) Includes asset impairment amounting to €851 million.

E X P L O R A T I O N & P R O D U C T I O NE
ni F
ac
t Bo
ok
20
1851
Capitalized cost(a)
(€ million) Italy
Rest
of E
urop
e
Nort
h Af
rica
Egup
t
Sub-
Saha
ran
Afric
a
Kaza
khst
an
Rest
of A
sia
Amer
ica
Aust
ralia
an
d Oc
eani
a
Tota
l
2018
Consolidated subsidiaries
Proved mineral interests 16,569 6,236 14,140 17,474 40,607 11,240 12,711 15,347 1,967 136,291
Unproved mineral interests 18 332 456 56 2,311 3 1,530 861 193 5,760
Support equipment and facilities 369 21 1,516 208 1,281 108 38 52 12 3,605
Incomplete wells and other 653 103 1,554 1,504 2,307 1,382 562 595 127 8,787
Gross Capitalized Costs 17,609 6,692 17,666 19,242 46,506 12,733 14,841 16,855 2,299 154,443Accumulated depreciation, depletion and amortization (13,717) (5,355) (11,741) (11,722) (29,727) (2,175) (10,460) (13,443) (1,265) (99,605)Net Capitalized Costs consolidated subsidiaries(b) 3,892 1,337 5,925 7,520 16,779 10,558 4,381 3,412 1,034 54,838
Equity-accounted entities
Proved mineral interests 9,102 58 1,481 2 1,912 12,555
Unproved mineral interests 1,045 11 1,056
Support equipment and facilities 25 6 7 38
Incomplete wells and other 364 10 10 19 224 627
Gross Capitalized Costs 10,536 74 1,491 32 2,143 14,276Accumulated depreciation, depletion and amortization (4,543) (54) (266) (19) (1,052) (5,934)Net Capitalized Costs equity-accounted entities(b)(c) 5,993 20 1,225 13 1,091 8,342
2017
Consolidated subsidiaries
Proved mineral interests 16,277 17,600 12,514 15,211 36,976 10,547 12,493 14,840 1,950 138,408
Unproved mineral interests 18 356 471 32 2,157 3 1,023 785 185 5,030
Support equipment and facilities 359 39 1,436 191 1,212 101 34 46 14 3,432
Incomplete wells and other 681 345 2,050 1,297 2,679 1,417 421 280 124 9,294
Gross Capitalized Costs 17,335 18,340 16,471 16,731 43,024 12,068 13,971 15,951 2,273 156,164Accumulated depreciation, depletion and amortization (13,504) (12,014) (10,640) (10,413) (25,920) (1,690) (10,386) (12,534) (1,188) (98,289)Net Capitalized Costs consolidated subsidiaries(b) 3,831 6,326 5,831 6,318 17,104 10,378 3,585 3,417 1,085 57,875
Equity-accounted entities
Proved mineral interests 67 1,419 581 1,833 3,900
Unproved mineral interests 4 85 89
Support equipment and facilities 7 6 13
Incomplete wells and other 1 6 4 93 225 329
Gross Capitalized Costs 5 80 1,423 759 2,064 4,331Accumulated depreciation, depletion and amortization (61) (475) (611) (785) (1,932)Net Capitalized Costs equity-accounted entities(b) 5 19 948 148 1,279 2,399
(a) Capitalized costs represent the total expenditures for proved and unproved mineral interests and related support equipment and facilities utilized in oil and gas exploration and production activities, together with related accumulated depreciation, depletion and amortization.(b) The amounts include net capitalized financial charges totalling €831 million in 2018 and €969 million in 2017 for the consolidated subsidiaries and €180 million in 2018 and €78 million in 2017 for equity-accounted entities.(c) Includes Vår Energi AS asset fair value.

E X P L O R A T I O N & P R O D U C T I O N52
Capitalized cost
(€ million) Italy
Rest
of E
urop
e
Nort
h Af
rica
Egup
t
Sub-
Saha
ran
Afric
a
Kaza
khst
an
Rest
of A
sia
Amer
ica
Aust
ralia
an
d Oc
eani
a
Tota
l
2016
Consolidated subsidiaries
Proved mineral interests 15,951 18,678 13,492 15,262 38,539 10,790 11,680 17,127 2,085 143,604
Unproved mineral interests 18 301 416 55 2,461 1 1,155 903 210 5,520
Support equipment and facilities 357 42 1,627 203 1,375 111 37 77 15 3,844
Incomplete wells and other 724 242 2,347 1,828 5,117 2,565 2,248 317 134 15,522
Gross Capitalized Costs 17,050 19,263 17,882 17,348 47,492 13,467 15,120 18,424 2,444 168,490 Accumulated depreciation, depletion and amortization (13,022) (12,113) (11,374) (11,022) (27,264) (1,608) (11,000) (14,301) (1,227) (102,931)Net Capitalized Costs consolidated subsidiaries(a) 4,028 7,150 6,508 6,326 20,228 11,859 4,120 4,123 1,217 65,559
Equity-accounted entities
Proved mineral interests 2 82 14 657 2,037 2,792
Unproved mineral interests 15 96 111
Support equipment and facilities 8 7 15
Incomplete wells and other 9 5 1,596 24 253 1,887
Gross Capitalized Costs 26 95 1,610 777 2,297 4,805 Accumulated depreciation, depletion and amortization (20) (72) (482) (682) (602) (1,858)Net Capitalized Costs equity-accounted entities(a) 6 23 1,128 95 1,695 2,947
2015
Consolidated subsidiaries
Proved mineral interests 15,280 15,110 26,904 35,241 3,364 10,424 16,156 2,037 124,516
Unproved mineral interests 18 297 444 2,443 1 1,229 874 203 5,509
Support equipment and facilities 355 42 1,758 1,318 112 34 74 15 3,708
Incomplete wells and other 1,114 3,501 2,280 4,932 8,900 1,665 729 123 23,244
Gross Capitalized Costs 16,767 18,950 31,386 43,934 12,377 13,352 17,833 2,378 156,977 Accumulated depreciation, depletion and amortization (12,184) (11,431) (20,268) (25,235) (1,422) (9,691) (13,344) (1,122) (94,697)Net Capitalized Costs consolidated subsidiaries(a) 4,583 7,519 11,118 18,699 10,955 3,661 4,489 1,256 62,280
Equity-accounted entities
Proved mineral interests 3 89 23 624 2,010 2,749
Unproved mineral interests 17 93 110
Support equipment and facilities 8 6 14
Incomplete wells and other 10 5 1,508 23 112 1,658
Gross Capitalized Costs 30 102 1,531 740 2,128 4,531 Accumulated depreciation, depletion and amortization (23) (77) (441) (628) (338) (1,507)Net Capitalized Costs equity-accounted entities(a) 7 25 1,090 112 1,790 3,024
(a) The amounts include net capitalized financial charges totalling €1,090 million in 2016 and €1,029 million in 2015 for the consolidates subsidiaries and €95 million in 2016 and €92 million in 2015 for equity-accounted entities.

E X P L O R A T I O N & P R O D U C T I O NE
ni F
ac
t Bo
ok
20
1853
Capitalized cost
(€ million) Italy
Rest
of E
urop
e
Nort
h Af
rica
Sub-
Saha
ran
Afric
a
Kaza
khst
an
Rest
of A
sia
Amer
ica
Aust
ralia
an
d Oc
eani
a
Tota
l
2014
Consolidated subsidiaries
Proved mineral interests 14,862 13,754 21,549 27,697 2,917 8,827 13,050 1,825 104,481
Unproved mineral interests 31 399 493 3,263 43 1,590 1,588 214 7,621
Support equipment and facilities 346 42 1,569 1,164 94 35 66 13 3,329
Incomplete wells and other 816 3,527 1,411 2,988 7,140 690 819 120 17,511
Gross Capitalized Costs 16,055 17,722 25,022 35,112 10,194 11,142 15,523 2,172 132,942 Accumulated depreciation, depletion and amortization (11,154) (9,519) (14,335) (20,039) (1,241) (8,042) (10,605) (1,009) (75,944)Net Capitalized Costs consolidated subsidiaries(a)(b) 4,901 8,203 10,687 15,073 8,953 3,100 4,918 1,163 56,998
Equity-accounted entities
Proved mineral interests 2 77 24 539 549 1,191
Unproved mineral interests 31 84 115
Support equipment and facilities 7 1 4 12
Incomplete wells and other 12 5 1,241 776 2,034
Gross Capitalized Costs 45 89 1,265 624 1,329 3,352 Accumulated depreciation, depletion and amortization (39) (69) (522) (230) (860)Net Capitalized Costs equity-accounted entities(a)(b) 6 20 1,265 102 1,099 2,492
(a) The amounts include net capitalized financial charges totalling €868 million for the consolidates subsidiaries and €46 million for equity-accounted entities.(b) The amounts do not include costs associated with exploration activities which are capitalized in order to reflect their investment nature and amortized in full when incurred. The “SuccessfulEffort Method” application according to Eni accounting policy would have led to an increase in net capitalized costs, mainly in relation to exploration costs, of €4,804 million for theconsolidated subsidiaries and €123 million for equity-accounted entities.

E X P L O R A T I O N & P R O D U C T I O N54
Cost incurred(a)
(€ million) Italy
Rest
of E
urop
e
Nort
h Af
rica
Egup
t
Sub-
Saha
ran
Afric
a
Kaza
khst
an
Rest
of A
sia
Amer
ica
Aust
ralia
an
d Oc
eani
a
Tota
l
2018
Consolidated subsidiaries
Proved property acquisitions 382 382
Unproved property acquisitions 487 487
Exploration 26 106 43 102 66 3 182 215 7 750
Development(b) 382 557 445 2,216 1,379 92 589 340 36 6,036Total costs incurred consolidated subsidiaries 408 663 488 2,318 1,445 95 1,640 555 43 7,655
Equity-accounted entities
Proved property acquisitions
Unproved property acquisitions
Exploration 2 103 105
Development(c) 3 (16) (13)Total costs incurred equity-accounted entities 5 103 (16) 92
2017
Consolidated subsidiaries
Proved property acquisitions 5 5
Unproved property acquisitions
Exploration 31 242 77 110 65 3 76 106 5 715
Development(b) 251 364 785 3,041 1,939 246 714 292 14 7,646Total costs incurred consolidated subsidiaries 282 606 862 3,151 2,009 249 790 398 19 8,366
Equity-accounted entities
Proved property acquisitions
Unproved property acquisitions
Exploration 1 90 91
Development(c) 2 9 4 48 63Total costs incurred equity-accounted entities 1 2 9 94 48 154
2016
Consolidated subsidiaries
Proved property acquisitions
Unproved property acquisitions 2 2
Exploration 27 51 58 306 70 80 26 3 621
Development(b) 387 437 694 1,752 2,019 651 1,232 (5) 1 7,168Total costs incurred consolidated subsidiaries 414 488 752 2,060 2,089 651 1,312 21 4 7,791
Equity-accounted entities
Proved property acquisitions
Unproved property acquisitions
Exploration 1 13 14
Development(c) 1 28 12 95 136Total costs incurred equity-accounted entities 1 1 28 25 95 150
(a) Costs incurred represent amounts both capitalized and expensed in connection with oil and gas producing activities. (b) Includes the abandonment costs of the assets negative for €517 million in 2018, assets for €355 million in 2017, negative for €665 million in 2016.(c) Includes the abandonment costs of the assets negative for €22 million in 2018, negative €23 million in 2017, negative for €15 million in 2016.

E X P L O R A T I O N & P R O D U C T I O NE
ni F
ac
t Bo
ok
20
1855
Cost incurred
(€ million) Italy
Rest
of E
urop
e
Nort
h Af
rica
Sub-
Saha
ran
Afric
a
Kaza
khst
an
Rest
of A
sia
Amer
ica
Aust
ralia
an
d Oc
eani
a
Tota
l
2015
Consolidated subsidiaries
Proved property acquisitions
Unproved property acquisitions
Exploration 28 176 289 196 71 54 6 820
Development(a) 207 1,006 1,574 2,957 819 1,332 745 18 8,658
Total costs incurred consolidated subsidiaries 235 1,182 1,863 3,153 819 1,403 799 24 9,478
Equity-accounted entities
Proved property acquisitions
Unproved property acquisitions
Exploration 1 14 1 16
Development(b) 1 1 112 35 554 703
Total costs incurred equity-accounted entities 2 1 112 49 555 719
2014
Consolidated subsidiaries
Proved property acquisitions
Unproved property acquisitions
Exploration 29 188 227 635 160 139 20 1,398
Development(a) 1,382 2,395 955 3,479 572 1,118 1,169 122 11,192
Total costs incurred consolidated subsidiaries 1,411 2,583 1,182 4,114 572 1,278 1,308 142 12,590
Equity-accounted entities
Proved property acquisitions
Unproved property acquisitions
Exploration 2 33 1 36
Development (b) 1 22 38 375 436
Total costs incurred equity-accounted entities 2 1 22 71 376 472
(a) Includes the abandonment costs of assets for €2,062 million in 2014 and negative for €817 million in 2015.(b) Includes the abandonment costs of the assets negative for €47 million in 2014 and costs for €54 million in 2015.

E X P L O R A T I O N & P R O D U C T I O N56
Standardized measure of discounted future net cash flows(a)
(€ million) Italy
Rest
of E
urop
e
Nort
h Af
rica
Egup
t
Sub-
Saha
ran
Afric
a
Kaza
khst
an
Rest
of A
sia
Amer
ica
Aust
ralia
an
d Oc
eani
a
Tota
l
December 31, 2018
Consolidated subsidiaries
Future cash inflows 18,372 4,895 43,578 39,193 53,534 40,698 33,384 14,192 2,319 250,165
Future production costs (5,659) (1,438) (6,653) (12,193) (16,417) (8,276) (9,492) (6,038) (511) (66,677)
Future development and abandonment costs (4,670) (1,350) (4,700) (2,769) (6,778) (2,640) (5,755) (2,467) (291) (31,420)
Future net inflow before income tax 8,043 2,107 32,225 24,231 30,339 29,782 18,137 5,687 1,517 152,068
Future income tax (1,671) (798) (17,514) (7,829) (11,566) (6,524) (11,980) (1,791) (289) (59,962)
Future net cash flows 6,372 1,309 14,711 16,402 18,773 23,258 6,157 3,896 1,228 92,106
10% discount factor (2,045) (124) (6,727) (6,564) (7,501) (12,477) (2,258) (1,508) (491) (39,695)Standardized measure of discounted future net cash flows 4,327 1,185 7,984 9,838 11,272 10,781 3,899 2,388 737 52,411
Equity-accounted entities
Future cash inflows 18,608 347 2,675 8,292 29,922
Future production costs (4,686) (138) (873) (2,192) (7,889)
Future development and abandonment costs (3,633) (3) (75) (191) (3,902)
Future net inflow before income tax 10,289 206 1,727 5,909 18,131
Future income tax (6,822) (43) (204) (1,839) (8,908)
Future net cash flows 3,467 163 1,523 4,070 9,223
10% discount factor (1,104) (76) (793) (2,009) (3,982)Standardized measure of discounted future net cash flows 2,363 87 730 2,061 5,241
Total 4,327 3,548 8,071 9,838 12,002 10,781 3,899 4,449 737 57,652
(a) Estimated future cash inflows represent the revenues that would be received from production and are determined by applying the year-end average prices during the years ended. Future price changes are considered only to the extent provided by contractual arrangements. Estimated future development and production costs are determined by estimating the expenditures to be incurred in developing and producing the proved reserves at the end of the year. Neither the effects of price and cost escalations nor expected future changes in technology and operating practices have been considered. The standardized measure is calculated as the excess of future cash inflows from proved reserves less future costs of producing and developing the reserves, future income taxes and a yearly 10% discount factor. Future production costs include the estimated expenditures related to the production of proved reserves plus any production taxes without consideration of future inflation. Future development costs include the estimated costs of drilling development wells and installation of production facilities, plus the net costs associated with dismantlement and abandonment of wells and facilities, under the assumption that year-end costs continue without considering future inflation. Future income taxes were calculated in accordance with the tax laws of the Countries in which Eni operates. The standardized measure of discounted future net cash flows, related to the preceding proved oil and gas reserves, is calculated in accordance with the requirements of FASB Extractive Activities — Oil & Gas (Topic 932). The standardized measure does not purport to reflect realizable values or fair market value of Eni’s proved reserves. An estimate of fair value would also take into account, among other things, hydrocarbon resources other than proved reserves, anticipated changes in future prices and costs and a discount factor representative of the risks inherent in the oil and gas exploration and production activity.

E X P L O R A T I O N & P R O D U C T I O NE
ni F
ac
t Bo
ok
20
1857
Standardized measure of discounted future net cash flows
(€ million) Italy
Rest
of E
urop
e
Nort
h Af
rica
Egup
t
Sub-
Saha
ran
Afric
a
Kaza
khst
an
Rest
of A
sia
Amer
ica
Aust
ralia
an
d Oc
eani
a
Tota
l
December 31, 2017
Consolidated subsidiaries
Future cash inflows 14,339 19,507 31,793 29,156 41,136 30,263 11,826 6,205 2,593 186,818
Future production costs (5,091) (5,711) (6,677) (6,153) (14,790) (6,992) (3,653) (2,351) (590) (52,008)
Future development and abandonment costs (3,943) (5,483) (4,350) (4,496) (6,522) (2,787) (3,694) (1,011) (318) (32,604)
Future net inflow before income tax 5,305 8,313 20,766 18,507 19,824 20,484 4,479 2,843 1,685 102,206
Future income tax (859) (4,490) (10,836) (5,709) (6,418) (3,970) (757) (699) (303) (34,041)
Future net cash flows 4,446 3,823 9,930 12,798 13,406 16,514 3,722 2,144 1,382 68,165
10% discount factor (1,633) (1,050) (4,566) (6,698) (5,430) (9,172) (1,239) (777) (607) (31,172)Standardized measure of discounted future net cash flows 2,813 2,773 5,364 6,100 7,976 7,342 2,483 1,367 775 36,993
Equity-accounted entities
Future cash inflows 245 2,062 11 10,797 13,115
Future production costs (119) (930) (6) (3,291) (4,346)
Future development and abandonment costs (1) (66) (535) (602)
Future net inflow before income tax 125 1,066 5 6,971 8,167
Future income tax (21) (57) (1) (2,459) (2,538)
Future net cash flows 104 1,009 4 4,512 5,629
10% discount factor (50) (471) (2,475) (2,996)Standardized measure of discounted future net cash flows 54 538 4 2,037 2,633
Total 2,813 2,773 5,418 6,100 8,514 7,342 2,487 3,404 775 39,626

E X P L O R A T I O N & P R O D U C T I O N58
Standardized measure of discounted future net cash flows
(€ million) Italy
Rest
of E
urop
e
Nort
h Af
rica
Egup
t
Sub-
Saha
ran
Afric
a
Kaza
khst
an
Rest
of A
sia
Amer
ica
Aust
ralia
an
d Oc
eani
a
Tota
l
December 31, 2016
Consolidated subsidiaries
Future cash inflows 9,627 12,898 30,847 33,524 38,271 26,903 12,263 5,789 2,815 172,937
Future production costs (4,136) (5,240) (7,481) (7,927) (13,913) (9,247) (3,498) (2,935) (658) (55,035)
Future development and abandonment costs (3,641) (3,575) (5,904) (6,981) (9,392) (3,268) (5,047) (1,313) (270) (39,391)
Future net inflow before income tax 1,850 4,083 17,462 18,616 14,966 14,388 3,718 1,541 1,887 78,511
Future income tax (237) (1,308) (9,253) (5,941) (4,525) (2,596) (953) (298) (341) (25,452)
Future net cash flows 1,613 2,775 8,209 12,675 10,441 11,792 2,765 1,243 1,546 53,059
10% discount factor (241) (365) (4,060) (8,055) (4,594) (6,536) (1,266) (501) (724) (26,342)Standardized measure of discounted future net cash flows 1,372 2,410 4,149 4,620 5,847 5,256 1,499 742 822 26,717
Equity-accounted entities
Future cash inflows 259 2,429 33 16,430 19,151
Future production costs (143) (974) (20) (4,614) (5,751)
Future development and abandonment costs (1) (64) (1,186) (1,251)
Future net inflow before income tax 115 1,391 13 10,630 12,149
Future income tax (21) (115) (4) (3,667) (3,807)
Future net cash flows 94 1,276 9 6,963 8,342
10% discount factor (46) (734) (4,441) (5,221)Standardized measure of discounted future net cash flows 48 542 9 2,522 3,121
Total 1,372 2,410 4,197 4,620 6,389 5,256 1,508 3,264 822 29,838

E X P L O R A T I O N & P R O D U C T I O NE
ni F
ac
t Bo
ok
20
1859
Standardized measure of discounted future net cash flows
(€ million) Italy
Rest
of E
urop
e
Nort
h Af
rica
Sub-
Saha
ran
Afric
a
Kaza
khst
an
Rest
of A
sia
Amer
ica
Aust
ralia
an
d Oc
eani
a
Tota
l
December 31, 2015
Consolidated subsidiaries
Future cash inflows 16,760 18,692 58,390 44,114 34,589 13,027 8,101 3,519 197,192
Future production costs (4,995) (5,554) (13,481) (14,645) (8,846) (4,585) (3,091) (804) (56,001)
Future development and abandonment costs (4,299) (4,379) (9,457) (9,359) (4,108) (4,964) (1,644) (218) (38,428)
Future net inflow before income tax 7,466 8,759 35,452 20,110 21,635 3,478 3,366 2,497 102,763
Future income tax (1,657) (4,349) (17,195) (8,222) (4,682) (1,230) (933) (604) (38,872)
Future net cash flows 5,809 4,410 18,257 11,888 16,953 2,248 2,433 1,893 63,891
10% discount factor (2,077) (817) (7,844) (4,976) (10,561) (1,276) (970) (901) (29,422)Standardized measure of discounted future net cash flows 3,732 3,593 10,413 6,912 6,392 972 1,463 992 34,469
Equity-accounted entities
Future cash inflows 313 3,047 85 18,519 21,964
Future production costs (177) (1,021) (32) (5,370) (6,600)
Future development and abandonment costs (5) (95) (22) (2,118) (2,240)
Future net inflow before income tax 131 1,931 31 11,031 13,124
Future income tax (8) (251) (10) (4,088) (4,357)
Future net cash flows 123 1,680 21 6,943 8,767
10% discount factor (70) (1,016) (2) (4,358) (5,446)Standardized measure of discounted future net cash flows 53 664 19 2,585 3,321
Total 3,732 3,593 10,466 7,576 6,392 991 4,048 992 37,790

E X P L O R A T I O N & P R O D U C T I O N60
Standardized measure of discounted future net cash flows
(€ million) Italy
Rest
of E
urop
e
Nort
h Af
rica
Sub-
Saha
ran
Afric
a
Kaza
khst
an
Rest
of A
sia
Amer
ica
Aust
ralia
an
d Oc
eani
a
Tota
l
December 31, 2014
Consolidated subsidiaries
Future cash inflows 24,951 29,140 96,372 65,853 55,740 13,664 10,955 4,849 301,524
Future production costs (6,374) (6,856) (19,906) (18,236) (9,878) (4,158) (2,680) (1,092) (69,180)
Future development and abandonment costs (4,698) (5,292) (9,673) (9,139) (4,576) (4,600) (1,892) (356) (40,226)
Future net inflow before income tax 13,879 16,992 66,793 38,478 41,286 4,906 6,383 3,401 192,118
Future income tax (3,583) (10,595) (35,484) (20,514) (10,400) (1,462) (2,401) (989) (85,428)
Future net cash flows 10,296 6,397 31,309 17,964 30,886 3,444 3,982 2,412 106,690
10% discount factor (4,064) (1,464) (13,905) (7,164) (19,699) (1,900) (1,353) (1,106) (50,655)Standardized measure of discounted future net cash flows 6,232 4,933 17,404 10,800 11,187 1,544 2,629 1,306 56,035
Equity-accounted entities
Future cash inflows 485 3,861 200 18,871 23,417
Future production costs (165) (692) (33) (5,724) (6,614)
Future development and abandonment costs (18) (104) (51) (2,032) (2,205)
Future net inflow before income tax 302 3,065 116 11,115 14,598
Future income tax (23) (426) (45) (4,608) (5,102)
Future net cash flows 279 2,639 71 6,507 9,496
10% discount factor (158) (1,442) (11) (4,327) (5,938)Standardized measure of discounted future net cash flows 121 1,197 60 2,180 3,558
Total 6,232 4,933 17,525 11,997 11,187 1,604 4,809 1,306 59,593

E X P L O R A T I O N & P R O D U C T I O NE
ni F
ac
t Bo
ok
20
1861
Changes in standardized measure of discounted future net cash flows
Increase (Decrease):
(€ million) Valu
e at
beg
inni
ng o
f the
yea
r
sal
es, n
et o
f pro
duct
ion
cost
s
net c
hang
es in
sal
es a
nd tr
ansf
er p
rices
, ne
t of p
rodu
ctio
n co
sts
exte
nsio
ns, d
isco
verie
s an
d im
prov
ed
reco
very
, net
of f
utur
e pr
oduc
tion
and
deve
lopm
ent c
osts
chan
ges
in e
stim
ated
futu
re d
evel
opm
ent a
nd
aban
donm
ent c
osts
deve
lopm
ent c
osts
incu
rred
dur
ing
the
perio
d th
at re
duce
d fu
ture
dev
elop
men
t cos
ts
revi
sion
s of
qua
ntity
est
imat
es
accr
etio
n of
dis
coun
t
net
cha
nge
in in
com
e ta
xes
purc
hase
of r
eser
ves
in-p
lace
sale
of r
eser
ves
in-p
lace
chan
ges
in p
rodu
ctio
n ra
tes
(tim
ing)
and
oth
er
Net i
ncre
ase
(dec
reas
e)
Valu
e at
end
of t
he y
ear
2018
Consolidated subsidiaries 36,993 (19,793) 27,970 1,649 (2,525) 6,468 10,487 5,670 (16,566) 5,369 (8,363) 5,052 15,418 52,411Equity-accounted entities 2,633 (445) 671 216 14 (803) 384 193 6,700 (4,322) 2,608 5,241
Total 39,626 (20,238) 28,641 1,649 (2,309) 6,482 9,684 6,054 (16,373) 12,069 (8,363) 730 18,026 57,652
2017
Consolidated subsidiaries 26,717 (14,125) 23,940 1,697 (2,817) 7,203 5,269 3,864 (6,498) 10 (2,995) (5,272) 10,276 36,993Equity-accounted entities 3,121 (432) 1,482 495 45 (2,285) 438 238 (469) (488) 2,633
Total 29,838 (14,557) 25,422 1,697 (2,322) 7,248 2,984 4,302 (6,260) 10 (2,995) (5,741) 9,788 39,626
2016
Consolidated subsidiaries 34,469 (11,222) (24,727) 4,563 (2,357) 7,578 2,840 5,705 9,200 668 (7,752) 26,717Equity-accounted entities 3,321 (347) (1,586) 650 151 (131) 514 386 163 (200) 3,121
Total 37,790 (11,569) (26,313) 4,563 (1,707) 7,729 2,709 6,219 9,586 831 (7,952) 29,838
2015
Consolidated subsidiaries 56,035 (14,846) (70,909) 524 (1,711) 8,960 12,322 11,288 29,530 (114) 3,390 (21,566) 34,469Equity-accounted entities 3,558 (179) (2,858) (241) 604 915 629 530 363 (237) 3,321
Total 59,593 (15,025) (73,767) 524 (1,952) 9,564 13,237 11,917 30,060 (114) 3,753 (21,803) 37,790
2014
Consolidated subsidiaries 56,177 (21,795) (12,053) 1,667 (6,047) 8,745 8,085 11,064 7,049 67 (271) 3,347 (142) 56,035Equity-accounted entities 2,327 (192) (500) 223 451 (325) 512 704 358 1,231 3,558
Total 58,504 (21,987) (12,553) 1,667 (5,824) 9,196 7,760 11,576 7,753 67 (271) 3,705 1,089 59,593

E X P L O R A T I O N & P R O D U C T I O N62
Capital expenditure
(€ million) 2018 2017 2016 2015 2014
Acquisition of proved and unproved properties 869 5 2
Egypt 2
Sub-Saharan Africa 5
Rest of Asia 869
Exploration 463 442 417 566 1,030
Italy 1 5 1
Rest of Europe 52 186 11 133 132
North Africa 20 55 42 64 108
Egypt 80 70 270 168 69
Sub-Saharan Africa 22 25 30 157 511
Kazakhstan 3
Rest of Asia 140 20 57 15 89
America 146 76 7 29 109
Australia and Oceania 2 2 11
Development 6,506 7,236 7,770 9,341 9,021
Italy 380 260 407 679 880
Rest of Europe 600 399 590 1,264 1,574
North Africa 525 626 747 641 305
Egypt 2,205 3,030 1,700 929 527
Sub-Saharan Africa 1,635 1,852 2,176 2,998 3,085
Kazakhstan 193 197 707 835 521
Rest of Asia 550 666 1,213 1,333 1,105
America 381 195 220 637 921
Australia and Oceania 37 11 10 25 103
Other expenditure 63 56 65 73 105
7,901 7,739 8,254 9,980 10,156

G A S & P O W E RE
ni F
ac
t Bo
ok
20
1863
GAS& POWER
KEY PERFORMANCE INDICATORS
2018 2017 2016 2015 2014TRIR (Total Recordable Injury Rate) (total recordable injuries/worked hours) x 1,000,000 0.56 0.37 0.29 0.89 0.82
of which: employees 0.34 0.45 0.28 0.91 0.87
contractors 0.99 0.23 0.31 0.81 0.70
Net sales from operations(a) (€ million) 55,690 50,623 40,961 52,096 73,434
Operating profit (loss) 629 75 (391) (1,258) 64
Adjusted operating profit (loss) 543 214 (390) (126) 168
Adjusted net profit (loss) 310 52 (330) (168) 86
Capital expenditure 215 142 120 154 172
Worldwide gas sales (bcm) 76.71 80.83 86.31 87.72 86.11
LNG sales(b) 10.3 8.3 8.1 9.0 8.9
Retail customers in Italy (million) 7.7 7.7 7.7 7.8 7.9
Electricity sold (TWh) 37.07 35.33 37.05 34.88 33.58
Employees at year end (number) 3,040 4,313 4,261 4,484 4,561
of which: outside Italy 951 2,031 2,229 2,461 2,494Direct GHG emissions (mmtonnes CO2eq) 11.08 11.30 11.17 10.57 10.12
(a) Before elimination of intragroup sales.(b) Refers to LNG sales of the Gas & Power segment (included in worldwide gas sales).
PERFORMANCE OF THE YEAR
●In 2018, the total recordable injury rate (TRIR) amounted to 0.56, increasing by 51.4% compared to 2017, as result of the higher number of accidents (+2 events) registered among the contractors, partly offset by the better performance in the employees.
●The greenhouse gas emissions (GHG) reported an improved performance, approximately 2%, due to lower power generation (down by 3.6% vs. 2017).
●GHG emissions/kWheq relating to electricity production slightly increased by 1.8% compared to the previous year due to the higher consumption of refinery gas in place of natural gas at the Ferrera Erbognone site.
●In 2018, the Gas & Power segment reported an adjusted operating profit of €543 million, more than doubled compared to 2017 following the restructuring of all business lines, in particular the growth in LNG sales, power optimizations and reduction of gas logistic costs, supported by a scenario which allowed to enhance the flexibility of the portfolio assets.
●Eni worldwide gas sales amounted to 76.71 bcm, down by 4.12 bcm or 5.1% compared to 2017. Eni’s sales in Italy (39.03 bcm) increased by 4% compared to 2017.
●Electricity sales recorded an increase of 5% (up by 1.74 TWh) compared to 2017, due to higher volumes sold to the Italian power exchange.
●Capital expenditure amounting to €215 million mainly related the gas marketing activities and the power business.

64 G A S & P O W E R
WORLDWIDE GAS SALES
(bcm)
GAS SALES IN ITALY
9.2 million retail customers in Italy and in the rest of Europe.
Italian gas exchange and spot marketsSmall and medium-sized enterprises and services
Power generationIndustries
ResidentialOwn consumption
Wholesales
9.15
4.79
12.49
0.79
1.50
4.20
6.11
20
1638
.43
20
1737
.43
47.8
8
43.4
0
86.3180.83
20
1839
.03
37.6
8
76.71
Sales in ItalyInternational sales
39.03 bmc
MARKETING
1. Natural gas
Supply The supply of natural gas is a free activity where prices are determined by free negotiations of demand and supply involving natural gas resellers and producers. In order to secure mid and
long-term access to gas availability, Eni has signed a number of long-term gas supply contracts with key producing Countries that supply the European gas markets. In recent years Eni
AGREEMENTS FOR THE PURCHASE OF LNG VOLUMES
In order to strengthen the integration with upstream business Eni, obtained from the partners of Area 4 joint venture, long-term agreements for the purchase of LNG volumes. For more details see the “Mozambique” section in the Exploration & Production segment.
ENERGY EFFICIENCY SERVICES
In January 2019, Eni through the subsidiary Eni gas e luce SpA, completed the acquisition of the controlling interest of SEA SpA, an energy service company operating in the field of services and solutions for energy efficiency. This transaction confirmed the strategy aiming to strengthen Eni’s presence in the energy efficiency services market, through the growth of commercial offer with integrated and innovative solutions, mainly focused on the industrial segment and apartment buildings.
PORTFOLIO OPTIMIZATION IN EUROPE
Completed the sale of gas distribution activities in Hungary with a distribution network of about 33,700 kilometers and 1.2 million of delivery points. In July 2018, in line with the planned portfolio rationalization, Eni acquired the further 51% interest, reaching to 100% of the company “Gas Supply Company Thessaloniki-Thessalia SA”, gas and electricity supplier in the retail market in Greece, with approximately 300,000 customers. In March 2018, the subsidiary Adriaplin finalized the acquisition of 100% of the company Mestni Plinovodi, which managed gas distribution and commercialization in 11 municipalities located in the central-north and north-eastern part of Slovenia. In May, Mestni Plinovodi was incorporated into Adriaplin to make fully operational the synergies between the two companies.

G A S & P O W E RE
ni F
ac
t Bo
ok
20
1865
Long-term contracts Equity gas
ENI’S NATURAL GAS SUPPLY
Russia
Norway
USA
Indonesia
the UKthe Netherlands
Croatia
Italy
EgyptLibya
Nigeria
Oman
Algeria
Qatar
renegotiated a number of the main long-term supply Contracts, thus better aligning gas prices and related trends to market conditions. Eni could also leverage on the availability of natural gas deriving from equity production, the access to all phases of the LNG chain (liquefaction, shipping and regasification) and to other gas infrastructures, and by trading and risk management activity. Eni’s long-term gas requirements are met by natural gas from a total of 18 Countries, where Eni signed long-term gas supply contracts or holds upstream activities and by access to continental Europe’s spot markets.
In 2018, Eni’s consolidated subsidiaries supplied 74.15 bcm of natural gas, down by 4.13 bcm or by 5.3% from the full year 2017. Gas volumes supplied outside Italy from consolidated subsidiaries (68.82 bcm), imported in Italy or sold outside Italy, represented approximately 93% of total supplies, decreased by 4.41 bcm or by 6% from the full year 2017. This mainly reflected lower volumes purchased in Russia (down by 1.85 bcm), in the Netherlands (down by 1.25 bcm), in Algeria (down by 1.16 bcm) and in Norway (down by 0.73 bcm), partly offset by higher purchases in Indonesia (up by 2.32 bcm) driven by higher availabilty of gas volumes from upstream productions and in Qatar (up by 0.20
Trading andshipping
Purchase of LNG
Purchase of power 15.45 TWh
Internationalmarkets
Transmissionnetwork
Power generation21.62 TWh
Power sales37.07 TWh
Italy(*) 39.03 bcm
Europe 29.42 bcm
Outside Europe 8.26 bcm
Equityproduction
Gasliquefaction
(*) Includes own consumption.
Eni’s Gas & Power segment engages in all phases of the natural gas value chain: supply, trading and marketing of natural gas and and LNG. This segment also includes power generation and marketing of electricity. Eni’s leading position in the European gas market is ensured by a set of competitive advantages, including our multi-Country approach, long-term gas availability, access to infrastructures, market knowledge and a strong customer base, in addition to long-term relations with producing Countries. Furthermore, integration with our upstream operations provides valuable growth options whereby the Company targets to monetize its large gas reserves.
LNGRe-gasification
Gas sales76.71 bcm
GAS & POWER VALUE CHAIN
Shipping
bcm). Supplies in Italy (5.33 bcm) increased by 5.5% from the full year 2017 due to higher supplied gas volumes from equity production.

G A S & P O W E R66
Purchase in Italy5.33
Equity productionoutside Italy 3.01
Purchase outside Italy68.47
Offtake from storageand network losses (0.10)
ENI’S AVAILABILITY OF NATURAL GAS(bcm)
Availability 76.71
Own consumption6.11
Other Eni segment1.35
G&P powergeneration 4.76
Sales in the restof Europe 29.42
Importers in Italy3.42
Target markets26.00
Sales outside Europe8.26
Sales in Italy(to third parties) 32.92
Wholesalers9.15
Italian gas exchangeand spot markets 12.49
Power generation1.50
Residential4.20
Industries, small and medium-sizedenterprises and services 5.58
Sales and market shares on the Italian gas market
(bcm) 2018 2017
Volumes sold
Marketshare (%)
Volumessold
Marketshare (%)
% Ch. 2018vs. 2017
Italy to third parties 32.92 45.3 31.25 41.6 5.3
Wholesalers 9.15 8.36 9.4
Italian gas exchange and spot markets 12.49 10.81 15.5
Industries 4.79 4.42 8.4
Medium-sized enterprises and services 0.79 0.93 (15.1)
Power generation 1.50 2.22 (32.4)
Residential 4.20 4.51 (6.9)
Own consumption 6.11 6.18 (1.1)
TOTAL SALES IN ITALY 39.03 53.7 37.43 49.8 4.3
Gas demand(a) 72.70 75.15 (3.3)
(a) Source: Italian Ministry of Economic Development.
Marketing in Italy and EuropeEni operates in a liberalized market where energy customers are allowed to choose the gas supplier and, according to their specific needs, to evaluate the quality of services and offers. Overall Eni supplies 9.2 million retail customers in Italy and Europe. In particular, clients located all over Italy are 7.7 million.In a trading environment characterized by a still decreasing
demand in 2018 (down by 3% in the Italian market and down by 2% in the European Union compared to the previous year) and characterized by a raised competitive pressure, Eni carried out a number of initiatives – such as renegotiation of supply contracts, efficiency and optimization actions – in order to consolidate the business profitability in a weak demand scenario.

G A S & P O W E RE
ni F
ac
t Bo
ok
20
1867
Gas sales by market
(bcm) 2018 2017 2016 2015 2014
ITALY 39.03 37.43 38.43 38.44 34.04
Wholesalers 9.15 8.36 7.93 4.19 4.05
Italian gas exchange and spot markets 12.49 10.81 12.98 16.35 11.96
Industries 4.79 4.42 4.54 4.66 4.93
Medium-sized enterprises and services 0.79 0.93 1.72 1.58 1.60
Power generation 1.50 2.22 0.77 0.88 1.42
Residential 4.20 4.51 4.39 4.90 4.46
Own consumption 6.11 6.18 6.10 5.88 5.62
INTERNATIONAL SALES 37.68 43.40 47.88 49.28 52.07
Rest of Europe 29.42 38.23 42.43 42.89 46.22
Importers in Italy 3.42 3.89 4.37 4.61 4.01
European markets 26.00 34.34 38.06 38.28 42.21
Iberian Peninsula 4.65 5.06 5.28 5.40 5.31
Germany/Austria 1.83 6.95 7.81 5.82 7.44
Benelux 5.29 5.06 7.03 7.94 10.36
Hungary 0.93 1.58 1.55
UK 2.22 2.21 2.01 1.96 2.94
Turkey 6.53 8.03 6.55 7.76 7.12
France 4.95 6.38 7.42 7.11 7.05
Other 0.53 0.65 1.03 0.71 0.44
Extra European markets 8.26 5.17 5.45 6.39 5.85
WORLDWIDE GAS SALES 76.71 80.83 86.31 87.72 86.11
A review of Eni’s presence in key European markets is presented below:
The percentage represents Eni’s interest in each subsidiary as of December 31, 2018.
Eni Trading & Shipping SpA
(50%)
Eni Gas & Power France SA (99.87%)
Eni Branch France
Eni Branch Belgium
ENI'S PRESENCE IN EUROPE
Eni Branch Germany
Adriaplin (51%)
Eni Trading BV(Blue Stream)
EPA Thess SA (100%)
EDA Thess SA (49%)
Benelux Eni operates in Benelux in the industrial, wholesalers and thermoelectric segments. In 2018, sales amounted to 5.29 bcm, up by 0.23 bcm, or 4.5% compared to 2017, thanks to the optimization initiatives.
France Eni is present in all the market segments through its direct commercial activities and its subsidiary Eni Gas & Power France SA. In 2018, sales in the Country amounted to 4.95 bcm, a decrease of 1.43 bcm, or 22.4%, from a year ago.

G A S & P O W E R68
FerreraErbognone1,030 MW
Bolgiano 64 MW
Mantova 836 MW
Ferrara 429 MW
Ravenna 972 MW
Brindisi 1,321 MW
Installed and operational generation capacity as of December 31, 2018: 4,652 MW.
The combined cycle gas fired technology (CCGT) ensures an high level of efficiency and low environmental impact. In particular, management estimates that for a given amount of energy (electricity and steam) produced, using the CCGT technology instead of conventional power generation technology, the emission of carbon dioxide is reduced by about 5 mmtonnes, on an energy production of 24.1 TWh.
Combined cycle-CCGT
District heating station
ENIPOWER PLANTS AND SITES IN ITALY
Germany/Austria Eni operates in Germany-Austria through Gas & Power branches. In 2018, total sales in Germany-Austria amounted to 1.83 bcm, a decrease of 5.12 bcm, or 73.7% from 2017 due to lower volumes marketed to local distribution companies. A process of complete exit from these markets is ongoing.
SpainEni operates in the Spanish gas market through Unión Fenosa Gas (UFG) joint venture (Eni’s interest 50%) which mainly supplies natural gas to industrial clients, wholesalers and power generation utilities. In 2018, UFG gas sales amounted to 3.50 bcm (1.75 bcm Eni’s share). UFG holds an 80% interest in the Damietta liquefaction plant, on the Egyptian coast, and a 7.36% interest in a liquefaction plant in Oman. In 2018, total sales in the Iberian Peninsula amounted to 4.65 bcm, a decrease of 0.41 bcm, or down by 8.1%.
Turkey Eni sells gas supplied from Russia and transported via the Blue Stream pipeline. In 2018, sales amounted to 6.53 bcm, a decrease of 1.50 bcm, or 18.7% from a year ago due to lower sales to Botas.
United Kingdom Eni through its subsidiary ETS markets in the United Kingdom the equity gas produced at Eni’s fields in the North Sea and operates in the main continental natural gas hubs (NBP, Zeebrugge, TTF). In 2018, sales amounted to 2.22 bcm, substantially in line compared to 2017.
GreeceEni operates in the Country through the supply and marketing activities of natural gas and electricity and the natural gas distribution.These businesses are carried on, respectively, by EPA Thess SA, Eni’s interest 100%, after the acquisition in 2018 of a further 51% and by the joint operation EDA Thess SA (Eni’s interest 49%).In 2018, natural gas sales amounted to 0.23 bcm (0.17 bcm in 2017) and were supplied approximately 300 thousand gas and power customers.
2. LNGEni is present in all phases of the LNG business: liquefaction, gas feeding, shipping, regasification and sale through a direct presence and interests in joint ventures and associates. The LNG business registered a good profitability, leveraging on the growing energy demand in Asia. In the next years Eni intends to increase sales in premium markets, redirecting the availability through portfolio optimization and a higher integration with the upstream segment. LNG sales amounted to 10.3 bcm (included in worldwide gas sales), an increase of 24.1% compared to 2017 and mainly concerned LNG
from Indonesia, Qatar, Nigeria, Oman and Algeria and marketed in Europe, China, Japan, Pakistan and Taiwan.
3. Power generationEni’s power generation sites are located in Ferrera Erbognone, Ravenna, Mantova, Brindisi, Ferrara and Bolgiano. As of December 31, 2018, installed operational capacity of EniPower’s power plants was 4.7 GW. In 2018, thermoelectric power generation was 21.62 TWh, down by 0.8 TWh or by 3.6% from 2017. Electricity trading (15.45 TWh) reported an increase of 19.7% thanks to the optimization of inflows and outflows of power.
In 2018, power sales of 37.07 TWh increased by 4.9% from the full year 2017 and were directed to the free market (70%), the Italian power exchange (19%), industrial sites (10%) and other (1%). Compared to 2017, power sales marketed in the free market decreased by 0.62 TWh or by 2.3%, due to lower volumes sold to large customers (down by 2.38 TWh), middle market (down by 1.45 TWh) and small and medium-sized enterprises (down by 0.20 TWh) partly offset by higher volumes sold to wholesalers segment (up by 3.39 TWh).

G A S & P O W E RE
ni F
ac
t Bo
ok
20
1869
TANAP
North Sea System
North Stream
Interconnector
Milford Haven
Isle of Grain
Rotterdam
Zeebrugge
Porto Levante
Independence
Swinoujscie
Fos Cavaou
OLT Toscana
Delimara
Idku
Revithousa
Marmara Ereglisi
Allaga
Damietta Oman Qatar
Panigaglia
Cartagena
Sagunto
Barcellona
Dunkerque
Montoir-de-Bretagne
Bilbao
Murgados
Gijón
Sines
Huelva
Nigeria
Magreb-Europe Gas(MEG)
GreenStream
LNG Pipelines
Re-gasification plants
(*) Source: GIE (Gas Infrastructure Europe) - www.gie.eu.
Liquefaction plants Planned or underway Existing Gas hubs
Transitgas
TenpTag
TMPC
SCP
Blue Stream
TTPC
TAP
IAP
GEM
Medgaz
MAIN GAS TRANSPORT INFRASTRUCTURE IN EUROPE(*)
INTERNATIONAL TRANSPORT
Eni, as shipper, has transport rights on a large European and North African networks for transporting natural gas in Italy and Europe, which link key consumption basins with the main producing areas (Russia, Algeria, the North Sea, including the Netherlands, Norway and Libya). The Company participates to both entities which operate the pipelines and entities which manage transport rights. A description of the main international pipelines currently participated or operated by Eni is provided below:- the TTPC pipeline, 740-kilometer long, is made up of two lines
that are each 370-kilometer long with a transport capacity of 34.3 bcm/y and five compression stations. This pipeline transports natural gas from Algeria across Tunisia from Oued Saf Saf at the Algerian border to Cap Bon on the Sicily Channel where it links with the TMPC pipeline;
- the TMPC pipeline for the import of Algerian gas is 775-kilometer long and consists of five lines that are each 155-kilometer long
with a transport capacity of 33.5 bcm/y. It crosses the Sicily Channel from Cap Bon to Mazara del Vallo in Sicily, the point of entry into the Italian natural gas transport system;
- the GreenStream pipeline for the import of Libyan gas produced at the Eni operated fields of Bahr Essalam and Wafa. It is 520-kilometer long with a transport capacity of 8 bcm/y crossing the Mediterranean Sea from Mellitah on the Libyan coast to Gela in Sicily, the point of entry into the Italian natural gas transport system;
- Eni holds a 50% interest in the Blue Stream underwater pipeline (with a record water depth of more than 2,150 meters) linking the Russian coast to the Turkish coast of the Black Sea. This pipeline is 774-kilometer long on two lines and has transport capacity of 16 bcm/y. It is part of a joint venture to sell gas produced in Russia on the Turkish market. These assets generate a steady operating profit thanks to the sale of transport rights on a long-term basis.

G A S & P O W E R70
Supply of natural gas
(bcm) 2018 2017 2016 2015 2014
Italy 5.33 5.05 6.00 6.73 6.92Russia 26.24 28.09 27.99 30.33 26.68Algeria (including LNG) 12.02 13.18 12.90 6.05 7.51Libya 4.55 4.76 4.87 7.25 6.66Netherlands 3.95 5.20 9.60 11.73 13.46Norway 6.75 7.48 8.18 8.40 8.43United Kingdom 2.21 2.36 2.08 2.35 2.64Indonesia (LNG) 3.06 0.74Qatar (LNG) 2.56 2.36 3.28 3.11 2.98Other supplies of natural gas 5.52 6.75 5.83 7.42 5.94Other supplies of LNG 1.96 2.31 1.91 2.02 1.69
Outside Italy 68.82 73.23 76.64 78.66 75.99Total supplies of Eni’s consolidated subsidiaries 74.15 78.28 82.64 85.39 82.91Offtake from (input to) storage 0.08 0.31 1.40 (0.20)Network losses, measurement differences and other changes (0.18) (0.45) (0.21) (0.34) (0.25)Available for sale at Eni’s consolidated subsidiaries 74.05 78.14 83.83 85.05 82.46Available for sale at Eni’s affiliates 2.66 2.69 2.48 2.67 3.65NATURAL GAS VOLUMES AVAILABLE FOR SALE 76.71 80.83 86.31 87.72 86.11
Gas sales by entity
(bcm) 2018 2017 2016 2015 2014
Sales of consolidated companies 73.70 77.52 83.34 84.94 81.73Italy (including own consumption) 39.03 37.43 38.43 38.44 34.04Rest of Europe 27.58 36.10 40.52 41.14 43.07Outside Europe 7.09 3.99 4.39 5.36 4.62Sales of Eni’s affiliates (net to Eni) 3.01 3.31 2.97 2.78 4.38Rest of Europe 1.84 2.13 1.91 1.75 3.15Outside Europe 1.17 1.18 1.06 1.03 1.23WORLDWIDE GAS SALES 76.71 80.83 86.31 87.72 86.11
LNG sales
(bcm) 2018 2017 2016 2015 2014
G&P sales 10.3 8.3 8.1 9.0 8.9Rest of Europe 4.7 5.2 5.2 4.8 5.0Extra European markets 5.6 3.1 2.9 4.2 3.9
Power sales
(TWh) 2018 2017 2016 2015 2014
Free market 25.91 26.53 27.49 25.90 24.86Italian Exchange for electricity 7.17 5.21 5.64 5.09 4.71Industrial plants 3.49 3.01 3.11 3.23 3.17Other(a) 0.50 0.58 0.81 0.66 0.84Power sales 37.07 35.33 37.05 34.88 33.58Power generation 21.62 22.42 21.78 20.69 19.55Power traded(a) 15.45 12.91 15.27 14.19 14.03
(a) Include positive and negative network imbalances (difference between electricity placed on the market vs. planned quantities).

G A S & P O W E RE
ni F
ac
t Bo
ok
20
1871
Power stations
Installed capacity(a) as of December 31, 2018
(MW)Effective/planned
start-up Technology Fuel
Brindisi 1,321 2006 CCGT Gas
Ferrera Erbognone 1,030 2004 CCGT Gas/syngas
Mantova 836 2005 CCGT Gas
Ravenna 972 2004 CCGT Gas
Ferrara(b) 429 2008 CCGT Gas
Bolgiano 64 2012 Power Station Gas
Photovoltaic sites(c) 2 2011-2014 Photovoltaic Photovoltaic
4,654
(a) Installed operational capacity.(b) Eni’s share of capacity.(c) Plants managed by Energy Solutions Department.
Power generation
2018 2017 2016 2015 2014
Purchases
Purchases of natural gas (mmcm) 4,300 4,359 4,334 4,270 4,074
Purchases of other fuels (ktep) 356 392 360 313 338
Production
Power generation (TWh) 21.62 22.42 21.78 20.69 19.55
Steam (ktonnes) 7,919 7,551 7,974 9,318 9,010
Installed generation capacity (GW) 4.7 4.7 4.7 4.9 4.9
Transport infrastructure
INFRASTRUCTURESLines
(units)Lenght
(km)Diameter
(inch)
Transport capacity(a)
(bcm/y)
Transit capacity(b)
(bcm/y)
Compression stations
(No.)
TTPC (Oued Saf Saf-Cap Bon) 2 lines of 370 km 740 48 34.3 33.2 5
TMPC (Cap Bon-Mazara del Vallo) 5 lines of 155 km 775 20/26 33.5 33.5
GreenStream (Mellitah-Gela) 1 line of 520 km 520 32 8.0 8.0 1
Blue Stream (Beregovaya-Samsun) 2 lines of 387 km 774 24 16.0 16.0 1
(a) Includes both transit capacity and volumes of natural gas destined to local markets and withdrawn at various points along the pipeline.(b) The maximum volume of natural gas which is input at various entry points along the pipeline and transported to the next pipeline.
Capital expenditure
(€ million) 2018 2017 2016 2015 2014
Italy 139 99 73 100 128
Outside Italy 76 43 47 54 44
215 142 120 154 172
Market 207 138 110 138 164
Market 161 102 69 69 66
Italy 93 63 32 31 30
Outside Italy 68 39 37 38 36
Power generation 46 36 41 69 98
International transport 8 4 10 16 8
215 142 120 154 172

R E F I N I N G & M A R K E T I N G A N D C H E M I C A L S72
PERFORMANCE OF THE YEAR
●In 2018, the total recordable injury rate (TRIR) confirms Eni’s commitment in the field of health and security with a decrease by 9.7% compared to 2017, with both employees and contractors contribution (down by 12.5% and 10.1%, respectively).
● Greenhouse gas emissions (GHG) reported an increase of 4.7% in absolute terms following higher volumes processed.
● Energy efficiency projects contributed to a 2.1% decrease in GHG emissions related to refining throughputs.
● In 2018, the Refining & Marketing and Chemicals segment reported an adjusted operating profit of €380 million, down by €611 million, or 62% from 2017.
The Refining & Marketing business reported an adjusted operating profit of €390 million (down by 27%), consistent with an unfavorable refining trading environment (SERM down by 26%). This result was also affected by increased standstills, partly offset by the improved performance in marketing activities driven by the effective commercial initiatives.
REFINING & MARKETINGAND CHEMICALS
KEY PERFORMANCE INDICATORS
2018 2017 2016 2015 2014TRIR (Total Recordable Injury Rate) (total recordable injuries/worked hours) x 1,000,000 0.56 0.62 0.38 1.07 1.51
of which: employees 0.49 0.56 0.44 0.97 1.60
contractors 0.62 0.69 0.32 1.17 1.40
Net sales from operations(a) (€ million) 25,216 22,107 18,733 22,639 28,994
Operating profit (loss) (380) 981 723 (1,567) (2,811)
Adjusted operating profit (loss) 380 991 583 695 (412)
- Refining & Marketing 390 531 278 387 (65)
- Chemicals (10) 460 305 308 (347)
Adjusted net profit (loss) 238 663 419 512 (319)
- Refining & Marketing 279 355 157 282 (41)
- Chemicals (41) 308 262 230 (278)
Capital expenditure 877 729 664 628 819
Refinery throughputs on own account in Italy and outside Italy (mmtonnes) 23.23 24.02 24.52 26.41 25.03
Conversion index (%) 54 54 50 49 51
Balanced capacity of refineries (kbbl/d) 548 548 548 548 617
Average refineries utilization rate (%) 91 90 90 95 82
Green refinery throughputs (ktonnes) 253 242 212 204 127
Retail sales of petroleum products in Europe (mmtonnes) 8.39 8.54 8.59 8.89 9.21
Service stations in Europe at year end (number) 5,448 5,544 5,622 5,846 6,220
Average throughput per service station in Europe (kliters) 1,776 1,783 1,742 1,754 1,725
Retail efficiency index (%) 1.20 1.20 1.10 1.14 1.19
Production of petrochemical products (ktonnes) 9,483 8,955 8,809 8,670 7,926
Sale of petrochemical products 4,938 4,646 4,745 4,813 4,681
Average plant utilization rate (%) 76 73 72 73 71
Employees at year end (number) 11,136 10,916 10,858 10,995 11,884
- of which: outside Italy 2,396 2,336 2,281 2,360 2,598
Direct GHG emissions (mmtonnes CO2eq) 8.19 7.82 8.50 8.19 8.45
SOx emissions (sulphur oxide) (ktonnes SO2eq) 4.80 5.18 4.35 6.17 6.84
GHG emissions/refining throughputs(b) (tonnes CO2eq/ktonnes) 253 258 278 253 301
(a) Before elimination of intragroup sales.(b) Relates only to traditional refineries.

R E F I N I N G & M A R K E T I N G A N D C H E M I C A L SE
ni F
ac
t Bo
ok
20
1873
The Chemical business was negatively affected by rising costs of oil-based feedstock in the first ten months of the year and by a sharp decrease in polyethylene prices during the fourth quarter, thus reporting an adjusted operating loss of €10 million from the adjusted operating profit of €460 million reported in 2017.
● Breakeven refining margin at the budget scenario of exchange rates and oil spreads was 3 $/barrel, in line with the guidance.
● In 2018, Eni’s refining throughputs amounted to 23.23 mmtonnes, lower y-o-y (down by 3.3%) due to lower throughputs at the Taranto plant, reflecting higher crude oil volumes processed on behalf of third parties, at the Milazzo refinery due to maintenance standstills and at the Bayernoil refinery following an event occurred in September.
These negatives were partially offset by higher volumes processed at the Sannazzaro and Livorno refineries, with the latter affected in 2017 by a shutdown due to a force majeure event.
● Production of biofuels from vegetable oil at the Venice green refinery amounted to 0.25 mmtonnes, up by 4.2% compared 2017.
● Retail sales in Italy were 5.91 mmtonnes, slightly decreased by 1.7% from 2017.
● Retail sales in the rest of Europe (2.48 mmtonnes) were down by 2% compared to the previous year, mainly due to lower volumes traded in Germany, due to the event occurred at Bayernoil refinery and in France.
● Sales of petrochemical products in Europe amounted to 4.94 mmtonnes, recording an increase of 6.3% y-o-y, due to higher intermediates sale volumes.
● Capital expenditure of €877 million mainly related to refining activities.
ACQUISITION OF NEW REFINING CAPACITY IN THE MIDDLE EAST
In January 2019, Eni signed a Share Purchase Agreement with Abu Dhabi National Oil Company (ADNOC) for the acquisition of a 20% interest in the ADNOC Refining company, one of the top worldwide in terms of refining capacity (with an overall capacity of more than 900 kbbl/d). Additionally, the agreement includes the creation of a joint venture engaged in oil products trading activities, participated by Eni with a 20% interest, ADNOC with a 65% interest and Österreichische Mineralölverwaltung (OMV) with a 15% interest. The total consideration of the deal amounts to $3.3 billion, net of acquired debt and possible price adjustments at the closing date. The transaction is subject to the approval by the relevant authorities. The transaction is in line with Eni’s strategy finalized to geographical diversification and value chain integration. Eni, with its expertise, will provide support to the technological development of the three refineries operated by ADNOC Refining, located in Ruwais and Abu Dhabi areas. The agreement, one of the most remarkable transaction finalized in the refining sector, increased downstream capacity by 35% and is expected to halve the breakeven refining margin to 1.5 $/barrel in the long term.
AGREEMENTS TO SUPPORT CIRCULAR ECONOMY
As part of its commitment in circular economy, Eni launched a number of partnerships with some Italian municipalities, Vatican City and multi-utility companies operating in waste treatment and local public transport (in Taranto, Turin, Venice, Rome and in some municipalities of Emilia Romagna) for the exploitation of civil waste and organic raw materials by using them as feedstock to produce energy resources like biofuels. These partnerships aim to promote the use of Eni Diesel + in local public transport, in order to reduce GHG emissions, thanks to a 15% renewable component, and to establish a network for collecting non-edible feedstock, such as used cooking oil and other waste of biological origin, for the subsequent transformation into biofuel at the Eni biorefineries in Venice and in Gela, with the latter starting from 2019.
GREEN CHEMICAL DEVELOPMENT
Eni continues to be focused on its commitment in the development of green chemicals based on use of renewable resources through the acquisition of activities in the segment of green chemicals of the Mossi & Ghisolfi Group, finalized at the year-end. In particular, the new assets will allow the valorization of biomass. Development activities also include the re-launch of the international licensing of a proprietary technology to produce second generation bio-ethanol, to meet the growing demand and sustainability criteria required for bio-fuels.

R E F I N I N G & M A R K E T I N G A N D C H E M I C A L S74
PARTNERSHIPS
Signed a partnership between Versalis and Italian producers to establish a supply chain aimed at recycling synthetic grass from sports fields.Versalis and SABIC, a company active in the reactors segment, signed an agreement to develop an innovative technology for natural gas conversion into synthesis gas to be further transformed into high value fuels and chemicals (such as methanol).
NEW ELASTOMERS UNIT
In September 2018, started up a new plant in Ferrara for the production of high value products which will mainly supply the automotive industry. The project, that consolidates the presence of Eni in the territory, will increase overall production capacity, to update elastomer products portfolio and to increase employment.
CHEMICAL INTERNATIONAL DEVELOPMENT
As a part of Eni’s commitment in the chemical international development, was signed an agreement with Mazrui Energy Service, a leading service company in the Oil & Gas industry in the Middle East, to establish a joint venture for the marketing of innovative chemicals. The partnership with Mazrui will enable to enhance the Versalis know-how and proprietary technologies and to compete against major players in the market.
(mmtonnes)
PRODUCTION CYCLE OF REFINED PRODUCTS IN 2018
Changes in stockand transport losses
0.24
Refining23.23
Own consumptionfor power generation
0.35
Own consumptionand losses
1.58
Semi-finishedproducts from
third parties 0.65
Purchase of finished productsand changes in stock
11.63Eni’s production4.14
Crude from thirdparties 18.48
Trading of crude0.28
Italy12.46
Outside Italy1.24Other markets
Italy5.91
Outside Italy2.48Retail markets
Italy7.54
Otside Italy3.29Wholesale market
1. RefiningEni is active in the refining segment in Italy and Germany. Furthermore, in Italy, Eni has converted the former Venice refinery into green refinery (the first case in the world of transformation in biorefinery) and also started the green reconversion project in the industrial site of Gela.In 2018, Eni refinery capacity (balanced with conversion capacity)
REFINING & MARKETING
was approximately 27.4 mmtonnes (equal to 548 kbbl/d), with a conversion index of 54%.Eni’s 100% owned refineries have a balanced capacity of 19.4 mmtonnes (equal to 388 kbbl/d), with a 56% conversion index. In 2018, Eni’s refineries throughputs in Italy and outside Italy were 23.23 mmtonnes down by 3.3% or 0.79 mmtonnes from 2017.

R E F I N I N G & M A R K E T I N G A N D C H E M I C A L SE
ni F
ac
t Bo
ok
20
1875
topping-vacuum unit, an hydrocracking, a platforming and two desulphurization units.
Livorno: refinery, with a balanced refining capacity of 84 kbbl/d and a conversion index of 11%, is dedicated to the production of lubricants and specialties. The refinery is connected by pipeline to a depot in Florence (Calenzano). The refinery has a topping-vacuum unit, a platforming unit, two desulphurization units and a de-aromatization unit (DEA) – for the production of fuels; a propane de-asphalting (PDA), aromatics extraction and de-waxing units, for the production of base oils; a blending and filling plant – for the production of finished lubricants.
Milazzo: jointly-owned by Eni and Kuwait Petroleum Italy, the refinery has balanced refining capacity of 100 kbbl/d (net to Eni) and a conversion index of 60%. Located on the Northern coast of Sicily, it is provided with two primary distillation columns and a vacuum unit, two desulphurization units, a fluid catalytic cracker (FCC), one hydrocracking unit for the conversion of middle distillates (HDC), one reforming unit and one unit devoted to the residue treatment process (LC-Finer).
Outside ItalyIn Germany, Eni’s share in the Schwedt refinery is 8.33% and 20% in Bayernoil, an integrated industrial hub that includes Vohburg and Neustadt refineries. Eni’s refining capacity in Germany is approximately 60 kbbl/d mainly to supply Eni’s distribution network in Bavaria and Eastern Germany.
ItalyEni’s refining system in Italy is composed by three wholly-owned refineries (Sannazzaro, Livorno and Taranto) and a 50% interest in the Milazzo refinery. Each of Eni’s refineries in Italy has operating and strategic features that aim at maximizing the value associated to the asset structure, the geographic location with respect to end markets and the integration with Eni’s other activities.
Sannazzaro: refinery has a balanced refining capacity of 200 kbbl/d and a conversion index of 74%. Located in the Po Valley, in the center of the North Italy, Sannazzaro is one of the most efficient refineries in Europe. The high flexibility and conversion capacity of this refinery allows it to process a wide range of feedstock. The main equipments in the refinery are: two primary distillation columns and two associated vacuum units, three desulphurization units, a fluid catalytic cracker (FCC), two hydrocracking unit for the conversion of middle distillates (HDC), two reforming units, a visbreaking thermal conversion unit integrated with a gasification producing a syngas used in a combined cycle power generation, and finally the Eni Slurry Technology (EST) plant, started up in 2013. The EST plant exploits a proprietary technology to convert extra heavy crude residues (vacuum and visbreaking tar) into naphtha and middle distillates (in particular gasoil), with a conversion factor of 95%.
Taranto: refinery has a balanced refining capacity of 104 kbbl/d and a conversion index of 56%. Taranto has a strong market position due to the fact that is the only refinery in southern continental Italy, and is upstream integrated with the Val d’Agri fields in Basilicata (Eni 60.77%) through a pipeline. The main equipments are a
Refining system in 2018
Ownership
Balanced refining
capacity(Eni’s share)
Utilization rate(Eni’s share)
Conversion index(a)
Fluid catalytic cracking (FCC)(b)
Residue conversion(b) Hydrocracking(b)
Visbreaking/Thermal
Cracking(b)
(%) (kbbl/d) (%) (%) (kbbl/d) (kbbl/d) (kbbl/d) (kbbl/d)Wholly-owned refineries 388 90 56 34 40 71 29Italy
Sannazzaro 100 200 93 74 34 14 51 29 Taranto 100 104 73 56 26 20 Livorno 100 84 100 11
Partially-owned refineries 160 94 52 143 25 75 27Italy
Milazzo 50 100 99 60 45 25 32Germany
Vohburg/Neustadt (Bayernoil) 20 41 77 36 49 43 Schwedt 8.33 19 100 42 49 27
TOTAL 548 91 54 177 65 146 56
(a) Conversion index: catalytic cracking equivalent capacity/topping capacity (%wt).(b) Conversion unit capacities are 100%.

R E F I N I N G & M A R K E T I N G A N D C H E M I C A L S76
Green refineries
Ownership share
Capacity(2018)
Capacity (at regime)
Throughput (2018)
Wholly owned (%) (ktonnes/y) (ktonnes/y) (ktonnes/y)
Venice 100 360 560 253
Gela 100 - 750 -
Total 360 1,310 253
2. Green Refining1
• Cracking of paraffins• Isomerization of paraffins
ISOMERIZATION
CO2
Water
Green GPL
Green Naphtha
BIO+H2 FEEDSTOCK
Green Diesel
Green Jet Fuel
• Rapeseed, soy, sunflower and palm oils• Tall oil• Other oils and 2nd and 3rd generation
bio-feedstocks non-food based (oil of jatropha, microalgae, ricinus, etc.))
• Exhaust vegetable oils
• Cracking the triglyceride structure• Oil deoxygenation• Saturation of double bonds
HYDRO-DEOXYGENATION SEPARATION
PRODUCTION CYCLE OF BIO-FUELS
Green Diesel qualities Green Diesel produced throughout EcofiningTM can be blended until 30% threshould to traditional gasoil; for these characteristics it can be used in the formulation of top quality products. When compared to traditional FAME (Fatty Acid Methyl Esters), Green Diesel displays:
• Higher calorific value• Low solvent characteristic and low water solubility• No low value liquid by-product• Compatibility with automotive materials• Stable blending component• Relevant oxydation stability• Performance at low temperature• Sulphur and aromatics/poliaromatics absence • Productis a high quality cetane component
Venice: green refinery entered into production in June 2014, with a production capacity of 360 ktonnes/y. The refinery exploits the proprietary EcofiningTM technology to transform vegetable oil in hydrogenated bio-fuels. A second phase of development is underway. At full capacity, the refinery production will satisfy approximately half of Eni bio-fuels needs required for being compliant with the EU environmental normative aimed at reducing CO2 emissions.
Gela: in November 2014, Eni defined with the Ministry for Economic Development, the Region of Sicily and interested stakeholders a plan to reconvert this plant in a biorefinery. In August 2017 the project obtained the environmental impact assessment and
authorization (VIA/AIA) by the Italian Ministry for Environment, Land and Sea Protection and the Ministry of Cultural Heritage. Upgrading works have progressed in 2018. The project is expected to come on stream in 2019. The refinery will have a capacity of 750 ktonnes/y. The conversion will leverage on the application of the EcofiningTM proprietary technology, developed and licensed by Eni, to convert unconventional and second generation raw materials into green diesel, a highly sustainable biofuel. The plant properties will allow the production of green diesel in compliance with the last regulatory constraints in terms of reduction of GHG emissions throughout the whole production chain, deploying the full capacity in process second-generation feedstock.
(1) Eni fully owns the Green Refinery of Venice and the site of Gela, where another green refinery is being implemented.
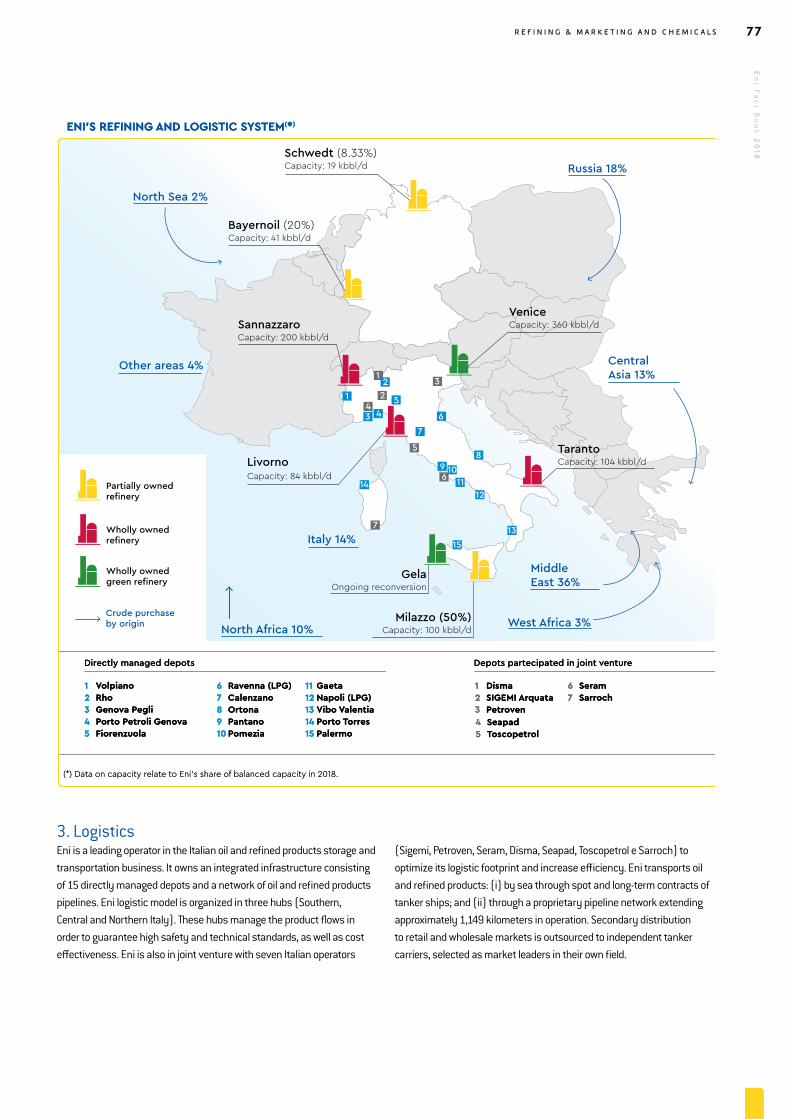
R E F I N I N G & M A R K E T I N G A N D C H E M I C A L SE
ni F
ac
t Bo
ok
20
1877
ENI’S REFINING AND LOGISTIC SYSTEM(*)
Other areas 4%
North Sea 2%
Italy 14%
North Africa 10%
MiddleEast 36%
West Africa 3%
Russia 18%
VeniceCapacity: 360 kbbl/dSannazzaro
Capacity: 200 kbbl/d
Bayernoil (20%)Capacity: 41 kbbl/d
Schwedt (8.33%)Capacity: 19 kbbl/d
(*) Data on capacity relate to Eni’s share of balanced capacity in 2018.
GelaOngoing reconversion
LivornoCapacity: 84 kbbl/d
TarantoCapacity: 104 kbbl/d
Milazzo (50%)Capacity: 100 kbbl/d
Wholly ownedgreen refinery
Partially ownedrefinery
Wholly ownedrefinery
Crude purchaseby origin
1
12
2
3 45
3
46
7
89 106 11
12
13
14
7
15
5
Directly managed depots Depots partecipated in joint venture
1 Volpiano2 Rho3 Genova Pegli4 Porto Petroli Genova5 Fiorenzuola
6 Ravenna (LPG)7 Calenzano8 Ortona9 Pantano10 Pomezia
11 Gaeta12 Napoli (LPG)13 Vibo Valentia14 Porto Torres15 Palermo
1 Disma2 SIGEMI Arquata3 Petroven4 Seapad5 Toscopetrol
6 Seram7 Sarroch
CentralAsia 13%
3. LogisticsEni is a leading operator in the Italian oil and refined products storage and transportation business. It owns an integrated infrastructure consisting of 15 directly managed depots and a network of oil and refined products pipelines. Eni logistic model is organized in three hubs (Southern, Central and Northern Italy). These hubs manage the product flows in order to guarantee high safety and technical standards, as well as cost effectiveness. Eni is also in joint venture with seven Italian operators
(Sigemi, Petroven, Seram, Disma, Seapad, Toscopetrol e Sarroch) to optimize its logistic footprint and increase efficiency. Eni transports oil and refined products: (i) by sea through spot and long-term contracts of tanker ships; and (ii) through a proprietary pipeline network extending approximately 1,149 kilometers in operation. Secondary distribution to retail and wholesale markets is outsourced to independent tanker carriers, selected as market leaders in their own field.

R E F I N I N G & M A R K E T I N G A N D C H E M I C A L S78
4. OxygenatesEni, through its subsidiary Ecofuel (Eni’s interest 100%), sells 0.9 mmtonnes/y of oxygenates, mainly ethers (approximately 3% of world demand, used as a gasoline octane booster), and methanol (mainly for petrochemical use). About 79% of oxygenates are produced in Eni’s plants in Italy (Ravenna), in Saudi Arabia (in joint venture with Sabic) and Venezuela (in joint venture with Pequiven) and the remaining 21% is purchased.
MARKETING
1. Retail sales in ItalyEni is a leader in the Italian retail market of refined products with a 24% market share, slightly decreased from 2017 (24.3%). In 2018, retail sales in Italy were 5.91 mmtonnes, with a slight decrease compared
to 2017 (about 100 ktonnes from 2017 or 1.7%). Average gasoline and gasoil throughput (1,589 kliters) was almost unchanged from 2017. As of December 31, 2018, Eni’s retail network in Italy consisted of 4,223 service stations, lower by 87 units from December 31, 2017 (4,310 service stations), resulting from the negative balance of acquisitions/releases of lease concessions (74 units), closure of low throughput stations (10 units) and the reduction in motorway concessions netted by the new opening (3 units).
2. Retail rest of EuropeRetail sales in the rest of Europe were 2.48 mmtonnes, reducing from 2017 (down by 2%) due to lower volumes traded in Germany, for the event occurred at Bayernoil refinery, and in France. At December 31, 2018, Eni’s retail network in the rest of Europe consisted of 1,225 units, decreasing by 9 units from December 31, 2017, mainly in Germany. Average throughput (2,391 kliters) decreased by 49 kliters compared to 2017 (2,440 kliters).
3. Wholesale businessEni markets fuels on the wholesale market: LPG, naphtha, gasoline, jet fuel, lubricants, fuel oil and bitumen. Major customers are resellers, manufacturing industries, service companies, public utilities and transporters, as well as final users (transporters, condominiums, farmers, fishers, etc.). Eni provides its customers a wide range of
products covering all market requirements leveraging on its expertise on fuels’ manufacturing. Customer care and product distribution are supported by a widespread commercial and logistical organization presence all over Italy and articulated in local marketing offices and a network of agents and dealers.
RETAIL AND WHOLESALE BUSINESSES IN EUROPE - 2018 ENI’S COMPETITIVE POSITION
No. of service station: 4,223 unitAverage throughput: 1.7 klitersWholesale sales: 7,536 ktonnesRetail sales: 5,906 ktonnesMarket share: 24%
Italy
No. of service station: 155 unitAverage throughput: 2.1 klitersWholesale sales: 449 ktonnesRetail sales: 274 ktonnesMarket share: 0.8%
France
No. of service station: 471 unitAverage throughput: 3.2 klitersWholesale sales: 1,246 ktonnesRetail sales: 1,230 ktonnesMarket share: 3.2%
Germany
No. of service station: 276 unitAverage throughput: 1.3 klitersWholesale sales: 474 ktonnesRetail sales: 279 ktonnes
Market share: 7.8%
Switzerland
No. of service station: 323 unitAverage throughput: 2.7 klitersWholesale sales: 244 ktonnesRetail sales: 697 ktonnesMarket share: 12.3%
Austria
Wholesale sales:392 ktonnes
Spain

R E F I N I N G & M A R K E T I N G A N D C H E M I C A L SE
ni F
ac
t Bo
ok
20
1879
Supply of oil
(mmtonnes) 2018 2017 2016 2015 2014
Equity crude oil 4.14 3.51 3.43 5.04 5.81Other crude oil 18.48 20.77 19.92 19.76 17.21Total crude oil purchases 22.62 24.28 23.35 24.80 23.02Purchases of intermediate products 0.65 0.96 1.35 1.66 2.02Purchases of products 11.55 10.92 11.20 10.68 11.07TOTAL PURCHASES 34.82 36.16 35.90 37.14 36.11Consumption for power generation (0.35) (0.34) (0.37) (0.41) (0.57)Other changes(a) (1.27) (1.76) (1.92) (1.22) (0.62)TOTAL AVAILABILITY 33.20 34.06 33.61 35.51 34.92
(a) Include changes in inventories, transport declines, consumption and losses.
Wholesale sales in Italy amounted to 7.54 mmtonnes, unchanged from 2017, mainly due to lower volumes marketed of gasoil offset by higher sales of other products.Supplies of feedstock to the petrochemical industry (0.96 mmtonnes) increased by 11.6%.Wholesale sales in the rest of Europe were 2.82 mmtonnes, down by 6.9% from 2017 due to lower volumes sold in Germany and France, partly offset by higher volumes in Spain.Other sales in Italy and outside Italy (12.74 mmtonnes) slightly increased by 0.06 mmtonnes, due to higher volumes sold to oil companies.The marketing of LPG in Italy is supported by the Eni’s refining production logistic network made of five bottling plants, 1 owned storage site and three storage sites located in the coasts Livorno, Naples and Ravenna. LPG is used as heating and automotive fuel. In
2018 Eni share of LPG market in Italy was 17.8%. Outside Italy, the main market of Eni is Ecuador, with a market share of 37.3%. Eni operates six (owned and co-owned) blending and filling plants, in Italy, Spain, Germany, USA, Africa and in the Far East. With a wide range of products composed of over 650 different blends Eni masters international state of the art know-how for the formulation of products for vehicles (engine oil, special fluids and transmission oils) and industries (lubricants for hydraulic systems, industrial machinery and metal processing). In Italy, Eni is leader in the manufacture and sale of lubricant bases, manufactured at Eni’s refinery in Livorno. Eni also owns one facility for the production of additives in Robassomero. In 2018, Eni’s share of lubricants market in Italy was 19.06%, in Europe 3% and on a worldwide base 1%. Eni sales its products in more than 80 countries by subsidiaries, licensees and distributors.
Availability of refined products
(mmtonnes) 2018 2017 2016 2015 2014
ITALY At wholly-owned refineries 16.78 16.03 17.37 18.37 16.24Less input on account of third parties (1.03) (0.34) (0.27) (0.38) (0.58)At affiliate refineries 4.93 5.46 4.51 4.73 4.26Refinery throughputs on own account 20.68 21.15 21.61 22.72 19.92Consumption and losses (1.38) (1.36) (1.53) (1.52) (1.33)Products available for sale 19.30 19.79 20.08 21.20 18.59Purchases of refined products and change in inventories 7.50 6.74 6.28 6.22 7.19Products transferred to operations outside Italy (0.54) (0.46) (0.39) (0.48) (0.72)Consumption for power generation (0.35) (0.34) (0.37) (0.41) (0.57)Sales of products 25.91 25.73 25.60 26.53 24.49GREEN REFINERY THROUGHPUTS 0.25 0.24 0.21 0.20 0.13OUTSIDE ITALY Refinery throughputs on own account 2.55 2.87 2.91 3.69 5.11Consumption and losses (0.20) (0.22) (0.22) (0.23) (0.21)Products available for sale 2.35 2.65 2.69 3.46 4.90Purchases of refined products and change in inventories 4.12 4.36 4.72 4.77 4.48Products transferred from Italian operations 0.54 0.46 0.40 0.48 0.72Sales of products 7.01 7.47 7.81 8.71 10.10REFINERY THROUGHPUTS ON OWN ACCOUNT IN ITALY AND OUTSIDE ITALY 23.23 24.02 24.52 26.41 25.03of which: refinery throughputs of equity crude on own account 4.14 3.51 3.43 5.04 5.81TOTAL SALES OF REFINED PRODUCTS IN ITALY AND OUTSIDE ITALY 32.92 33.20 33.41 35.24 34.59Crude oil sales 0.28 0.86 0.20 0.27 0.33TOTAL SALES 33.20 34.06 33.61 35.51 34.92

R E F I N I N G & M A R K E T I N G A N D C H E M I C A L S80
Production and sales
(mmtonnes) 2018 2017 2016 2015 2014
Products:
Gasoline 5.97 5.88 6.13 6.36 6.07
Gasoil 8.81 8.99 9.93 10.66 10.31
Jet fuel/kerosene 1.60 1.43 1.49 1.51 1.45
Fuel oil 2.25 2.60 2.43 2.46 2.04
LPG 0.42 0.56 0.39 0.44 0.49
Lubricants 0.59 0.46 0.44 0.54 0.54
Petrochemical feedstock 0.72 0.97 1.46 1.86 1.67
Other 1.28 1.56 0.49 0.84 0.92
Total products 21.64 22.44 22.77 24.67 23.49
Sales:
Italy 25.91 25.73 25.60 26.53 24.48
Gasoline 1.90 1.95 2.02 1.97 2.00
Gasoil 7.28 7.43 7.69 7.64 7.61
Jet fuel/kerosene 1.98 1.96 1.82 1.60 1.59
Fuel oil 0.07 0.08 0.13 0.12 0.12
LPG 0.58 0.59 0.58 0.58 0.59
Lubricants 0.08 0.08 0.08 0.08 0.09
Petrochemical feedstock 0.96 0.86 1.02 1.17 0.89
Other 13.06 12.78 12.26 13.37 11.59
Rest of Europe 6.56 7.03 7.38 8.29 9.69
Gasoline 1.30 1.21 1.27 1.51 1.80
Gasoil 3.16 3.29 3.44 3.98 4.48
Jet fuel/kerosene 0.33 0.50 0.62 0.65 0.55
Fuel oil 0.13 0.13 0.13 0.17 0.18
LPG 0.07 0.08 0.07 0.10 0.14
Lubricants 0.09 0.09 0.08 0.09 0.09
Other 1.48 1.73 1.77 1.79 2.45
Extra Europe 0.45 0.44 0.43 0.42 0.42
LPG 0.44 0.43 0.42 0.41 0.41
Lubricants 0.01 0.01 0.01 0.01 0.01
Worldwide
Gasoline 3.20 3.16 3.29 3.48 3.80
Gasoil 10.44 10.72 11.13 11.62 12.09
Jet fuel/kerosene 2.31 2.46 2.44 2.25 2.14
Fuel oil 0.20 0.21 0.26 0.29 0.30
LPG 1.09 1.10 1.07 1.09 1.14
Lubricants 0.18 0.18 0.17 0.18 0.19
Petrochemical feedstock 0.96 0.86 1.02 1.17 0.89
Other 14.54 14.51 14.03 15.16 14.04
TOTAL WORLDWIDE SALES 32.92 33.20 33.41 35.24 34.59

R E F I N I N G & M A R K E T I N G A N D C H E M I C A L SE
ni F
ac
t Bo
ok
20
1881
Retail and wholesale sales of refined products
(mmtonnes) 2018 2017 2016 2015 2014
Italy 13.45 13.65 14.09 13.80 13.71 Retail sales 5.91 6.01 5.93 5.96 6.14
Gasoline 1.46 1.51 1.53 1.60 1.71 Gasoil 4.03 4.08 3.99 3.96 4.07 LPG 0.38 0.38 0.36 0.36 0.32 Other 0.04 0.04 0.04 0.04 0.04
Wholesale sales 7.54 7.64 8.16 7.84 7.57 Gasoil 3.25 3.36 3.70 3.69 3.54 Fuel oil 0.07 0.08 0.14 0.12 0.12 LPG 0.20 0.21 0.22 0.22 0.28 Gasoline 0.44 0.44 0.49 0.38 0.30 Lubricants 0.08 0.08 0.08 0.07 0.09 Bunker 0.80 0.85 1.01 1.07 0.91 Jet fuel 1.98 1.96 1.82 1.60 1.59 Other 0.72 0.66 0.70 0.69 0.74
Outside Italy (retail + wholesale) 5.77 6.01 6.27 7.19 8.10 Gasoline 1.30 1.21 1.27 1.51 1.80 Gasoil 3.16 3.29 3.44 3.98 4.48 Jet fuel 0.33 0.50 0.62 0.65 0.56 Fuel oil 0.14 0.13 0.13 0.17 0.18 Lubricants 0.09 0.10 0.10 0.10 0.10 LPG 0.50 0.51 0.49 0.51 0.55 Other 0.25 0.27 0.22 0.27 0.43
TOTAL RETAIL AND WHOLESALE SALES 19.22 19.66 20.36 20.99 21.81
Service stations
2018 2017 2016 2015 2014
Italy (units) 4,223 4,310 4,396 4,420 4,592Ordinary stations 4,108 4,192 4,273 4,297 4,468Highway stations 115 118 123 123 124
Outside Italy 1,225 1,234 1,226 1,426 1,628Germany 471 478 472 472 469France 155 157 156 154 160Austria/Switzerland 599 599 598 604 591Eastern Europe 196 408Service stations selling premium products 4,675 4,488 4,405 4,466 4,949
of which service stations selling Green Diesel 3,537 3,477 3,484“Multi-Energy” service stations 4 4 4 6 6Service stations selling LPG and natural gas 1,043 1,050 1,073 1,176 1,206Non-oil sales (€ million) 144 144 146 143 151
Sales in Italy and outside Italy by market
(mmtonnes) 2018 2017 2016 2015 2014
Retail 5.91 6.01 5.93 5.96 6.14Wholesale 7.54 7.64 8.16 7.84 7.57
13.45 13.65 14.09 13.80 13.71Petrochemicals 0.96 0.86 1.02 1.17 0.89Other markets 11.50 11.22 10.49 11.56 9.89Sales in Italy 25.91 25.73 25.60 26.53 24.49Retail rest of Europe 2.48 2.53 2.66 2.93 3.07Wholesale rest of Europe 2.82 3.03 3.18 3.83 4.60Wholesale outside Europe 0.47 0.45 0.43 0.43 0.43Retail and wholesale outside Italy 5.77 6.01 6.27 7.19 8.10Other markets 1.24 1.46 1.54 1.52 2.00Sales outside Italy 7.01 7.47 7.81 8.71 10.10TOTAL SALES 32.92 33.20 33.41 35.24 34.59

R E F I N I N G & M A R K E T I N G A N D C H E M I C A L S82
Average throughput
(kliters/no. of service stations) 2018 2017 2016 2015 2014
Italy 1,589 1,588 1,551 1,569 1,534
Germany 3,247 3,336 3,325 3,351 3,299
France 2,144 2,302 2,360 2,244 2,139
Austria/Switzerland 2,018 2,009 1,939 1,923 1,891
Eastern Europe 1,802 1,979
Average throughput 1,776 1,783 1,742 1,754 1,725
Market shares in Italy
(%) 2018 2017 2016 2015 2014
Retail 24.0 24.3 24.3 24.5 25.6
Gasoline 20.2 20.6 20.7 21.1 22.3
Gasoil 25.8 26.2 26.4 26.5 27.9
LPG (automotive) 23.6 22.8 21.6 22.2 20.1
Lubricants 45.0 35.0 38.5 24.5 25.1
Wholesale 24.8 25.7 28.4 27.5 26.4
Gasoil 22.3 23.3 27.2 27.1 27.1
Fuel oil 12.7 14.0 21.5 11.1 13.6
Bunker 24.7 27.2 33.8 40.8 39.1
Lubricants 18.8 19.3 20.4 19.4 23.2
Retail market shares outside Italy
(%) 2018 2017 2016 2015 2014
Central Europe
Austria 12.3 12.4 12.4 12.6 12.1
Switzerland 7.8 7.8 8.3 8.3 7.3
Germany 3.2 3.3 3.3 3.3 3.2
France 0.8 0.8 0.9 0.8 0.8
Eastern Europe
Hungary 12.1 11.9
Czech Republic 8.5 8.9
Slovakia 9.1 9.5Slovenia 2.4 2.4
Capital expenditure
(€ million) 2018 2017 2016 2015 2014
Italy 661 463 363 349 466
Outside Italy 65 63 58 59 71
726 526 421 408 537
Refining, supply and logistic 587 395 298 282 362
Italy 578 389 293 274 357
Outside Italy 9 6 5 8 5
Marketing 139 131 123 126 175
Italy 83 74 70 75 109
Outside Italy 56 57 53 51 66
TOTAL 726 526 421 408 537

R E F I N I N G & M A R K E T I N G A N D C H E M I C A L SE
ni F
ac
t Bo
ok
20
1883
CHEMICALS
Eni through Versalis engages in the production and marketing of petrochemical products, basic petrochemicals, intermediates, polyethylene, styrenics and elastomers, leveraging on a wide range
of patents (310), 14 production sites, 6 research centers (Ferrara, Mantova, Novara, Porto Torres, Ravenna, Rivalta), as well as a large and efficient retail network located in 26 different Countries.
VERSALIS’ INTERNATIONAL PRESENCE
(*) Versalis International manages the activities of the European commercial branches (France, UK, Germany, Swiss, Austria, Hungary, Romania, Poland, Czech Rep., Slovakia, Russia, Denmark, Sweden, Spain, Greece), coordinates the companies in Turkey and in US, and delivers services to manufacturing companies in France, Germany, Hungary and UK.
Commercial network
Production plants
Versalis AmericasHouston
Versalis UKGrangemouth
Versalis FranceDunkerque
Versalis Zeal Takoradi
Lotte Versalis ElastomersYeosu
Versalis Pacific TradingShanghai e Qingdao
Dunastyr Budapest, Százhalombatta
Versalis DeutschlandOberhausenVersalis International
Bruxelles(*)
Versalis Congo Pointe-Noire
Versalis Pacific India Mumbai
Versalis SingaporeSingapore
Versalis Kimya Istanbul
9
7 8
45
321
Crescentino Bio-ethanolMantova Intermediates Styrene Styrenics Ferrara Elastomers PolyethyleneRavenna Elastomers ButadienePorto Marghera Steam-cracker AromaticsPorto Torres Elastomers (chemicals from renewable resources in JV) Ragusa PolyethylenePriolo Steam-cracker AromaticsBrindisi Steam-cracker Butadiene Polyethylene
123456789
6
Italy
The main objective of basic petrochemicals is granting the adequate availability of monomers (ethylene, butadiene and benzene) which represent the feedstock for further production processes: in particular olefins production is strictly linked with the polyethylene and elastomers business, aromatics grant the benzene availability necessary to produce intermediate products used in the production of resins, artificial fibres and polystyrene. In polymers business Versalis is one of the most relevant European producers of elastomers, where it is present in almost all the relevant sectors (in particular, in the
automotive industry), polystyrene and polyethylene, whose most relevant use is in flexible packaging.
Versalis is also committed in the development of chemicals based on use of renewable resources, through an integrated technological platform. In November 2018 was completed the acquisition of bio-activities of the Mossi & Ghisolfi Group. The new assets will allow producing “advanced” bio-ethanol (i.e. obtained by non-food feedstock) and, potentially, other chemical bio-intermediates.

R E F I N I N G & M A R K E T I N G A N D C H E M I C A L S84
THE PRODUCTION CYCLE
Plastic bags, film for greenhouses,film for industrial packaging, film for foodstuffs, agricultural film for the protection of fields, laminating film, toys, flexible containers, phials, lids, irrigation piping, compounds for civilian use and for use in the automotive industry.
Insulating materials for the buildingindustry, electrical and electronicappliances and household appliances,industrial and food packaging, largeand small household appliances, car components, sports equipment, furniture, piping and extensions, illuminating engineering, medical and pharmaceutical products, toys.
Tyres, footwear, adhesives, piping, components for the building industry, electrical cables, components and parts for cars, household appliances, technical products, as modifiers of plastics materials and bitumens, additives for lubricating oils, carpet underlay, paper coating, printed foam.
POLYMERS
POLYETHYLENE STYRENICS ELASTOMERS
OILdistillation process
VIRGIN NAPHTHAsteam-cracking process
Products addressed to Versalisdownstream production cyclesand to the market.
MONOMERS AND INTERMEDIATES
The materials produced by Versalis are obtained following a manufacturing cycle which involves several processing stages. Virgin naphtha, a raw material which is a distillation product from petroleum, undergoes thermal cracking also known as steam-cracking. The component molecules split into simpler molecules: monomers (ethylene, propylene, butadiene, etc.) and into blends of aromatic compounds. The monomers are then reconstituted into more complex molecules: polymers. The following are produced from polymers: polyethylene, styrenes and elastomers used by processing companies to produce a whole variety of products for everyday use. The blends of aromatic compounds, properly treated, are used to produce intermediates, used in the manufacturing of products for everyday use.
Versalis offers a product portfolio oriented to a constantly evolving market, thanks to a global strategy, enhancement of research and licensing, and international development. Versalis boasts industrial expertise and a wide range of proprietary technologies, an extensive retail network and after-sale support activities.
Versalis is engaged in developing a business model in line with the principles of circular economy, strategic drivers applied to processes and products throughout their life cycle. Versalis develops its activities according to three guidelines based on innovation: feedstock diversification, eco-design projects and development of recycling technologies of polymers.
Among the chemical international development, the Lotte Versalis Elastomers (LVE) joint venture was established with South Korean company Lotte Chemical, starting an industrial plant for the elastomers production to be used in high value applications. Versalis is present in the United States with retail networks, mainly marketing elastomers. In Ghana and Congo, Versalis plays an active role in the Oil & Gas sector with the oilfield chemicals portfolio.
Business areasPetrochemical sales of 4,938 ktonnes increased from 2017 (up by 292 ktonnes, or 6.3%). The main increases were registered in olefins (up by 14.8%) and derivatives (up by 20.4%), partly offset by lower sales volumes of polyethylene (down by 6.3%)
and elastomers (down by 3.2%). Average unit sales prices of the intermediates business increased by 7.1% from 2017, with olefins and aromatics up by 10.9% and 4.2%, respectively. The polymers reported a decrease of 2.4% from 2017. Petrochemical production of 9,483 ktonnes increased by 528 ktonnes (up by 5.9%) mainly due to higher production of intermediates business (up by 8.1%), in particular derivatives up by 17.6%; the polymers productions were substantially in line despite the improvement of styrenics (up by 8.3%). The main increases in production were registered at the Porto Marghera site (up by 22.9%), due to a recovery of production capacity for a shutdown in 2017, as well as Szàzhalombatta, Mantova and Priolo sites. Decreasing production at the Ferrara, Brindisi and Oberhausen sites due to unplanned shutdowns of the plants in 2018. Nominal capacity of plants is in line with 2017. The average plant utilization rate calculated on nominal capacity was 76.2%, increasing from 2017 (72.8%).
IntermediatesBasic petrochemicals are one of the pillars of the activities of Versalis, whose products have a range of important industrial uses, such as the production of polyethylene, polypropylene, PVC and polystyrene. They are also used in the production of petrochemical intermediates that converge, in turn, into a range of other productive processes: plastics, rubbers, fibres, solvents and lubricants.Intermediates revenues (€2,401 million) increased by €413 million from 2017 (up by 20.8%) reflecting the higher commodity prices

R E F I N I N G & M A R K E T I N G A N D C H E M I C A L SE
ni F
ac
t Bo
ok
20
1885
Product availability (ktonnes) 2018 2017 2016 2015 2014
Intermediates 7,130 6,595 6,580 6,304 5,615Polymers 2,353 2,360 2,229 2,366 2,311Production 9,483 8,955 8,809 8,670 7,926Consumption and losses (5,085) (4,566) (4,917) (4,454) (3,834)Purchases and change in inventories 540 257 853 597 589TOTAL AVAILABILITY 4,938 4,646 4,745 4,813 4,681Intermediates 3,087 2,748 2,956 2,895 2,779
Polymers 1,851 1,898 1,789 1,918 1,902
TOTAL SALES 4,938 4,646 4,745 4,813 4,681
Revenues by geographic area (€ million) 2018 2017 2016 2015 2014
Italy 2,292 2,201 1,930 2,154 2,565Rest of Europe 2,183 2,145 2,107 2,326 2,433Asia 481 352 99 162 157Americas 109 93 53 61 105Africa 58 57 7 13 10Other areas 3 14
5,123 4,851 4,196 4,716 5,284
scenario that influences average intermediates prices of the main product of the business unit. Sales increased by 12.3%, in particular ethylene (up by 30.3%) and derivatives (up by 20.4%) driven by higher availability of product following the shutdowns in 2017. Average unit prices increased by 7.1%, in particular olefins (up by 10.9%) and aromatics (up by 4.1%); decreasing of derivatives (down by 9.3%). Intermediates production (7,130 ktonnes) registered an increase of 8.1% from the last year. Increasing production of derivatives (up by 17.6%), aromatics (up by 8.3%) and olefins (up by 7%).
PolymersIn the polymers business Versalis is active in the production of: - polyethylene, that represent approximately a 40% of total volume of
plastic materials produced worldwide; it is a basic plastic material, used as a raw material by companies that transform it into a wide range of goods, from basic product like film for packaging, phials, industrial containers to more sophisticated like automotive tanks, solar panels, medical prostheses;
- styrenics that are polymeric materials based on styrenes that are used in a very large number of sectors through a range of transformation technologies. The most common applications are for industrial packaging and in the food industry, small and large electrical appliances, building isolation, electrical and electronic devices, household appliances, car components and toys;
- elastomers that are polymers characterized by high elasticity that allow them to regain their original shape even after having been subjected to extensive deformation. Versalis has a leading position in this sector and produces a wide range of products for the following sectors: tyres, footwear, adhesives, building components,
pipes, electrical cables, car components and sealing, household appliances; they can be used as modifiers for plastics and bitumens, as additives for lubricating oils (solid elastomers); carpet backing, paper coating, moulded foams (synthetic latex). Versalis is one of the world’s major producers of elastomers and synthetic latex.
Polymers revenues (€2,589 million) decreased by €141 million or 5.2% from 2017 due to lower volumes sold (down by 2.5%), as well as to the decrease of the average unit prices (down by 2.4%). The styrenics business benefitted from higher sold volumes (up by 5.8%) reflecting higher product availability; slightly decrease in prices of sold volumes (down by 1.4%). Polyethylene volumes decreased (down by 6.4%) due to oversupply and competitive pressure from cheaper products streams from the Middle-East and the USA; decreasing of average prices (down by 3.9%).In the elastomers business, a decrease of sold volumes was attributable to SBR rubbers (down by 3.6%), special rubbers EPDM (down by 5.7%) and lattices (down by 16.9%); increasing of thermoplastic rubbers (up by 2.5%) and BR (up by 1.2%). Higher styrenics volumes sold (up by 5.8%) was mainly driven by higher sales of styrene (up by 21.1%), compact polystyrene (up by 8.2%) and expandable polystyrene (up by 5.3%); lower sales of ABS/SAN (down by 16%). Overall, the sold volumes of polyethylene business reported a decrease (down by 6.4%) with lower sales of EVA, LDPE and LLDPE (down by 16.1%, 8.6% and 5.1%, respectively), while volumes of HDPE increased (up by 2.2%). Polymers productions are in line with 2017 (2,353 ktonnes) despite the lower productions of polyethylene (down by 7.3%) and elastomers (down by 2.7%). The styrenics business reported higher production of styrene (up by 12.1%) and HIPS (up by 11.7%).

R E F I N I N G & M A R K E T I N G A N D C H E M I C A L S86
Revenues by product (€ million) 2018 2017 2016 2015 2014
Olefins 1,666 1,308 1,087 1,275 1,305Aromatics 340 328 290 327 610Derivatives 365 352 311 297 394Elastomers 665 699 539 543 628Styrenics 749 723 647 764 745Polyetilene 1,175 1,308 1,194 1,383 1,428Other 163 133 128 126 174 5,123 4,851 4,196 4,716 5,284
Capital expenditure(€ million) 2018 2017 2016 2015 2014
151 203 243 220 282of which: - upkeeping 21 46 34 33 26 - plant upgrades 84 114 162 141 161 - HSE 26 34 37 36 30 - energy recovery 2 2 5 3 28

F I N A N C I A L D A T AE
ni F
ac
t Bo
ok
20
1887
Profit and loss account
(€ million) 2018 2017 2016 2015 2014
Net sales from operations 75,822 66,919 55,762 72,286 98,218
Other income and revenues 1,116 4,058 931 1,252 1,079
Total revenues 76,938 70,977 56,693 73,538 99,297
Purchases, services and other (56,037) (52,461) (44,124) (56,848) (77,404)
Payroll and related costs (3,093) (2,951) (2,994) (3,119) (2,929)
Total operating expenses (59,130) (55,412) (47,118) (59,967) (80,333)
Other operating income (expense) 129 (32) 16 (485) 145
Depreciation, depletion, amortization (6,988) (7,483) (7,559) (8,940) (7,676)
Impairment losses (impairments reversals), net (866) 225 475 (6,534) (1,270)
Write-off (100) (263) (350) (688) (1,198)
Operating profit (loss) 9,983 8,012 2,157 (3,076) 8,965
Finance (expense) income (971) (1,236) (885) (1,306) (1,167)
Net income from investments 1,095 68 (380) 105 476
Profit (loss) before income taxes 10,107 6,844 892 (4,277) 8,274
Income taxes (5,970) (3,467) (1,936) (3,122) (6,466)
Tax rate (%) 59.1 50.7 .. .. 78.1
Net profit (loss) - continuing operations 4,137 3,377 (1,044) (7,399) 1,808
Attributable to:
- Eni’s shareholders 4,126 3,374 (1,051) (7,952) 1,720
- Non-controlling interest 11 3 7 553 88
Net profit (loss) - discontinued operations (413) (1,974) (949)
Attributable to:
- Eni’s shareholders (413) (826) (417)
- Non-controlling interest (1,148) (532)
Net profit (loss) 4,137 3,377 (1,457) (9,373) 859
Attributable to:
- Eni’s shareholders 4,126 3,374 (1,464) (8,778) 1,303
- Non-controlling interest 11 3 7 (595) (444)
Net profit (loss) attributable to Eni’s shareholders - continuing operations 4,126 3,374 (1,051) (7,952) 1,720
Exclusion of inventory holding (gains) losses 69 (156) (120) 782 1,008
Exclusion of special items 388 (839) 831 8,487 1,471
Adjusted net profit (loss) attributable to Eni’s shareholders - continuing operations 4,583 2,379 (340) 1,317 4,199
Adjusted net profit (loss) attributable to Eni’s shareholders - discontinued operations (642) (343)
Adjusted net profit (loss) attributable to Eni’s shareholders 4,583 2,379 (340) 675 3,856
FINANCIAL DATA
TABLES

88 F I N A N C I A L D A T A
Summarized Group Balance Sheet
(€ million) Dec. 31, 2018 Dec. 31, 2017 Dec. 31, 2016 Dec. 31, 2015 Dec. 31, 2014
Fixed assets
Property, plant and equipment 60,302 63,158 70,793 68,005 75,991
Inventories - Compulsory stock 1,217 1,283 1,184 909 1,581
Intangible assets 3,170 2,925 3,269 3,034 4,420
Equity-accounted investments and other investments 7,963 3,730 4,316 3,513 5,187
Receivables and securities held for operating purposes 1,314 1,698 1,932 2,273 1,881
Net payables related to capital expenditure (2,399) (1,379) (1,765) (1,284) (1,971)
71,567 71,415 79,729 76,450 87,089
Net working capital
Inventories 4,651 4,621 4,637 4,579 7,555
Trade receivables 9,520 10,182 11,186 12,616 19,709
Trade payables (11,645) (10,890) (11,038) (9,605) (15,015)
Tax payables and provisions for net deferred tax liabilities (1,104) (2,387) (3,073) (4,137) (3,330)
Provisions (11,886) (13,447) (13,896) (15,375) (15,882)
Other current assets and liabilities (860) 287 1,171 1,827 222
(11,324) (11,634) (11,013) (10,095) (6,741)
Provisions for employee post-retirement benefits (1,117) (1,022) (868) (1,123) (1,313)
Discontinued operations and assets held for sale including related liabilities 236 236 14 9,048 291
CAPITAL EMPLOYED, NET 59,362 58,995 58,927 74,280 79,326
Shareholders’ equity
attributable to: - Eni’s shareholders 51,016 48,030 53,037 55,493 63,186
- Non-controlling interest 57 49 49 1,916 2,455
51,073 48,079 53,086 57,409 65,641
Net borrowings 8,289 10,916 14,776 16,871 13,685
TOTAL LIABILITIES AND SHAREHOLDERS’ EQUITY 59,362 58,995 67,862 74,280 79,326
Summarized Group Cash Flow Statement
(€ million) 2018 2017 2016 2015 2014
Net profit (loss) - continuing operations 4,137 3,377 (1,044) (7,399) 1,808
Adjustments to reconcile net profit (loss) to net cash provided by operating activities:
- depreciation, depletion and amortization and other non monetary items 7,657 8,720 7,773 17,216 10,898
- net gains on disposal of assets (474) (3,446) (48) (577) (224)
- dividends, interest, taxes and other changes 6,168 3,650 2,229 3,215 6,600
Changes in working capital related to operations 1,632 1,440 2,112 4,781 2,199
Dividends received, taxes paid, interest (paid) received during the period (5,473) (3,624) (3,349) (4,361) (6,812)
Net cash provided by operating activities - continuing operations 13,647 10,117 7,673 12,875 14,469
Net cash provided by operating activities - discontinued operations (1,226) 273
Net cash provided by operating activities 13,647 10,117 7,673 11,649 14,742
Capital expenditure - continuing operations (9,119) (8,681) (9,180) (10,741) (11,178)
Capital expenditure - discontinued operations (561) (694)
Capital expenditure (9,119) (8,681) (9,180) (11,302) (11,872)
Investments and purchase of consolidated subsidiaries and businesses (244) (510) (1,164) (228) (408)
Disposals 1,242 5,455 1,054 2,258 3,684
Other cash flow related to capital expenditure, investments and disposals 942 (373) 465 (1,351) 435
Free cash flow 6,468 6,008 (1,152) 1,026 6,581Borrowings (repayment) of debt related to financing activities (357) 341 5,271 (300) (414)
Changes in short and long-term financial debt 320 (1,712) (766) 2,126 (628)
Dividends paid and changes in non-controlling interests and reserves (2,957) (2,883) (2,885) (3,477) (4,434)Effect of changes in consolidation, exchange differences and cash cash eqiuvalent related to discontinued operations 18 (65) (3) (780) 78
NET CASH FLOW 3,492 1,689 465 (1,405) 1,183
Net cash provided by operating activities at replacement cost 12,111 8,458 5,386 8,510 12,805

F I N A N C I A L D A T AE
ni F
ac
t Bo
ok
20
1889
Changes in net borrowings
(€ million) 2018 2017 2016 2015 2014
Free cash flow 6,468 6,008 (1,152) 1,026 6,581
Net borrowings of acquired companies (18) (19)
Net borrowings of divested companies (499) 261 5,848 83
Exchange differences on net borrowings and other changes (367) 474 284 (818) (850)
Dividends paid and changes in non-controlling interest and reserves (2,957) (2,883) (2,885) (3,477) (4,434)
CHANGE IN NET BORROWINGS 2,627 3,860 2,095 (3,186) 1,278
Net sales from operations
(€ million) 2018 2017 2016 2015 2014
Exploration & Production 25,744 19,525 16,089 21,436 28,488
Gas & Power 55,690 50,623 40,961 52,096 73,434
Refining & Marketing and Chemicals 25,216 22,107 18,733 22,639 28,994
Corporate and other activities 1,589 1,462 1,343 1,468 1,429
Consolidation adjustment (32,417) (26,798) (21,364) (25,353) (34,181)
75,822 66,919 55,762 72,286 98,218
Net sales to customers
(€ million) 2018 2017 2016 2015 2014
Exploration & Production 9,943 7,131 6,378 9,321 11,870
Gas & Power 43,109 39,846 32,063 42,179 59,183
Refining & Marketing and Chemicals 22,594 19,771 17,128 20,632 26,952
Corporate and other activities 176 171 193 154 159
Impact of unrealized intragroup profit elimination 54
75,822 66,919 55,762 72,286 98,218
Net sales by geographic area of destination
(€ million) 2018 2017 2016 2015 2014
Italy 25,279 21,925 21,280 24,405 29,234
Other EU Countries 20,408 19,791 15,808 20,730 29,298
Rest of Europe 7,052 5,911 4,804 7,125 11,975
Americas 5,051 5,154 3,212 4,217 5,763
Asia 9,585 7,523 5,619 9,086 12,840
Africa 8,246 6,428 4,865 6,482 8,786
Other areas 201 187 174 241 322
Total outside Italy 50,543 44,994 34,482 47,881 68,984
75,822 66,919 55,762 72,286 98,218
Net sales by geographic area of origin
(€ million) 2018 2017 2016 2015 2014
Italy 51,733 45,764 37,515 47,287 66,763
Other EU Countries 8,004 7,772 7,899 9,996 12,470
Rest of Europe 2,496 2,096 1,560 2,561 3,215
Americas 3,627 3,986 2,257 2,893 10,024
Africa 1,165 616 862 1,687 3,528
Asia 8,599 6,504 5,496 7,630 1,912
Other areas 198 181 173 232 306
Total outside Italy 24,089 21,155 18,247 24,999 31,455
75,822 66,919 55,762 72,286 98,218

90 F I N A N C I A L D A T A
Purchases, services and other
(€ million) 2018 2017 2016 2015 2014
Production costs - raw, ancillary and consumable materials and goods 41,125 35,907 27,783 39,812 60,987Production costs - services 10,625 12,228 12,727 13,197 12,414Operating leases and other 1,820 1,684 1,672 2,205 2,655Net provisions 1,120 886 505 644 340Gains on price adjustments under overlifting/underlifting 145 240 278 409Other expenses 1,130 931 666 528 424less:capitalized direct costs associated with self-constructed tangible and intangible assets (198) (233) (315) (423) (319)
55,622 51,548 43,278 56,241 76,910
Principal accountant fees and services
(€ thousand) 2018 2017 2016 2015 2014
Audit fees 25,349 23,193 21,433 33,752 27,607Audit-related fees 1,568 1,712 1,874 1,138 1,287Tax fees 3 11All other fees 12
26,917 24,917 23,307 34,893 28,905
Payroll and related costs
(€ million) 2018 2017 2016 2015 2014
Wages and salaries 2,409 2,447 2,491 2,648 2,590Social security contributions 448 441 445 453 445Cost related to defined benefit plans and defined contribution plans 220 113 81 85 73Other costs 170 162 202 182 160less: capitalized direct costs associated with self-constructed tangible and intangible assets (154) (212) (225) (249) (339)
3,093 2,951 2,994 3,119 2,929
Depreciation, depletion, amortization, impairments (impairments reversal) net and write-off
(€ million) 2018 2017 2016 2015 2014
Exploration & Production 6,152 6,747 6,772 8,080 6,916Gas & Power 408 345 354 363 335Refining & Marketing and Chemicals 399 360 389 454 381Corporate and other activities 59 60 72 71 70Impact of unrealized intragroup profit elimination (30) (29) (28) (28) (26)Total depreciation, depletion and amortization 6,988 7,483 7,559 8,940 7,676Exploration & Production 726 (158) (700) 5,212 851Gas & Power (71) (146) 81 152 25Refining & Marketing and Chemicals 193 54 104 1,150 380Corporate and other activities 18 25 40 20 14Impairment losses (impairment reversal), net 866 (225) (475) 6,534 1,270Total DD&A and impairment losses (impairment reversal), net 7,854 7,258 7,084 15,474 8,946Write-off 100 263 350 688 1,198
7,954 7,521 7,434 16,162 10,144
Operating profit by segment
(€ million) 2018 2017 2016 2015 2014
Exploration & Production 10,214 7,651 2,567 (959) 10,727Gas & Power 629 75 (391) (1,258) 64Refining & Marketing and Chemicals (380) 981 723 (1,567) (2,811)Corporate and other activities (691) (668) (681) (497) (518)Impact of unrealized intragroup profit elimination 211 (27) (61) 1,205 1,503
9,983 8,012 2,157 (3,076) 8,965

F I N A N C I A L D A T AE
ni F
ac
t Bo
ok
20
1891
Management evaluates underlying business performance on the basis of Non-GAAP financial measures, not determined in accordance with IFRS (“Alternative performance measures”), such as adjusted operating profit and adjusted net profit, which are arrived at by excluding from reported operating profit and net profit certain gains and losses, defined special items, which include, among others, asset impairments, gains on disposals, risk provisions, restructuring charges and, in determining the business segments’ adjusted results, finance charges on finance debt and interest income (see below). In determining adjusted results, also inventory holding gains or losses are excluded from base business performance, which is the difference between the cost of sales of the volumes sold in the period based on the cost of supplies of the same period and the cost of sales of the volumes sold calculated using the weighted average cost method of inventory accounting as required by IFRS, except in those business segments where inventories are utilized as a lever to optimize margins. Management is disclosing Non-GAAP measures of performance to facilitate a comparison of base business performance across periods, and to allow financial analysts to evaluate Eni’s trading performance on the basis of their forecasting models.Non-GAAP financial measures should be read together with information determined by applying IFRS and do not stand in for them. Other companies may adopt different methodologies to determine Non-GAAP measures. Follows the description of the main alternative performance measures adopted by Eni. The measures reported below refer to the performance of the reporting periods disclosed in this Report.
Adjusted operating and net profit Adjusted operating and net profit are determined by excluding inventory holding gains or losses, special items and, in determining the business segments’ adjusted results, finance charges on finance debt and interest income. The adjusted operating profit of each business segment reports gains and losses on derivative financial instruments entered into to manage exposure to movements in foreign currency exchange rates which impact industrial margins and translation of commercial payables and receivables. Accordingly, also currency translation effects recorded through profit and loss are reported within business segments’ adjusted operating profit. The taxation effect of the items excluded from adjusted operating or net profit is determined based on the specific rate of taxes applicable to each of them. Finance charges or income related to net borrowings excluded from the adjusted net profit of business segments are comprised of interest charges on finance debt and interest income earned on cash and cash equivalents not related to operations. Therefore, the adjusted net profit of business segments includes finance charges or income deriving from certain segment operated assets, i.e., interest income on certain receivable financing and securities related to operations and finance charge pertaining to the accretion of certain provisions recorded on a discounted basis (as in the case of the asset retirement obligations in the Exploration & Production segment).
Inventory holding gain or loss This is the difference between the cost of sales of the volumes sold in the period based on the cost of supplies of the same period and the cost of sales of the volumes sold calculated using the weighted average cost method of inventory accounting as required by IFRS.
Special items These include certain significant income or charges pertaining to either: (i) infrequent or unusual events and transactions, being identified as non-recurring items under such circumstances; (ii) certain events or transactions which are not considered to be representative of the ordinary course of business, as in the case of environmental provisions, restructuring charges, asset impairments or write-ups and gains or losses on divestments even though they occurred in past periods or are likely to occur in future ones; or (iii) exchange rate differences and derivatives relating to industrial activities and commercial payables and receivables, particularly exchange rate derivatives to manage commodity pricing formulas which are quoted in a currency other than the functional currency. Those items are reclassified in operating profit with a corresponding adjustment to net finance charges, notwithstanding the handling of foreign currency exchange risks is made centrally by netting off naturally occurring opposite positions and then dealing with any residual risk exposure in the exchange rate market. As provided for in Decision No. 15519 of July 27, 2006 of the Italian market regulator (CONSOB), non-recurring material income or charges are to be clearly reported in the management’s discussion and financial tables. Also, special items allow to allocate to future reporting periods gains and losses on re-measurement at fair value of certain non-hedging commodity derivatives and exchange rate derivatives relating to commercial exposures, lacking the criteria to be designed as hedges, including the ineffective portion of cash flow hedges and certain derivative financial instruments embedded in the pricing formula of long-term gas supply agreements of the Exploration & Production segment.
Leverage Leverage is a Non-GAAP measure of the Company’s financial condition, calculated as the ratio between net borrowings and shareholders’ equity, including non-controlling interest. Leverage is the reference ratio to assess the solidity and efficiency of the Group balance sheet in terms of incidence of funding sources including third-party funding and equity as well as to carry out benchmark analysis with industry standards.
GearingGearing is calculated as the ratio between net borrowings and net capital employed and measures how much of net capital employed is financed recurring to third-party funding.
Net cash provided by operating activities before changes in working capital at replacement cost Net cash provided from operating activities before changes in working capital and excluding inventory holding gain or loss.
ALTERNATIVE PERFORMANCE MEASURES (NON-GAAP MEASURE)

92 F I N A N C I A L D A T A
Free cash flow Free cash flow represents the link existing between changes in cash and cash equivalents (deriving from the statutory cash flows statement) and in net borrowings (deriving from the summarized cash flow statement) that occurred from the beginning of the period to the end of period. Free cash flow is the cash in excess of capital expenditure needs. Starting from free cash flow it is possible to determine either: (i) changes in cash and cash equivalents for the period by adding/deducting cash flows relating to financing debts/ receivables (issuance/repayment of debt and receivables related to financing activities), shareholders’ equity (dividends paid, net repurchase of own shares, capital issuance) and the effect of changes in consolidation and of exchange rate differences; (ii) changes in net borrowings for the period by adding/deducting cash flows relating to shareholders’ equity and the effect of changes in consolidation and of exchange rate differences.
Net borrowingsNet borrowings is calculated as total finance debt less cash, cash equivalents and certain very liquid investments not related to operations, including among others non-operating financing receivables and securities not related to operations. Financial activities are qualified as “not related to operations” when these are not strictly related to the business operations.
ROACE (Return On Average Capital Employed) adjusted Is the return on average capital invested, calculated as the ratio between net income before minority interests, plus net financial charges on net financial debt, less the related tax effect and net average capital employed.
Coverage Financial discipline ratio, calculated as the ratio between operating profit and net finance charges.
Current ratio Measures the capability of the company to repay short-term debt, calculated as the ratio between current assets and current liabilities.
Debt coverage Rating companies use the debt coverage ratio to evaluate debt sustainability. It is calculated as the ratio between net cash provided by operating activities and net borrowings, less cash and cash-equivalents, securities held for non-operating purposes and financing receivables for non-operating purposes.
Net Debt/EBITDA adjustedNet Debt/EBITDA adjusted is the ratio between the profit available to cover the debt before interest, taxes, amortizations and impairment. This index is a measure of the company’s ability to pay off its debt and gives an indication as to how long a company would need to operate at its current level to pay off all its debt.
Profit per boe Measures the return per oil and natural gas barrel produced. It is calculated as the ratio between Results of operations from E&P activities (as defined by FASB Extractive Activities - Oil and Gas Topic 932) and production sold.
Opex per boe Measures efficiency in the oil and gas development activities, calculated as the ratio between operating costs (as defined by FASB Extractive Activities - oil&gas Topic 932) and production sold.
Finding & Development cost per boe Represents Finding & Development cost per boe of new proved or possible reserves. It is calculated as the overall amount of exploration and development expenditure, the consideration for the acquisition of possible and probable reserves as well as additions of proved reserves deriving from improved recovery, extensions, discoveries and revisions of previous estimates (as defined by FASB Extractive Activities - Oil and Gas Topic 932).
The following tables report the group operating profit and Group adjusted net profit and their breakdown by segment, as well as is represented the reconciliation with net profit attributable to Eni’s shareholders of continuing operations.

F I N A N C I A L D A T AE
ni F
ac
t Bo
ok
20
1893
2018 (€ million) Expl
orat
ion
& P
rodu
ctio
n
Gas
& P
ower
Refin
ing
& M
arke
ting
and
Chem
ical
s
Corp
orat
e an
d ot
her
acti
vitie
s
Impa
ct o
f unr
ealiz
ed
intr
agro
up p
rofit
el
imin
atio
n
GROU
P
Reported operating profit (loss) 10,214 629 (380) (691) 211 9,983
Exclusion of inventory holding (gains) losses 234 (138) 96
Exclusion of special items:
environmental charges 110 (1) 193 23 325
impairment losses (impairments reversals), net 726 (71) 193 18 866
gains on disposal of assets (442) (9) (1) (452)
risk provisions 360 21 (1) 380
provision for redundancy incentives 26 122 8 (1) 155
commodity derivatives (156) 23 (133)
exchange rate differences and derivatives (6) 112 1 107
other (138) (92) 96 47 (87)
Special items of operating profit (loss) 636 (86) 526 85 1,161
Adjusted operating profit (loss) 10,850 543 380 (606) 73 11,240
Net finance (expense) income(a) (366) (4) 11 (697) (1,056)
Net income (expense) from investments(a) 285 9 (2) 5 297
Income taxes(a) (5,814) (238) (151) 333 (17) (5,887)
Tax rate (%) 54.0 43.4 38.8 56.2
Adjusted net profit (loss) 4,955 310 238 (965) 56 4,594
of which attributable to:
- non-controlling interest 11
- Eni’s shareholders 4,583
Reported net profit (loss) attributable to Eni’s shareholders 4,126
Exclusion of inventory holding (gains) losses 69
Exclusion of special items 388
Adjusted net profit (loss) attributable to Eni’s shareholders 4,583
(a) Excluding special items.

94 F I N A N C I A L D A T A
2017 (€ million) Expl
orat
ion
& P
rodu
ctio
n
Gas
& P
ower
Refin
ing
& M
arke
ting
and
Chem
ical
s
Corp
orat
e an
d ot
her
acti
vitie
s
Impa
ct o
f unr
ealiz
ed
intr
agro
up p
rofit
el
imin
atio
n
GROU
P
Reported operating profit (loss) 7,651 75 981 (668) (27) 8,012
Exclusion of inventory holding (gains) losses (213) (6) (219)
Exclusion of special items:
environmental charges 46 136 26 208
impairment losses (impairments reversals), net (154) (146) 54 25 (221)
gains on disposal of assets (3,269) (13) (1) (3,283)
risk provisions 366 82 448
provision for redundancy incentives 19 38 (6) (2) 49
commodity derivatives 157 (11) 146
exchange rate differences and derivatives (68) (171) (9) (248)
other 582 261 72 (4) 911
Special items of operating profit (loss) (2,478) 139 223 126 (1,990)
Adjusted operating profit (loss) 5,173 214 991 (542) (33) 5,803
Net finance (expense) income(a) (50) 10 5 (699) (734)
Net income (expense) from investments(a) 408 (9) 19 22 440
Income taxes(a) (2,807) (163) (352) 178 17 (3,127)
Tax rate (%) 50.8 75.8 34.7 56.8
Adjusted net profit (loss) 2,724 52 663 (1,041) (16) 2,382
of which attributable to:
- non-controlling interest 3
- Eni’s shareholders 2,379
Reported net profit (loss) attributable to Eni’s shareholders 3,374
Exclusion of inventory holding (gains) losses (156)
Exclusion of special items (839)
Adjusted net profit (loss) attributable to Eni’s shareholders 2,379
(a) Excluding special items.

F I N A N C I A L D A T AE
ni F
ac
t Bo
ok
20
1895
2016 (€ million) Expl
orat
ion
& P
rodu
ctio
n
Gas
& P
ower
Refin
ing
& M
arke
ting
and
Chem
ical
s
Corp
orat
e an
d ot
her
acti
vitie
s
Impa
ct o
f unr
ealiz
ed
intr
agro
up p
rofit
el
imin
atio
n
GROU
P
DISC
ONTI
NUED
OP
ERAT
IONS
CONT
INUI
NG
OPER
ATIO
NS
Reported operating profit (loss) 2,567 (391) 723 (681) (61) 2,157 2,157
Exclusion of inventory holding (gains) losses 90 (406) 141 (175) (175)
Exclusion of special items:
environmental charges 1 104 88 193 193
impairment losses (impairments reversals), net (684) 81 104 40 (459) (459)
impairment of exploration projects 7 7 7
gains on disposal of assets (2) (8) (10) (10)
risk provisions 105 17 28 1 151 151
provision for redundancy incentives 24 4 12 7 47 47
commodity derivatives 19 (443) (3) (427) (427)
exchange rate differences and derivatives (3) (19) 3 (19) (19)
other 461 270 26 93 850 850
Special items of operating profit (loss) (73) (89) 266 229 333 333
Adjusted operating profit (loss) 2,494 (390) 583 (452) 80 2,315 2,315
Net finance (expense) income(a) (55) 6 1 (721) (769) (769)
Net income (expense) from investments(a) 68 (20) 32 (6) 74 74
Income taxes(a) (1,999) 74 (197) 188 (19) (1,953) (1,953)
Tax rate (%) 79.7 .. 32.0 120.6 120.6
Adjusted net profit (loss) 508 (330) 419 (991) 61 (333) (333)
of which attributable to:
- non-controlling interest 7 7
- Eni’s shareholders (340) (340)
Reported net profit (loss) attributable to Eni’s shareholders (1,464) 413 (1,051)
Exclusion of inventory holding (gains) losses (120) (120)
Exclusion of special items 1,244 (413) 831
Adjusted net profit (loss) attributable to Eni’s shareholders (340) (340)
(a) Excluding special items.
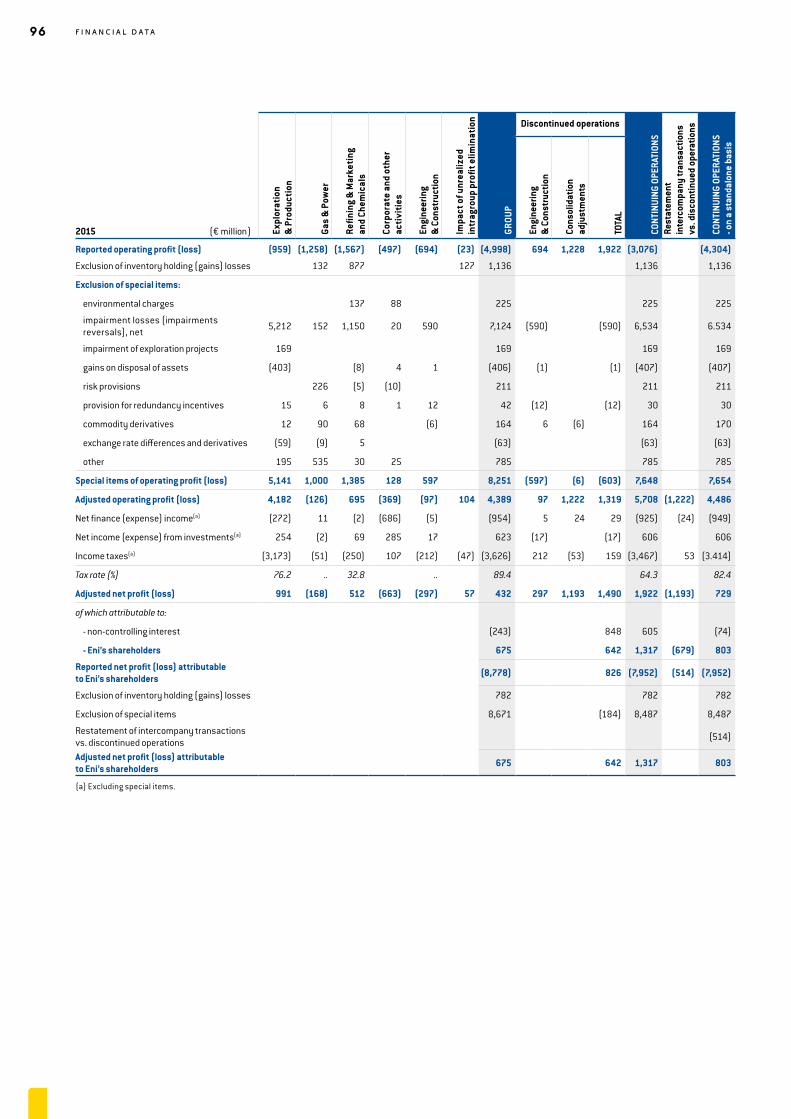
96 F I N A N C I A L D A T A
2015 (€ million) Expl
orat
ion
& P
rodu
ctio
n
Gas
& P
ower
Refin
ing
& M
arke
ting
and
Chem
ical
s
Corp
orat
e an
d ot
her
acti
vitie
s
Engi
neer
ing
& C
onst
ruct
ion
Impa
ct o
f unr
ealiz
ed
intr
agro
up p
rofit
elim
inat
ion
GROU
P
Discontinued operations
CONT
INUI
NG O
PERA
TION
SRe
stat
emen
t in
terc
ompa
ny tr
ansa
ctio
ns
vs. d
isco
ntin
ued
oper
atio
ns
CONT
INUI
NG O
PERA
TION
S - o
n a
stan
dalo
ne b
asis
Engi
neer
ing
& C
onst
ruct
ion
Cons
olid
atio
n ad
just
men
ts
TOTA
L
Reported operating profit (loss) (959) (1,258) (1,567) (497) (694) (23) (4,998) 694 1,228 1,922 (3,076) (4,304)
Exclusion of inventory holding (gains) losses 132 877 127 1,136 1,136 1,136
Exclusion of special items:
environmental charges 137 88 225 225 225
impairment losses (impairments reversals), net 5,212 152 1,150 20 590 7,124 (590) (590) 6,534 6.534
impairment of exploration projects 169 169 169 169
gains on disposal of assets (403) (8) 4 1 (406) (1) (1) (407) (407)
risk provisions 226 (5) (10) 211 211 211
provision for redundancy incentives 15 6 8 1 12 42 (12) (12) 30 30
commodity derivatives 12 90 68 (6) 164 6 (6) 164 170
exchange rate differences and derivatives (59) (9) 5 (63) (63) (63)
other 195 535 30 25 785 785 785
Special items of operating profit (loss) 5,141 1,000 1,385 128 597 8,251 (597) (6) (603) 7,648 7,654
Adjusted operating profit (loss) 4,182 (126) 695 (369) (97) 104 4,389 97 1,222 1,319 5,708 (1,222) 4,486
Net finance (expense) income(a) (272) 11 (2) (686) (5) (954) 5 24 29 (925) (24) (949)
Net income (expense) from investments(a) 254 (2) 69 285 17 623 (17) (17) 606 606
Income taxes(a) (3,173) (51) (250) 107 (212) (47) (3,626) 212 (53) 159 (3,467) 53 (3.414)
Tax rate (%) 76.2 .. 32.8 .. 89.4 64.3 82.4
Adjusted net profit (loss) 991 (168) 512 (663) (297) 57 432 297 1,193 1,490 1,922 (1,193) 729
of which attributable to:
- non-controlling interest (243) 848 605 (74)
- Eni’s shareholders 675 642 1,317 (679) 803
Reported net profit (loss) attributable to Eni’s shareholders (8,778) 826 (7,952) (514) (7,952)
Exclusion of inventory holding (gains) losses 782 782 782
Exclusion of special items 8,671 (184) 8,487 8,487
Restatement of intercompany transactions vs. discontinued operations (514)
Adjusted net profit (loss) attributable to Eni’s shareholders 675 642 1,317 803
(a) Excluding special items.

F I N A N C I A L D A T AE
ni F
ac
t Bo
ok
20
1897
2014 (€ million) Expl
orat
ion
& P
rodu
ctio
n
Gas
& P
ower
Refin
ing
& M
arke
ting
and
Chem
ical
s
Corp
orat
e an
d ot
her
acti
vitie
s
Engi
neer
ing
& C
onst
ruct
ion
Impa
ct o
f unr
ealiz
ed
intr
agro
up p
rofit
elim
inat
ion
GROU
P
Discontinued operations
CONT
INUI
NG O
PERA
TION
SRe
stat
emen
t in
terc
ompa
ny tr
ansa
ctio
ns
vs. d
isco
ntin
ued
oper
atio
ns
CONT
INUI
NG O
PERA
TION
S - o
n a
stan
dalo
ne b
asis
Engi
neer
ing
& C
onst
ruct
ion
Cons
olid
atio
n ad
just
men
ts
TOTA
L
Reported operating profit (loss) 10,727 64 (2,811) (518) 18 398 7,878 (18) 1,105 1,087 8,965 7,860
Exclusion of inventory holding (gains) losses (119) 1,746 (167) 1,460 1,460 1,460
Exclusion of special items:
environmental charges 138 41 179 179 179
impairment losses (impairments reversals), net 853 25 380 14 420 1,692 (420) (420) 1,272 1,272
impairment of exploration projects
gains on disposal of assets (70) 43 3 2 (22) (2) (2) (24) (24)
risk provisions (5) (42) 12 25 (10) (25) (25) (35) (35)
provision for redundancy incentives 24 9 (4) (25) 5 9 (5) (5) 4 4
commodity derivatives (28) (38) 41 9 (16) (9) 9 (16) (25)
exchange rate differences and derivatives 6 205 18 229 229 229
other 172 64 37 30 303 303 303
Special items of operating profit (loss) 952 223 653 75 461 2,364 (461) 9 (452) 1,912 1,903
Adjusted operating profit (loss) 11,679 168 (412) (443) 479 231 11,702 (479) 1,114 635 12,337 (1,114) 11,223
Net finance (expense) income(a) (273) 7 (12) (564) (6) (848) 6 40 46 (802) (40) (842)
Net income (expense) from investments(a) 333 49 64 (156) 21 311 (21) (21) 290 290
Income taxes(a) (7,170) (138) 41 311 (185) (79) (7,220) 185 (51) 134 (7,086) 51 (7,035)
Tax rate (%) 61.1 61.6 .. 37.4 64.7 59.9 65.9
Adjusted net profit (loss) 4,569 86 (319) (852) 309 152 3,945 (309) 1,103 794 4,739 (1,103) 3,636
of which attributable to:
- non-controlling interest 89 451 540 (627) (87)
- Eni’s shareholders 3,856 343 4,199 (476) 3,723
Reported net profit (loss) attributable to Eni’s shareholders 1,303 417 1,720 1,720
Exclusion of inventory holding (gains) losses 1,008 1,008 1,008
Exclusion of special items 1,545 (74) 1,471 1,471
Restatement of intercompany transactions vs. discontinued operations (476)
Adjusted net profit (loss) attributable to Eni’s shareholders 3,856 343 4,199 3,723
(a) Excluding special items.

98 F I N A N C I A L D A T A
Breakdown of special items
(€ million) 2018 2017 2016 2015 2014
Special items of operating profit (loss) 1,161 (1,990) 333 8,251 2,364
- environmental charges 325 208 193 225 179
- impairment losses (impairments reversals), net 866 (221) (459) 7,124 1,692
- impairment of exploration projects 7 169
- net gains on disposal of assets (452) (3,283) (10) (406) (22)
- risk provisions 380 448 151 211 (10)
- provision for redundancy incentives 155 49 47 42 9
- commodity derivatives (133) 146 (427) 164 (16)
- exchange rate differences and derivatives 107 (248) (19) (63) 229
- reinstatement of Eni Norge amortization charges (375)
- other 288 911 850 785 303
Net finance (income) expense (85) 502 166 292 203
of which:
- exchange rate differences and derivatives reclassified to operating profit (loss) (107) 248 19 63 (229)
Net income (expense) from investments (798) 372 817 488 (189)
of which:
- gains on disposals of assets (909) (163) (57) (33) (159)
- impairments/revaluation of equity investments 67 537 896 506 (38)
Income taxes 110 277 (72) (7) (300)
of which:
- net impairment of deferred tax assets of Italian subsidiaries 99 170 880 976
- other net tax refund (824)
- deferred tax adjustment on PSAs 69
- net impairment of deferred tax assets of upstream business outside Italy 6 860
- USA tax reform 115
- taxes on special items of operating profit (outside Italy) and other special items 11 162 (248) (1,747) (521)
Total special items of net profit (loss) 388 (839) 1,244 9,024 2,078
attributable to:
- Non-controlling interest 353 533
- Eni's shareholders 388 (839) 1,244 8,671 1,545
Adjusted operating profit by segment
(€ million) 2018 2017 2016 2015 2014
Exploration & Production 10,850 5,173 2,494 4,182 11,679
Gas & Power 543 214 (390) (126) 168
Refining & Marketing and Chemicals 380 991 583 695 (412)
Corporate and other activities (606) (542) (452) (369) (443)
Impact of unrealized intragroup profit elimination 73 (33) 80 1,326 1,345
11,240 5,803 2,315 5,708 12,337
Adjusted net profit by segment
(€ million) 2018 2017 2016 2015 2014
Exploration & Production 4,955 2,724 508 991 4,569
Gas & Power 310 52 (330) (168) 86
Refining & Marketing and Chemicals 238 663 419 512 (319)
Corporate and other activities (965) (1,041) (991) (663) (852)
Impact of unrealized intragroup profit elimination 56 (16) 61 1,250 1,255
4,594 2,382 (333) 1,922 4,739
of which attributable to:
Non-controlling interest 11 3 7 605 540
Eni’s shareholders 4,583 2,379 (340) 1,317 4,199

F I N A N C I A L D A T AE
ni F
ac
t Bo
ok
20
1899
Finance income (expense)
(€ million) 2018 2017 2016 2015 2014
Finance income (expense) related to net borrowings (627) (834) (726) (814) (802)
- Finance expense from banks on short and long-term debt (685) (751) (757) (838) (871)
- Interest from banks 18 12 15 19 19
- Net finance income (expense) from financial assets held for trading 32 (111) (21) 3 24- Interest and other income from financial receivables and securities held for non-operating purposes 8 16 37 2 26
Income (expense) from derivative financial instruments (307) 837 (482) 160 165
- Derivatives on exchange rate (329) 809 (494) 96 51
- Derivatives on interest rate 22 28 (12) 31 46
- Options 24 33 68
Exchange differences 341 (905) 676 (354) (415)
Other finance income (expense) (430) (407) (459) (464) (278)- Interest and other income on financing receivables and securities held for operating purposes 132 128 143 120 74
- Finance expense due to the passage of time (accretion discount) (249) (264) (312) (291) (293)
- Other finance income (expense) (313) (271) (290) (293) (59)
(1,023) (1,309) (991) (1,472) (1,330)
Capitalized finance expense 52 73 106 166 163
(971) (1,236) (885) (1,306) (1,167)
Income (expense on) from investments
(€ million) 2018 2017 2016 2015 2014
Share of profit of equity-accounted investments 409 124 77 150 188
Share of loss of equity-accounted investments (430) (353) (370) (615) (77)
Gains on disposals 22 163 (14) 164 160
Dividends 231 205 143 402 385Decreases (increases) in the provision for losses on investments from equity accounted investments (47) (38) (33) (6) (1)
Other income (expense), net 910 (33) (183) 10 (179)
1,095 68 (380) 105 476
Property, plant and equipment by segment
(€ million) 2018 2017 2016 2015 2014
Property, plant and equipment by segment, gross
Exploration & Production 151,046 152,608 165,559 154,064 135,385
Gas & Power 5,441 5,333 6,276 6,169 5,985
Refining & Marketing and Chemicals 25,424 24,554 24,119 23,818 23,425
Engineering & Construction 13,657
Corporate and other activities 1,973 1,866 1,886 1,854 2,201
Impact of unrealized intragroup profit elimination (600) (584) (568) (656) (572)
183,284 183,777 197,272 185,249 180,081
Property, plant and equipment by segment, net
Exploration & Production 53,535 56,833 64,428 61,495 60,683
Gas & Power 1,391 1,379 1,692 1,882 1,985
Refining & Marketing and Chemicals 5,300 4,929 4,642 4,664 5,653
Engineering & Construction 7,616
Corporate and other activities 386 341 368 418 452
Impact of unrealized intragroup profit elimination (310) (324) (337) (454) (398)
60,302 63,158 70,793 68,005 75,991

100 F I N A N C I A L D A T A
Capital expenditure by segment
(€ million) 2018 2017 2016 2015 2014
Exploration & Production 7,901 7,739 8,254 9,980 10,156Gas & Power 215 142 120 154 172Refining & Marketing and Chemicals 877 729 664 628 819Corporate and other activities 143 87 55 64 113Impact of unrealized intragroup profit elimination (17) (16) 87 (85) (82)Capital expenditure - continuing operations 9,119 8,681 9,180 10,741 11,178Capital expenditure - discontinued operations 561 694Capital expenditure 9,119 8,681 9,180 11,302 11,872Investments 244 510 1,164 228 408Capital expenditure and investments 9,363 9,191 10,344 11,530 12,280
Capital expenditure by geographic area of origin
(€ million) 2018 2017 2016 2015 2014
Italy 1,424 1,090 1,163 1,303 1,730Other European Union Countries 267 316 331 444 571Rest of Europe 538 387 460 1,101 1,346Africa 4,533 5,699 5,004 5,009 4,658Americas 534 278 233 674 1,039Asia 1,782 898 1,978 2,186 1,717Other areas 41 13 11 24 117Total outside Italy 7,695 7,591 8,017 9,438 9,448Capital expenditure - continuing operations 9,119 8,681 9,180 10,741 11,178Italy 17 27Other European Union Countries 264 256Rest of Europe 50 32Africa 11 31Americas 53 126Asia 140 187Other areas 26 35Total outside Italy 544 667Capital expenditure - discontinued operations 561 694Capital expenditure 9,119 8,681 9,180 11,302 11,872
Net borrowings
(€ million) Debt and bondsCash and cash
equivalents
Securities held for trading and other securities
held for non-operating purposes
Financing receivables held
for non-operating purposes Total
2018Short-term debt 5,783 (10,836) (6,552) (188) (11,793)Long-term debt 20,082 20,082
25,865 (10,836) (6,552) (188) 8,2892017 Short-term debt 4,528 (7,363) (6,219) (209) (9,263)Long-term debt 20,179 20,179
24,707 (7,363) (6,219) (209) 10,9162016 Short-term debt 6,675 (5,674) (6,404) (385) (5,788)Long-term debt 20,564 20,564
27,239 (5,674) (6,404) (385) 14,7762015 Short-term debt 8,396 (5,209) (5,028) (685) (2,526)Long-term debt 19,397 19,397
27,793 (5,209) (5,028) (685) 16,8712014 Short-term debt 6,575 (6,614) (5,037) (555) (5,631)Long-term debt 19,316 19,316
25,891 (6,614) (5,037) (555) 13,685

E M P L O Y E E SE
ni F
ac
t Bo
ok
20
18101
Employees at year end
(units) 2018 2017 2016 2015 2014
Exploration & Production Italy 4,531 4,510 4,608 4,572 4,534
Outside Italy 7,114 7,460 7,886 8,249 8,243
11,645 11,970 12,494 12,821 12,777
Gas & Power Italy 2,089 2,282 2,032 2,023 2,067
Outside Italy 951 2,031 2,229 2,461 2,494
3,040 4,313 4,261 4,484 4,561
Refining & Marketing and Chemicals Italy 8,740 8,580 8,577 8,635 9,286
Outside Italy 2,396 2,336 2,281 2,360 2,598
11,136 10,916 10,858 10,995 11,884
Corporate and other activities Italy 5,642 5,501 5,693 5,650 5,320
Outside Italy 238 234 229 246 304
5,880 5,735 5,922 5,896 5,624
Total employees at year end Italy 21,002 20,873 20,910 20,880 21,207
Outside Italy 10,699 12,061 12,626 13,316 13,639
31,701 32,934 33,536 34,196 34,846
Breakdown by position
(units) 2018 2017 2016 2015 2014
fully consolidated
entities
joint operations
fully consolidated
entities
joint operations
fullyconsolidated
entities
joint operations
fully consolidated
entities
joint operations
fully consolidated
entities
joint operations
Senior Managers 1,008 17 990 17 1,000 17 1,036 18 1,052 16
Middle Managers and Senior Staff 9,147 80 9,043 88 9,135 109 9,185 110 8,996 107
White collar workers 15,839 369 16,600 352 16,842 390 17,519 378 17,850 379
Blue collar workers 4,956 285 5,562 282 5,756 287 5,649 301 6,142 304
Total 30,950 751 32,195 739 32,733 803 33,389 807 34,040 806
EMPLOYEES

102 Q U A R T E R LY I N F O R M A T I O N
Main financial data(a)
2018 2017 2016 2015(€ million) I quarter II quarter III quarter IV quarter I quarter II quarter III quarter IV quarter (€ million) I quarter II quarter III quarter IV quarter I quarter II quarter III quarter IV quarter
Net sales from operations 17,932 18,139 19,695 20,056 75,822 18,047 15,643 15,684 17,545 66,919 Net sales from operations 13,344 13,416 13,195 15,807 55,762 21,038 20,279 15,903 15,066 72,286
Operating profit (loss) 2,399 2,639 3,449 1,496 9,983 2,111 563 998 4,340 8,012 Operating profit (loss) 105 220 192 1,640 2,157 1,770 1,605 248 (6,699) (3,076)
Adjusted operating profit (loss) 2,380 2,564 3,304 2,992 11,240 1,834 1,019 947 2,003 5,803 Adjusted operating profit (loss) 583 188 258 1,286 2,315 1,795 1,823 943 1,147 5,708
Exploration & Production 2,085 2,742 3,095 2,928 10,850 1,415 845 1,046 1,867 5,173 Exploration & Production 95 355 644 1,400 2,494 1,080 1,585 919 598 4,182
Gas & Power 322 108 71 42 543 338 (146) (193) 215 214 Gas & Power 285 (229) (374) (72) (390) 294 31 (469) 18 (126)
Refining & Marketing and Chemicals 77 67 93 143 380 189 352 337 113 991 Refining & Marketing and Chemicals 177 156 175 75 583 121 105 335 134 695
Corporate and other activities (162) (169) (102) (173) (606) (115) (160) (151) (116) (542) Corporate and other activities (90) (126) (118) (118) (452) (89) (123) (56) (101) (369)Unrealized profit intragroup elimination and consolidation adjustments 58 (184) 147 52 73 7 128 (92) (76) (33)
Unrealized profit intragroup elimination and consolidation adjustments 116 32 (69) 1 80 389 225 214 498 1,326
Net (loss) profit(b) 946 1,252 1,529 399 4,126 965 18 344 2,047 3,374 Net (loss) profit(b) (796) (446) (562) 340 (1,464) 832 (97) (790) (8,723) (8,778)
- continuing operations 946 1,252 1,529 399 4,126 965 18 344 2,047 3,374 - continuing operations (383) (446) (562) 340 (1,051) 787 498 (783) (8,454) (7,952)
- discontinued operations - discontinued operations (413) (413) 45 (595) (7) (269) (826)
Capital expenditure 2,541 1,961 1,830 2,787 9,119 2,831 2,092 1,570 2,188 8,681 Capital expenditure 2,455 2,424 2,051 2,250 9,180 2,684 3,150 2,210 2,697 10,741
Investments 37 94 26 87 244 36 14 453 7 510 Investments 1,124 28 6 6 1,164 61 47 63 57 228
Net borrowings at period end 11,278 9,897 9,005 8,289 8,289 14,931 15,467 14,965 10,916 10,916 Net borrowings at period end 12,222 13,814 16,008 14,776 14,776 15,140 16,477 18,414 16,871 16,871
(a) Quarterly data are unaudited.(b) Net profit attributable to Eni’s shareholders.
Key market indicators
2018 2017 2016 2015
I quarter II quarter III quarter IV quarter I quarter II quarter III quarter IV quarter I quarter II quarter III quarter IV quarter I quarter II quarter III quarter IV quarter
Average price of Brent dated crude oil(a) 66.76 74.35 75.27 67.76 71.04 53.78 49.83 52.08 61.39 54.27 Average price of Brent dated crude oil(a) 33.89 45.57 45.85 49.46 43.69 53.97 61.92 50.26 43.69 52.46
Average EUR/USD exchange rate(b) 1.229 1.191 1.163 1.141 1.181 1.065 1.101 1.175 1.177 1.130 Average EUR/USD exchange rate(b) 1.102 1.129 1.116 1.079 1.107 1.126 1.105 1.112 1.095 1.110
Average price in euro of Brent dated crude oil 54.32 62.40 64.72 59.37 60.15 50.51 45.25 44.34 52.14 48.03 Average price in euro of Brent dated crude oil 30.75 40.36 41.08 45.84 39.47 47.93 56.04 45.20 39.90 47.26
Standard Eni Refining Margin (SERM)(c) 3.0 4.1 4.5 3.4 3.7 4.2 5.3 6.4 4.3 5.0 Standard Eni Refining Margin (SERM)(c) 4.2 4.6 3.3 4.7 4.2 7.6 9.1 10.0 6.6 8.3
(a) In USD per barrel. Source: Platt’s Oilgram.(b) Source: ECB.(c) In USD per barrel. Source: Eni calculations. It gauges the profitability of Eni’s refineries against the typical raw material slate and yields.
QUARTERLY INFORMATION

Q U A R T E R LY I N F O R M A T I O NE
ni F
ac
t Bo
ok
20
18103
Main financial data(a)
2018 2017 2016 2015(€ million) I quarter II quarter III quarter IV quarter I quarter II quarter III quarter IV quarter (€ million) I quarter II quarter III quarter IV quarter I quarter II quarter III quarter IV quarter
Net sales from operations 17,932 18,139 19,695 20,056 75,822 18,047 15,643 15,684 17,545 66,919 Net sales from operations 13,344 13,416 13,195 15,807 55,762 21,038 20,279 15,903 15,066 72,286
Operating profit (loss) 2,399 2,639 3,449 1,496 9,983 2,111 563 998 4,340 8,012 Operating profit (loss) 105 220 192 1,640 2,157 1,770 1,605 248 (6,699) (3,076)
Adjusted operating profit (loss) 2,380 2,564 3,304 2,992 11,240 1,834 1,019 947 2,003 5,803 Adjusted operating profit (loss) 583 188 258 1,286 2,315 1,795 1,823 943 1,147 5,708
Exploration & Production 2,085 2,742 3,095 2,928 10,850 1,415 845 1,046 1,867 5,173 Exploration & Production 95 355 644 1,400 2,494 1,080 1,585 919 598 4,182
Gas & Power 322 108 71 42 543 338 (146) (193) 215 214 Gas & Power 285 (229) (374) (72) (390) 294 31 (469) 18 (126)
Refining & Marketing and Chemicals 77 67 93 143 380 189 352 337 113 991 Refining & Marketing and Chemicals 177 156 175 75 583 121 105 335 134 695
Corporate and other activities (162) (169) (102) (173) (606) (115) (160) (151) (116) (542) Corporate and other activities (90) (126) (118) (118) (452) (89) (123) (56) (101) (369)Unrealized profit intragroup elimination and consolidation adjustments 58 (184) 147 52 73 7 128 (92) (76) (33)
Unrealized profit intragroup elimination and consolidation adjustments 116 32 (69) 1 80 389 225 214 498 1,326
Net (loss) profit(b) 946 1,252 1,529 399 4,126 965 18 344 2,047 3,374 Net (loss) profit(b) (796) (446) (562) 340 (1,464) 832 (97) (790) (8,723) (8,778)
- continuing operations 946 1,252 1,529 399 4,126 965 18 344 2,047 3,374 - continuing operations (383) (446) (562) 340 (1,051) 787 498 (783) (8,454) (7,952)
- discontinued operations - discontinued operations (413) (413) 45 (595) (7) (269) (826)
Capital expenditure 2,541 1,961 1,830 2,787 9,119 2,831 2,092 1,570 2,188 8,681 Capital expenditure 2,455 2,424 2,051 2,250 9,180 2,684 3,150 2,210 2,697 10,741
Investments 37 94 26 87 244 36 14 453 7 510 Investments 1,124 28 6 6 1,164 61 47 63 57 228
Net borrowings at period end 11,278 9,897 9,005 8,289 8,289 14,931 15,467 14,965 10,916 10,916 Net borrowings at period end 12,222 13,814 16,008 14,776 14,776 15,140 16,477 18,414 16,871 16,871
(a) Quarterly data are unaudited.(b) Net profit attributable to Eni’s shareholders.
Key market indicators
2018 2017 2016 2015
I quarter II quarter III quarter IV quarter I quarter II quarter III quarter IV quarter I quarter II quarter III quarter IV quarter I quarter II quarter III quarter IV quarter
Average price of Brent dated crude oil(a) 66.76 74.35 75.27 67.76 71.04 53.78 49.83 52.08 61.39 54.27 Average price of Brent dated crude oil(a) 33.89 45.57 45.85 49.46 43.69 53.97 61.92 50.26 43.69 52.46
Average EUR/USD exchange rate(b) 1.229 1.191 1.163 1.141 1.181 1.065 1.101 1.175 1.177 1.130 Average EUR/USD exchange rate(b) 1.102 1.129 1.116 1.079 1.107 1.126 1.105 1.112 1.095 1.110
Average price in euro of Brent dated crude oil 54.32 62.40 64.72 59.37 60.15 50.51 45.25 44.34 52.14 48.03 Average price in euro of Brent dated crude oil 30.75 40.36 41.08 45.84 39.47 47.93 56.04 45.20 39.90 47.26
Standard Eni Refining Margin (SERM)(c) 3.0 4.1 4.5 3.4 3.7 4.2 5.3 6.4 4.3 5.0 Standard Eni Refining Margin (SERM)(c) 4.2 4.6 3.3 4.7 4.2 7.6 9.1 10.0 6.6 8.3
(a) In USD per barrel. Source: Platt’s Oilgram.(b) Source: ECB.(c) In USD per barrel. Source: Eni calculations. It gauges the profitability of Eni’s refineries against the typical raw material slate and yields.

104 Q U A R T E R LY I N F O R M A T I O N
Main operating data
2018 2017 2016 2015I quarter II quarter III quarter IV quarter I quarter II quarter III quarter IV quarter I quarter II quarter III quarter IV quarter I quarter II quarter III quarter IV quarter
Liquids production (kbbl/d) 885 881 886 897 887 832 827 885 861 852 Liquids production (kbbl/d) 890 852 864 906 878 860 903 868 998 908
Natural gas production (mmcf/d) 5,358 5,359 5,008 5,321 5,261 5,254 5,152 5,012 5,625 5,261 Natural gas production (mmcf/d) 4,718 4,709 4,616 5,184 4,807 4,596 4,676 4,582 4,868 4,681
Hydrocarbons production (kboe/d) 1,867 1,863 1,803 1,872 1,851 1,795 1,771 1,803 1,892 1,816 Hydrocarbons production (kboe/d) 1,754 1,715 1,710 1,856 1,759 1,697 1,754 1,703 1,884 1,760
Italy 144 142 132 134 138 154 100 136 146 134 Italy 154 96 125 159 133 165 173 168 169 169
Rest of Europe 218 186 181 193 194 202 218 174 163 189 Rest of Europe 190 188 187 240 201 186 181 182 192 185
North Africa 442 417 368 358 396 483 453 455 542 483 North Africa 450 478 453 464 462 459 457 455 524 473
Egypt 259 290 324 327 300 224 226 230 240 230 Egypt 166 173 185 216 185 179 224 192 160 189
Sub-Saharan Africa 348 354 346 377 356 302 345 374 365 347 Sub-Saharan Africa 343 350 330 334 339 342 343 336 343 341
Kazakhstan 139 135 134 162 143 142 136 118 130 132 Kazakhstan 118 90 103 133 111 100 98 82 100 95
Rest of Asia 151 176 186 198 178 93 108 137 139 119 Rest of Asia 132 141 133 103 127 109 113 117 201 135
America 142 144 109 99 123 172 164 160 144 160 America 178 174 171 184 177 128 140 148 170 147
Australia and Oceania 24 19 23 24 23 23 21 19 23 22 Australia and Oceania 23 25 23 23 24 29 25 23 25 26
Hydrocarbons production sold (mmboe) 156.9 158.6 152.3 157.2 625.0 151.3 149.7 156.3 165.0 622.3 Hydrocarbons production sold (mmboe) 151.5 147.5 148.5 161.1 608.6 144.5 153.6 149.8 166.2 614.1
Sales of natural gas to third parties (bcm) 19.98 16.03 15.20 16.38 67.59 20.64 16.54 15.16 19.00 71.34 Sales of natural gas to third parties (bcm) 21.01 18.51 17.03 20.69 77.24 23.47 20.38 18.30 20.07 82.22
Own consumption of natural gas 1.59 1.34 1.58 1.60 6.11 1.59 1.40 1.55 1.64 6.18 Own consumption of natural gas 1.53 1.31 1.60 1.66 6.10 1.54 1.28 1.51 1.55 5.88
Sales to third parties and own consumption 21.57 17.37 16.78 17.98 73.70 22.23 17.94 16.71 20.64 77.52 Sales to third parties and own consumption 22.54 19.82 18.63 22.35 83.34 25.01 21.66 19.81 21.62 88.10 Sales of natural gas of Eni’s affiliates (net to Eni) 0.87 0.71 0.69 0.74 3.01 1.05 0.69 0.73 0.84 3.31 Sales of natural gas of Eni’s affiliates
(net to Eni) 0.75 0.66 0.65 0.91 2.97 0.61 0.73 0.68 0.76 2.78
Total sales and own consumption of natural gas 22.44 18.08 17.47 18.72 76.71 23.28 18.63 17.44 21.48 80.83 Total sales and own consumption
of natural gas 23.29 20.48 19.28 23.26 86.31 24.84 21.57 19.78 21.53 87.72
Electricity sales (TWh) 9.22 8.49 9.46 9.90 37.07 9.37 8.39 8.91 8.66 35.33 Electricity sales (TWh) 9.45 8.64 9.17 9.79 37.05 8.47 8.35 9.00 9.06 34.88
Sales of refined products (mmtonnes) 7.87 8.19 8.33 8.53 32.92 7.93 8.25 8.56 8.46 33.19 Sales of refined products (mmtonnes) 7.69 8.70 8.65 8.37 33.40 8.36 9.43 8.85 8.60 35.24
Retail sales in Italy 1.40 1.48 1.54 1.48 5.90 1.42 1.54 1.56 1.49 6.01 Retail sales in Italy 1.37 1.50 1.59 1.47 5.93 1.36 1.51 1.58 1.51 5.96
Wholesale sales in Italy 1.68 1.89 1.98 1.99 7.54 1.68 1.98 2.04 1.94 7.64 Wholesale sales in Italy 1.84 2.01 2.23 2.08 8.16 1.69 1.99 2.17 1.99 7.84
Retail sales rest of Europe 0.59 0.63 0.66 0.61 2.49 0.58 0.65 0.68 0.62 2.53 Retail sales rest of Europe 0.63 0.71 0.72 0.61 2.66 0.69 0.79 0.77 0.68 2.93
Wholesale sales rest of Europe 0.69 0.78 0.74 0.61 2.82 0.68 0.78 0.79 0.77 3.02 Wholesale sales rest of Europe 0.70 0.81 0.83 0.84 3.18 1.08 0.98 0.90 0.87 3.83
Wholesale sales outside Europe 0.11 0.12 0.12 0.12 0.47 0.11 0.11 0.11 0.12 0.45 Wholesale sales outside Europe 0.10 0.11 0.11 0.11 0.43 0.10 0.11 0.11 0.11 0.43
Other markets 3.40 3.29 3.29 3.72 13.70 3.46 3.19 3.38 3.52 13.54 Other markets 3.05 3.57 3.17 3.26 13.05 3.44 4.05 3.33 3.43 14.25

Q U A R T E R LY I N F O R M A T I O NE
ni F
ac
t Bo
ok
20
18105
Main operating data
2018 2017 2016 2015I quarter II quarter III quarter IV quarter I quarter II quarter III quarter IV quarter I quarter II quarter III quarter IV quarter I quarter II quarter III quarter IV quarter
Liquids production (kbbl/d) 885 881 886 897 887 832 827 885 861 852 Liquids production (kbbl/d) 890 852 864 906 878 860 903 868 998 908
Natural gas production (mmcf/d) 5,358 5,359 5,008 5,321 5,261 5,254 5,152 5,012 5,625 5,261 Natural gas production (mmcf/d) 4,718 4,709 4,616 5,184 4,807 4,596 4,676 4,582 4,868 4,681
Hydrocarbons production (kboe/d) 1,867 1,863 1,803 1,872 1,851 1,795 1,771 1,803 1,892 1,816 Hydrocarbons production (kboe/d) 1,754 1,715 1,710 1,856 1,759 1,697 1,754 1,703 1,884 1,760
Italy 144 142 132 134 138 154 100 136 146 134 Italy 154 96 125 159 133 165 173 168 169 169
Rest of Europe 218 186 181 193 194 202 218 174 163 189 Rest of Europe 190 188 187 240 201 186 181 182 192 185
North Africa 442 417 368 358 396 483 453 455 542 483 North Africa 450 478 453 464 462 459 457 455 524 473
Egypt 259 290 324 327 300 224 226 230 240 230 Egypt 166 173 185 216 185 179 224 192 160 189
Sub-Saharan Africa 348 354 346 377 356 302 345 374 365 347 Sub-Saharan Africa 343 350 330 334 339 342 343 336 343 341
Kazakhstan 139 135 134 162 143 142 136 118 130 132 Kazakhstan 118 90 103 133 111 100 98 82 100 95
Rest of Asia 151 176 186 198 178 93 108 137 139 119 Rest of Asia 132 141 133 103 127 109 113 117 201 135
America 142 144 109 99 123 172 164 160 144 160 America 178 174 171 184 177 128 140 148 170 147
Australia and Oceania 24 19 23 24 23 23 21 19 23 22 Australia and Oceania 23 25 23 23 24 29 25 23 25 26
Hydrocarbons production sold (mmboe) 156.9 158.6 152.3 157.2 625.0 151.3 149.7 156.3 165.0 622.3 Hydrocarbons production sold (mmboe) 151.5 147.5 148.5 161.1 608.6 144.5 153.6 149.8 166.2 614.1
Sales of natural gas to third parties (bcm) 19.98 16.03 15.20 16.38 67.59 20.64 16.54 15.16 19.00 71.34 Sales of natural gas to third parties (bcm) 21.01 18.51 17.03 20.69 77.24 23.47 20.38 18.30 20.07 82.22
Own consumption of natural gas 1.59 1.34 1.58 1.60 6.11 1.59 1.40 1.55 1.64 6.18 Own consumption of natural gas 1.53 1.31 1.60 1.66 6.10 1.54 1.28 1.51 1.55 5.88
Sales to third parties and own consumption 21.57 17.37 16.78 17.98 73.70 22.23 17.94 16.71 20.64 77.52 Sales to third parties and own consumption 22.54 19.82 18.63 22.35 83.34 25.01 21.66 19.81 21.62 88.10 Sales of natural gas of Eni’s affiliates (net to Eni) 0.87 0.71 0.69 0.74 3.01 1.05 0.69 0.73 0.84 3.31 Sales of natural gas of Eni’s affiliates
(net to Eni) 0.75 0.66 0.65 0.91 2.97 0.61 0.73 0.68 0.76 2.78
Total sales and own consumption of natural gas 22.44 18.08 17.47 18.72 76.71 23.28 18.63 17.44 21.48 80.83 Total sales and own consumption
of natural gas 23.29 20.48 19.28 23.26 86.31 24.84 21.57 19.78 21.53 87.72
Electricity sales (TWh) 9.22 8.49 9.46 9.90 37.07 9.37 8.39 8.91 8.66 35.33 Electricity sales (TWh) 9.45 8.64 9.17 9.79 37.05 8.47 8.35 9.00 9.06 34.88
Sales of refined products (mmtonnes) 7.87 8.19 8.33 8.53 32.92 7.93 8.25 8.56 8.46 33.19 Sales of refined products (mmtonnes) 7.69 8.70 8.65 8.37 33.40 8.36 9.43 8.85 8.60 35.24
Retail sales in Italy 1.40 1.48 1.54 1.48 5.90 1.42 1.54 1.56 1.49 6.01 Retail sales in Italy 1.37 1.50 1.59 1.47 5.93 1.36 1.51 1.58 1.51 5.96
Wholesale sales in Italy 1.68 1.89 1.98 1.99 7.54 1.68 1.98 2.04 1.94 7.64 Wholesale sales in Italy 1.84 2.01 2.23 2.08 8.16 1.69 1.99 2.17 1.99 7.84
Retail sales rest of Europe 0.59 0.63 0.66 0.61 2.49 0.58 0.65 0.68 0.62 2.53 Retail sales rest of Europe 0.63 0.71 0.72 0.61 2.66 0.69 0.79 0.77 0.68 2.93
Wholesale sales rest of Europe 0.69 0.78 0.74 0.61 2.82 0.68 0.78 0.79 0.77 3.02 Wholesale sales rest of Europe 0.70 0.81 0.83 0.84 3.18 1.08 0.98 0.90 0.87 3.83
Wholesale sales outside Europe 0.11 0.12 0.12 0.12 0.47 0.11 0.11 0.11 0.12 0.45 Wholesale sales outside Europe 0.10 0.11 0.11 0.11 0.43 0.10 0.11 0.11 0.11 0.43
Other markets 3.40 3.29 3.29 3.72 13.70 3.46 3.19 3.38 3.52 13.54 Other markets 3.05 3.57 3.17 3.26 13.05 3.44 4.05 3.33 3.43 14.25

106 E N E R G Y C O N V E R S I O N T A B L E
Oil (average reference density 32.35 f API, relative density 0.8636)
1 barrel (bbl) 158.987 l oil(a) 0.159 m3 oil 162.602 m3 gas 5,458 ft3 gas
5,800,000 btu
1 barrel/d (bbl/d) ~50 t/y
1 cubic meter (m3) 1,000 l oil 6.47 bbl 1,033 m3 gas 36,481 ft3 gas
1 tonne oil equivalent (toe) 1,160.49 l oil 7.299 bbl 1.161 m3 oil 1,187 m3 gas 41,911 ft3 gas
Gas
1 cubic meter (m3) 0.976 l oil 0.00647 bbl 35,314.67 btu 35,315 ft3 gas
1.000 cubic feet (ft3) 27.637 l oil 0.1742 bbl 1,000,000 btu 27.317 m3 gas 0.02386 toe
1.000.000 British thermal unit (btu) 27.4 l oil 0.17 bbl 0.027 m3 oil 28.3 m3 gas 1,000 ft3 gas
1 tonne LNG (tLNG) 1.2 toe 8.9 bbl9 bbl 52,000,000 btu 52,000 ft3 gas
Electricity
1 megawatthour=1.000 kWh (MWh) 93.532 l oil 0,5883 bbl 0.0955 m3 oil 94.448 m3 gas 3,412.14 ft3 gas
1 terajoule (TJ) 25,981.45 l oil 163,42 bbl 25.9814 m3 oil 26,939.46 m3 gas 947,826.7 ft3 gas
1.000.000 kilocalories (kcal) 108.8 l oil 00,68 bbl 0.109 m3 oil 112.4 m3 gas 3,968.3 ft3 gas
(a) l oil: liters of oil.
Conversion of mass
kilogram (kg) pound (lb) metric ton (t)
kg 1 2.2046 0.001
lb 0.4536 1 0.0004536
t 1,000 22,046 1
Conversion of length
meter (m) inch (in) foot (ft) yard (yd)
m 1 39.37 3.281 1.093
in 0.0254 1 0.0833 0.0278
ft 0.3048 12 1 0.3333
yd 0.9144 36 3 1
Conversion of volumes
cubic feet (ft3) barrel (bbl) liter (lt) cubic meter (m3)
ft3 1 0 28.32 0.02832
bbl 5.458 1 159 0.158984
l 0.035315 0.0065 1 0.001
m3 35.31485 6.2898 103 1
ENERGY CONVERSION TABLE


Eni SpA
Headquarters
Piazzale Enrico Mattei, 1 - Rome - Italy
Capital Stock as of December 31, 2018: € 4,005,358,876.00 fully paid
Tax identification number 00484960588
Branches
Via Emilia, 1 - San Donato Milanese (Milan) - Italy
Piazza Ezio Vanoni, 1 - San Donato Milanese (Milan) - Italy
Publications
Relazione Finanziaria Annuale pursuant to rule 154-ter paragraph 1 of Legislative Decree No. 58/1998 (in Italian)
Annual Report
Annual Report on Form 20-F for the Securities and Exchange Commission
Fact Book (in Italian and English)
Interim Consolidated Report as of June 30 pursuant to rule 154-ter paragraph 2 of Legislative Decree No. 58/1998
(in Italian and English)
Corporate Governance Report pursuant to rule 123-bis of Legislative Decree No. 58/1998 (in Italian and English)
Remuneration Report pursuant to rule 123-ter of Legislative Decree No. 58/1998 (in Italian and English)
ENI IN 2018 – Summary Annual Review (in English)
ENI FOR 2018 – Sustainability Report (in Italian and English)
Internet home page
www.eni.com
Rome office telephone
+39-0659821
Toll-free number
800940924
Investor Relations
Piazza Ezio Vanoni, 1 - 20097 San Donato Milanese (Milan)
Tel. +39-0252051651 - Fax +39-0252031929
e-mail: [email protected]
Layout and supervision
K-Change - Rome
Printing
Varigrafica Alto Lazio – Viterbo - Italy