Embed Size (px)
Citation preview


Fact Book2014
NATIONAL STOCK EXCHANGE OF INDIA LIMITED
Fact Book
Copyright © 2014 by National Stock Exchange of India Ltd. (NSE) Exchange Plaza, Bandra Kurla ComplexBandra (East), Mumbai 400 051 INDIA
All rights reserved. No part of this publication may be produced, stored in a retrieval system or transmitted in any form by any means, electronic, mechanical, photocopying, recording or otherwise without the written permission of NSE, except as stated below. Single photocopies of single chapters may be made for private study or research provided that the source is acknowledged and NSE is notified.
NSE does not guarantee the accuracy of the data included in this publication and accepts no responsibility whatsoever for any consequence of their use.

i
C O N T E N T S
1. National Stock Exchange of India Ltd
1-1 Trading Value of Different Market Segments ................................................................ 3
1-2 Market Capitalisation of different market segments ...................................................... 3
1-3 Records reached in different Market Segments (data from inception to - March 31, 2014) ......... 3
1-4 Board of Directors of NSEIL .................................................................................... 4
2. Membership
2-1 Eligibility Criteria for Membership ........................................................................... 7
2-2 Growth and Distribution of Members .......................................................................11
3. Listing of Securities
3-1 Listing Criteria for Companies on the CM Segment of NSE ..............................................15
3-2 Listing fees in the CM segment ..............................................................................16
3-3 Companies Listed, Permitted to Trade, Available for Trading on the CM Segment ..................17
3-4 Shareholding Pattern at the end of March 2014 for companies listed at NSE .........................18
3-5 Pledged shares data as of March 2014 ......................................................................19
3-6 Eligibility Criteria for Securities on WDM Segment .......................................................19
3-7 Securities Available for Trading on WDM Segment ........................................................21
3-8 Funds Mobilisation on the Exchange ........................................................................22
3-9 Initial Public Offerings (IPOs) of Equity Shares during 2013-14 .........................................22
3-10 Resource Mobilisation through public issue of NCDs during 2013-14 ...................................22
3-11 Rights Issues during 2013-14 ..................................................................................23
3-12 Preferential Allotments by NSE Listed Companies during 2013-14 .....................................24
3-13 Amount raised through QIP during 2013-14 ................................................................29
3-14 Companies Delisted during 2013-14 .........................................................................29
4. Capital Market Segment
4-1 Business Growth of CM Segment .............................................................................33
4-2 Frequency Distribution of Companies traded ..............................................................35
4-3 Trading Frequency of Companies in Cash Segment during 2013-14 ....................................35
4-4 Advances/Declines in Cash Segment of NSE during 2013-14 (No. of Securities) .....................36
4-5 City-wise Turnover in the CM segment ......................................................................36
4-6 Internet Trading Value in the CM segment in comparison with total trading volumes at NSE ......37
Contd...
ii
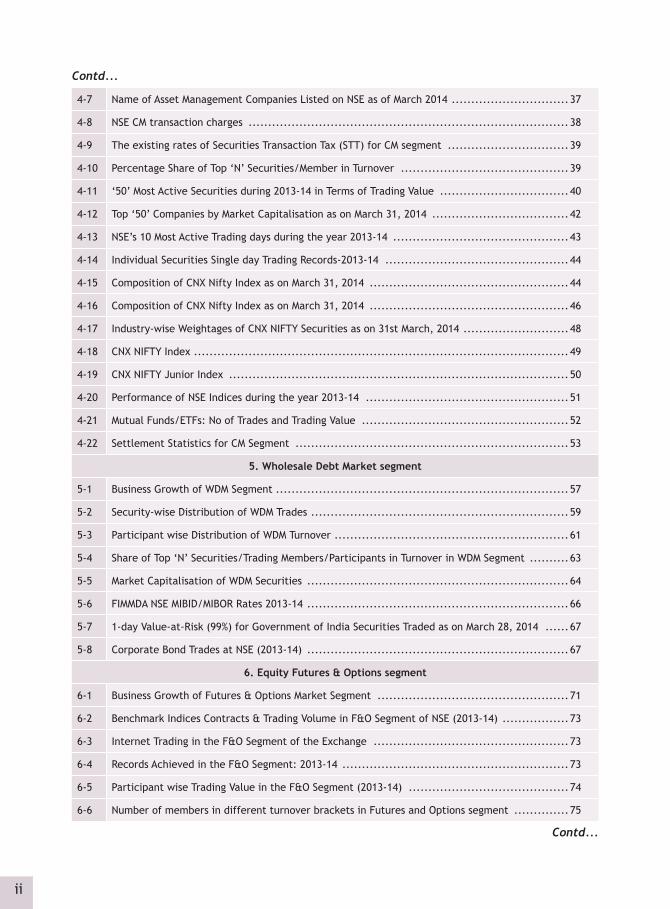
4-7 Name of Asset Management Companies Listed on NSE as of March 2014 ..............................37
4-8 NSE CM transaction charges ..................................................................................38
4-9 The existing rates of Securities Transaction Tax (STT) for CM segment ...............................39
4-10 Percentage Share of Top ‘N’ Securities/Member in Turnover ...........................................39
4-11 ‘50’ Most Active Securities during 2013-14 in Terms of Trading Value .................................40
4-12 Top ‘50’ Companies by Market Capitalisation as on March 31, 2014 ...................................42
4-13 NSE’s 10 Most Active Trading days during the year 2013-14 .............................................43
4-14 Individual Securities Single day Trading Records-2013-14 ...............................................44
4-15 Composition of CNX Nifty Index as on March 31, 2014 ...................................................44
4-16 Composition of CNX Nifty Index as on March 31, 2014 ...................................................46
4-17 Industry-wise Weightages of CNX NIFTY Securities as on 31st March, 2014 ...........................48
4-18 CNX NIFTY Index ................................................................................................49
4-19 CNX NIFTY Junior Index .......................................................................................50
4-20 Performance of NSE Indices during the year 2013-14 ....................................................51
4-21 Mutual Funds/ETFs: No of Trades and Trading Value .....................................................52
4-22 Settlement Statistics for CM Segment ......................................................................53
5. Wholesale Debt Market segment
5-1 Business Growth of WDM Segment ...........................................................................57
5-2 Security-wise Distribution of WDM Trades ..................................................................59
5-3 Participant wise Distribution of WDM Turnover ............................................................61
5-4 Share of Top ‘N’ Securities/Trading Members/Participants in Turnover in WDM Segment ..........63
5-5 Market Capitalisation of WDM Securities ...................................................................64
5-6 FIMMDA NSE MIBID/MIBOR Rates 2013-14 ...................................................................66
5-7 1-day Value-at-Risk (99%) for Government of India Securities Traded as on March 28, 2014 ......67
5-8 Corporate Bond Trades at NSE (2013-14) ...................................................................67
6. Equity Futures & Options segment
6-1 Business Growth of Futures & Options Market Segment .................................................71
6-2 Benchmark Indices Contracts & Trading Volume in F&O Segment of NSE (2013-14) .................73
6-3 Internet Trading in the F&O Segment of the Exchange ..................................................73
6-4 Records Achieved in the F&O Segment: 2013-14 ..........................................................73
6-5 Participant wise Trading Value in the F&O Segment (2013-14) .........................................74
6-6 Number of members in different turnover brackets in Futures and Options segment ..............75
Contd...
Contd...
iii
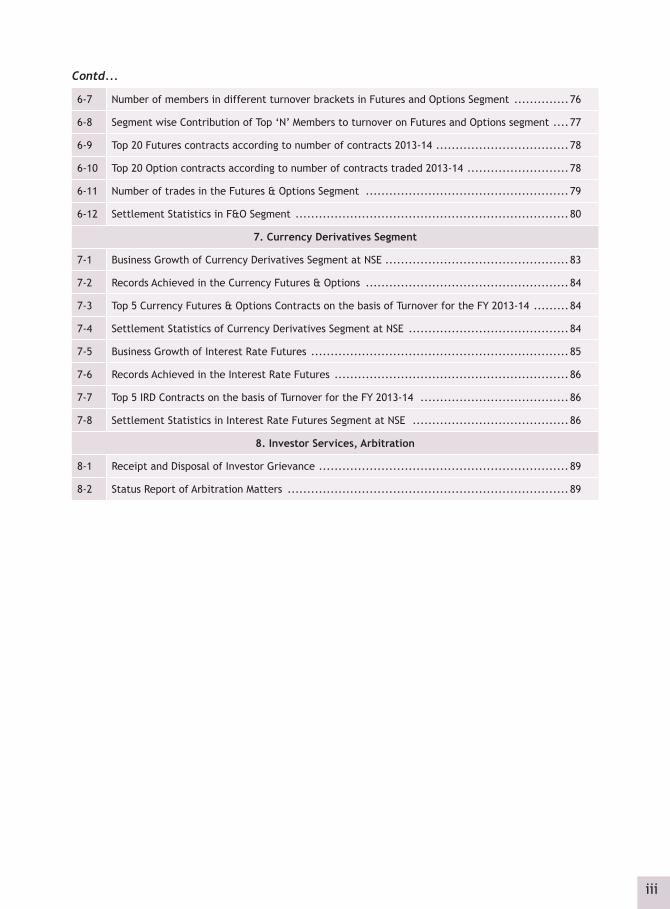
6-7 Number of members in different turnover brackets in Futures and Options Segment ..............76
6-8 Segment wise Contribution of Top ‘N’ Members to turnover on Futures and Options segment ....77
6-9 Top 20 Futures contracts according to number of contracts 2013-14 ..................................78
6-10 Top 20 Option contracts according to number of contracts traded 2013-14 ..........................78
6-11 Number of trades in the Futures & Options Segment ....................................................79
6-12 Settlement Statistics in F&O Segment ......................................................................80
7. Currency Derivatives Segment
7-1 Business Growth of Currency Derivatives Segment at NSE ...............................................83
7-2 Records Achieved in the Currency Futures & Options ....................................................84
7-3 Top 5 Currency Futures & Options Contracts on the basis of Turnover for the FY 2013-14 .........84
7-4 Settlement Statistics of Currency Derivatives Segment at NSE .........................................84
7-5 Business Growth of Interest Rate Futures ..................................................................85
7-6 Records Achieved in the Interest Rate Futures ............................................................86
7-7 Top 5 IRD Contracts on the basis of Turnover for the FY 2013-14 ......................................86
7-8 Settlement Statistics in Interest Rate Futures Segment at NSE ........................................86
8. Investor Services, Arbitration
8-1 Receipt and Disposal of Investor Grievance ................................................................89
8-2 Status Report of Arbitration Matters ........................................................................89
Contd...

iv

National Stock Exchange of India 1

2
3
1National Stock Exchange of India
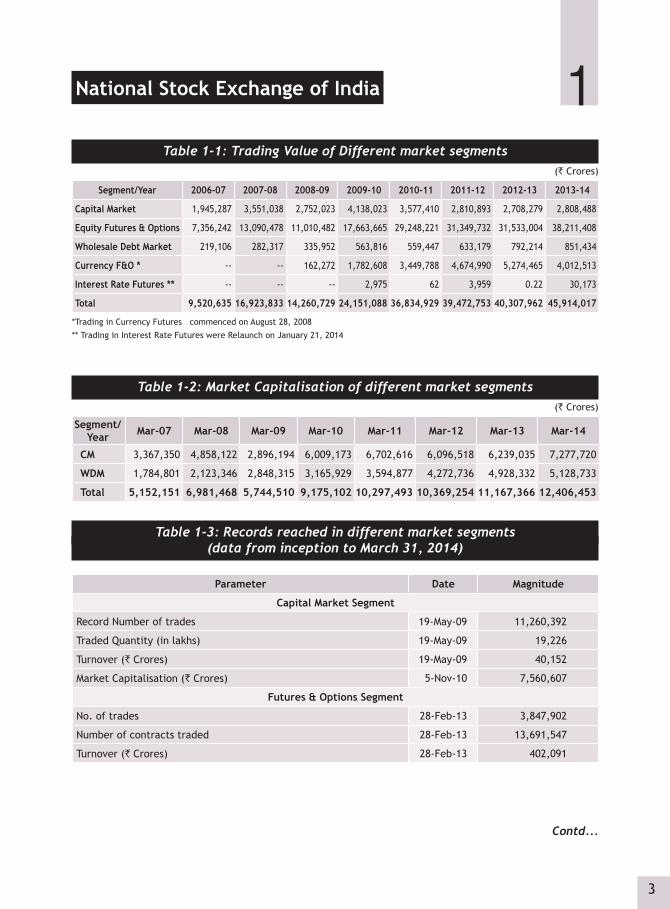
Table 1-1: Trading Value of Different market segments(` Crores)
Segment/Year 2006-07 2007-08 2008-09 2009-10 2010-11 2011-12 2012-13 2013-14
Capital Market 1,945,287 3,551,038 2,752,023 4,138,023 3,577,410 2,810,893 2,708,279 2,808,488
Equity Futures & Options 7,356,242 13,090,478 11,010,482 17,663,665 29,248,221 31,349,732 31,533,004 38,211,408
Wholesale Debt Market 219,106 282,317 335,952 563,816 559,447 633,179 792,214 851,434
Currency F&O * -- -- 162,272 1,782,608 3,449,788 4,674,990 5,274,465 4,012,513
Interest Rate Futures ** -- -- -- 2,975 62 3,959 0.22 30,173
Total 9,520,635 16,923,833 14,260,729 24,151,088 36,834,929 39,472,753 40,307,962 45,914,017
*Trading in Currency Futures commenced on August 28, 2008
** Trading in Interest Rate Futures were Relaunch on January 21, 2014
Table 1-2: Market Capitalisation of different market segments(` Crores)
Segment/Year Mar-07 Mar-08 Mar-09 Mar-10 Mar-11 Mar-12 Mar-13 Mar-14
CM 3,367,350 4,858,122 2,896,194 6,009,173 6,702,616 6,096,518 6,239,035 7,277,720
WDM 1,784,801 2,123,346 2,848,315 3,165,929 3,594,877 4,272,736 4,928,332 5,128,733
Total 5,152,151 6,981,468 5,744,510 9,175,102 10,297,493 10,369,254 11,167,366 12,406,453
Table 1-3: Records reached in different market segments (data from inception to March 31, 2014)
Parameter Date Magnitude
Capital Market Segment
Record Number of trades 19-May-09 11,260,392
Traded Quantity (in lakhs) 19-May-09 19,226
Turnover (` Crores) 19-May-09 40,152
Market Capitalisation (` Crores) 5-Nov-10 7,560,607
Futures & Options Segment
No. of trades 28-Feb-13 3,847,902
Number of contracts traded 28-Feb-13 13,691,547
Turnover (` Crores) 28-Feb-13 402,091
Contd...

4
Parameter Date Magnitude
Currency Derivatives Segment
No. of trades 20-Jun-13 390,049
Number of contracts traded 20-Jun-13 11,534,563
Turnover (` Crores) 20-Jun-13 69,323.90
Wholesale Debt Market Segment
No. of trades 25-Aug-03 2,074
Turnover (` Crores) 25-Aug-03 13,912
Table 1-4: Board of Directors of NSEIL
S.No. Name & Company Designation
1 Mr. S. B. Mathur Former Chairman Life Insurance Corporation of India
Chairman
2 Mr. Ravi Narain Former Managing Director & CEO National Stock Exchange of India Limited
Vice Chairman [Shareholder Director]
3 Ms. Chitra Ramkrishna National Stock Exchange of India Limited
Managing Director & CEO
4 Mr. Abhay Havaldar Managing Director - General Atlantic LLC
Shareholder Director
5 Mr. S. B. Mainak Managing Director Life Insurance Corporation of India
Shareholder Director
6 Mr. Y. H. Malegam Chairman Emeritus M/s. S. B. Billimoria & Co., Chartered Accountants
Public Interest Director
7 Dr. KRS Murthy Professor & Former Director Indian Institute of Management, Bangalore
Public Interest Director
8 Mr. Prakash Parthasarathy Chief Investment Officer Azim Premji Investment Private Limited
Shareholder Director
9 Dr. S. Sadagopan Director Indian Institute of Information Technology, Bangalore
Public Interest Director
10 Mr. Justice B.N. Srikrishna (Retd.) Former Judge, Supreme Court of India
Public Interest Director
11 Mrs. Pratima M. Umarji Former Principal Secretary (Legislation) Government of Maharashtra
Public Interest Director
Contd...

Membership 2

6
7
2
Cont
d...
MembershipTa
ble
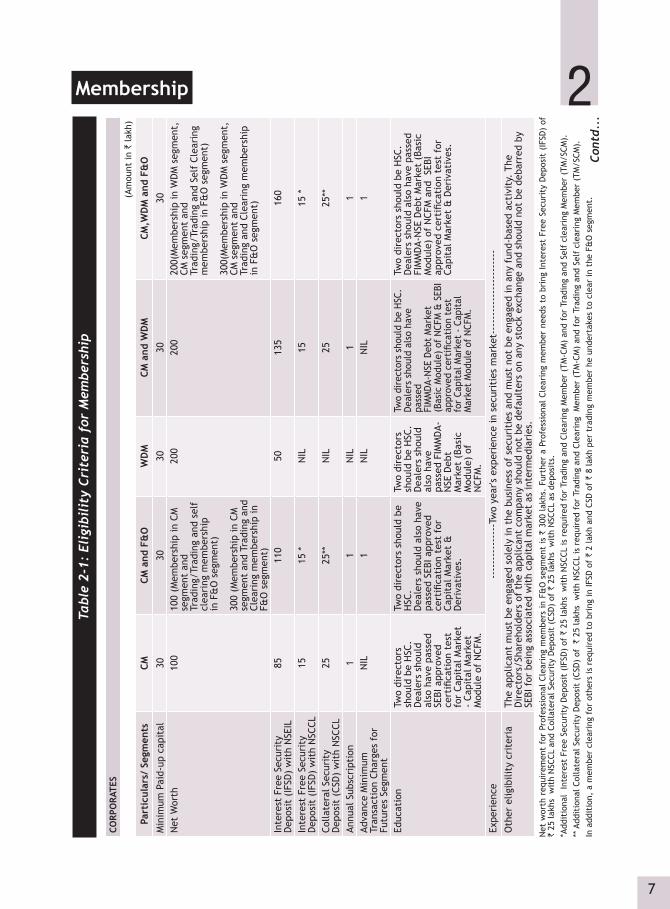
2-1:
Eli
gibi
lity
Cri
teri
a fo
r M
embe
rshi
p
CORP
ORA
TES
(Am
ount
in `
lakh
)
Part
icul
ars/
Seg
men
tsCM
CM
and
F&
OW
DM
CM a
nd W
DM
CM
,WD
M a
nd F
&O
Min
imum
Pai
d-up
cap
ital
3030
3030
30N
et W
orth
10
010
0 (M
embe
rshi
p in
CM
se
gmen
t an
d
Trad
ing/
Trad
ing
and
self
cl
eari
ng m
embe
rshi
p in
F&
O s
egm
ent)
30
0 (M
embe
rshi
p in
CM
se
gmen
t an
d Tr
adin
g an
d Cl
eari
ng m
embe
rshi
p in
F&
O s
egm
ent)
200
200
200(
Mem
bers
hip
in W
DM
seg
men
t,
CM s
egm
ent
and
Tr
adin
g/Tr
adin
g an
d Se
lf C
lear
ing
mem
bers
hip
in F
&O
seg
men
t)
300(
Mem
bers
hip
in W
DM
seg
men
t,
CM s
egm
ent
and
Trad
ing
and
Clea
ring
mem
bers
hip
in F
&O
seg
men
t)
Inte
rest
Fre
e Se
curi
ty
Dep
osit
(IF
SD)
wit
h N
SEIL
8511
050
135
160
Inte
rest
Fre
e Se
curi
ty
Dep
osit
(IF
SD)
wit
h N
SCCL
1515
*N
IL15
15 *
Colla
tera
l Sec
urit
y D
epos
it (
CSD
) w
ith
NSC
CL25
25**
NIL
2525
**
Annu
al S
ubsc
ript
ion
11
NIL
11
Adva
nce
Min
imum
Tr
ansa
ctio
n Ch
arge
s fo
r Fu
ture
s Se
gmen
t
NIL
1N
ILN
IL1
Educ
atio
nTw
o di
rect
ors
shou
ld b
e H
SC.
D
eale
rs s
houl
d al
so h
ave
pass
ed
SEBI
app
rove
d ce
rtifi
cati
on t
est
for
Capi
tal M
arke
t -
Capi
tal M
arke
t M
odul
e of
NCF
M.
Two
dire
ctor
s sh
ould
be
HSC
.
Dea
lers
sho
uld
also
hav
e pa
ssed
SEB
I app
rove
d ce
rtifi
cati
on t
est
for
Capi
tal M
arke
t &
D
eriv
ativ
es.
Two
dire
ctor
s sh
ould
be
HSC
.
Dea
lers
sho
uld
also
hav
e pa
ssed
FIM
MD
A-N
SE D
ebt
Mar
ket
(Bas
ic
Mod
ule)
of
NCF
M.
Two
dire
ctor
s sh
ould
be
HSC
.
Deal
ers
shou
ld a
lso
have
pa
ssed
FI
MM
DA-N
SE D
ebt
Mar
ket
(Bas
ic M
odul
e) o
f N
CFM
& S
EBI
appr
oved
cer
tific
atio
n te
st
for
Capi
tal M
arke
t -
Capi
tal
Mar
ket
Mod
ule
of N
CFM
.
Two
dire
ctor
s sh
ould
be
HSC
.
Dea
lers
sho
uld
also
hav
e pa
ssed
FI
MM
DA-
NSE
Deb
t M
arke
t (B
asic
M
odul
e) o
f N
CFM
and
SEB
I ap
prov
ed c
erti
ficat
ion
test
for
Ca
pita
l Mar
ket
& D
eriv
ativ
es.
Expe
rien
ce--
----
----
----
-Tw
o ye
ar's
expe
rien
ce in
sec
urit
ies
mar
ket-
----
----
----
----
----
--
Oth
er e
ligib
ility
cri
teri
aTh
e ap
plic
ant
mus
t be
eng
aged
sol
ely
in t
he b
usin
ess
of s
ecur
itie
s an
d m
ust
not
be e
ngag
ed in
any
fun
d-ba
sed
acti
vity
. Th
e D
irec
tors
/Sha
reho
lder
s of
the
app
lican
t co
mpa
ny s
houl
d no
t be
def
ault
ers
on a
ny s
tock
exc
hang
e an
d sh
ould
not
be
deba
rred
by
SEBI
for
bei
ng a
ssoc
iate
d w
ith
capi
tal m
arke
t as
inte
rmed
iari
es.
Net
wor
th r
equi
rem
ent
for
Prof
essi
onal
Cle
arin
g m
embe
rs i
n F&
O s
egm
ent
is `
300
lak
hs.
Furt
her
a Pr
ofes
sion
al C
lear
ing
mem
ber
need
s to
bri
ng I
nter
est
Free
Sec
urit
y D
epos
it (
IFSD
) of
`
25 la
khs
wit
h N
SCCL
and
Col
late
ral S
ecur
ity
Dep
osit
(CS
D)
of `
25
lakh
s w
ith
NSC
CL a
s de
posi
ts.
*Add
itio
nal
Inte
rest
Fre
e Se
curi
ty D
epos
it (
IFSD
) of
` 2
5 la
khs
wit
h N
SCCL
is r
equi
red
for
Trad
ing
and
Clea
ring
Mem
ber
(TM
-CM
) an
d fo
r Tr
adin
g an
d Se
lf c
lear
ing
Mem
ber
(TM
/SCM
).**
Add
itio
nal C
olla
tera
l Sec
urit
y D
epos
it (
CSD
) of
`
25 la
khs
wit
h N
SCCL
is r
equi
red
for
Trad
ing
and
Clea
ring
Mem
ber
(TM
-CM
) an
d fo
r Tr
adin
g an
d Se
lf c
lear
ing
Mem
ber
(TM
/SCM
).
In a
ddit
ion,
a m
embe
r cl
eari
ng f
or o
ther
s is
req
uire
d to
bri
ng in
IFSD
of
` 2
lakh
and
CSD
of
` 8
lakh
per
tra
ding
mem
ber
he u
nder
take
s to
cle
ar in
the
F&
O s
egm
ent.
8
Cont
d...
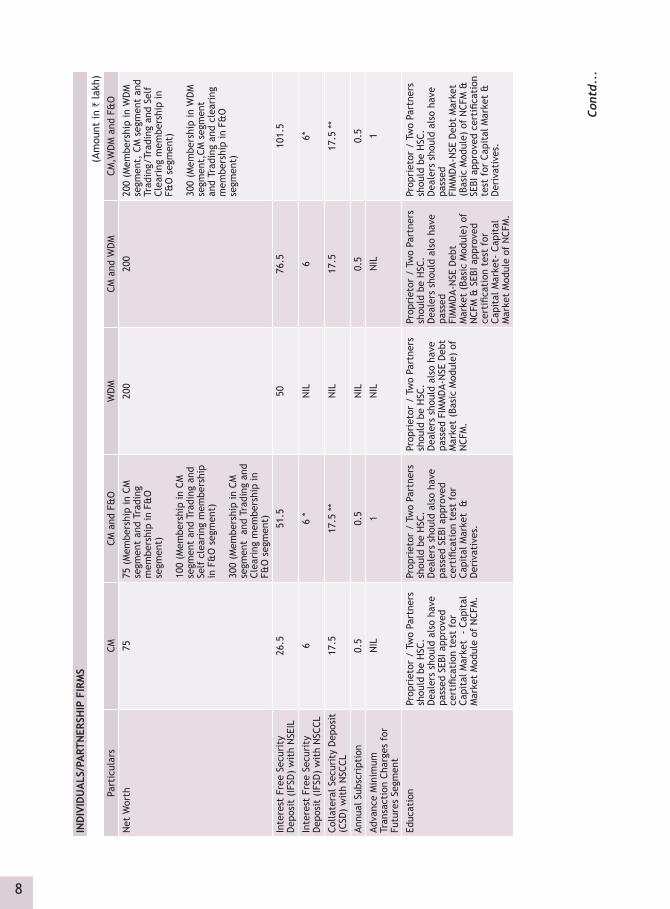
IND
IVID
UA
LS/P
ART
NER
SHIP
FIR
MS
(Am
ount
in `
lakh
)Pa
rtic
ular
sCM
CM
and
F&
O
WD
MCM
and
WD
M
CM,W
DM
and
F&
O
Net
Wor
th
7575
(M
embe
rshi
p in
CM
se
gmen
t an
d Tr
adin
g m
embe
rshi
p in
F&
O
segm
ent)
10
0 (M
embe
rshi
p in
CM
se
gmen
t an
d Tr
adin
g an
d Se
lf c
lear
ing
mem
bers
hip
in F
&O
seg
men
t)
300
(Mem
bers
hip
in C
M
segm
ent
and
Tra
ding
and
Cl
eari
ng m
embe
rshi
p in
F&
O s
egm
ent)
200
200
200
(Mem
bers
hip
in W
DM
se
gmen
t, C
M s
egm
ent
and
Trad
ing/
Trad
ing
and
Self
Cl
eari
ng m
embe
rshi
p in
F&
O s
egm
ent)
30
0 (M
embe
rshi
p in
WD
M
segm
ent,
CM s
egm
ent
and
Trad
ing
and
clea
ring
m
embe
rshi
p in
F&
O
segm
ent)
Inte
rest
Fre
e Se
curi
ty
Dep
osit
(IF
SD)
wit
h N
SEIL
26.5
51.5
5076
.510
1.5
Inte
rest
Fre
e Se
curi
ty
Dep
osit
(IF
SD)
wit
h N
SCCL
66
*N
IL6
6*
Colla
tera
l Sec
urit
y D
epos
it
(CSD
) w
ith
NSC
CL17
.517
.5 *
*N
IL17
.517
.5 *
*
Annu
al S
ubsc
ript
ion
0.5
0.5
NIL
0.5
0.5
Adva
nce
Min
imum
Tr
ansa
ctio
n Ch
arge
s fo
r Fu
ture
s Se
gmen
t
NIL
1N
ILN
IL1
Educ
atio
nPr
opri
etor
/ T
wo
Part
ners
sh
ould
be
HSC
.
Dea
lers
sho
uld
also
hav
e pa
ssed
SEB
I app
rove
d ce
rtifi
cati
on t
est
for
Capi
tal M
arke
t -
Cap
ital
M
arke
t M
odul
e of
NCF
M.
Prop
riet
or /
Tw
o Pa
rtne
rs
shou
ld b
e H
SC.
Dea
lers
sho
uld
also
hav
e pa
ssed
SEB
I app
rove
d ce
rtifi
cati
on t
est
for
Capi
tal M
arke
t &
D
eriv
ativ
es.
Prop
riet
or /
Tw
o Pa
rtne
rs
shou
ld b
e H
SC.
Dea
lers
sho
uld
also
hav
e pa
ssed
FIM
MD
A-N
SE D
ebt
Mar
ket
(Bas
ic M
odul
e) o
f N
CFM
.
Prop
riet
or /
Tw
o Pa
rtne
rs
shou
ld b
e H
SC.
Dea
lers
sho
uld
also
hav
e pa
ssed
FI
MM
DA-
NSE
Deb
t M
arke
t (B
asic
Mod
ule)
of
NCF
M &
SEB
I app
rove
d ce
rtifi
cati
on t
est
for
Capi
tal M
arke
t- C
apit
al
Mar
ket
Mod
ule
of N
CFM
.
Prop
riet
or /
Tw
o Pa
rtne
rs
shou
ld b
e H
SC.
D
eale
rs s
houl
d al
so h
ave
pass
ed
FIM
MD
A-N
SE D
ebt
Mar
ket
(Bas
ic M
odul
e) o
f N
CFM
&
SEBI
app
rove
d ce
rtifi
cati
on
test
for
Cap
ital
Mar
ket
&
Der
ivat
ives
.

9
Cont
d...
Cont
d... Pa
rtic
ular
sCM
CM
and
F&
O
WD
MCM
and
WD
M
CM,W
DM
and
F&
O
Expe
rien
ce--
----
----
----
-Tw
o ye
ar's
expe
rien
ce in
sec
urit
ies
mar
ket-
----
----
----
----
----
--
Oth
er e
ligib
ility
cri
teri
aTh
e ap
plic
ant
shou
ld n
ot b
e en
gage
d in
any
fun
d ba
sed
acti
vity
. Th
e Pr
opri
etor
/Par
tner
s sh
ould
not
be
defa
ulte
rs o
n an
y st
ock
exch
ange
an
d sh
old
not
be d
ebar
red
by S
EBI f
or b
eing
ass
ocia
ted
wit
h ca
pita
l mar
ket
as in
term
edia
ries
Fur
ther
, Pa
rtne
rshi
p fir
ms
shou
ld n
ot b
e en
gage
d in
any
bus
ines
s ot
her
than
Sec
urit
ies.
*Add
itio
nal
Inte
rest
Fre
e Se
curi
ty D
epos
it (
IFSD
) of
` 2
5 la
khs
wit
h N
SCCL
is r
equi
red
for
Trad
ing
and
Clea
ring
Mem
ber
(TM
-CM
) an
d fo
r Tr
adin
g an
d Se
lf c
lear
ing
Mem
ber
(TM
/SCM
).
* Ad
diti
onal
Col
late
ral S
ecur
ity
Dep
osit
(CS
D)
of `
25 la
khs
wit
h N
SCCL
is r
equi
red
for
Trad
ing
and
Clea
ring
Mem
ber
(TM
-CM
) an
d fo
r Tr
adin
g an
d Se
lf c
lear
ing
Mem
ber
(TM
/SCM
).
In a
ddit
ion,
a m
embe
r cl
eari
ng f
or o
ther
s is
req
uire
d to
bri
ng in
IFSD
of
` 2
lakh
and
CSD
of
` 8
lakh
per
tra
ding
mem
ber
he u
nder
take
s to
cle
ar in
the
F&
O s
egm
ent.
CURR
ENCY
DER
IVAT
IVES
- Co
rpor
ates
, In
divi
dual
s an
d Fi
rms
(Am
ount
in `
lakh
)
Part
icul
ars
NSE
Mem
bers
New
App
lican
ts
Trad
ing
Mem
bers
hip
Trad
ing
Cum
Se
lf C
lear
ing
Mem
bers
hip
Trad
ing
Cum
Cl
eari
ng
Mem
bers
hip
Trad
ing
Mem
bers
hip
Trad
ing
cum
Se
lf C
lear
ing
Mem
bers
hip
Trad
ing
cum
Cl
eari
ng
Mem
bers
hip
Prof
essi
onal
Cl
eari
ng
Mem
bers
hip
Net
wor
th10
050
010
0010
050
010
0010
00
Cash
to
NSE
IL2
22
22
2 -
Non
-cas
h to
NSE
IL8
88
1318
18-
Cash
to
NSC
CL -
2525
-25
2525
Non
cas
h to
NSC
CL -
2525
-25
2525
Adva
nce
Min
imum
Tr
ansa
ctio
n Ch
arge
s0.
50.
50.
50.
50.
50.
50.
5

10
Cont
d...
Part
icul
ars
NSE
Mem
bers
New
App
lican
ts
Trad
ing
Mem
bers
hip
Trad
ing
Cum
Se
lf C
lear
ing
Mem
bers
hip
Trad
ing
Cum
Cl
eari
ng
Mem
bers
hip
Trad
ing
Mem
bers
hip
Trad
ing
cum
Se
lf C
lear
ing
Mem
bers
hip
Trad
ing
cum
Cl
eari
ng
Mem
bers
hip
Prof
essi
onal
Cl
eari
ng
Mem
bers
hip
Educ
atio
nPr
opri
etor
/Tw
o Pa
rtne
rs/T
wo
dire
ctor
s sh
ould
be
HSC
.D
eale
rs s
houl
d al
so h
ave
pass
ed
SEBI
app
rove
d N
atio
nal I
nsti
tute
of
Sec
urit
ies
Mar
kets
(N
ISM
) Se
ries
I –
Curr
ency
D
eriv
ativ
es
Cert
ifica
tion
Ex
amin
atio
n
Prop
riet
or/T
wo
Part
ners
/Tw
o di
rect
ors
shou
ld
be H
SC.
Dea
lers
sho
uld
also
hav
e pa
ssed
SE
BI a
ppro
ved
Nat
iona
l Ins
titu
te
of S
ecur
itie
s M
arke
ts (
NIS
M)
Seri
es I
– Cu
rren
cy
Der
ivat
ives
Ce
rtifi
cati
on
Exam
inat
ion
Prop
riet
or/T
wo
Part
ners
/Tw
o di
rect
ors
shou
ld
be H
SC.
Dea
lers
sho
uld
also
hav
e pa
ssed
SE
BI a
ppro
ved
Nat
iona
l Ins
titu
te
of S
ecur
itie
s M
arke
ts (
NIS
M)
Seri
es I
– Cu
rren
cy
Der
ivat
ives
Ce
rtifi
cati
on
Exam
inat
ion
Prop
riet
or/T
wo
Part
ners
/Tw
o di
rect
ors
shou
ld
be H
SC.
Dea
lers
sho
uld
also
hav
e pa
ssed
SE
BI a
ppro
ved
Nat
iona
l Ins
titu
te
of S
ecur
itie
s M
arke
ts (
NIS
M)
Seri
es I
– Cu
rren
cy
Der
ivat
ives
Ce
rtifi
cati
on
Exam
inat
ion
Prop
riet
or/T
wo
Part
ners
/Tw
o di
rect
ors
shou
ld
be H
SC.
Dea
lers
sho
uld
also
hav
e pa
ssed
SE
BI a
ppro
ved
Nat
iona
l Ins
titu
te
of S
ecur
itie
s M
arke
ts (
NIS
M)
Seri
es I
– Cu
rren
cy
Der
ivat
ives
Ce
rtifi
cati
on
Exam
inat
ion
Prop
riet
or/T
wo
Part
ners
/Tw
o di
rect
ors
shou
ld
be H
SC.
Dea
lers
sho
uld
also
hav
e pa
ssed
SE
BI a
ppro
ved
Nat
iona
l Ins
titu
te
of S
ecur
itie
s M
arke
ts (
NIS
M)
Seri
es I
– Cu
rren
cy
Der
ivat
ives
Ce
rtifi
cati
on
Exam
inat
ion
Prop
riet
or/T
wo
Part
ners
/Tw
o di
rect
ors
shou
ld
be H
SC.
Dea
lers
sho
uld
also
hav
e pa
ssed
SE
BI a
ppro
ved
Nat
iona
l Ins
titu
te
of S
ecur
itie
s M
arke
ts (
NIS
M)
Seri
es I
– Cu
rren
cy
Der
ivat
ives
Ce
rtifi
cati
on
Exam
inat
ion
Expe
rien
ce--
----
----
----
-Tw
o ye
ar's
expe
rien
ce in
sec
urit
ies
mar
ket-
----
----
----
----
----
--
Oth
er e
ligib
ility
cri
teri
aPr
opri
etor
/Par
tner
s/D
irec
tors
/Sha
reho
ldre
s sh
ould
not
be
defa
ulte
rs o
n an
y st
ock
exch
ange
and
mus
t no
t be
deb
arre
d by
SEB
I fo
r be
ing
asso
ciat
ed w
ith
capi
tal
mar
ket
as i
nter
med
iari
es.
The
app
lican
t m
ust
be e
ngag
ed s
olel
y in
the
bus
ines
s of
sec
urit
ies
and
mus
t no
t be
en
gage
d in
any
fun
d-ba
sed
acti
vity
.*
* In
add
itio
n to
the
ind
ivid
uals
, co
rpor
ates
and
par
tner
ship
firm
s, B
anks
whi
ch a
re a
utho
rize
d by
the
Res
erve
Ban
k of
Ind
ia u
nder
sec
tion
10
of t
he F
orei
gn E
xcha
nge
Man
agem
ent
Act,
199
9 as
‘AD
Ca
tego
ry-
I ban
k’ a
re p
erm
itte
d to
bec
ome
trad
ing
and
clea
ring
mem
bers
of
the
curr
ency
der
ivat
ives
mar
ket
of t
he r
ecog
nize
d st
ock
exch
ange
s, o
n th
eir
own
acco
unt
and
on b
ehal
f o
f th
eir
clie
nts,
su
bjec
t to
min
imum
pru
dent
ial
requ
irem
ents
of
min
imum
net
wor
th o
f `
500
cror
es,
min
imum
CRA
R of
10
per
cent
, ne
t N
PA n
ot e
xcee
ding
3 p
er c
ent
and
net
profi
t sh
ould
hav
e be
en m
ade
for
the
last
3 y
ears
.
The
AD C
ateg
ory-
I ba
nks
whi
ch f
ulfil
l th
e pr
uden
tial
re
quir
emen
ts a
re r
equi
red
to l
ay d
own
deta
iled
guid
elin
es w
ith
the
appr
oval
of
thei
r Bo
ards
for
tra
ding
and
cle
arin
g of
cur
renc
y de
riva
tive
s co
ntra
cts
and
man
agem
ent
of r
isks
. AD
Cat
egor
y-I b
anks
whi
ch d
o no
t m
eet
the
abov
e m
inim
um p
rude
ntia
l re
quir
emen
ts a
nd A
D C
ateg
ory
- I b
anks
whi
ch a
re U
rban
Co-
oper
ativ
e ba
nks
or S
tate
Co-
oper
ativ
e ba
nks
can
part
icip
ate
in t
he c
urre
ncy
deri
vati
ves
mar
ket
only
as
clie
nts,
sub
ject
to
appr
oval
the
refo
re f
rom
the
res
pect
ive
regu
lato
ry D
epar
tmen
ts o
f th
e Re
serv
e Ba
nk.
In c
ase
the
mem
ber
is o
ptin
g fo
r m
embe
rshi
p of
any
oth
er s
egm
ent(
s) in
com
bina
tion
wit
h th
e m
embe
rshi
p of
Cur
renc
y D
eriv
ativ
es s
egm
ent,
the
app
licab
le n
et w
orth
will
be
the
min
imum
net
wor
th
requ
ired
for
the
oth
er s
egm
ent(
s) o
r th
e m
inim
um n
et w
orth
req
uire
d fo
r Cu
rren
cy D
eriv
ativ
es S
egm
ent,
whi
chev
er is
hig
her.
The
elig
ibili
ty c
ondi
tion
for
app
lican
ts p
lann
ing
to a
pply
for
new
mem
bers
hip
of t
he E
xcha
nge
is t
hat
eith
er t
he p
ropr
ieto
r/on
e de
sign
ated
dir
ecto
r/pa
rtne
r or
the
Com
plia
nce
Offi
cer
of t
he a
pplic
ant
enti
ty s
houl
d be
suc
cess
fully
cer
tifie
d ei
ther
in S
ecur
itie
s M
arke
t (B
asic
) M
odul
e or
Com
plia
nce
Offi
cers
(Br
oker
s) M
odul
e or
the
rel
evan
t m
odul
e pe
rtai
ning
to
the
segm
ents
whe
rein
mem
bers
hip
of
the
Exch
ange
had
bee
n so
ught
.
11
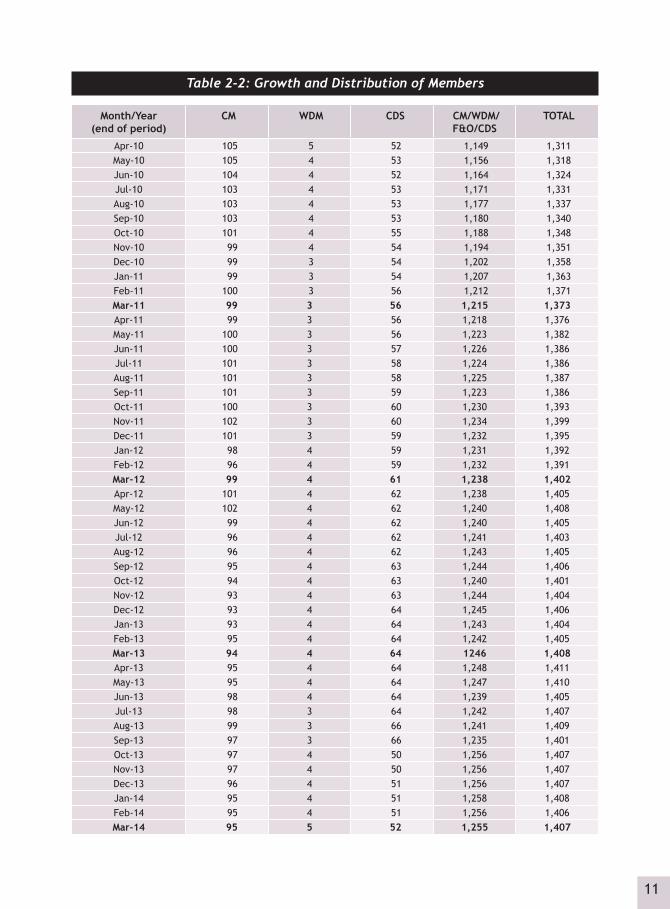
Table 2-2: Growth and Distribution of Members
Month/Year (end of period)
CM WDM CDS CM/WDM/F&O/CDS
TOTAL
Apr-10 105 5 52 1,149 1,311 May-10 105 4 53 1,156 1,318 Jun-10 104 4 52 1,164 1,324 Jul-10 103 4 53 1,171 1,331 Aug-10 103 4 53 1,177 1,337 Sep-10 103 4 53 1,180 1,340 Oct-10 101 4 55 1,188 1,348 Nov-10 99 4 54 1,194 1,351 Dec-10 99 3 54 1,202 1,358 Jan-11 99 3 54 1,207 1,363 Feb-11 100 3 56 1,212 1,371 Mar-11 99 3 56 1,215 1,373Apr-11 99 3 56 1,218 1,376May-11 100 3 56 1,223 1,382Jun-11 100 3 57 1,226 1,386Jul-11 101 3 58 1,224 1,386Aug-11 101 3 58 1,225 1,387Sep-11 101 3 59 1,223 1,386Oct-11 100 3 60 1,230 1,393Nov-11 102 3 60 1,234 1,399Dec-11 101 3 59 1,232 1,395Jan-12 98 4 59 1,231 1,392Feb-12 96 4 59 1,232 1,391Mar-12 99 4 61 1,238 1,402Apr-12 101 4 62 1,238 1,405May-12 102 4 62 1,240 1,408Jun-12 99 4 62 1,240 1,405Jul-12 96 4 62 1,241 1,403Aug-12 96 4 62 1,243 1,405Sep-12 95 4 63 1,244 1,406Oct-12 94 4 63 1,240 1,401Nov-12 93 4 63 1,244 1,404Dec-12 93 4 64 1,245 1,406Jan-13 93 4 64 1,243 1,404Feb-13 95 4 64 1,242 1,405Mar-13 94 4 64 1246 1,408Apr-13 95 4 64 1,248 1,411May-13 95 4 64 1,247 1,410Jun-13 98 4 64 1,239 1,405Jul-13 98 3 64 1,242 1,407Aug-13 99 3 66 1,241 1,409Sep-13 97 3 66 1,235 1,401Oct-13 97 4 50 1,256 1,407Nov-13 97 4 50 1,256 1,407Dec-13 96 4 51 1,256 1,407Jan-14 95 4 51 1,258 1,408Feb-14 95 4 51 1,256 1,406Mar-14 95 5 52 1,255 1,407

12

Listing of Securities 3

14

15
3Listing of Securities
Table 3-1: Listing Criteria for Companies on the CM Segment of NSE
Criteria Initial Public Offerings (IPOs) Companies listed on other exchanges
Paid-up Equity Capital (PUEC)/Market Capitalisation (MC) /Net Worth
PUEC ≥ ` 10 Crores and MC ≥ ` 25 Crores
PUEC ≥ ` 10 Crores and MC ≥ ` 25 Crores OR PUEC ≥ ` 25 Crores OR MC ≥ ` 50 Crores OR The company shall have a net worth of not less than `50 crores in each of the preceding three financial year
Company/Promoter's Track Record
Atleast 3 years track record of either(a) the applicant seeking listing OR (b) the promoters/promoting company
incorporated in or outside India OR (c) Partnership firm and subsequently
converted into Company not in existence as a Company for three years) and approaches the Exchange for listing. The Company subsequently formed would be considered for listing only on fulfillment of conditions stipulated by SEBI in this regard.
Atleast three years track record of either(a) the applicant seeking listing; OR(b) the promoters/promoting company,
incorporated in or outside India.
Dividend Record / Net worth / Distributable Profits
-- Dividend paid in at least 2 out of the last 3 financial years immediately preceding the year in which the application has been made OR The networth of the applicants atleast `50 crores OR The applicant has distributable profits in at least two out of the last three financial year
Listing Listed on any other stock exchange for at least last three years OR listed on the exchange having nationwide trading terminals for at least one year.
Other Requirements
(a) No disciplinary action by other stock exchanges/regulatory authority in past 3 years
(b) Satisfactory redressal mechanism for investor grievances,
(c) distribution of shareholding (d) details of litigation record in past
3 years(e) Track record of Directors of the
Company
(a) No disciplinary action by other stock exchanges/regulatory authority in past 3 years
(b) Satisfactory redressal mechanism for investor grievances,
(c) distribution of shareholding and (d) details of llitigation record in past
3 years(e) Track record of Directors of the Company(f) Change in control of a Company/
Utilisation of funds raised from public
Note:
1. (a) In case of IPOs, Paid up Equity Capital means post issue paid up equity capital.
(b) In case of Existing companies listed on other exchanges, the existing paid up equity capital as well as the paid up equity capital after the proposed issue for which listing is sought shall be taken into account.
2. (a) In case of IPOs, market capitalisation is the product of the issue price and the post-issue number of equity shares.
(b) In case of case of Existing companies listed on other stock exchanges the market capitalisation shall be calculated by using a

16
12 month moving average of the market capitalisation over a period of six months immediately preceding the date of application. For the purpose of calculating the market capitalisation over a 12 month period, the average of the weekly high and low of the closing prices of the shares as quoted on the National Stock Exchange during the last twelve months and if the shares are not traded on the National Stock Exchange such average price on any of the recognised Stock Exchanges where those shares are frequently traded shall be taken into account while determining market capitalisation after making necessary adjustments for Corporate Action such as Rights / Bonus Issue/Split.
3. In case of Existing companies listed on other stock exchanges, the requirement of `25 crores market capital shall not be applicable to listing of securities issued by Government Companies, Public Sector Undertakings, Financial Institutions, Nationalised Banks, Statutory Corporations and Banking Companies who are otherwise bound to adhere to all the relevant statutes, guidelines, circulars, clarifications etc. that may be issued by various regulatory authorities from time to time
4. Net worth means paid-up equity capital + reserves excluding revaluation reserve - miscellaneous expenses not written off - negative balance in profit and loss account to the extent not set off.
5. Promoters mean one or more persons with minimum 3 years of experience of each of them in the same line of business and shall be holding at least 20 % of the post issue equity share capital individually or severally.
6. In case a company approaches the Exchange for listing within six months of an IPO, the securities may be considered as eligible for listing if they were otherwise eligible for listing at the time of the IPO. If the company approaches the Exchange for listing after six months of an IPO, the norms for existing listed companies may be applied and market capitalisation be computed based on the period from the IPO to the time of listing.
Table 3-2: Listing fees in the CM segment
Particulars Amount (`)
Initial Listing fees 50,000
Annual Listing fees (on paid-up share, bond and/ or debenture and/or debt capital, etc.)
a) Upto ` 5 Crores 18,000
b) Above ` 5 Crores and upto ` 10 Crores 31,500
c) Above ` 10 Crores and upto ` 20 Crores 57,500
d) Above ` 20 Crores and upto ` 30 Crores 90,000
e) Above ` 30 Crores and upto ` 40 Crores 1,00,000
f) Above ` 40 Crores and upto ` 50 Crores 1,05,000
g) Above ` 50 Crores and upto ` 100 Crores 1,75,000
h) Above ` 100 Crores and upto ` 150 Crores 2,00,000
i) Above ` 150 Crores and upto ` 200 Crores 2,40,000
j) Above ` 200 Crores and upto ` 250 Crores 2,75,000
k) Above ` 250 Crores and upto ` 300 Crores 3,10,000
l) Above ` 300 Crores and upto ` 350 Crores 3,40,000
m) Above ` 350 Crores and upto ` 400 Crores 3,75,000
n) Above ` 400 Crores and upto ` 450 Crores 4,35,000
o) Above ` 450 Crores and upto ` 500 Crores 5,00,000
Companies which have a paid up share, bond and/or debenture and/or debt capital, etc of more than `500 crores will have to pay a minimum fees of `5,00,000/- and an additional listing fees of `3,400/- for every increase of `5 crores or part thereof in the paid up share, bond and/ debenture and/or debt capital etc.
Companies which have a paid up share, bond and/or debenture and/or debt capital, etc. of more than `1,000 crores will have to pay minimum fees of `8,50,000/- and an additional listing fees of `3,700/- for every increase of `5 crores or part thereof in the paid up share, bond and/or debenture and/or debt capital etc
17
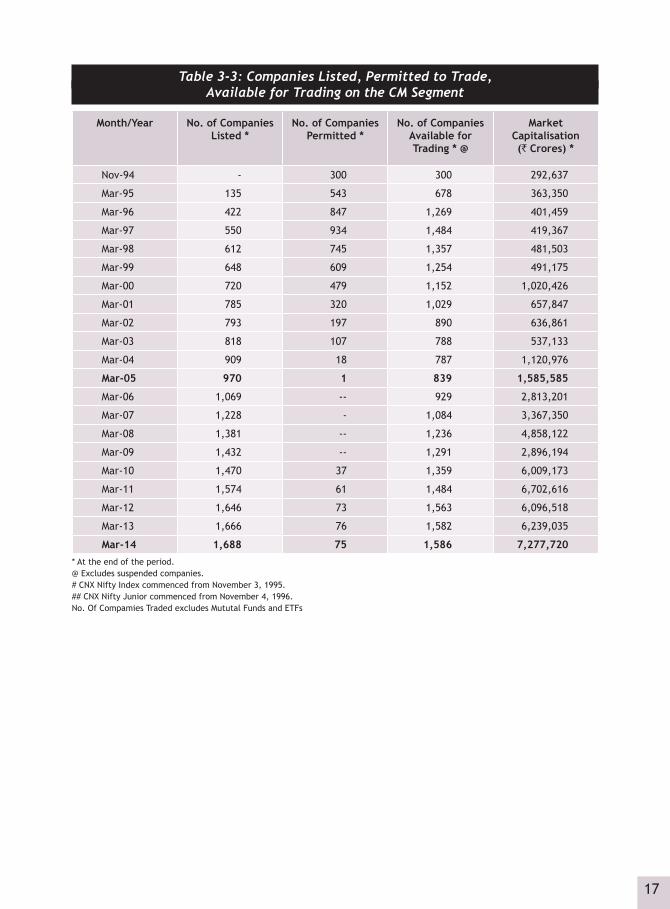
Table 3-3: Companies Listed, Permitted to Trade, Available for Trading on the CM Segment
Month/Year No. of Companies Listed *
No. of Companies Permitted *
No. of Companies Available for Trading * @
Market Capitalisation (` Crores) *
Nov-94 - 300 300 292,637
Mar-95 135 543 678 363,350
Mar-96 422 847 1,269 401,459
Mar-97 550 934 1,484 419,367
Mar-98 612 745 1,357 481,503
Mar-99 648 609 1,254 491,175
Mar-00 720 479 1,152 1,020,426
Mar-01 785 320 1,029 657,847
Mar-02 793 197 890 636,861
Mar-03 818 107 788 537,133
Mar-04 909 18 787 1,120,976
Mar-05 970 1 839 1,585,585
Mar-06 1,069 -- 929 2,813,201
Mar-07 1,228 - 1,084 3,367,350
Mar-08 1,381 -- 1,236 4,858,122
Mar-09 1,432 -- 1,291 2,896,194
Mar-10 1,470 37 1,359 6,009,173
Mar-11 1,574 61 1,484 6,702,616
Mar-12 1,646 73 1,563 6,096,518
Mar-13 1,666 76 1,582 6,239,035
Mar-14 1,688 75 1,586 7,277,720* At the end of the period. @ Excludes suspended companies. # CNX Nifty Index commenced from November 3, 1995. ## CNX Nifty Junior commenced from November 4, 1996. No. Of Compamies Traded excludes Mututal Funds and ETFs
18
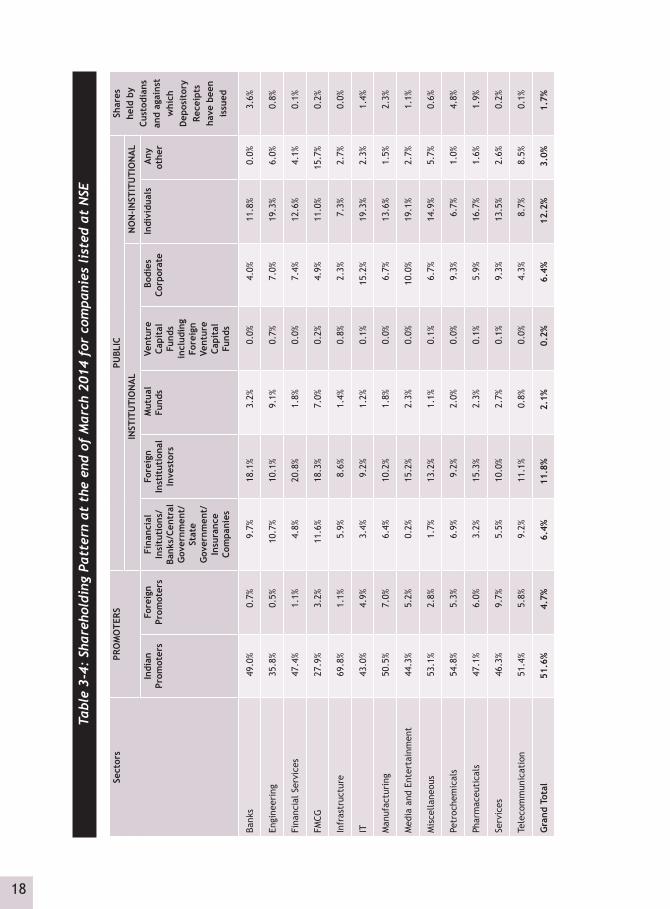
Tabl
e 3-
4: S
hare
hold
ing
Patt
ern
at t
he e
nd o
f M
arch
201
4 fo
r co
mpa
nies
lis
ted
at N
SE
Sect
ors
PRO
MO
TERS
PUBL
ICSh
ares
he
ld b
y Cu
stod
ians
an
d ag
ains
t w
hich
D
epos
itor
y Re
ceip
ts
have
bee
n is
sued
INST
ITU
TIO
NA
LN
ON
-IN
STIT
UTI
ON
AL
Indi
an
Prom
oter
s Fo
reig
n Pr
omot
ers
Fina
ncia
l In
situ
tion
s/Ba
nks/
Cent
ral
Gov
ernm
ent/
Stat
e G
over
nmen
t/In
sura
nce
Com
pani
es
Fore
ign
Inst
itut
iona
l In
vest
ors
Mut
ual
Fund
s Ve
ntur
e Ca
pita
l Fu
nds
incl
udin
g Fo
reig
n Ve
ntur
e Ca
pita
l Fu
nds
Bod
ies
Corp
orat
eIn
divi
dual
s A
ny
othe
r
Bank
s 49
.0%
0.7%
9.7%
18.1
%3.
2%0.
0%4.
0%11
.8%
0.0%
3.6%
Engi
neer
ing
35.8
%0.
5%10
.7%
10.1
%9.
1%0.
7%7.
0%19
.3%
6.0%
0.8%
Fina
ncia
l Ser
vice
s 47
.4%
1.1%
4.8%
20.8
%1.
8%0.
0%7.
4%12
.6%
4.1%
0.1%
FMCG
27
.9%
3.2%
11.6
%18
.3%
7.0%
0.2%
4.9%
11.0
%15
.7%
0.2%
Infr
astr
uctu
re
69.8
%1.
1%5.
9%8.
6%1.
4%0.
8%2.
3%7.
3%2.
7%0.
0%
IT
43.0
%4.
9%3.
4%9.
2%1.
2%0.
1%15
.2%
19.3
%2.
3%1.
4%
Man
ufac
turi
ng
50.5
%7.
0%6.
4%10
.2%
1.8%
0.0%
6.7%
13.6
%1.
5%2.
3%
Med
ia a
nd E
nter
tain
men
t 44
.3%
5.2%
0.2%
15.2
%2.
3%0.
0%10
.0%
19.1
%2.
7%1.
1%
Mis
cella
neou
s 53
.1%
2.8%
1.7%
13.2
%1.
1%0.
1%6.
7%14
.9%
5.7%
0.6%
Petr
oche
mic
als
54.8
%5.
3%6.
9%9.
2%2.
0%0.
0%9.
3%6.
7%1.
0%4.
8%
Phar
mac
euti
cals
47
.1%
6.0%
3.2%
15.3
%2.
3%0.
1%5.
9%16
.7%
1.6%
1.9%
Serv
ices
46
.3%
9.7%
5.5%
10.0
%2.
7%0.
1%9.
3%13
.5%
2.6%
0.2%
Tele
com
mun
icat
ion
51.4
%5.
8%9.
2%11
.1%
0.8%
0.0%
4.3%
8.7%
8.5%
0.1%
Gra
nd T
otal
51.6
%4.
7%6.
4%11
.8%
2.1%
0.2%
6.4%
12.2
%3.
0%1.
7%

19
Table 3-5: Pledged shares data as of March 2014
Sector Classification Indian Promoters
Foreign Promoters
Total Promoters Holding
%age of promoters' ownership pledged
Banks 49.0% 0.7% 49.7% 0.1%
Engineering 35.8% 0.5% 36.3% 11.2%
Financial Services 47.4% 1.1% 48.4% 7.6%
FMCG 27.9% 3.2% 31.1% 11.7%
Infrastructure 69.8% 1.1% 70.9% 14.7%
Information Technology 43.0% 4.9% 47.9% 11.2%
Manufacturing 50.5% 7.0% 57.5% 18.1%
Media and Entertainment 44.3% 5.2% 49.4% 24.9%
Miscellaneous 53.1% 2.8% 55.9% 12.6%
Petrochemicals 54.8% 5.3% 60.1% 8.7%
Pharmaceuticals 47.1% 6.0% 53.1% 5.4%
Services 46.3% 9.7% 56.1% 25.5%
Telecommunication 51.4% 5.8% 57.3% 12.8%
Total 51.6% 4.7% 56.3% 14.2%
Table 3-6: Eligibility criteria for securities on WDM segment
The security proposed for listing on the WDM segment of NSE should comply with the requirements as indicated hereunder:
Issuer Eligibility Criteria for listing
Public Issue /Private Placement
Non-Structured Product/ Non-Market Linked Debentures
Structured Product / Market Linked Debentures
Corporates (Public limited companies and Private limited companies)
• Paid-up capital of `10 crores; or
Market capitalisation of `25 crores (In case of unlisted companies Networth more than `25 crores)
• Credit rating
• Networth of `100 crores • Credit Rating prefix of ‘PP-MLD’
denoting Principal protected market linked debentures followed by the standardized rating symbols
Public Sector Undertaking, Statutory Corporation established/ constituted under Special Act of Parliament /State Legislature, Local bodies/authorities,
• Credit rating • Qualifies for listing under
the respective Acts, Rules or Regulations under which the securities are issued.
• Networth of `100 crores • Credit Rating prefix of ‘PP-MLD’
denoting Principal protected market linked debentures followed by the standardized rating symbols
• Qualifies for listing under the respective Acts, Rules or Regulations under which the securities are issued.
Contd...

20
Issuer Eligibility Criteria for listing
Public Issue /Private Placement
Non-Structured Product/ Non-Market Linked Debentures
Structured Product / Market Linked Debentures
Mutual Funds: Units of any SEBI registered Mutual Fund/scheme: Investment objective to invest predominantly in debt or Scheme is traded in secondary market as debt instrument
Qualifies for listing under the respective Acts, Rules or Regulations under which the securities are issued.
• Networth of `100 crores • Credit Rating prefix of ‘PP-MLD’
denoting Principal protected market linked debentures followed by the standardized rating symbols
• Qualifies for listing under the respective Acts, Rules or Regulations under which the securities are issued.
Infrastructure companies : Tax exemption and recognition as infrastructure company under related statutes/regulations
• Credit rating• Qualifies for listing under
the respective Acts, Rules or Regulations under which the securities are issued.
• Networth of `100 crores • Credit Rating prefix of ‘PP-MLD’
denoting Principal protected market linked debentures followed by the standardized rating symbols
• Qualifies for listing under the respective Acts, Rules or Regulations under which the securities are issued.
Financial Institutions u/s. 4A of Companies Act, 1956 including Industrial Development Corporations
• Qualifies for listing under the respective Acts, Rules or Regulations under which the securities are issued.
• Credit rating
• Networth of `100 crores• Credit Rating prefix of ‘PP-MLD’
denoting Principal protected market linked debentures followed by the standardized rating symbols
• Qualifies for listing under the respective Acts, Rules or Regulations under which the securities are issued.
Banks Scheduled banks • Networth of `50 crores or above• Qualifies for listing under
the respective Acts, Rules or Regulations under which the securities are issued
Scheduled banks • Networth of `100 crores• Credit Rating prefix of ‘PP-MLD’
denoting Principal protected market linked debentures followed by the standardized rating symbols
• Qualifies for listing under the respective Acts, Rules or Regulations under which the securities are issued.
An Issuer shall ensure compliance with SEBI circulars/guidelines and any other law, guidelines/directions of Central Government, other Statutory or local authority issued on regulating the listing of debt instruments from time to time
Contd...
21
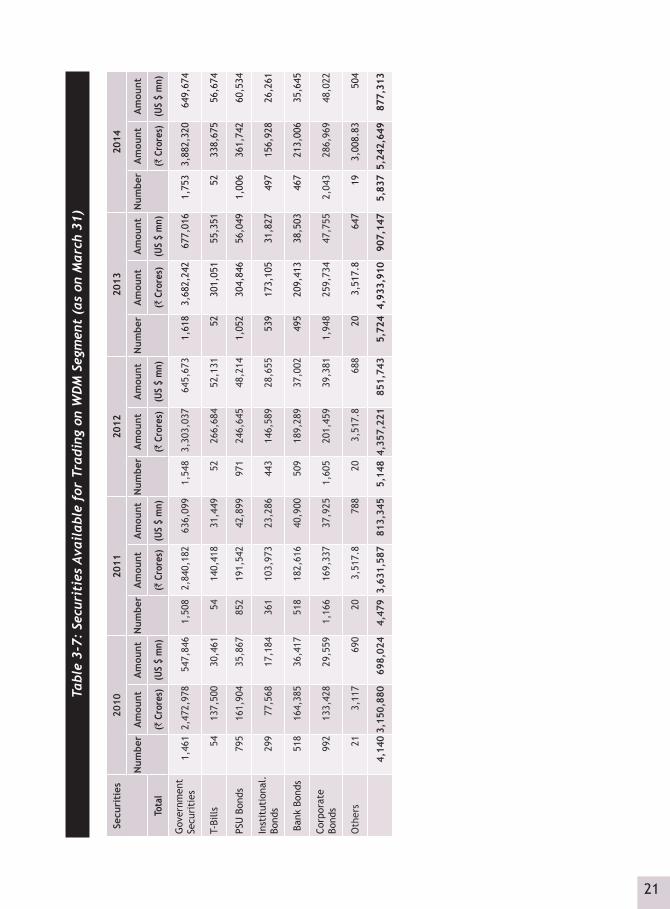
Tabl
e 3-
7: S
ecur
itie
s Av
aila
ble
for
Trad
ing
on W
DM
Seg
men
t (a
s on
Mar
ch 3
1)
Secu
riti
es20
1020
1120
1220
1320
14
Num
ber
Am
ount
Am
ount
Num
ber
Am
ount
Am
ount
Num
ber
Am
ount
Am
ount
Num
ber
Am
ount
Am
ount
Num
ber
Am
ount
Am
ount
Tota
l(`
Cro
res)
(US
$ m
n)(`
Cro
res)
(US
$ m
n)(`
Cro
res)
(US
$ m
n)(`
Cro
res)
(US
$ m
n)(`
Cro
res)
(US
$ m
n)
Gov
ernm
ent
Secu
riti
es1,
461
2,47
2,97
854
7,84
61,
508
2,84
0,18
263
6,09
91,
548
3,30
3,03
764
5,67
31,
618
3,68
2,24
267
7,01
61,
753
3,88
2,32
064
9,67
4
T-Bi
lls
5413
7,50
030
,461
5414
0,41
831
,449
5226
6,68
452
,131
5230
1,05
155
,351
5233
8,67
556
,674
PSU
Bon
ds79
516
1,90
435
,867
852
191,
542
42,8
9997
124
6,64
548
,214
1,05
230
4,84
656
,049
1,00
636
1,74
260
,534
Inst
itut
iona
l.
Bond
s29
977
,568
17,1
8436
110
3,97
323
,286
443
146,
589
28,6
5553
917
3,10
531
,827
497
156,
928
26,2
61
Ban
k Bo
nds
518
164,
385
36,4
1751
818
2,61
640
,900
509
189,
289
37,0
0249
520
9,41
338
,503
467
213,
006
35,6
45
Corp
orat
e
Bond
s99
213
3,42
829
,559
1,16
616
9,33
737
,925
1,60
520
1,45
939
,381
1,94
825
9,73
447
,755
2,04
328
6,96
948
,022
Oth
ers
213,
117
690
203,
517.
878
820
3,51
7.8
688
203,
517.
864
719
3,00
8.83
504
4,14
03,
150,
880
698,
024
4,47
93,
631,
587
813,
345
5,14
84,
357,
221
851,
743
5,72
44,
933,
910
907,
147
5,83
75,
242,
649
877,
313
22
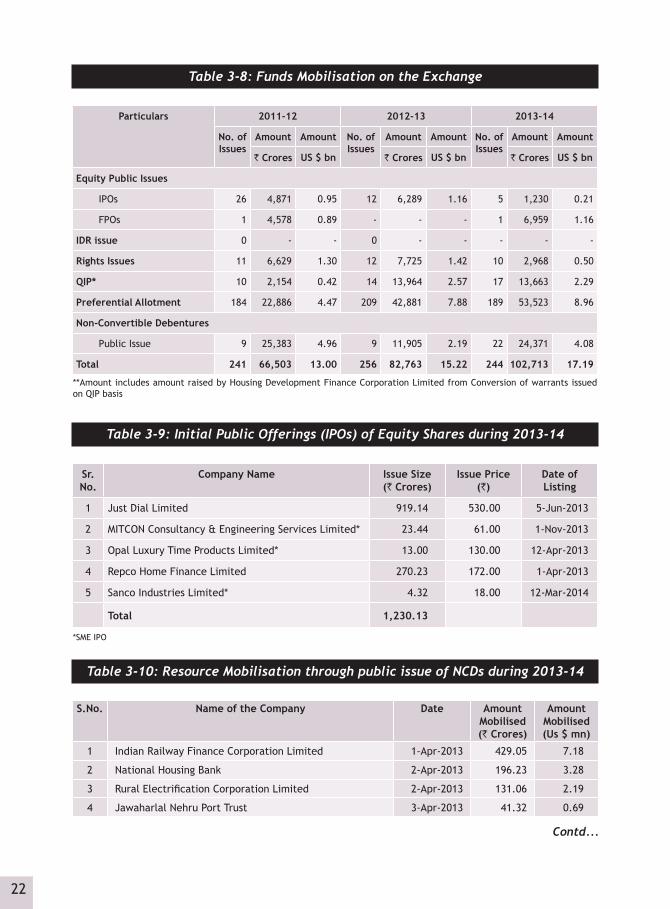
Table 3-8: Funds Mobilisation on the Exchange
Particulars 2011-12 2012-13 2013-14
No. of Issues
Amount Amount No. of Issues
Amount Amount No. of Issues
Amount Amount
` Crores US $ bn ` Crores US $ bn ` Crores US $ bn
Equity Public Issues
IPOs 26 4,871 0.95 12 6,289 1.16 5 1,230 0.21
FPOs 1 4,578 0.89 - - - 1 6,959 1.16
IDR issue 0 - - 0 - - - - -
Rights Issues 11 6,629 1.30 12 7,725 1.42 10 2,968 0.50
QIP* 10 2,154 0.42 14 13,964 2.57 17 13,663 2.29
Preferential Allotment 184 22,886 4.47 209 42,881 7.88 189 53,523 8.96
Non-Convertible Debentures
Public Issue 9 25,383 4.96 9 11,905 2.19 22 24,371 4.08
Total 241 66,503 13.00 256 82,763 15.22 244 102,713 17.19
**Amount includes amount raised by Housing Development Finance Corporation Limited from Conversion of warrants issued on QIP basis
Table 3-9: Initial Public Offerings (IPOs) of Equity Shares during 2013-14
Sr. No.
Company Name Issue Size (` Crores)
Issue Price(`)
Date of Listing
1 Just Dial Limited 919.14 530.00 5-Jun-2013
2 MITCON Consultancy & Engineering Services Limited* 23.44 61.00 1-Nov-2013
3 Opal Luxury Time Products Limited* 13.00 130.00 12-Apr-2013
4 Repco Home Finance Limited 270.23 172.00 1-Apr-2013
5 Sanco Industries Limited* 4.32 18.00 12-Mar-2014
Total 1,230.13
*SME IPO
Table 3-10: Resource Mobilisation through public issue of NCDs during 2013-14
S.No. Name of the Company Date Amount Mobilised (` Crores)
Amount Mobilised (Us $ mn)
1 Indian Railway Finance Corporation Limited 1-Apr-2013 429.05 7.18
2 National Housing Bank 2-Apr-2013 196.23 3.28
3 Rural Electrification Corporation Limited 2-Apr-2013 131.06 2.19
4 Jawaharlal Nehru Port Trust 3-Apr-2013 41.32 0.69
Contd...

23
S.No. Name of the Company Date Amount Mobilised (` Crores)
Amount Mobilised (Us $ mn)
5 Housing & Urban Development Corporation Limited 3-Apr-2013 207.01 3.46
6 Shriram Transport Finance Company Limited 7-Aug-2013 735.89 12.31
7 India Infoline Finance Limited 8-Oct-2013 1,050.00 17.57
8 Rural Electrification Corporation Limited 30-Oct-2013 3,440.60 57.58
9 Shriram Transport Finance Company Limited 29-Oct-2013 500.00 8.37
10 NHPC Limited 7-Nov-2013 1,000.00 16.73
11 NTPC Limited 19-Dec-2013 1,750.00 29.28
12 India Infoline Housing Finance Limited 1-Jan-2014 500.00 8.37
13 Shriram City Union Finance Limited 8-Jan-2014 153.61 2.57
14 National Housing Bank 16-Jan-2014 2,100.00 35.14
15 National Highways Authority of India 10-Feb-2014 3,698.40 61.89
16 ECL Finance Limited 12-Feb-2014 500.00 8.37
17 SREI Infrastructure Finance Limited 13-Feb-2014 100.00 1.67
18 Indian Railway Finance Corporation Limited 21-Feb-2014 4,083.12 68.33
19 Indian Renewable Energy Development Agency Limited 19-Mar-2014 721.65 12.08
20 TATA Capital Financial Services Limited 22-Mar-2014 288.18 4.82
21 National Housing Bank 26-Mar-2014 1,000.00 16.73
22 Indian Railway Finance Corporation Limited 28-Mar-2014 1,745.22 29.20
Total 24,371.36 407.83
Table 3-11: Rights Issues during 2013-14
S.No. Company Name Date of Listing
Amount Mobilised(` Crores)
Amount Mobilised(US $ mn)
1 Alok Industries Limited 13-May-2013 550.85 9.22
2 Asahi India Glass Limited 20-Sep-2013 249.49 4.17
3 Godrej Properties Limited 24-Sep-2013 700.00 11.71
4 Hitachi Home and Life Solutions (India) Limited 11-Apr-2013 55.00 0.92
5 Kesoram Industries Limited 3-Jul-2013 416.18 6.96
6 Kokuyo Camlin Limited 6-Sep-2013 103.24 1.73
7 Mukand Limited 21-Mar-2014 143.41 2.40
8 Reliance MediaWorks Limited 19-Sep-2013 588.33 9.85
9 Uniphos Enterprises Limited 8-Nov-2013 74.92 1.25
10 Wheels India Limited 27-Mar-2014 86.51 1.45
Total 2,967.93 49.67
Contd...

24
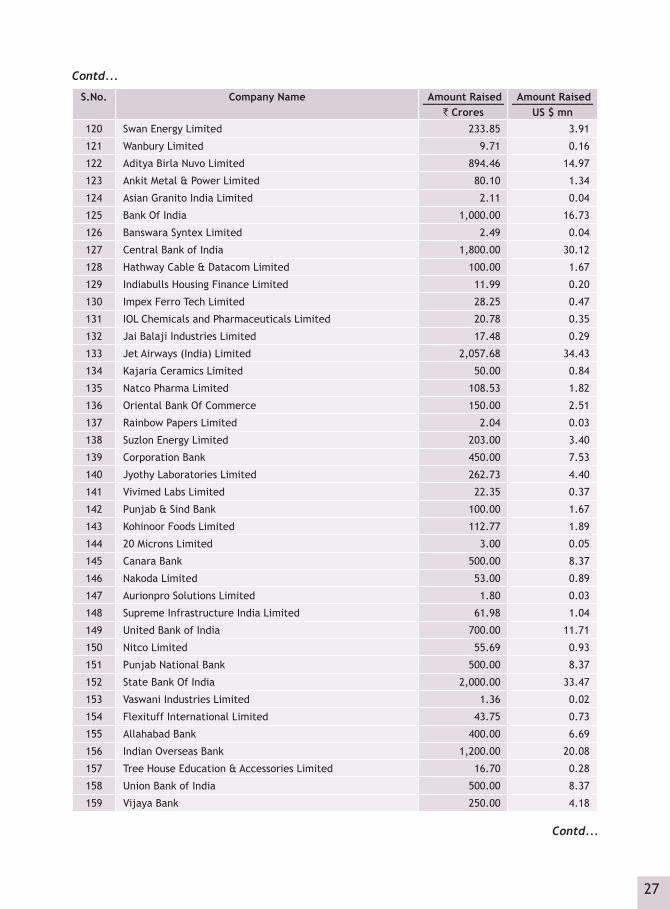
Table 3-12: Preferential Allotments by NSE Listed Companies during 2013-14
S.No. Company Name Amount Raised_____________ ` Crores
Amount Raised_____________ US $ mn
1 Corporation Bank 204.00 3.41
2 FCS Software Solutions Limited 23.00 0.38
3 Central Bank of India 2,406.00 40.26
4 State Bank Of India 3,004.00 50.27
5 IDBI Bank Limited 555.00 9.29
6 Punjab National Bank 1,248.00 20.88
7 Bank Of Baroda 850.00 14.22
8 R. S. Software (India) Limited 2.93 0.05
9 United Bank of India 100.00 1.67
10 Flexituff International Limited 27.00 0.45
11 Ramkrishna Forgings Limited 37.50 0.63
12 Autolite (India) Limited 1.90 0.03
13 Indian Overseas Bank 1,000.00 16.73
14 Astec LifeSciences Limited 3.79 0.06
15 Aditya Birla Nuvo Limited 608.45 10.18
16 Union Bank of India 1,114.00 18.64
17 20 Microns Limited 13.50 0.23
18 Orient Green Power Company Limited 150.00 2.51
19 Kesar Enterprises Limited 3.85 0.06
20 ANG Industries Limited 2.84 0.05
21 Jayaswal Neco Industries Limited 270.00 4.52
22 Bank of Maharashtra 406.00 6.79
23 Capital First Limited 50.00 0.84
24 MSP Steel & Power Limited 120.00 2.01
25 Murudeshwar Ceramics Limited 3.29 0.06
26 Shrenuj & Company Limited 135.06 2.26
27 Jindal Stainless Limited 100.27 1.68
28 GTL Infrastructure Limited 0.74 0.01
29 IFB Agro Industries Limited 18.16 0.30
30 Kwality Dairy (India) Limited 5.00 0.08
31 The Sirpur Paper Mills Limited 2.39 0.04
32 Suzlon Energy Limited 581.67 9.73
33 Helios And Matheson Information Technology Limited 3.66 0.06
34 Godawari Power And Ispat limited 13.00 0.22
35 GTL Limited 0.93 0.02
36 Kotak Mahindra Bank Limited 1,296.00 21.69
37 Pioneer Embroideries Limited 3.50 0.06
38 Pioneer Embroideries Limited 6.18 0.10
39 JVL Agro Industries Limited 52.25 0.87
Contd...

25
S.No. Company Name Amount Raised_____________ ` Crores
Amount Raised_____________ US $ mn
40 Emmbi Polyarns Limited 2.04 0.03
41 Shriram City Union Finance Limited 162.45 2.72
42 DCW Limited 1.68 0.03
43 Deep Industries Limited 10.45 0.17
44 Rainbow Papers Limited 12.15 0.20
45 SHREE GANESH JEWELLERY HOUSE (I) LIMITED 62.16 1.04
46 Uttam Value Steels Limited 226.95 3.80
47 Aurionpro Solutions Limited 15.75 0.26
48 Dhanlaxmi Bank Limited 35.40 0.59
49 United Spirits Limited 2,092.72 35.02
50 3i Infotech Limited 17.63 0.30
51 Next Mediaworks Limited 6.00 0.10
52 Metkore Alloys & Industries Limited 18.00 0.30
53 Adani Power Limited 2,542.11 42.54
54 APL Apollo Tubes Limited 5.58 0.09
55 Paramount Communications Limited 7.41 0.12
56 Kesar Enterprises Limited 4.39 0.07
57 Fortis Healthcare Limited 186.62 3.12
58 Gujarat NRE Coke Limited 10.54 0.18
59 Shasun Pharmaceuticals Limited 11.25 0.19
60 Spentex Industries Limited 1.40 0.02
61 Bharti Airtel Limited 6,795.58 113.72
62 3i Infotech Limited 0.76 0.01
63 Aurionpro Solutions Limited 4.64 0.08
64 Bharati Shipyard Limited 53.52 0.90
65 Duncans Industries Limited 34.22 0.57
66 Gallantt Ispat Limited 40.00 0.67
67 ING Vysya Bank Limited 955.06 15.98
68 Moser-Baer (I) Limited 20.00 0.33
69 SHREE GANESH JEWELLERY HOUSE (I) LIMITED 87.00 1.46
70 Sree Rayalaseema Hi-Strength Hypo Limited 1.33 0.02
71 Vardhman Polytex Limited 10.51 0.18
72 Venus Remedies Limited 16.98 0.28
73 Wanbury Limited 10.09 0.17
74 CEAT Limited 14.56 0.24
75 Helios And Matheson Information Technology Limited 3.66 0.06
76 Indiabulls Housing Finance Limited 373.87 6.26
77 Kaushalya Infrastructure Development Corporation Limited 16.53 0.28
78 KEI Industries Limited 4.90 0.08
79 Murudeshwar Ceramics Limited 3.46 0.06
Contd...
Contd...

26
S.No. Company Name Amount Raised_____________ ` Crores
Amount Raised_____________ US $ mn
80 Pipavav Defence and Offshore Engineering Company Limited 81.90 1.37
81 Pipavav Defence and Offshore Engineering Company Limited 200.96 3.36
82 Southern Petrochemicals Industries Corporation Limited 52.19 0.87
83 Suzlon Energy Limited 130.54 2.18
84 Vaswani Industries Limited 1.30 0.02
85 AI Champdany Industries Limited 5.50 0.09
86 APL Apollo Tubes Limited 16.17 0.27
87 Aurionpro Solutions Limited 7.20 0.12
88 Fortis Healthcare Limited 37.03 0.62
89 Hathway Cable & Datacom Limited 149.81 2.51
90 Kalindee Rail Nirman (Engineers) Limited 26.77 0.45
91 Nakoda Limited 48.60 0.81
92 Pricol Limited 8.10 0.14
93 Religare Enterprises Limited 6.14 0.10
94 SHREE GANESH JEWELLERY HOUSE (I) LIMITED 16.00 0.27
95 Shriram City Union Finance Limited 173.85 2.91
96 Sree Rayalaseema Hi-Strength Hypo Limited 2.69 0.05
97 TTK Prestige Limited 106.50 1.78
98 TVS Electronics Limited 0.80 0.01
99 Venus Remedies Limited 19.10 0.32
100 Hindalco Industries Limited 2,165.25 36.23
101 Industrial Investment Trust Limited 1.00 0.02
102 Den Networks Limited 689.68 11.54
103 Lakshmi Energy and Foods Limited 7.26 0.12
104 Ramkrishna Forgings Limited 49.44 0.83
105 Ramkrishna Forgings Limited 3.76 0.06
106 Ramkrishna Forgings Limited 0.23 0.00
107 Credit Analysis And Research Limited 25.00 0.42
108 Astec LifeSciences Limited 1.65 0.03
109 Dhanlaxmi Bank Limited 11.50 0.19
110 Peacock Industries Limited 9.30 0.16
111 Aster Silicates Limited 10.00 0.17
112 Celebrity Fashions Limited 7.47 0.12
113 Diamond Power Infra Ltd 42.00 0.70
114 Hotel Leela Venture Limited 65.00 1.09
115 Indiabulls Housing Finance Limited 65.40 1.09
116 Jindal Drilling And Industries Limited 63.03 1.05
117 Nicco Corporation Limited 2.20 0.04
118 R. S. Software (India) Limited 3.09 0.05
119 Suzlon Energy Limited 129.94 2.17
Contd...
Contd...
27
S.No. Company Name Amount Raised_____________ ` Crores
Amount Raised_____________ US $ mn
120 Swan Energy Limited 233.85 3.91
121 Wanbury Limited 9.71 0.16
122 Aditya Birla Nuvo Limited 894.46 14.97
123 Ankit Metal & Power Limited 80.10 1.34
124 Asian Granito India Limited 2.11 0.04
125 Bank Of India 1,000.00 16.73
126 Banswara Syntex Limited 2.49 0.04
127 Central Bank of India 1,800.00 30.12
128 Hathway Cable & Datacom Limited 100.00 1.67
129 Indiabulls Housing Finance Limited 11.99 0.20
130 Impex Ferro Tech Limited 28.25 0.47
131 IOL Chemicals and Pharmaceuticals Limited 20.78 0.35
132 Jai Balaji Industries Limited 17.48 0.29
133 Jet Airways (India) Limited 2,057.68 34.43
134 Kajaria Ceramics Limited 50.00 0.84
135 Natco Pharma Limited 108.53 1.82
136 Oriental Bank Of Commerce 150.00 2.51
137 Rainbow Papers Limited 2.04 0.03
138 Suzlon Energy Limited 203.00 3.40
139 Corporation Bank 450.00 7.53
140 Jyothy Laboratories Limited 262.73 4.40
141 Vivimed Labs Limited 22.35 0.37
142 Punjab & Sind Bank 100.00 1.67
143 Kohinoor Foods Limited 112.77 1.89
144 20 Microns Limited 3.00 0.05
145 Canara Bank 500.00 8.37
146 Nakoda Limited 53.00 0.89
147 Aurionpro Solutions Limited 1.80 0.03
148 Supreme Infrastructure India Limited 61.98 1.04
149 United Bank of India 700.00 11.71
150 Nitco Limited 55.69 0.93
151 Punjab National Bank 500.00 8.37
152 State Bank Of India 2,000.00 33.47
153 Vaswani Industries Limited 1.36 0.02
154 Flexituff International Limited 43.75 0.73
155 Allahabad Bank 400.00 6.69
156 Indian Overseas Bank 1,200.00 20.08
157 Tree House Education & Accessories Limited 16.70 0.28
158 Union Bank of India 500.00 8.37
159 Vijaya Bank 250.00 4.18
Contd...
Contd...
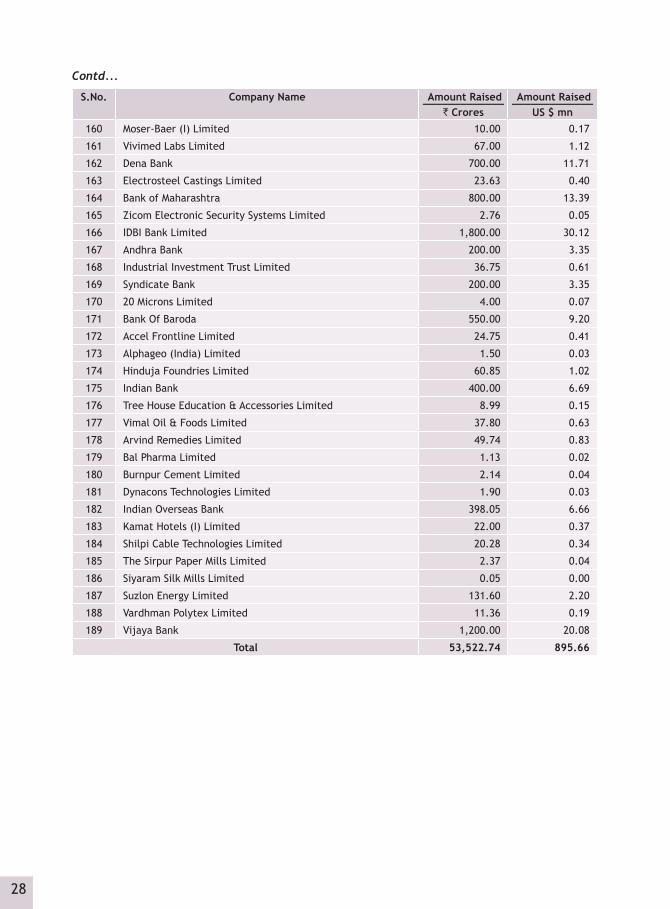
28
S.No. Company Name Amount Raised_____________ ` Crores
Amount Raised_____________ US $ mn
160 Moser-Baer (I) Limited 10.00 0.17
161 Vivimed Labs Limited 67.00 1.12
162 Dena Bank 700.00 11.71
163 Electrosteel Castings Limited 23.63 0.40
164 Bank of Maharashtra 800.00 13.39
165 Zicom Electronic Security Systems Limited 2.76 0.05
166 IDBI Bank Limited 1,800.00 30.12
167 Andhra Bank 200.00 3.35
168 Industrial Investment Trust Limited 36.75 0.61
169 Syndicate Bank 200.00 3.35
170 20 Microns Limited 4.00 0.07
171 Bank Of Baroda 550.00 9.20
172 Accel Frontline Limited 24.75 0.41
173 Alphageo (India) Limited 1.50 0.03
174 Hinduja Foundries Limited 60.85 1.02
175 Indian Bank 400.00 6.69
176 Tree House Education & Accessories Limited 8.99 0.15
177 Vimal Oil & Foods Limited 37.80 0.63
178 Arvind Remedies Limited 49.74 0.83
179 Bal Pharma Limited 1.13 0.02
180 Burnpur Cement Limited 2.14 0.04
181 Dynacons Technologies Limited 1.90 0.03
182 Indian Overseas Bank 398.05 6.66
183 Kamat Hotels (I) Limited 22.00 0.37
184 Shilpi Cable Technologies Limited 20.28 0.34
185 The Sirpur Paper Mills Limited 2.37 0.04
186 Siyaram Silk Mills Limited 0.05 0.00
187 Suzlon Energy Limited 131.60 2.20
188 Vardhman Polytex Limited 11.36 0.19
189 Vijaya Bank 1,200.00 20.08
Total 53,522.74 895.66
Contd...
29
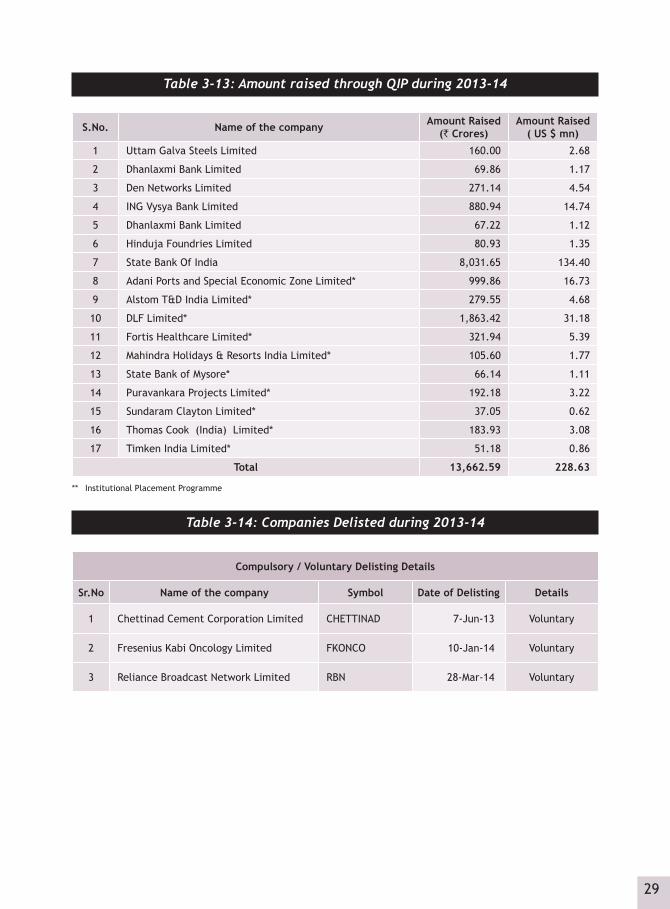
Table 3-13: Amount raised through QIP during 2013-14
S.No. Name of the company Amount Raised(` Crores)
Amount Raised( US $ mn)
1 Uttam Galva Steels Limited 160.00 2.68
2 Dhanlaxmi Bank Limited 69.86 1.17
3 Den Networks Limited 271.14 4.54
4 ING Vysya Bank Limited 880.94 14.74
5 Dhanlaxmi Bank Limited 67.22 1.12
6 Hinduja Foundries Limited 80.93 1.35
7 State Bank Of India 8,031.65 134.40
8 Adani Ports and Special Economic Zone Limited* 999.86 16.73
9 Alstom T&D India Limited* 279.55 4.68
10 DLF Limited* 1,863.42 31.18
11 Fortis Healthcare Limited* 321.94 5.39
12 Mahindra Holidays & Resorts India Limited* 105.60 1.77
13 State Bank of Mysore* 66.14 1.11
14 Puravankara Projects Limited* 192.18 3.22
15 Sundaram Clayton Limited* 37.05 0.62
16 Thomas Cook (India) Limited* 183.93 3.08
17 Timken India Limited* 51.18 0.86
Total 13,662.59 228.63
** Institutional Placement Programme
Table 3-14: Companies Delisted during 2013-14
Compulsory / Voluntary Delisting Details
Sr.No Name of the company Symbol Date of Delisting Details
1 Chettinad Cement Corporation Limited CHETTINAD 7-Jun-13 Voluntary
2 Fresenius Kabi Oncology Limited FKONCO 10-Jan-14 Voluntary
3 Reliance Broadcast Network Limited RBN 28-Mar-14 Voluntary

30

Capital Market Segment 4

32

33
4
Cont
d...
Capital Market SegmentTa
ble
4-1:
Busi
ness
Gro
wth
of
CM S
egm
ent
Mon
th &
Ye
arNo
. of
Trad
-in
g Da
ys
No. o
f co
m-
pani
es
Trad
ed
No. o
f Tr
ades
Trad
ed
Qua
ntity
Trad
ing
Valu
eAv
erag
e Da
ily
Trad
ing
Valu
eTu
rn-
over
Ra
tio
Dem
at T
rad-
ed Q
uant
ityDe
mat
Tra
ding
Va
lue
Mar
ket
Capi
talis
atio
n
(lakh
)(la
kh)
(` C
rore
s)(U
S $
bn)
(` C
rore
s)
(US
$ m
n.)
(%)
(lakh
)(`
Cro
res)
(U
S $
bn)
(` C
rore
s)
(US
$ bn
)19
94-9
5 (N
ov.-M
ar.)
102
--3
1,39
11,
805
--17
--0.
500
0--
363
,350
--
1995
-96
246
--66
39,9
1267
,287
--27
6--
16.7
60
0--
401
,459
--
1996
-97
250
--26
413
5,56
129
4,50
3--
1,17
6--
70.2
32
6--
419
,367
--
1997
-98
244
--38
113
5,68
537
0,19
3--
1,52
0--
76.8
831
535
1--
481
,503
--
1998
-99
251
--54
616
5,32
741
4,47
498
1,65
138
984
.38
8,54
223
,818
6 4
91,1
75
116
1999
-200
025
4--
984
242,
704
839,
052
192
3,30
375
782
.23
153,
772
711,
706
163
1,0
20,4
26
234
2000
-01
251
1,20
1 1
,676
32
9,53
61,
339,
510
287
5,33
71,
144
203.
6230
7,22
21,
264,
337
271
657,
847
141
2001
-02
247
1,01
91,
753
278,
408
513,
167
105
2,07
842
680
.58
277,
717
512,
866
105
636,
861
131
2002
-03
251
899
2,39
836
4,06
661
7,98
913
02,
462
518
115.
0536
4,04
961
7,98
413
053
7133
113
2003
-04
254
804
3,78
071
3,30
01,
099,
534
253
4,32
999
898
.09
713,
300
1,09
9,53
425
31,
120,
976
258
2004
-05
253
856
4,51
079
7,68
51,
140,
072
261
4,50
61,
030
71.9
079
7,68
51,
140,
072
261
1,5
85,5
85
362
2005
-06
251
928
6,0
88
844
,486
1
,569
,558
35
2 6
,253
1,
402
55.7
9 8
44,4
86
1,5
69,5
58
352
2,8
13,2
01
631
2006
-07
249
1,1
14
7,8
46
855
,456
1
,945
,287
44
6 7
,812
1,
792
57.7
7 8
55,4
56
1,9
45,2
87
446
3,3
67,3
50
773
2007
-08
251
1,2
44
11,7
27
1,4
98,4
69
3,5
51,0
38
888
1
4,14
8 3
,540
73
.09
1,4
98,4
69
3,5
51,0
38
888
4,
858,
122
1,2
15
2008
-09
243
1,2
77
13,6
51
1,4
26,3
55
2,7
52,0
23
540
1
1,32
5 2
,223
95
.02
1,4
26,3
55
2,7
52,0
23
540
2,
896,
194
568
2009
-201
0 2
44
1,3
70
16,8
16
2,2
15,5
30
4,1
38,0
23
917
1
6,95
9 3
,757
6
8.86
2
,215
,530
4
,138
,023
9
17
6,00
9,17
3 1
,331
2010
-11
255
1,48
315
,507
1
,824
,515
3
,577
,410
8
01
14,
029
3,1
42
3.3
7 1
,824
,515
3
,577
,410
8
01
6,70
2,61
6 1
,501
2011
-12
249
1,55
114
,377
1
,616
,978
2
,810
,893
5
49
11,
289
2,2
07
46.1
1 1
,616
,978
2
,810
,893
5
49
6,09
6,51
8 1
,192
Apr-
1220
1,52
9 9
99
116
,755
1
98,3
24
36
9,9
16
1,8
23
-- 1
16,7
55
198
,324
3
6 6
,059
,258
1
,114
May
-12
221,
530
1,1
43
129
,997
2
16,7
55
40
9,8
52
1,8
11
-- 1
29,9
97
216
,755
4
0 5
,695
,547
1
,047
Jun-
1221
1,53
2 1
,058
1
25,0
22
202
,104
3
7 9
,624
1
,769
--
125
,022
2
02,1
04
37
6,0
26,7
66
1,1
08
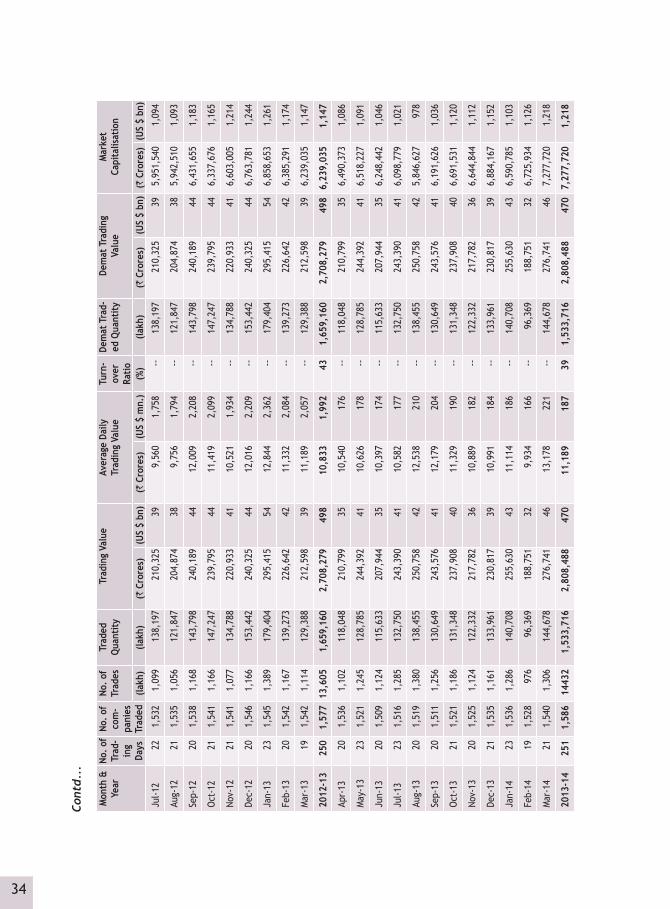
34
Mon
th &
Ye
arNo
. of
Trad
-in
g Da
ys
No. o
f co
m-
pani
es
Trad
ed
No. o
f Tr
ades
Trad
ed
Qua
ntity
Trad
ing
Valu
eAv
erag
e Da
ily
Trad
ing
Valu
eTu
rn-
over
Ra
tio
Dem
at T
rad-
ed Q
uant
ityDe
mat
Tra
ding
Va
lue
Mar
ket
Capi
talis
atio
n
(lakh
)(la
kh)
(` C
rore
s)(U
S $
bn)
(` C
rore
s)
(US
$ m
n.)
(%)
(lakh
)(`
Cro
res)
(U
S $
bn)
(` C
rore
s)
(US
$ bn
)
Jul-1
222
1,53
2 1
,099
1
38,1
97
210
,325
3
9 9
,560
1
,758
--
138
,197
2
10,3
25
39
5,9
51,5
40
1,0
94
Aug-
1221
1,53
5 1
,056
1
21,8
47
204
,874
3
8 9
,756
1
,794
--
121
,847
2
04,8
74
38
5,9
42,5
10
1,0
93
Sep-
1220
1,53
8 1
,168
1
43,7
98
240
,189
4
4 1
2,00
9 2
,208
--
143
,798
2
40,1
89
44
6,4
31,6
55
1,1
83
Oct
-12
211,
541
1,1
66
147
,247
2
39,7
95
44
11,
419
2,0
99
-- 1
47,2
47
239
,795
4
4 6
,337
,676
1
,165
Nov-
1221
1,54
1 1
,077
1
34,7
88
220
,933
4
1 1
0,52
1 1
,934
--
134
,788
2
20,9
33
41
6,6
03,0
05
1,2
14
Dec-
1220
1,54
6 1
,166
1
53,4
42
240
,325
4
4 1
2,01
6 2
,209
--
153
,442
2
40,3
25
44
6,7
63,7
81
1,2
44
Jan-
1323
1,54
5 1
,389
1
79,4
04
295
,415
5
4 1
2,84
4 2
,362
--
179
,404
2
95,4
15
54
6,8
58,6
53
1,2
61
Feb-
1320
1,54
2 1
,167
1
39,2
73
226
,642
4
2 1
1,33
2 2
,084
--
139
,273
2
26,6
42
42
6,3
85,2
91
1,1
74
Mar
-13
191,
542
1,1
14
129
,388
2
12,5
98
39
11,
189
2,0
57
-- 1
29,3
88
212
,598
3
9 6
,239
,035
1
,147
2012
-13
250
1,57
713
,605
1,
659,
160
2,7
08,2
79
498
1
0,83
3 1
,992
4
3 1
,659
,160
2
,708
,279
4
98
6,23
9,03
5 1
,147
Apr-
1320
1,53
6 1
,102
11
8,04
8 2
10,7
99
35
10,
540
176
--
118
,048
2
10,7
99
35
6,4
90,3
73
1,0
86
May
-13
231,
521
1,2
45
128,
785
244
,392
4
1 1
0,62
6 1
78
-- 1
28,7
85
244
,392
4
1 6
,518
,227
1
,091
Jun-
1320
1,50
9 1
,124
11
5,63
3 2
07,9
44
35
10,
397
174
--
115
,633
2
07,9
44
35
6,2
48,4
42
1,0
46
Jul-1
323
1,51
6 1
,285
13
2,75
0 2
43,3
90
41
10,
582
177
--
132
,750
2
43,3
90
41
6,0
98,7
79
1,0
21
Aug-
1320
1,51
9 1
,380
13
8,45
5 2
50,7
58
42
12,
538
210
--
138
,455
2
50,7
58
42
5,8
46,6
27
978
Sep-
1320
1,51
1 1
,256
13
0,64
9 2
43,5
76
41
12,
179
204
--
130
,649
2
43,5
76
41
6,1
91,6
26
1,0
36
Oct
-13
211,
521
1,1
86
131,
348
237
,908
4
0 1
1,32
9 1
90
-- 1
31,3
48
237
,908
4
0 6
,691
,531
1
,120
Nov-
1320
1,52
5 1
,124
12
2,33
2 2
17,7
82
36
10,
889
182
--
122
,332
2
17,7
82
36
6,6
44,8
44
1,1
12
Dec-
1321
1,53
5 1
,161
13
3,96
1 2
30,8
17
39
10,
991
184
--
133
,961
2
30,8
17
39
6,8
84,1
67
1,1
52
Jan-
1423
1,53
6 1
,286
14
0,70
8 2
55,6
30
43
11,
114
186
--
140
,708
2
55,6
30
43
6,5
90,7
85
1,1
03
Feb-
1419
1,52
8 9
76
96,3
69 1
88,7
51
32
9,9
34
166
--
96,
369
188
,751
3
2 6
,725
,934
1
,126
Mar
-14
211,
540
1,3
06
144,
678
276
,741
4
6 1
3,17
8 2
21
-- 1
44,6
78
276
,741
4
6 7
,277
,720
1
,218
2013
-14
251
1,58
614
432
1,53
3,71
62,
808,
488
470
11
,189
187
3
9 1,
533,
716
2,80
8,48
8 4
70
7,27
7,72
0 1
,218
Cont
d...
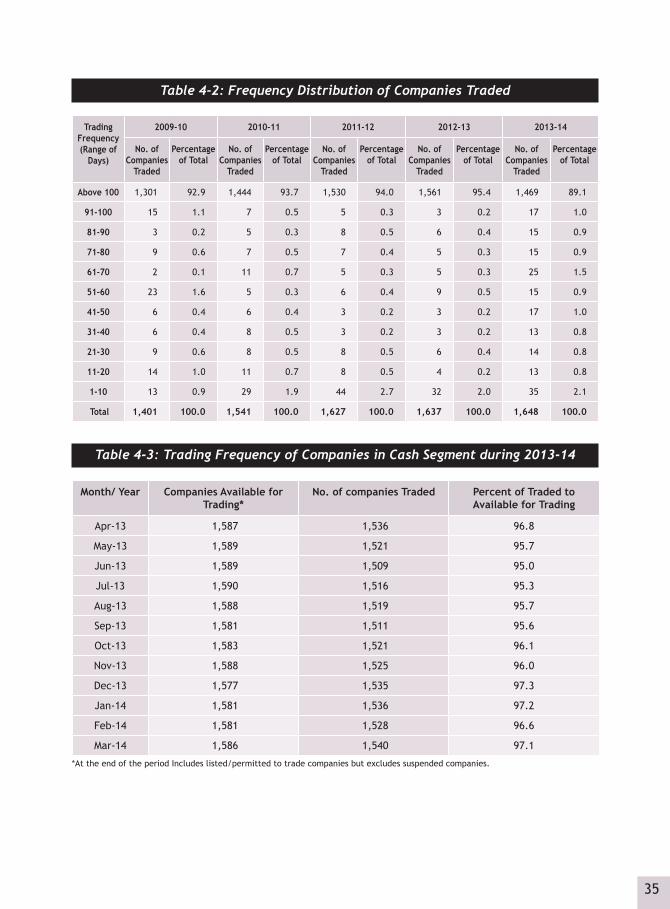
35
Table 4-2: Frequency Distribution of Companies Traded
Trading Frequency (Range of
Days)
2009-10 2010-11 2011-12 2012-13 2013-14
No. of Companies
Traded
Percentage of Total
No. of Companies
Traded
Percentage of Total
No. of Companies
Traded
Percentage of Total
No. of Companies
Traded
Percentage of Total
No. of Companies
Traded
Percentage of Total
Above 100 1,301 92.9 1,444 93.7 1,530 94.0 1,561 95.4 1,469 89.1
91-100 15 1.1 7 0.5 5 0.3 3 0.2 17 1.0
81-90 3 0.2 5 0.3 8 0.5 6 0.4 15 0.9
71-80 9 0.6 7 0.5 7 0.4 5 0.3 15 0.9
61-70 2 0.1 11 0.7 5 0.3 5 0.3 25 1.5
51-60 23 1.6 5 0.3 6 0.4 9 0.5 15 0.9
41-50 6 0.4 6 0.4 3 0.2 3 0.2 17 1.0
31-40 6 0.4 8 0.5 3 0.2 3 0.2 13 0.8
21-30 9 0.6 8 0.5 8 0.5 6 0.4 14 0.8
11-20 14 1.0 11 0.7 8 0.5 4 0.2 13 0.8
1-10 13 0.9 29 1.9 44 2.7 32 2.0 35 2.1
Total 1,401 100.0 1,541 100.0 1,627 100.0 1,637 100.0 1,648 100.0
Table 4-3: Trading Frequency of Companies in Cash Segment during 2013-14
Month/ Year Companies Available for Trading*
No. of companies Traded Percent of Traded to Available for Trading
Apr-13 1,587 1,536 96.8
May-13 1,589 1,521 95.7
Jun-13 1,589 1,509 95.0
Jul-13 1,590 1,516 95.3
Aug-13 1,588 1,519 95.7
Sep-13 1,581 1,511 95.6
Oct-13 1,583 1,521 96.1
Nov-13 1,588 1,525 96.0
Dec-13 1,577 1,535 97.3
Jan-14 1,581 1,536 97.2
Feb-14 1,581 1,528 96.6
Mar-14 1,586 1,540 97.1
*At the end of the period Includes listed/permitted to trade companies but excludes suspended companies.

36
Table 4-4: Advances/Declines in Cash Segment of NSE durign 2013-14(No. of Securities)
Month/Date
NSE
Advances Declines Advance / Decline Ratio
Apr-13 521 1,045 0.5
May-13 729 594 1.2
Jun-13 242 1,081 0.2
Jul-13 427 901 0.5
Aug-13 175 1,021 0.2
Sep-13 835 360 2.3
Oct-13 916 273 3.4
Nov-13 820 354 2.3
Dec-13 757 423 1.8
Jan-14 660 515 1.3
Feb-14 382 1,138 0.3
Mar-14 968 556 1.7
Note: Advance/Decline is calculated based on the average price methodology.Stocks which have been traded in both months have been considered only
Table 4-5: City-wise Turnover of NSE in the CM segment (in %)
City 2005-06 2006-07 2007-08 2008-09 2009-10 2010-11 2011-12 2012-13 2013-14
Ahmedabad 3.0 2.9 3.4 5.3 7.0 6.2 6.1 4.7 3.8
Bangalore 1.7 1.3 0.8 0.6 0.6 0.6 0.5 0.4 1.6
Baroda 0.8 0.9 0.8 0.7 0.6 0.5 0.4 0.4 0.4
Bhubaneshwar 0.0 0.0 0.0 0.0 0.0 0.0 0.0 0.0 0.0
Chennai 2.8 2.2 1.9 2.0 1.7 1.6 1.4 1.4 1.3
Cochin 0.6 0.5 0.5 0.8 1.4 1.7 1.7 0.0 0.0
Coimbatore 0.4 0.3 0.2 0.3 0.3 0.3 0.2 0.2 0.2
Delhi 13.4 13.5 14.7 15.0 14.9 10.8 8.4 8.0 9.0
GUWAHATI 0.0 0.0 0.0 0.0 0.0 0.0 0.0 0.0 0.0
Hyderabad 1.9 1.2 1.3 1.7 1.8 1.6 1.4 3.0 4.2
Indore 0.8 0.8 0.7 0.5 0.6 0.6 0.4 0.4 0.5
Jaipur 1.2 0.9 0.7 0.6 0.5 0.5 0.4 0.4 0.4
Kanpur 0.2 0.2 0.1 0.1 0.1 0.1 0.1 0.1 0.1
Kolkata/Howrah 11.4 10.6 11.0 9.2 8.3 7.5 8.6 7.7 7.4
Ludhiana 0.3 0.2 0.2 0.2 0.2 0.1 0.1 0.1 0.1
Mangalore 0.1 0.1 0.0 0.0 0.0 0.0 0.0 0.0 0.0
Mumbai / Thane 52.4 57.1 57.7 55.9 54.5 58.6 60.4 61.7 59.5
Patna 0.1 0.1 0.3 0.0 0.0 0.0 0.0 0.0 0.0
Pune 0.6 0.4 0.0 0.2 0.2 0.2 0.2 0.2 0.2
Rajkot 0.3 0.4 0.8 1.3 1.4 1.6 1.4 1.2 1.0
Others 8.1 6.5 5.0 5.7 5.9 7.5 8.2 10.0 10.2
Total 100 100 100 100 100 100 100 100 100
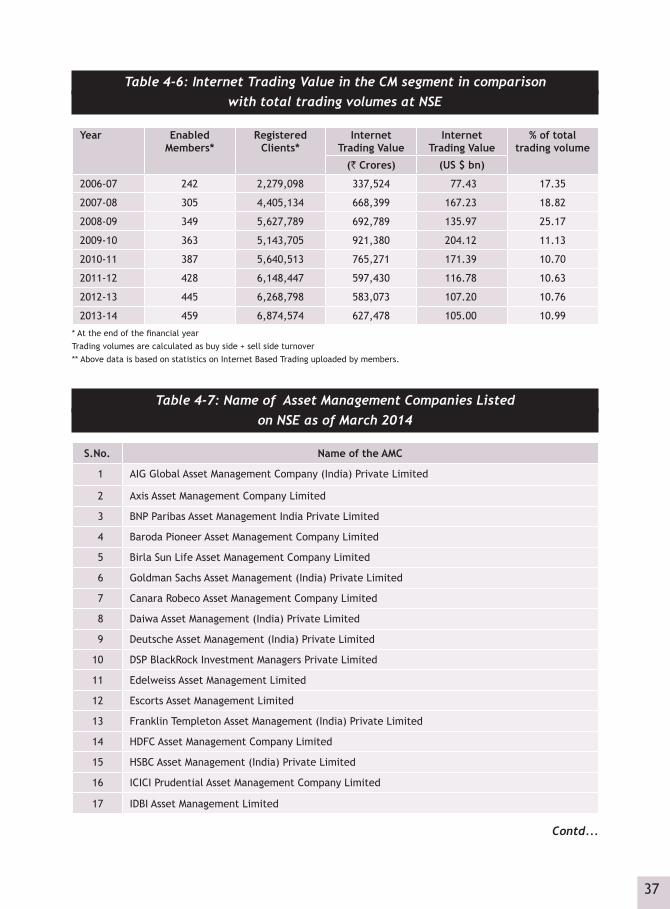
37
Table 4-6: Internet Trading Value in the CM segment in comparison with total trading volumes at NSE
Year Enabled Members*
Registered Clients*
Internet Trading Value
Internet Trading Value
% of total trading volume
(` Crores) (US $ bn)
2006-07 242 2,279,098 337,524 77.43 17.35
2007-08 305 4,405,134 668,399 167.23 18.82
2008-09 349 5,627,789 692,789 135.97 25.17
2009-10 363 5,143,705 921,380 204.12 11.13
2010-11 387 5,640,513 765,271 171.39 10.70
2011-12 428 6,148,447 597,430 116.78 10.63
2012-13 445 6,268,798 583,073 107.20 10.76
2013-14 459 6,874,574 627,478 105.00 10.99
* At the end of the financial year
Trading volumes are calculated as buy side + sell side turnover
** Above data is based on statistics on Internet Based Trading uploaded by members.
Table 4-7: Name of Asset Management Companies Listed on NSE as of March 2014
S.No. Name of the AMC
1 AIG Global Asset Management Company (India) Private Limited
2 Axis Asset Management Company Limited
3 BNP Paribas Asset Management India Private Limited
4 Baroda Pioneer Asset Management Company Limited
5 Birla Sun Life Asset Management Company Limited
6 Goldman Sachs Asset Management (India) Private Limited
7 Canara Robeco Asset Management Company Limited
8 Daiwa Asset Management (India) Private Limited
9 Deutsche Asset Management (India) Private Limited
10 DSP BlackRock Investment Managers Private Limited
11 Edelweiss Asset Management Limited
12 Escorts Asset Management Limited
13 Franklin Templeton Asset Management (India) Private Limited
14 HDFC Asset Management Company Limited
15 HSBC Asset Management (India) Private Limited
16 ICICI Prudential Asset Management Company Limited
17 IDBI Asset Management Limited
Contd...

38
S.No. Name of the AMC
18 India Infoline Asset Management Company Limited
19 IDFC Asset Management Company Limited
20 JM Financial Asset Management Private Limited
21 JPMorgan Asset Management India Private Limited
22 Kotak Mahindra Asset Management Company Limited
23 L&T Investment Management Limited
24 LIC NOMURA Mutual Fund Asset Management Company Limited
25 Motilal Oswal Asset Management Company Limited
26 Principal Pnb Asset Management Company Private Limited
27 Pramerica Asset Managers Private Limited
28 Reliance Capital Asset Management Limited
29 Religare Asset Management Company Limited
30 Sahara Asset Management Company Private Limited
31 SBI Funds Management Private Limited
32 Sundaram Asset Management Company Limited
33 Taurus Asset Management Company Limited
34 Union KBC Asset Management Company Private Limited
35 UTI Asset Management Company Limited
36 Quantum Asset Management Company Private Limited
37 BOI AXA Investment Managers Private Limited
Table 4-8: NSE CM transaction charges*
Total Traded Value in a month Revised Transaction Charges (` per lakh of Traded Value)
Up to First ` 1,250 cores ` 3.25 each side
More than ` 1,250 crores up to ` 2,500 crores (on incremental volume)
` 3.20 each side
More than ` 2,500 crores up to ` 5,000 crores (on incremental volume)
` 3.15 each side
More than ` 5,000 crores up to ` 10,000 crores (on incremental volume)
` 3.10 each side
More than ` 10,000 crores up to ` 15,000 crores(on incremental volume)
` 3.05 each side
Exceeding ` 15,000 crores (on incremental volume)
` 3.00 each side
** not applicable to money market instruments.
Contd...

39
Table 4-9: The existing rates of Securities Transaction Tax (STT) for CM segment
Sr.No Taxable securities transaction Rate (%) Payable by
1 Purchase of an equity share in a company or a unit of an equity oriented fund, where –(a) the transaction of such purchase is entered into in a
recognised stock exchange; and(b) the contract for the purchase of such share or unit is
settled by the actual delivery or transfer of such share or unit.
0.1 Purchaser.
2 Sale of an equity share in a company or a unit of an equity oriented fund, where –(a) the transaction of such sale is entered into in a
recognised stock exchange; and(b) the contract for the sale of such share or unit is settled
by the actual delivery or transfer of such share or unit.
0.1 Seller.
3 Sale of an equity share in a company or a unit of an equity oriented fund, where –(a) the transaction of such sale is entered into in a
recognised stock exchange; and(b) the contract for the sale of such share or unit is settled
otherwise than by the actual delivery or transfer of such share or unit.
0.025 Seller.
Table 4-10: Percentage Share of Top ‘N’ Securities/Member in Turnover
No. of Securities/Members
Year 5 10 25 50 100
Securities1994-95 (Nov.-Mar.) 48.77 55.92 68.98 81.14 91.07
1995-96 82.98 86.60 90.89 93.54 95.871996-97 84.55 91.96 95.70 97.03 98.191997-98 72.98 85.17 92.41 95.76 97.901998-99 52.56 67.11 84.71 92.03 95.981999-00 39.56 59.22 82.31 88.69 93.662000-01 52.15 72.90 88.93 94.57 97.462001-02 44.43 62.92 82.24 91.56 95.912002-03 40.58 55.41 77.8 89.16 95.382003-04 31.04 44.87 64.32 79.44 91.032004-05 25.88 41.65 57.98 72.40 84.262005-06 22.15 31.35 46.39 59.22 73.122006-07 16.97 25.25 43.46 61.94 77.222007-08 16.29 26.78 45.46 61.47 77.292008-09 20.48 32.58 56.36 74.66 87.692009-10 15.43 26.15 46.80 64.24 78.202010-11 15.25 23.03 38.73 53.58 68.932011-12 17.17 27.14 44.28 59.79 75.742012-13 16.18 26.22 44.30 60.54 76.822013-14 15.29 26.24 46.63 64.85 82.05
Contd...

40
No. of Securities/Members
Year 5 10 25 50 100
Members
1994-95 (Nov.-Mar.) 18.19 26.60 44.37 61.71 81.121995-96 10.65 16.56 28.61 41.93 58.591996-97 5.94 10.08 19.67 30.57 45.951997-98 6.29 10.59 18.81 29.21 44.241998-99 7.73 11.96 20.77 31.66 47.021999-00 7.86 12.99 22.78 34.41 49.962000-01 7.78 12.76 23.00 33.86 48.792001-02 7.14 12.29 23.63 36.32 53.402002-03 10.26 16.41 29.07 42.49 59.152003-04 11.58 17.36 30.34 44.05 61.372004-05 13.52 20.20 34.97 49.01 65.092005-06 14.62 22.57 38.17 52.57 38.452006-07 14.72 24.27 42.61 56.71 71.222007-08 14.57 25.71 44.70 60.11 73.902008-09 13.56 23.62 43.55 61.21 75.422009-10 14.63 23.48 41.00 57.01 72.712010-11 14.35 23.83 42.85 58.61 73.042011-12 14.80 25.26 46.30 62.16 76.982012-13 14.25 24.68 46.66 63.07 77.182013-14 13.90 24.92 45.95 63.69 78.75
Table 4-11: ‘50’ Most Active Securities during 2013-14 in Terms of Trading Value
Rank Name of SecurityTrading Value
% Share in Total Trading Value
Market Capitalisation as on March 31,2014
% Share in Total Market
Capitalisation(` Crores) (US $ bn) (` Crores) (US $ bn)
1 ICICI BANK LTD. 96,682 16.18 3.44 143,745 24.05 1.98
2 STATE BANK OF INDIA 92,785 15.53 3.30 143,170 23.96 1.97
3 INFOSYS LIMITED 89,726 15.01 3.19 188,510 31.55 2.59
4 AXIS BANK LIMITED 80,330 13.44 2.86 68,550 11.47 0.94
5 RELIANCE INDUSTRIES LTD 69,771 11.68 2.48 300,787 50.33 4.13
6 HDFC LTD 64,221 10.75 2.29 137,854 23.07 1.89
7 TATA CONSULTANCY SERVICES LTD 63,098 10.56 2.25 417,826 69.92 5.74
8 YES BANK LIMITED 60,700 10.16 2.16 14,927 2.50 0.21
9 TATA MOTORS LIMITED 60,323 10.09 2.15 109,099 18.26 1.50
10 UNITED SPIRITS LIMITED 59,309 9.92 2.11 34,627 5.79 0.48
11 LARSEN & TOUBRO LTD. 56,556 9.46 2.01 117,845 19.72 1.62
12 ITC LTD 55,049 9.21 1.96 280,373 46.92 3.85
13 HDFC BANK LTD 52,257 8.74 1.86 179,512 30.04 2.47
Contd...
Contd...

41
Rank Name of SecurityTrading Value
% Share in Total Trading Value
Market Capitalisation as on March 31,2014
% Share in Total Market
Capitalisation(` Crores) (US $ bn) (` Crores) (US $ bn)
14 TATA STEEL LIMITED 44,632 7.47 1.59 38,261 6.40 0.53
15 RELIANCE COMMUNICATIONS LTD 40,516 6.78 1.44 26,605 4.45 0.37
16 BHARTI AIRTEL LIMITED 37,382 6.26 1.33 127,017 21.26 1.75
17 JAIPRAKASH ASSOCIATES LTD 36,770 6.15 1.31 11,916 1.99 0.16
18 HCL TECHNOLOGIES LTD 36,512 6.11 1.30 97,242 16.27 1.34
19 DLF LIMITED 34,843 5.83 1.24 31,433 5.26 0.43
20 TECH MAHINDRA LIMITED 33,230 5.56 1.18 41,886 7.01 0.58
21 RELIANCE CAPITAL LTD 30,560 5.11 1.09 8,496 1.42 0.12
22 HINDUSTAN UNILEVER LTD. 30,087 5.03 1.07 130,959 21.91 1.80
23 MARUTI SUZUKI INDIA LTD. 28,990 4.85 1.03 59,563 9.97 0.82
24 SUN PHARMACEUTICALS IND. 28,170 4.71 1.00 119,040 19.92 1.64
25 RANBAXY LABS LTD 27,078 4.53 0.96 15,464 2.59 0.21
26 OIL AND NATURAL GAS CORP. 26,145 4.38 0.93 272,663 45.63 3.75
27 AUROBINDO PHARMA LTD 25,900 4.33 0.92 14,902 2.49 0.20
28 MAHINDRA & MAHINDRA LTD 25,869 4.33 0.92 60,401 10.11 0.83
29 IDFC LIMITED 25,069 4.20 0.89 18,536 3.10 0.25
30 RELIANCE INFRASTRUCTURE LTD 24,868 4.16 0.89 11,405 1.91 0.16
31 WIPRO LTD 24,046 4.02 0.86 133,945 22.41 1.84
32 INDUSIND BANK LIMITED 24,016 4.02 0.86 26,365 4.41 0.36
33 BANK OF BARODA 23,702 3.97 0.84 30,950 5.18 0.43
34 SESA STERLITE LIMITED 23,290 3.90 0.83 55,899 9.35 0.77
35 HINDALCO INDUSTRIES LTD 20,810 3.48 0.74 29,265 4.90 0.40
36 COAL INDIA LTD 20,155 3.37 0.72 182,385 30.52 2.51
37 PUNJAB NATIONAL BANK 20,119 3.37 0.72 26,934 4.51 0.37
38 BHEL 19,992 3.35 0.71 47,985 8.03 0.66
39 IDEA CELLULAR LIMITED 19,805 3.31 0.71 45,624 7.63 0.63
40 DR. REDDY'S LABORATORIES 19,182 3.21 0.68 43,614 7.30 0.60
41 JSW STEEL LIMITED 17,734 2.97 0.63 25,044 4.19 0.34
42 JINDAL STEEL & POWER LTD 17,734 2.97 0.63 26,756 4.48 0.37
43 LUPIN LIMITED 17,607 2.95 0.63 41,838 7.00 0.57
44 BAJAJ AUTO LIMITED 17,480 2.93 0.62 60,293 10.09 0.83
45 NTPC LTD 17,193 2.88 0.61 98,863 16.54 1.36
46 CAIRN INDIA LIMITED 17,129 2.87 0.61 63,526 10.63 0.87
47 LIC HOUSING FINANCE LTD 16,374 2.74 0.58 11,918 1.99 0.16
48 HERO MOTOCORP LIMITED 16,268 2.72 0.58 45,425 7.60 0.62
49 POWER GRID CORP. LTD. 15,905 2.66 0.57 54,932 9.19 0.75
50 ZEE ENTERTAINMENT ENT LTD 15,429 2.58 0.55 26,061 4.36 0.36
Total 1,821,392 304.79 64.85 4,300,237 719.61 59.09
Contd...
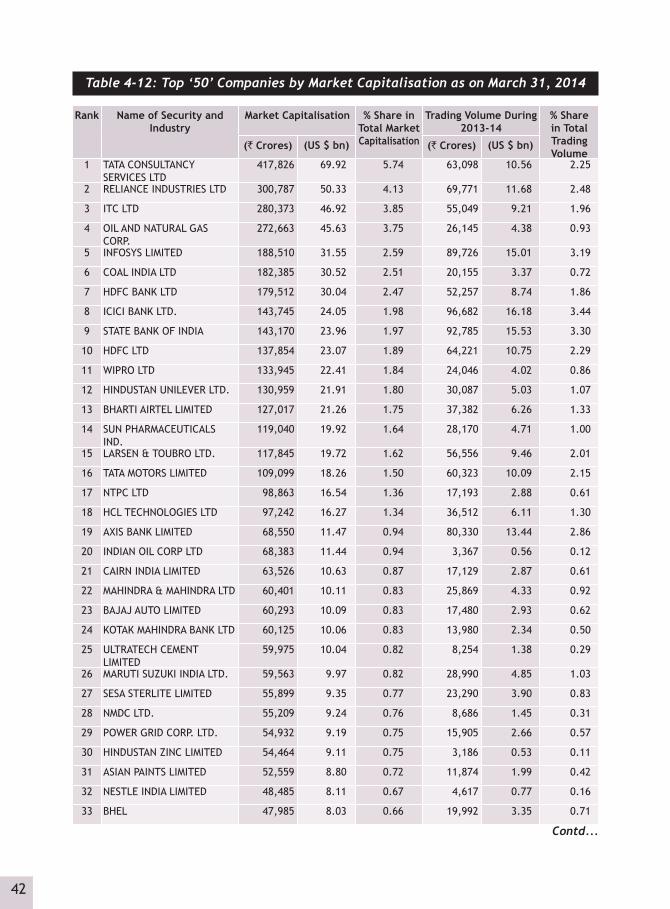
42
Table 4-12: Top ‘50’ Companies by Market Capitalisation as on March 31, 2014
Rank Name of Security and Industry
Market Capitalisation % Share in Total Market Capitalisation
Trading Volume During 2013-14
% Share in Total Trading Volume
(` Crores) (US $ bn) (` Crores) (US $ bn)
1 TATA CONSULTANCY SERVICES LTD
417,826 69.92 5.74 63,098 10.56 2.25
2 RELIANCE INDUSTRIES LTD 300,787 50.33 4.13 69,771 11.68 2.48
3 ITC LTD 280,373 46.92 3.85 55,049 9.21 1.96
4 OIL AND NATURAL GAS CORP.
272,663 45.63 3.75 26,145 4.38 0.93
5 INFOSYS LIMITED 188,510 31.55 2.59 89,726 15.01 3.19
6 COAL INDIA LTD 182,385 30.52 2.51 20,155 3.37 0.72
7 HDFC BANK LTD 179,512 30.04 2.47 52,257 8.74 1.86
8 ICICI BANK LTD. 143,745 24.05 1.98 96,682 16.18 3.44
9 STATE BANK OF INDIA 143,170 23.96 1.97 92,785 15.53 3.30
10 HDFC LTD 137,854 23.07 1.89 64,221 10.75 2.29
11 WIPRO LTD 133,945 22.41 1.84 24,046 4.02 0.86
12 HINDUSTAN UNILEVER LTD. 130,959 21.91 1.80 30,087 5.03 1.07
13 BHARTI AIRTEL LIMITED 127,017 21.26 1.75 37,382 6.26 1.33
14 SUN PHARMACEUTICALS IND.
119,040 19.92 1.64 28,170 4.71 1.00
15 LARSEN & TOUBRO LTD. 117,845 19.72 1.62 56,556 9.46 2.01
16 TATA MOTORS LIMITED 109,099 18.26 1.50 60,323 10.09 2.15
17 NTPC LTD 98,863 16.54 1.36 17,193 2.88 0.61
18 HCL TECHNOLOGIES LTD 97,242 16.27 1.34 36,512 6.11 1.30
19 AXIS BANK LIMITED 68,550 11.47 0.94 80,330 13.44 2.86
20 INDIAN OIL CORP LTD 68,383 11.44 0.94 3,367 0.56 0.12
21 CAIRN INDIA LIMITED 63,526 10.63 0.87 17,129 2.87 0.61
22 MAHINDRA & MAHINDRA LTD 60,401 10.11 0.83 25,869 4.33 0.92
23 BAJAJ AUTO LIMITED 60,293 10.09 0.83 17,480 2.93 0.62
24 KOTAK MAHINDRA BANK LTD 60,125 10.06 0.83 13,980 2.34 0.50
25 ULTRATECH CEMENT LIMITED
59,975 10.04 0.82 8,254 1.38 0.29
26 MARUTI SUZUKI INDIA LTD. 59,563 9.97 0.82 28,990 4.85 1.03
27 SESA STERLITE LIMITED 55,899 9.35 0.77 23,290 3.90 0.83
28 NMDC LTD. 55,209 9.24 0.76 8,686 1.45 0.31
29 POWER GRID CORP. LTD. 54,932 9.19 0.75 15,905 2.66 0.57
30 HINDUSTAN ZINC LIMITED 54,464 9.11 0.75 3,186 0.53 0.11
31 ASIAN PAINTS LIMITED 52,559 8.80 0.72 11,874 1.99 0.42
32 NESTLE INDIA LIMITED 48,485 8.11 0.67 4,617 0.77 0.16
33 BHEL 47,985 8.03 0.66 19,992 3.35 0.71
Contd...

43
Rank Name of Security and Industry
Market Capitalisation % Share in Total Market Capitalisation
Trading Volume During 2013-14
% Share in Total Trading Volume
(` Crores) (US $ bn) (` Crores) (US $ bn)
34 GAIL (INDIA) LTD 47,701 7.98 0.66 8,251 1.38 0.29
35 IDEA CELLULAR LIMITED 45,624 7.63 0.63 19,805 3.31 0.71
36 HERO MOTOCORP LIMITED 45,425 7.60 0.62 16,268 2.72 0.58
37 DR. REDDY'S LABORATORIES 43,614 7.30 0.60 19,182 3.21 0.68
38 TECH MAHINDRA LIMITED 41,886 7.01 0.58 33,230 5.56 1.18
39 LUPIN LIMITED 41,838 7.00 0.57 17,607 2.95 0.63
40 ADANI ENTERPRISES LIMITED 40,473 6.77 0.56 11,336 1.90 0.40
41 ADANI PORT & SEZ LTD 38,803 6.49 0.53 7,496 1.25 0.27
42 BHARTI INFRATEL LTD. 38,421 6.43 0.53 2,173 0.36 0.08
43 TATA STEEL LIMITED 38,261 6.40 0.53 44,632 7.47 1.59
44 UNITED SPIRITS LIMITED 34,627 5.79 0.48 59,309 9.92 2.11
45 BOSCH LIMITED 34,201 5.72 0.47 1,222 0.20 0.04
46 BHARAT PETROLEUM CORP LTD
33,265 5.57 0.46 11,579 1.94 0.41
47 DLF LIMITED 31,433 5.26 0.43 34,843 5.83 1.24
48 DABUR INDIA LTD 31,328 5.24 0.43 6,075 1.02 0.22
49 AMBUJA CEMENTS LTD 31,257 5.23 0.43 9,321 1.56 0.33
50 BANK OF BARODA 30,950 5.18 0.43 23,702 3.97 0.84
Total 4,700,293 864.19 64.58 1,529,134 281.15 54.45
Table 4-13: NSE’s 10 Most Active Trading days during the year 2013-2014
Sr.No. DateHighest Single Day Trading Value
(` Crores) (US $ bn)
1 27-Mar-2014 20,476 3.43
2 7-Mar-2014 19,150 3.20
3 20-Sep-2013 18,303 3.06
4 19-Sep-2013 18,130 3.03
5 10-Mar-2014 16,719 2.80
6 30-Aug-2013 16,681 2.79
7 31-Oct-2013 16,160 2.70
8 29-Aug-2013 15,790 2.64
9 25-Apr-2013 15,609 2.61
10 26-Nov-2013 15,506 2.59
Contd...
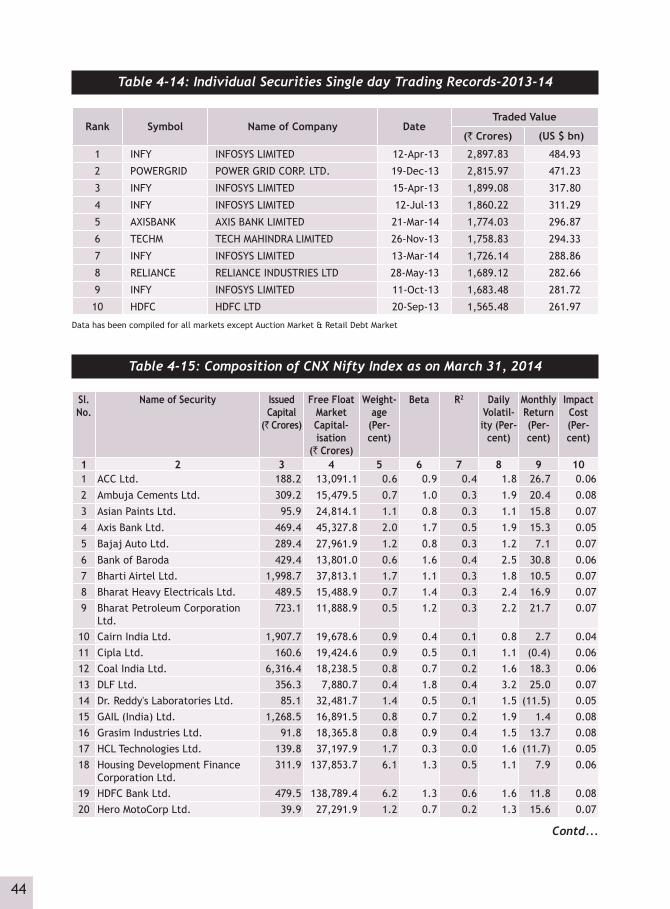
44
Table 4-14: Individual Securities Single day Trading Records-2013-14
Rank Symbol Name of Company DateTraded Value
(` Crores) (US $ bn)
1 INFY INFOSYS LIMITED 12-Apr-13 2,897.83 484.93
2 POWERGRID POWER GRID CORP. LTD. 19-Dec-13 2,815.97 471.23
3 INFY INFOSYS LIMITED 15-Apr-13 1,899.08 317.80
4 INFY INFOSYS LIMITED 12-Jul-13 1,860.22 311.29
5 AXISBANK AXIS BANK LIMITED 21-Mar-14 1,774.03 296.87
6 TECHM TECH MAHINDRA LIMITED 26-Nov-13 1,758.83 294.33
7 INFY INFOSYS LIMITED 13-Mar-14 1,726.14 288.86
8 RELIANCE RELIANCE INDUSTRIES LTD 28-May-13 1,689.12 282.66
9 INFY INFOSYS LIMITED 11-Oct-13 1,683.48 281.72
10 HDFC HDFC LTD 20-Sep-13 1,565.48 261.97
Data has been compiled for all markets except Auction Market & Retail Debt Market
Table 4-15: Composition of CNX Nifty Index as on March 31, 2014
Sl.No.
Name of Security Issued Capital
(` Crores)
Free Float Market Capital-isation
(` Crores)
Weight-age
(Per-cent)
Beta R2 Daily Volatil-ity (Per-
cent)
Monthly Return (Per-cent)
Impact Cost (Per-cent)
1 2 3 4 5 6 7 8 9 10 1 ACC Ltd. 188.2 13,091.1 0.6 0.9 0.4 1.8 26.7 0.06
2 Ambuja Cements Ltd. 309.2 15,479.5 0.7 1.0 0.3 1.9 20.4 0.08
3 Asian Paints Ltd. 95.9 24,814.1 1.1 0.8 0.3 1.1 15.8 0.07
4 Axis Bank Ltd. 469.4 45,327.8 2.0 1.7 0.5 1.9 15.3 0.05
5 Bajaj Auto Ltd. 289.4 27,961.9 1.2 0.8 0.3 1.2 7.1 0.07
6 Bank of Baroda 429.4 13,801.0 0.6 1.6 0.4 2.5 30.8 0.06 7 Bharti Airtel Ltd. 1,998.7 37,813.1 1.7 1.1 0.3 1.8 10.5 0.07 8 Bharat Heavy Electricals Ltd. 489.5 15,488.9 0.7 1.4 0.3 2.4 16.9 0.07 9 Bharat Petroleum Corporation
Ltd. 723.1 11,888.9 0.5 1.2 0.3 2.2 21.7 0.07
10 Cairn India Ltd. 1,907.7 19,678.6 0.9 0.4 0.1 0.8 2.7 0.04 11 Cipla Ltd. 160.6 19,424.6 0.9 0.5 0.1 1.1 (0.4) 0.06 12 Coal India Ltd. 6,316.4 18,238.5 0.8 0.7 0.2 1.6 18.3 0.06 13 DLF Ltd. 356.3 7,880.7 0.4 1.8 0.4 3.2 25.0 0.07 14 Dr. Reddy's Laboratories Ltd. 85.1 32,481.7 1.4 0.5 0.1 1.5 (11.5) 0.05 15 GAIL (India) Ltd. 1,268.5 16,891.5 0.8 0.7 0.2 1.9 1.4 0.08 16 Grasim Industries Ltd. 91.8 18,365.8 0.8 0.9 0.4 1.5 13.7 0.08 17 HCL Technologies Ltd. 139.8 37,197.9 1.7 0.3 0.0 1.6 (11.7) 0.05 18 Housing Development Finance
Corporation Ltd. 311.9 137,853.7 6.1 1.3 0.5 1.1 7.9 0.06
19 HDFC Bank Ltd. 479.5 138,789.4 6.2 1.3 0.6 1.6 11.8 0.08 20 Hero MotoCorp Ltd. 39.9 27,291.9 1.2 0.7 0.2 1.3 15.6 0.07
Contd...

45
Sl.No.
Name of Security Issued Capital
(` Crores)
Free Float Market Capital-isation
(` Crores)
Weight-age
(Per-cent)
Beta R2 Daily Volatil-ity (Per-
cent)
Monthly Return (Per-cent)
Impact Cost (Per-cent)
1 2 3 4 5 6 7 8 9 10 21 Hindalco Industries Ltd. 206.5 18,232.5 0.8 1.2 0.3 3.1 34.6 0.07
22 Hindustan Unilever Ltd. 216.3 42,851.1 1.9 0.6 0.1 1.0 10.3 0.06
23 ICICI Bank Ltd. 1,154.5 143,744.8 6.4 1.6 0.6 1.9 19.3 0.05
24 IDFC Ltd. 1,516.2 15,340.1 0.7 1.7 0.5 2.5 30.0 0.07
25 IndusInd Bank Ltd. 525.4 21,381.3 1.0 1.7 0.5 2.2 26.3 0.07
26 Infosys Ltd. 287.1 158,470.0 7.1 0.5 0.1 2.0 (14.2) 0.04
27 I T C Ltd. 794.6 195,115.6 8.7 0.9 0.4 1.0 7.7 0.06
28 Jindal Steel & Power Ltd. 91.5 10,791.0 0.5 1.1 0.2 1.8 22.2 0.07
29 Kotak Mahindra Bank Ltd. 384.9 29,755.9 1.3 1.3 0.5 1.8 14.1 0.07
30 Larsen & Toubro Ltd. 185.3 103,642.9 4.6 1.5 0.6 1.6 14.6 0.06
31 Lupin Ltd. 89.7 22,273.9 1.0 0.4 0.1 1.1 (6.3) 0.06
32 Mahindra & Mahindra Ltd. 307.9 45,155.9 2.0 0.8 0.3 1.7 0.6 0.07
33 Maruti Suzuki India Ltd. 151.0 26,084.6 1.2 0.9 0.2 2.2 24.1 0.06
34 United Spirits Ltd. 130.8 20,890.5 0.9 0.7 0.1 1.6 10.9 0.05
35 NMDC Ltd. 396.5 11,039.3 0.5 0.9 0.3 1.7 9.2 0.06
36 NTPC Ltd. 8,245.5 24,715.8 1.1 0.7 0.2 1.3 6.7 0.05
37 Oil & Natural Gas Corporation Ltd.
4,277.7 56,391.4 2.5 1.2 0.4 2.0 9.4 0.07
38 Punjab National Bank 362.1 11,076.8 0.5 1.6 0.5 2.4 34.7 0.06
39 Power Grid Corporation of India Ltd.
5,231.6 23,128.9 1.0 0.6 0.2 1.5 11.1 0.06
40 Reliance Industries Ltd. 3,231.7 153,021.3 6.8 1.1 0.5 1.7 16.4 0.04
41 State Bank of India 746.6 59,278.7 2.6 1.1 0.4 1.7 25.1 0.05
42 Sesa Sterlite Ltd. 296.5 23,305.5 1.0 1.1 0.2 2.1 6.1 0.07
43 Sun Pharmaceutical Industries Ltd.
207.1 43,268.5 1.9 0.6 0.1 2.0 (10.9) 0.06
44 Tata Motors Ltd. 547.3 71,643.6 3.2 1.0 0.3 1.5 (4.4) 0.06
45 Tata Power Co. Ltd. 270.5 15,556.0 0.7 1.0 0.2 1.9 12.0 0.07
46 Tata Steel Ltd. 971.2 26,264.7 1.2 1.3 0.3 2.2 14.6 0.05
47 Tata Consultancy Services Ltd. 195.9 109,065.1 4.9 0.5 0.1 1.7 (6.3) 0.05
48 Tech Mahindra Ltd. 233.3 26,662.6 1.2 0.3 0.0 1.6 (3.9) 0.05
49 UltraTech Cement Ltd. 274.2 22,219.9 1.0 0.9 0.3 1.5 18.9 0.06
50 Wipro Ltd. 493.2 35,502.5 1.6 0.3 0.0 1.5 (9.0) 0.05
TOTAL 2,245,636 100.0 0.06
Note :• Beta & R2 are calculated for the period 01-Apr-2013 to 31-Mar-2014• Beta measures the degree to which any portfolio of stocks is affected as compared to the effect on the market as a whole.• The coefficient of determination (R2) measures the strength of relationship between two variables the return on a security versus
that of the market.• Volatility is the Std. deviation of the daily returns for the period 01-Mar-2014 to 31-Mar-2014• Last day of trading was 31-Mar-2014• Impact Cost for CNX Nifty is for a portfolio of ` 50 Lakhs • Impact Cost for CNX Nifty is the weightage average impact cost
Contd...
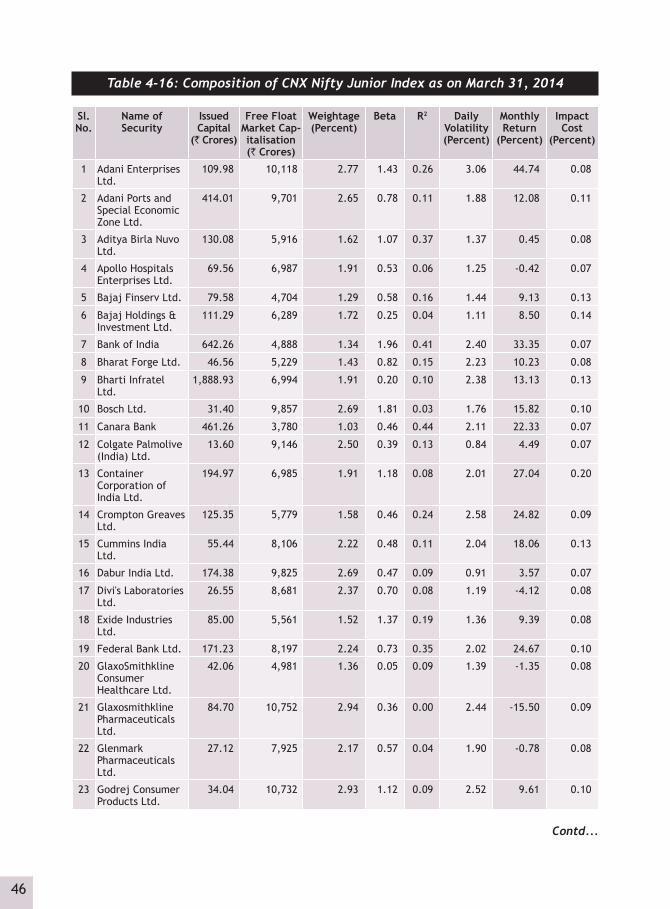
46
Table 4-16: Composition of CNX Nifty Junior Index as on March 31, 2014
Sl. No.
Name of Security
Issued Capital
(` Crores)
Free Float Market Cap-italisation (` Crores)
Weightage (Percent)
Beta R2 Daily Volatility (Percent)
Monthly Return
(Percent)
Impact Cost
(Percent)
1 Adani Enterprises Ltd.
109.98 10,118 2.77 1.43 0.26 3.06 44.74 0.08
2 Adani Ports and Special Economic Zone Ltd.
414.01 9,701 2.65 0.78 0.11 1.88 12.08 0.11
3 Aditya Birla Nuvo Ltd.
130.08 5,916 1.62 1.07 0.37 1.37 0.45 0.08
4 Apollo Hospitals Enterprises Ltd.
69.56 6,987 1.91 0.53 0.06 1.25 -0.42 0.07
5 Bajaj Finserv Ltd. 79.58 4,704 1.29 0.58 0.16 1.44 9.13 0.13
6 Bajaj Holdings & Investment Ltd.
111.29 6,289 1.72 0.25 0.04 1.11 8.50 0.14
7 Bank of India 642.26 4,888 1.34 1.96 0.41 2.40 33.35 0.07
8 Bharat Forge Ltd. 46.56 5,229 1.43 0.82 0.15 2.23 10.23 0.08
9 Bharti Infratel Ltd.
1,888.93 6,994 1.91 0.20 0.10 2.38 13.13 0.13
10 Bosch Ltd. 31.40 9,857 2.69 1.81 0.03 1.76 15.82 0.10
11 Canara Bank 461.26 3,780 1.03 0.46 0.44 2.11 22.33 0.07
12 Colgate Palmolive (India) Ltd.
13.60 9,146 2.50 0.39 0.13 0.84 4.49 0.07
13 Container Corporation of India Ltd.
194.97 6,985 1.91 1.18 0.08 2.01 27.04 0.20
14 Crompton Greaves Ltd.
125.35 5,779 1.58 0.46 0.24 2.58 24.82 0.09
15 Cummins India Ltd.
55.44 8,106 2.22 0.48 0.11 2.04 18.06 0.13
16 Dabur India Ltd. 174.38 9,825 2.69 0.47 0.09 0.91 3.57 0.07
17 Divi's Laboratories Ltd.
26.55 8,681 2.37 0.70 0.08 1.19 -4.12 0.08
18 Exide Industries Ltd.
85.00 5,561 1.52 1.37 0.19 1.36 9.39 0.08
19 Federal Bank Ltd. 171.23 8,197 2.24 0.73 0.35 2.02 24.67 0.10
20 GlaxoSmithkline Consumer Healthcare Ltd.
42.06 4,981 1.36 0.05 0.09 1.39 -1.35 0.08
21 Glaxosmithkline Pharmaceuticals Ltd.
84.70 10,752 2.94 0.36 0.00 2.44 -15.50 0.09
22 Glenmark Pharmaceuticals Ltd.
27.12 7,925 2.17 0.57 0.04 1.90 -0.78 0.08
23 Godrej Consumer Products Ltd.
34.04 10,732 2.93 1.12 0.09 2.52 9.61 0.10
Contd...

47
Sl. No.
Name of Security
Issued Capital
(` Crores)
Free Float Market Cap-italisation (` Crores)
Weightage (Percent)
Beta R2 Daily Volatility (Percent)
Monthly Return
(Percent)
Impact Cost
(Percent)
24 Hindustan Petroleum Corporation Ltd.
338.63 5,129 1.40 1.28 0.26 1.96 17.02 0.09
25 ING Vysya Bank Ltd.
188.55 6801 1.86 0.71 0.28 2.09 16.24 0.13
26 Idea Cellular Ltd. 3,319.32 11,101 3.03 1.17 0.12 1.51 6.63 0.07
27 JSW Steel Ltd. 241.72 11,942 3.26 1.63 0.27 2.13 18.28 0.08
28 LIC Housing Finance Ltd.
100.93 7113 1.94 0.91 0.51 1.61 14.41 0.07
29 Mahindra & Mahindra Financial Services Ltd.
113.75 6,855 1.87 0.39 0.11 2.26 1.53 0.07
30 MphasiS Ltd. 210.13 2,966 0.81 0.86 0.04 2.42 4.16 0.10
31 Oil India Ltd. 601.14 6,595 1.80 0.20 0.23 1.60 6.26 0.08
32 Oracle Financial Services Software Ltd.
42.06 6,505 1.78 0.67 0.02 1.04 -0.86 0.11
33 Petronet LNG Ltd. 750.00 4,110 1.12 1.64 0.19 1.28 13.18 0.08
34 Power Finance Corporation Ltd.
1,320.04 6,704 1.83 1.74 0.37 2.79 17.38 0.08
35 Ranbaxy Laboratories Ltd.
211.89 5,658 1.55 1.61 0.11 1.71 -0.26 0.07
36 Reliance Capital Ltd.
245.63 3,897 1.07 1.33 0.56 1.49 12.25 0.06
37 Reliance Communications Ltd.
1,032.01 8,568 2.34 1.45 0.26 1.96 14.78 0.08
38 Reliance Power Ltd.
2,805.13 4,958 1.36 0.87 0.40 1.98 14.14 0.08
39 Rural Electrification Corporation Ltd.
987.46 7,531 2.06 1.08 0.42 2.39 18.65 0.09
40 Shriram Transport Finance Co. Ltd.
226.88 12,900 3.53 0.98 0.17 2.60 29.81 0.11
41 Siemens Ltd. 71.22 6,876 1.88 0.57 0.26 1.64 24.61 0.08
42 Steel Authority of India Ltd.
4,130.53 5,899 1.61 0.69 0.24 2.98 28.19 0.08
43 Tata Chemicals Ltd.
254.76 5,044 1.38 0.34 0.20 2.10 7.22 0.09
44 Tata Global Beverages Ltd.
61.84 6,022 1.65 1.01 0.17 1.52 7.41 0.07
45 Titan Company Ltd.
88.78 10,949 2.99 0.76 0.21 1.80 8.33 0.08
46 UPL Ltd. 85.72 5,624 1.54 1.91 0.12 1.16 0.90 0.08
47 Union Bank of India
630.31 3,453 0.94 0.80 0.44 2.72 33.53 0.07
Contd...
Contd...
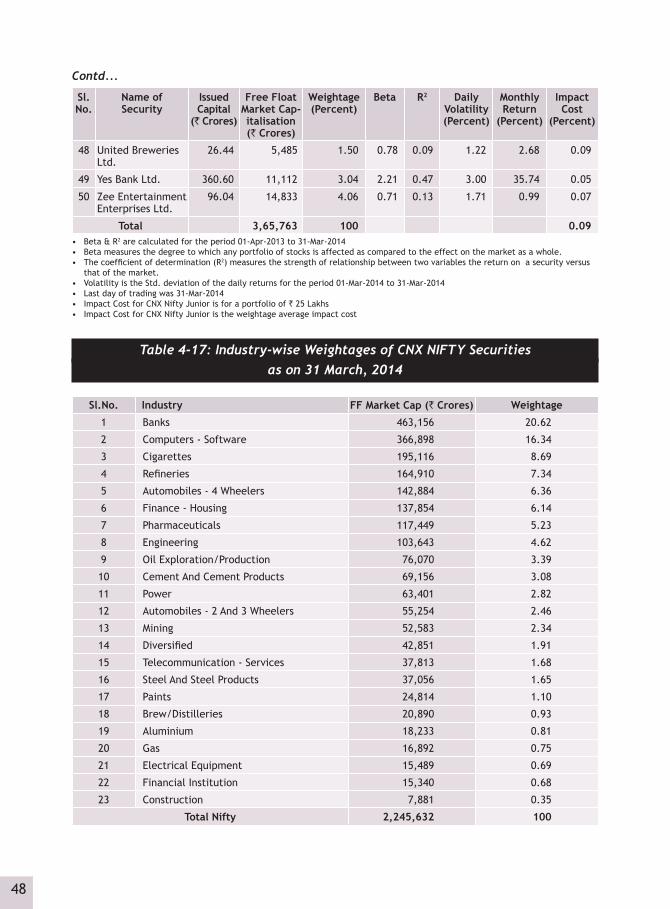
48
Sl. No.
Name of Security
Issued Capital
(` Crores)
Free Float Market Cap-italisation (` Crores)
Weightage (Percent)
Beta R2 Daily Volatility (Percent)
Monthly Return
(Percent)
Impact Cost
(Percent)
48 United Breweries Ltd.
26.44 5,485 1.50 0.78 0.09 1.22 2.68 0.09
49 Yes Bank Ltd. 360.60 11,112 3.04 2.21 0.47 3.00 35.74 0.05
50 Zee Entertainment Enterprises Ltd.
96.04 14,833 4.06 0.71 0.13 1.71 0.99 0.07
Total 3,65,763 100 0.09• Beta & R2 are calculated for the period 01-Apr-2013 to 31-Mar-2014• Beta measures the degree to which any portfolio of stocks is affected as compared to the effect on the market as a whole.• The coefficient of determination (R2) measures the strength of relationship between two variables the return on a security versus
that of the market.• Volatility is the Std. deviation of the daily returns for the period 01-Mar-2014 to 31-Mar-2014• Last day of trading was 31-Mar-2014• Impact Cost for CNX Nifty Junior is for a portfolio of ` 25 Lakhs • Impact Cost for CNX Nifty Junior is the weightage average impact cost
stry-wise Weightages of CNX NIFTY Secuties Table 4-17: Industry-wise Weightages of CNX NIFTY Securities
as on 31 March, 2014
Sl.No. Industry FF Market Cap (` Crores) Weightage
1 Banks 463,156 20.62
2 Computers - Software 366,898 16.34
3 Cigarettes 195,116 8.69
4 Refineries 164,910 7.34
5 Automobiles - 4 Wheelers 142,884 6.36
6 Finance - Housing 137,854 6.14
7 Pharmaceuticals 117,449 5.23
8 Engineering 103,643 4.62
9 Oil Exploration/Production 76,070 3.39
10 Cement And Cement Products 69,156 3.08
11 Power 63,401 2.82
12 Automobiles - 2 And 3 Wheelers 55,254 2.46
13 Mining 52,583 2.34
14 Diversified 42,851 1.91
15 Telecommunication - Services 37,813 1.68
16 Steel And Steel Products 37,056 1.65
17 Paints 24,814 1.10
18 Brew/Distilleries 20,890 0.93
19 Aluminium 18,233 0.81
20 Gas 16,892 0.75
21 Electrical Equipment 15,489 0.69
22 Financial Institution 15,340 0.68
23 Construction 7,881 0.35
Total Nifty 2,245,632 100
Contd...

49
Table 4-18: CNX NIFTY Index*
Month & Year Open High Low Close Volatility (%)
Price To Earning Ratio#
1995-96 (Nov.-Mar.) 1,000.00 1,067.49 813.12 985.30 1.62 --
1996-97 988.33 1,203.11 775.43 968.30 1.67 --
1997-98 931.95 1,297.10 929.05 1,116.90 1.52 --
1998-99 1,117.15 1,247.15 800.10 1,078.05 1.86 16.53
1999-2000 1,082.55 1,818.15 916.00 1,528.45 1.93 24.60
2000-01 1,528.70 1,636.95 1,098.75 1,148.20 1.98 17.21
2001-02 1,148.10 1,207.00 849.95 1,129.55 1.40 18.10
2002-03 1,129.85 1,153.30 920.10 978.20 0.99 13.36
2003-04 977.40 2,014.65 920.00 1,771.90 1.43 20.70
2004-05 1,771.45 2,183.45 1,292.20 2,035.65 1.61 14.60
2005-06 2,035.90 3,433.85 1,896.30 3,402.55 1.04 20.26
2006-07 3,403.15 4,245.30 2,595.65 3,821.55 1.77 18.40
2007-08 3,820.00 6,357.100 3,617.000 4,734.500 2.02 20.63
2008-09 4,735.65 5,298.85 2,252.75 3,020.95 2.66 14.30
2009-2010 3,023.85 5,329.55 2,965.70 5,249.10 1.88 22.33
2010-11 5,249.20 6,338.500 4,786.450 5,833.75 1.12 22.14
2011-12 5,835.00 5,944.450 4,531.150 5,295.55 1.29 18.71
Apr-12 5,296.35 5,378.750 5,154.300 5,248.15 0.84 18.12
May-12 5,254.30 5,279.600 4,788.950 4,924.25 0.98 16.66
Jun-12 4,910.85 5,286.250 4,770.350 5,278.90 1.14 17.51
Jul-12 5,283.85 5,348.550 5,032.400 5,229.00 0.89 17.09
Aug-12 5,220.70 5,448.600 5,164.650 5,258.50 0.62 17.64
Sep-12 5,276.50 5,735.150 5,215.700 5,703.30 0.96 19.17
Oct-12 5,704.75 5,815.350 4,888.200 5,619.70 0.71 18.40
Nov-12 5,609.85 5,885.250 5,548.350 5,879.85 0.73 18.59
Dec-12 5,878.25 5,965.150 5,823.150 5,905.10 0.52 18.68
Jan-13 5,937.65 6,111.800 5,935.200 6,034.75 0.55 18.50
Feb-13 6,040.95 6,052.950 5,671.900 5,693.05 0.69 17.66
Mar-13 5,702.45 5,971.20 5,604.85 5,682.55 1.50 17.57
2012-13 5,296.35 6,111.80 4,770.35 5,682.55 0.82 17.57
Apr-13 5,697.35 5,962.30 5,477.20 5,930.20 0.99 17.85
May-13 5,911.40 6,229.45 5,910.95 5,985.95 1.15 17.95
Jun-13 5,997.35 6,011.00 5,566.25 5,842.20 1.23 17.76
Jul-13 5,834.10 6,093.35 5,675.75 5,742.00 1.03 17.05
Aug-13 5,776.90 5,808.50 5,118.85 5,471.80 1.71 15.77
Sep-13 5,480.25 6,142.50 5,318.90 5,735.30 1.90 16.82
Oct-13 5,756.10 6,309.05 5,700.95 6,299.15 0.91 18.18
Contd...

50
Month & Year Open High Low Close Volatility (%)
Price To Earning Ratio#
Nov-13 6,289.75 6,342.95 5,972.45 6,176.10 1.10 18.38
Dec-13 6,171.15 6,415.25 6,129.95 6,304.00 1.25 18.7
Jan-14 6,323.80 6,358.30 6,027.25 6,089.50 0.79 17.7
Feb-14 6,058.80 6,282.70 5,933.30 6,276.95 0.70 17.67
Mar-14 6,264.35 6,730.05 6,212.25 6,704.20 0.72 18.86
2013-14 5,697.35 6,730.05 5,118.85 6,704.20 1.13 18.86
* CNX Nifty commenced from November 3, 1995 # At the end of the period Note : Volatility is calculated as standard deviation of the Natural Log of returns for the respective month/year
Table 4-19: CNX NIFTY Junior Index*
Month & Year Open High Low Close Volatility (%)
Price To Earning Ratio#
1996-97 (Nov.-Mar.) 1,000.00 1,208.87 907.02 1,032.95 1.76 --
1997-98 1,028.30 1,395.25 1,016.65 1,339.40 1.44 --
1998-99 1,339.75 2,079.10 1,177.20 2,069.20 2.14 18.92
1999-2000 2,099.75 5,365.90 1,631.90 3,695.75 2.46 33.47
2000-01 3,720.45 3,771.80 1,570.20 1,601.80 2.75 9.69
2001-02 1,601.40 1,676.25 1,038.75 1,566.95 1.60 6.80
2002-03 1,568.40 1,690.35 1,231.95 1,259.55 1.23 11.68
2003-04 1,260.75 3,702.60 1,259.75 3,392.05 1.57 11.93
2004-05 3,398.00 4,705.25 2,493.70 4,275.15 1.83 13.82
2005-06 4,275.35 6,437.40 3,998.80 6,412.10 0.95 20.25
2006-07 6,415.25 7,566.65 4,463.75 6,878.05 2.05 18.48
2007-08 6,675.85 13,209.35 6,559.55 7,975.75 2.41 16.69
2008-09 7,982.75 9,541.00 3,587.60 4,336.45 2.80 8.69
2009-2010 4,343.20 10,896.50 4,297.45 10,773.75 1.97 15.76
2010-11 10,777.00 13,624.10 10,037.90 11,279.55 1.14 16.18
2011-12 11,319.20 11,758.15 8,224.15 10,450.20 1.26 15.87
Apr-12 10,449.80 10,699.05 10,050.30 10,226.25 0.80 17.50
May-12 10,231.60 10,304.20 9,333.95 9,563.15 0.58 16.11
Jun-12 9,563.40 10,118.40 9,268.50 10,099.55 1.00 15.50
Jul-12 10,102.75 10,412.65 9,756.30 10,028.55 0.86 15.14
Aug-12 10,029.35 10,288.45 9,821.45 9,892.15 0.54 17.54
Sep-12 9,895.85 11,073.75 9,851.55 11,042.75 0.67 19.99
Oct-12 11,044.70 11,353.90 10,733.10 10,898.45 0.76 18.87
Nov-12 10,899.45 11,805.25 10,899.45 11,790.60 0.81 16.91
Dec-12 11,794.00 12,348.80 11,793.10 12,340.05 0.66 17.79
Contd...
Contd...

51
Month & Year Open High Low Close Volatility (%)
Price To Earning Ratio#
Jan-13 12,345.60 12,744.00 12,042.20 12,270.55 0.85 17.26
Feb-13 12,272.40 12,393.50 11,425.35 11,457.75 0.92 17.19
Mar-13 11,459.30 11,932.85 10,973.50 11,222.80 1.08 16.84
2012-13 10,449.80 12,744.00 9,268.50 11,222.80 0.86 16.84
Apr-13 11,238.05 12,066.20 11,046.40 12,042.40 0.90 18.72
May-13 12,020.20 12,798.05 12,020.20 12,312.05 0.93 19.23
Jun-13 12,313.30 12,530.80 11,086.90 11,546.65 1.30 16.90
Jul-13 11,575.50 12,058.45 10,905.05 11,161.95 1.20 16.75
Aug-13 11,197.45 11,351.95 9,951.40 10,494.40 1.76 12.88
Sep-13 10,525.90 11,545.15 10,310.65 11,208.00 1.52 13.42
Oct-13 11,231.85 12,231.60 11,093.25 12,209.40 0.86 14.56
Nov-13 12,182.70 12,395.70 11,857.80 12,363.40 1.02 15.08
Dec-13 12,392.55 12,979.00 12,139.05 12,933.25 1.19 16.00
Jan-14 12,967.50 13,088.95 11,704.25 11,993.05 1.12 14.67
Feb-14 11,971.80 12,213.35 11,709.65 12,180.00 0.63 15.49
Mar-14 12,168.65 13,488.20 12,125.85 13,469.05 0.67 17.28
2013-14 11,238.05 13,488.20 9,951.40 13,469.05 1.14 17.28
* CNX Nifty Junior commenced from November 4, 1996# At the end of period
Note : Volatility is calculated as standard deviation of the Natural Log of returns for the respective month/year
Table 4-20: Performance of NSE Indices during the year 2013-14
IndicesRecord high Closing Index
Values (31-03-14)
Avg. Daily Volatility
(%)
Y-o-Y ReturnsValue Date
CNX 100 6,616.60 3/31/2014 6,597.05 1.12 18.25
CNX 500 5,234.30 3/31/2014 5,224.85 1.06 17.72
CNX FMCG 19,539.40 7/24/2013 18,085.25 1.27 18.04
CNX IT 10,398.15 3/3/2014 9,298.00 1.48 28.80
CNX Midcap 8,623.95 3/31/2014 8,612.45 1.07 16.36
CNX Nifty 6,730.05 3/31/2014 6,704.20 1.14 17.98
CNX Nifty Junior 13,488.20 3/31/2014 13,469.05 1.13 20.02
IISL CNX Finance* 5,114.90 3/31/2014 5,114.90 1.14 15.35
Nifty Midcap 50 2,469.20 3/31/2014 2,465.15 1.36 27.53
IISL CNX Petrochemicals* 13,021.20 6/5/2013 11,553.39 1.29 0.92
IISL CNX Pharmaceuticals* 12,870.46 2/28/2014 12,043.97 0.96 26.60
* * Closing Record High, Other - Record Intra-day High
Note : Volatility is calculated as standard deviation of the Natural Log of returns for the respective month/year
Contd...

52
Table 4-21: Mutual Funds/ETFs: No of Trades and Trading Value
Month & Year
Mutual Funds Exchange traded funds
No. of Trades
Trading Value No. of Trades
Trading Value
(` Crores) (US $ mn) (` Crores) (US $ mn)
Apr-13 44 0.08 0.01 496,524 1,373.27 229.80
May-13 33 14.77 2.47 480,614 1,727.57 289.10
Jun-13 45 4.66 0.78 348,170 1,059.97 177.38
Jul-13 31 1.17 0.20 274,106 926.90 155.11
Aug-13 28 4.62 0.77 391,170 1,324.21 221.60
Sep-13 71 23.45 3.92 284,052 1,011.41 169.25
Oct-13 109 0.47 0.08 235,961 778.26 130.24
Nov-13 26 0.18 0.03 201,950 623.06 104.26
Dec-13 45 0.22 0.04 214,274 910.69 152.40
Jan-14 81 29.53 4.94 173,004 784.30 131.25
Feb-14 43 0.15 0.03 128,567 623.50 104.34
Mar-14 68 3.61 0.60 204,928 1,091.31 182.62
2013-14 624 82.9 13.88 3,433,320 12,234 2,047.33
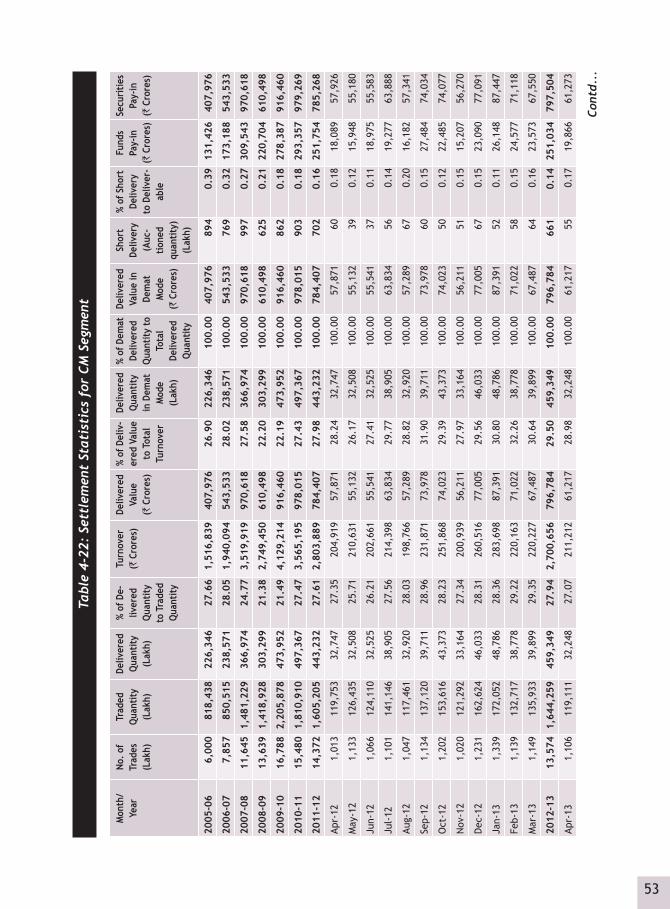
53
Tabl
e 4-
22:
Sett
lem
ent
Stat
isti
cs f
or C
M S
egm
ent
Mon
th/
Year
No. o
f Tr
ades
(L
akh)
Trad
ed
Qua
ntity
(L
akh)
Deliv
ered
Q
uant
ity
(Lak
h)
% of
De-
liver
ed
Qua
ntity
to
Tra
ded
Qua
ntity
Turn
over
(`
Cro
res)
Deliv
ered
Va
lue
(`
Cro
res)
% of
Del
iv-
ered
Val
ue
to T
otal
Tu
rnov
er
Deliv
ered
Q
uant
ity
in D
emat
M
ode
(Lak
h)
% of
Dem
at
Deliv
ered
Q
uant
ity t
o To
tal
Deliv
ered
Q
uant
ity
Deliv
ered
Va
lue
in
Dem
at
Mod
e
(` C
rore
s)
Shor
t De
liver
y (A
uc-
tione
d qu
antit
y)
(Lak
h)
% of
Sho
rt
Deliv
ery
to D
eliv
er-
able
Fund
s Pa
y-in
(`
Cro
res)
Secu
ritie
s Pa
y-in
(`
Cro
res)
2005
-06
6,00
081
8,43
822
6,34
627
.66
1,51
6,83
940
7,97
626
.90
226,
346
100.
0040
7,97
689
40.
3913
1,42
640
7,97
6
2006
-07
7,85
785
0,51
523
8,57
128
.05
1,94
0,09
454
3,53
328
.02
238,
571
100.
0054
3,53
376
90.
3217
3,18
854
3,53
3
2007
-08
11,6
45 1
,481
,229
36
6,97
424
.77
3,51
9,91
997
0,61
8 2
7.58
36
6,97
410
0.00
970,
618
997
0.27
309,
543
970,
618
2008
-09
13,6
391,
418,
928
303,
299
21.
38
2,74
9,45
061
0,49
8 2
2.20
30
3,29
910
0.00
610,
498
625
0.21
220,
704
610,
498
2009
-10
16,
788
2,2
05,8
78
473
,952
2
1.49
4,
129,
214
916
,460
2
2.19
4
73,9
52
100
.00
916
,460
8
62
0.1
8 2
78,3
87
916
,460
2010
-11
15,
480
1,8
10,9
10
497
,367
2
7.47
3,
565,
195
978
,015
2
7.43
4
97,3
67
100
.00
978
,015
9
03
0.1
8 2
93,3
57
979
,269
2011
-12
14,
372
1,6
05,2
05
443
,232
2
7.61
2,
803,
889
784
,407
2
7.98
4
43,2
32
100
.00
784
,407
7
02
0.1
6 2
51,7
54
785
,268
Apr-
121,
013
119,
753
32,7
4727
.35
204,
919
57,8
7128
.24
32,7
4710
0.00
57,8
7160
0.18
18,0
8957
,926
May
-12
1,13
312
6,43
532
,508
25.7
121
0,63
155
,132
26.1
732
,508
100.
0055
,132
390.
1215
,948
55,1
80
Jun-
121,
066
124,
110
32,5
2526
.21
202,
661
55,5
4127
.41
32,5
2510
0.00
55,5
4137
0.11
18,9
7555
,583
Jul-
121,
101
141,
146
38,9
0527
.56
214,
398
63,8
3429
.77
38,9
0510
0.00
63,8
3456
0.14
19,2
7763
,888
Aug-
121,
047
117,
461
32,9
2028
.03
198,
766
57,2
8928
.82
32,9
2010
0.00
57,2
8967
0.20
16,1
8257
,341
Sep-
121,
134
137,
120
39,7
1128
.96
231,
871
73,9
7831
.90
39,7
1110
0.00
73,9
7860
0.15
27,4
8474
,034
Oct
-12
1,20
215
3,61
643
,373
28.2
325
1,86
874
,023
29.3
943
,373
100.
0074
,023
500.
1222
,485
74,0
77
Nov
-12
1,02
012
1,29
233
,164
27.3
420
0,93
956
,211
27.9
733
,164
100.
0056
,211
510.
1515
,207
56,2
70
Dec
-12
1,23
116
2,62
446
,033
28.3
126
0,51
677
,005
29.5
646
,033
100.
0077
,005
670.
1523
,090
77,0
91
Jan-
131,
339
172,
052
48,7
8628
.36
283,
698
87,3
9130
.80
48,7
8610
0.00
87,3
9152
0.11
26,1
4887
,447
Feb-
131,
139
132,
717
38,7
7829
.22
220,
163
71,0
2232
.26
38,7
7810
0.00
71,0
2258
0.15
24,5
7771
,118
Mar
-13
1,14
913
5,93
339
,899
29.3
522
0,22
767
,487
30.6
439
,899
100.
0067
,487
640.
1623
,573
67,5
50
2012
-13
13,5
741,
644,
259
459,
349
27.9
42,
700,
656
796,
784
29.5
045
9,34
910
0.00
796,
784
661
0.14
251,
034
797,
504
Apr-
131,
106
119,
111
32,2
4827
.07
211,
212
61,2
1728
.98
32,2
4810
0.00
61,2
1755
0.17
19,8
6661
,273
Cont
d...
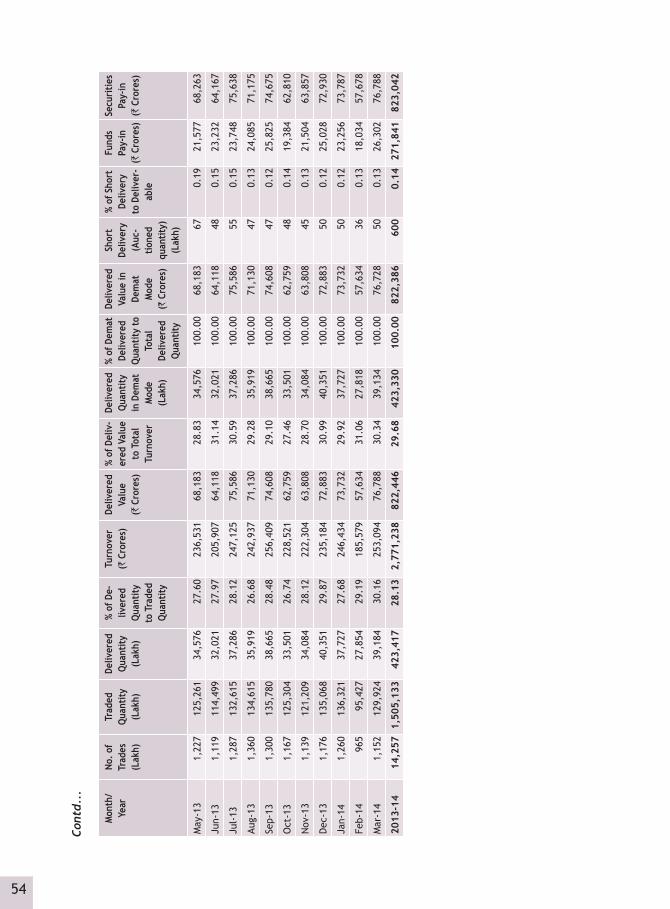
54
Mon
th/
Year
No. o
f Tr
ades
(L
akh)
Trad
ed
Qua
ntity
(L
akh)
Deliv
ered
Q
uant
ity
(Lak
h)
% of
De-
liver
ed
Qua
ntity
to
Tra
ded
Qua
ntity
Turn
over
(`
Cro
res)
Deliv
ered
Va
lue
(`
Cro
res)
% of
Del
iv-
ered
Val
ue
to T
otal
Tu
rnov
er
Deliv
ered
Q
uant
ity
in D
emat
M
ode
(Lak
h)
% of
Dem
at
Deliv
ered
Q
uant
ity t
o To
tal
Deliv
ered
Q
uant
ity
Deliv
ered
Va
lue
in
Dem
at
Mod
e
(` C
rore
s)
Shor
t De
liver
y (A
uc-
tione
d qu
antit
y)
(Lak
h)
% of
Sho
rt
Deliv
ery
to D
eliv
er-
able
Fund
s Pa
y-in
(`
Cro
res)
Secu
ritie
s Pa
y-in
(`
Cro
res)
May
-13
1,22
712
5,26
134
,576
27.6
023
6,53
168
,183
28.8
334
,576
100.
0068
,183
670.
1921
,577
68,2
63
Jun-
131,
119
114,
499
32,0
2127
.97
205,
907
64,1
1831
.14
32,0
2110
0.00
64,1
1848
0.15
23,2
3264
,167
Jul-
131,
287
132,
615
37,2
8628
.12
247,
125
75,5
8630
.59
37,2
8610
0.00
75,5
8655
0.15
23,7
4875
,638
Aug-
131,
360
134,
615
35,9
1926
.68
242,
937
71,1
3029
.28
35,9
1910
0.00
71,1
3047
0.13
24,0
8571
,175
Sep-
131,
300
135,
780
38,6
6528
.48
256,
409
74,6
0829
.10
38,6
6510
0.00
74,6
0847
0.12
25,8
2574
,675
Oct
-13
1,16
712
5,30
433
,501
26.7
422
8,52
162
,759
27.4
633
,501
100.
0062
,759
480.
1419
,384
62,8
10
Nov
-13
1,13
912
1,20
934
,084
28.1
222
2,30
463
,808
28.7
034
,084
100.
0063
,808
450.
1321
,504
63,8
57
Dec
-13
1,17
613
5,06
840
,351
29.8
723
5,18
472
,883
30.9
940
,351
100.
0072
,883
500.
1225
,028
72,9
30
Jan-
141,
260
136,
321
37,7
2727
.68
246,
434
73,7
3229
.92
37,7
2710
0.00
73,7
3250
0.12
23,2
5673
,787
Feb-
1496
595
,427
27,8
5429
.19
185,
579
57,6
3431
.06
27,8
1810
0.00
57,6
3436
0.13
18,0
3457
,678
Mar
-14
1,15
212
9,92
439
,184
30.1
625
3,09
476
,788
30.3
439
,134
100.
0076
,728
500.
1326
,302
76,7
88
2013
-14
14,2
571,
505,
133
423,
417
28.1
32,
771,
238
822,
446
29.6
842
3,33
010
0.00
822,
386
600
0.14
271,
841
823,
042
Cont
d...

Wholesale Debt Market Segment 5

56

57
5
Cont
d...
Wholesale Debt Market SegmentTa
ble
5-1:
Bus
ines
s G
row
th o
f W
DM
Seg
men
t
Mon
th /
Year
All
Trad
esRe
tail
Trad
e
No.
of
acti
ve
secu
riti
es
Num
ber
of T
rade
sTr
adin
g Vo
lum
eAv
erag
e D
aily
Tra
ding
Vo
lum
e A
vera
ge
Trad
e Si
ze
Num
ber
of T
rade
sTr
adin
g Vo
lum
eSh
are
in T
otal
Tr
adin
g Vo
lum
e
(`
Cror
es)
(U
S $
mn)
(`
Cror
es)
(U
S $
mn)
(`
Cror
es)
(`
Cror
es)
(US
$ m
n)(%
)
1994
- 95
(Ju
n-M
ar)
183
1,02
1 6
,781
2,1
57 3
0 1
0 6
.64
168
319.
860.
4519
95-9
6 3
042,
991
11,
868
3,4
55 4
1 1
2 3
.97
1,11
520
760
.26
1.74
1996
-97
524
7,80
4 4
2,27
8 1
1,78
3 1
45 4
0 5
.42
1,06
120
156
.02
0.47
1997
-98
719
16,8
21 1
11,2
63 2
8,14
6 3
85 9
7 6
.61
1,39
028
973
.02
0.26
1998
-99
1,0
7116
,092
105
,469
24,
857
365
86
6.5
51,
522
308
72.5
40.
2919
99-0
0 1
,057
46,9
87 3
04,2
16 6
9,74
2 1
,035
237
6.4
793
621
849
.92
0.07
2000
-01
1,0
3864
,470
428
,582
91,
891
1,4
83 3
18 6
.65
498
131
28.0
90.
0320
01-0
2 9
7914
4,85
1 9
47,1
90 1
94,0
96 3
,277
672
6.5
437
811
022
.54
0.01
2002
-03
1,1
2316
7,77
81,
068,
701
224
,990
3,5
98 7
58 6
.37
1,25
230
063
.16
0.03
2003
-04
1,0
7818
9,51
81,
316,
096
303
,318
4,4
77 1
,032
6.9
41,
400
332
69.8
30.
0320
04-0
5 1
,151
124,
308
887
,294
202
,810
3,0
28 6
92 7
.14
1,27
841
093
.74
0.05
2005
-06
897
61,
891
475
,523
106
,596
1,7
55 3
93 7
.68
892
310
69.
49 0
.07
2006
-07
762
19,
575
219
,106
50,
265
898
206
11.
19 3
99 1
02 2
3.29
0.0
520
07-0
8 6
01 1
6,17
9 2
82,3
17 7
0,63
2 1
,138
285
17.
45 2
11 4
9 1
2.26
0.0
220
08-0
9 7
11 1
6,12
9 3
35,9
52 6
5,93
7 1
,412
277
20.
8325
764
12.5
60.
0220
09-2
010
1,14
424
,069
563
,816
124
,904
2,3
59 5
23 2
3.42
2,23
543
3.00
95.9
20.
0820
10-1
11,
111
20,3
83 5
59,4
47 1
25,2
96 2
,256
505
27.
451,
397
305.
2468
.36
0.05
2011
-12
1,14
023
,447
633
,179
123
,773
2,6
49 5
18 2
7.00
1,28
129
2.73
57.
220.
05Ap
r-12
259
1,70
0 4
7,74
3 8
,778
2,6
52 4
88 2
8.08
113.
70.
680.
01M
ay-1
228
82,
078
50,
941
9,3
66 2
,315
426
24.
5190
17.3
33.
190.
03Ju
n-12
341
2,57
6 7
2,34
8 1
3,30
2 3
,445
633
28.
0973
14.1
62.
600.
02Ju
l-12
326
2,41
6 6
6,18
7 1
2,16
9 3
,009
553
27.
4069
11.1
52.
050.
02Au
g-12
343
1,93
0 4
8,62
6 8
,940
2,3
16 4
26 2
5.19
198
37.2
16.
840.
08Se
p-12
358
2,64
8 7
1,32
7 1
3,11
4 3
,754
690
26.
9418
432
.46
5.97
0.05
Oct
-12
396
2,37
6 6
6,98
6 1
2,31
6 3
,349
616
28.
1970
13.6
82.
520.
02N
ov-1
234
11,
721
51,
361
9,4
43 2
,703
497
29.
8490
17.7
63.
270.
03

58
Cont
d... M
onth
/Ye
ar
All
Trad
esRe
tail
Trad
e
No.
of
acti
ve
secu
riti
es
Num
ber
of T
rade
sTr
adin
g Vo
lum
eAv
erag
e D
aily
Tra
ding
Vo
lum
e A
vera
ge
Trad
e Si
ze
Num
ber
of T
rade
sTr
adin
g Vo
lum
eSh
are
in T
otal
Tr
adin
g Vo
lum
e
(`
Cror
es)
(U
S $
mn)
(`
Cror
es)
(U
S $
mn)
(`
Cror
es)
(`
Cror
es)
(US
$ m
n)(%
)
Dec
-12
402
2,20
8 7
1,98
0 1
3,23
4 3
,599
662
32.
6094
14.1
12.
590.
02Ja
n-13
490
3,58
4 1
03,4
26 1
9,01
6 4
,701
864
28.
8610
618
.55
3.41
0.02
Feb-
1331
61,
819
65,
154
11,
979
3,4
29 6
30 3
5.82
101
18.6
13.
420.
03M
ar-1
344
31,
918
76,
136
13,
998
4,0
07 7
37 3
9.70
173.
540.
650.
0020
12-1
31,
421
26,9
74 7
92,2
14 1
45,6
56 3
,260
599
29.
371,
103
202.
2637
.19
0.03
Apr-
1350
32,
355
93,
397
15,
629
5,1
89 8
68 3
9.66
71.
94 0
.32
0.00
May
-13
524
2,63
2 9
7,97
6 1
6,39
5 4
,453
745
37.
2220
5.28
0.8
80.
01Ju
n-13
448
2,00
4 8
3,56
5 1
3,98
4 4
,178
699
41.
7097
20.2
6 3
.39
0.05
Jul-
1344
91,
908
66,
188
11,
076
2,8
78 4
82 3
4.69
8817
.38
2.9
10.
04Au
g-13
376
1,64
6 6
6,56
1 1
1,13
8 3
,328
557
40.
4499
18.0
5 3
.02
0.06
Sep-
1336
71,
675
77,
058
12,
895
3,8
53 6
45 4
6.00
4711
.48
1.9
20.
03O
ct-1
336
91,
848
67,
338
11,
269
3,2
07 5
37 3
6.44
235
41.6
8 6
.97
0.11
Nov
-13
324
1,35
3 5
1,92
7 8
,689
2,7
33 4
57 3
8.38
5113
.11
2.1
90.
04D
ec-1
331
11,
439
62,
489
10,
457
2,9
76 4
98 4
3.43
6014
.63
2.4
50.
04Ja
n-14
406
1,68
9 7
9,03
5 1
3,22
6 3
,593
601
46.
7964
12.5
7 2
.10
0.04
Feb-
1426
91,
248
59,
848
10,
015
3,3
25 5
56 4
7.96
9114
.90
2.4
90.
07M
ar-1
432
21,
346
46,
053
7,7
07 2
,424
406
34.
2114
524
.02
4.0
20.
1020
13-1
41,
585
21,1
43 8
51,4
34 1
42,4
80 3
,504
586
40.
271,
004
195.
00 3
2.63
0.05
Cont
d...
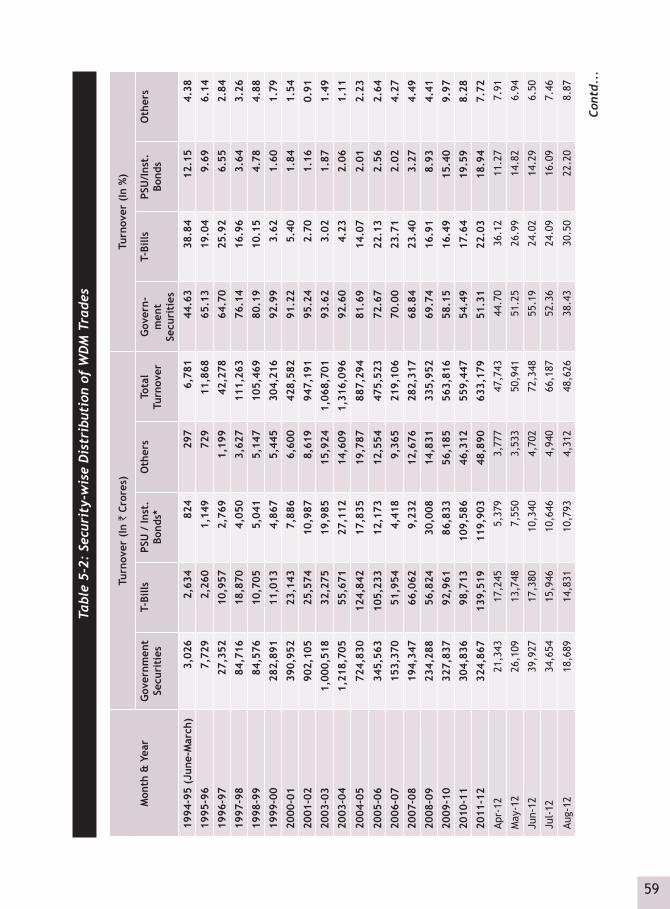
59
Tabl
e 5-
2: S
ecur
ity-
wis
e D
istr
ibut
ion
of W
DM
Tra
des
Mon
th &
Yea
r
Turn
over
(In
` C
rore
s)Tu
rnov
er (
In %
)
Gov
ernm
ent
Secu
riti
esT-
Bills
PSU
/ In
st.
Bond
s*O
ther
sTo
tal
Turn
over
Gov
ern-
men
t Se
curi
ties
T-Bi
llsPS
U/I
nst.
Bo
nds
Oth
ers
1994
-95
(Jun
e-M
arch
) 3
,026
2
,634
8
24
297
6
,781
4
4.63
3
8.84
1
2.15
4
.38
1995
-96
7,7
29
2,2
60
1,1
49
729
1
1,86
8 6
5.13
1
9.04
9
.69
6.1
4
1996
-97
27,
352
10,
957
2,7
69
1,1
99
42,
278
64.
70
25.
92
6.5
5 2
.84
1997
-98
84,
716
18,
870
4,0
50
3,6
27
111
,263
7
6.14
1
6.96
3
.64
3.2
6
1998
-99
84,
576
10,
705
5,0
41
5,1
47
105
,469
8
0.19
1
0.15
4
.78
4.8
8
1999
-00
282
,891
1
1,01
3 4
,867
5
,445
3
04,2
16
92.
99
3.6
2 1
.60
1.7
9
2000
-01
390
,952
2
3,14
3 7
,886
6
,600
4
28,5
82
91.
22
5.4
0 1
.84
1.5
4
2001
-02
902
,105
2
5,57
4 1
0,98
7 8
,619
9
47,1
91
95.
24
2.7
0 1
.16
0.9
1
2003
-03
1,0
00,5
18
32,
275
19,
985
15,
924
1,0
68,7
01
93.
62
3.0
2 1
.87
1.4
9
2003
-04
1,2
18,7
05
55,
671
27,
112
14,
609
1,3
16,0
96
92.
60
4.2
3 2
.06
1.1
1
2004
-05
724
,830
1
24,8
42
17,
835
19,
787
887
,294
8
1.69
1
4.07
2
.01
2.2
3
2005
-06
345
,563
1
05,2
33
12,
173
12,
554
475
,523
7
2.67
2
2.13
2
.56
2.6
4
2006
-07
153
,370
5
1,95
4 4
,418
9
,365
2
19,1
06
70.
00
23.
71
2.0
2 4
.27
2007
-08
194
,347
6
6,06
2 9
,232
1
2,67
6 2
82,3
17
68.
84
23.
40
3.2
7 4
.49
2008
-09
234
,288
5
6,82
4 3
0,00
8 1
4,83
1 3
35,9
52
69.7
416
.91
8.93
4.41
2009
-10
327
,837
9
2,96
1 8
6,83
3 5
6,18
5 5
63,8
16
58.
15
16.
49
15.
40
9.9
7
2010
-11
304
,836
9
8,71
3 1
09,5
86
46,
312
559
,447
5
4.49
1
7.64
1
9.59
8
.28
2011
-12
324
,867
1
39,5
19
119
,903
4
8,89
0 6
33,1
79
51.
31
22.
03
18.
94
7.7
2
Apr-
12 2
1,34
3 1
7,24
5 5
,379
3
,777
4
7,74
3 4
4.70
3
6.12
1
1.27
7
.91
May
-12
26,
109
13,
748
7,5
50
3,5
33
50,
941
51.
25
26.
99
14.
82
6.9
4
Jun-
12 3
9,92
7 1
7,38
0 1
0,34
0 4
,702
7
2,34
8 5
5.19
2
4.02
1
4.29
6
.50
Jul-
12 3
4,65
4 1
5,94
6 1
0,64
6 4
,940
6
6,18
7 5
2.36
2
4.09
1
6.09
7
.46
Aug-
12 1
8,68
9 1
4,83
1 1
0,79
3 4
,312
4
8,62
6 3
8.43
3
0.50
2
2.20
8
.87
Cont
d...
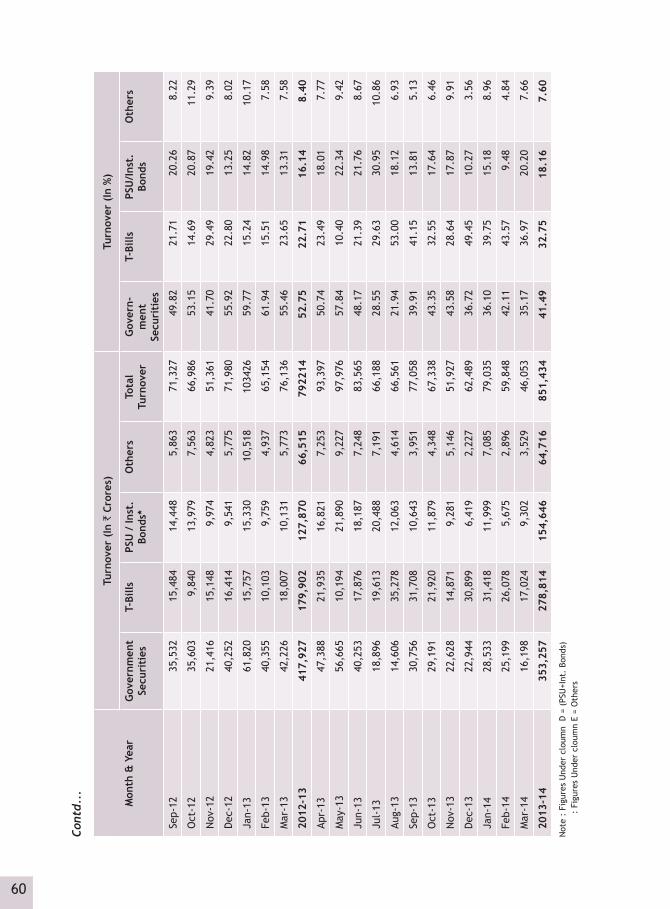
60
Cont
d...
Mon
th &
Yea
r
Turn
over
(In
` C
rore
s)Tu
rnov
er (
In %
)
Gov
ernm
ent
Secu
riti
esT-
Bills
PSU
/ In
st.
Bond
s*O
ther
sTo
tal
Turn
over
Gov
ern-
men
t Se
curi
ties
T-Bi
llsPS
U/I
nst.
Bo
nds
Oth
ers
Sep-
12 3
5,53
2 1
5,48
4 1
4,44
8 5
,863
7
1,32
7 4
9.82
2
1.71
2
0.26
8
.22
Oct
-12
35,
603
9,8
40
13,
979
7,5
63
66,
986
53.
15
14.
69
20.
87
11.
29
Nov
-12
21,
416
15,
148
9,9
74
4,8
23
51,
361
41.
70
29.
49
19.
42
9.3
9
Dec
-12
40,
252
16,
414
9,5
41
5,7
75
71,
980
55.
92
22.
80
13.
25
8.0
2
Jan-
13 6
1,82
0 1
5,75
7 1
5,33
0 1
0,51
8 10
3426
59.
77
15.
24
14.
82
10.
17
Feb-
13 4
0,35
5 1
0,10
3 9
,759
4
,937
6
5,15
4 6
1.94
1
5.51
1
4.98
7
.58
Mar
-13
42,
226
18,
007
10,
131
5,7
73
76,
136
55.
46
23.
65
13.
31
7.5
8
2012
-13
417
,927
1
79,9
02
127
,870
6
6,51
5 79
2214
52.
75
22.
71
16.
14
8.4
0
Apr-
13 4
7,38
8 2
1,93
5 1
6,82
1 7
,253
9
3,39
7 5
0.74
2
3.49
1
8.01
7
.77
May
-13
56,
665
10,
194
21,
890
9,2
27
97,
976
57.
84
10.
40
22.
34
9.4
2
Jun-
13 4
0,25
3 1
7,87
6 1
8,18
7 7
,248
8
3,56
5 4
8.17
2
1.39
2
1.76
8
.67
Jul-
13 1
8,89
6 1
9,61
3 2
0,48
8 7
,191
6
6,18
8 2
8.55
2
9.63
3
0.95
1
0.86
Aug-
13 1
4,60
6 3
5,27
8 1
2,06
3 4
,614
6
6,56
1 2
1.94
5
3.00
1
8.12
6
.93
Sep-
13 3
0,75
6 3
1,70
8 1
0,64
3 3
,951
7
7,05
8 3
9.91
4
1.15
1
3.81
5
.13
Oct
-13
29,
191
21,
920
11,
879
4,3
48
67,
338
43.
35
32.
55
17.
64
6.4
6
Nov
-13
22,
628
14,
871
9,2
81
5,1
46
51,
927
43.
58
28.
64
17.
87
9.9
1
Dec
-13
22,
944
30,
899
6,4
19
2,2
27
62,
489
36.
72
49.
45
10.
27
3.5
6
Jan-
14 2
8,53
3 3
1,41
8 1
1,99
9 7
,085
7
9,03
5 3
6.10
3
9.75
1
5.18
8
.96
Feb-
14 2
5,19
9 2
6,07
8 5
,675
2
,896
5
9,84
8 4
2.11
4
3.57
9
.48
4.8
4
Mar
-14
16,
198
17,
024
9,3
02
3,5
29
46,
053
35.
17
36.
97
20.
20
7.6
6
2013
-14
353
,257
2
78,8
14
154
,646
6
4,71
6 8
51,4
34
41.
49
32.
75
18.
16
7.6
0
Not
e :
Figu
res
Und
er c
loum
n D
= (
PSU
+Int
. Bo
nds)
:
Figu
res
Und
er c
loum
n E
= O
ther
s

61
Tabl
e 5-
3: P
arti
cipa
nt w
ise
Dis
trib
utio
n of
WD
M T
urno
ver
Mon
th/Y
ear
Turn
over
(In
` C
rore
s) T
urno
ver
(In
%)
Trad
ing
Mem
bers
FIs/
MFs
/ Co
rpo-
rate
s
Prim
ary
Dea
lers
Indi
an
Bank
sFo
reig
n Ba
nks
Tota
l Tu
rnov
erTr
adin
g M
embe
rsFI
s/M
Fs/
Corp
o-ra
tes
Prim
ary
Dea
lers
Indi
an
Bank
sFo
reig
n Ba
nks
1994
-95
(Jun
-Mar
) 3
,921
4
36
1
960
1
,463
6
,781
57
.82
6.43
0.02
14.1
621
.57
1995
-96
2,7
87 9
02 1
38 3
,569
4,4
73 1
1,86
823
.48
7.60
1.16
30.0
737
.69
1996
-97
9,7
03 1
,611
2,5
79 1
2,68
8 1
5,69
8 4
2,27
822
.95
3.81
6.10
30.0
137
.13
1997
-98
21,
975
4,7
84 1
3,41
8 4
5,88
5 2
5,20
1 1
11,2
6319
.75
4.30
12.0
641
.24
22.6
519
98-9
9 1
6,32
7 5
,200
15,
441
44,
424
24,
079
105
,469
15.4
84.
9314
.64
42.1
222
.83
1999
-00
56,
675
12,
716
59,
079
129
,961
45,
785
304
,216
18.6
34.
1819
.42
42.7
215
.05
2000
-01
99,
602
17,
915
94,
888
143
,746
72,
430
428
,582
23.2
44.
1822
.14
33.5
416
.90
2001
-02
222
,779
39,
403
213
,118
346
,672
125
,219
947
,191
23.5
24.
1622
.50
36.6
013
.22
2002
-03
265
,145
40,
290
235
,435
414
,336
113
,496
1,06
8,70
124
.81
3.77
22.0
338
.77
10.6
220
03-0
4 4
58,0
01 6
0,01
4 2
24,1
31 4
78,5
33 9
5,41
71,
316,
096
34.8
04.
5617
.03
36.3
67.
2520
04-0
5 3
01,3
25 4
5,60
7 1
64,1
49 2
65,2
12 1
11,0
00 8
87,2
9433
.96
5.14
18.5
029
.89
12.5
120
05-0
6 1
52,2
15 1
8,64
1 1
04,0
92 1
33,4
79 6
7,09
6 4
75,5
2332
.01
3.92
21.8
928
.07
14.1
120
06-0
7 6
7,66
0 5
,916
43,
427
57,
033
45,
070
219
,106
30.8
82.
7019
.82
26.0
320
.57
2007
-08
107
,704
6,6
06 2
4,39
2 6
7,13
5 7
6,48
0 2
82,3
1738
.15
2.34
8.64
23.7
827
.09
2008
-09
150
,014
11,
408
22,
106
60,
851
91,
573
335
,952
44.6
53.
406.
5818
.11
27.2
620
09-1
0 2
77,5
92 1
4,76
9 2
6,09
6 1
11,8
86 1
33,4
72 5
63,8
1649
.23
2.63
4.63
19.8
423
.67
2010
-11
299
,366
13,
417
23,
579
73,
239
149
,846
559
,447
53.5
12.
414.
2113
.09
26.7
820
11-1
2 3
45,1
67 2
8,50
9 2
6,37
7 9
6,56
6 1
36,5
59 6
33,1
79 5
4.51
4.5
1 4
.17
15.
25 2
1.57
Apr-
12 2
3,86
2 1
,447
2,1
05 9
,062
11,
267
47,
743
49.9
83.
034.
4118
.98
23.6
May
-12
26,
413
2,2
46 2
,277
9,2
92 1
0,71
3 5
0,94
151
.85
4.41
4.47
18.2
421
.03
Jun-
12 3
6,99
9 3
,972
3,3
06 1
1,56
1 1
6,51
0 7
2,34
851
.14
5.49
4.57
15.9
822
.82
Jul-
12 3
6,14
5 2
,694
1,8
80 1
0,35
2 1
5,11
7 6
6,18
754
.61
4.07
2.84
15.6
422
.84
Aug-
12 2
6,47
7 1
,556
1,2
89 6
,161
13,
143
48,
626
54.4
53.
202.
6512
.67
27.0
3Se
p-12
37,
125
2,9
67 2
,168
13,
245
15,
820
71,
327
52.0
54.
163.
0418
.57
22.1
8O
ct-1
2 3
6,05
8 3
,021
2,5
12 8
,762
16,
633
66,
986
53.8
34.
513.
7513
.08
24.8
3
Cont
d...
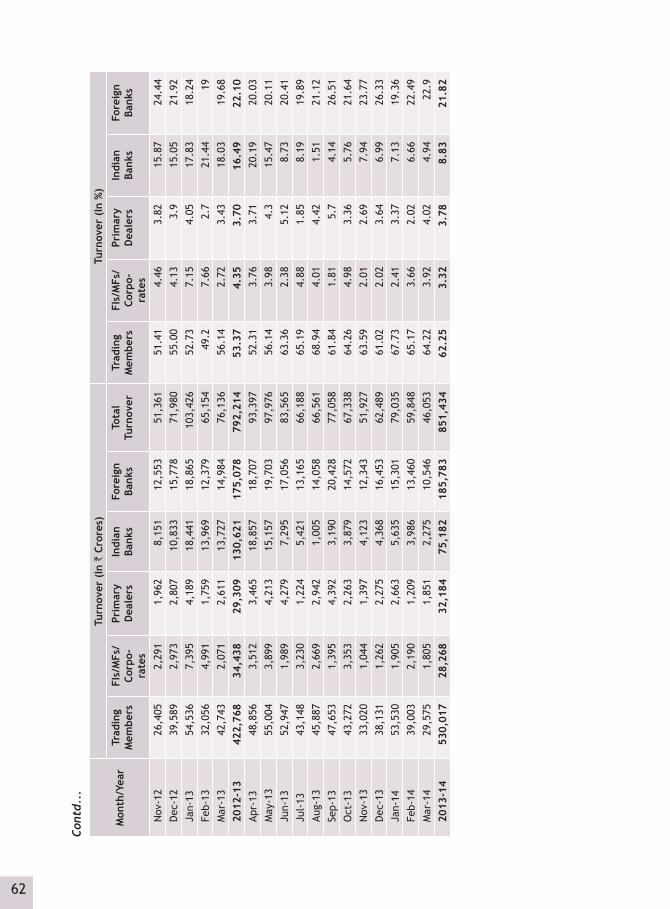
62
Mon
th/Y
ear
Turn
over
(In
` C
rore
s) T
urno
ver
(In
%)
Trad
ing
Mem
bers
FIs/
MFs
/ Co
rpo-
rate
s
Prim
ary
Dea
lers
Indi
an
Bank
sFo
reig
n Ba
nks
Tota
l Tu
rnov
erTr
adin
g M
embe
rsFI
s/M
Fs/
Corp
o-ra
tes
Prim
ary
Dea
lers
Indi
an
Bank
sFo
reig
n Ba
nks
Nov
-12
26,
405
2,2
91 1
,962
8,1
51 1
2,55
3 5
1,36
151
.41
4.46
3.82
15.8
724
.44
Dec
-12
39,
589
2,9
73 2
,807
10,
833
15,
778
71,
980
55.0
04.
133.
915
.05
21.9
2Ja
n-13
54,
536
7,3
95 4
,189
18,
441
18,
865
103
,426
52.7
37.
154.
0517
.83
18.2
4Fe
b-13
32,
056
4,9
91 1
,759
13,
969
12,
379
65,
154
49.2
7.66
2.7
21.4
419
Mar
-13
42,
743
2,0
71 2
,611
13,
727
14,
984
76,
136
56.1
42.
723.
4318
.03
19.6
820
12-1
3 4
22,7
68 3
4,43
8 2
9,30
9 1
30,6
21 1
75,0
78 7
92,2
14 5
3.37
4.3
5 3
.70
16.
49 2
2.10
Apr-
13 4
8,85
6 3
,512
3,4
65 1
8,85
7 1
8,70
7 9
3,39
752
.31
3.76
3.71
20.1
920
.03
May
-13
55,
004
3,8
99 4
,213
15,
157
19,
703
97,
976
56.1
43.
984.
315
.47
20.1
1Ju
n-13
52,
947
1,9
89 4
,279
7,2
95 1
7,05
6 8
3,56
563
.36
2.38
5.12
8.73
20.4
1Ju
l-13
43,
148
3,2
30 1
,224
5,4
21 1
3,16
5 6
6,18
865
.19
4.88
1.85
8.19
19.8
9Au
g-13
45,
887
2,6
69 2
,942
1,0
05 1
4,05
8 6
6,56
168
.94
4.01
4.42
1.51
21.1
2Se
p-13
47,
653
1,3
95 4
,392
3,1
90 2
0,42
8 7
7,05
861
.84
1.81
5.7
4.14
26.5
1O
ct-1
3 4
3,27
2 3
,353
2,2
63 3
,879
14,
572
67,
338
64.2
64.
983.
365.
7621
.64
Nov
-13
33,
020
1,0
44 1
,397
4,1
23 1
2,34
3 5
1,92
763
.59
2.01
2.69
7.94
23.7
7D
ec-1
3 3
8,13
1 1
,262
2,2
75 4
,368
16,
453
62,
489
61.0
22.
023.
646.
9926
.33
Jan-
14 5
3,53
0 1
,905
2,6
63 5
,635
15,
301
79,
035
67.7
32.
413.
377.
1319
.36
Feb-
14 3
9,00
3 2
,190
1,2
09 3
,986
13,
460
59,
848
65.1
73.
662.
026.
6622
.49
Mar
-14
29,
575
1,8
05 1
,851
2,2
75 1
0,54
6 4
6,05
364
.22
3.92
4.02
4.94
22.9
2013
-14
530
,017
28,
268
32,
184
75,
182
185
,783
851
,434
62.2
53.
323.
788.
8321
.82
Cont
d...

63
Table 5-4: Share of Top ‘N’ Securities/Trading Members/Participants in Turnover in WDM Segment.
YearIn Percent
Top 5 Top 10 Top 25 Top 50 Top 100Securities1994-95 42.84 61.05 80.46 89.81 97.161995-96 57.59 69.46 79.60 86.58 93.241996-97 32.93 48.02 65.65 78.32 90.171997-98 30.65 46.92 71.25 85.00 92.151998-99 26.81 41.89 64.30 78.24 86.661999-00 37.11 55.57 82.12 90.73 95.282000-01 42.20 58.30 80.73 89.97 95.132001-02 51.61 68.50 88.73 94.32 97.192002-03 43.10 65.15 86.91 92.74 96.132003-04 37.06 54.43 81.58 90.66 95.142004-05 43.70 57.51 71.72 80.59 89.552005-06 47.42 59.78 72.02 81.04 89.362006-07 40.90 51.29 65.82 77.15 86.912007-08 39.65 53.31 68.35 79.64 89.552008-09 31.31 43.05 60.42 72.45 83.872009-10 24.19 35.14 53.05 65.63 77.892010-11 26.65 38.63 51.69 61.49 74.222011-12 36.35 44.22 52.63 61.54 72.092012-13 34.02 44.36 53.04 62.32 73.292013-14 17.83 29.24 41.81 53.82 67.82Trading Members1994-95 51.99 73.05 95.37 100.00 -1995-96 44.36 68.58 96.10 100.00 -1996-97 30.02 51.27 91.57 99.96 100.001997-98 27.17 47.85 83.38 99.82 100.001998-99 29.87 50.45 86.55 99.98 100.001999-00 32.38 53.41 84.46 100.00 -2000-01 35.17 54.25 86.82 100.00 -2001-02 35.18 58.68 88.36 100.00 -2002-03 31.77 53.71 85.49 100.00 -2003-04 30.72 53.01 86.71 100.00 -2004-05 35.75 56.84 86.74 100.00 -2005-06 39.68 60.63 89.38 100.00 -2006-07 57.75 78.01 96.43 100.00 -2007-08 65.32 80.24 97.60 100.00 -2008-09 69.92 82.89 98.38 100.00 -2009-10 73.72 85.28 97.98 100.00 -2010-11 73.58 86.08 98.72 100.00 -2011-12 77.50 89.14 99.41 100.00 -2012-13 81.83 91.18 99.46 100.00 -2013-14 82.13 92.14 99.82 100.00 -Participants1994-95 18.37 27.38 38.40 42.20 -1995-96 29.66 47.15 70.49 76.32 76.581996-97 25.27 44.92 67.00 76.33 77.101997-98 23.60 38.96 65.59 77.96 80.221998-99 22.47 37.39 62.79 79.27 84.511999-00 15.54 27.87 52.51 74.76 81.322000-01 17.51 28.85 50.64 69.72 76.782001-02 17.49 29.25 50.19 69.16 76.492002-03 17.27 28.29 49.22 68.14 75.202003-04 16.66 25.96 44.25 59.87 65.172004-05 16.82 28.64 47.24 61.71 66.002005-06 17.50 30.53 53.61 65.84 67.972006-07 25.85 40.65 59.99 68.17 69.092007-08 28.36 40.64 55.58 61.77 61.842008-09 24.08 38.24 51.19 55.34 55.382009-10 23.40 36.87 47.64 50.77 -2010-11 23.52 35.89 44.63 46.51 -2011-12 20.60 33.77 44.64 45.50 - 2012-13 21.73 34.52 45.64 46.65 - 2013-14 21.11 29.89 37.22 37.72 -

64
Tabl
e 5-
5: M
arke
t Ca
pita
lisa
tion
of
WD
M S
ecur
itie
s
Mon
th/
Year
Gov
t.
Secu
riti
esPS
U b
onds
Stat
e lo
ans
T-bi
llsO
ther
sTo
tal
Tota
lG
ovt.
Se
curi
ties
PSU
bon
dsSt
ate
lo
ans
T-bi
llsO
ther
s
(` C
rore
s)(U
S $
bn)
(in
perc
ent)
Jun-
94 6
0,71
9 2
0,43
9 1
,833
1
8,47
6 2
0,05
2 12
1,51
8 3
8.66
49
.97
16.8
21.
5115
.20
16.5
0
Mar
-95
86,
175
25,
675
5,8
67
17,
129
23,
334
158,
181
50.
33
54.4
816
.23
3.71
10.8
314
.75
Mar
-96
125
,492
3
0,07
4 1
3,85
0 8
,452
2
9,91
5 20
7,78
3 6
0.49
60
.40
14.4
76.
674.
0714
.40
Mar
-97
169
,830
3
6,21
1 1
8,89
1 1
3,46
0 5
4,38
0 29
2,77
2 8
1.60
58
.01
12.3
76.
454.
6018
.57
Mar
-98
196
,290
3
5,32
3 2
3,98
9 1
7,49
7 7
0,09
1 34
3,19
1 8
6.82
57
.20
10.2
96.
995.
1020
.42
Mar
-99
260
,002
3
4,99
4 3
0,51
6 1
1,29
2 7
4,66
6 41
1,47
0 9
6.98
63
.19
8.50
7.42
2.74
18.1
5
Mar
-00
319
,865
3
9,35
7 3
9,47
7 1
5,34
5 7
9,98
9 49
4,03
3 1
13.2
6 64
.75
7.97
7.99
3.11
16.1
9
Mar
-01
397
,228
3
6,36
5 4
4,62
4 1
7,72
5 8
4,89
4 58
0,83
6 1
24.5
4 68
.39
6.26
7.68
3.05
14.6
2
Mar
-02
542
,601
3
9,94
4 6
1,38
5 2
3,84
9 8
9,01
6 75
6,79
4 1
55.7
2 71
.70
5.28
8.11
3.15
11.7
6
Mar
-03
658
,002
3
8,38
3 7
2,09
4 3
4,91
9 6
1,08
4 86
4,48
1 1
82.0
0 76
.12
4.44
8.34
4.04
7.06
Mar
-04
959
,302
5
6,83
2 7
9,34
0 3
2,69
2 8
7,69
8 1,
215,
864
280
.22
78.9
04.
676.
532.
697.
21
Mar
-05
1,0
06,1
07
68,
398
223
,208
7
3,50
2 9
0,51
9 1,
461,
734
334
.11
68.8
34.
6815
.27
5.03
6.19
Mar
-06
1,0
59,7
89
88,
716
241
,927
7
0,18
6 1
06,9
56
1,56
7,57
4 3
51.4
0 67
.61
5.66
15.4
34.
486.
82
Mar
-07
1,1
82,2
78
89,
628
249
,847
1
15,1
83
147
,865
1,
784,
801
409
.45
66.2
45.
0214
.00
6.45
8.28
Mar
-08
1,3
92,2
19
96,
268
315
,661
1
11,5
62
207
,636
2,
123,
346
531
.23
65.5
74.
5314
.87
5.25
9.77
Mar
-09
1,8
49,9
71
129
,499
4
22,3
62
147
,617
2
98,8
67
2,84
8,31
5 5
59.0
4 64
.95
4.55
14.8
35.
1810
.49
Mar
-10
1,9
50,4
36
162
,979
5
36,9
96
135
,696
3
79,8
23
3,16
5,92
9 7
01.3
6 6
1.61
5
.15
16.
96
4.2
9 1
2.00
Mar
-11
2,1
85,7
21
190
,922
6
22,0
69
137
,677
4
58,4
88
3,59
4,87
7 8
05.1
2 6
0.80
5
.31
17.
30
3.8
3 1
2.75
Mar
-12
2,4
72,1
79
244
,165
7
57,2
81
259
,271
5
39,8
41
4,27
2,73
6 8
35.2
3 5
7.86
5
.71
17.
72
6.0
7 1
2.63
Apr-
12 2
,472
,644
2
47,9
11
761
,001
2
77,8
12
551
,434
4
,310
,802
7
92.5
8 57
.36
5.75
17.6
56.
4412
.79
May
-12
2,5
07,9
88
253
,674
7
73,3
66
315
,708
5
52,6
07
4,4
03,3
43
809
.60
56.
96
5.7
6 1
7.56
7
.17
12.
55
Jun-
12 2
,575
,390
2
57,9
54
781
,257
3
20,8
67
565
,820
4
,501
,288
8
27.6
1 5
7.21
5
.73
17.
36
7.1
3 1
2.57
Jul-
12 2
,631
,910
2
64,1
72
795
,469
3
24,8
43
578
,579
4
,594
,973
8
44.8
3 5
7.28
5
.75
17.
31
7.0
7 1
2.59
Aug-
12 2
,677
,079
2
68,9
08
805
,047
3
17,1
96
595
,099
4
,663
,328
8
57.4
0 5
7.41
5
.77
17.
26
6.8
0 1
2.76
Sep-
12 2
,703
,215
2
66,1
77
821
,979
3
21,0
86
602
,937
4
,715
,394
8
66.9
7 5
7.33
5
.64
17.
43
6.8
1 1
2.79
Co
ntd.
..

65
Cont
d...
Mon
th/
Year
Gov
t.
Secu
riti
esPS
U b
onds
Stat
e lo
ans
T-bi
llsO
ther
sTo
tal
Tota
lG
ovt.
Se
curi
ties
PSU
bon
dsSt
ate
lo
ans
T-bi
llsO
ther
s
(` C
rore
s)(U
S $
bn)
(in
perc
ent)
Oct
-12
2,7
22,8
82
276
,334
8
41,9
05
312
,155
6
13,0
40
4,7
66,3
16
876
.33
57.
13
5.8
0 1
7.66
6
.55
12.
86
Nov
-12
2,7
16,5
59
281
,435
8
55,8
27
306
,396
6
15,8
52
4,7
76,0
69
878
.13
56.
88
5.8
9 1
7.92
6
.42
12.
89
Dec
-12
2,7
41,2
55
288
,740
8
65,9
22
302
,299
6
17,2
49
4,8
15,4
65
885
.37
56.
93
6.0
0 1
7.98
6
.28
12.
82
Jan-
13 2
,763
,300
2
92,5
63
883
,100
3
18,2
51
636
,250
4
,893
,464
8
99.7
1 5
6.47
5
.98
18.
05
6.5
0 1
3.00
Feb-
13 2
,776
,205
2
97,4
85
888
,873
2
98,0
98
641
,787
4
,902
,448
9
01.3
6 5
6.63
6
.07
18.
13
6.0
8 1
3.09
Mar
-13
2,7
69,0
02
305
,606
9
04,1
43
298
,488
6
51,0
93
4,92
8,33
2 9
06.1
2 5
6.19
6
.20
18.
35
6.0
6 1
3.21
Apr-
13 2
,791
,603
32
4,00
191
3448
298
,399
6
52,8
28
4,9
80,2
78
833
.41
56.0
56.
5118
.34
5.99
13.1
1
May
-13
2,8
42,3
35
332
,899
9
20,1
57
313
,460
6
66,7
89
5,0
75,6
41
849
.37
56.
00
6.5
6 1
8.13
6
.18
13.
14
Jun-
13 2
,840
,233
3
37,7
13
925
,372
3
30,6
78
678
,406
5
,112
,402
8
55.5
2 5
5.56
6
.61
18.
10
6.4
7 1
3.27
Jul-
13 2
,812
,449
3
52,6
11
920
,176
3
52,6
11
670
,391
5
,096
,478
8
52.8
5 5
5.18
6
.92
18.
06
6.9
2 1
3.15
Aug-
13 2
,772
,692
3
36,7
75
935
,728
3
97,8
52
660
,579
5
,103
,627
8
54.0
5 5
4.33
6
.60
18.
33
7.8
0 1
2.94
Sep-
13 2
,713
,298
3
36,9
62
950
,019
37
2942
659
,054
5
,032
,274
8
42.1
1 5
3.92
6
.70
18.
88
7.4
1 1
3.10
Oct
-13
2,7
25,6
03
344
,535
9
70,3
78
329
,141
6
67,2
25
5,0
36,8
83
842
.88
54.
11
6.8
4 1
9.27
6
.53
13.
25
Nov
-13
2,7
36,1
12
344
,858
9
84,8
65
331
,360
6
67,0
09
5,0
64,2
05
847
.45
54.
03
6.8
1 1
9.45
6
.54
13.
17
Dec
-13
2,7
42,4
59
347
,021
1
,006
,943
3
48,9
23
668
,973
5
,114
,319
8
55.8
4 5
3.62
6
.79
19.
69
6.8
2 1
3.08
Jan-
14 2
,747
,508
3
49,7
84
1,0
34,6
77
334
,101
6
69,6
30
5,1
35,7
00
859
.42
53.
50
6.8
1 2
0.15
6
.51
13.
04
Feb-
14 2
,716
,619
3
57,5
81
1,0
53,3
06
333
,338
6
66,8
94
5,1
27,7
38
858
.08
52.
98
6.9
7 2
0.54
6
.50
13.
01
Mar
-14
2,6
97,5
39
370
,992
1,
068,
115
328
,407
6
63,6
80
5,12
8,73
3 8
58.2
5 5
2.60
7
.23
20.
83
6.4
0 1
2.94
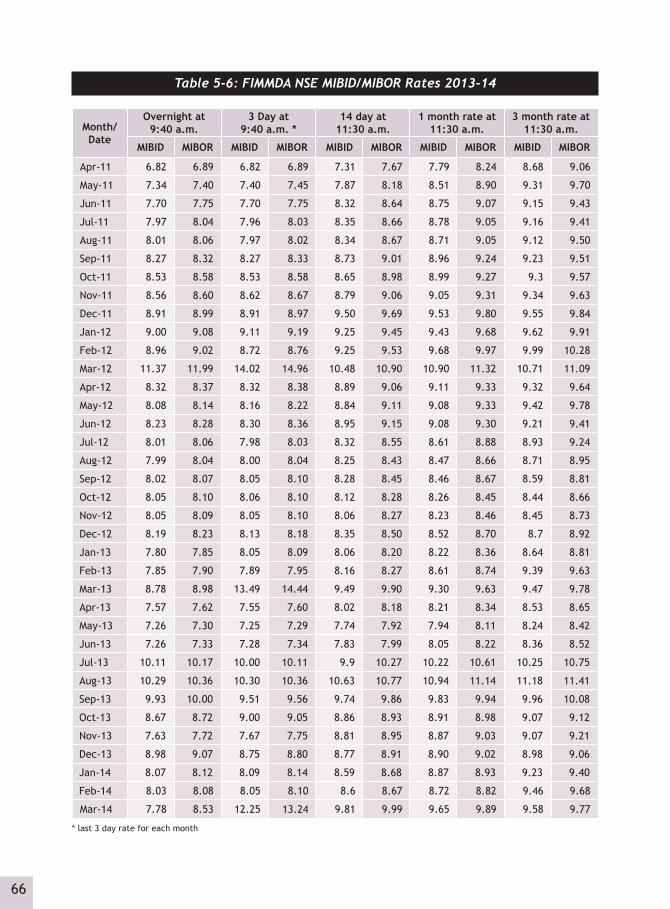
66
Table 5-6: FIMMDA NSE MIBID/MIBOR Rates 2013-14
Month/Date
Overnight at 9:40 a.m.
3 Day at 9:40 a.m. *
14 day at 11:30 a.m.
1 month rate at 11:30 a.m.
3 month rate at 11:30 a.m.
MIBID MIBOR MIBID MIBOR MIBID MIBOR MIBID MIBOR MIBID MIBOR
Apr-11 6.82 6.89 6.82 6.89 7.31 7.67 7.79 8.24 8.68 9.06
May-11 7.34 7.40 7.40 7.45 7.87 8.18 8.51 8.90 9.31 9.70
Jun-11 7.70 7.75 7.70 7.75 8.32 8.64 8.75 9.07 9.15 9.43
Jul-11 7.97 8.04 7.96 8.03 8.35 8.66 8.78 9.05 9.16 9.41
Aug-11 8.01 8.06 7.97 8.02 8.34 8.67 8.71 9.05 9.12 9.50
Sep-11 8.27 8.32 8.27 8.33 8.73 9.01 8.96 9.24 9.23 9.51
Oct-11 8.53 8.58 8.53 8.58 8.65 8.98 8.99 9.27 9.3 9.57
Nov-11 8.56 8.60 8.62 8.67 8.79 9.06 9.05 9.31 9.34 9.63
Dec-11 8.91 8.99 8.91 8.97 9.50 9.69 9.53 9.80 9.55 9.84
Jan-12 9.00 9.08 9.11 9.19 9.25 9.45 9.43 9.68 9.62 9.91
Feb-12 8.96 9.02 8.72 8.76 9.25 9.53 9.68 9.97 9.99 10.28
Mar-12 11.37 11.99 14.02 14.96 10.48 10.90 10.90 11.32 10.71 11.09
Apr-12 8.32 8.37 8.32 8.38 8.89 9.06 9.11 9.33 9.32 9.64
May-12 8.08 8.14 8.16 8.22 8.84 9.11 9.08 9.33 9.42 9.78
Jun-12 8.23 8.28 8.30 8.36 8.95 9.15 9.08 9.30 9.21 9.41
Jul-12 8.01 8.06 7.98 8.03 8.32 8.55 8.61 8.88 8.93 9.24
Aug-12 7.99 8.04 8.00 8.04 8.25 8.43 8.47 8.66 8.71 8.95
Sep-12 8.02 8.07 8.05 8.10 8.28 8.45 8.46 8.67 8.59 8.81
Oct-12 8.05 8.10 8.06 8.10 8.12 8.28 8.26 8.45 8.44 8.66
Nov-12 8.05 8.09 8.05 8.10 8.06 8.27 8.23 8.46 8.45 8.73
Dec-12 8.19 8.23 8.13 8.18 8.35 8.50 8.52 8.70 8.7 8.92
Jan-13 7.80 7.85 8.05 8.09 8.06 8.20 8.22 8.36 8.64 8.81
Feb-13 7.85 7.90 7.89 7.95 8.16 8.27 8.61 8.74 9.39 9.63
Mar-13 8.78 8.98 13.49 14.44 9.49 9.90 9.30 9.63 9.47 9.78
Apr-13 7.57 7.62 7.55 7.60 8.02 8.18 8.21 8.34 8.53 8.65
May-13 7.26 7.30 7.25 7.29 7.74 7.92 7.94 8.11 8.24 8.42
Jun-13 7.26 7.33 7.28 7.34 7.83 7.99 8.05 8.22 8.36 8.52
Jul-13 10.11 10.17 10.00 10.11 9.9 10.27 10.22 10.61 10.25 10.75
Aug-13 10.29 10.36 10.30 10.36 10.63 10.77 10.94 11.14 11.18 11.41
Sep-13 9.93 10.00 9.51 9.56 9.74 9.86 9.83 9.94 9.96 10.08
Oct-13 8.67 8.72 9.00 9.05 8.86 8.93 8.91 8.98 9.07 9.12
Nov-13 7.63 7.72 7.67 7.75 8.81 8.95 8.87 9.03 9.07 9.21
Dec-13 8.98 9.07 8.75 8.80 8.77 8.91 8.90 9.02 8.98 9.06
Jan-14 8.07 8.12 8.09 8.14 8.59 8.68 8.87 8.93 9.23 9.40
Feb-14 8.03 8.08 8.05 8.10 8.6 8.67 8.72 8.82 9.46 9.68
Mar-14 7.78 8.53 12.25 13.24 9.81 9.99 9.65 9.89 9.58 9.77
* last 3 day rate for each month

67
Table 5-7: 1-day Value-at-Risk (99%) for Government of India Securities Traded as on March 28, 2014
Sec_type Security Issue_
Name Normal Weighted Normal
Historical_Simulation
Weighted Historical_Simulation
EVT Clean
Price (off NSE-ZCYC)
Accrued_Interest
GS CG2016 7.59% 0.951 0.825 1.22 1.904 1.005 97.807 3.4998
GS CG2017 7.99% 1.045 0.719 1.264 0.636 1.045 97.274 1.7534
GS CG2018 7.83% 1.084 0.735 1.242 0.69 1.039 95.966 3.6322
GS CG2019 7.28% 1.151 0.838 1.295 0.6 1.039 92.423 2.3256
GS CG2019A 6.05% 1.155 0.822 1.337 1.092 1.052 88.165 0.9411
GS CG2020 8.12% 1.227 0.984 1.345 0.866 1.02 94.514 2.436
GS CG2021 8.79% 1.279 1.05 1.368 0.803 1.051 97.421 3.4183
GS CG2022 8.08% 1.371 1.126 1.478 1.145 1.1 93.039 1.2569
GS CG2023 7.16% 1.507 1.21 1.595 1.03 1.208 86.884 2.5458
GS CG2023 8.83% 1.491 1.176 1.633 1.212 1.193 96.901 3.0169
GS CG2024 9.15% 1.606 1.204 1.775 1.001 1.312 98.762 3.4058
GS CG2027 8.28% 2.159 1.355 2.457 0.893 1.863 91.854 0.161
GS CG2032 8.28% 3.115 1.868 3.869 3.071 2.827 90.809 0.989
GS CG2032 8.32% 3.214 1.942 4.042 4.358 2.863 91.08 1.2942
GS CG2034 7.50% 3.819 2.422 4.944 5.103 3.452 83.395 1
GS CG2041 8.83% 4.945 3.479 6.615 4.223 4.862 95.317 2.5999
GS CG2042 8.30% 5.211 3.712 7.112 4.633 5.188 90.041 2.0058
GS CG2043 9.23% 5.168 3.677 7.11 4.613 5.128 99.322 2.4357
TB 364D 50315 0.717 0.903 0.893 0.532 0.776 92.429 0
TB 364D 190315 0.732 0.911 0.914 0.529 0.792 92.125 0
TB 91D 120614 0.248 0.33 0.315 0.312 0.268 98.299 0
Note: 1-day VaR(99%) measure for GoI Securities that traded on NSE-WDM
Table 5-8: Corporate Bond trades at NSE (2013-14)
Month/Year No. of Trades Traded Value (` Crores)
Apr-11 499 11,886
May-11 370 8,205
Jun-11 719 15,960
Jul-11 915 15,852
Aug-11 718 13,658
Contd...
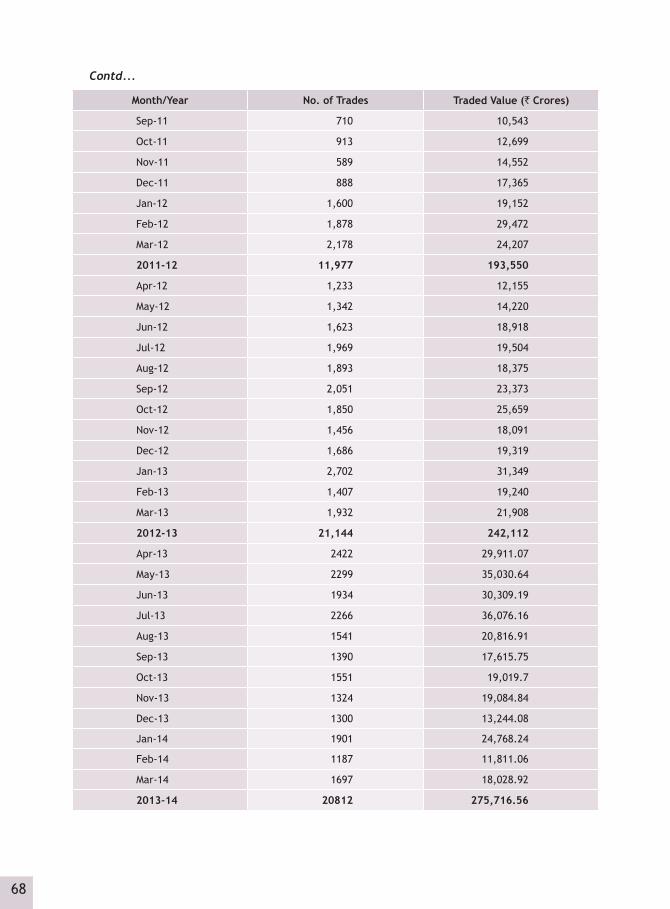
68
Month/Year No. of Trades Traded Value (` Crores)
Sep-11 710 10,543
Oct-11 913 12,699
Nov-11 589 14,552
Dec-11 888 17,365
Jan-12 1,600 19,152
Feb-12 1,878 29,472
Mar-12 2,178 24,207
2011-12 11,977 193,550
Apr-12 1,233 12,155
May-12 1,342 14,220
Jun-12 1,623 18,918
Jul-12 1,969 19,504
Aug-12 1,893 18,375
Sep-12 2,051 23,373
Oct-12 1,850 25,659
Nov-12 1,456 18,091
Dec-12 1,686 19,319
Jan-13 2,702 31,349
Feb-13 1,407 19,240
Mar-13 1,932 21,908
2012-13 21,144 242,112
Apr-13 2422 29,911.07
May-13 2299 35,030.64
Jun-13 1934 30,309.19
Jul-13 2266 36,076.16
Aug-13 1541 20,816.91
Sep-13 1390 17,615.75
Oct-13 1551 19,019.7
Nov-13 1324 19,084.84
Dec-13 1300 13,244.08
Jan-14 1901 24,768.24
Feb-14 1187 11,811.06
Mar-14 1697 18,028.92
2013-14 20812 275,716.56
Contd...
Equity Futures & Options Segment 6

70
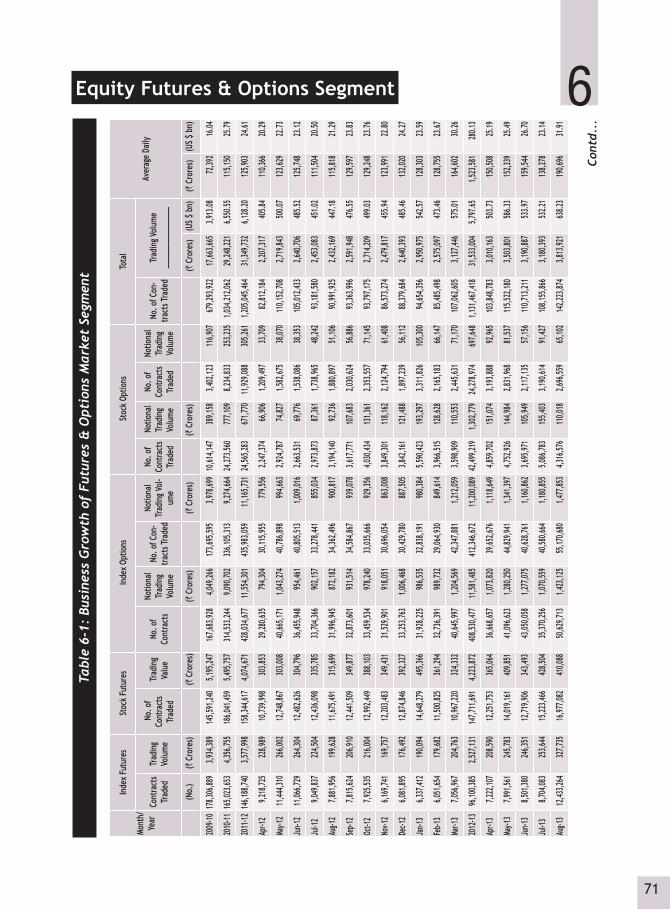
71
6
Cont
d...
Equity Futures & Options SegmentTa
ble
6-1:
Bus
ines
s G
row
th o
f Fu
ture
s &
Opt
ions
Mar
ket
Segm
ent
Mont
h/Ye
ar
Inde
x Fu
ture
sSt
ock
Futu
res
Inde
x Op
tions
Stoc
k Op
tions
Tota
l
Aver
age
Daily
Cont
ract
s Tr
aded
Trad
ing
Volu
me
No.
of
Cont
ract
s Tr
aded
Trad
ing
Valu
eNo
. of
Cont
ract
s
Notio
nal
Trad
ing
Volu
me
No. o
f Con
-tra
cts T
rade
d
Notio
nal
Trad
ing V
ol-
ume
No. o
f Co
ntra
cts
Trad
ed
Not
iona
l Tr
adin
g Vo
lum
e
No. o
f Co
ntra
cts
Trad
ed
Notio
nal
Trad
ing
Volu
me
No. o
f Con
-tra
cts T
rade
dTr
adin
g Vol
ume
____
____
____
___
(No.
) (`
Cro
res)
(` C
rore
s)(`
Cro
res)
(` C
rore
s)(`
Cro
res)
(` C
rore
s)(U
S $ b
n)(`
Cro
res)
(US $
bn)
2009
-1017
8,306
,889
3,93
4,389
14
5,591
,240
5,19
5,247
16
7,683
,928
4,04
9,266
17
3,695
,595
3,97
8,699
10,6
14,14
7 38
9,158
3,
402,1
23
116,9
07
679,2
93,92
2 17
,663,6
65
3,91
3.08
72,39
2 16
.04
2010
-1116
5,023
,653
4,35
6,755
18
6,041
,459
5,49
5,757
31
4,533
,244
9,09
0,702
33
6,105
,313
9,27
4,664
24,2
73,56
0 77
7,109
8,
234,8
33
253,2
35
1,034
,212,0
62
29,24
8,221
6,
550.5
5 11
5,150
25
.79
2011
-1214
6,188
,740
3,57
7,998
15
8,344
,617
4,07
4,671
42
8,034
,677
11,55
4,301
43
5,983
,059
11,16
5,731
24,5
65,28
3 67
1,770
11
,929,0
88
305,2
61
1,205
,045,4
64
31,34
9,732
6,
128.2
0 12
5,903
24
.61
Apr-1
29,2
18,72
522
8,989
10,73
9,998
303,8
5329
,280,6
3579
4,304
30,11
5,955
779,5
562,2
47,37
466
,906
1,209
,497
33,70
982
,812,1
842,2
07,31
740
5.84
110,3
6620
.29
May-1
211
,444,3
1026
6,002
12,74
8,867
303,0
0840
,665,1
711,0
43,27
440
,786,8
9899
4,663
2,924
,787
74,82
71,5
82,67
538
,070
110,1
52,70
82,7
19,84
350
0.07
123,6
2922
.73
Jun-1
211
,066,7
2926
4,304
12,48
2,626
304,7
9636
,455,9
4895
4,461
40,80
5,513
1,009
,016
2,663
,531
69,77
61,5
38,08
638
,353
105,0
12,43
32,6
40,70
648
5.52
125,7
4823
.12
Jul-1
29,0
49,83
722
4,504
12,43
6,098
335,7
8533
,704,3
6690
2,157
33,27
8,441
855,0
342,9
73,87
387
,361
1,738
,965
48,24
293
,181,5
802,4
53,08
345
1.02
111,5
0420
.50
Aug-1
27,8
81,95
619
9,628
11,67
5,491
315,6
9931
,996,9
4587
2,182
34,36
2,496
900,8
173,1
94,14
092
,736
1,880
,897
51,10
690
,991,9
252,4
32,16
944
7.18
115,8
1821
.29
Sep-1
27,8
15,62
420
6,910
12,44
1,509
349,8
7732
,873,6
0193
1,514
34,58
4,867
939,0
783,6
17,77
110
7,683
2,030
,624
56,88
693
,363,9
962,5
91,94
847
6.55
129,5
9723
.83
Oct-1
27,9
25,53
521
6,004
12,99
2,449
388,1
0333
,459,5
3497
8,240
33,03
5,666
929,3
564,0
30,43
413
1,361
2,353
,557
71,14
593
,797,1
752,7
14,20
949
9.03
129,2
4823
.76
Nov-1
26,1
69,74
116
9,757
12,20
3,483
349,4
3131
,529,9
0191
8,051
30,69
6,054
863,0
083,8
49,30
111
8,162
2,124
,794
61,40
886
,573,2
742,4
79,81
745
5.94
123,9
9122
.80
Dec-1
26,0
81,89
517
6,492
12,87
4,846
392,3
2733
,253,7
631,0
06,46
830
,429,7
8088
7,505
3,842
,161
121,4
881,8
97,23
956
,112
88,37
9,684
2,640
,393
485.4
613
2,020
24.27
Jan-1
36,3
37,41
219
0,094
14,64
8,279
495,3
6631
,928,2
2598
6,535
32,83
8,191
980,3
845,5
90,42
319
3,297
3,311
,826
105,3
0094
,654,3
562,9
50,97
554
2.57
128,3
0323
.59
Feb-1
36,0
51,65
417
9,682
11,50
0,825
361,2
9432
,736,3
9198
9,732
29,06
4,930
849,6
143,9
66,51
512
8,628
2,165
,183
66,14
785
,485,4
982,5
75,09
747
3.46
128,7
5523
.67
Mar-1
37,0
56,96
720
4,763
10,96
7,220
324,3
3240
,645,9
971,2
04,56
942
,347,8
811,2
12,05
93,5
98,90
911
0,553
2,445
,631
71,17
010
7,062
,605
3,127
,446
575.0
116
4,602
30.26
2012
-1396
,100,3
852,5
27,13
114
7,711
,691
4,223
,872
408,5
30,47
711
,581,4
8541
2,346
,672
11,20
0,089
42,49
9,219
1,302
,779
24,27
8,974
697,6
481,1
31,46
7,418
31,53
3,004
5,797
.651,5
23,58
128
0.13
Apr-1
37,2
22,10
720
8,590
12,25
1,753
36
5,064
36
,668,6
571,0
73,82
039
,652,6
761,1
18,64
94,8
59,70
215
1,074
3,193
,888
92,96
510
3,848
,783
3,010
,163
503.7
315
0,508
25.19
May-1
37,9
91,56
124
5,783
14,01
9,161
40
9,851
41
,096,6
231,2
80,25
044
,829,9
411,3
41,39
74,7
52,92
614
4,984
2,831
,968
81,53
711
5,522
,180
3,503
,801
586.3
315
2,339
25.49
Jun-1
38,5
01,38
024
6,351
12,71
9,906
34
3,493
43
,050,0
581,2
77,07
540
,628,7
611,1
60,86
23,6
95,97
110
5,949
2,117
,135
57,15
611
0,713
,211
3,190
,887
533.9
715
9,544
26.70
Jul-1
38,7
04,08
325
3,644
15,22
3,466
42
8,504
35
,370,2
561,0
70,55
940
,580,6
641,1
80,85
55,0
86,78
315
5,403
3,190
,614
91,42
710
8,155
,866
3,180
,393
532.2
113
8,278
23.14
Aug-1
312
,433,2
6432
7,735
16,97
7,082
41
0,088
50
,629,7
131,4
23,12
555
,170,6
801,4
77,85
34,3
16,57
611
0,018
2,696
,559
65,10
214
2,223
,874
3,813
,921
638.2
319
0,696
31.91
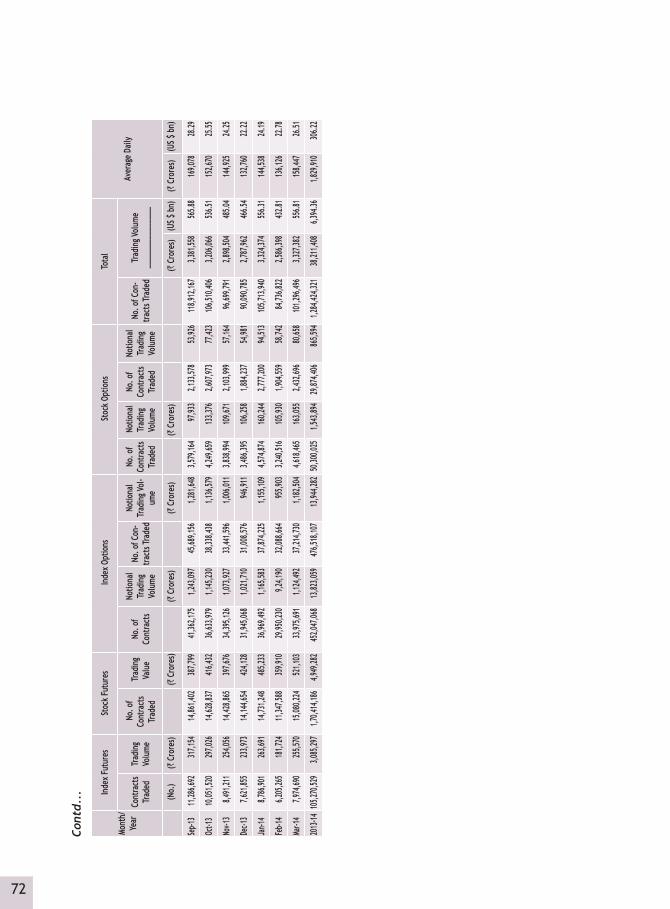
72
Mont
h/Ye
ar
Inde
x Fu
ture
sSt
ock
Futu
res
Inde
x Op
tions
Stoc
k Op
tions
Tota
l
Aver
age
Daily
Cont
ract
s Tr
aded
Trad
ing
Volu
me
No.
of
Cont
ract
s Tr
aded
Trad
ing
Valu
eNo
. of
Cont
ract
s
Notio
nal
Trad
ing
Volu
me
No. o
f Con
-tra
cts T
rade
d
Notio
nal
Trad
ing V
ol-
ume
No. o
f Co
ntra
cts
Trad
ed
Not
iona
l Tr
adin
g Vo
lum
e
No. o
f Co
ntra
cts
Trad
ed
Notio
nal
Trad
ing
Volu
me
No. o
f Con
-tra
cts T
rade
dTr
adin
g Vol
ume
____
____
____
___
(No.
) (`
Cro
res)
(` C
rore
s)(`
Cro
res)
(` C
rore
s)(`
Cro
res)
(` C
rore
s)(U
S $ b
n)(`
Cro
res)
(US $
bn)
Sep-1
311
,286,6
9231
7,154
14,86
1,402
38
7,799
41
,362,1
751,2
43,09
745
,689,1
561,2
81,64
83,5
79,16
497
,933
2,133
,578
53,92
611
8,912
,167
3,381
,558
565.8
816
9,078
28.29
Oct-1
310
,051,5
2029
7,026
14,62
8,837
41
6,432
36
,633,9
791,1
45,23
038
,338,4
381,1
36,57
94,2
49,65
913
3,376
2,607
,973
77,42
310
6,510
,406
3,206
,066
536.5
115
2,670
25.55
Nov-1
38,4
91,21
125
4,056
14,42
8,865
39
7,676
34
,395,1
261,0
73,92
733
,441,5
961,0
06,01
13,8
38,99
410
9,671
2,103
,999
57,16
496
,699,7
912,8
98,50
448
5.04
144,9
2524
.25
Dec-1
37,6
21,85
523
3,973
14,14
4,654
42
4,128
31
,945,0
681,0
21,71
031
,008,5
7694
6,911
3,486
,395
106,2
581,8
84,23
754
,981
90,09
0,785
2,787
,962
466.5
413
2,760
22.22
Jan-1
48,7
86,90
126
3,691
14,73
1,248
48
5,233
36
,969,4
921,1
65,58
337
,874,2
251,1
55,10
94,5
74,87
416
0,244
2,777
,200
94,51
310
5,713
,940
3,324
,374
556.3
114
4,538
24.19
Feb-1
46,2
05,26
518
1,724
11,34
7,588
35
9,910
29
,950,2
309,2
4,190
32,08
8,664
955,9
033,2
40,51
610
5,930
1,904
,559
58,74
284
,736,8
222,5
86,39
843
2.81
136,1
2622
.78
Mar-1
47,9
74,69
025
5,570
15,08
0,224
52
1,103
33
,975,6
911,1
24,49
237
,214,7
301,1
82,50
44,6
18,46
516
3,055
2,432
,696
80,65
810
1,296
,496
3,327
,382
556.8
115
8,447
26.51
2013
-1410
5,270
,529
3,085
,297
1,70,4
14,18
64,9
49,28
245
2,047
,068
13,82
3,059
476,5
18,10
713
,944,2
8250
,300,0
251,5
43,89
429
,874,4
0686
5,594
1,284
,424,3
2138
,211,4
086,3
94.36
1,829
,910
306.2
2
Cont
d...

73
Table 6-2: Benchmark Indices Contracts & Trading Volume in F&O Segment of NSE (2013-14)
Products Underlying No. of Contracts Turnover
` Crores US $ bn
BANKNIFTY BANK NIFTY 91,528,064 2,562,078.87 15,316.45
CNXINFRA CNXINFRA 133 3.07 0.02
CNXIT CNX IT 85,473 3,695.10 14.30
CNXPSE CNXPSE 96 1.98 0.02
DJIA DJIA 174,060 6,689.45 29.13
FTSE100 FTSE100 10,190 327.50 1.71
INDIAVIX INDIA VIX 17,546 2,193.23 2.94
NFTYMCAP50 NIFTY MIDCAP 50 26,353 833.82 4.41
NIFTY CNX NIFTY 941,915,613 28,273,504.97 157,621.68
S&P500 S&P 500 78,176 3,309.83 13.08
TOTAL 1,033,835,704 30,852,637.82 173,003.73
Table 6-3: Internet Trading in the F&O Segment of the Exchange
Year Enabled members *
Registered clients *
Internet Trading Value
Internet Trading Value
% of Total Trading Volume(` Crores) (US $ bn)
2006-07 242 1,616,218 1,214,961 278.73 8.26
2007-08 305 3,432,771 2,417,165 604.75 9.24
2008-09 337 4,426,577 1,686,208 330.95 7.66
2009-10 356 3,529,947 2,694,513 596.92 7.63
2010-11 380 4,363,400 4,318,184 967.12 7.38
2011-12 421 4,151,677 4,910,582 959.91 7.83
2012-13 437 3,833,149 5,905,158 704.76 9.36
2013-14 451 4,116,039 7,652,572 688.78 10.01* At the end of financial year.
Table 6-4: Records Achieved in the F&O Segment : 2013-14
Product Traded Value (` in Crores) (US $ mn) Date
Index Futures 29,261 4,896.55 28-Feb-13
Stock Futures 52,774 8,831.24 27-Mar-14
Index Options 308,254 51,583.76 28-Feb-13
Stock Options 28,002 4,685.87 12-Apr-13
Total F&O Traded Value 402,091 67,286.50 28-Feb-13

74
Table 6-5: Participant wise Trading Value in the F&O Segment (2013-14)
Month/Year
Institutional investors Retail Proprietary
Gross Traded Value % to GrossTurn-over
Gross Traded Value % to GrossTurn-over
Gross Traded Value % to GrossTurn-over` Crores US $ bn ` Crores US $ bn ` Crores US $ bn
2007-08 3,256,034 814.62 12.44 16,485,724 4,124.52 62.97 6,439,196 1,611.01 24.59
2008-09 2,944,454 577.91 13.37 12,250,029 2,404.32 55.63 6,826,484 1,339.84 31.00
2009-10 4,772,915 1,057.36 13.51 19,378,966 4,293.08 54.86 11,175,447 2,475.73 31.63
2010-11 7,423,695 1,662.64 12.69 28,762,436 6,441.75 49.17 22,310,313 4,996.71 38.14
2011-12 10,170,705 1,988.15 16.22 25,374,513 4,960.17 40.47 27,154,245 5,308.07 43.31
Apr-12 820,221 150.81 18.58 1,635,584 300.72 37.05 1,958,828 360.15 44.37
May-12 1,113,118 204.66 20.46 1,915,628 352.21 35.22 2,410,940 443.27 44.32
Jun-12 1,057,546 194.44 20.02 1,895,154 348.44 35.88 2,328,713 428.16 44.09
Jul-12 799,888 147.07 16.3 1,819,039 334.45 37.08 2,287,239 420.53 46.62
Aug-12 788,960 145.06 16.22 1,761,029 323.78 36.2 2,314,347 425.52 47.58
Sep-12 849,517 156.19 16.39 1,864,544 342.81 35.97 2,469,836 454.10 47.64
Oct-12 927,090 170.45 17.08 1,990,928 366.05 36.68 2,510,401 461.56 46.25
Nov-12 760,587 139.84 15.34 1,897,137 348.81 38.25 2,301,910 423.23 46.41
Dec-12 852,434 156.73 16.14 1,982,682 364.54 37.55 2,445,670 449.66 46.31
Jan-13 1,006,523 185.06 17.05 2,278,529 418.93 38.61 2,616,899 481.14 44.34
Feb-13 857,676 157.69 16.65 1,892,046 347.87 36.74 2,400,472 441.35 46.61
Mar-13 1,081,910 198.92 17.3 2,218,683 407.93 35.47 2,954,299 543.18 47.23
2012-13 9,908,947 1,821.86 16.63 23,150,983 4,256.53 38.85 26,529,718 4,877.75 44.52
Apr-13 952,881 159.46 15.83 2,166,070 362.47 35.98 2,901,375 485.52 48.19
May-13 1,197,001 200.31 17.08 2,576,188 431.10 36.76 3,234,413 541.25 46.16
Jun-13 1,095,184 183.27 17.16 2,334,265 390.62 36.58 2,952,324 494.05 46.26
Jul-13 1,005,539 168.27 15.81 2,367,557 396.19 37.22 2,987,690 499.96 46.97
Aug-13 1,382,615 231.37 18.13 2,523,528 422.29 33.08 3,721,698 622.79 48.79
Sep-13 1,229,608 205.76 18.18 2,350,467 393.33 34.75 3,183,041 532.66 47.06
Oct-13 1,128,881 188.91 17.61 2,241,602 375.11 34.96 3,041,649 508.99 47.44
Nov-13 949,303 158.86 16.38 2,092,960 350.24 36.10 2,754,746 460.98 47.52
Dec-13 832,497 139.31 14.93 2,019,756 337.99 36.22 2,723,671 455.78 48.85
Jan-14 975,376 163.22 14.67 2,383,877 398.92 35.85 3,289,494 550.47 49.48
Feb-14 785,207 131.40 15.18 1,880,388 314.67 36.35 2,507,201 419.56 48.47
Mar-14 1,077,529 180.32 16.19 2,413,766 403.92 36.27 3,163,469 529.38 47.54
2013-14 12,611,623 2,110.45 16.50 27,350,424 4,576.86 35.79 36,460,769 6,101.40 47.71
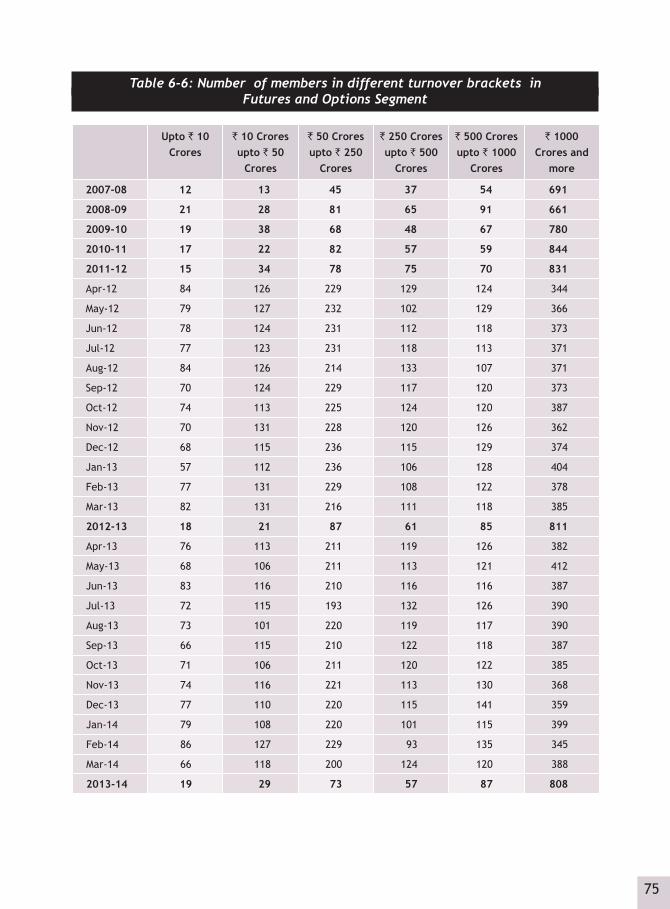
75
Table 6-6: Number of members in different turnover brackets in Futures and Options Segment
Upto ` 10 Crores
` 10 Crores upto ` 50
Crores
` 50 Crores upto ` 250
Crores
` 250 Crores upto ` 500
Crores
` 500 Crores upto ` 1000
Crores
` 1000 Crores and
more
2007-08 12 13 45 37 54 691
2008-09 21 28 81 65 91 661
2009-10 19 38 68 48 67 780
2010-11 17 22 82 57 59 844
2011-12 15 34 78 75 70 831
Apr-12 84 126 229 129 124 344
May-12 79 127 232 102 129 366
Jun-12 78 124 231 112 118 373
Jul-12 77 123 231 118 113 371
Aug-12 84 126 214 133 107 371
Sep-12 70 124 229 117 120 373
Oct-12 74 113 225 124 120 387
Nov-12 70 131 228 120 126 362
Dec-12 68 115 236 115 129 374
Jan-13 57 112 236 106 128 404
Feb-13 77 131 229 108 122 378
Mar-13 82 131 216 111 118 385
2012-13 18 21 87 61 85 811
Apr-13 76 113 211 119 126 382
May-13 68 106 211 113 121 412
Jun-13 83 116 210 116 116 387
Jul-13 72 115 193 132 126 390
Aug-13 73 101 220 119 117 390
Sep-13 66 115 210 122 118 387
Oct-13 71 106 211 120 122 385
Nov-13 74 116 221 113 130 368
Dec-13 77 110 220 115 141 359
Jan-14 79 108 220 101 115 399
Feb-14 86 127 229 93 135 345
Mar-14 66 118 200 124 120 388
2013-14 19 29 73 57 87 808

76
Table 6-7: Number of members in different turnover brackets in Futures and Options Segment
Month
Futures Segment Options Segment
Number of Members Number of Members
Upto ` 10
Crores
` 10 Crores upto ` 50
Crores
` 50 Crores upto `250
Crores
` 250 Crores upto `500
Crores
` 500 Crores upto
`1000 Crores
` 1000 Crores
and more
Upto ` 10
Crores
` 10 Crores upto ` 50
Crores
` 50 Crores upto `250
Crores
` 250 Crores upto `500
Crores
` 500 Crores upto
`1000 Crores
` 1000 Crores
and more
2007-08 13 14 50 42 57 676 98 96 176 96 91 295
2008-09 29 36 95 70 104 613 111 99 162 103 90 382
2009-10 28 41 93 55 88 715 96 85 146 88 94 511
2010-11 26 32 118 69 83 753 83 71 108 77 84 658
2011-12 30 52 121 93 117 690 89 70 131 60 92 661
Apr-12 134 178 287 153 99 185 246 156 193 117 74 250
May-12 134 178 289 127 110 197 235 144 200 89 96 271
Jun-12 136 178 279 130 114 199 228 147 208 87 99 267
Jul-12 120 191 270 145 112 195 229 153 196 100 87 268
Aug-12 136 181 286 141 105 186 231 141 205 95 97 266
Sep-12 125 185 289 144 104 186 215 148 202 78 112 278
Oct-12 120 187 272 146 107 211 220 156 198 85 103 281
Nov-12 124 210 270 143 115 175 215 157 201 82 114 268
Dec-12 118 183 279 141 121 195 199 164 203 86 116 269
Jan-13 103 172 275 150 119 224 205 164 183 87 120 284
Feb-13 136 198 281 136 116 178 222 145 204 85 115 274
Mar-13 147 195 297 130 104 170 208 147 191 89 110 298
2012-13 35 41 128 99 120 660 88 68 110 79 90 648
Apr-13 127 189 291 130 109 181 199 139 189 95 110 295
May-13 115 182 283 134 111 206 194 132 187 101 101 305
Jun-13 135 191 286 136 100 180 209 151 197 95 111 259
Jul-13 119 184 282 132 113 198 224 157 181 103 102 248
Aug-13 131 171 297 129 102 190 207 152 183 96 103 281
Sep-13 117 190 285 124 110 192 208 123 188 109 108 292
Oct-13 112 174 288 120 119 202 207 126 189 104 109 293
Nov-13 125 178 282 137 113 187 199 130 210 94 100 283
Dec-13 129 170 288 125 113 197 199 123 193 88 107 321
Jan-14 116 170 277 125 120 214 206 151 192 100 109 264
Feb-14 134 194 274 138 103 172 198 134 197 96 100 290
Mar-14 120 167 264 138 116 211 187 135 192 106 110 288
2013-14 35 41 138 80 124 655 74 66 116 73 77 667
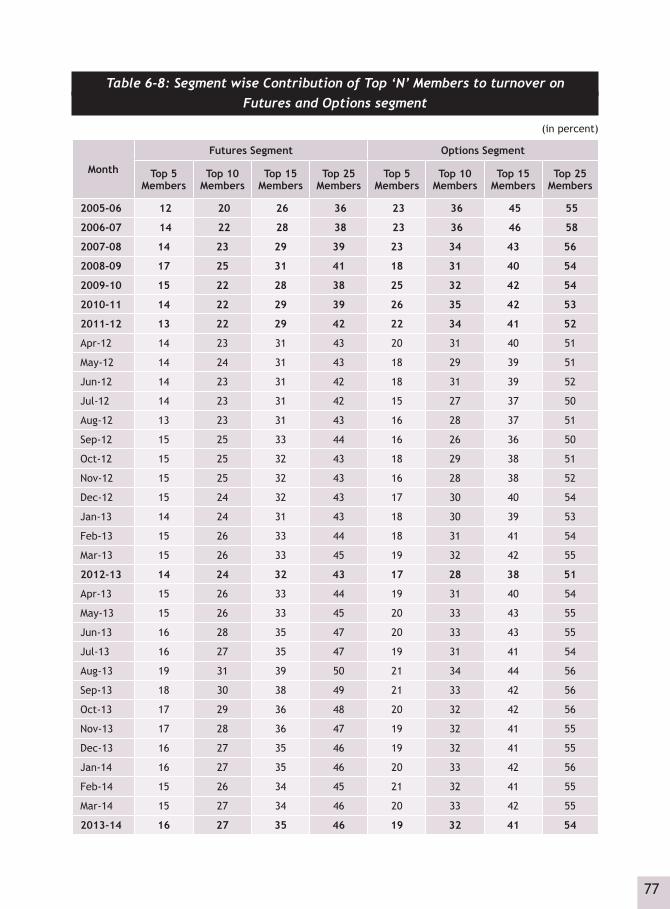
77
Table 6-8: Segment wise Contribution of Top ‘N’ Members to turnover on Futures and Options segment
(in percent)
Month
Futures Segment Options Segment
Top 5 Members
Top 10 Members
Top 15 Members
Top 25 Members
Top 5 Members
Top 10 Members
Top 15 Members
Top 25 Members
2005-06 12 20 26 36 23 36 45 55
2006-07 14 22 28 38 23 36 46 58
2007-08 14 23 29 39 23 34 43 56
2008-09 17 25 31 41 18 31 40 54
2009-10 15 22 28 38 25 32 42 54
2010-11 14 22 29 39 26 35 42 53
2011-12 13 22 29 42 22 34 41 52
Apr-12 14 23 31 43 20 31 40 51
May-12 14 24 31 43 18 29 39 51
Jun-12 14 23 31 42 18 31 39 52
Jul-12 14 23 31 42 15 27 37 50
Aug-12 13 23 31 43 16 28 37 51
Sep-12 15 25 33 44 16 26 36 50
Oct-12 15 25 32 43 18 29 38 51
Nov-12 15 25 32 43 16 28 38 52
Dec-12 15 24 32 43 17 30 40 54
Jan-13 14 24 31 43 18 30 39 53
Feb-13 15 26 33 44 18 31 41 54
Mar-13 15 26 33 45 19 32 42 55
2012-13 14 24 32 43 17 28 38 51
Apr-13 15 26 33 44 19 31 40 54
May-13 15 26 33 45 20 33 43 55
Jun-13 16 28 35 47 20 33 43 55
Jul-13 16 27 35 47 19 31 41 54
Aug-13 19 31 39 50 21 34 44 56
Sep-13 18 30 38 49 21 33 42 56
Oct-13 17 29 36 48 20 32 42 56
Nov-13 17 28 36 47 19 32 41 55
Dec-13 16 27 35 46 19 32 41 55
Jan-14 16 27 35 46 20 33 42 56
Feb-14 15 26 34 45 21 32 41 55
Mar-14 15 27 34 46 20 33 42 55
2013-14 16 27 35 46 19 32 41 54

78
Table 6-9: Top 20 Futures contracts according to number of contracts 2013-14
S.No. Name of the ContractNumber of Contracts
Turnover Percentage of contracts to Top
20 contracts(` Crores)
1 NIFTY August 13 252,498 9,065,745 8.99
2 NIFTY September 13 245,614 8,596,843 8.74
3 NIFTY October 13 231,426 7,645,028 8.24
4 NIFTY January 14 191,815 6,131,913 6.83
5 NIFTY June 13 189,063 6,492,389 6.73
6 NIFTY November 13 188,152 6,106,099 6.70
7 NIFTY May 13 181,338 6,019,855 6.46
8 NIFTY July 13 167,507 5,687,503 5.96
9 NIFTY December 13 164,155 5,253,648 5.84
10 NIFTY March 14 159,345 4,931,435 5.67
11 NIFTY February 14 140,617 4,595,362 5.01
12 NIFTY April 13 118,765 4,188,277 4.23
13 BANKNIFTY August 13 84,724 3,484,170 3.02
14 BANKNIFTY October 13 78,292 2,966,124 2.79
15 BANKNIFTY September 13 74,222 3,001,290 2.64
16 BANKNIFTY January 14 73,103 2,646,175 2.60
17 BANKNIFTY March 14 72,452 2,458,223 2.58
18 BANKNIFTY May 13 66,726 2,102,706 2.38
19 BANKNIFTY November 13 66,070 2,388,079 2.35
20 BANKNIFTY December 13 63,236 2,208,387 2.25
TOTAL 2,809,119 95,969,251 100.00
Table 6-10: Top 20 Option contracts according to No.of Contracts traded 2013-14
S.No. Name of the Contract Number of Contracts
Turnover Percentage of contracts to Top
20 contracts(` Crores)
1 NIFTYMay 2013 CE 6100 11,766,568 361,473.47 6.87
2 NIFTYMay 2013 PE 6000 10,643,581 321,600.30 6.22
3 NIFTYJuly 2013 CE 6000 9,685,215 292,596.50 5.66
4 NIFTYOctober 2013 CE 6200 9,210,188 288,108.43 5.38
5 NIFTYMay 2013 CE 6200 8,806,050 274,288.80 5.14
6 NIFTYOctober 2013 CE 6300 8,637,480 273,036.97 5.05
7 NIFTYJune 2013 PE 5600 9,267,660 260,686.87 5.41
8 NIFTYAugust 2013 PE 5300 9,577,711 255,650.76 5.60
Contd...

79
S.No. Name of the Contract Number of Contracts
Turnover Percentage of contracts to Top
20 contracts(` Crores)
9 NIFTYJanuary 2014 PE 6200 7,921,654 247,757.31 4.63
10 NIFTYJanuary 2014 CE 6300 7,775,740 247,148.73 4.54
11 NIFTYDecember 2013 CE 6300 7,727,104 245,151.72 4.51
12 NIFTYMay 2013 PE 5900 8,224,573 244,255.43 4.81
13 NIFTYMarch 2014 CE 6600 7,342,144 243,611.64 4.29
14 NIFTYAugust 2013 PE 5400 8,905,098 242,841.76 5.20
15 NIFTYMay 2013 PE 6100 7,664,989 235,850.07 4.48
16 NIFTYNovember 2013 PE 6100 7,641,415 235,018.04 4.46
17 NIFTYFebruary 2014 CE 6200 7,479,989 232,992.39 4.37
18 NIFTYSeptember 2013 CE 6000 7,574,130 228,952.48 4.43
19 NIFTYNovember 2013 CE 6100 7,432,829 228,335.07 4.34
20 NIFTYJune 2013 PE 5700 7,881,302 226,630.18 4.60
TOTAL 171,165,420 5,185,986.92 100.00
Table 6-11: Number of trades in the Futures & Options Segment
Month/Year Index Futures Stock Futures Index Options Stock Options Total
2007-08 30,897,058 153,187,768 10,370,483 7,767,865 202,223,174
2008-09 58,898,232 153,256,283 43,740,142 9,331,300 265,225,957
2009-10 57,564,449 120,163,033 76,949,992 11,494,712 266,172,186
2010-11 54,099,706 143,556,091 147,150,524 25,923,625 370,729,946
2011-12 57,713,350 122,687,746 217,338,496 27,365,782 425,105,374
Apr-12 3,714,837 8,406,636 15,777,206 2,394,700 30,293,379
May-12 4,798,810 10,006,573 19,883,886 3,153,481 37,842,750
Jun-12 4,723,786 9,854,508 18,258,363 2,983,161 35,819,818
Jul-12 3,700,672 9,772,208 14,850,095 3,241,985 31,564,960
Aug-12 3,146,717 9,168,328 13,762,676 3,537,216 29,614,937
Sep-12 2,931,286 9,889,491 13,692,987 3,941,425 30,455,189
Oct-12 2,930,307 10,152,996 14,603,697 4,465,733 32,152,733
Nov-12 2,357,016 9,365,963 13,025,996 4,255,525 29,004,500
Dec-12 2,310,677 9,960,354 14,204,771 4,126,867 30,602,669
Jan-13 2,409,550 11,756,067 15,028,433 6,266,537 35,460,587
Feb-13 2,259,389 9,216,435 14,015,673 4,444,449 29,935,946
Mar-13 2,723,645 8,793,565 19,241,427 4,303,118 35,061,755
2012-13 38,006,692 116,343,124 186,345,210 47,114,197 387,809,223
Apr-13 2,858,690 9,914,354 19,339,862 5,454,669 37,567,575
Contd...
Contd...

80
Month/Year Index Futures Stock Futures Index Options Stock Options Total
May-13 3,278,315 11,210,661 21,889,267 5,436,817 41,815,060
Jun-13 3,420,694 10,142,638 20,303,648 4,207,317 38,074,297
Jul-13 3,610,354 12,289,284 19,681,116 5,835,184 41,415,938
Aug-13 5,109,057 13,748,427 28,270,186 5,121,116 52,248,786
Sep-13 4,888,542 11,993,971 24,235,254 4,286,295 45,404,062
Oct-13 4,426,253 11,729,097 20,683,649 5,065,517 41,904,516
Nov-13 3,798,671 11,372,781 18,400,372 4,420,190 37,992,014
Dec-13 3,277,693 11,189,188 17,178,589 3,999,503 35,644,973
Jan-14 3,845,830 11,897,007 21,464,126 5,416,957 42,623,920
Feb-14 2,738,592 8,853,015 17,369,668 3,887,232 32,848,507
Mar-14 3,567,252 12,164,825 20,897,460 5,376,100 42,005,637
2013-14 44,819,943 136,505,248 249,713,197 58,506,897 489,545,285
Table 6-12: Settlement Statistics in F&O Segment
Month/Year
Index/Stock Futures Index/Stock Options
TotalMTM Settlement
Final Settlement
Premium Settlement
Exercise Settlement
(` Crores) (` Crores) (` Crores) (` Crores) (` Crores) (US $ mn)
Apr-13 2,994.26 138.47 1,153.99 156.95 4,443.67 743.61
May-13 3,802.99 92.57 1,094.52 153.04 5,143.12 860.66
Jun-13 3,703.77 233.71 1,034.28 486.85 5,458.61 913.45
Jul-13 4,358.96 125.27 1,082.09 133.87 5,700.19 953.88
Aug-13 5,274.29 358.69 1,439.80 329.24 7,402.02 1,238.67
Sep-13 4,273.44 30.44 1,352.35 176.96 5,833.19 976.14
Oct-13 2,669.13 74.46 1,135.32 131.29 4,010.20 671.07
Nov-13 3,223.00 47.01 949.40 67.08 4,286.49 717.31
Dec-13 2,732.79 23.80 1,143.38 145.06 4,045.03 676.90
Jan-14 4,054.38 151.87 919.49 102.80 5,228.54 874.95
Feb-14 2,061.54 53.02 770.00 63.48 2,948.04 493.33
Mar-14 3,142.42 95.99 1,182.64 210.89 4,631.94 775.12
2013-14 42,290.97 1,425.30 13,257.26 2,157.51 59,131.04 9,895.08
Contd...
Currency DerivativesSegment 7

82

83
7Currency Derivatives Segment
Table 7-1: Business Growth of Currency Derivatives Segment at NSE
Month/ Year
No. of trading
days
No. of Contracts
Traded
Trading Value
(` Crores)
Trading Value
(US $ mn)
Average Daily
Trading Value
(` Crores)
Average Daily
Trading Value
(US $ mn)
No. of Contracts
Trading Value
(` Crores)
Trading Value
(US $ mn)
2008-09 139 32,672,768 162,272 31,849 1,167 229.05 257,554 1,313 257.70
2009-10 240 378,606,983 1,782,608 394,907 7,428 1645.55 427,873 1,964 435.09
2010-11 249 749,602,075 3,449,788 772,629 13,855 3102.93 3,020,562 13,690 3065.99
2011-12 240 973,344,132 4,674,990 913,860 19,479 3807.75 2,959,055 15,328 2996.24
Apr-12 20 49,684,569 260,451 47,886 13,023 2394.32 3,322,444 17,737 3261.16
May-12 22 82,490,519 453,946 83,462 20,634 3793.74 3,504,174 19,913 3661.16
Jun-12 21 69,624,353 393,619 72,371 18,744 3446.22 3,519,170 19,918 3662.05
Jul-12 22 83,611,989 467,274 85,913 21,240 3905.13 3,267,658 18,388 3380.89
Aug-12 21 58,715,174 328,907 60,473 15,662 2879.65 3,319,129 18,694 3437.08
Sep-12 19 72,551,533 397,592 73,101 20,926 3847.43 3,459,475 18,451 3392.36
Oct-12 20 94,860,746 507,426 93,295 25,371 4664.76 3,437,306 18,825 3461.11
Nov-12 20 84,515,590 467,875 86,023 23,394 4301.17 4,569,734 25,176 4628.89
Dec-12 20 81,164,915 448,753 82,508 22,438 4125.38 4,102,895 22,872 4205.20
Jan-13 22 106,705,891 586,025 107,746 26,637 4897.56 4,665,849 25,155 4624.99
Feb-13 19 91,017,848 497,277 91,429 26,172 4812.07 4,823,407 26,399 4853.67
Mar-13 19 84,300,321 465,320 85,554 24,491 4502.82 3,657,304 20,101 3695.73
2012-13 245 959,243,448 5,274,465 969,761 21,528 3958.21 3,657,304 20,101 3695.73
Apr-13 18 80,273,119 441,682 73,912 24,538 4106.21 4,622,954 25,188 4215.02
May-13 22 103,742,010 578,460 96,800 26,294 4400.02 5,303,380 30,349 5078.60
Jun-13 20 131,090,225 775,313 129,742 38,766 6487.10 4,674,415 28,247 4726.86
Jul-13 23 67,030,359 409,739 68,566 17,815 2981.15 1,799,562 11,360 1900.95
Aug-13 20 51,755,070 340,807 57,031 17,040 2851.56 1,533,205 10,494 1756.12
Sep-13 20 45,646,963 303,632 50,810 15,182 2540.51 1,159,752 7,568 1266.45
Oct-13 21 34,804,567 221,371 37,045 10,541 1764.03 1,076,464 6,866 1148.98
Nov-13 20 30,570,173 197,909 33,118 9,895 1655.92 1,157,479 7,537 1261.20
Dec-13 21 28,821,389 186,064 31,136 8,860 1482.68 1,160,405 7,493 1253.93
Jan-14 22 32,122,699 208,564 34,901 9,480 1586.43 1,130,108 7,385 1235.74
Feb-14 18 24,880,915 161,726 27,063 8,985 1503.53 1,041,007 6,780 1134.49
Mar-14 19 29,455,041 187,245 31,334 9,855 1649.15 1,034,474 6,409 1072.44
2013-14 244 660,192,530 4,012,513 671,460 16,445 2751.89 1,034,474 6,409 1072.44
* Includes turnover details for August 29,2008- the first day of trading of Currency futures at NSE.Currency Options were introducded at NSE w.e.f October 29, 2010.

84
Table 7-2: Records achieved in the Currency Futures & Options segment from the date of inception till 31 March 2014
CDS Segment Date Number/Value
Record number of trades 20-Jun-13 390,049
Record number of contracts 20-Jun-13 11,534,563
Record Daily Notional Turnover (` Crores) 20-Jun-13 69,323.90
Note:
Trading Value :- For Futures, Value of contract = Traded Qty*Traded Price. For Options, Value of contract = Traded Qty*(Strike Price+Traded Premium)
Table 7-3: Top 5 Currency Futures & Options Contracts on the basis of Turnover for the FY 2013-2014
Rank
Contract NameTotal Traded
QuantityTotal Traded Value
(` In Crores)
Total Traded Value (%) to Currency
Futures & Options Total Traded Value
Instrument Type
Contract Symbol Expiry
1 FUTCUR USDINR 26-Jun-13 76,525,555 442,867.94 11.04
2 FUTCUR USDINR 29-Jul-13 55,719,165 333,349.66 8.31
3 FUTCUR USDINR 29-May-13 58,638,824 321,910.37 8.02
4 OPTCUR USDINR 26-Jun-13 47,313,672 274,570.32 6.84
5 FUTCUR USDINR 26-Sep-13 38,522,829 249,298.08 6.21
Note:- Total Traded Value of Currency Futures & Options for FY 2013-14 is ` 4012513.45 Crores
Table 7-4: Settlement Statistics of Currency Derivatives Segment at NSE
Month/Year MTM Settlement Final Settlement
` Crores US $ mn ` Crores US $ mn
Apr-13 465.91 77.97 48.30 8.08
May-13 609.16 101.94 115.28 19.29
Jun-13 1,495.94 250.33 177.18 29.65
Jul-13 840.30 140.62 33.86 5.67
Aug-13 835.48 139.81 87.74 14.68
Sep-13 558.99 93.54 31.41 5.26
Oct-13 198.79 33.27 8.05 1.35
Nov-13 250.81 41.97 9.24 1.55
Dec-13 191.64 32.07 8.44 1.41
Jan-14 181.85 30.43 11.21 1.88
Feb-14 117.22 19.62 6.85 1.15
Mar-14 179.32 30.01 18.40 3.08
2013-14 5,925.41 991.57 555.95 93.03Note: 1. Currency Futures trading statred at NSE on August 29, 2008 2. Currency Options were introducded at NSE w.e.f October 29, 2010 3. MTM Settlement includes Futures MTM settlement as well as Option Premium settlement values 4. Final Settlement includes Futures Final settlement as well as Options Exercise settlement values
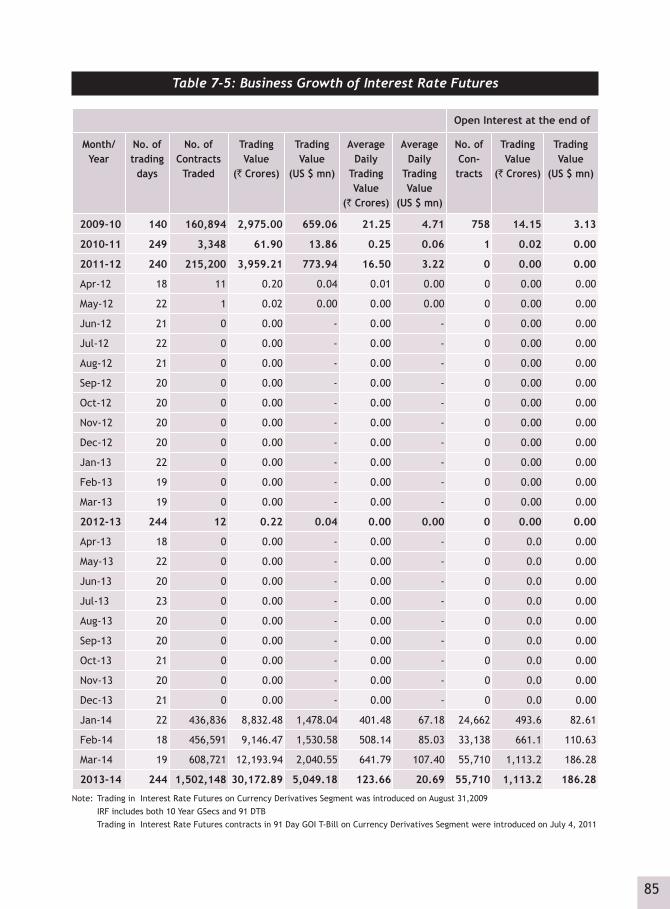
85
Table 7-5: Business Growth of Interest Rate Futures
Open Interest at the end of
Month/ Year
No. of trading
days
No. of Contracts
Traded
Trading Value
(` Crores)
Trading Value
(US $ mn)
Average Daily
Trading Value
(` Crores)
Average Daily
Trading Value
(US $ mn)
No. of Con-tracts
Trading Value
(` Crores)
Trading Value
(US $ mn)
2009-10 140 160,894 2,975.00 659.06 21.25 4.71 758 14.15 3.13
2010-11 249 3,348 61.90 13.86 0.25 0.06 1 0.02 0.00
2011-12 240 215,200 3,959.21 773.94 16.50 3.22 0 0.00 0.00
Apr-12 18 11 0.20 0.04 0.01 0.00 0 0.00 0.00
May-12 22 1 0.02 0.00 0.00 0.00 0 0.00 0.00
Jun-12 21 0 0.00 - 0.00 - 0 0.00 0.00
Jul-12 22 0 0.00 - 0.00 - 0 0.00 0.00
Aug-12 21 0 0.00 - 0.00 - 0 0.00 0.00
Sep-12 20 0 0.00 - 0.00 - 0 0.00 0.00
Oct-12 20 0 0.00 - 0.00 - 0 0.00 0.00
Nov-12 20 0 0.00 - 0.00 - 0 0.00 0.00
Dec-12 20 0 0.00 - 0.00 - 0 0.00 0.00
Jan-13 22 0 0.00 - 0.00 - 0 0.00 0.00
Feb-13 19 0 0.00 - 0.00 - 0 0.00 0.00
Mar-13 19 0 0.00 - 0.00 - 0 0.00 0.00
2012-13 244 12 0.22 0.04 0.00 0.00 0 0.00 0.00
Apr-13 18 0 0.00 - 0.00 - 0 0.0 0.00
May-13 22 0 0.00 - 0.00 - 0 0.0 0.00
Jun-13 20 0 0.00 - 0.00 - 0 0.0 0.00
Jul-13 23 0 0.00 - 0.00 - 0 0.0 0.00
Aug-13 20 0 0.00 - 0.00 - 0 0.0 0.00
Sep-13 20 0 0.00 - 0.00 - 0 0.0 0.00
Oct-13 21 0 0.00 - 0.00 - 0 0.0 0.00
Nov-13 20 0 0.00 - 0.00 - 0 0.0 0.00
Dec-13 21 0 0.00 - 0.00 - 0 0.0 0.00
Jan-14 22 436,836 8,832.48 1,478.04 401.48 67.18 24,662 493.6 82.61
Feb-14 18 456,591 9,146.47 1,530.58 508.14 85.03 33,138 661.1 110.63
Mar-14 19 608,721 12,193.94 2,040.55 641.79 107.40 55,710 1,113.2 186.28
2013-14 244 1,502,148 30,172.89 5,049.18 123.66 20.69 55,710 1,113.2 186.28
Note: Trading in Interest Rate Futures on Currency Derivatives Segment was introduced on August 31,2009
IRF includes both 10 Year GSecs and 91 DTB
Trading in Interest Rate Futures contracts in 91 Day GOI T-Bill on Currency Derivatives Segment were introduced on July 4, 2011

86
Table 7-6: Records Achieved in the Interest Rate Futures : Records (From the date of inception till 31 March 2014)
Particulars Date Number/Value
Record number of trades (date and number) 21-Jan-14 6289
Record number of contracts (date and number) 21-Jan-14 151,134
Record daily turnover ` in Crores (date and value) 21-Jan-14 3,081.49
Table 7-7: Top 5 IRD Contracts on the basis of Turnover for the FY 2013-2014
Rank Contract Name Total Traded Quantity
Total Traded Value (` In Crores)
Total Traded Value (%) to Interest rate
products Total Traded Value
Instrument Type
Contract Symbol
Expiry
1 FUTIRC 883GS2023 27-Mar-14 579,059 11,594.46 38.43
2 FUTIRC 883GS2023 26-Feb-14 432,437 8,668.28 28.73
3 FUTIRC 883GS2023 30-Jan-14 374,380 7,582.24 25.13
4 FUTIRC 883GS2023 24-Apr-14 115,530 2,314.59 7.67
5 FUTIRC 716GS2023 30-Jan-14 512 9.14 0.03
Note:- Total Traded Value of Interest Rates Futures for FY 2013-14 is ` 30,172.89 Crores
Table 7-8: Settlement Statistics in Interest Rate Futures# Segment at NSE
Month/Year MTM Settlement Physical Delivery Settlement
` Crores US $ mn ` Crores US $ mn
Apr-13 - - - -
May-13 - - - -
Jun-13 - - - -
Jul-13 - - - -
Aug-13 - - - -
Sep-13 - - - -
Oct-13 - - - -
Nov-13 - - - -
Dec-13 - - - -
Jan-14 11.50 1.92 1.48 0.25
Feb-14 23.67 3.96 0.71 0.12
Mar-14 31.18 5.22 0.84 0.14
2013-14 66.34 11.10 3.02 0.51 # Interest Rate Futures trading started on August 31, 2009.IRF includes both 10 Year GSecs and 91 DTBOpen interest is valued at daily settlement prices91 DTB was introduced on 04th of July 2011
Investor Services,Arbitration 8

88
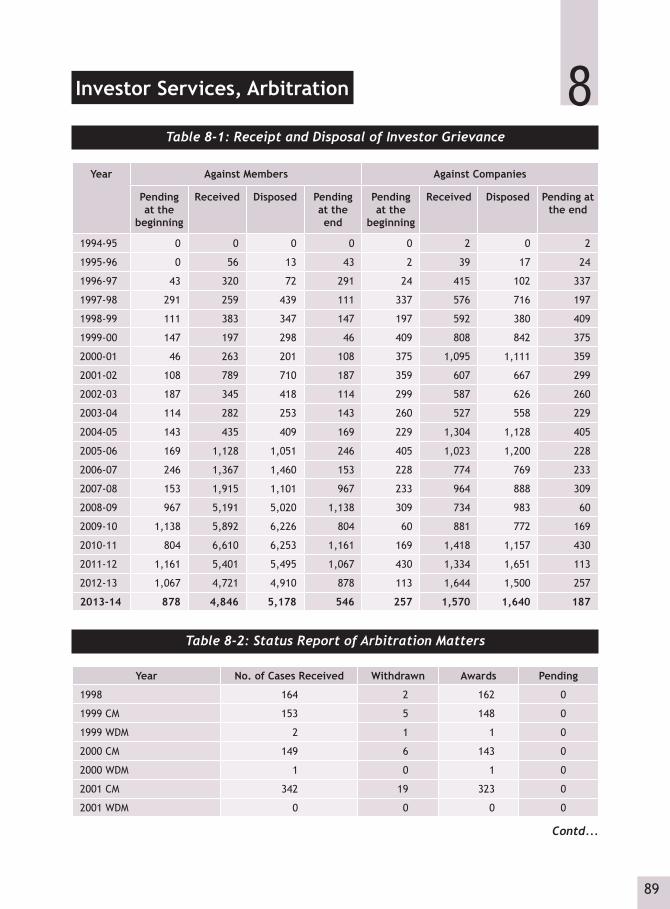
89
8Investor Services, Arbitration
Table 8-1: Receipt and Disposal of Investor Grievance
Year Against Members Against Companies
Pending at the
beginning
Received Disposed Pending at the end
Pending at the
beginning
Received Disposed Pending at the end
1994-95 0 0 0 0 0 2 0 2
1995-96 0 56 13 43 2 39 17 24
1996-97 43 320 72 291 24 415 102 337
1997-98 291 259 439 111 337 576 716 197
1998-99 111 383 347 147 197 592 380 409
1999-00 147 197 298 46 409 808 842 375
2000-01 46 263 201 108 375 1,095 1,111 359
2001-02 108 789 710 187 359 607 667 299
2002-03 187 345 418 114 299 587 626 260
2003-04 114 282 253 143 260 527 558 229
2004-05 143 435 409 169 229 1,304 1,128 405
2005-06 169 1,128 1,051 246 405 1,023 1,200 228
2006-07 246 1,367 1,460 153 228 774 769 233
2007-08 153 1,915 1,101 967 233 964 888 309
2008-09 967 5,191 5,020 1,138 309 734 983 60
2009-10 1,138 5,892 6,226 804 60 881 772 169
2010-11 804 6,610 6,253 1,161 169 1,418 1,157 430
2011-12 1,161 5,401 5,495 1,067 430 1,334 1,651 113
2012-13 1,067 4,721 4,910 878 113 1,644 1,500 257
2013-14 878 4,846 5,178 546 257 1,570 1,640 187
Table 8-2: Status Report of Arbitration Matters
Year No. of Cases Received Withdrawn Awards Pending
1998 164 2 162 0
1999 CM 153 5 148 0
1999 WDM 2 1 1 0
2000 CM 149 6 143 0
2000 WDM 1 0 1 0
2001 CM 342 19 323 0
2001 WDM 0 0 0 0
Contd...
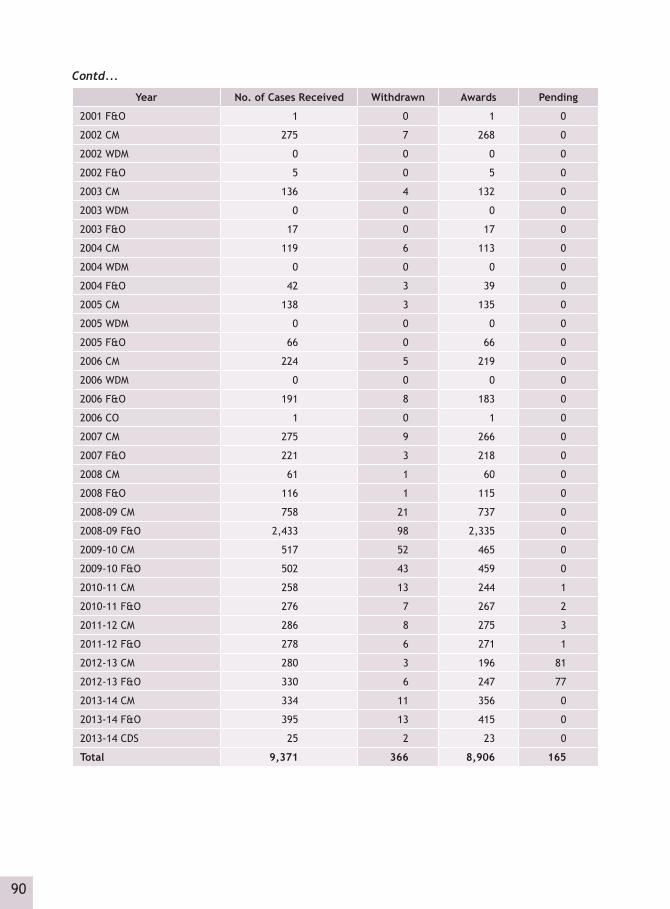
90
Contd...
Year No. of Cases Received Withdrawn Awards Pending
2001 F&O 1 0 1 0
2002 CM 275 7 268 0
2002 WDM 0 0 0 0
2002 F&O 5 0 5 0
2003 CM 136 4 132 0
2003 WDM 0 0 0 0
2003 F&O 17 0 17 0
2004 CM 119 6 113 0
2004 WDM 0 0 0 0
2004 F&O 42 3 39 0
2005 CM 138 3 135 0
2005 WDM 0 0 0 0
2005 F&O 66 0 66 0
2006 CM 224 5 219 0
2006 WDM 0 0 0 0
2006 F&O 191 8 183 0
2006 CO 1 0 1 0
2007 CM 275 9 266 0
2007 F&O 221 3 218 0
2008 CM 61 1 60 0
2008 F&O 116 1 115 0
2008-09 CM 758 21 737 0
2008-09 F&O 2,433 98 2,335 0
2009-10 CM 517 52 465 0
2009-10 F&O 502 43 459 0
2010-11 CM 258 13 244 1
2010-11 F&O 276 7 267 2
2011-12 CM 286 8 275 3
2011-12 F&O 278 6 271 1
2012-13 CM 280 3 196 81
2012-13 F&O 330 6 247 77
2013-14 CM 334 11 356 0
2013-14 F&O 395 13 415 0
2013-14 CDS 25 2 23 0
Total 9,371 366 8,906 165

![A MODIFIED LEARN++.NSE ALGORITHM FOR DEALING WITH … · 2.3. Learn++.NSE Algorithm Learn++.NSE [10] is an incremental learning algorithm for non-stationary environments. Learn++.NSE](https://img.pdfslide.us/doc/110x75/6007f3d5164dfd561d4092b2/a-modified-learnnse-algorithm-for-dealing-with-23-learnnse-algorithm-learnnse.jpg)