Embed Size (px)
Citation preview

Compiled by Finance Office
Cover Design and Printed by Educational Technology Center
November 1998
?3 23 $4 # A 3 THE HONG KONG UNIVERSITY OF SCIENCE AND TECHNOLOGY
t235hfsll~sf7k?d! Clear Water Bay, Kowloon, Hong Kong
Fact Book 1997198
72 23 $4 %2 3i 3 THE HONG KONG UNIVERSITY OF SCIENCE AND TECHNOLOGY
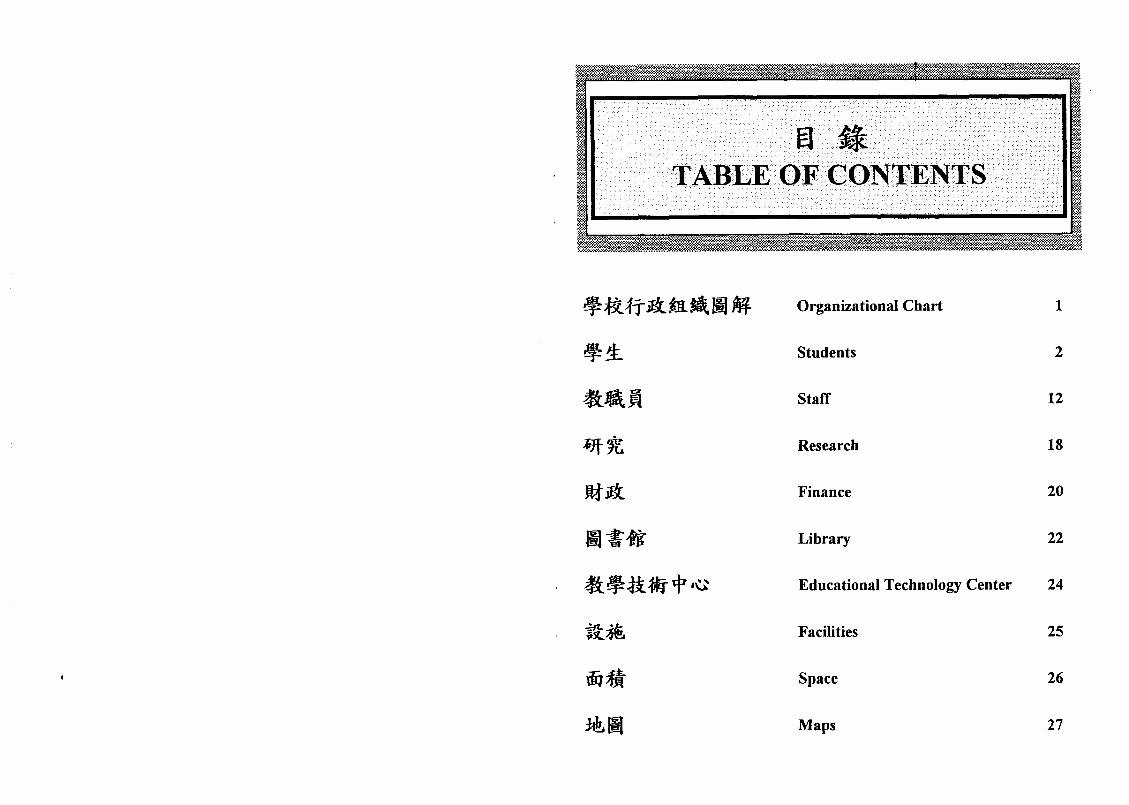
TABLE- OF CONTENTS
Organizational Chart
Students
Staff
Research
Finance
Library
Educational Technology Center
Facilities
Space
Maps
1
2
12
18
20
22
24
25
26
27

THE HONG KONG UNIVERSITY OF SCIENCE AND TECHNOLOGY MANAGEMENT AND ORGANIZATION
School of S&me
School of Business and Managmmt
I-
%k&?iT Fact Book I99?/98 1

1997/985 FIRST-YEAR INTAKE, 1997/98
SCHOOL OF HUMANITIES & SOCIAL SCIENCE ht!$%% Hummitics
69 82 84 107 89
1.0
431
7.0 10.0 16.0 22.0 19.0
74.0. :. -
.’ l&
76.0 92.0
100.0 130.0 108.0
- ‘. 506.0
-
54 6.0 2.5 62.5 117 15.0 16.5 148.5 139 38.0 4.0 181.0 154 60.0 3.0 217.0 73 8.5 7.5 89.0
91 116
144'
11.5 7.0
- :. 40,5,
P
109.5 116.0
.. 92$.5
130 3 6 6 4 3
570
2.0
2.0 4.5
15.0 9.0 7.5
3.0
132.0 18.0 17.0 18.0 4.0 6.0
570.0
10.0 9.0
19.0
243.5
80.0
3J1.5':. -
80.0
845:o -
8.0 18.0
4.0 13.0 7.0 7.0
19.0 38.0 - -
6.5 6.5 8.5 8.5 10.5 10.5 3.0 3.0
yJ.5 "
200.5
28.5 - 2,341.0
1997/98%3@Be%AB FIRST-YEAR INTAKE, 1997/98
SE BY SCHOOL
l!f&z!m Joint Degree
PrOglWIl
1%
Business &
Management
36%
m!Ik Undergraduates
81%
Science 2%
BY LEVEL
iifl3?k (MIS) Postgraduates
(Research)
10%
li+Fz!k (iziw%%@) Postgraduates
CTaught) 9%
&k&l Fact Book 1997/9X
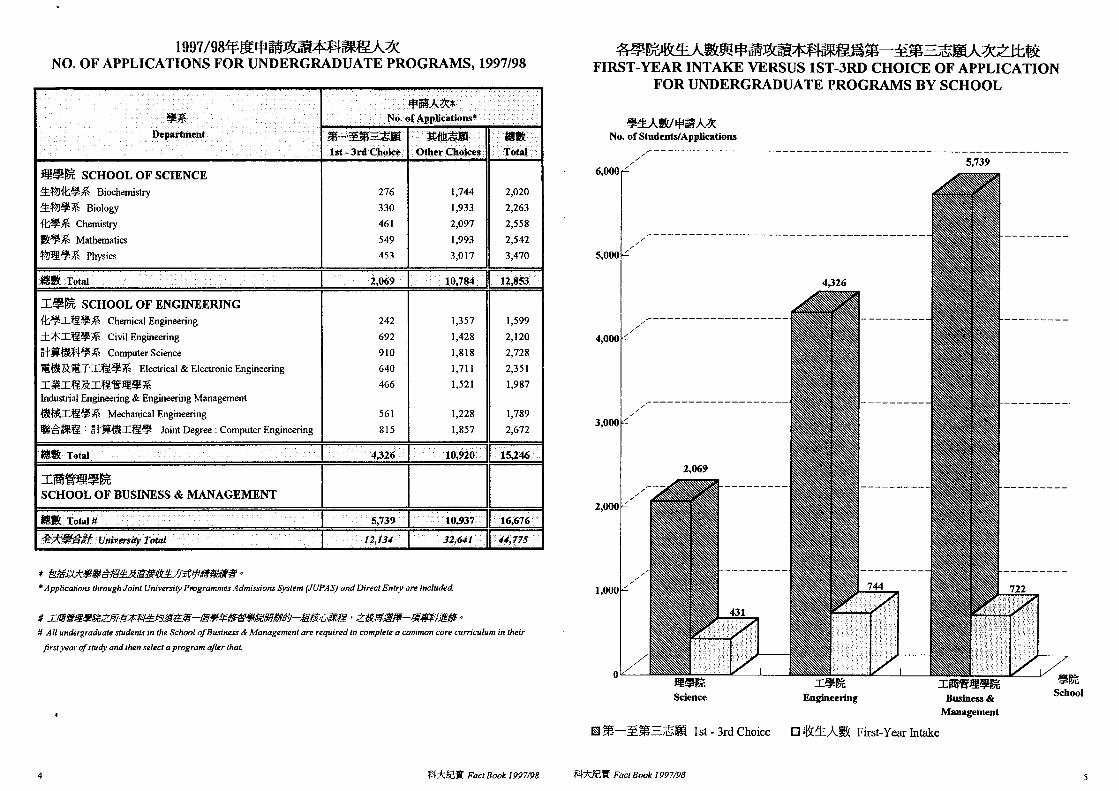
NO. OF APPLICATIONS FOR UNDERGRADUATE PROGRAMS, 1997/98
a%iibm* 3% No. ofApplications*
Department %-s%Eiwi YbZM ia!!l
1st - 3rd Choke Other Chokes Total
@!bf% SCHOOL OF SCIENCE
!k%Jk;$% Biochemistry 276 1,744 2,020
$%!l/lf% Biology 330 1,933 2,263
kg% Chemistry 461 2,097 2,558
At% Mathematics 549 1.993 2,542
%I@?.%% Physics 453 3,017 3,470
h%Jgt Total 2,069
3?!% SCHOOL OF ENGINEERING
k%X@%% Chemical Engineering 242
k$X~~% Civil Engineering 692
Zt?%$E+S% Computer Science 910
%&7jt%~IJ%!%% Electrical & Electronic Engineering 640
X%X@WX@B~~~ 466
Industrial Engineering & Engineering Management
&#I$%$!% Mechanical Engineering 561
@$a$%@ : ,%?$&I@% Joint Degree : Computer Engineering 815
&& Total 4,326
IBmsR
SCHOOL OF BUSINESS & MANAGEMENT
,
4
~i~~m~~%-~~~~x2~~ FIRST-YEAR INTAKE VERSUS lST3RD CHOICE OF APPLICATION
FOR UNDERGRADUATE PROGRAMS BY SCHOOL
f~~lrl~lA~ No. of Students/Applications
t
_---------------- ,
3,000 //’
2,069
---
4,326
--
- 7
- XSR fR
Science Engineering Bwdness & School
Management
El %-?i?i%~b@ 1 st - 3rd Choice 0 &*A%! First-Year Intake
@+Yk-RR Fact Book 1997/W %t?iii% Fact Book 1997/98 5

1997/985 STUDENT ENROLMENT, 1997198
:ZBpIRI. Depdnlent
@f%% SCHOOL OF SCIENCE $%?Ik$% Biochemisby #kJ%% Biology dS% chemisby s!!tSd Msthemstics i!zmm FJhysics %#&k Total
15% SCHOOL OF ENGINEERING
_ - - #!Bh@ Total
220 31.5 269 50.5 241 53.5 320 46.0 244 57.0
1,294 238~5
3.0 1.5
- 4.5
-
251.5 319.5 294.5 369.0 302.5
- ‘1,537.tr
172 24.5 4.0 200.5 362 43s 34.5 440.0 422 98.5 13.0 533.5 469 139.0 11.0 619.0 209 40.5 29.0 278.5
275 323
47.5 14.5
2.232~ 393.5 -
1060 -
337.0 323.0
- 2,731.S’
655 15
343 195 50
232 573
4.5 10.5 9.5
10.0 2.0 4.0
28.5 19.5 11.0
659.5
114.0 372.0 216.0
52.0 236.0 573.0
‘lo.5
27.5 14.5
42.0
714.5
205.0 -
264.0 -
205.0
2,427.5
20.5 48.0 10.0 24.5
10.0 10.0
40.5 82.5 - -
13.0 13.0 25.0 25.0 26.5 26.5 12.0 12.0
76.5 76.5 - -
49t.s 6$7SSsO
Program -
1%
ZamQE Business &
Management
36%
1997/984%ES%U% STUDENT ENROLMENT, 1997/98
545z BY SCHOOL
tJkeA@ Joint Degree
BY LEVEL
m!k Undergraduates -
82%
J2aE Engineering
40%
Ame Pf!sw%
Humanities & Social
Science 1%
%t?JEk(~S~) Postgraduates
(Research)
11%
li%R&~~~~s, Postgraduates
Vaught) 7%
6

* 7!E@l1998/99~B~~~
STUDENT ENROLMENT PROJECTION, 1998/99
SCH&L OF HUMANITIES & SOCIAL SCIENCE hzZB'i3 Hutunities iitWiS% Social Science $f-@%@ : q$@f% Joint Degree : Chinese Studies
%..h#i? Total
$-@ii%~ JOINT DEGREE PROGRAM
r Ilate.3 )“.
Tf$F
209 36.0 266 56.0 241 51.0 321 53.0 245 57.0
1,288 253.0
3.5 2.0
5.5
245.0 322.0 292.0 383.5 304.0
- 1,546.5
-
166 32.0 3.5 201.5 364 75.5 29.0 468.5 421 117.5 11.0 549.5 461 168.0 8.5 637.5 192 42.5 12.0 246.5
291 340
2.235
64.0 22.0
499.5 860
377.0 340.0
- 2,820.5
553 90
314 33
242 84
241 578
9.5 10.5 17.0
21.0 22.5
10.0 4.0 6.0
24.5
562.5 121.5 353.5
33.0 276.5
88.0 247.0 578.0
2,135 57.0
221.0
289.0
221.0 -
2.481.0
39.5 25.5
65.0
il.0 12.5
16.5
50.0
60.5 38.0 16.5
- 115.0
-
11.0 29.0 32.5 10.0
s, 658 8745
82.5
513.6
11.0 29.0 32.5 10.0
- 82.5
7,au.s
%Tk#?& Fact Beak 199?/98 @kk&% Fact Book 1997/98
1992/93-1998/99@!$E$i%kA$4!k STUDENT ENROLMENT, 1992/93-1998/99
6&h@ e?ElM%B)* No. of Students (FTE)*
6,000
I
5,ooo ’
4,ooa L
3,ooo-’
2,000 L
l,OOO-/
OL
4,367
_--------
1992l93 1993194 1994/95 199W6 1996i97 1997l98 mm/99 $ppjg
fSi $f%k Undergraduates Cl i&%% Postgraduates
* ~‘81#!%%? Full-time Equivalent
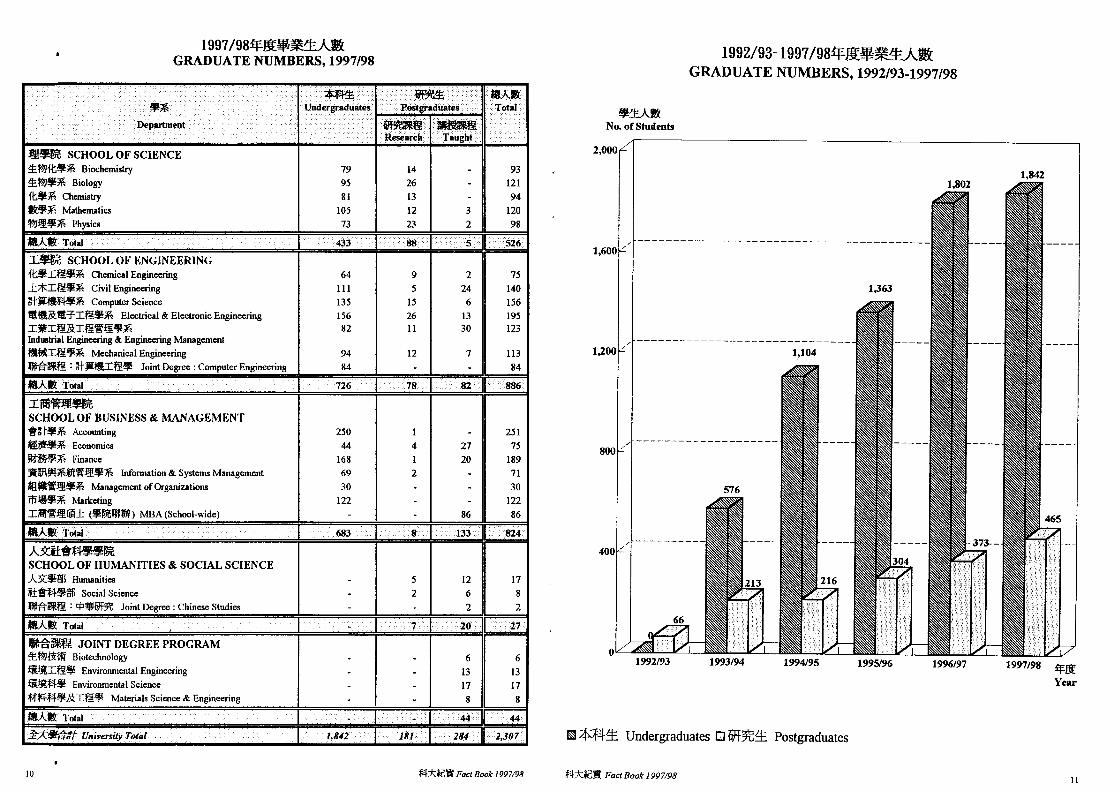
1 1997/984%@I%EA% GRADUATE NUMBERS, 1997/98
zis% Department
@%i% SCHOOL OF SCIENCE
-%%ti-% SCHOOL OF ENGINEERING k%I@8% Chemical Engineering
f%I@i48% Civil Engineering
ZWBWW+ Computer Science
~&~%?I@%% Electrical & Electronic Engineering
1%1@7jtI@E@8% Industrial Engineering & Engineering Management
#@.I@%% Mechanical Enaineerine. I -
%i%?@ : .%@#r@fsa Joint Degree : Computer Engineering
&A#k Total
J3@is@%E SCHOOL OF BUSINESS & MANAGEMENT @?it%% Accounting
LB$t% Economics
%f%%% Finance
~a(&%%?%%!%$ Information C Systems Management
I&@@%% Management of Organizations
ii7#3% Marketing
IBg@!@-f- (%!!%b#) MBA (School-wide)
#!&h%t Total >
AzZStMSR SCHOOL OF HUMANITIES & SOCIAL SCIENCE Aft%% Humanities
tiM Social Science
!&%!%g : q$s@k% Joint Degree : Chinese Studies
#$A#! Total
#&%%!@ JOINT DEGREE PROGRAM &%@!ffi Biotechnology
~&I%.$ Environmental Engineering
B&w Environmental Science
ti#$@%xI@g Materials Science & Eneineerinr!
Undergraduates
r luates
EC Total
Taugbt
79
95
81
105
13
433
14
26
13
12
23 -
‘88 -
3
2 -
5 -
93
121
94
120
98 -
526
64 9 2 75
111 5 24 140
135 15 6 156
156 26 13 195 82 11 30 123
94
84
726
12 I
78 -
82
113
84 -
,886 -
250
44
168
69
30
122
27
20
683 -
8 -
86 -
133
251
75
189
71
30
122
86 -
824
5
2
I2
6
2
7 -
20 -
6
13
17
8 -
44
6
13
17
8
1,842 c
181 284 I ”
1992/93-1997/98~~~%AkA$& GRADUATE NUMBERS, 1992/93-1997/98
ts% No. of Students
199996 1996f97 1997/98 qq~
Year
Ei $f@k Undergraduates 0 @%!k Postgraduates
&%#a?~ Fact Book 1997/98
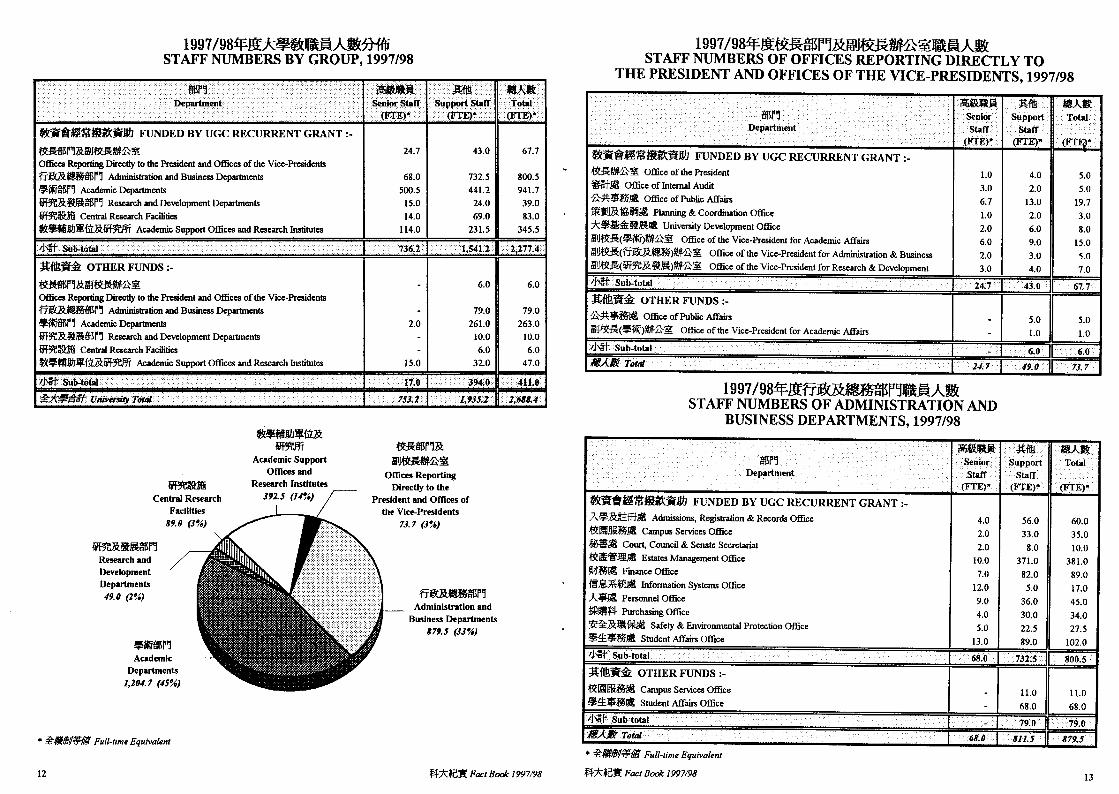
1997/98W!iEAS&RBAB~ STAFF NUMBERS BY GROUP, 1997198
gk%f%!!?%!%?#l~ti FUNDED BY UGC RECURRENT GRANT :-
Oftices Rqtting Directly to the President and O&es of the Vice-lksidenh
t%@d%+%P7 Administration and Business Dcpartmcnts
~ t%it%P? Academic Dqwtmcnts
W%W?MP'T Research and Development Departments
@$%k& Central Rcaeatch FaciM.i~
1 Academic Surmort OEices and Research Institutes
68.0 132.5
500.5 441.2
15.0 24.0
14.0 69.0
114.0 231.5
136.2 ‘.1,54i.2
800.5
941.7
39.0
83.0
345.5
ii%!@& OTHER FUNDS :-
Ofliccs Rcprhg htiy to the President and Oftices of the Vice-Presidents
fii&%%%%? Administration and BuGness Departments
~~~~ Academic Departments
i$fRZM?E%P7 Research and Development Departments
#%%&% Central Research Facilities
$,@%ritl&$f~!$%%i Academic Support Oftices and Research Institutes
79.0
261.0
10.0
6.0
32.0
79.0
263.0
10.0
6.0
47.0 - 411,8
2,6iw.r
Central Research
Academic Support
OtTices and
Research Institutes
392s (14%) f-
#+!I .: suppott StaN
<FTEj’, 1.
394.0 >
11,935.z
t.H%WYW t-iM%wms
Ofllces Reporting
Directly to the President and Ofllces of
the Vice-Presidents 73.7 (3%)
i?cesamPY Administration and
Business Departments 879.5 (33%)
isir Total
mm-
2,271.4
1997/98~~~~~P~~~~~~~~~A~ STAFF NUMBERS OF OFFICES REPORTING DIRECTLY TO
THE PRESIDENT AND OFFICES OF THE VICE-PRESIDENTS, 1997/98
%aP? Department
8%i&%i!%g%gm FUNDED BY UGC RECURRENT GRANT :-
REM% Office of the President
%%+. O&e of Internal Audit
&&?@%a O&c of Public Affak
Rflx-%@l~ Planning & coordination office
kse@M Unkxsity Development Of&x
~ti@&%%%?)%!f?fi~ Office of the Vice-President for Academic AfTairs
~@&%(?%!@_@%%)#fi~ O&e of the Vice-President for Administration & Business
%%&%%!B@@!#~~ Office of the Vice-President for Research & Development
/I’%. Sub-total
1.0
3.0
6.7
1.0
2.0
6.0
2.0
3.0
24.7
~#!I$%& OTHER FUNDS :-
fi;#$%%% Office of Public Affairs
k#%%(%%@%?fi~ O&e of the Vice-President for Academic Affairs
&% Sub-total
#@I&!# Toiid 1 24.7
1997/98~~fi~~~HA% STAFF NUMBERS OF ADMINISTRATION AND
BUSINESS DEPARTMENTS, 1997/98
/
&~l%%%%?kf%!iJ FUNDED BY UGC RECURRENT GRANT :-
hgE?%ff%% Admissions, Registration 8r Records Office
@!&IL%%% Campus Services Office
&G&B Cow Council & Senate Secretariat
@&%%%% Estates Management Office
W%& Fiance O&e
#tL%kX@ Ioformation Systems OfEce
AG% P monnel Office
Rm@t Purchasing Office
??WZM%% Safety & Environmental Protection Ofice
%&s%!% Student Affairs Office
de Sub-total
fffi!@& OTHER FUNDS :-
t2HHE%B Campus Services Office
4.0 5.0
2.0 5.0
13.0 19.7
2.0 3.0
6.0 8.0
9.0 15.0
3.0 5.0
4.0 56.0
2.0 33.0
2.0 8.0
10.0 371.0
7.0 82.0
12.0 5.0
9.0 36.0
4.0 30.0
5.0 22.5
13.0 89.0
68.0 732.5
- I 11.0
1 68.0
Y&j-+
7iKE Total
60.0
35.0
10.0
381.0
89.0
17.0
45.0
34.0
27.5
102.0 -
800.5 -
11.0
68.0 -
79.0 -
879.5
13

1997/98~~~~~~Y~~.A~ STAFF NUMBERS OF ACADEMIC DEPARTMENTS, 1997198
9% Department
1
&m&##maa :- FUNDED BY UGC RECURRENT GRANT :-
!@t%% SCHOOL OF SCIENCE
k??!Jk%% Biochemistry
!???8%% Biology
#% Chemistry
LBM Mathematics
?@!8% Physics
1%’ Sub-total
l?!%% SCHOOL OF ENGINEERING
@Ii%%% Chemical Engineering
fci$I@8% Civil Engineering
t$WW% Computer Science
~&&kr&~Il%!%% Elecbical C Electronic Engineering
c%I@Br@@B9% ldustrial Engineering & Engineering Management
#&%!%% Mechanical Engineering
I’# Sub-total
KHOOL OF BUSINESS & MANAGEMENT
b#%% Accounting
!%?$%h Economics
wm Fiinee
%%@%#WWF% Information & Systems Management
Wk@@%% Management of Organizations
SUS% Marketing
1% Sub-total
4mmm ;CHOOL OF HUMANITIES & SOCIAL SCIENCE
ix= Humanities
ftFWi$ Social Science
1% Sob-total
Total (VGC Recurrent GrarqI
* ~&%@@’ Full-time Equtvalent
6.5
1.0
3.0
9.0
4.0
4.0 -
37.8 -
1.0
38.5
33.1
31.5
45.2
31.4
28.0 - 218.0 -
1.0
27.1
26.0 -
53.1 -
493.5
2.3
8.3 -
11.6
Tz-
2.0
1.0
3.0 -
1.0
2.0
1.0
- 4.0
-
-
-
-
- 1.0
6.0
6.0
35.4
40.3 -
76.7
27
d* Sub-total I I
A2&&W%E SCHOOL OF HUMANITIES & SOCIAL SCIENCE
Aft%%% Humanities
fcbiStQ% Social Science
2.0
12.0 -
276.0
6.0 -
8.0 - 24x0 - 328.0
2.0
6.0
14 %k~~ Fact Book 1997198 #7k#i% Fact Book 1997198 15
1
iiiiiii Senior
stafr
15.0
25.0
19.0
40.0
33.0
1320 - 8.8
12.6
9.7
7.7
1.7
11.0 -
42.7 -
14.0 3.0 6.2
25.5 2.0 2.8
43.0 6.0 4.2
37.3 11.0 6.7
19.3 3.0 3.4
23.0 1.0 -
26.0 -
10.3
10.1 -
33.4 -
162.1 -
27.0
26.3
24.0
27.0
22.0
20.0 -
146.3 -
Qemic
FE)’
?z Demor
SMtOl
1.3
4.0
1.0
2.5
K
xi
8uPpol StaR
0.8
0.5
2.2
1.4
?8@Ts!TAB Non-Academic Sta
(FTEI’
iai!ew m!a Senior Supper
staff staff
r
24.0
35.0
26.0
11.0
21.0
117.0 -
17.0 40.2
20.0 51.3
17.0 72.2
32.0 88.0
12.0 37.7
20.0 -
118.0 -
29.0 -
Total
CFTEI’
52.9
73.7
55.7
55.2
66.0 - 31)3,5 D
54.1 - 343.5 -
10.3
1997/98WP2BlEVY&~~A% STAFF NUMBERS OF ACADEMIC DEPARTMENTS, 1997/98
Em Em Department Department
XtiS& :- OTHER FUNDS :-
%!%%% SCHOOL OF SCIENCE
&%k6% Biochemistry
ik??J%% Biology
k8% Chemistry
@&%i Mathematics
zffs!im3E SCHOOL OF BUSINESS &‘t MANAGEMENT
!%-t%% Accounting
@!$f$% Economics
BG%%% Finance
WW%%;kk;@@s% Information & Systems Management
If%@%%% Management of Organizations
-
- 2.0
- 2
24.0
45.0
18.0
6.0
19.0
$&I
19.0
22.0
13.0
13.0
9.0
17.0 -
93.0 -
3.0
3.0
2.0
17.0
6.0
3.0
- -
-
-
1.0
zy
mic Staf
3”
xftti
SuPporf staff
2.0
1.0
3.0 1
1.0
5.0
2.0
1.0
- 9.0
-
Total
FTW
26.0
47.0
18.0
6.0
19.0 -
116.0 -
2.0
19.0
23.0
18.0
15.0
10.0
17.0 -
104.0 -
3.0
3.0
2.0
17.0
7.0
3.0
35.0 -

1997/98~~~~~~~~~Y~~A~ 1997/98%4%SESBBfr@~~M~HA~ STAFF NUMBERS OF RESEARCH AND STAFF NUMBERS OF ACADEMIC SUPPORT OFFICES AND
DEVELOPMENT DEPARTMENTS, 1997/98 RESEARCH INSTITUTES, 1997/98
1 i!33@?& #fib 4!aAB
RrJ Senior Support Total
Department Stdi Sbff
FE)* FE)’ (FTW
~~&!%~~~ FUNDED BY TJGC RECURRENT GRANT :-
!&i%%%@~~~ Applied Technology Center 10.0 12.0 22.0
wa%h.%%B O&x of Contract & Grant Administration 2.0 8.0 10.0
#?$#8~~&~ Technology Transfer Center 3.0 4.0 1 7.0
4% sub-totai 15.0 24.0 39.0
%i%f& OTHER FUNDS :-
@%%%d~$o Applied Technology Center 10.0 10.0
~J$%suetota~ 10.0 10.0
if&@+ Total 15.0 [ 34.0 49.0
1997/98J+2miR%=BRAB STAFF NUMBERS OF CENTRAL RESEARCH FACILITIES, 1997/98
elm Department
~~‘&t?!%~~@J FUNDED BY UGC RECURRENT GRANT :-
?i%!%L~~~~~& Advanced Engineering Materials Facility
@J%Bn%?%ff&% Animal Care Facility
qm%rf% China Light & Power Wind/Wave Tunnel Facility
metiriWl&R c omputer Aided Design & Manufacturing Facility
k8.?@%.%& Electrical & Mechanical Services Facility
%kI%%bi%~&pfi Geotechnical Centrifuge Facility
@.#8%!&&!% Materials Characterization & Preparation Facility
&;;&%$%%s%?% Microelectronics Fabrication Facility
f!#?!ff&%@&% Plant Growth Facilitv
d’i% Sub-total
%.!!%k OTHER FUNDS :-
%&I@fi~%&$!pfi Advanced Engineering Materials Facility
pb%?I~flfl&% Animal Care Facility
EEy1(61%!%8~~4’1’~& Cornouter Aided Desien & Manufacturine Facilitv
iiiEiGi Tir senior SUPpod Stan- Stiff
WEI VW*
1.0
1.0
1.0
1.0
1.0
7.0
1.0
1.0 -
14.0
- 14.0
3.0
7.0
1.5
5.0
29.0
1.5
10.0
12.0
69+iI
2.0
1.0
3.0
6.0
75.0 -
[email protected] Tdal
4.0
7.0
2.5
6.0
30.0
2.5
17.0
13.0
1.0
83.0
2.0
1.0
3.0 -
6.0 - 89.0
%k#W Fact Book 1997/98 i%+i&~ Fact Book 1997#8 17
%?@?-$%~~~~~ FUNDED BY UGC RECURRENT GRANT :-
F!?SERRMGS O&e of the Dean of Science
IfR%R##b9a% Office of the Dean of Engineering
Ii8~~~~~#&&% Offke of the Dean of Business & Management
h~i?~~%%%$%%~~~ Office of the Dean of Humanities & Social Science
?&%$k!~%@f~~&~ Center for Coastal & Atmospheric Research
~#$~~?&$&~ Center of Computing Services & Telecommunications
RUHo*o#%b Center of Laboratory Supplies
@k%~#?$% Educational Technology Center
I%~~~$$,~ industrial Training Center
%iB+i~ Language Center
~?&!!@I Library
>JGf Sub-total
#$!a&% OTHER F’UNDS :-
I@!&%k!?k%#fi~ Offke of the Dean of Engineering
I%@f@$%%8%#~~ Oftice ofthe Dean of Business & Management
il%%kk%~~~~i~ Center for Coastal & Atmospheric Research
$!Z~~~~& Educational Technology Center
%%%!8%R~,!!!$%$j@%pfi Hongkong Telecom institute of Information Technology
ZESWi~ Language Center
@$I#%$f~% Sino Solhvare Research Institute
!i%i- Sub-total
a%%$? Total
2.0
5.0
9.0
2.0
7.0
22.0
4.0
1.0
36.0
26.0
114.(3:
1.0
14.0
: 15.0
129.0
7
@Jo-.:-
SiipflI?
stpn:
iWE)*
7.0
15.0
26.0
4.0
5.0
36.0
12.0
32.0
2.5
9.0
83.0
23i.j
3.0
2.0
5.0
3.0
4.0
11.0
4.0
9.0
20.0
35.0
6.0
12.0
58.0
12.0
36.0
3.5
45.0
109.0
3.0
2.0
5.0
4.0
4.0
25.0
4.0 - .-4i.o
- 392s -

1992/93-1997/98wt!m%%H AWARDS FOR RESEARCH PROJECTS, 1992/93-1997/98
A 19’
ZG N9.d.
‘roJ&
Is’ NO:
91
30
-
f2l
52
-
269.
HKSM
79.6
59.8
-
139.4
No.’
336
62
-
398 143.7
No.’
337
56
E
393
HKSM
86.0
40.0
-
126.0
li-ff%sBm RESEARCH PROJECTS STATUS
NO.*
311
ii&ii HKSM
111.3
19
GiGG NR’.f
PVOJCtt!
JzI* NO.*
314
iEzi HKSM
139.5
76 46.0 69 68.5
- - - -
653.. 1J;t.l. R43 ttkT.O
98
iGiG3
Fmnlb
NO. NO. No. 1 No. 1 No. 1 No. 1 No. 1 No. 1 No. 1 No. 1 No. 1
2 28 11 40 13 48 18 37 45 30 67 2
5 II5 21 211 so 330 139 240 2% I49 ‘, 427 I2
1992/93-1997/98%lt#?iR%BB NUMBERS OF RESEARCH PROJECTS, 1992/93-1997/98
%f!Tl%lH No. of Projects
1992193 1993l94 199495 199Sl96 1996f97 w!iz
1997EJ8 Yenr
1992/93-1997/98#@$@%%~ FUNDING AWARDS FOR RESEARCH PROJECTS, 1992/93-1997/98
itH?wB HKSM
0 1 I
1992i93 1993194 1994195 1995l96 1996l97 e-!z 1997198 Yenr
18 &Ckh% Fact Beak 1997/98 ?%kk?ef Fact Book 1997/98 19

1995/96-1998/99+f%%~&~~~~~ 3a%!lsBma&E(@%R)m
RECURRENT INCOME AND EXPENDITURE FOR
UGC FUNDED ACTIVITIES, 1995196-1998199
1,370 1,435 1,529 1,587
$@!&A Miscellaneous home
-@6%#&? Total General Income
-@i%? GENERAL EXPENDITURE
189 252 289
86 109 124
1,645 I, 796 1,942
4i@ Adminhation
&% Academic
-&%!ftW General Education
@?#$% Maintenance of Premises
b4rirBrniW Student Facilities and Amenities
124 137 142
885 1,007 1,124
20 21 19
236 278 298
33 38 38
!$fl!! Miscellaneous 209 244 271
BA(Fd1B/@l3& Allocation to ReservesProvisions
40 57 138
#IfMa HKSM’
l!W&99
f&3 Projection
293
105
1,Pd
150
1,171
17
294
41
194
44
1,911
fh&%$f Fad Book 1997/98
1997/98~~~~~~~~~~~~~~~~(~~~>~~ RECURRENT INCOME AND EXPENDITURE FOR
UGC FUNDED ACTIVITIES, 1997/98
-#imcA GENERAL INCOME
At&mm ?&BeLXfm UGC Recurrent
cl-ant 79%
---EHX GENERAL, EXPENDITURE
- Fee Income
BifQ - Miscellaneous
6%
&f Academic
55%
li?bmlbiiilE~& Allocation to
Reserves/Provisions
7%
?d m& - Admiaistration
I 7%
am Miscellaneous
Maintenance of
13% PEWlli.5~
General Education 15% 1%
21
Student Facilities &
Amenities 2%
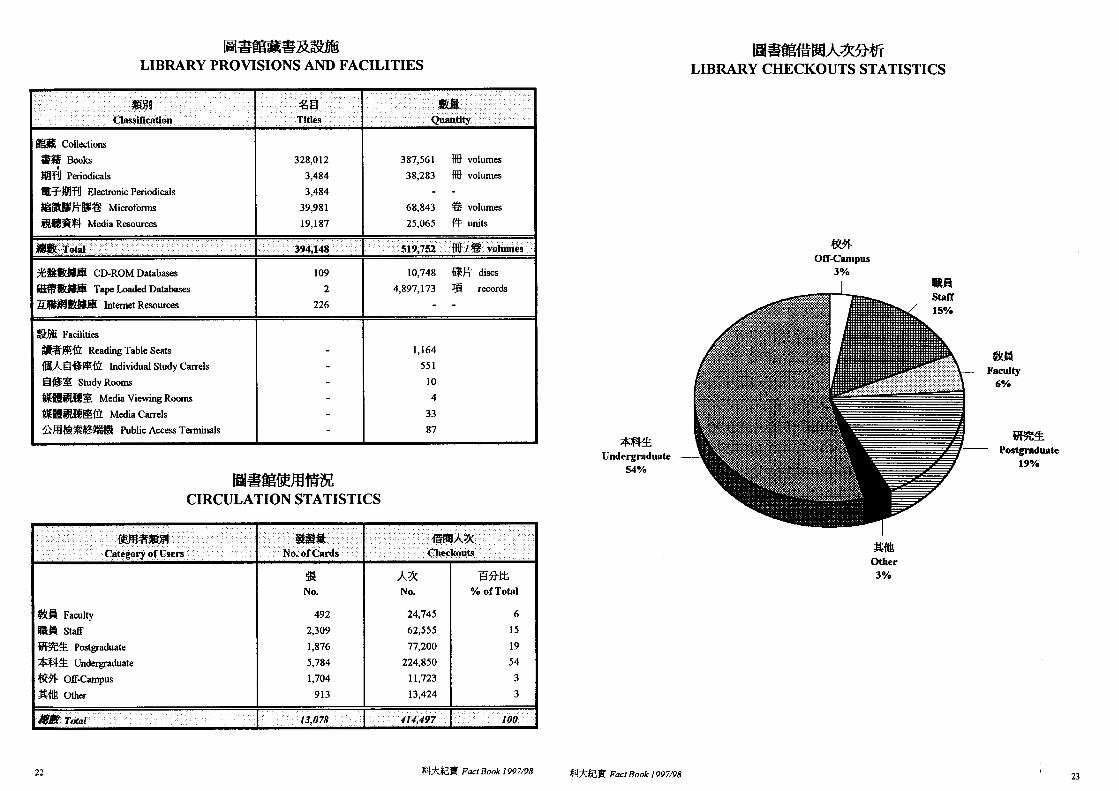
Ei!3lsas1 LIBRARY PROVISIONS AND FACILITIES
%wJ Chssitication
If!!% Collections
“#f Books
RFJ Periodicals
S533833J Electronic Periodicals
,$?,@a8 Media Resources
?k&@!&#@ CD-ROM Databases 109
if8f1%!#.@ Tape Loaded Databases 2
~~#@‘&#&~ Internet Resources 226
m Facilities
~f&$fi Reading Table Seats
f@%Jhi?iQ%k@ Individual Study Carrels
e f&+i Study Rooms
!&f&$&&g Media Viewing Rooms
f@f@!@&@ Media Carrels
ti~&~@@## Public Access Terminals
ai Titles
328,012
3,484
3,484
39,981
19,187
394,148
387,561 ff volumes
38,283 # volumes
- -
68,843 8 volumes
25,065 # units
$19,752 fw 1% iohunes
10,748 6% discs
4,897,173 %. records
- -
lf4EsE~rnE CIRCULATION STATISTICS
@!A Faculty 492 24,745 6
Em StatT 2,309 62,555 15
@@k Postgraduate 1,876 77,200 19
w?k Undergraduate 5,784 224,850 54
w+ off-Campus 1,704 11,723 3
#ft!# other 913 13,424 3
t No. of Cards
*
3s No.
1,164
551
10
4
33
87
No. % of Total
Undergraduate
54%
333%EWA~%ti LIBRARY CHECKOUTS STATISTICS
t?w off-campus
3%
I
w-3 Fatuity
6%
a@& Total I 13,078 t 414,497 100
22 @tFk#~ Fact Book 1997/98 @tTk-&%t Fact Book I997/98
- Postgraduate
19%
XflB Other
3%
i 23

&se&+Jbmi AUDIO-VISUAL EQUIPMENT IN
EDUCATIONAL TECHNOLOGY CENTER
8
$#+f Audio
#& Video
m3t visual
3ffiil Accessories
1 % ofTotal
1,032 36 3.04
496 17 8.39
390 13 2.04
998 34 2.22
I I II
ABy Tarot 1 2,916 1 100 15.69
1997/984f3a!z~~~EHE~ AV EQUIPMENT LOAN STATISTICS, 1997198
f%H&i LmnPcnlod ”
@%-@H Short Term
(-4mh ) (within one weak)
R%d#H Long Term
(-@@dk& ) (one week or over)
QrnAti’ f%rn#tiSB x’lm Na of Transadions No. pf Items x Days
2,776 41,384
732 141,476
182,860
brnB%%tfi8i
Indoor Sports Facilities
I?izW~~3~ Outdoor Sports Facilities
Sk+& Student Center
%%?%s? Halls of Residence
kswi~ University Center
t?Fzxlatft Services in Campus
24 %k%!f$ Fact Book 1997198
i!zB!IBs%%m=m SPORTS AND STUDENT FACILITIES
ti%&eil?%% S. H. Ho Sports Hall
/#W%% ’ Efz * 6% * rzswsze - 334csmJ
for badminton, basketball, volleyball, indoor soccer, handball, etc.
%#&$$.tJ%? Multi-purpose Room
#Me * #I?# - &%%%I% for table tennis, fencing, martial arts, etc.
t%P (4 8) squash courts (4 colnts)
!&%X Fitness Room
6%@5 Table Tennis Room
E&@~tl$$!% Weight Training Room
#%$a (8 fk@ Tennis Courts (8 courts)
z@J% Athletic Field
EfJztff: Basketball Court
~JB!!arjt@ Mini-Soccer Pitch
if&k@ swimming Pool
PPCisfi@% Lam Area
t%3@~H~w~~-~&E~~~~rn for softball, archery and athletic throwing events, such as discus, javelin, short-put, etc.
~~~~.~L~.~Q~.~~~.f~.~~~~~~~~~~~~~~ includii conference rooms, quiet room, common room, music rooms, workshop,
store rooms, photographic dark room & work area for student societies
*f%%& (1,722 @ilG) Undergraduate Hall (1,722 places)
68?i%&!? (578 %M) Postgraduate Hall (578 places)
w!s ’ iwfa ’ R%*;t;$ ’ i?m!fz * WMS - $e;MABiiWRI(lOOEE.> including activities room, exercise room foyer, fbnction room, gallery, health lounge,
multi-purpose hall, music lounge, music room, quiet lounge, quiet room, reading room,
seminar room, staff lounge and restaurant (100 seats)
@@t% (370 6@) Chinese Restaurant (370 seats), G/F
ti%?g (120 !?@fi) Western Restaurant (120 seats), LGl
f&SE (1,100 @%i?) Cafeteria (1,100 seats), LGl and LG7
&!@!#?8 (160 @%) Coffee Shop (160 seats), l/P
1@/J&& (48 @fi) Seahont Snack Shop (48 seats)
%&ii&# Food Court, LG5
#i%? Banks
$%!?a Hair Salon
$$&!@i~ Health Center
%%j% Mail Room
iif%%%% Supermarket Aggl& University Bookstore
25

w&AB- DISTRIBUTION OF SPACE IN ACADEMIC COMPLEX
Hj& #m PFhX) Function Net AFen (sq. m)
Academic Sll LectureTheaters s%m Specialist Subject Facilities
&@f#%?? Academic offices, Tutorial Teaching & Research &%#B!J%~ Academic Supporting Facilities
/ %s S-af Rooms / Group Teaching
2,307 25,43 1
5,023 8,763
12,689
I 10,982 I ??mmmh? Central Administration and Maintenance I 8.977 I
8,415 540
1 99,7I 1 I
ffm car Park
9% , - aB!Bmi (sm) Sports (Indoor)
5%
Amenities -
9%
nmmYE Central Admin &
Maintenance 9%
wi Academic
57%
Library 1lYO
26 %%?,a FactBwk 1997198

CAMPUS PLAN OF THE HONG KONG UNIVERSITY OF SCIENCE AND TECHNOLOGY
Clear Water Bay RI
hatters A-D
4 To Tseung Kwan 0 8 Clear Water Bay
‘\ Piaz2
\
I
\
\
I
I
\
\
Port Shelter
Hall IV
University Center &
C & D
#k&.R Fact Book 1997/9X 27

7%fWBA9i?EH LOCATION MAP OF THE HONG KONG UNIVERSITY OF SCIENCE AND TECHNOLOGY
I
28 1 R?Ck!R Fact Book 1997198