Embed Size (px)
Citation preview

URTeC: 2433427
Fact-Based Re-Frac Candidate Selection and Design in Shale – A Case Study in Application of Data Analytics Shahab D. Mohaghegh, Intelligent Solutions, Inc. & West Virginia University. Copyright 2016, Unconventional Resources Technology Conference (URTeC) DOI 10.15530-urtec-2016-2433427
This paper was prepared for presentation at the Unconventional Resources Technology Conference held in San Antonio, Texas, USA, 1-3 August 2016.
The URTeC Technical Program Committee accepted this presentation on the basis of information contained in an abstract submitted by the author(s). The contents of this paper
have not been reviewed by URTeC and URTeC does not warrant the accuracy, reliability, or timeliness of any information herein. All information is the responsibility of, and, is
subject to corrections by the author(s). Any person or entity that relies on any information obtained from this paper does so at their own risk. The information herein does not
necessarily reflect any position of URTeC. Any reproduction, distribution, or storage of any part of this paper without the written consent of URTeC is prohibited.
Summary
Research and development as well as field testing of re-frac candidate selection dates back to late 1990s and early
2000. Originally, re-frac (also called re-stimulation at the time) was routinely applied to gas storage wells to maintain
deliverability and later to vertical production wells completed in tight gas formations. Completion and production of
tens of thousands of shale wells that are characterized by high initial production followed by a sharp decline made it
all but obvious that re-frac will become a prominent production strategy sooner rather than later.
The new commodity prices will make the application of re-fracturing in
shale wells an attractive alternative to drilling new wells. Two facts make
re-fracturing of the shale wells an attractive proposition: (a) only half of all
hydraulic fracture stages end up being productive during the first round of
completions, (b) the stages that have been successfully stimulated and have
produced substantial amount of fluid, now have altered stress fields and
therefor new fracs will penetrate new horizons. Therefore, chances are that
re-fracs will be accessing new and untapped reserves and will be just as
effective as drilling new wells with better economics.
Once the decision is made that the re-frac is a viable production strategy, the question becomes, which wells should
be re-frac-ed first? Operators must select from hundreds of potential candidate wells, those with the highest return on
re-frac investment will be the best candidates. In such situations the operator is faced by two options: (a) use intuition
or the traditional approaches, (b) learn from the data generate from completing the wells during the original completion
in order to make the best decisions on re-frac candidates.
This paper presents a unique workflow for shale wells re-frac candidate selection based on advanced data-driven
analytics. The workflow is presented in the form of a case study that includes hundreds of shale wells in Marcellus
Shale. It is demonstrated that the data (well construction, well logs, completion and hydraulic fracturing practices
along with production history) that is generated during the original development process can provide a treasure trove
of information for making decisions during the re-frac stage of the field development.
Introduction
Publications about re-fracturing treatments (re-stimulation) before 1990s are sparse. The first published work on re-
frac dates back to 1960 (Johnson, March 1960), followed by another publication in 1973 (Coulter, May 1973).
Application of data-driven analytics1 to the subject of hydraulic fracturing in general and re-frac, specifically,
originated at West Virginia University in mid-1990s (Mohaghegh S. D., 1996) (McVey, November 1994) (Mohaghegh
S. D., October 1996) (Mohaghegh S. D., October 1996) (Mohaghegh S. D., November 1998) (Mohaghegh S. D.,
1 In early 1990s Data-Driven Analytics was not used in reference to the series of technologies that were used to perform data-
driven analysis and modeling. Those days they were simply referred to as artificial neural networks, or intelligent systems.
WITHOUT DATA, YOU ARE JUST
ANOTHER PERSON WITH AN
OPINION W.E. DEMING (1900-93)

URTeC 2433427 2
October 1999) and continued into mid-2000s (Mohaghegh S. D., October 2001) (Mohaghegh S. D., October 2002)
(Mohaghegh S. D., October 2003) (Mohaghegh S. D., October 2005) (Mohaghegh S. D., July 2005) (Malik, October
2006). Gas Research Institute2 started a new Re-Frac Candidate Selection project in 1998 that breathed new life into
the re-frac technology. Results of this project were extensively published and inspired many new activities in this area
(Reeves S. R., May 1999) (Reeves S. R., October 1999) (Mohaghegh S. D., April 2000) (Reeves S. B., October 2000).
Since production of hydrocarbon from shale is intimately tied to hydraulic fracturing, it was inevitable that re-
fracturing become the subject of interest for production enhancement in shale. It is a widely accepted notion that at
least 40 percent of the hydraulic fracture stages in shale wells do not contribute to production. This has been mentioned
in articles and interviews with service company representative (Jacobs, 2015) and has also been indicated through
micro-seismic. Even in the stages that have been properly fracked and are contributing to production, the depletion of
the reservoir modifies the stresses that controlled the original orientation of the hydraulic fractures and if new frac
jobs are pumped into these same stages, chances are that the propagation of the new fracs will take different paths
compared to the original fracs.
Figure 1. Frac reorientation due to previous production and modification of the stress around the wellbore (Siebrits,
October 2000).
Figure 1 is a schematic diagram of the frac reorientation due to stress modification in the reservoir after partial
depletion. It should be a well-established fact by now that hydraulic fractures in shale do not follow paths that are
well-behaved and are penny-shaped, such as those generated by many hydraulic fracture modeling software
applications. Nevertheless, the general idea that partial depletion will modify the original stresses in the rock and
provides a new stress filed around the wellbore causing a different propagation path for the new hydraulic fractures,
seems to be a sound argument.
Once we accept the idea that re-frac can provide major potentials for more production from shale wells by tapping
into new reserves (whether it be by fracking stages that were not productive in the first pass, or by propagating into
new natural fractures resulting from modification of the stress field) two new questions surface that need to be
addressed accurately in order to have a successful re-frac program. These questions are:
2 Now: Gas Technology Institute.
URTeC 2433427 3
1. Given that most shale assets include large number of wells, how would one screen them in order to identify
the best re-frac candidates? It should be obvious that not all wells would respond in the same manner to a re-
frac.
2. Once the re-frac candidate selection is completed (wells are ranked based on their response to re-frac), how
would one designs a re-frac treatment for a well that has been hydraulically fractured before?
The objective of this paper is to address the above two questions. When it comes to initiating a re-frac program, it is
important not to treat all shale assets in the exact same manner. This is true, since no two shale assets (even if and
when they are in the same shale formation) are the same and usually differ (sometimes considerably) in reservoir
characteristics and how they have been completed and produced by different operators. All the historical details and
nuances of a given shale asset must be taken into account before a successful re-frac program is initiated. We use
Shale Analytics3 in order to address the above two questions. Conducting a re-frac program using Shale Analytics
requires a comprehensive analysis and predictive modeling to be performed on the large amount of data that is
collected during the original development of the asset. In other words, the data and information collected during the
original development (drilling, reservoir characterization, completion and production) of the shale asset is used as a
guide for a successful re-frac program. The idea is very simple. Let’s the shale asset tell you how it can give you the
most hydrocarbon through field measurements, rather than human bias. Shale Analytics accomplishes this task through
a process that includes thorough and detail data mining and analysis of the previous completions in the given asset.
Shale Analytics algorithms are trained to learn the well construction, reservoir characteristics, completion and
production practices in the specific shale asset so that the re-frac program can be based on facts and field measurements
rather than pre-conceived notions on how completion and re-completions supposed to work.
Re-Frac Candidate Selection
The data-driven analytics approach to re-frac candidate selection in shale wells (Shale Analytics) is intimately related
to two topics (a) data-driven predictive modeling also known as Predictive Analytics, and (b) look-back analysis.
These topics will be covered in details in a separate paper. However, in this manuscript we provide a quick overview
of both of these technologies so that their use in re-frac candidate selection can be put in perspective.
a. Data Driven Predictive Model (Predictive Analytics):
Data driven predictive model for shale assets are developed by using field measurements from a given assets
in order to train a machine learning algorithm. The field measurements that are used include well construction
parameters (well location, inclination, azimuth, TVD, MD, orientation, etc.), reservoir characteristics (any
and all available well logs, porosity, formation tops, thickness, NTG, TOC, initial water saturation, etc.),
completion (lateral length, number of stages, number of clusters per stage, stage length, distance between
stage, shot density, etc.) and hydraulic fracturing parameters (average injection pressure, average injection
rate, amount of clean volume, slurry volume, proppant volume, proppant concentration, etc.) as well as
operational constraints (well-head pressure, choke size, etc.) These parameters are correlated to well
productivity such as 30, 90, 120, 180, and 360 days cumulative production from each well. The data driven
predictive model is calibrated and validated using a number of randomly selected wells that are treated as
blind wells that are not included in the training.
Upon the development (training and calibration) and validation of a data-driven predictive model we are in
possession of a tool that can predict production (in this case production indicators) from a shale well that is
conditioned to a large number of (facts) field measurements with little to no human biases involved.
The data-driven predictive model calculates well production that is conditioned to well construction, reservoir
characteristics, completion and stimulation (hydraulic fracture) parameters and operational constraints. This
is the only technology that can accurately predict shale well productivity while making the most use of all
the field measurements. Most importantly, this technology avoids any and all types of interpretations and
biases that are usually introduced in traditional techniques such as the use of soft data that cannot be
measured, examples of which are Stimulated Reservoir Volume (SRV), fracture half length, fracture height,
3 The term “Shale Analytics” refers to the collection of techniques that are based on advanced data-driven analytics. These
techniques have been developed to streamline solutions for analysis, predictive modeling and optimization of shale assets using a
technology called Shale Production Optimization Technology – SPOT (Intelligent Solutions, 2016).
URTeC 2433427 4
width and conductivity. Data-driven predictive model provides the luxury of being able to modify some of
the input parameters and examine their impact on model output (shale well’s productivity). This is a powerful
tool for understanding the role of different parameters or groups of parameters on shale well’s productivity.
Furthermore, given the fact that the data-driven predictive model has small computational footprint (only a
fraction of a second per execution) it can be executed a large number of times in only a few seconds and
therefore provide the means for studies that require large number of model execution such as quantification
of uncertainties.
For example, if for a given well, the operational constraints are modified, we can learn how the shale well
will respond to changes to surface facilities constraints (translated to well-head pressure) and choke sizes.
By modifying reservoir characteristics and monitoring the model’s response (shale well’s productivity) we
can learn the impact of different reservoir parameters and their role in controlling production from wells in
the specific shale asset. Similarly, we can assess the importance of different completion practices on the
production from a given well. It can easily be seen that data-driven predictive model is a powerful tool in
learning so much about the production behavior of shale wells in a given asset.
b. Look-Back Analysis:
During the “Look-Back Analysis” the validated predictive model is used to identify the quality of the frac
jobs that have been performed in the past. For the purposes of the look-back analysis, parameters in the model
are divided into two groups. The combination of completion and hydraulic fracture parameters are named the
“Design Parameters.” These are the so-called controllable parameters. Parameters related to well construction
and reservoir characteristics are treated as uncontrollable parameters.
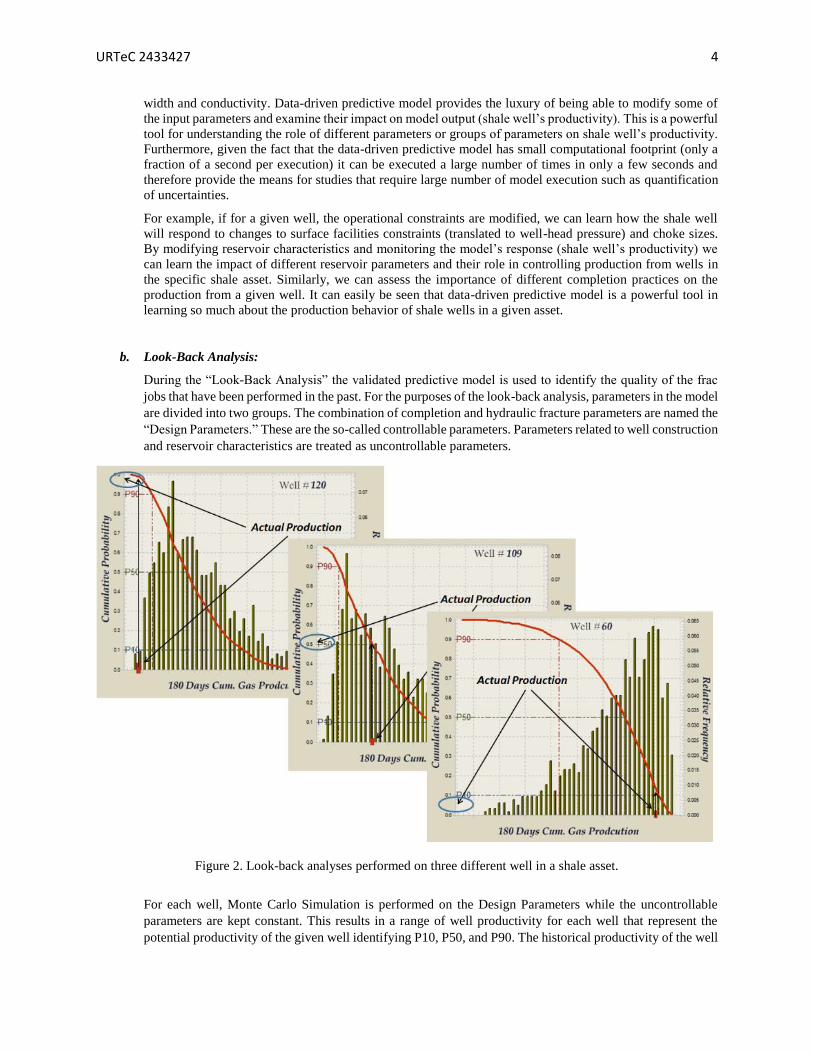
Figure 2. Look-back analyses performed on three different well in a shale asset.
For each well, Monte Carlo Simulation is performed on the Design Parameters while the uncontrollable
parameters are kept constant. This results in a range of well productivity for each well that represent the
potential productivity of the given well identifying P10, P50, and P90. The historical productivity of the well
URTeC 2433427 5
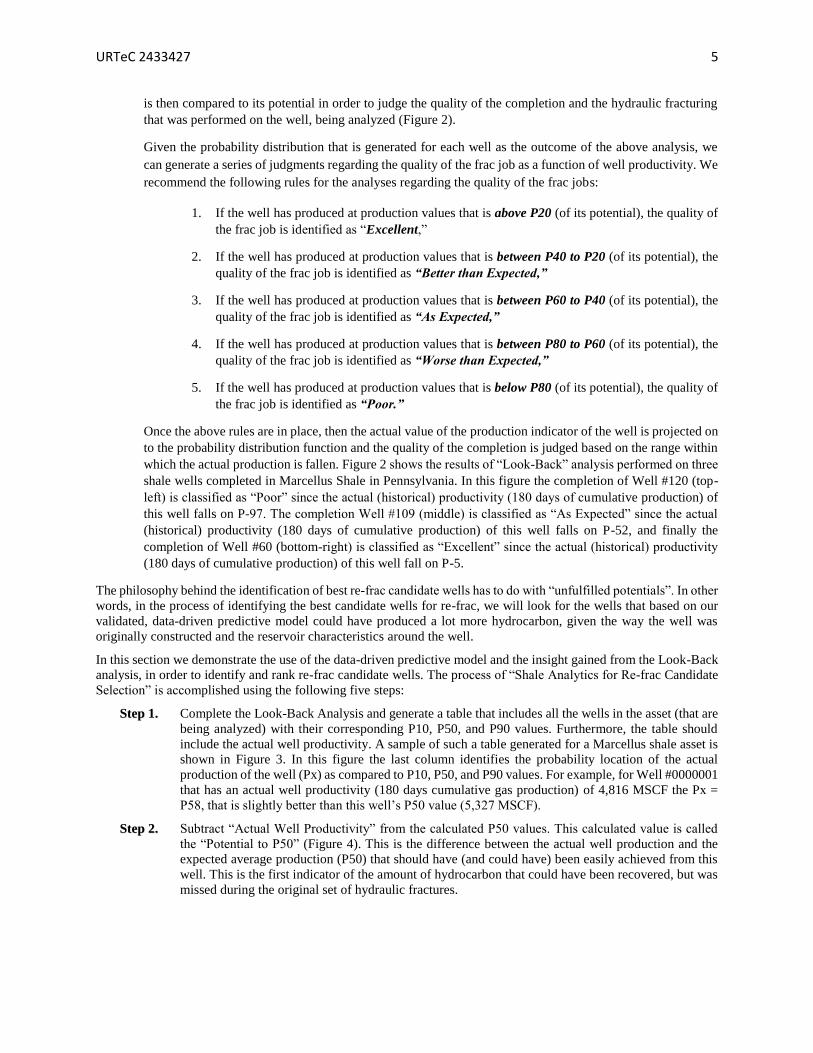
is then compared to its potential in order to judge the quality of the completion and the hydraulic fracturing
that was performed on the well, being analyzed (Figure 2).
Given the probability distribution that is generated for each well as the outcome of the above analysis, we
can generate a series of judgments regarding the quality of the frac job as a function of well productivity. We
recommend the following rules for the analyses regarding the quality of the frac jobs:
1. If the well has produced at production values that is above P20 (of its potential), the quality of
the frac job is identified as “Excellent,”
2. If the well has produced at production values that is between P40 to P20 (of its potential), the
quality of the frac job is identified as “Better than Expected,”
3. If the well has produced at production values that is between P60 to P40 (of its potential), the
quality of the frac job is identified as “As Expected,”
4. If the well has produced at production values that is between P80 to P60 (of its potential), the
quality of the frac job is identified as “Worse than Expected,”
5. If the well has produced at production values that is below P80 (of its potential), the quality of
the frac job is identified as “Poor.”
Once the above rules are in place, then the actual value of the production indicator of the well is projected on
to the probability distribution function and the quality of the completion is judged based on the range within
which the actual production is fallen. Figure 2 shows the results of “Look-Back” analysis performed on three
shale wells completed in Marcellus Shale in Pennsylvania. In this figure the completion of Well #120 (top-
left) is classified as “Poor” since the actual (historical) productivity (180 days of cumulative production) of
this well falls on P-97. The completion Well #109 (middle) is classified as “As Expected” since the actual
(historical) productivity (180 days of cumulative production) of this well falls on P-52, and finally the
completion of Well #60 (bottom-right) is classified as “Excellent” since the actual (historical) productivity
(180 days of cumulative production) of this well fall on P-5.
The philosophy behind the identification of best re-frac candidate wells has to do with “unfulfilled potentials”. In other
words, in the process of identifying the best candidate wells for re-frac, we will look for the wells that based on our
validated, data-driven predictive model could have produced a lot more hydrocarbon, given the way the well was
originally constructed and the reservoir characteristics around the well.
In this section we demonstrate the use of the data-driven predictive model and the insight gained from the Look-Back
analysis, in order to identify and rank re-frac candidate wells. The process of “Shale Analytics for Re-frac Candidate
Selection” is accomplished using the following five steps:
SStteepp 11.. Complete the Look-Back Analysis and generate a table that includes all the wells in the asset (that are
being analyzed) with their corresponding P10, P50, and P90 values. Furthermore, the table should
include the actual well productivity. A sample of such a table generated for a Marcellus shale asset is
shown in Figure 3. In this figure the last column identifies the probability location of the actual
production of the well (Px) as compared to P10, P50, and P90 values. For example, for Well #0000001
that has an actual well productivity (180 days cumulative gas production) of 4,816 MSCF the Px =
P58, that is slightly better than this well’s P50 value (5,327 MSCF).
SStteepp 22.. Subtract “Actual Well Productivity” from the calculated P50 values. This calculated value is called
the “Potential to P50” (Figure 4). This is the difference between the actual well production and the
expected average production (P50) that should have (and could have) been easily achieved from this
well. This is the first indicator of the amount of hydrocarbon that could have been recovered, but was
missed during the original set of hydraulic fractures.

URTeC 2433427 6
Figure 3. List of wells from a Marcellus shale asset. Data-driven predictive model was used to calculate P10, P50,
and P90 as part of the Loo-Back analysis.
Figure 4. Potential to P50 and Potential to P10 calculated for all wells.

URTeC 2433427 7
SStteepp 33.. Subtract “Actual Well Productivity” from the calculated P10 values. This calculated value is called
the “Potential to P10” (Figure 4). This is the difference between the actual well production and the
expected best production (P10) that could have been achieved from this well. This is the second
indicator of the amount of hydrocarbon that could have been recovered, but was missed during the
original set of hydraulic fractures.
SStteepp 44.. Sort the table based on the “Potential to P50” (This is the missed potential to achieve average
production. This must be easiest to achieve) and “Potential to P10” (This is the missed potential to
achieve an excellent frac job and. This is achievable, but not very easily) separately. These calculations
and rankings are shown in Figure 5 (the left- and the middle-tables).
SStteepp 55.. The right-table in Figure 5 is the final ranking of the Re-Frac Candidates. This table is generated using
the ranking in the left- and the middle-tables in Figure 5. The reconciliation of the left- and the middle-
tables in Figure 5 is accomplished by giving the ranking of “Potential to P50” twice as much weight
as the ranking of “Potential to P10”.
Figure 5. Sorting the table of wells based on the highest production missing values of Potential to P50 (left-table)
and Potential to P10 (middle-table). Final ranking of Re-Frac Candidates (right-table).
Re-Frac Design
In the previous section, identification and ranking of re-frac candidates were covered. Once the re-frac candidate wells
are identified and ranked, it is time to design the most appropriate frac job to be pumped. The objective of the design
of frac job is to have a treatment that is as close to optimum as possible. The optimum frac job is defined as a frac job
that creates (activates) the largest possible network of highly conductive pathways (natural fractures) into the wellbore
such that it would maximize the amount of hydrocarbon that can be produced. In other words, the quality of the frac
job is judged based on the hydrocarbon production that it triggers and sustains. The frac job needs to do what it does
in order to contribute to higher, more sustainable hydrocarbon production.

URTeC 2433427 8
As suggested by data-driven analytics (Shale Analytics), we learn from the historical data in order to design a new
frac job. The premise that is being incorporated in Shale Analytics, suggests that instead of basing our analysis,
modeling and design judgments on our today’s understanding of the physics of storage and transport phenomena in
shale, we use the field measurements as the basis of our design and analysis. The technology that has been introduced
here, provides the means for using field measurements as sets of input-output records that will eventually guide our
modeling and design of frac jobs in shale wells.
To use data-driven analytics as a design tool, we make maximum use of the data-driven predictive model as the
objective function of a search and optimization algorithm. Search and optimization algorithms are developed in order
to find the optimum combination of input parameters that results in the best output of a given objective function. In
this analyses, well productivity is defined as the result (output) of the objective function (a yardstick to compare
effectiveness of frac jobs in combination with reservoir characteristics) of our search and optimization algorithm. The
combination of well construction, reservoir characteristics, completion practices, operational constraints and frac
parameters serve as the input parameters. A schematic diagram of the flow chart is provided in Figure 6.
Figure 6. Search and optimization flow chart for the design of optimum re-frac.
There are many search and optimization algorithms that can be used for the purposes identified above. Staying loyal
to data-driven analytics (Shale Analytics), we will use an evolutionary optimization technique called genetic
algorithms (Mohaghegh S. D., 2000) for this purpose. Evolutionary computing paradigms provide a rich and capable
environment to solve many search, optimization, and design problems. The larger the space of the possible solutions,
the more effective would be the use of these paradigms. Evolutionary computing, in general, and genetic algorithms,
specifically, are able to combine the exploration characteristics of an effective search algorithm with a remarkable
ability of preserving and exploiting the knowledge acquired during every step of the search as a guide to take the next
step. This provides an intelligent approach to more efficiently solve search, optimization, and design problems. The
re-frac design that is introduced in this section uses genetic algorithm as the search and optimization technology.
The optimization of re-frac design that is introduced in this section can be applied to the entire asset, to a group of
wells that are identified based on some common theme such as geographic location, reservoir characteristics, or
production characteristics (such as common BTU range), or to an individual well. The algorithm that is covered in
this section does not change as it is applied to the entire field, group of wells or an individual well. The difference will

URTeC 2433427 9
show up in the population of the parameters (as it will be explained next) during the analyses. For the purposes of
explaining the process, we apply the design optimization algorithm to the entire field.
The main distinction between the re-frac design technology proposed here with other methods is that in this technology
we let the realities of completion practices in a given asset (field) be the main design driver. Instead of using our biases
and (today’s) understanding of the completion and hydraulic fracturing in shale in order to design a re-frac treatment,
this technology capitalizes on facts collected in the field (field measurements) to drive the treatment design. Since our
understanding of interaction between shale’s natural fracture network and the induced fractures is quite limited (at
best), this technology prevents human biases to enter the design process.
In summary, this technology (for designing re-frac treatment) uses the lessons learned from the past frac jobs in the
same asset to generate an optimum design for re-frac treatment. This is done by evolving the new treatment design
that is conditioned to all the details (well construction, reservoir characteristics and completion) for a given well,
through several generations, while keeping track of the characteristics of the most successful individual frac designs
(combination of design parameters), then looking for distinctive patterns among these successful individual frac
designs.
Figure 7. Generating multiple realizations of Designs for each individual well.
Following steps are performed for every individual well in order to generate a set of general guidelines for the optimum
re-frac treatment design that is applicable to the entire the field:
1. Generating random set of design parameters (initialization):
In this step the design parameters that are the subject of optimization are identified and separated from other
parameters (design or non-design parameters that are not going to be modified [optimized] during this process
are called the constant parameters.) Then, a large number (for example one thousand 1,000) of realization of
the combination of the design parameters are generated, randomly. Each realization of the combination of

URTeC 2433427 10
design parameters are coupled with the constant parameters to generate one set of input parameters to be
applied to the data-driven predictive model.
2. Generating model outputs:
Apply each set of input parameters (total of 1,000) to the data-driven predictive model and generate
corresponding outputs (production indicators). Upon completion of this step, we have generated 1,000 values
of the output parameter (production indicator) for each well. Each production indicator represent one
randomly generated frac design applied to the well (while keeping all other parameters constant). A schematic
diagram of this process is shown in Figure 7.
Upon completion of this process for an individual well in the field we have generated 1,000 production
indicators representing large number (1,000) of possible outcomes (production) for a single well with a given
set of characteristics (well construction, reservoir characteristics and completion).
3. Ranking the model outputs:
The one thousand production indicators (for example, 180 days of cumulative production) are sorted from
highest value (production) to lowest with their corresponding combination of design parameters. At this point
in time, we have identified the best combination of the design parameters for a given well, from amongst the
1,000 randomly generated designs.
By sorting these combination of design parameters we now know which set of combinations are responsible
for highest production given all the details of this particular well. Remember that by looking at the details of
the design parameters, we may or may not understand “why” one set of combination of design parameters
are better for this given well, than other combination (better design parameters result in higher production).
But it does not matter “why”, as long as we know one set is better than the other, we are going to use this
knowledge to our advantage.
4. Save the best designs:
Upon completion of Step 3, we have completed one generation of evolution. We save the combination of
design parameter for the top 10% of the solutions. By the end of the first generation we have now a collection
of 100 “good” re-frac designs (combination of design parameters) for this particular well.
5. Assign reproduction probability based on fitness:
A reproduction probability value is assigned to each individual solution based on its ranking generated in the
previous step. Figure 8 shows the probability assignment based on fitness. The values of the probability that
are assigned in this step will be used during the selection of the parents that will produce the next generation
of the re-frac design solutions. The higher is the reproduction probability of an individual solution, the higher
is the probability of that solution to be selected as a parent and play a role in the makeup of the next generation
of the individual solutions.
6. Producing the next generation:
A large portion of the next generation of the re-frac designs are produced (generated) using the top solutions
from the previous generation. Each time parents are selected from the previous generation based on their
probability values assigned in the previous step. Solutions with the higher probability values will have a
better chance of being selected as a parent to produce (generate) the population of the solutions for the new
generation. The new generation is produced using genetic operators such as crossover, inversion, and
mutation (Mohaghegh S. D., 2000). Usually a large portion of the population of the new generation is
produced via cross over (about 75%), where other genetic operators are used to produce a smaller amount of
the new generation of solutions (5% for inversion and 5% for mutation operators). Furthermore, a small
percentage of the population (15%) of the previous generation are used to move to the next generation, where
the value of the probability plays an important role, again.
7. Repeat from Step 2, until convergence:
Once a new generation of solutions are produced the algorithm goes back to Step 2 and repeats the process.
Each time a cycle of the genetic optimization is completed during the evaluation of the goodness of the
solutions that have been generated (Step 2), the algorithm must check to see if the convergence has been
reached. The algorithm continues only if the convergence has not yet been achieved. Convergence can be

URTeC 2433427 11
defined in multiple ways. For example, convergence can be achieved when no better individual (re-frac
design solution) is evolved after several generations.
8. Analyze the data saved in Step 4:
Let us assume that it takes 145 generations before the optimum re-frac design is evolved using the process
enumerated above. Since the top 10% solutions (re-frac design parameters) of each generation were being
saved (100 solutions as was mentioned in Step 4), and since it took 145 generation to converge to the best
solution, upon completion of the above optimization process we have saved 14,500 top solutions for a single
well. These 14,500 solutions have one thing in common. They all are among the top survivors, as the fittest
solutions of their generation. Therefore, they must be doing something right since the definition of a “good
solution” in the context of re-frac treatment design is the best combination of hydraulic fracture parameters
that results in high production.
Figure 8. Assigning reproduction probability to each individual solution based on their fitness.
Now that the data representing the set of best solutions for a re-frac design is available, we should be able to
see if this data contains any specific patterns or trend that can guide us toward the best re-frac design for this
specific well. This is called “Data-Driven Best Practices”. Figure 9 is the result of performing the above
optimization on an individual shale well producing from Utica shale. This figure includes three of the several
parameters that were used in this process. The top-left bar-chart in this figure shows the frequency of the
“Shot Density” (shots per ft. of completion) in the completion process. This bar chart clearly shows that the
overwhelming percent of the top solutions (re-frac designs) have small number of shot density. The top-right
bar-chart shows a clear pattern of higher values of proppant concentration (lbs/gal/ft. of completion) for the
top design solutions for this well, and finally the bottom bar-chart shows that the best designs for this well
mostly included lower values of injection rates (BPM/ft. of completion).

URTeC 2433427 12
Figure 9 shows that there is an undeniable pattern in the top re-frac designs that results in high production in this
particular well. Therefore, in order to have a successful re-frac, it is recommended that the numbers generated by this
optimization algorithm be honored as much as it is operationally feasible. For example for the well presented in Figure
9, it is recommended that the number of shots per foot of completed lateral length be less than 1.3, the proppant
concentration should be higher than 2.5 lbs. per gallon of fluid per foot of completed lateral length and the injection
rate be kept at less than 0.15 barrels per minute per foot of completed lateral length.
Figure 9. Result of evolving re-frac design solution using a genetic optimization algorithm for a well in Utica shale.
Concluding Remarks
When it comes to selecting re-frac candidates and design of the re-frac jobs, the operators are faced with a choice.
They can either use the same techniques that have left more than 40% of the stages in the original completion without
production or use alternative technologies that although being non-traditional, have proven to outperform traditional
techniques, anytime they have been employed. In other words, either stick to what you have been doing and be satisfied
with only 60% success (at best), or try something new that has proven itself as the state-of-the-art, i.e. predictive
analytics, not only in the oil and gas industry but in almost every other industry, today.
This manuscript demonstrated how predictive analytics as applied to shale (Shale Analytics) can be used for re-frac
candidate selection and design. The workflow that had been successfully developed and validated in tight sand
formations have been enhanced and been applied to shale. The technology learns from the facts and field
measurements and everything that has worked and those that did not, in a given field, in order to identify and rank re-
frac candidates and based on the same information it designs re-fracs that have the best chance of success.
URTeC 2433427 13
Bibliography
Coulter, G. a. (May 1973). The Design of Re-frac Treatments for Restimulation of Subsurface Foramtions. Rocky
Mountain Regional Meeting. Casper, Wyoming: Society of Petroleum Engineers - SPE.
Intelligent Solutions, I. (2016, May 3). Intelligent Solutions, Inc. Retrieved from Intelligent Solutions, Inc.:
http://intelligentsolutionsinc.com/
Jacobs, T. (2015, November). Halliburton Reveals Refracturing Strategy. Journal of Petroleum Technology (JPT),
pp. 40-41.
Johnson, P. (March 1960). Evaluation of Wells for Re-Fracturing Treatments. Spring Meeting of Southwerstern
District, Division of production. Dallas, Texas.
Malik, K. M. (October 2006). An Intelligent Portfolio Management Approach to Gas Storage Field Deliverability
Maintenance and Enhancement; Part One Database Development & Model Building. SPE Eastern
Regional Conference & Exhibition. Canton, Ohio: Society of Petroleum Engineers (SPE).
McVey, D. M. (November 1994). Identification of Parameters Influencing the Response of Gas Storage Wells to
Hydraulic Fracturing With the Aid of a Neural Network. SPE Eastern Regional Conference and Exhibition.
Charleston, West Virginia.
Mohaghegh, S. D. (1996). Predicting Well Stimulation Results in a Gas Storage Field in the Absence of Reservoir
Data, Using Neural Networks. SPE Reservoir Engineering , November, 268-272.
Mohaghegh, S. D. (2000, October). Virtual Intelligence Applications in Petroleum Engineering: Part 2 ;
Evolutionary Computing. Journal of Petroleum Technology, Distinguished Author Series, 40-46.
Mohaghegh, S. D. (April 2000). Development of an Intelligent Systems Approach to Restimulation Candidate
Selection. SPE Gas Technology Symposium. Calgary, Alberta: Society of Petroleum Engineers (SPE).
Mohaghegh, S. D. (July 2005). A Soft Computing-Based Method for the Identification of Best Practices, with
Application in Petroleum Industry. IEEE International Conference on Computational Intelligence for
Measurement Systems& Applications. Taormina, Sicily, Italy.
Mohaghegh, S. D. (November 1998). Candidate Selection for Stimulation of Gas Storage Wells Using Available
Data With Neural Networks and Genetic Algorithms. SPE Eastern Regional Conference and Exhibition.
Pittsburgh, PA: Society of Petroleum Engineers (SPE).
Mohaghegh, S. D. (October 1996). A Hybrid Neuro-Genetic Approach to Hydraulic Fracture Treatment Design and
Optimization. SPE Annual Technical Conference & Exhibition (ATCE). Denver, Colorado: Society of
Petroleum Engineers (SPE).
Mohaghegh, S. D. (October 1996). Fracture Optimization eXpert (FOX): How Computational Intelligence Helps the
Bottom-Line in Gas Storage. SPE Eastern Regional Conference and Exhibition. Columbus, Ohio: Society
of Petroleum Engineers (SPE).
Mohaghegh, S. D. (October 1999). Performance Drivers in Restimulation of Gas Storage Wells. SPE Eastern
Regional Conference and Exhibition. Charleston, West Virginia.
Mohaghegh, S. D. (October 2001). Identifying Best Practices in Hydraulic Fracturing Using Virtual Intelligence
Techniques. SPE Eastern Regional Conference and Exhibition. North Canton, Ohio: Society of Petroleum
Engineers (SPE).
Mohaghegh, S. D. (October 2002). Identifying Successful Practices in Hydraulic Fracturing Using Intelligence Data
Mining Tools; Application to the Codell Formation in the DJ Basin. SPE Annual Conference and
Exhibition (ATCE). San Antonio, Texas: Society of Petroleum Engineers (SPE).

URTeC 2433427 14
Mohaghegh, S. D. (October 2003). Essential Components of an Integrated Data Mining Tool for the Oil & Gas
Industry, With an Example Application in the DJ Basin. SPE Annual Conference and Exhibition (ATCE).
Denver, Colorado: Society of Petroleum Engineers (SPE).
Mohaghegh, S. D. (October 2005). Analysis of Best Hydraulic Fracturing Practices in the Golden Trend Fields of
Oklahoma. SPE Annual Conference and Exhibition (ATCE). Dallas, Texas: Society of Petroleum Engineers
(SPE).
Reeves, S. B. (October 2000). Benchmarking of Restimulation Candidate Selection Techniques in Layered, Tight
Gas Sand Formations Using Reservoir Simulation. SPE Annual Technical Conference and Exhibition
(ATCE). Dallas, TX: Society of Petroleum Engineers (SPE).
Reeves, S. R. (May 1999). Restimulation of Tight Gas Sand Wells in the Rocky Mountain Region. SPE Rocky
Mountain Region Meeting. Gillette, Wyoming: Society of Petroleum Engineers (SPE).
Reeves, S. R. (October 1999). Restimulation Technology for Tight Gas Sand Wells. SPE Technical Conference and
Exhibition (ATCE). Houston, Texas: Society of Petroleum Engineers (SPE).
Siebrits, E. e. (October 2000). Refracture Reorientation Enhances Gas Production in Barnett Shale Tight Gas Wells.
SPE Annual Technical Conference and Exhibition (ATCE). Dallas, Texas: Society of Petroleum Engineers
(SPE).