Embed Size (px)
Citation preview
FACILITY PROFILE
Irving Oil Refining GP Saint John Refinery
Prepared by Impact Management Branch
New Brunswick Department of Environment amp Local Government September 2014
2
TABLE OF CONTENTS BACKGROUND PROCESS DESCRIPTION AIR POLLUTION CONTROL POTENTIAL AIR QUALITY CONTAMINANTS POTENTIAL IMPACTS OF AIR EMISSIONS AIR QUALITY COMPLIANCE AND ENFORCEMENT PUBLIC OUTREACH CONTACTS REFERENCES GLOSSARY
3
BACKGROUND The Irving Oil Refinery built on a plot of farmland in 1959 in east Saint John officially opened on July 20 1960 At the time the refinery was designed to process 38500 barrels of crude oil per day (BPD) Two new process areas constructed in 1976 resulted in the refinery becoming the largest in Canada with a current reference crude rate of 313000 BPD In order to prepare for the requirement for cleaner burning fuels the availability of natural gas as well as potential changes in the supply of crude oils Irving Oil Refining GP (formerly Irving Oil Limited) registered the Refinery Upgrade Project (1) under the Environmental Impact Assessment (EIA) Regulation in March of 1998 This project which the Minister allowed to proceed under specific conditions (2) on August 13 1998 involved the construction of eight new units of which three were petroleum production units and five were environmental control units These are discussed in the sections on Process Description and Air Pollution Control By the end of 2001 all new units had been commissioned The upgrade did not increase the nameplate capacity of the refinery as the design crude processing capacity on which the nameplate capacity is based did not increase The Irving Oil Refining GP refinery produces a range of fuels for transportation (ultra-low sulphur gasoline ultra-low sulphur diesel jet fuel) and combustion applications (home heating oil kerosene Bunker C) Other fuels produced for use in more specialized combustion and transportation applications include butane and propane The heaviest components of crude oil are used in asphalt which is sold for paving With the availability of natural gas from the Sable Island Gas Field the demand for heavy fuels like Bunker C which have traditionally been used for heating electricity generation and marine transportation is diminishing Product demand continues to be strong for cleaner fuels for use in transportation and combustion applications The refinery upgrade allowed the refinery to meet current and anticipated product demand for cleaner fuels and environmental requirements Over the next few years Irving Oil plans to complete some reliability and optimization projects during future maintenance turnarounds These projects will likely involve replacing and improving components within existing units to improve their efficiency The improvements may increase the volumes of certain products being produced but it is expected that emissions will remain within the approved limits PROCESS DESCRIPTION The refinery consists of units for distillation cracking reforming (molecular rearrangement) product treating steam and hydrogen production sulphur recovery and tanks for blending and product storage Below are brief descriptions of the process operations
4
Distillation The purpose of crude oil refining is to convert the diverse mixture of petroleum hydrocarbons present in the crude oil into component streams having the best use and marketability Crude oil contains a mixture of hydrocarbons of various chemical compositions and boiling points as well as impurities such as brine and sulphur and nitrogen compounds This mixture contains a range of petroleum hydrocarbons from the lightest methane which is the primary constituent of natural gas to the heaviest residues with high molecular weights that are used in paving asphalt Between these are a series of hydrocarbons that are separated for use in gasoline jet fuel diesel fuel home heating oil and heavy fuel oils The first step in the refining process following removal of brine is to separate the hydrocarbons present in the crude oil into distinct boiling ranges Some of the separated products may be used directly in saleable products while others must be processed further in order to make the most of their inherent value and to meet product specifications The separation process known as distillation takes place in a distillation column as shown in Figure 1 The crude oil is first heated to temperatures above 700 degF after which it is fed to a distillation column containing a series of perforated trays Due to differences in the boiling points of the hydrocarbons the crude oil vapours condense on the trays at different levels within the distillation column The lower boiling point hydrocarbons (heavier products) condense first and are withdrawn near the bottom of the column As the crude oil vapours move up the column progressively lighter fractions condense and are withdrawn Those fractions that do not condense are withdrawn as a gas at the top of the column The heavy ends those hydrocarbons that are too heavy to boil off in the first distillation column collect in the bottom of the column and are withdrawn and sent to a second distillation column which operates under a vacuum Under vacuum the hydrocarbons boil at lower temperatures and gas oils which could not be vaporized in the first column move up through the column and are separated out The heaviest (bottom) products are used in asphalt The separated gas oils are further processed in the cracking units as described under Cracking
5
Figure 1 Schematic of Crude Oil Distillation Column
The refinery operates two crude oil distillation units
Crude Unit No 3 (146000 BPD) constructed in 1976 Crude Unit No 4 (155000 BPD) constructed in 1999 and commissioned in 2000
Cracking Following distillation the gas oils which represent approximately half of the crude are broken into smaller molecules in processes referred to as cracking operations Cracking employs a catalyst which is a material that is used to promote a reaction but which is not consumed in the reaction The catalyst is used either to speed up the reaction or to allow it to occur at a lower temperature which renders the process more energy efficient Following are the three cracking units at the refinery
Residue Fluid Catalytic Cracking Unit (RFCCU) (90000 BPD) where residual oil (high molecular weight residual oil) is cracked and can be separated into fractions including fuel gas propane propylene butane butylene gasoline diesel and decant oil
6
Fluid Catalytic Cracking Unit (FCCU) (25000 BPD) where vacuum gas oils are cracked and separated into fractions that form gasoline diesel and liquefied petroleum gas (LPG) and
Visbreaker (20000 BPD) where residue from the vacuum tower of the crude units is cracked at high temperatures to make gasoline and diesel fuels
Molecular Rearrangement Light molecules in the gasoline component streams can be rearranged to improve their properties as gasoline blending components Reforming is normally carried out in the presence of hydrogen and a catalyst at temperatures of up to 1000 o F The refinery has five of these units which perform specific operations as follows
Butamer Unit (13000 BPD) where normal butane is converted to isobutene Two Alkylation Units (8000 BPD and 10000 BPD) where iso-butane from other units is
combined with butylenenormal butane mixture to make alkylate a high octane zero sulphur low vapour pressure gasoline blending component and
Rheniformer No 1 (9000 BPD) and Rheniformer No 2 (28000 BPD) where gasoline blending stocks are reformed to yield a higher-octane fuel
Product Treating Most refinery streams are treated to remove contaminants such as sulphur organic acids metals and surfactants that might be detrimental to engines or the environment The refinery has five units that are used to treat product streams to remove contaminants
Naphtha Hydrotreating Unit (NHT) (44000 BPD) where sulphur is completely removed from the naphtha by reaction with hydrogen over a catalyst
Hydrocracker (45000 BPD) where heavy diesel and light cycle oil are desulphurized in the presence of hydrogen and a catalyst resulting in the production of ultra-low sulphur diesel products
Hydrodesulphurizer (HDS) (56000 BPD) where the sulphur in diesel blending components is converted to hydrogen sulphide by reacting with hydrogen over a catalyst
Merox Plants (44500 BPD) where mercaptans which are odorous compounds are removed from gasoline and jet fuels and
CD-Tech Unit (58000 BPD) where sulphur compounds are removed from cat-cracker gasoline in a two-stage process
Steam Production Many of the process units contain heat exchangers to recapture waste heat from process streams Steam produced in the refinery boilers and heat recovery steam generators (HRSGs) is used to provide power in turbines and ejectors to heat processes and materials and as part of the refining process
7
The refinery currently has four boilers (1 3 5 and 6) which burn refinery fuel gas and two HRSGs The HRSGs operated as stand-alone units until late 2004 when combustion turbines were commissioned as part of the Grandview Cogeneration Project The combustion turbines generate up to 90 Megawatts (MW) of electricity that is sold to NB Power a portion (approximately 65 MW) of which is re-sold to Irving Oil Refining GP for use in the refinery The HRSGs now derive a significant portion of their heat input from waste heat generated by the combustion turbines significantly increasing the efficiency of steam generation Hydrogen Production Hydrogen required as a feedstock for the hydrocracker and the diesel and naphtha hydrotreaters is produced by a Hydrogen Plant where natural gas low octane gasoline or butane at high temperature and pressure and in the presence of a catalyst is converted to hydrogen and carbon dioxide Hydrogen is also produced as a by-product of the molecular rearrangement process Storage Blending and Shipping Approximately 15 to 20 different component streams are produced by the refinery These products are stored in the tank field before being blended together in appropriate proportions to make various grades of gasoline low sulphur diesel jet fuel furnace oil and asphalt The finished products are also stored in the refinery tank field prior to being shipped to customers via road rail and ship The tank storage area contains 135 tanks storing crude oil blending components and finished products There are also a total of 8 spheres and 10 bullets for storing butane and propane AIR POLLUTION CONTROL Owing to the complexity of the refinery air pollution control is achieved through a variety of techniques including engineering design task and unit specific control technologies operating strategies and procedures and programs having specific emission reduction goals These are summarized in the following sub-sections Fuel Combustion Controls Generally speaking there is no air pollution control equipment on fuel combustion stacks (although there are some exceptions) Control is typically exercised by maximizing heat recovery at the process design stage through the choice of fuel and fuel sulphur levels and through optimizing furnace operating conditions For example process heaters for Crude Unit No 4 were designed to be more than 90 percent efficient in terms of energy usage which is reported to be 20 percent more energy efficient than the furnaces associated with Crude Unit No1 which they replaced Sulphur Recovery Refinery processing operations where possible are designed as closed cycle operations This means that there are few emissions to the atmosphere There are several reasons for this including safety environmental protection product recovery and economics The lightest fractions produced by each processing unit are stripped of their saleable components and the remaining gases called
8
sour gas (because of the hydrogen sulphide it contains) are sent to the Amine Sulphur Recovery Unit where the hydrogen sulphide is removed The cleaned gas known as refinery fuel gas or sweet gas is used throughout the refinery to provide product heating with minimal emissions Recovered hydrogen sulphide gas is fed to the Sulphur Recovery Units where the sulphur is recovered for sale to the fertilizer and pulp and paper industries Some hydrogen sulphide gas is fed to the Sulphuric Acid Regeneration Unit where it is converted to sulphuric acid and used in the alkylation process Approximately ninety nine percent of the sulphur is recovered in this process with the rest being emitted through the Sulphur Recovery Unit stacks as sulphur dioxide Water is used in a variety of processes within the refinery to clean and cool product streams Water that comes into direct contact with petroleum products becomes contaminated and is likewise handled in a closed system The sour water that results from these operations is cleaned of its impurities in the Sour Water Stripper where hydrogen sulphide and ammonia are removed The recovered impurities are fed along with the hydrogen sulphide from the Amine Recovery Unit to the Sulphur Recovery Units The refinery presently has
two Amine Sulphur Recovery Units (9000 BPD recycle rate) and two Sour Water Stripping Units (7600 BPD) The second units in each case were added during the upgrade to provide additional sulphur extraction capability as well as redundancy for maintenance and other shutdown periods
a Tail Gas Unit to remove additional sulphur from the Sulphur Recovery Units exhaust (tail) gas The original unit (Sulphuric Acid Tail Gas Unit) installed during the upgrade did not operate as expected so the refinery was required to propose a solution In 2008 a new unit was installed (the Hydrogenation Amine Tail Gas Unit or HATGU) which is achieving the desired sulphur recovery
a Sulphuric Acid Regeneration Unit to regenerate spent sulphuric acid catalyst from the Alkylation Plants and
two Sulphur Recovery Units (100 long tons per day each) Flares Process units are linked together in a system that allows for pressure relief of vessels being shut down for maintenance or due to upset conditions such as occurs following a power interruption The pressure is relieved by piping the excess product to one of three flares where the hydrocarbons are combusted at a safe distance from people and equipment The flares are equipped with smokeless technology and steam assisted air dispersion equipment The flare system tips were upgraded in 2004 to reduce noise when additional steam is directed to the flares In addition the No 1 flare was upgraded during the fall 2007 turnaround and as a result of the newer technology employed noise levels have been reduced
9
FCCU Particulate Control Particulate matter emissions from the FCCU are minimized by a series of cyclonic separators Flue gases from the catalyst regenerator are passed through six sets of primary and secondary cyclones where centrifugal forces cause the particulate matter to move to the outside surface of the cyclones where they drop to the bottom and are removed Flue gases from the secondary cyclones are sent to a third stage containing 80 high efficiency cyclones and then to a fourth stage high-efficiency cyclone where the majority of the remaining particulate is removed prior to its being released through the stack The third stage cyclone was replaced in December 2007 and the fourth stage separator was replaced in 2009 for more reliable operation and particulate capture As the flue gas continues through each stage the size and amount of the particles left in the stream decreases Recovered catalyst is returned to the unit for re-use or recycled To further reduce particulate emissions catalyst fines are no longer added to the unit FCCU Carbon Monoxide Control As part of the 1976 refinery expansion a platinum combustion promoter was added to the regenerator The promoter keeps the heat in the bottom of the regenerator where combustion of carbon monoxide to carbon dioxide is completed without hazard and reduces the concentration of the carbon monoxide emissions from approximately 10 to 001 percent Particulate Matter and Sulphur Dioxide Control on RFCCU A Flue Gas Scrubber (FGS) was installed as part of the Refinery Upgrade Project to control emissions of particulate matter and sulphur dioxide from the RFCCU catalyst regeneration process Noise Control Noise emissions from the refinery are controlled through the equipment selection process a silencer to reduce noise on the FCCU was installed in 1995 in response to concerns from neighbours around the refinery Noise mitigation is recognized as an integral part of the design process and noise level specifications were included in the upgrade project procurement process In the fall of 2007 the refinery conducted a noise study as a requirement through their Approval to Operate Although the results of the study showed noise to be within benchmark levels at their property line it did help identify certain activities and units that contribute to slightly increased levels As a result several process and mechanical changes were made (such as the installation of silencers) to reduce intermittent noise levels Hydrogen Plant Carbon Dioxide Control Primary sources of carbon dioxide within the refinery are from fuel combustion and from synthetic hydrogen production through steamnaphtha reforming In order to reduce the refinerys emissions of carbon dioxide recycle a contaminant emission and produce a saleable product Irving Oil Refining GP entered into a joint venture with Praxair Canada Inc and constructed a carbon dioxide liquefaction plant in the Grandview Industrial Park in 1997 Over half of the carbon dioxide emissions generated from the hydrogen plant are now being recovered and recycled as a food grade product
10
Instrumentation and Stack Monitoring The refinery re-instrumentation carried out between 1991 and 1993 allowed for more frequent and precise control of all refinery processes This improved control allows the optimization of refinery processes which contributes markedly to energy efficiency and emission reductions During re-instrumentation a second fiber optic communication backbone was installed which provides a backup for the control system and allows the refinery to continue safe operation in the event that a portion of the control system becomes inoperable Stack emissions are monitored for a number of parameters In some cases the monitors provide direct measurements of contaminant concentrations such as the sulphur dioxide continuous emission monitors on the sulphur plant stacks In other cases such as the furnaces boilers and the FCCU process parameters including fuel flow oxygen and temperature are continuously measured These measurements allow for optimal control of the process as well as in combination with frequent fuel sulphur analysis for the calculation of sulphur dioxide emissions Continuous Emission Monitors (CEMs) for sulphur dioxide and nitrogen oxides are operational on the Flue Gas Scrubber the Tail Gas Unit and the Sulphuric Acid Regeneration Unit During the construction of the Grandview Cogeneration Project CEMs for sulphur dioxide and nitrogen oxides were installed on both HRSGs Operational Procedures The refinery burns refinery fuel gas (sweet gas) to provide heat for the refining process The 26 stacks emit flue gases from the combustion of refinery fuel gas natural gas propane or LPG Adherence to the Sulphur Dioxide Response Plan also contributes to reducing emissions and minimizing their impact The operating approval requires the refinery to implement the plan when ambient sulphur dioxide concentrations are above 8 parts per hundred million (pphm) which is approximately one half the maximum permissible 1-hour ground level concentrations of sulphur dioxide at any one of five ambient monitors In order to conserve energy process heaters and boilers are operated near stoichiometric (ideal) conditions that is the minimum amount of air required is used to enable complete combustion of the fuels This operating objective has the benefit of minimizing emissions of all contaminants Shutdown start-up and maintenance procedures are designed to minimize emissions During planned shutdowns units are steamed out and the resulting hydrocarbon mixture is burned in the flare(s) with clean fuels such as propane or LPG to minimize the hydrocarbon emissions Wherever possible mechanical procedures are now employed to remove coke build-up on boiler tubes as opposed to the previous practice of slowly burning the coke out Further during maintenance of the sulphur plants or associated units the refinery uses low sulphur crude to reduce the load on the operating sulphur recovery plant
11
Product Quality Product (fuel) quality affects emissions at the refinery level during product distribution and in product usage Changes to fuel quality are frequently driven by environmental and health concerns and often become requirements of national fuel regulations in Canada and the United States The Alkylation Unit (to reduce volatile organic compound (VOC) emissions) and Dehexanizer (for US reformulated gasoline) are process units that were installed between 1987 and 1994 as a result of new Canadian and US federal gasoline regulations aimed at reducing emissions from both gasoline storage and use More recent federal environmental initiatives necessitated the upgrade to the Diesel Hydrodesulphurizer and the Hydrocracker in 1995 which allowed production of low sulphur diesel This became a requirement in 1998 as a result of the Diesel Fuel Regulations (3) The Aromatics Saturation Unit was constructed in 1997-98 to reduce the benzene content in gasoline as required by the Benzene in Gasoline Regulations (4) The CD-Tech Unit installed in 2003 as part of the RFCCU provides enhanced capability to ensure that the Sulphur in Gasoline Regulations (5) are met Irving Oil has also made infrastructure improvements such as new pipelines in preparation for adherence with the ultra-low sulphur diesel requirements mandated under the Sulphur in Diesel Fuel Regulations (6) In 2006 the hydrocracker was converted into a diesel treater to help meet these requirements In 2010 the refinery started construction of a new Dehexanizer unit to further reduce the benzene content in gasoline to meet US EPA regulations set to come into force in January 2011 The unit was commissioned in 2011 Fugitive Emissions Programs In 1993 the Irving Oil Refinery began an annual program aimed at reducing its contribution to ground-level ozone in keeping with the Code of Practice for the Measurement and Control of Fugitive VOC Emissions from Equipment Leaks October 1993 (7) established by the Canadian Council of Ministers of the Environment (CCME) This program is comprised of the detection and repair of leaks (fugitive emissions) from specific process components such as pump seals valves flanges vents connectors and compressor seals The detection component of the program began in 1993 The program was expanded to include the repair of leaking components in 1995 Where a repair cannot be made immediately it is scheduled for the next available maintenance turnaround In addition all Irving Oil Refining GP storage tanks are required to be maintained in accordance with the CCME Environmental Guidelines for Controlling Emissions of Volatile Organic Compounds from Aboveground Storage Tanks June 1995 (8) and the requirements of this guideline have been incorporated into an annual tank reliability program carried out by the refinery Since 1995 major improvements have been carried out on the wastewater treatment plant which have resulted in reductions of odorous emissions These include the segregation and redirection of odorous caustic streams for off-site treatment the reconditioning of the Sour Water Tank the treatment of the equalization pond and the dredging and disposal of sludge from the bottom of the effluent treatment ponds In addition following recommendations in the Odour Impact Study report further odour reduction techniques have been implemented (see section ldquoCompliance with the Approval to Operaterdquo for more details)
12
POTENTIAL AIR QUALITY CONTAMINANTS The refinery is situated in east Saint John and although it is in an industrial area there are several residential areas within close proximity Emissions from the refinery come from four main source areas
Sulphur Block (includes two Sulphur Recovery Units the Tail Gas Unit and the Sulphuric Acid Regeneration Unit) where although 99 percent of the sulphur fed to the units is recovered less than 1 percent is released to the atmosphere as sulphur dioxide as well as small amounts of nitrogen oxides particulate matter and carbon dioxide
Refinery Boilers and the No 3 Crude Unit fired heaters where fuel oil and gas combustion results in the emission of sulphur dioxide particulate matter nitrogen oxides carbon dioxide and small amounts of carbon monoxide and hydrocarbons
FCCU catalyst regenerator where sulphur dioxide particulate matter nitrogen oxides carbon dioxide and small amounts of carbon monoxide and hydrocarbons are emitted
FGS where nitrogen oxides particulate matter carbon dioxide and small amounts of sulphur dioxide and carbon monoxide are emitted
Fugitive emissions can also have an effect on local air quality POTENTIAL IMPACTS OF AIR EMISSIONS Acid Deposition Emissions of sulphur dioxide and nitrogen oxides can be transformed in the atmosphere to acidic particles which ultimately fallout as acid deposition (acid rain is one way in which this deposition occurs) This deposition can occur far from the original source of the emissions The majority of the acid deposition measured in New Brunswick is caused by emission sources in the US mid-west and central Canada Generally speaking acid deposition in New Brunswick has shown gradual improvement since 1990 through national and international efforts to reduce acid causing emissions primarily through controlling emissions of sulphur dioxide While some ecosystems have begun to show recovery from the effects of acid deposition the rate of progress is relatively slow and further reductions will be required in order to afford protection to the more sensitive receiving environments in New Brunswick eg water bodies in the south-western region of the province Climate Change When fossil fuels are burned it results in the generation of greenhouse gases (GHG) such as carbon dioxide (CO2) and methane (CH4) which are the main contributors to the problem of climate change Climate change (also referred to as global warming or the greenhouse effect) occurs as a result of industrial and natural pollutants trapping solar radiation and heat in the earths atmosphere resulting in a gradual warming of the planets atmosphere While natural variations in global atmospheric temperatures have occurred in past centuries it appears that the rate at which these temperatures are increasing (currently approximately 01degC per decade) may be higher than has historically been the case which may be partly due to a gradual increase in pollutant levels in the
13
atmosphere Left unabated climate change has the potential to cause serious ecological damage and significantly modify the Earths climates Ground-Level Ozone Ozone (O3) is a reactive unstable form of oxygen It is not emitted directly from stacks or exhaust pipes but it is formed as a result of photochemical reactions between other pollutants most importantly nitrogen oxides and volatile organic compounds (VOCs) such as solvent and gasoline vapours Both stationary and mobile emissions sources contribute precursor pollutants that have the potential to result in the formation of ground-level ozone It has been estimated that 85 percent of ground-level ozone enters this region from the North Eastern United States Central Canada and the American Mid-West (9) Elevated levels generally occur in the summer under very warm conditions when large stable air masses move up the eastern seaboard into the Fundy region Although the contribution of local sources may pose an added stress to already deteriorating air quality conditions during such episodes in general local sources are relatively minor contributors to ground-level ozone levels experienced in our region Control programs in New Brunswick specifically for ground-level ozone are therefore not able to reduce ambient concentrations appreciably Despite this all measures which can reduce the emission of ozone precursors are promoted such as the refinerys Fugitive Emissions Program Of particular interest are programs where multiple environmental benefits may be expected For example improving energy efficiency will reduce greenhouse gas emissions as well as nitrogen oxides and sulphur dioxide Therefore efficiency measures are favoured over measures exclusively targeting ground-level ozone AIR QUALITY COMPLIANCE AND ENFORCEMENT Compliance and Enforcement options used by the Department of Environment are outlined in the Departments Compliance and Enforcement Policy (10) These may include but are not limited to schedules of compliance warnings orders and prosecutions Although not specifically outlined in the Policy it is also possible to amend approvals with more stringent conditions both during its valid period or at the time of renewal to address specific compliance issues or to improve the environmental impact of the facility Most recently a new Regulation under the Clean Air Act allows for the issuance of administrative penalties for minor violations as an alternative to traditionally-used enforcement options All sources of air emissions in the province are required to comply with the Clean Air Act and Air Quality Regulation In addition to establishing ambient standards for contaminants in air Section 3 of the Air Quality Regulation requires that no person shall construct modify or operate a source without applying for and obtaining an approvalrdquo The refinery currently operates under Approval to Operate I-6672 issued March 31 2010 The current Approval expires on March 30 2015 Compliance with the Approval to Operate Following are the key issues addressed in the Approval to Operate for Irving Oil Refining GP
14
including comments on compliance with the associated conditions and actions taken to achieve compliance with these conditions A summary of the key conditions are in italics Emergency Response and Reporting Notify the Department immediately (or the Coast Guard if not during business hours) following an environmental emergency and provide a written report within five business days of the incident The refinery continues to notify the Department of all environmental emergency incidents following the emergency response conditions in the approval Environmental incidents of a non-emergency status are reported to the Department via fax Irving Oil received one warning letter regarding emergency response and reporting On May 16 2012 a trip in Plant 143 produced elevated sulphur dioxide concentrations which exceeded the ambient air quality limits at the Forest Hills station The environmental emergency reporting procedure was not followed as per the Approval This was addressed and there have been no re-occurrences Provide the Department with training on the IOL Environmental Emergency Response Plan This training was conducted on May 25th 2011 at the refinery and several members of both the central office and Saint John Regional Office of the Department participated Total Reduced Sulphur (TRS) Reduced sulphur compounds are highly malodorous In an effort to better understand the odours associated with the refinery a TRS monitor was installed by the Department on a temporary basis at the Champlain Heights School in 2004 Due to concerns about odours from the refinery affecting neighbours Irving (through amendment No 5 to their current approval) was required to install a replacement permanent TRS monitor at the Champlain Heights School monitoring station and also one at the Forest Hills and Midwood Avenue ambient monitoring stations Historically the TRS measurements at Champlain Heights were compared to ambient standards for hydrogen sulphide a component of TRS because there are no ambient standards in New Brunswick for TRS Therefore when the Approval was amended in July 2007 to require additional monitoring TRS ambient limits were also included based on new standards being proposed in Ontario (11) Three permanent ambient monitoring stations collect TRS data Champlain Heights Midwood Avenue and Forest Hills Limit ambient total reduced sulphur concentrations to 13 μgm3 (9 ppb) as a 10 minute average and 7 μgm3 (5 ppb) as a 24 hour average Generally there are very few issues with TRS at the monitoring stations although there were a few exceedances during the lifetime of the Approval
15
Table 1 Exceedances of 10 minute average for TRS East Saint John
Midwood Avenue
Champlain Heights
Forest Hills
2009 2 1 0
2010 0 0 0
2011 0 0 0
2012 3 4 0
2013 0 0 0
In 2012 an issue with the seals of Tank 103 caused the TRS exceedances in November and December of 2012 The Tank was taken out of service for repairs Install a replacement ambient TRS monitor at the Champlain Heights ambient monitoring station by September 30 2010 The replacement TRS monitor was installed in 2010 as required The Refinery shall ensure that the sour-gas-to-sweet-gas by-pass valve remains closed and secured The valve is not capable of opening It is locked with a numbered tag Operate and maintain the TRS monitor at the Midwood Avenue monitoring station and provide the refinery and the Department with real-time access to the information gathered by this monitor Operate and maintain the appropriate hardware to provide the Facility with access to the data at the two Department ambient TRS monitors The refinery remains in compliance Sulphur Dioxide (SO2) Limit annual emissions of sulphur dioxide to 5400 tonnes per calendar year and 30 day rolling average emissions to 175 tonnes per day The refinery consistently has been below these limits during the period of the approval (see Table 2 for a summary of annual emissions) Over the past five years average annual emissions of sulphur dioxide have remained well below the limit with the operation of the HATGU system
16
Table 2 Annual SO2 Emissions
SO2 2009 2010 2011 2012 2013 Average
Flue Gas Scrubber 91 60 86 92 113 88
FCCU 713 452 617 740 718 648
Sulphur Block 635 374 298 471 404 436
Boilers HRSGs and Process Heaters 57 22 99 24 15 43
Flares 36 23 90 3 10 32
Total SO2 Emissions (tonnesyear) 1533 930 1190 1330 1260 1249
Prior to 2000 the Irving Oil refinery had an annual sulphur dioxide emissions cap of 9500 tonnes In the EIA for the Refinery Upgrade Project Irving Oil Refining GP proposed a reduction in the annual sulphur dioxide cap to 8000 tonnes This cap was included in their Approval to Operate issued in October 2000 and the cap was reduced again to 7200 tonnes when the Approval was renewed in 2005 The emissions cap was reduced again in 2010 to 5400 tonnes of sulphur dioxide per year Sulphur dioxide emissions from the refinery have typically been stable and consistent as shown in Figure 1 2009 emissions are higher due to the commissioning operations of the new tail gas unit 2010 emissions were lower due to a 6 week turn around period unplanned outages that affected higher SO2 emitting units Initially following the upgrade overall facility emissions of Sulphur Dioxide (SO2) decreased to levels below those predicted in the EIA Registration however in December 2002 there was a failure in the Sulphuric Acid Tail Gas Unit (SATGU) due to overheating This resulted in emissions returning to pre-upgrade levels Through 2003 2004 and 2005 Irving worked to bring SO2 emissions to levels expected under the refinery upgrade project Despite achieving facility-wide SO2 emission reductions that are in line with overall projections emissions from the Sulphur Block were not reduced by the projected 70 For this reason and continued exceedances of the ambient objective at the Grandview West 1 monitoring site Irving was required in May 2005 to propose a solution The proposed solution was the construction and commissioning of a Hydrogenation Amine Tail Gas Unit (HATGU) Irving Oil registered and received a Determination under the EIA Regulation to install the HATGU This unit is designed to reduce emissions from the Sulphur Block to less than 3000 kilograms per day This represents a 70 reduction from the approved emission limits for the Sulphur Block at that time
17
The new tail gas unit (HATGU) has been in operation since June 2008 Annual SO2 emissions are shown in Figure 2 below
Figure 2 Annual Sulphur Dioxide Emissions Operate and maintain four sulphur dioxide ambient monitors in the east Saint John area and provide the refinery and the Department with real-time access to the information gathered by these monitors Operate and maintain the appropriate hardware to provide the Facility with access to the data at the two Department ambient SO2 monitors As a condition of the air quality approval to operate Irving Oil Refining GP is required to operate and maintain four ambient sulphur dioxide monitoring stations in east Saint John These are located north of the refinery at the Silver Falls Irving to the south-south east at the Irving Forest Products site in the Grandview Industrial Park to the south at the blower building for the Irving Paper lagoon (known as Grandview West 1) and on Midwood Avenue The Department also operates sulphur dioxide monitors in Forest Hills and Champlain Heights subdivisions Until February 2003 Irving Oil operated a sulphur dioxide monitoring station at the Three Mile Irving at the corner of McAllister Drive and Rothesay Avenue However this monitor had historically recorded low levels and was not providing any benefit in terms of episode control The Department and the refinery both have rapid access to the information collected at the six monitoring stations SO2 emissions from the refinery must be limited such that the maximum ground level concentrations listed in Schedule B and C of the AQR are not exceeded The refinery is one of several significant sources of sulphur dioxide in the Saint John region and elevated ambient concentrations of sulphur dioxide may result from emissions from any or all of these sources Therefore while there have been exceedances of ambient air quality standards in east Saint John in the past the causes of the exceedances could not necessarily be attributed to one source An exception exists with the measurements taken at the Grandview West 1 site where exceedances have almost exclusively been associated with winds from a northerly direction This
18
strongly suggests that emissions from Irving Oil are associated with the exceedances Examinations of the data conducted by both the Department and Irving Oil have determined that the likely sources within the refinery are the stacks associated with the Sulphur Block process units The exceedances at the Grandview West 1 monitoring station have decreased substantially over the past five years The exceedances of the sulphur dioxide ambient objectives at various monitoring locations in East Saint John are shown in Table 3 Exceedances have decreased dramatically since the installation of the HATGU and there have been only a few exceedances throughout the lifetime of the Approval Table 3 Exceedances of Maximum Permissible Ground Level Concentrations (Provincial Objectives) for SO2 East Saint John
Midwood Avenue
Champlain Heights
Grandview West 1
Forest Hills Forest Products
Silver Falls
1-HR OBJECTIVE
2009 0 0 3 0 0 0
2010 0 0 3 1 0 0
2011 0 0 3 0 0 0
2012 0 0 1 3 0 0
2013 0 0 0 0 0 0
24-HR OBJECTIVE
2009 0 0 0 0 0 0
2010 0 0 0 0 0 0
2011 0 0 0 0 0 0
2012 0 0 0 0 0 0
2013 0 0 0 0 0 0
Implement the Sulphur Dioxide Response Plan as required The refinery continues to implement the Sulphur Dioxide Response Plan when necessary Sulphur dioxide concentrations are monitored 24 hours a day by operators within the Refinery Control Centre If sulphur dioxide levels rise beyond pre-set limits at any one of the six monitors the refinery takes action to reduce sulphur dioxide emissions in an effort to prevent exceedances of the regulated standards The information received at the refinery consists of instantaneous sulphur dioxide concentrations 5 minute rolling averages and hourly and 24 hour sulphur dioxide averages Limit total daily sulphur dioxide emissions from the Sulphur Block to 4000 kgsday on an annual average The refinery has been in compliance with these limits throughout the lifetime of the Approval Continuously monitor emissions of SO2 from the SRUs FGS SARU TGU and HRSGs CEMs are installed and operated as required
19
Nitrogen Oxides (NOx) Nitrogen oxide emission estimates show a decreasing trend from 2009 to 2010 and have remained fairly steady since then (see Table 4 for details) In 2010 the accuracy in the methods used to determine the numbers was improved The USEPA emission factors were updated to reflect 2008 data and CEM data was used for various stacks that previously used emission factors In 2012 a new platforming catalyst in the FCCU that aide in the reduction of NOx emissions was used Nitrogen oxide emissions reported by the refinery are based on a variety of sources including stack tests mass and energy balances US EPA emission factors and design data The refinery has NOx CEMs on the FGS TGU SARU and HRSGs Over the past five years emissions have averaged approximately 3141 tonnes per year Table 4 Annual NOx Emissions
NOx 2009 2010 2011 2012 2013 Average
Flue Gas Scrubber 1586 1126 1008 936 1007 1133
FCCU 78 59 30 30 28 45
Sulphur Block 17 10 11 10 9 11
Boilers HRSGs and Process Heaters 2162 1742 1991 1835 1785 1903
Flares 49 48 50 48 48 49
Total NOx Emissions (tonnesyear) 3892 2985 3091 2859 2877 3141
Develop a Plan to reduce emissions of Nitrogen Oxides (NOx) A Nitrogen Oxides Reduction Report was submitted to the Department in 2010 Irving Oil updated the estimations of NOx emissions from the Facility and identified work that had been done to reduce NOx emissions over the last five years Irving has committed to better quantifying NOx emissions and comparing the emissions to the NFPRER benchmarks for consideration for further study Operate and maintain one ambient NOx monitor in the east Saint John area and provide the refinery and the Department with real-time access to the information gathered by this monitors In east Saint John there are currently three monitors that measure concentrations of nitric oxide and nitrogen dioxide One has been operated at the Forest Hills National Air Pollution Surveillance Network (NAPS) site for at least twenty years Two more have been added as a result of EIA Regulation reviews on new projects The Champlain Heights School monitor was installed as a requirement of the EIA Determination on the Bayside Power Project and the Mill Pond monitor (same general location as the Grandview West 1 site but housed in a building at ground level) was installed as a requirement of the EIA Determination on the Grandview Cogeneration Project These sites became operational in 2002 and 2004 respectively Continuously monitor emissions of NOx from the FGS SARU TGU and HRSGs CEMs are installed and operated as required
20
Particulate Matter (PM) Particulate matter emissions from the refinery are measured in two ways material balances on the catalyst being used in the FCCU and periodic stack tests Fuel combustion the FCCU catalyst regenerator stack and the FGS are the major sources of particulate matter emissions from the refinery Efforts to reduce emissions from the FCCU improvements in energy efficiency and the use of lower sulphur fuels have contributed to reductions in particulate matter emissions since 1993 The estimated particulate emissions over the last five years are 361 tonnes per year as outlined in Table 5 In 2011 additional source testing on the Fluid Catalytic Cracking Unit (FCCU) was completed to assess the accuracy of particulate emission calculations on this unit After the review it was determined that the National Framework Petroleum Emissions Reduction recommended method demonstrated fairly consistent results compared to the source testing although it is still an estimated value due to the high level of error and variabilities Table 5 Annual PM Emissions
PM 2009 2010 2011 2012 2013 Average
Flue Gas Scrubber 161 152 146 137 139 147
FCCU 92 98 126 94 92 100
Sulphur Block 0 0 0 0 0 0
Boilers HRSGs and Process Heaters 138 97 109 122 101 113
Flares 0 0 0 0 0 0
Total PM Emissions (tonnesyear) 391 347 381 353 332 361
Total Suspended Particulate (TSP) Matter was measured at the Forest Hills site until 1997 The TSP which measures total particulate as captured on a filter every sixth day was replaced with continuous monitoring beginning in 1996 Research into the health effects of particulate has lead jurisdictions to focus on finer particulate fractions of PM10 (inhalable particulate defined as particulate having an average diameter of less than 10 microns) and PM25 (respirable particulate which has an average diameter of less than 25 microns and which can enter deeply into the lungs) The continuous monitors operated at the Forest Hills site are of the TEOM design (Tapered Element Oscillating Microbalance) These units are capable of measuring particulate on a real time basis and therefore provide a much more comprehensive history of the particulate concentrations in the ambient environment As a result of the Refinery Upgrade Project Irving Oil Refining GP was initially required to install two TSP monitors Given that the particulate matter that was projected to be released from the upgraded facility was fine ie PM25 the requirement was adjusted to require Irving Oil to install one PM25 monitor This monitor was installed at the Champlain Heights School monitoring site in 2001 The technology used in this monitor is called BAM for Beta Attenuated Monitor which uses a filter tape to continuously capture particulate This technology was at the time gaining wider use in the US Since then additional BAM25 monitors have been installed both in the US and Canada In 2004 a BAM25 monitor was also placed at the Forest Hills monitoring site
21
Operate and maintain one ambient PM25 monitor at the Champlain Heights monitoring station and provide the refinery and the Department with real-time access to the information gathered by this monitor The monitor is installed and operated as required Maintain particulate matter emissions from the existing cat cracker within a 12-month rolling average limit of 300 kilograms per day during normal operation Particulate emissions in the FCCU remain fairly consistent during normal operations but there have been a few upset conditions during the lifetime of the Approval Most notably in August of 2010 during a five day period where approximately 285 tonnes of catalyst was emitted and particulate was deposited on neighbourhood houses vehicles and lawns In June 2013 an upset emitted 6 to 10 Tonnes of catalyst In 2011 there were higher than normal particulate matter emissions from the FCCU compared to the other 4 years Mechanical issues which included a hole in the west hopper as well as a catalyst release from a pressure build up in the dump line attributed to high particulate in January and again in August there were mechanical issues that increased particulate Following an audit of the Approval in 2013 Irving updated the Environmental Incident Reporting EMSI to include immediate notifications of any maintenance or shut down of the FCCU to be sent as noteworthy events in the chance an upset condition may occur during shut down or start up The FCCU is an older piece of equipment and it is necessary to do repairs and replace parts during turnarounds Operate the Flue Gas Scrubber so that an emission rate of 50 mgNm3 particulate matter on a dry basis is achieved Annual performance tests conducted on the Flue Gas Scrubber indicate that particulate emissions are below the target emission rate Volatile Organic Compounds (VOCs) Concentrations of volatile organic compounds have been measured at Forest Hills since 1992 In support of the process to validate the assumptions made in the Public Health Risk Assessment for the Refinery Upgrade Project VOC measurements started at the Champlain Heights School monitoring site in 2000 A third site was operated at Point Lepreau from 1992 until early 2009 a rural location upwind of the Saint John area The routine analysis provides results for over 150 different VOCs The measured VOC levels are well below standards applied in other jurisdictions A summary of annual VOC emissions over the past five years is provided in Table 6 below Fugitive emissions are higher in 2013 due to an unplanned shutdown of the RFCCU which made the leaking components in this area inaccessible The fugitive emissions in 2011 were also high as
22
compared to the average as a larger number of components requiring repairs were designated Turnaround or Shutdown work and could not be completed during the program year They were completed the following year as can be seen in the low emissions in 2012 Tank farm emissions continue to see a decline due in part by the Annual Tank Inspection and Repair Program The Fuel Distribution emissions saw a significant decrease in emissions following a third party study in 2011 conducted at the Gasoline Loading Rack to determine actual VOC emission rates during the loading process The study concluded that the actual emissions were much lower than the USEPA emission factors previously used Stack emissions and flare emissions show a reduction from 2009 to 2010 forward due to the removal of methane and ethane from VOC calculations Methane and ethane are not considered VOCs under the national Pollutant Release Inventory therefore not included in the reporting of total VOCs There has also been an initiative by the refinery to reduce the amount of gas flared since 2011 Table 6 Annual VOC Emissions
VOCs 2009 2010 2011 2012 2013 Average
Fugitive Emissions 65 68 107 55 100 79
Tank Farm 117 136 126 99 93 114
Fuel Distribution 493 506 75 74 74 244
Stack Emissions 95 78 78 72 70 79
Spills 0 0 2 2 2 12
Flares 172 77 67 66 61 89
Wastewater Treatment 33 32 35 35 36 34
Total VOC Emissions 976 897 490 405 435 641
Continue to implement the Fugitive VOC Emissions Measurement and Reductions Program in accordance with the CCME code of practice ldquoEnvironmental Code of Practice for the Measurement and Control of Fugitive Emissions from Equipment Leaksrdquo Irving Oil continues to conduct a leak detection and repair program in accordance with the CCME Code of Practice and provides the Department with annual updates as required All process units are now subject to the program In excess of 16000 components are tested annually and leaks repaired where required Information provided to the Department under the refinerys Fugitive Emissions Program indicate that an annual reduction of fugitive emissions of VOCs from leaking components have ranged from 26 to 45 from 2009 to 2013 The program provides a mechanism to control fugitive emissions on an annual basis These reductions are not cumulative Rather they represent the average reductions that have been made annually as a result of implementation of the Leak Detection and Repair Program which is in effect a maintenance activity designed to limit fugitive emissions
23
Maintain tanks storing volatile organic compounds in accordance with CCME guidelines Environmental Guidelines for Controlling Emissions of Volatile Organic Compounds from Aboveground Storage Tanks June 1995 The refinery continues to perform tank inspection maintenance and repair under their tank upgrade program Irving Oil operates a Storage Tank Maintenance and Inspection Program which incorporates the requirements of the Canadian Council of Ministers of the Environment (CCME) Environmental Guidelines for Controlling Emissions of Volatile Organic Compounds from Aboveground Storage Tanks Emissions reported to the Department from this source have averaged approximately 114 from 2009 to 2013 reduced from 143 tonnes per year from 2004 to 2008 Submit an implementation plan to reduce VOC emissions from the refinery Irving hired a consultant AMEC to undertake a VOC measurement program at their truck loading rack which was originally thought to be a significant source of VOCs The results of the study showed that the emissions from the loading rack were not as high as emission factors would suggest Odours Prepare a Plan concerning future activities with respect to assessment and mitigation of odourous emissions in light of the results of the Odour Impact Study An Odour Impact Assessment Follow-Up Study was completed by Odotech in December 2010 which included a validation of the predications in the 2006 Study a mitigation measures update additional odour emission mitigation measurement and recommendations and continuous improvement to odour mitigation and monitoring techniques A significant reduction in odours occurred from 2006 to 2010 due to several mitigation measures that the refinery implemented based on the study results The SRU and SARU stacks which were the most odourous in the 2006 study were significantly reduced in odour concentrations Odours continue to be studied and improvements are made Tours to monitor odours and other ambient conditions are conducted daily by members of the refinery Environmental Group and as required by the Industrial Security departments Odours from the tank farm have continued to decrease as well with estimated VOC emissions decreasing from 117 Tonnes in 2009 to 92 Tonnes in 2013 Tank Odours The Refinery Tank Odour Impact Assessment Study was submitted in Fall 2010 The report demonstrated that Irving Oil has sufficiently evaluated tank odour emissions around the tank farm and implemented odour mitigation measures The improvements in tank odour mitigations which in turn has decreased VOCs over the last five years are considerable
24
Irving requested to conclude the annual submission of the Investigation of Odour Mitigation from the tank farm as required by Conditions 56 amp 76 This was approved as the Tank Odour Abatement Program and Tank Life Extension Program sufficiently assesses tank farm odours each year There is still a requirement for the submittal of the Tank Repair Program report The report estimates total annual emissions of VOCs from the tank field as well as summarizes tank details and which tanks are receiving repairs each year VOC and OCT Control Study Study the issue of VOC and organic compound toxic (OCT) emissions detection measurement mitigation and reporting A report that reviewed the current state of the art and applicability of new techniques to VOC and OCT control at the Facility was submitted The current methods of detecting and measuring VOCs and OCTs were considered satisfactory by the Department It was recommended that new and improved control measures and testing methods should be reviewed periodically to ensure continuous improvements of emission reductions and measurements Cooling Tower Study Investigate and quantify the emissions that would be expected to come from the cooling towers in operation at the Facility A study was completed by Irving that applied chemical balances of the cooling water feed and return destinations to determine if contaminants are potentially emitted into the air The study included an assessment of mercury total suspended solids petroleum hydrocarbons and total metals Mercury levels in the supply and return water were well below the maximum acceptable exposure limit which indicates minimal environmental impacts Particulate emissions from wet cooling towers can be calculated using a National Pollutant Release Inventory (NPRI) calculation for Total Suspended Solids Both the calculated value and the chemical balance value were well below the levels required for reporting under the NPRI Volatile Organic Compound emissions (VOCs) from the cooling towers are considered negligible as there were no indications of petroleum hydrocarbon contamination The study demonstrated that the cooling water towers pose a minimal environmental risk with respect to metal or trace metal emissions Emissions from the cooling towers are in the form of PM10 and drift droplets that contribute a minimal percentage to overall losses
25
Noise All activities at the facility related to the maintenance decommissioning construction and commissioning of any units are carried out in a manner to remain under these noise levels at the nearest receptor Time 90th Percentile Noise Limit 700 ndash 2300 55 2300 ndash 700 50 Ensure that maintenance decommissioning construction andor decommissioning activities which are known or suspected to be noisy shall be limited to the hours between 700 and 2300 Monday to Saturday Advance notification of 2 days is required if not within these hours During periods when noisy activities are conducted ensure that the noise levels at the locations close to property boundary with residential properties are monitored periodically The results of the noise monitoring shall be complied within an Excel spreadsheet and provided to the Department within 30 days of the end of the month in which monitoring was conducted Conduct a sound survey at receptors in residential neighbourhoods around the refinery The refinery conducted a sound survey and submitted two reports to the Department outlining the details The study identified specific process units as possible noise sources and as a result several silencers were installed Ongoing noise measurements are taken in response to concern calls and typically measured levels are low Public Health Risk Assessment Validation Participate in a process to validate the assumptions in the Public Health Risk Assessment Provide a plan if the assumptions in the PHRA were not valid and if there are measurable negative health outcomes As a condition of the EIA Determination a Public Health Risk Assessment (PHRA) on the refinery upgrade project was commissioned in 1998 by the Department of Health The purpose of the PHRA was to provide an evaluation of the potential effects of the refinery upgrade on the health status of the people living in Saint John The study focused specifically on the changes associated with the refinery upgrade project The PHRA was not designed to evaluate the health effects relating to past or current air quality in Saint John A Public Health Risk Assessment is a scientific study using the best available biological medical and environmental science of the possible risks to human health resulting from exposure to specific chemicals present in the environment In the case of the refinery upgrade project the study was to evaluate the change in health impacts associated with the upgrade Potential risks are put into
26
perspective by comparing the public health status of the community being evaluated to the health status of other similar communities The PHRA of the Irving Oil Refinery Upgrade (13) consisted of two main components a health risk assessment component and a public health assessment component The health risk assessment component involved several steps These included the
identification and selection of chemicals of potential concern (COPCs) and potentially associated with Refinery Upgrade Project emissions
identification of the characteristics of the people in the community who would have both the greatest potential exposure and the greatest sensitivity to these COPCs
identification of scenarios routes and pathways of exposure by which representative community receptors would contact the COPCs and
identification of the potential hazards that could result from exposure to the selected COPCs and identification of concentrations of COPCs that would not result in adverse health effects
The public health assessment component involved the identification of risks and public health concerns and a prediction of the change in public health status The conclusion of the Public Health Risk Assessment was that no measurable adverse health outcomes would be expected in the community related to the Refinery Upgrade Project An addendum to the final PHRA report recommended that the assumptions used in the report should be validated When the refinery Air Quality Approval was renewed in 2005 a condition was included requiring that the original PHRA study undergo a validation process by September 30 2006 The validation was to be carried out by a qualified consultant under the direction of the Department of Health In the interest of co-ordinating completion of the Validation Project a Steering Committee was formed that included government industry and community member representatives The committee was co-chaired by the Department of Health and the Department of Environment Following a tendering process AMEC was hired as the consultant and the first meeting of the committee was held on May 30 2006 To allow the consultant adequate time the deadline for completion of the Validation Project was extended to March 31 2008 via an Approval amendment The final Public Health Risk Assessment Validation report was received by the Department of Health on March 31st and released to the public in June 2008 following receipt of the translated version from the consultant (14) The overall conclusion of the report was that the predictions of air quality changes used in the original PHRA were generally conservative therefore were suitable for assessment of health risk More specifically the conclusions outlined in the validation report are as follows
Emissions from the refinery have been equivalent to or lower than those predicted in the original PHRA with the exception of Sulphur Dioxide (SO2) emissions and Nitrogen Oxide (NOx) emissions
27
SO2 emissions did not decrease by the projected amount (the projected decrease was 29 the actual decrease was 18) The Hydrogenation Amine Tail Gas Unit (HATGU) project appears to have resolved this issue
NOx emissions increased more than the projected amount (projected increase was 29 actual increase was 36) The NOx emissions are currently being decreased by the installation of low-NOx burners as burners are replaced
Measurements of pollutants in the ambient air surrounding the refinery have not shown consistent trends
Risk assessment conducted for VOCs in ambient air around the refinery since the upgrade confirmed that residents of Forest Hills and Champlain Heights would not be exposed to unacceptable non-carcinogenic or carcinogenic risks from chronic VOC exposure
Risk of MTBE exposure assessed in original PHRA is no longer a concern as the refinery does not use or store MTBE on-site
IOL communication program is adequate as demonstrated by positive feedback during a study conducted by the validation team
National Framework for Petroleum Refinery Emission Reductions (NFPRER) Over the 2002 to 2004 period a multi-stakeholder Steering Committee co-chaired by Environment Canada and Alberta Environment oversaw the development of a Refinery Framework a CCME initiative that is aimed at providing a national approach to reducing air emissions from all facility sources within the petroleum refining sector in Canada The Framework contains a methodology to assist jurisdictions with prioritizing and setting facility-wide refinery emission caps (15) The methodology includes benchmarking analysis health prioritization analysis and an illustrative guide to assist jurisdictions with using the Refinery Framework Also included is a strategy to monitor and report on refinery emissions and reductions and a ten year plan to keep the Refinery Framework tools updated measure performance of the Refinery Framework and report on progress Comparison of emissions from Canadian refineries against US refinery emission benchmarks forms the basis for current and future actions required over the ten year period The Framework does not preclude jurisdictions from continuing to implement emission controls that are more stringent than the requirements of the Framework Provide the results of comparisons of the most recent three years of Facility emissions data reported under the National Pollutant Release Inventory to the Benchmarks as well as the calculations using HEIDI II following the years in which the US Benchmarks were available and approved by NFPRER The Report was submitted using 2007 2008 and 2009 data NFPRER analysis using the official 1999 US Refinery data showed no serious Emissions Reduction Strategy or Emissions Management Strategy triggers but did show one EMS trigger for 2008 for NOx Reports Provide monthly and annual reports within 30 days of the end of each month and by February 28th of each year respectively Other reports were due on dates specified in respective Approval conditions
28
Irving Oil has been in compliance with report submission requirements Conduct performance tests and provide reports as required by conditions in the Approval as follows
Establish operating range of CEMs for SO2 and NOx to be installed on FGS Measure PAH emissions from the FGS Determine emission rates and concentrations of (PM SO2 NOx CO CO2) from FGS SRUs
and SARU and determine how they compared to projected emissions and removal efficiencies
Measure emissions (SO2 NOx CO THC CO2 PM Metals) from major units including FGS FCCU SRUs SARU and the CU No 3
Irving Oil has conducted performance tests each year of the current approval The boilers as well as 3 Crude furnaces (atmos and vac) are no longer tested as only fuel gas is used and the emissions remain consistent Enforcement Irving Oil received one warning letter regarding emergency response and reporting On May 16 2012 a trip in Plant 143 produced elevated sulphur dioxide concentrations which exceeded the ambient air quality limits at the Forest Hills station The environmental emergency reporting procedure was not followed as per the Approval This was addressed and there have been no re-occurrences PUBLIC OUTREACH Call Monitoring The Irving Oil Refinery receives calls related to air quality noise and other issues in east Saint John The refinery has a call response procedure that must be followed by the person who receives the information All calls are investigated and response is provided to those callers who identify themselves Table 7 shows the number of calls received by the refinery in the last five years Table 7 Concern calls received directly by the refinery
Year Odour Noise Misc PM Total
2009 83 56 13 3 155
2010 95 22 1 27 145
2011 69 19 19 8 115
2012 102 14 8 17 141
2013 87 8 11 39 145
29
Community Outreach Anew employee was hired to concentrate on community concerns and the operation of new odour monitoring software being implemented within the refinery The Environment Community Coordinator manages incoming concern calls and ensures a resolution to the concern if possible and if the concern is refinery-related by working with operations technical personnel and refinery area teams Also new odour monitoring software is being used to be as proactive as possible to odour issues that may arise This software is still being developed and fine-tuned to refinery operations Community Liaison Committee The Irving Oil Community Liaison Committee was formed in 1998 as a requirement of the Environmental Impact Assessment Determination on the refinery Upgrade Project The purpose of the committee was to liaise with stakeholders on issues associated with the Refinery Upgrade Project The committee made up of neighbours government representatives and employee team members continues to operate even though the Upgrade Project has been completed The Community Liaison Committee meets quarterly to discuss new projects and review developments on the refineryrsquos safety and environmental performance In 2013 the Department received a request from Irving Oil Refining GP (Irving Oil) for Canaport Mispec related topics raised at the Canaport Community Environmental Liaison Committee (CCELC) be handled at the Irving Oil Refinery Community Liaison Committee This was agreed and issues related to Canaport Mispec are handled at the Irving Oil Refinery Community Liaison Committee as a means to discuss complaints and provide information on the Irving Oil Facility Neighbourhood Tours The daily neighbourhood tour conducted by the refinery is now using a new hybrid car selected for its environmental efficiency Members of the environment group tour neighbourhoods daily in the car to identify noise or odours that may be coming from the refinery If an odour or noise is detected the refinery is inspected for potential sources and solutions The daily tour includes 17 test points including Loch Lomond Road Forest Hills Church Creighton Avenue and four locations along Grandview Avenue This route represents a complete loop around the refinery Letters to their Neighbours Irving Oil keeps neighbours informed of events occurring at the refinery through letters that our either mailed or hand delivered to nearby homes Topics discussed in these letters include maintenance turnarounds community events (such as the Household Hazardous Waste Collection Day) and results of studies recently conducted at the facility such as the Odour Impact Study Typically between 5 and 10 letters are distributed every year Open House amp Neighbour Day Every year the refinery hosts an Open House to invite neighbours to learn about environmental safety and community relations initiatives underway at the refinery Historically the Open Houses
30
were held during a weekday evening however beginning in 2007 Irving decided to hold them on a Saturday afternoon to make it more of a family oriented event which has proven to be very successful The event features informative displays a barbeque lunch childrenrsquos entertainment and refinery bus tours In 2008 the event was attended by over 500 neighbours Neighbourly News (formerly Community Connections) In 2003 the refinery developed Community Connections a quarterly newsletter from the Irving Oil Refinery that is delivered to approximately six thousand residents around the Refinery Starting with the last issue of 2007 the name of the newsletter was changed to ldquoNeighbourly Newsrdquo This newsletter serves as a link between the refinery and the neighbours to keep them up-to-date on the refinerys activities as well as their environmental initiatives The issues have included articles on the new tail gas unit the wastewater treatment area and the fugitive emissions program New sections were added in 2007 to create more communication with their neighbours One of these includes an ldquoAsk Usrdquo section where neighbours can submit a question about the refinery and have it answered in the next newsletter CONTACTS For further information on the operation of the Irving Oil Refining GP refinery please contact Robyn McMullen Environment Manager Irving Oil Refining GP PO Box 1260 Saint John New Brunswick E2L 4H6 Telephone (506) 202-2361 Fax (506) 202-4050 E-mail RobynMcMullenirvingoilcom Principal Contact Saint John Region Patrick Stull Regional Director Region 4 Office Program Operations and Enforcement Branch NB Department of Environment amp Local Government 8 Castle Street PO Box 5001 Saint John New Brunswick E2L 4Y9 Telephone (506) 658-2558 Fax (506) 658-3046 E-mail PatrickStullgnbca
31
For further information on this document or on environmental regulations relating to air quality please contact Sheryl Johnstone Industrial Approvals Engineer Impact Management Branch New Brunswick Department of Environment amp Local Government PO Box 6000 20 McGloin St Fredericton New Brunswick E3B 5H1 Telephone (506) 444-4599 Fax (506) 457-7805 E-mail SherylJohnstonegnbca For comments or enquiries on the public participation process please contact Chandra Clowater Public Participation Officer Education amp Engagement Branch New Brunswick Department of Environment amp Local Government PO Box 6000 20 McGloin St Fredericton New Brunswick E3B 5H1 Telephone (506) 453-3700 Fax (506) 453-3843 E-mail ChandraClowatergnbca Department of Environment and Local Government website wwwgnbcaenvironment
32
REFERENCES
1 Irving Oil Refining GP Application to Register the Irving Oil Refinery Upgrade Project March 25 1998
2 New Brunswick Department of Environment Certificate of Determination issued to Irving Oil Refining GP Refining Division for Petroleum Refinery Upgrade August 13 1998
3 Government of Canada Diesel Fuel Regulations Canadian Environmental Protection Act February 1997
4 Government of Canada Benzene in Gasoline Regulations Canadian Environmental Protection Act November 1997
5 Government of Canada Sulphur in Gasoline Regulations Canadian Environmental Protection Act June 1999
6 Government of Canada Sulphur in Diesel Fuel Regulations Canadian Environmental Protection Act July 2002
7 CCME Code of Practice for the Measurement and Control of Fugitive VOC Emissions from Equipment Leaks CCME-EPC-73E October 1993
8 CCME Environmental Guidelines for Controlling Emissions of Volatile Organic Compounds From Aboveground Storage Tanks CCME-EPC-87E June 1995
9 Dann T Summers P (Editors) Ground-Level Ozone and its Precursors 1980 - 1993 Report of the Data Analysis Working Group on Canadian 1996 NOxVOC Science Assessment February 1997
10 New Brunswick Environment Compliance and Enforcement Policy December 1994 11 Ontario Ministry of the Environment Summary of Standards and Guidelines to Support
Ontario Regulation 419 Air Pollution ndash Local Air Quality February 2008 12 Irving Oil Limited Refinery Odour Impact Study ndash Final Version Prepared for Irving Oil
Limited by Odotech Inc December 2007 13 New Brunswick Department of Health and Community Services Public Health Risk
Assessment of the Irving Oil Refinery Upgrade Final Technical Document Prepared for the Department of Health and Community Services by Cantox Environmental Inc December 1999
14 New Brunswick Department of Health Validation of the Public Health Risk Assessment for the Irving Oil Refinery Upgrade Prepared for the Department of Health by AMEC Earth amp Environmental March 2008
15 CCME National Framework for Petroleum Refinery Emission Reductions PN 1338 May 2005
Additional reference information may be found at the following Canadian Industrial Energy End-Use Data and Analysis Centre httpwwwcieedacsfuca National Pollutant Release Inventory httpwwwecgccapdbnpriindexhtml Greenhouse Gas Registry httpwwwghgregistriescaindex_ecfm
33
GLOSSARY Aromatics organic compounds containing at least one ring of 6 carbon atoms and 6 hydrogen atoms Decant Oil the highest boiling product produced by a fluid catalytic cracking unit after fractionation Gas Oil a petroleum distillate with a boiling range between those of DIESEL and ATMOSPHERIC TOWER residue Liquefied Petroleum Gas light hydrocarbon material gaseous at atmospheric temperature held in a liquid state by pressure to facilitate storage transport and handling Commercial liquefied gas consists essentially of propane butane or mixtures thereof Nameplate capacity when applied to a refinery it is the nominal design crude oil processing capacity of a refinery normally expressed in barrels of crude oil per day Olefin (alkene) Any of a series of aliphatic (open chain structure) unsaturated hydrocarbons containing a double bond and having the general formula CnH2n including ethylene and propylene Octane (number) a measure of the anti-knocking value of gasoline Refinery Fuel Gas (Sweet Gas) A by-product mixture of gaseous hydrocarbons having low sulphur content and that is used in a refinery for product heating purposes Residuum a residual product as from the distillation of petroleum Sour Gas A by-product mixture of gaseous hydrocarbons that contains hydrogen sulphide Sour Water process water that has been contaminated with hydrogen sulphide and ammonia compounds
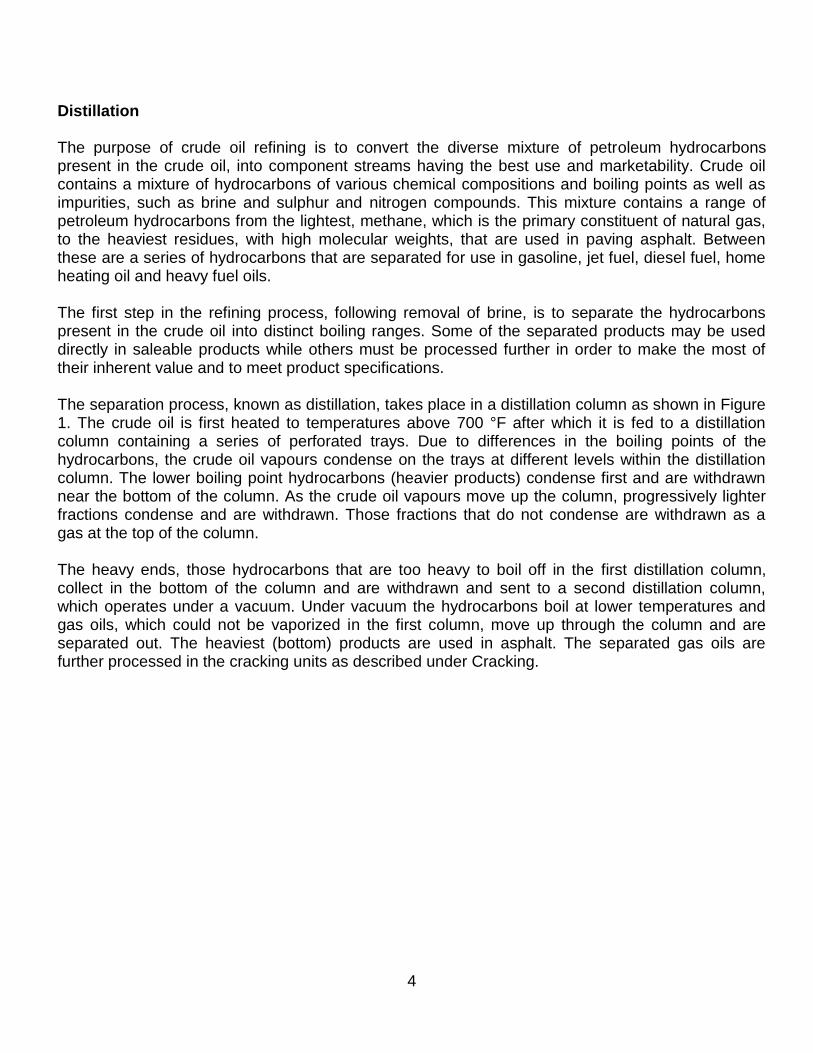
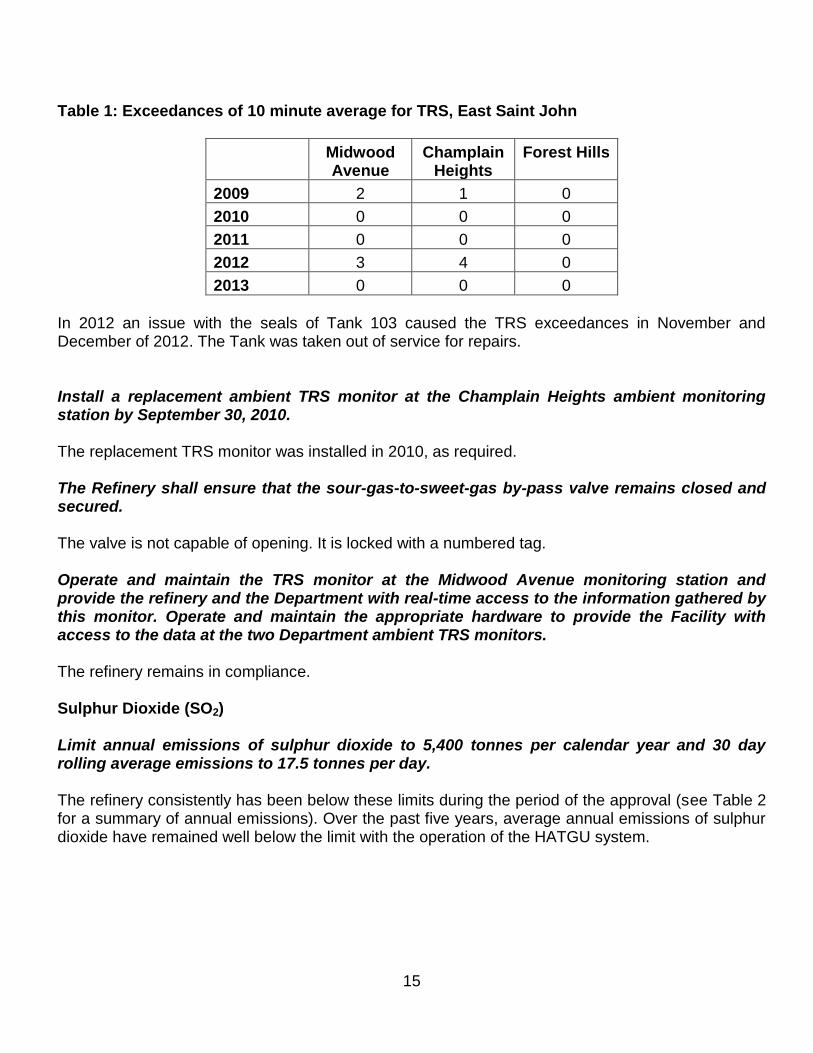
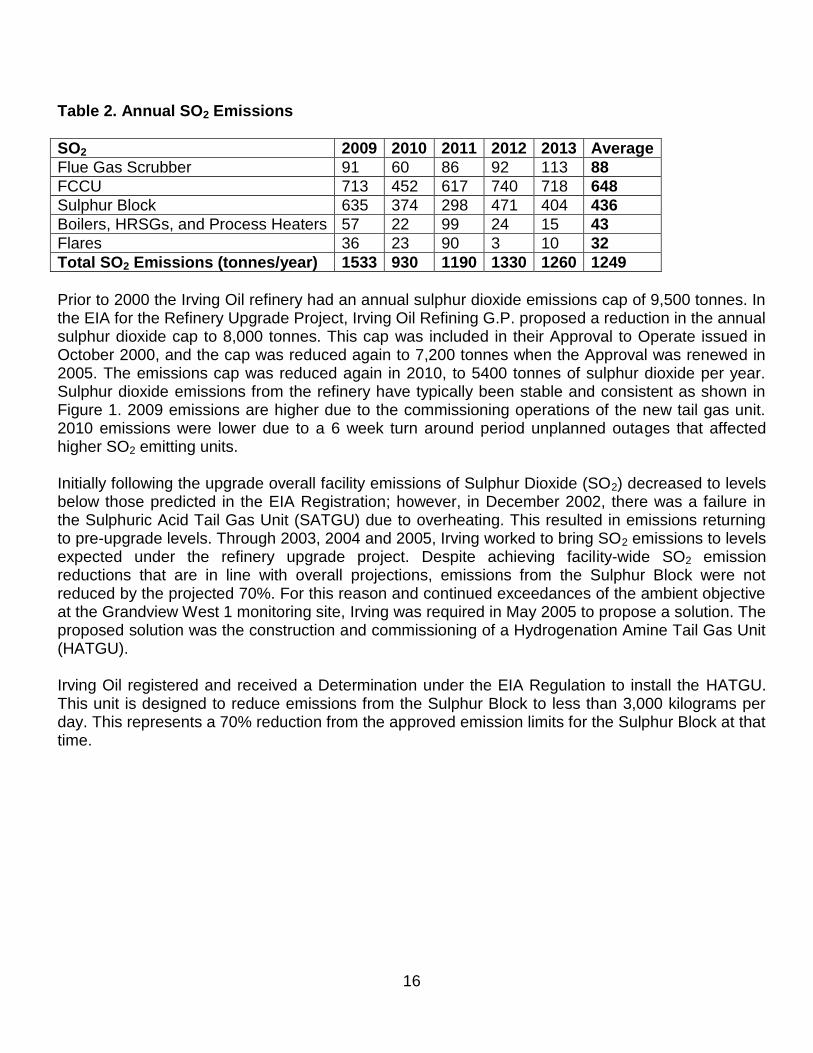
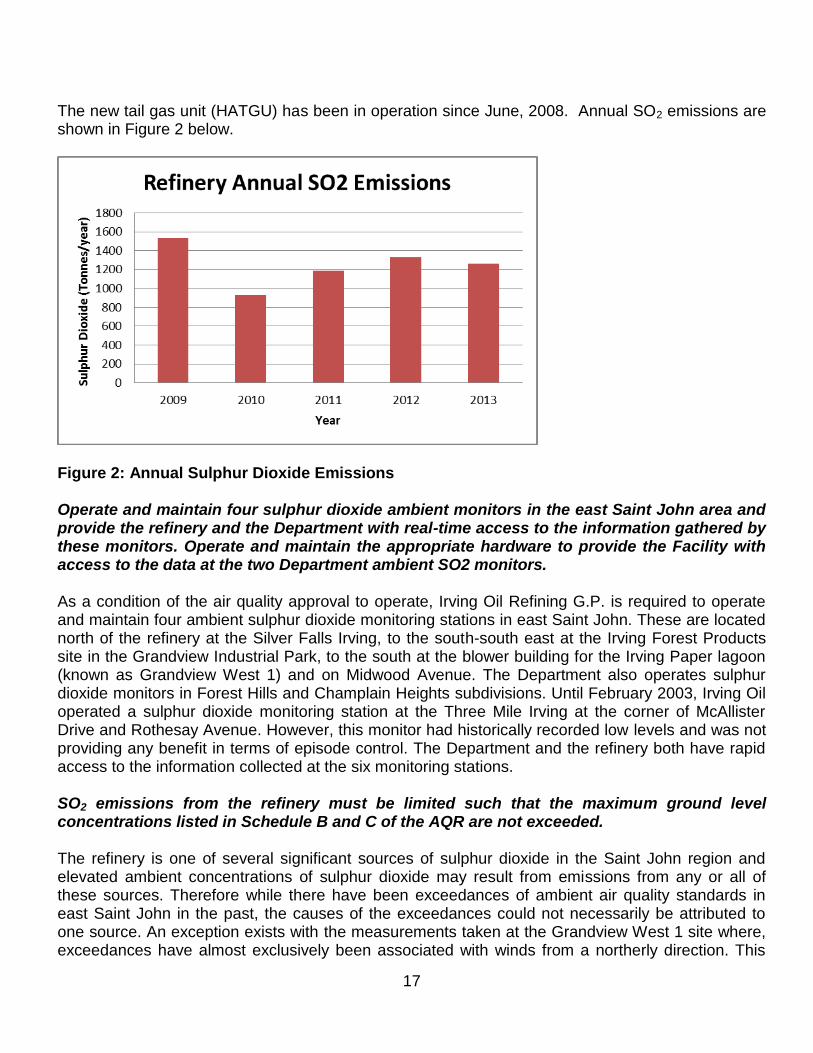
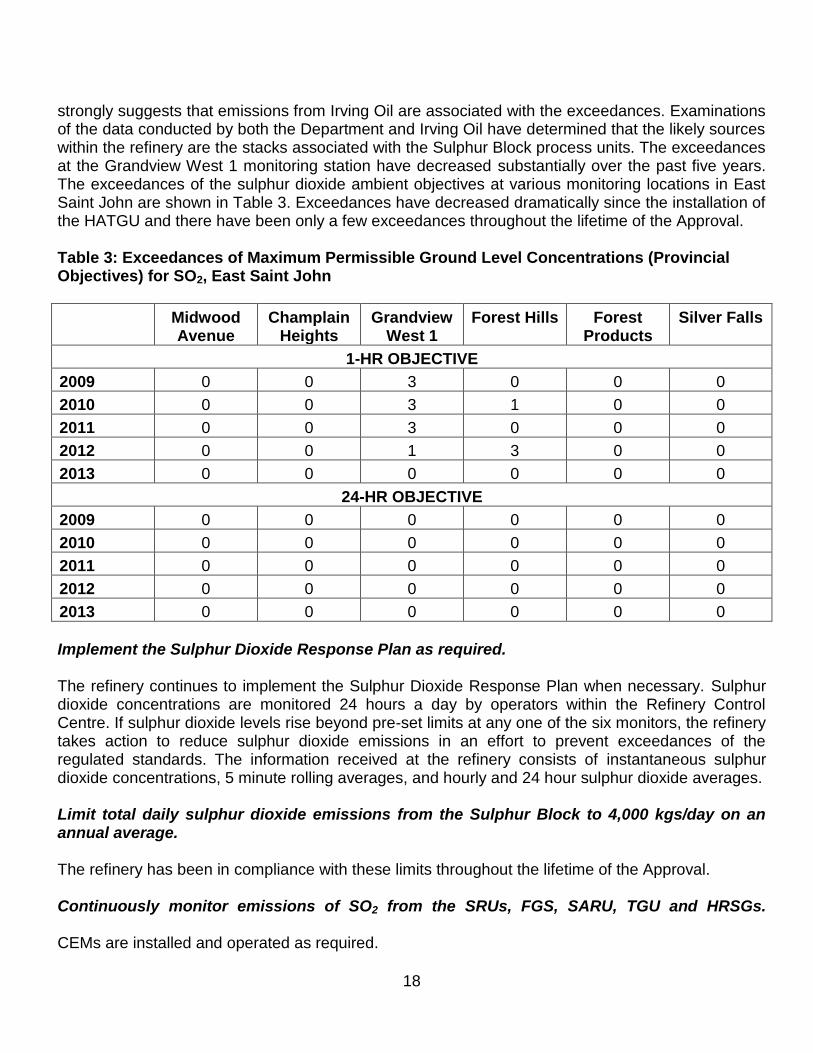
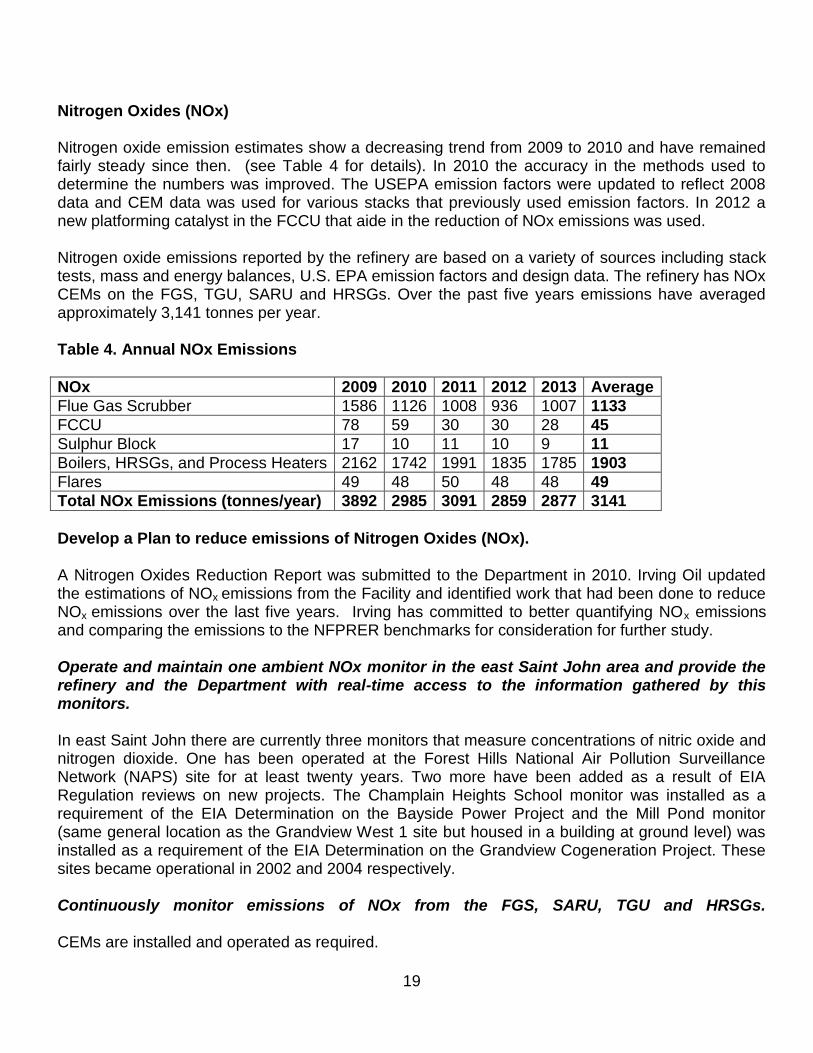
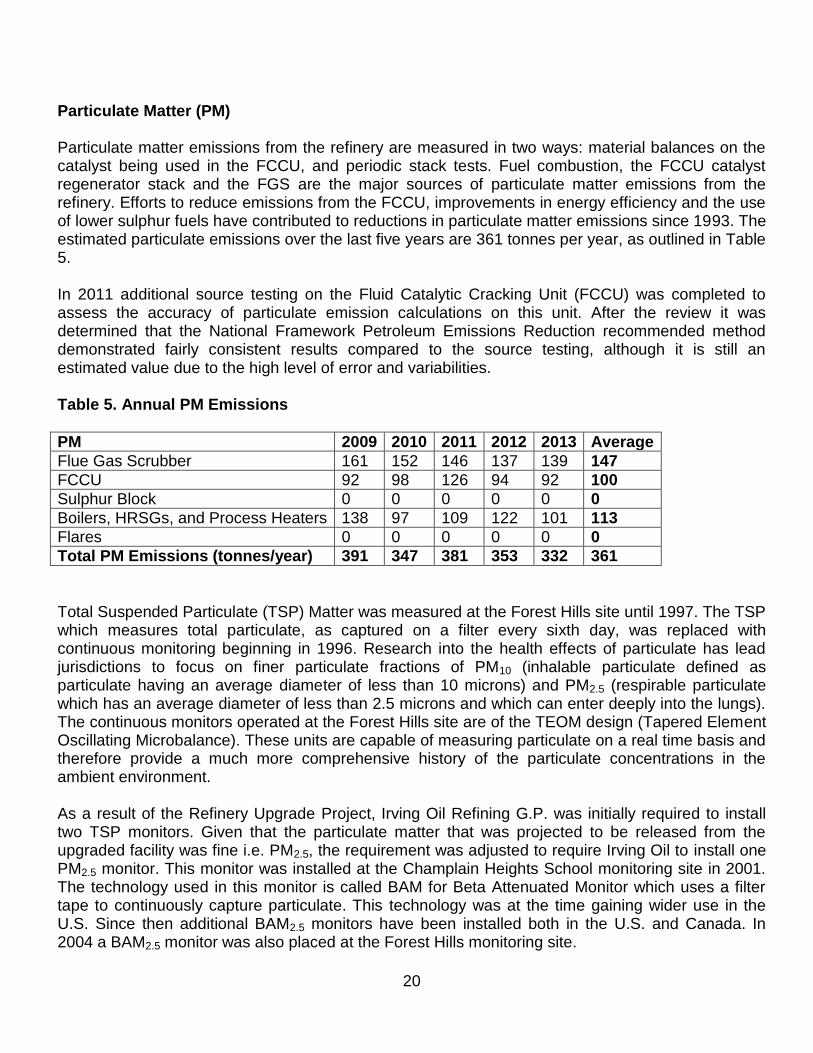
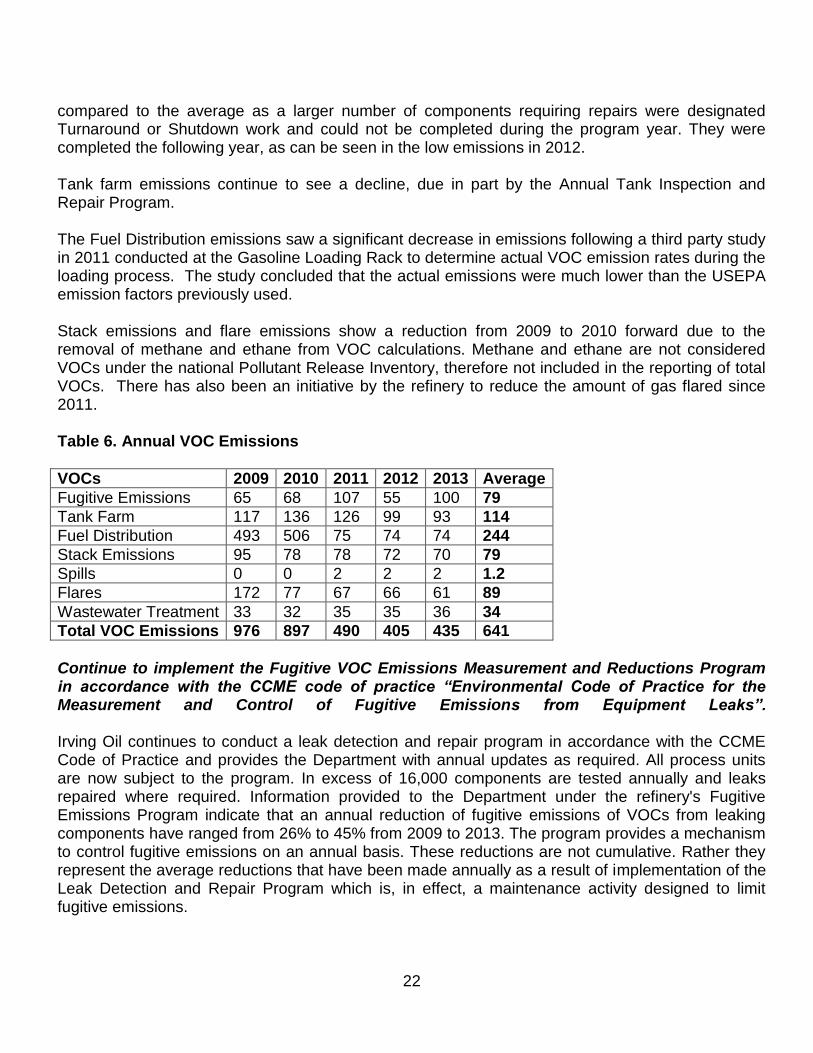
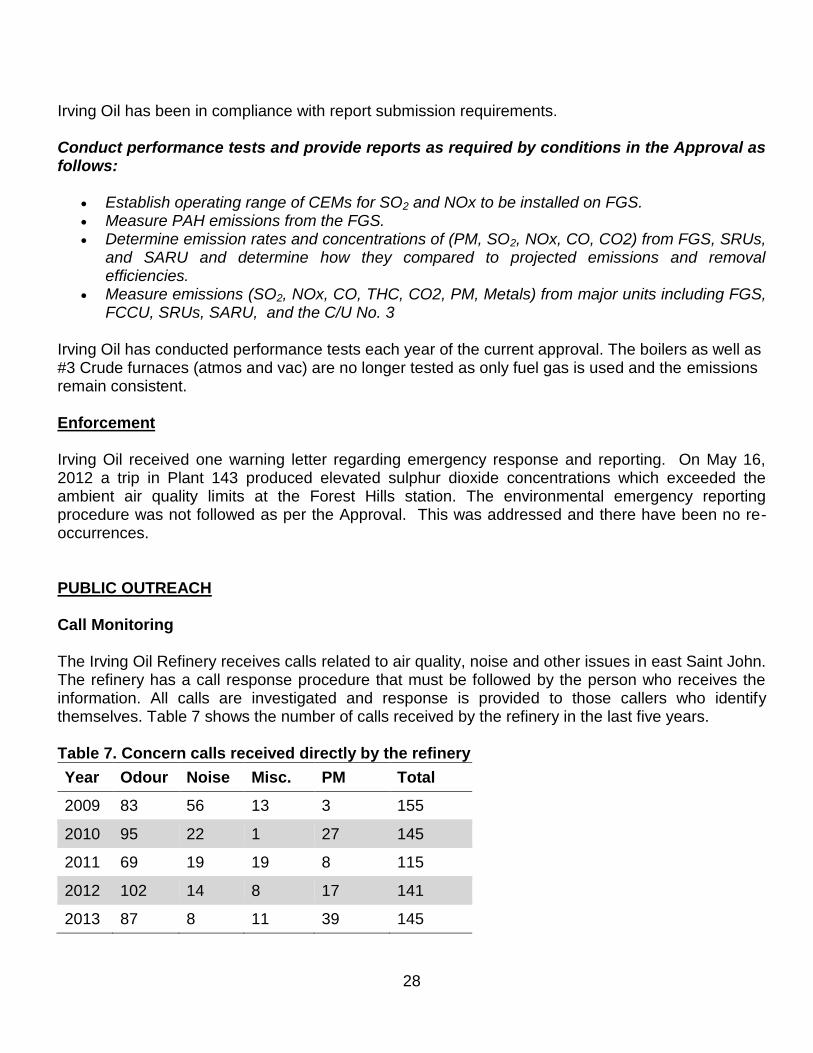