Embed Size (px)
Citation preview
Facility Mapping Report
This publication was produced for review by the United States Agency for
International Development. It was prepared by Constella Futures, New Delhi
ITAP is a three –year project funded by United States Agency for International Development under Contract No. GPO-1-01-04-00015-00 beginning April 1, 2005. The project is being implemented by Constella Futures in partnership with Bearing Point,
Sibley International, Johns Hopkins University, QED, Urban Institute and Association of Reproductive Health Professionals (ARHP)
For fu r ther in format ion con t ac t : Constella Futures
I D-1 L. Parkwood Estate R ao Tu l a R am Marg New Delhi 110 022
Facility Mapping Report
The author's views expressed in this publication do not necessarily reflect the views of the
United States Agency for International Development or the United States Government.
Contents
List of Tables
List of Figures
List of Abbreviations
Chapter 1: Background and Methodology.............................................................. 1-3
1.1 Introduction..... ............................................. ....... 1
1.2 Objectives of the study ...................................................... ....................................................... ......... 1
1.3 Study Design and Methodology................................................................................................................................................................................................................................................................................................................................................................................................................................................................................................................................................................. .........
....................................................................... .............................................................. 1
1.3.1 Study techniques-.. " ............................................................................................................................................................................................................................................................................................................................. ... 1
1.3.2 Development of the Brief Field Guide/Manual for Data Collection ................. 1
1.4 Research team composition ................................................................................ 2 1.5 Training for facility mapping................. ....................... ...... ........................................................................................................................................................................................................................................................................................... ...... 2
1.6 Field Work: Quality Control Mechanism ........................ ....................... ........ 2
1.7 Data Processing and Data Entry........................................................................... 2 1.8 Analysis and Report Writing ..................................... ................................................................................................................................................................................................................................................................................. ...... ........ 3
Chapter 2: Out-Patient Facility Mapping ................................................................. 4-10
2.1 Out-patient Facility by Type of Treatment Provided 4
2.1 -1 Outpatient Facility Mapping by Location-Rural/Urban.................................. 4
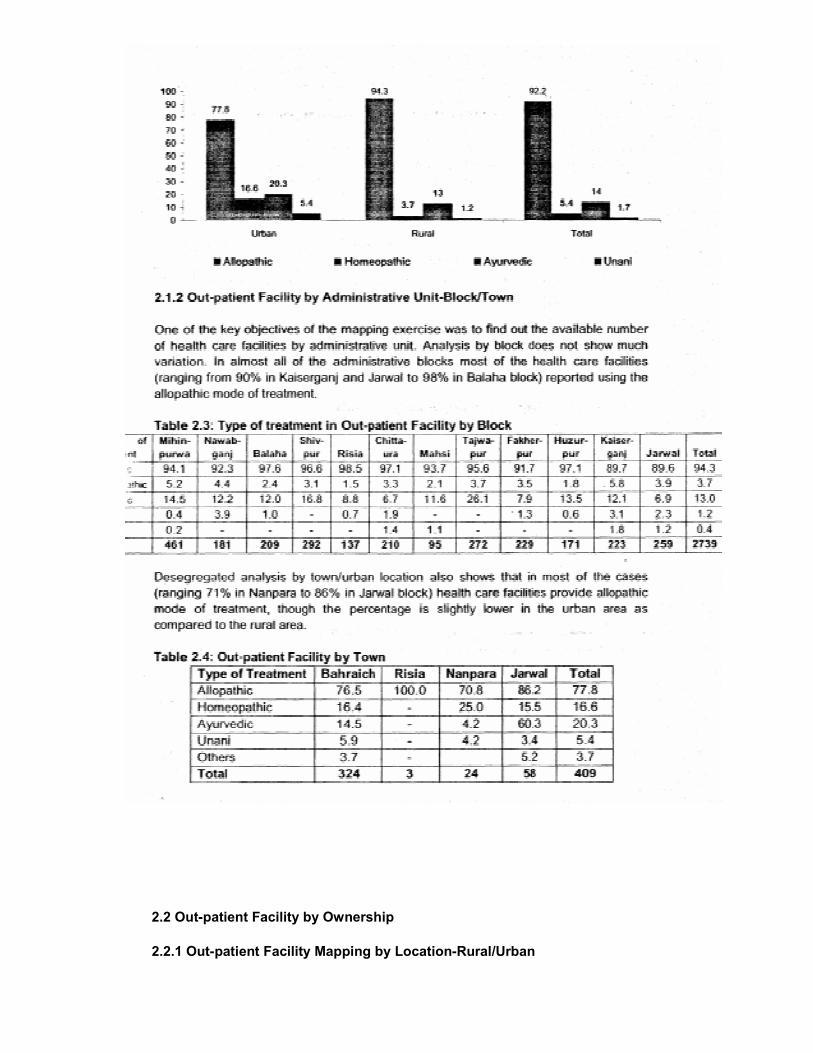
2.1.2 Outpatient Facility by Administrative Unit-Block/Town..... _ .......................... 5
2.2 Out-patient Facility by Ownership ......................................................................... 5
2.2.1 Outpatient Facility Mapping by Location-Rural/Urban. .................................. 5
2.2.2 Ownership of Outpatient Facility by Administrative. Unit- 6 Block/Town .......................................................................................................... 7
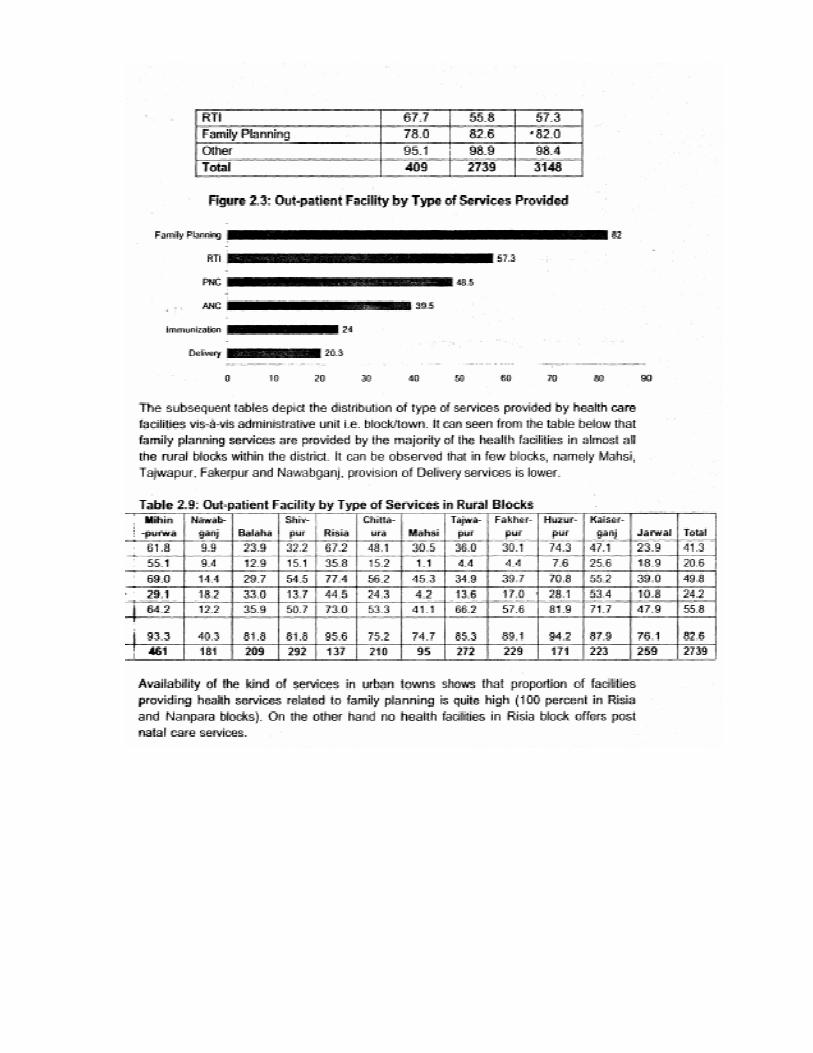
2.3 Out-patient Facility by Type of Services Provided (ANC Care/PNC etc.) ...... ........ 9 2.3.1 Health Facility having In-patient Facility---
11-30 Chapter 3: In-Patient Facility Mapping
11 3-1 Basic Profiling: Delineating by Type and Ownership of Facility.... .......................... 11
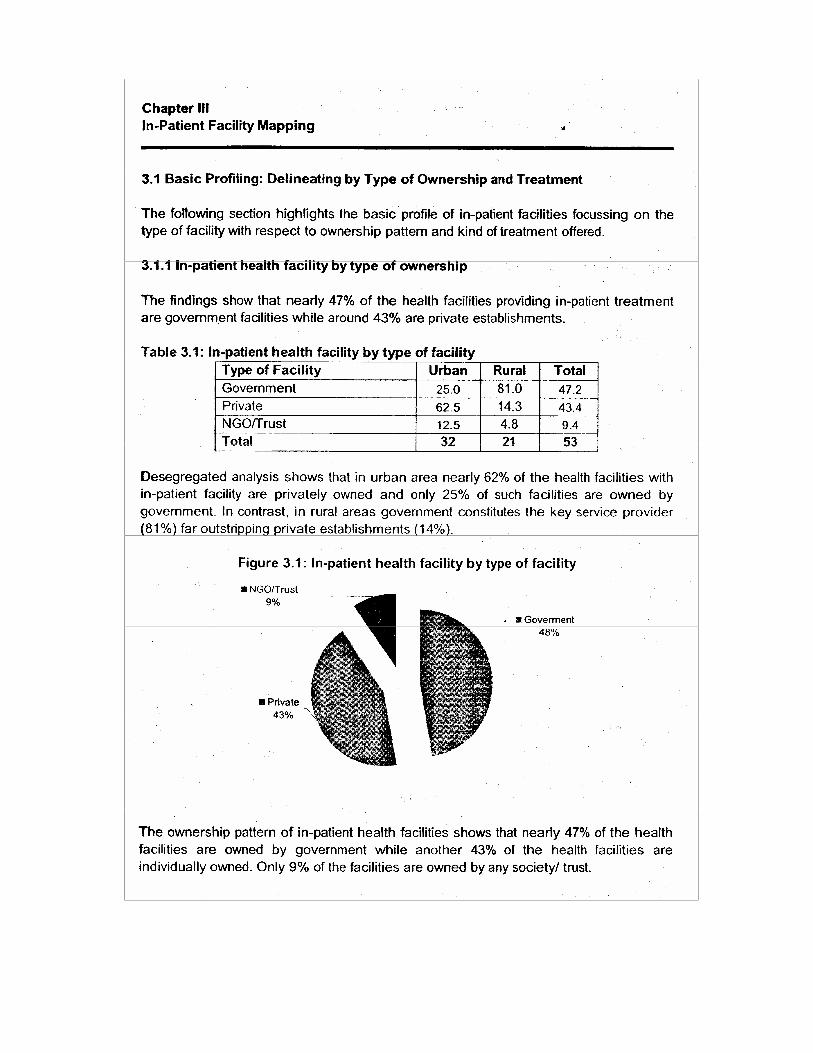
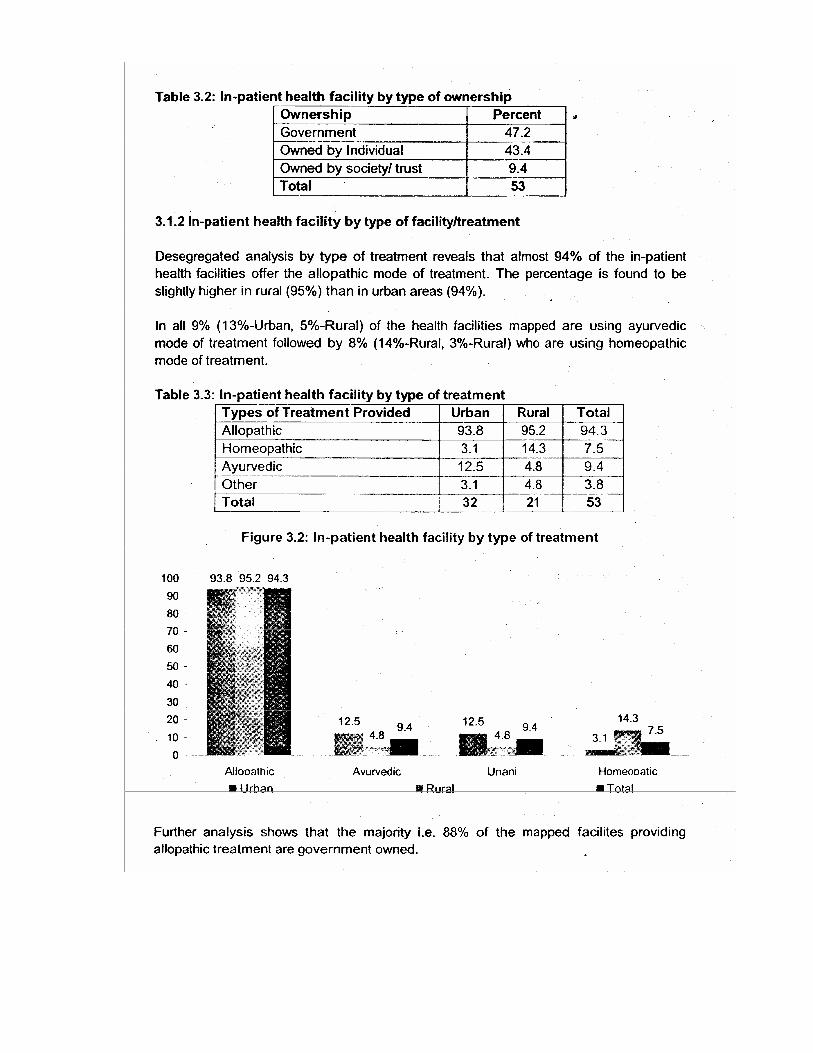
3. 1.1 In-patient health facility by type of ownership............................................... 12
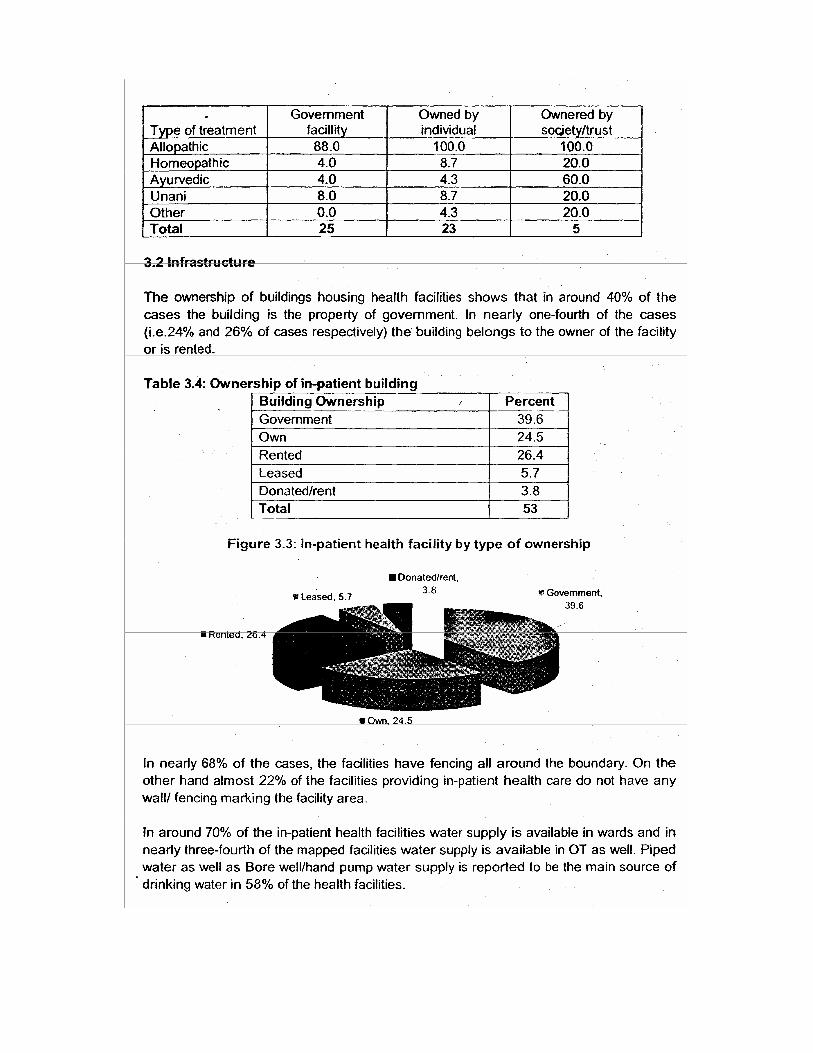
3.1.2 In-patient health facility by type of facility/treatment........ .. ........ .................. 13 3.2 Infrastructure ....................................................................................................... 15 3.3 Human Resource Deployment.............................................................................. 15
3.3.1 Availability of Doctor .................................................................................... 17
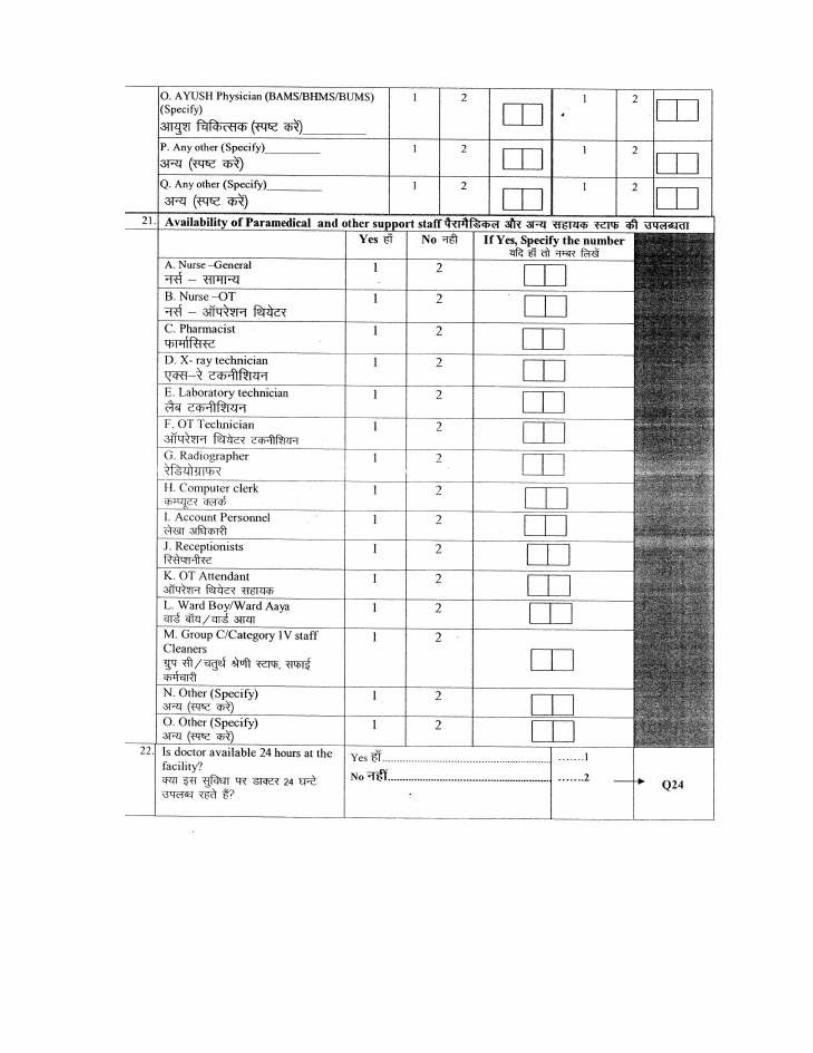
3.3.2 Availability of Paramedical Staff ................................................................... 18
3.4 Availability of Equipment ................................. ....................... ................................................................................................................... ... 20
3.5 Availability of facility/service............................................. ..................................................................................................................................................................................................................................................................................................................... ......... ................................................................................................. 20
3.5.1 General Facility ............................................................................... ........ 22
3.5.2 Laboratory Facility ............................................ ............. ................................................................................. 23
3.5.3 Storage Facility ................................................................................... ......

3.5.4 Accommodation Facility ...... ... ................................... ...... 23
3.5.5 Staff Quarter Facility ................................................................................ 24
3.5.6 Availability of Ambulance ......................................................................... 24 3.5.7 Availability of Beds................................................................................... 25
3.6 Waste Management System............................................................................. 26
3.7 Availability of Kind of Services................................................................ ...... 27 3.8 Social Responsibility and Associations.................................... ................................................................................................................................................................................................................ ............ 28
Annexure
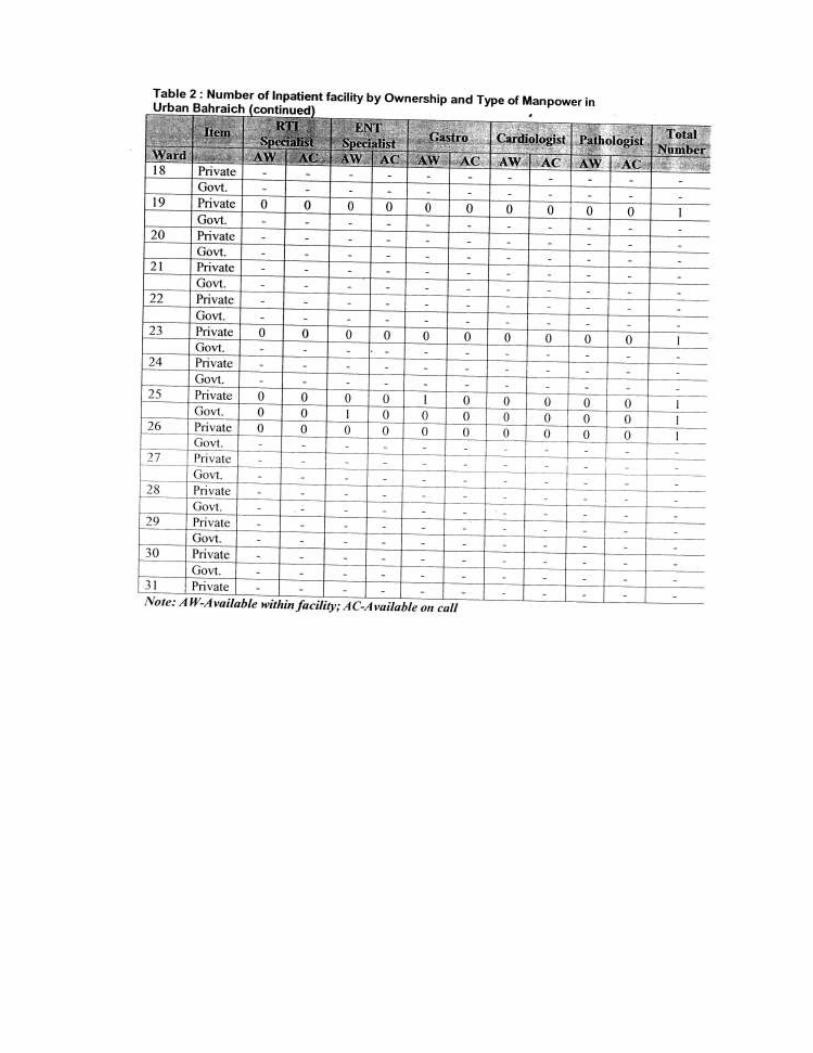
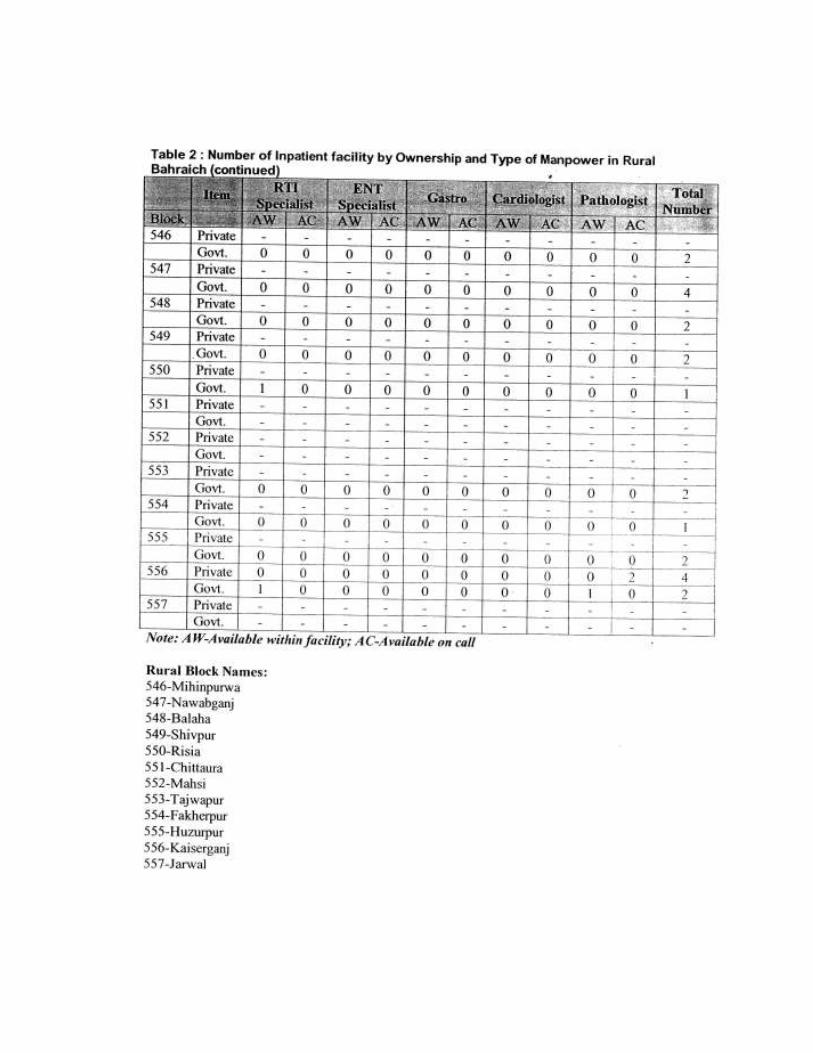
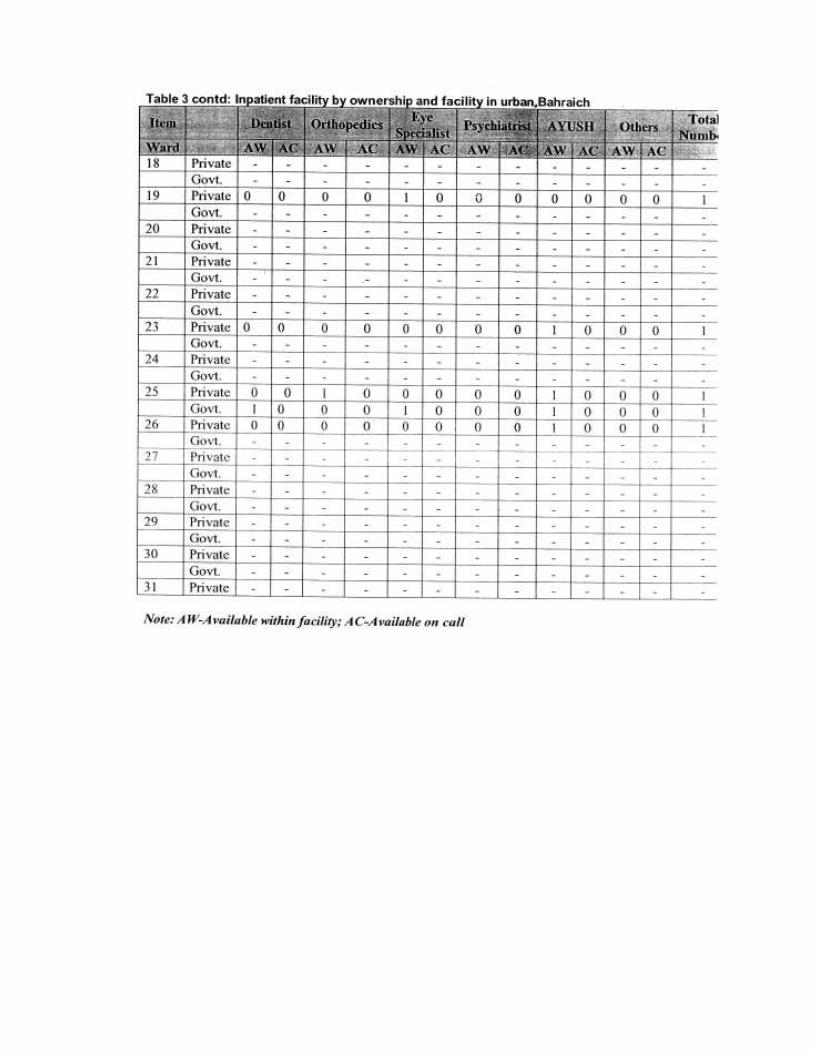
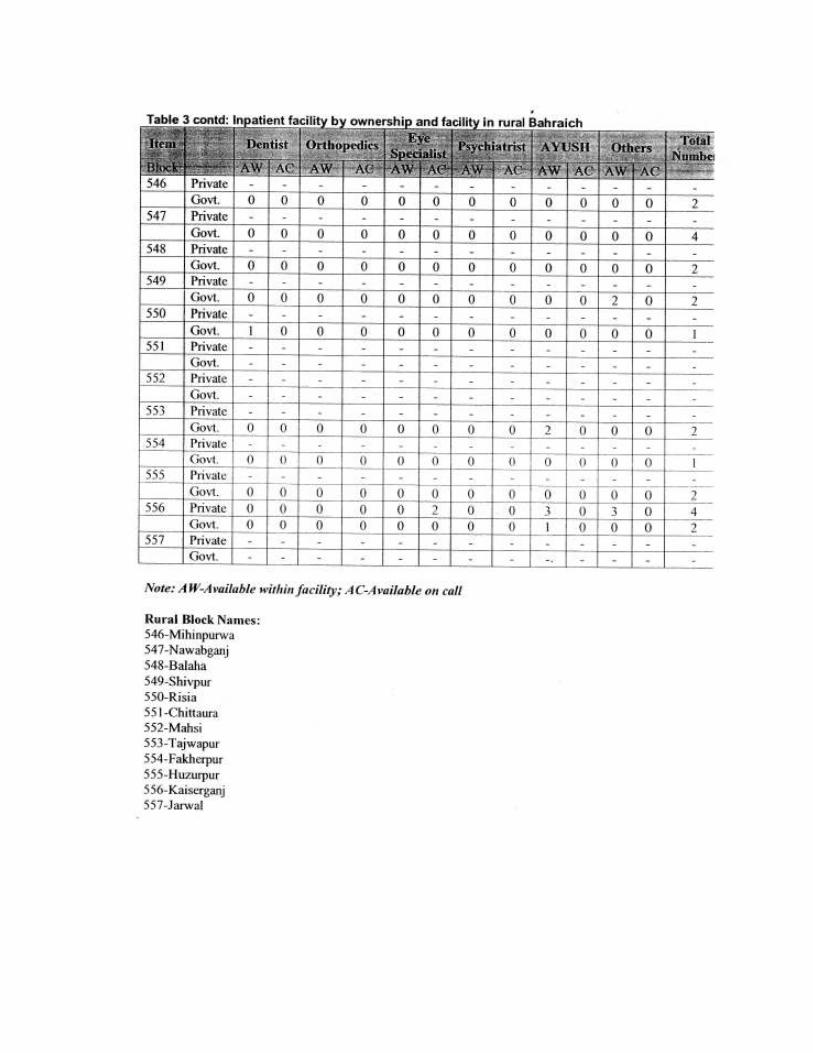
Tables based on additional analysis of inpatient and outpatient facility by
Ownership and type of services in Bahraich District... ............................................ 31-42
Survey Tools For Mapping Of Health Facilities In Bahraich District....---......— 43-67
List of Tables
Chapter 2
Table 2.1: Health Facilities Mapped/Available in District
Table 2.2: Out-patient Facility by Type of Treatment Provided Table 2.3: Type of treatment in Out-patient Facility by Block Table 2.4: Out-patient Facility by Town
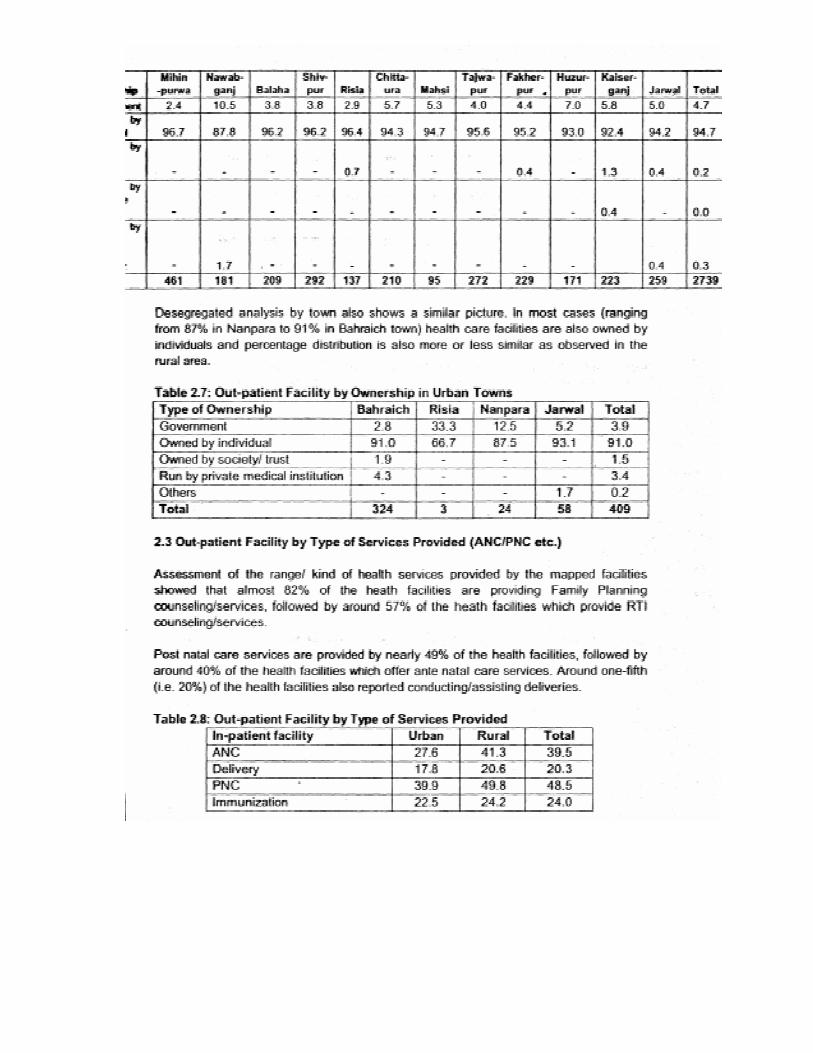
Table 2.5: Out-patient Facility by Ownership
Table 2.6: Out-patient Facility by Ownership in Rural Blocks Table 2.7: Out-patient Facility by Ownership in Urban Towns Table 2.8: Out-patient Facility by Type of Services Provided Table 2.9: Out-patient Facility by Type of Services in Rural Blocks Table 2.10: Out-patient Facility by Type of Services in Urban Towns Table 2.11: Health Facility having In-patient Facility Table 2.12: Health Facility having In-patient Facility in Urban Towns Table 2.13: Health Facility having In-patient Facility in Rural Blocks
Chapter 31
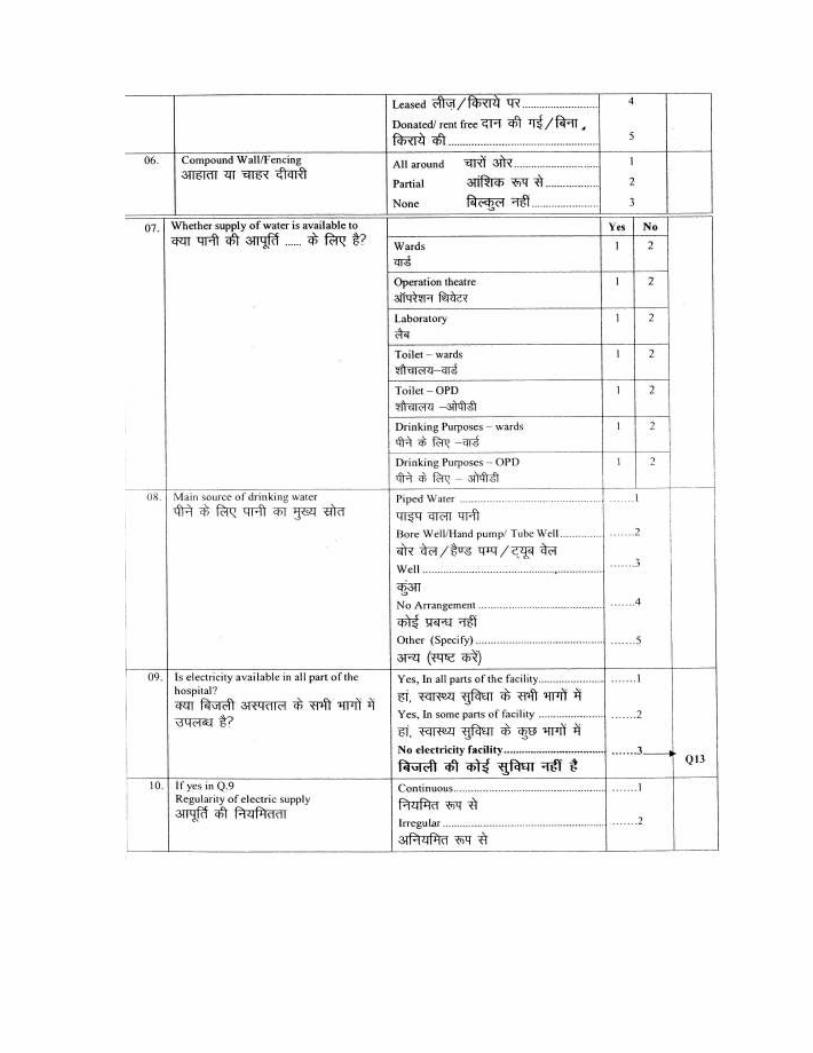
Table 3.1: In-patient health facility by type of facility Table 3.2: In-patient health facility by type of ownership Table 3.3: In-patient health facility by type of treatment Table 3.4: Ownership of in-patient building Table 3.5: Fencing and water supply Table 3.6: Electricity supply and power back-up Table 3.7: Availability of communication facilities Table 3.8: Availability of Doctors/ specialists Table 3.9: On-call availability of doctors/ specialists Table 3.10: Availability of Doctor Table 3.11: Availability of Paramedical Staff Table 3.12: Availability of OT Equipments Table 3.13: Availability of other instruments
Table 3.14: Availability and cleanliness of facility/services Table 3.15: Facility Available at OT Table 3.16: Availability of Pathology/ Laboratory Facility
Table 3.17: Storage facility available Table 3.18: Availability of Staff Quarter
Table 3.19: Availability of Ambulance Table 3.20: Availability of Beds Table 3.21: Average number of OPD cases/ day Table 3.22: Management of waste material Table 3.23: Availability of services Table 3.24: Average charges for services Table 3.25: Services through health camps Table 3.26: Frequency of health camps Table 3.27: Association with other organizations
List of Figures
Chapter 2 Figure 2.1: Out-patient Facility by Type of Treatment Provided Figure 2.1: Out-patient Facility by Type of Treatment Provided Figure 2.3: Out-patient Facility by Type of Services Provided Figure 2.4: Health Facility having In-patient Facility
Chapter 3 Figure 3.1: In-patient health facility by type of facility Figure 3.2: In-patient health facility by type of treatment Figure 3.3: In-patient health facility by type of ownership Figure 3.4: Availability of OT equipments Figure 3.5: Availability of other equipments Figure 3.6: Availability of facility/service available Figure 3.7: Availability of pathology/ laboratory facility Figure 3.8: Availability of services
Abbreviations
AFB Acid Fast Bacilli AIDS Acquired Immunodeficiency Syndrome ANC Ante Natal Care AYUSH Ayurveda, Yoga & Naturopathy, Unani, Siddha and Homoeopathy CT Scan Computed Tomography Scan Cu-T Copper-T DLC Differential Leucocyte Count ECG Eco-cardiography ELISA Enzyme-Linked Immuno Sorbent Assay HIV Human Immunodeficiency Virus ISO International Standards Organization MRI Magnetic Resonance Imaging NGO Non-Government Organization
OPD Out-Patient Department OT Operation Theater PNC Post Natal Care
RTI Reproductive Tract Infection STD Sexually Transmitted Diseases STI Sexually Transmitted Infection TLC Total Leucocyte Count TT Tetanus Toxide
UPHSDP Uttar Pradesh Health Systems Development Project VDRIJ WR Test Veneral Disease Reference Laboratory/ Weekly Reactive Test
Chapter I Background and Research Methodology
1.1 Introduction
Health insurance is an emerging social security instrument for the rural poor for whom chronic health problems, arising due to prevalence of diseases and inaccessibility to an affordable health care system, are a major threat to their income earning capacity. In order to address the health care needs of rural poor, the Uttar Pradesh Health Systems Development Project (UPHSDP), funded by World Bank, is going to be implemented in Bahraich district of Uttar Pradesh. To complement this effort, the project included the mapping all health facilities in the Bahraich district, covering both the in-patient and outpatient facilities.
1.2 Objective of the Study
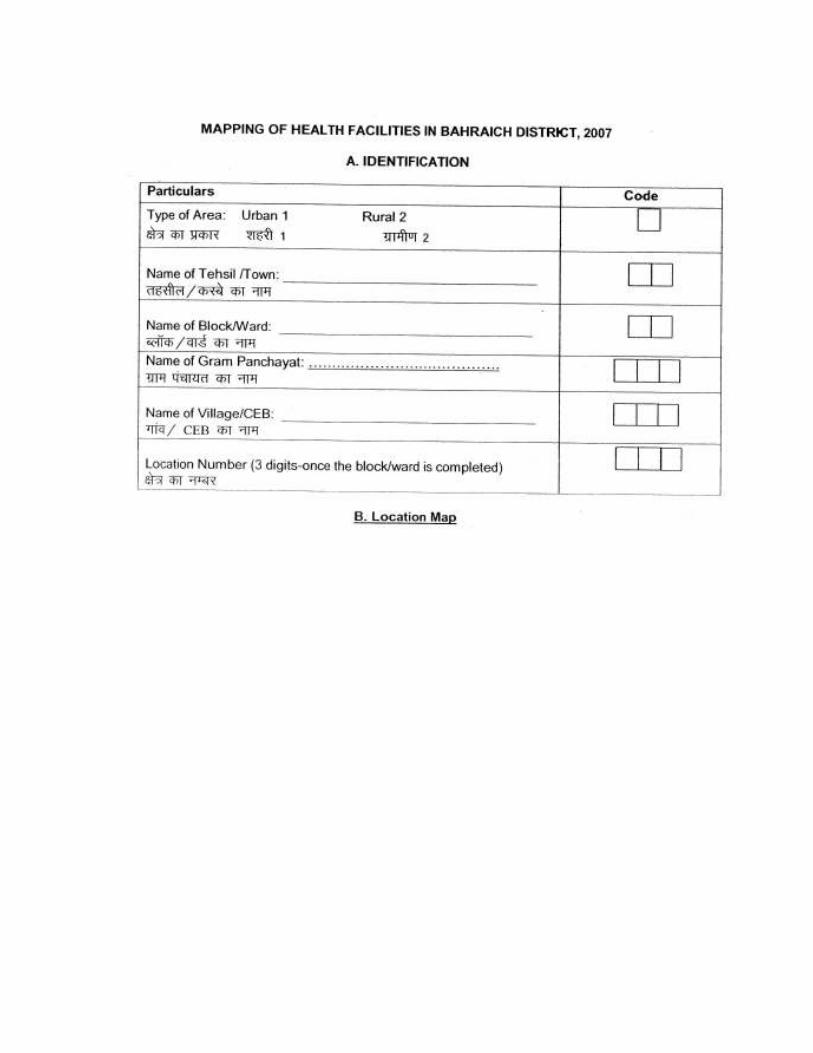
The objective of the Facility Mapping study is to collect detailed information from both government and private facilities – in-patient and out-patient.
1.3 Study Design and Methodology
One of the key objectives of the study is to examine the prevailing health scenario and assess awareness about health insurance at the community level and health care facilities provided by the organized sector. In order to access information, a household survey has been conducted at the village level in Bahraich district of U.P. and facility mapping carried out for all health care providers in rural as well as urban areas in the district.
1.3.1 Study Techniques
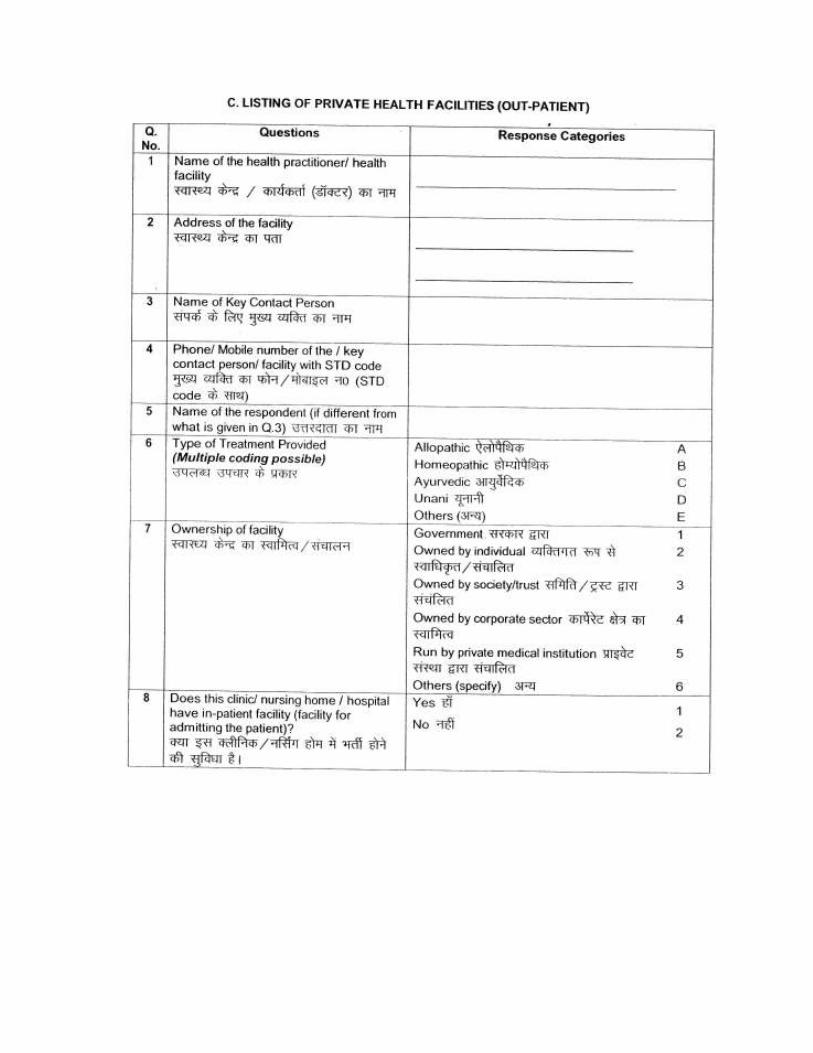
The' questionnaire to gather the data on in-patient and outpatient facilities mainly comprised questions pertaining to the kinds of services they provided.The interview schedule consisted of both open and closed ended questions.
1.3.2 Development of the Brief Field Guide/Manual for Data Collection
Development of the field guide/manual for data collection is essential for ensuring smooth functioning of field operations- Thus a brief note sheet and field guide/manual were developed before the field briefing.
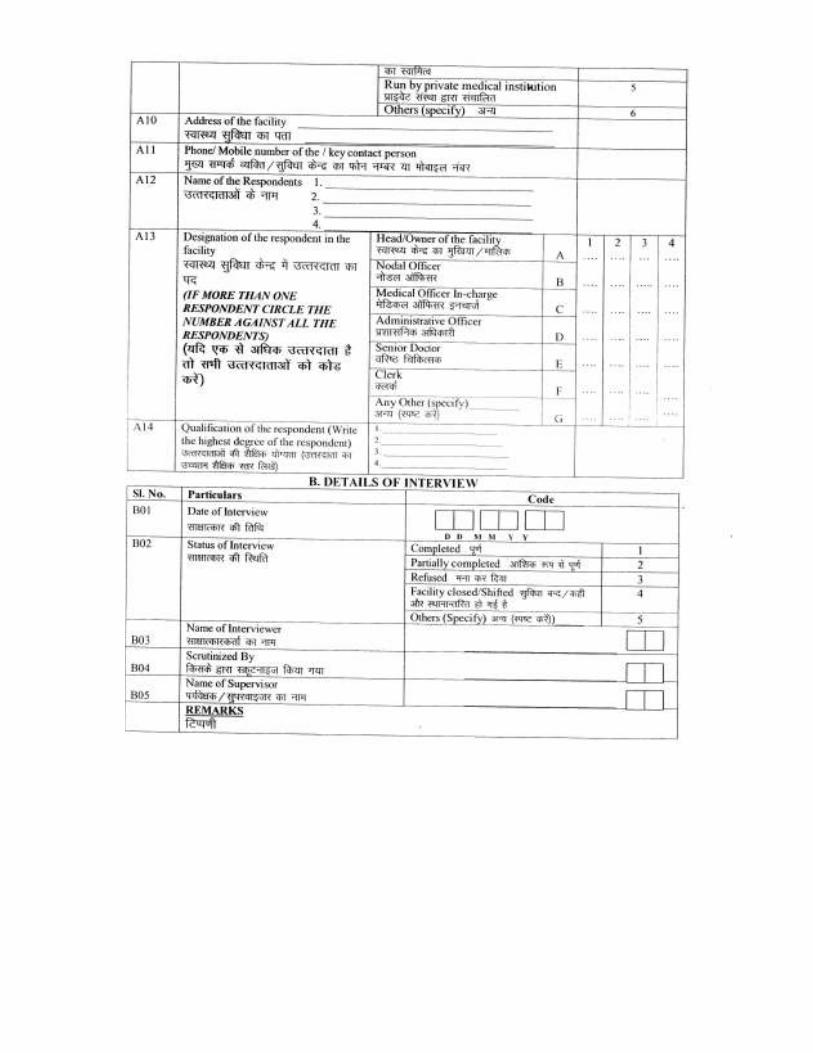
1.4 Research team composition
The project was headed by a Project Coordinator who was the chief functionary throughout the assignment. The Project Coordinator was supported by an Advisor, Project Manager and

one research executive.
Separate teams were employed for Listing/ Facility Mapping and the Survey. Each field team was coordinated by one Field Manager along with requisite field supervisors. The Field Manager was responsible for overall coordination, planning and the quality of the survey.
The field supervisors were the senior members of the field teams and were responsible for the completion of the assigned workload and maintenance of data quality.
1.5 Training for facility mapping
The facility mapping training was conducted for two days. During the training investigators were briefed on the basics of facility mapping i.e. the ways and means to collect information about existing facilities (both government and private) including inpatient and out-patient details.
� Things ensured during training:
• Investigators were recruited based on their educational qualification, maturity, their ability to spend a long time in the field, and their prior experience with a similar kind of survey.
• To account for dropouts, 15-20% extra investigators attended the training.
• During training, invest igators were screened out/ graded based on performance/skill shown during training.
1.6 Field Work: Quality Control Mechanism
Controlling the quality of the data collection is the most important function of the research professionals/field executive/supervisors. Throughout the fieldwork, they were responsible for observing interviews and carrying out field editing. To ensure the quality of data collection the field supervisor observed interviewers throughout the course of fieldwork. Following quality control measures were implemented during the fieldwork
� Spot check and observation
� Back check
1.7 Data Processing and Data Entry
The data entry and validation work of the survey was handled in-house by Sambodhi using the
most advanced data analysis package namely CS Pro. The Project Coordinator along with the research team members provided inputs at various stages of
data processing. After field editing, questionnaires were returned to the main survey office for data processing. The processing operation consisted of office editing, coding of "others" category – open-ended questions, data entry, and editing inconsistencies found by the computer program_
As with the coding, the process of verification of office data entry involved double data entry i.e. two persons independently entered the data, and used a computer program which can check for any differences in the two data sets by generating an error list. The errors were then resolved and corrected by a member of the research team.
The data was edited before use to ensure that the information was accurate, complete and consistent. During data editing three types of checks are applied i.e.
• Validity check
� Range checks
• Consistency checks
1.8 Analysis and Report Writing
After data processing, which includes data editing, recoding of new variables and data entry, data analysis was conducted.using the most advanced data analysis package, namely SPSS.
The analysis of the survey is guided by the specified research objectives. The core team members under the guidance of Project Coordinator and system analyst prepared the analysis/ tabulation plan. The tables were then generated using latest version of analysis software SPSS/STATA.
Chapter II
Out-Patient Facility Mapping

The Health Facility Mapping exercise was carried out in the entire district of Bahraich. The mapping exercise was conducted to assess the availability of both in-patient and out-patient health facilities (both private and government) in the district. In all 3148 health facilities (both private and government) were mapped in the district, out of which 2739 health facility were in the rural area while 409 health facilities were mapped in the urban area of District Bahraich.
The following section discusses the out-patient facilities availability in the district in detail by providing a desegregated overview by type of facility, ownership, treatment and services provided.
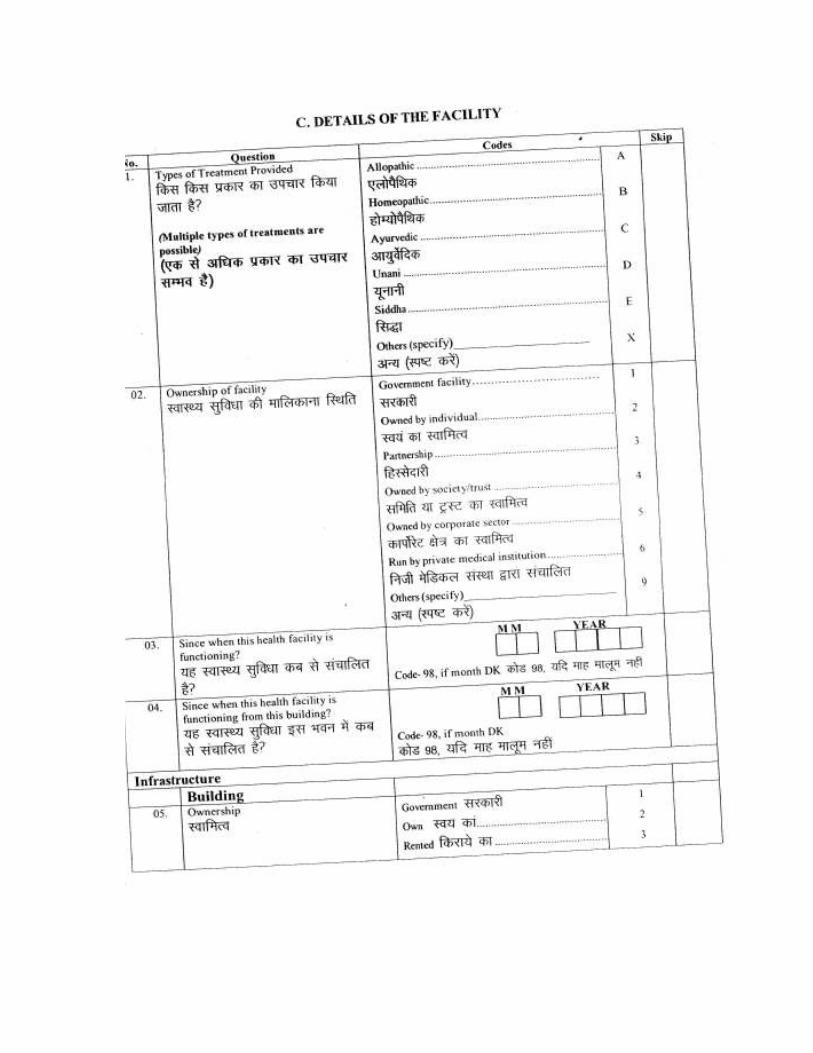
2.1 Out-patient Facility by Type of Treatment Provided 2.1.1
Out-patient Facility by Location-Rural/Urban
Desegregated analysis by type of treatment indicates that around 92% of the health facilities
provide the allopathic mode of treatment. The percentage is found to be higher in the rural
(92%) than in the urban areas (78%).
Further, in all 14% (20%-Urban, 13%-Rural) of the health facilities mapped are using Ayurvedic mode of treatment followed by another 5% (17%-Urban, 4%-Rural) who offer the homeopathic mode of treatment.
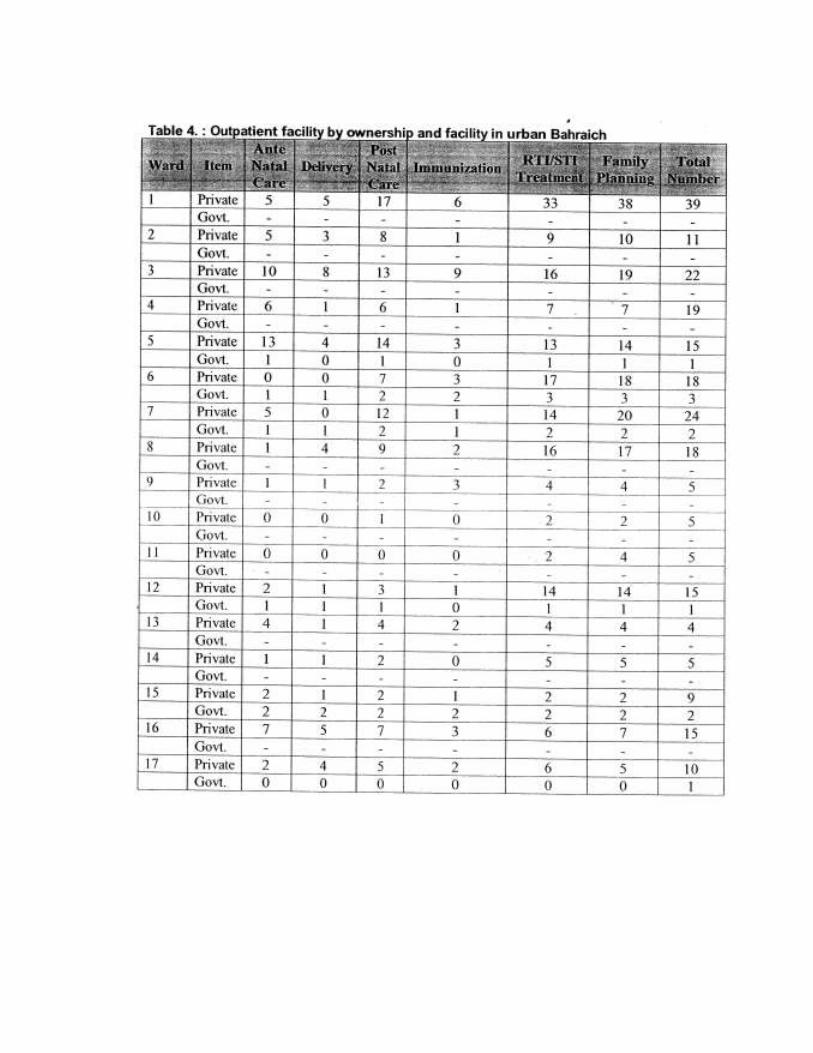
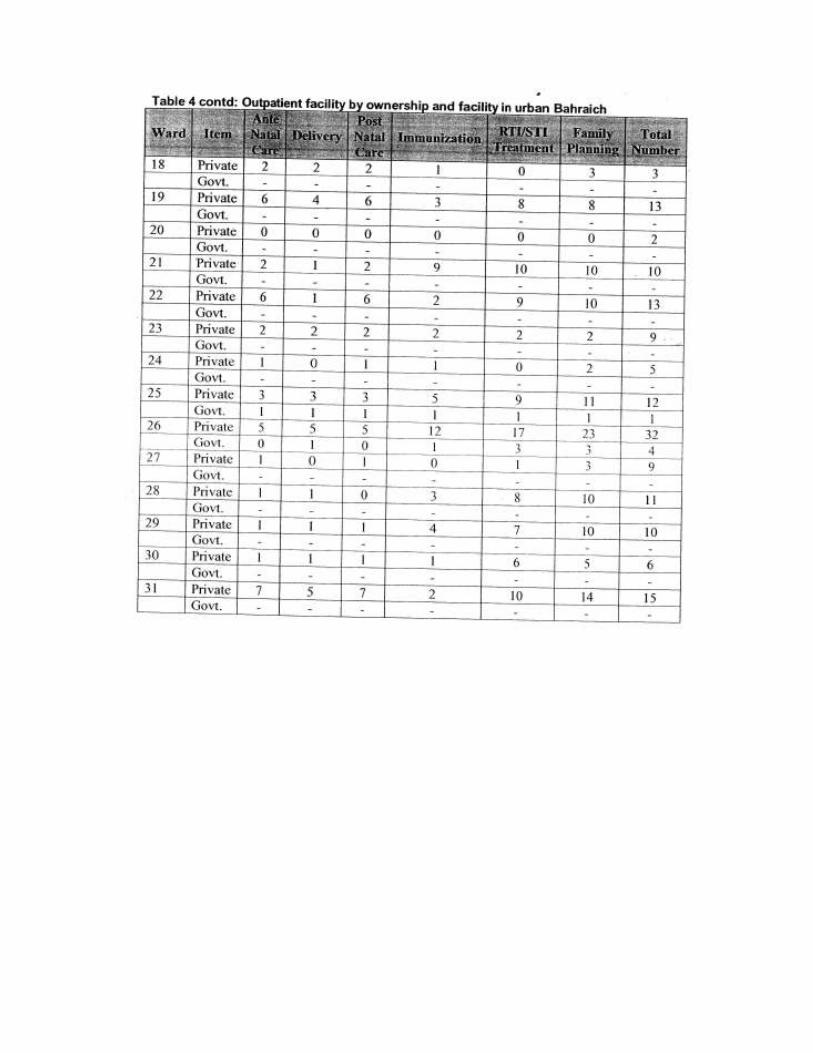
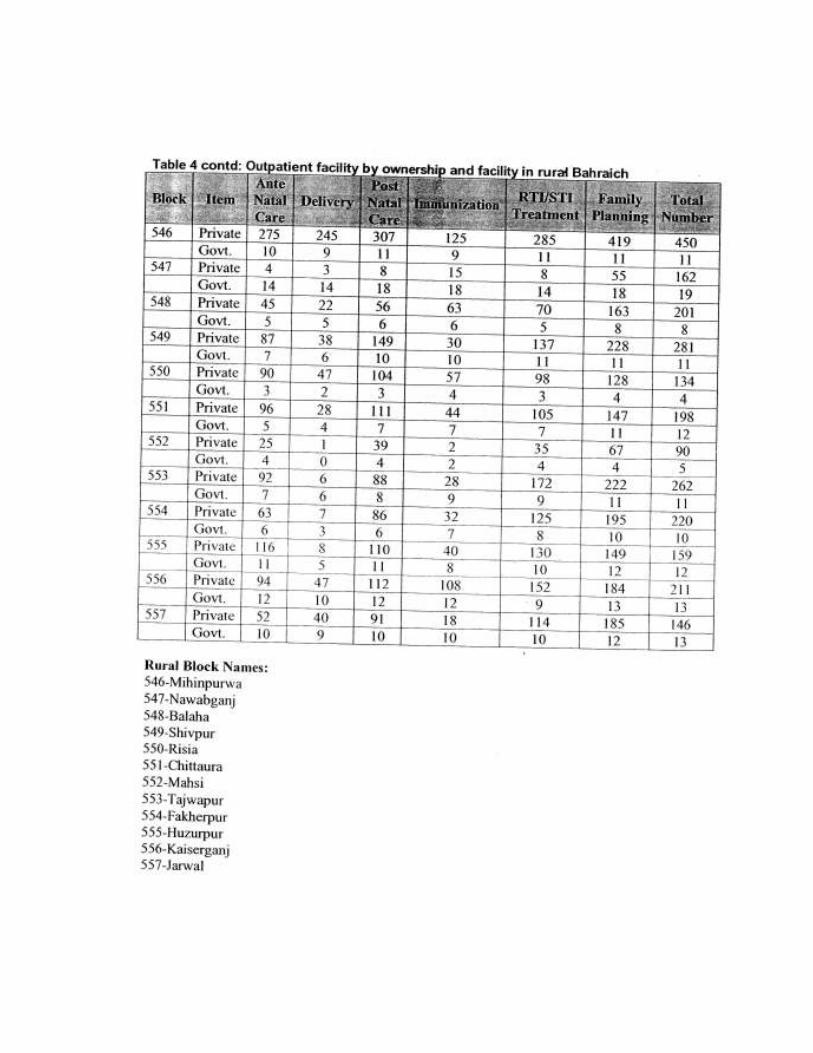
2.2 Out-patient Facility by Ownership
2.2.1 Out-patient Facility Mapping by Location-Rural/Urban

The Facility , mapping exercise also mapped health facilities by type of ownership. As
can be seen from the data, in around 94% of the cases (95%-Rural, 91%-Urban), health facilities are owned by individuals while only 5% of the heath facilities are reported to be owned by the government. Out of total health facilities mapped, less than 1 % are found to be run by society/trust and private medical institutions
Desegregated analysis by block doesn't show much variation and in almost all of the administrative blocks most of the health care facilities (ranging from 8% in Nawabganj to 97% in Mihinpurwa block) are owned by an individual.
Table 2.6: Out-patient Facility by Ownership in Rural Blocks
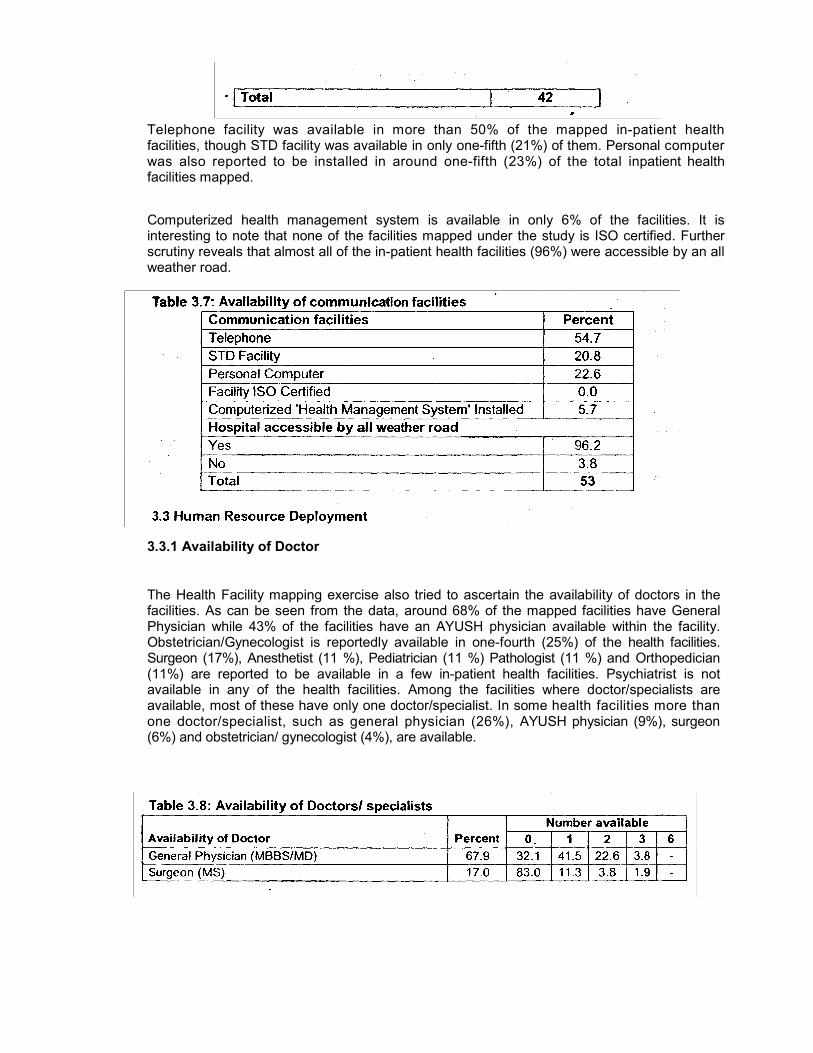
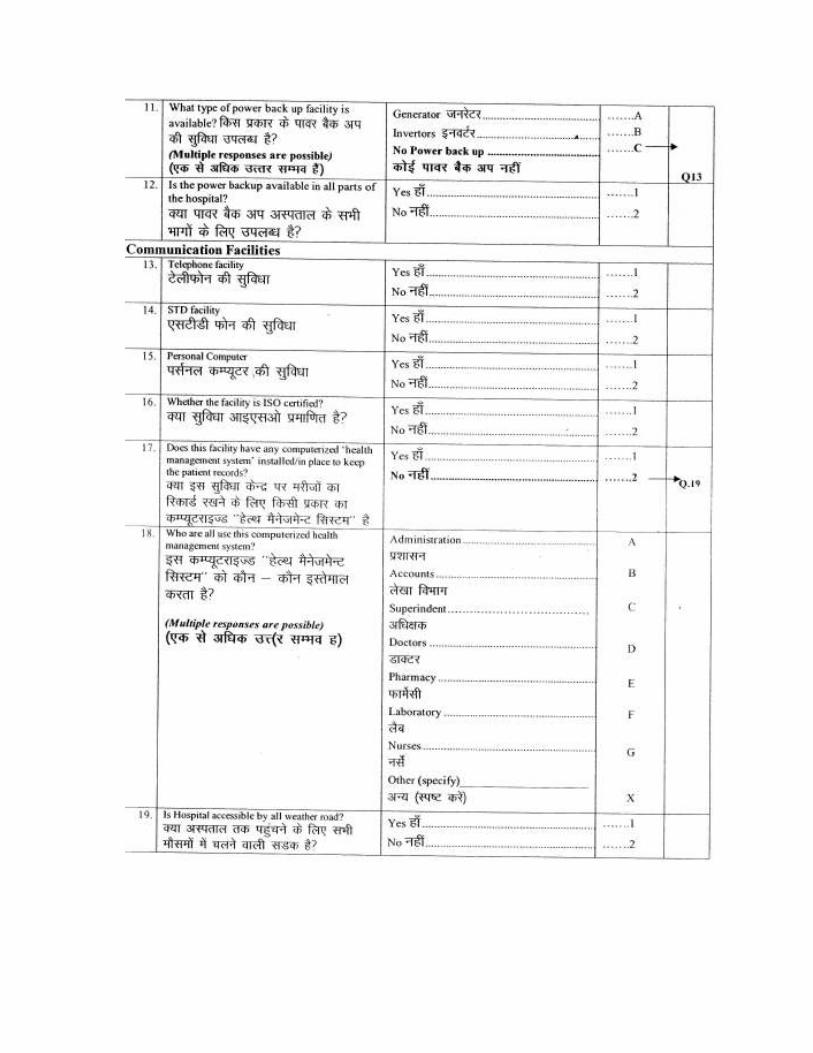
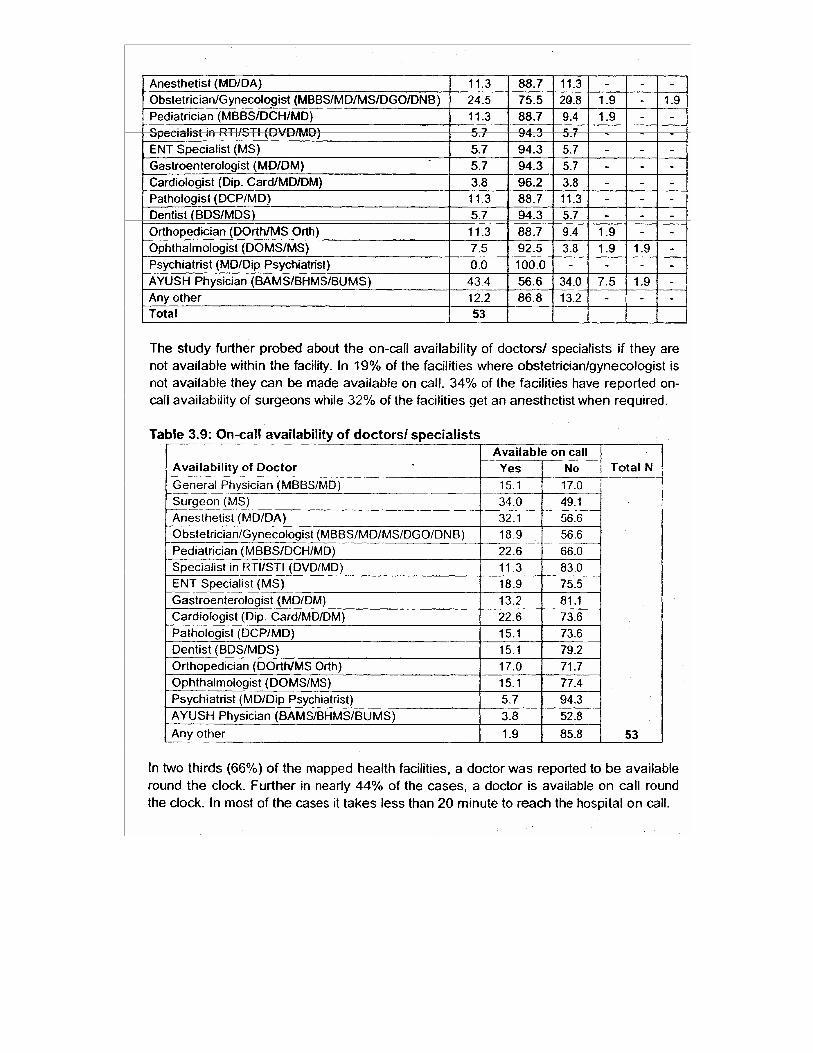
Telephone facility was available in more than 50% of the mapped in-patient health facilities, though STD facility was available in only one-fifth (21%) of them. Personal computer was also reported to be installed in around one-fifth (23%) of the total inpatient health facilities mapped.
Computerized health management system is available in only 6% of the facilities. It is interesting to note that none of the facilities mapped under the study is ISO certified. Further scrutiny reveals that almost all of the in-patient health facilities (96%) were accessible by an all weather road.
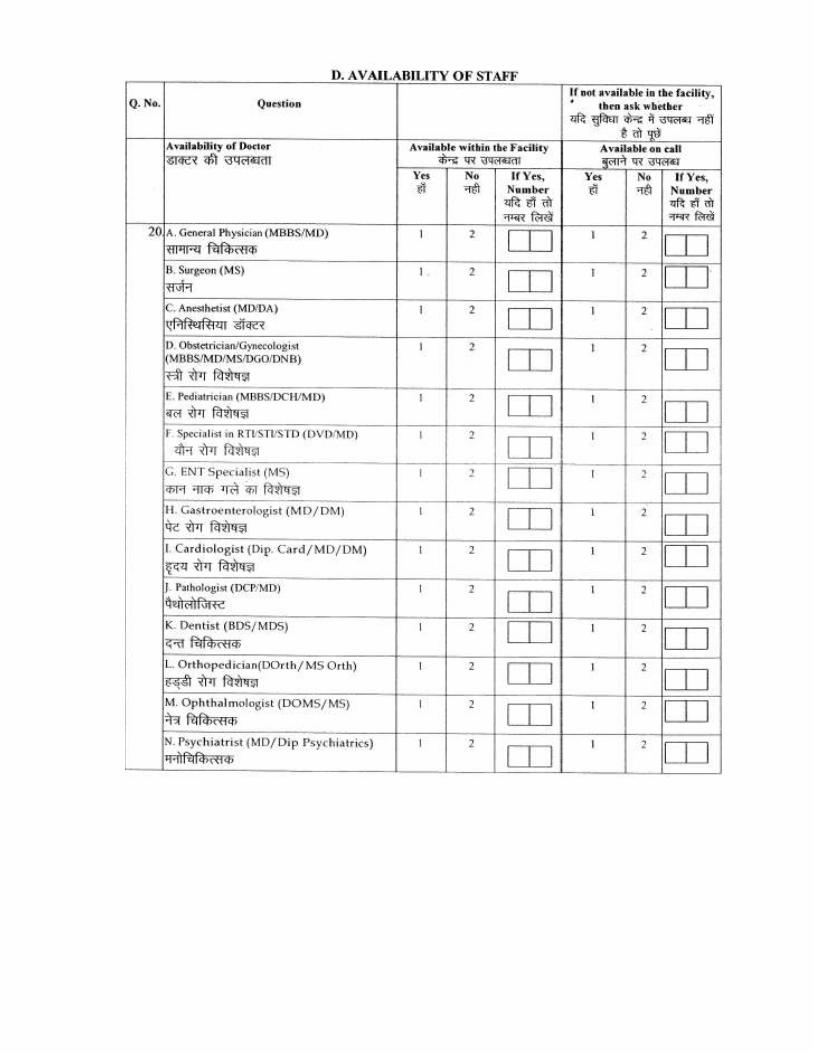
3.3.1 Availability of Doctor
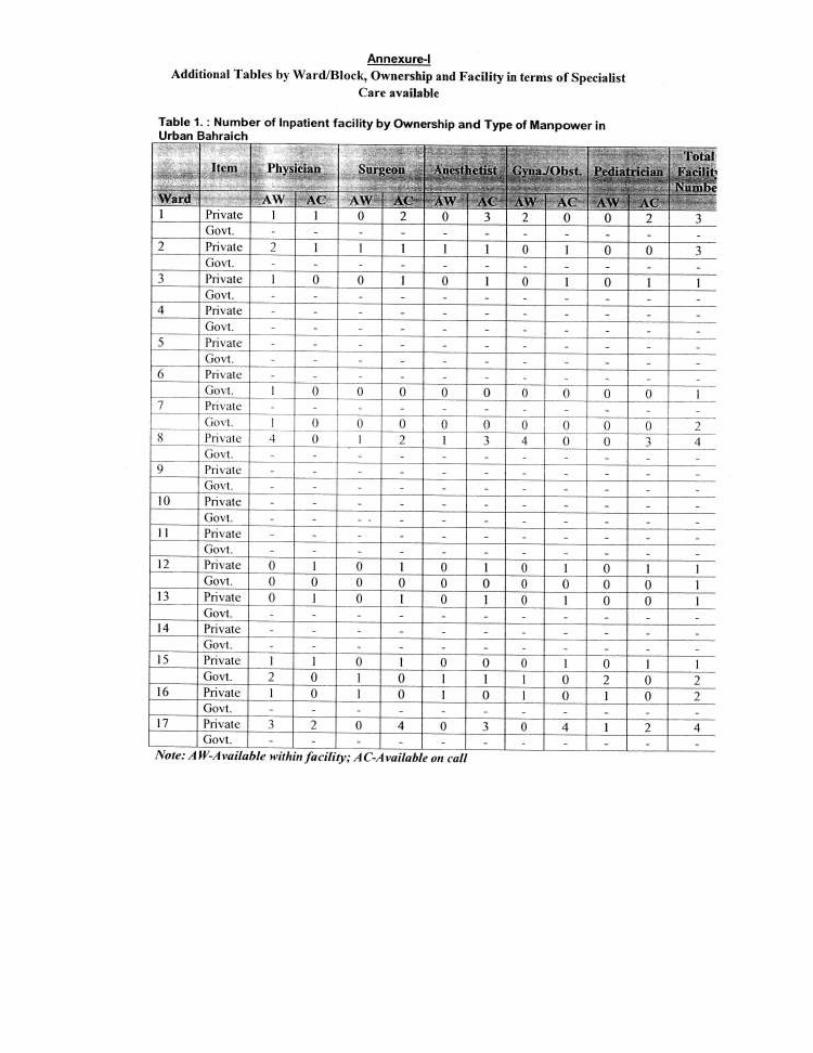
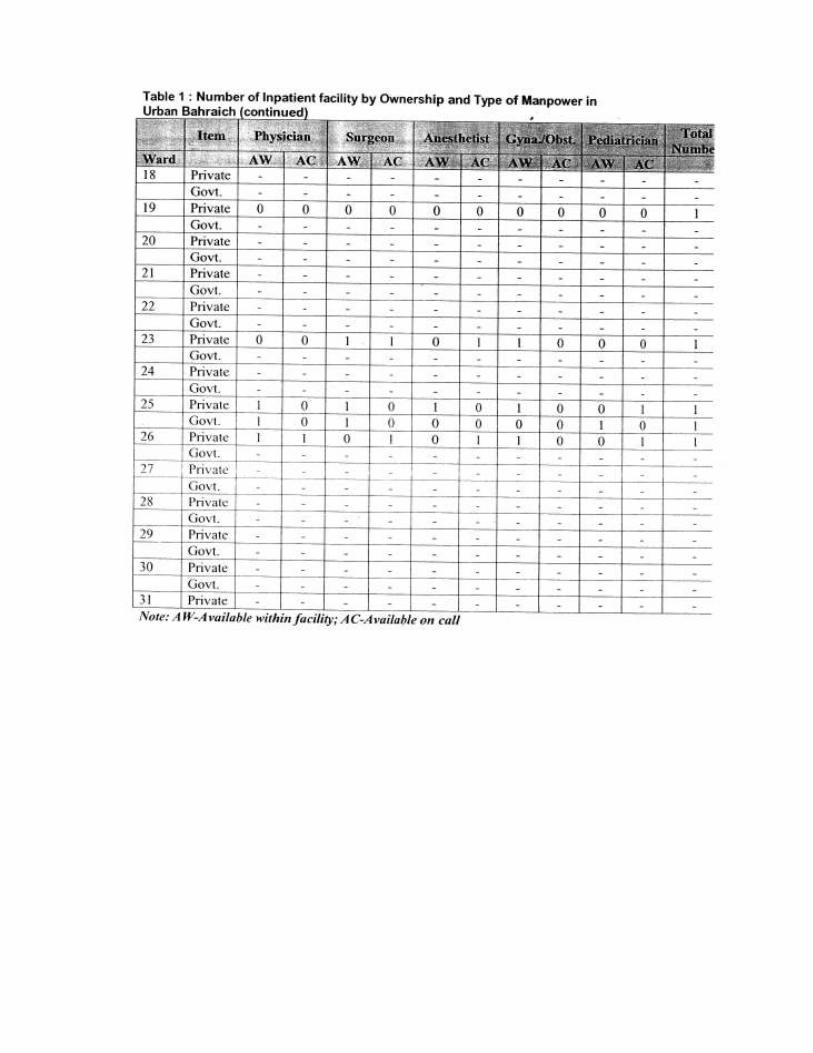
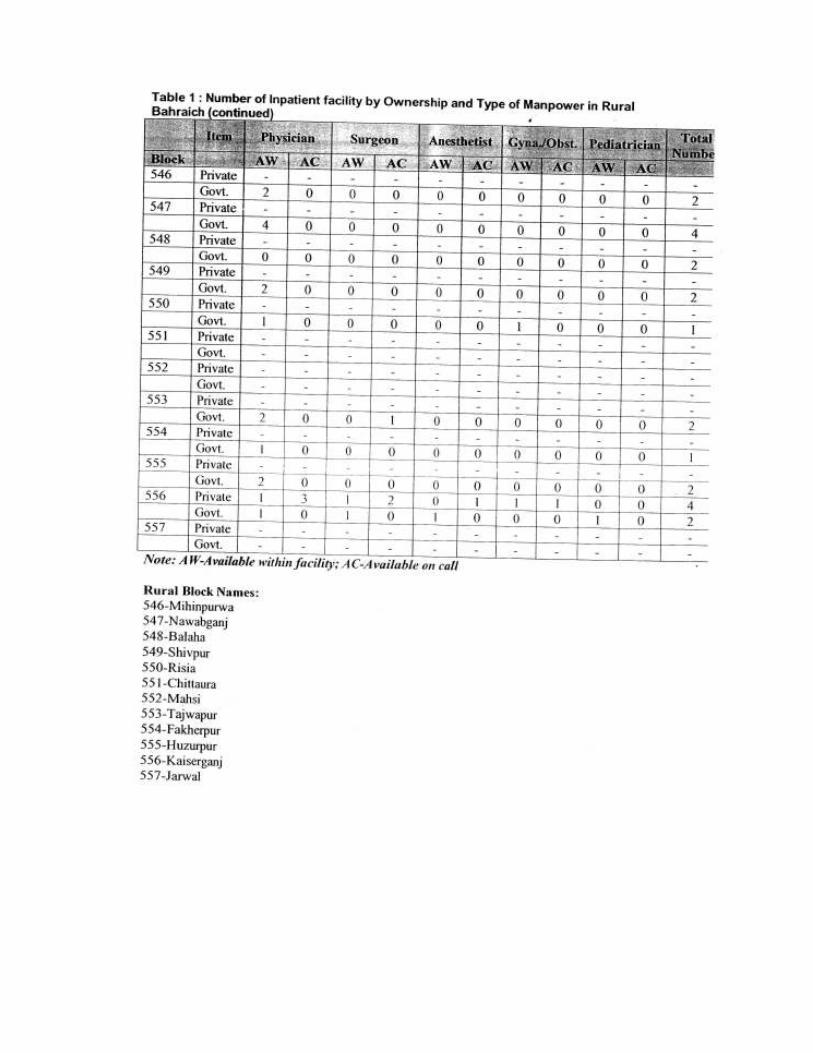
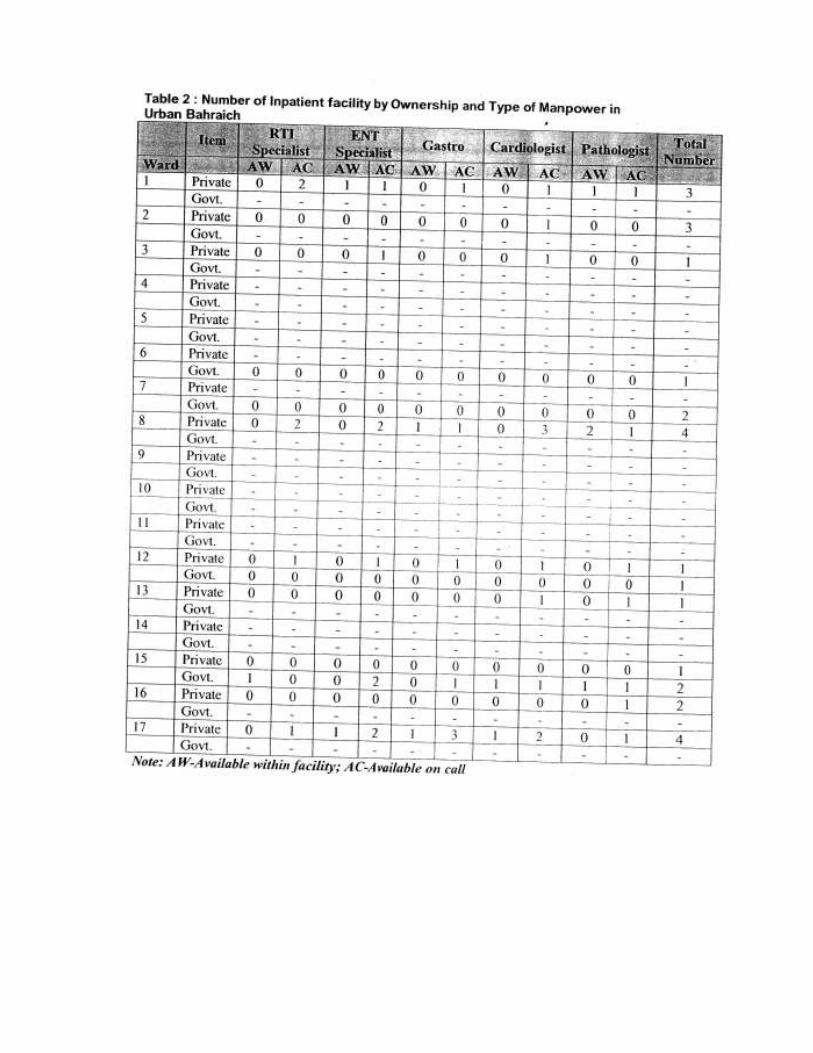
The Health Facility mapping exercise also tried to ascertain the availability of doctors in the facilities. As can be seen from the data, around 68% of the mapped facilities have General Physician while 43% of the facilities have an AYUSH physician available within the facility. Obstetrician/Gynecologist is reportedly available in one-fourth (25%) of the health facilities. Surgeon (17%), Anesthetist (11 %), Pediatrician (11 %) Pathologist (11 %) and Orthopedician (11%) are reported to be available in a few in-patient health facilities. Psychiatrist is not available in any of the health facilities. Among the facilities where doctor/specialists are available, most of these have only one doctor/specialist. In some health facilities more than one doctor/specialist, such as general physician (26%), AYUSH physician (9%), surgeon (6%) and obstetrician/ gynecologist (4%), are available.
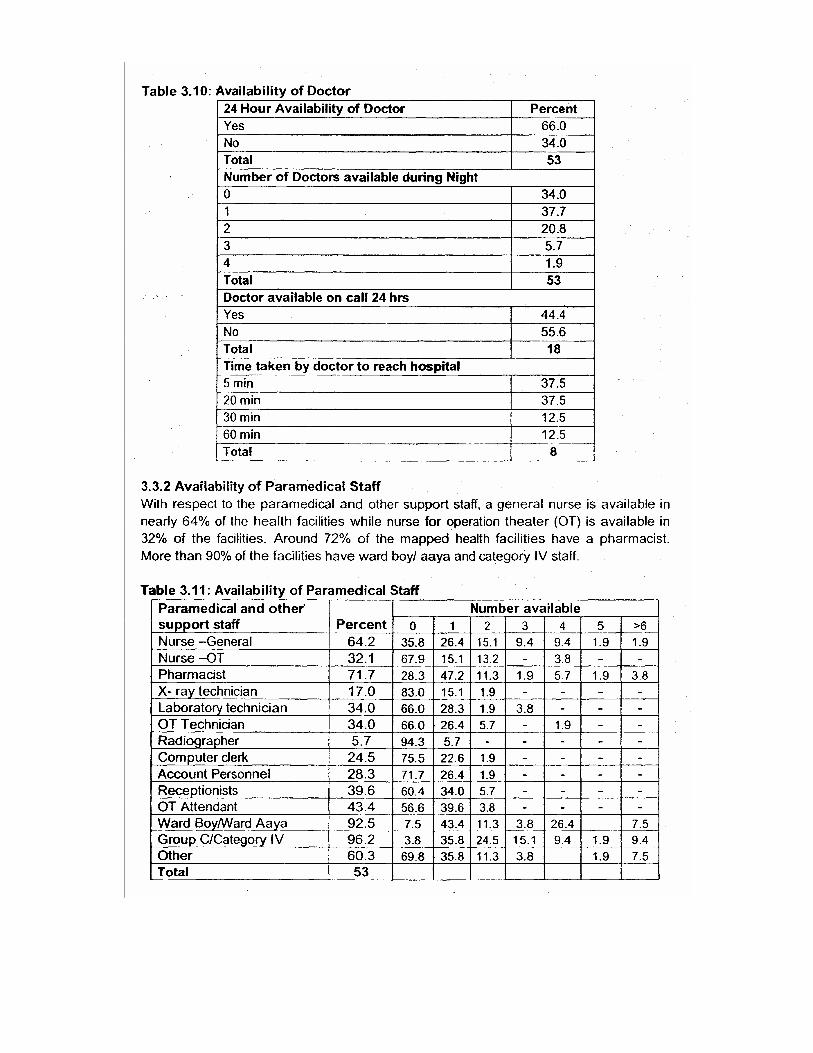

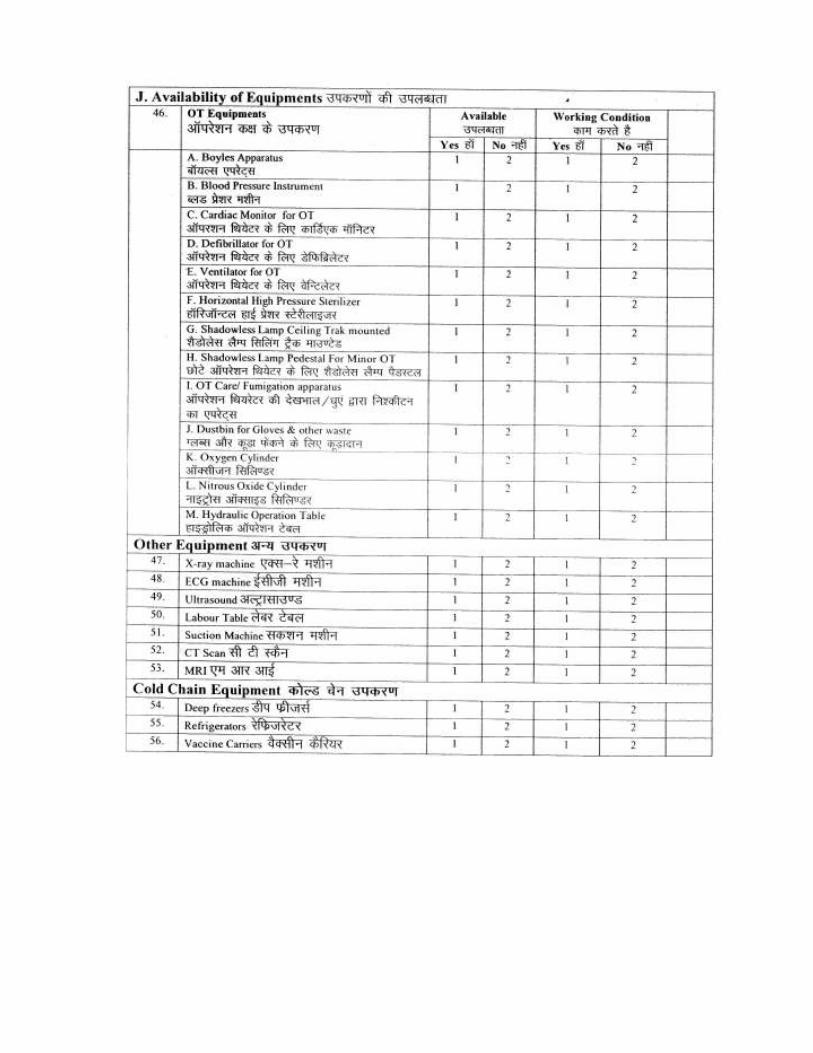
3.4 Availability of Equipment
The survey shows that blood pressure instrument is available in OT in all the facilities (which have OT) while Oxygen cylinder and dustbin for gloves and other waste is available within OT in almost 98% and 93% of in-patient facilities, respectively. Further, Boyles apparatus is also available in the OT in nearly 90% of the facilities. Other equipment specific to OT available in a large proportion of facilities are Horizontal High Pressure Sterilizer (74%), Shadowtess Lamp Pedestal for Minor OT (69%), and Hydraulic Operation Table (69%). Further probing indicates that most of the instruments are in working condition.
Table 3.12: Availability of OT Equipinents
OT Equipments Percent Working condition
Boyles Apparatus 90.5 89.5
Blood Pressure Instrument 100.0 95.2
Cardiac Monitor for OT 52.4 90.9
Defibrillator for OT 26.2 90.9
Ventilator for OT 35.7 93.3
Horizontal High Pressure Sterilizer 73.8 90.3
Shadowless Lamp Ceiling Trak mounted 64.3 88.9
Shadowless Lamp Pedestal for Minor OT 69.0 96.6
OT Care/ Fumigation apparatus 35.7 100.0
Dustbin for Gloves & other waste 92.9 100.0
Oxygen Cylinder 97.6 92.7
Nitrous Oxide Cylinder 35.7 93.3
Hydraulic Operation Table 69.0 93.1
Total N 53 53
Figure 3.4: Availability of OT equipments
120.0
100.0
80.0
60. 0
40.0
20.0
0.0
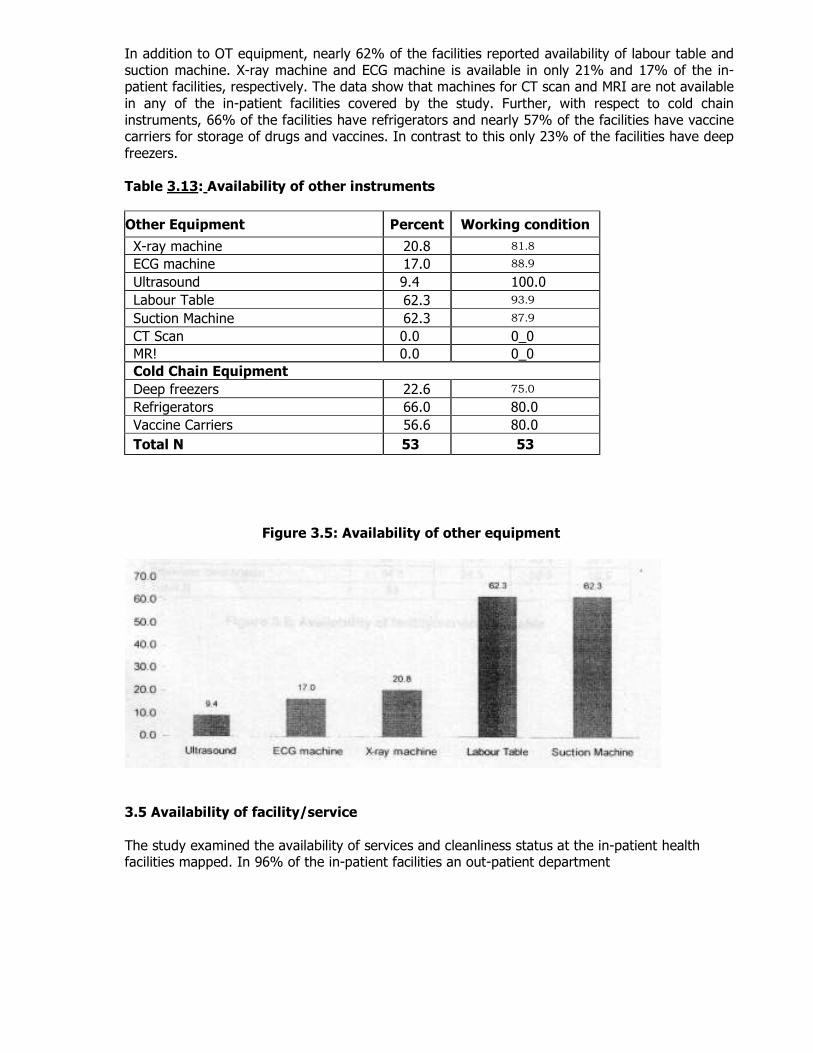
In addition to OT equipment, nearly 62% of the facilities reported availability of labour table and suction machine. X-ray machine and ECG machine is available in only 21% and 17% of the in-patient facilities, respectively. The data show that machines for CT scan and MRI are not available
in any of the in-patient facilities covered by the study. Further, with respect to cold chain instruments, 66% of the facilities have refrigerators and nearly 57% of the facilities have vaccine carriers for storage of drugs and vaccines. In contrast to this only 23% of the facilities have deep
freezers. Table 3.13: Availability of other instruments
Other Equipment Percent Working condition
X-ray machine 20.8 81.8
ECG machine 17.0 88.9
Ultrasound 9.4 100.0
Labour Table _
62.3 93.9
Suction Machine 62.3 87.9
CT Scan 0.0 0_0
MR! 0.0 0_0
Cold Chain Equipment
Deep freezers 22.6 75.0
Refrigerators 66.0 80.0
Vaccine Carriers 56.6 80.0
Total N 53 53
Figure 3.5: Availability of other equipment
3.5 Availability of facility/service
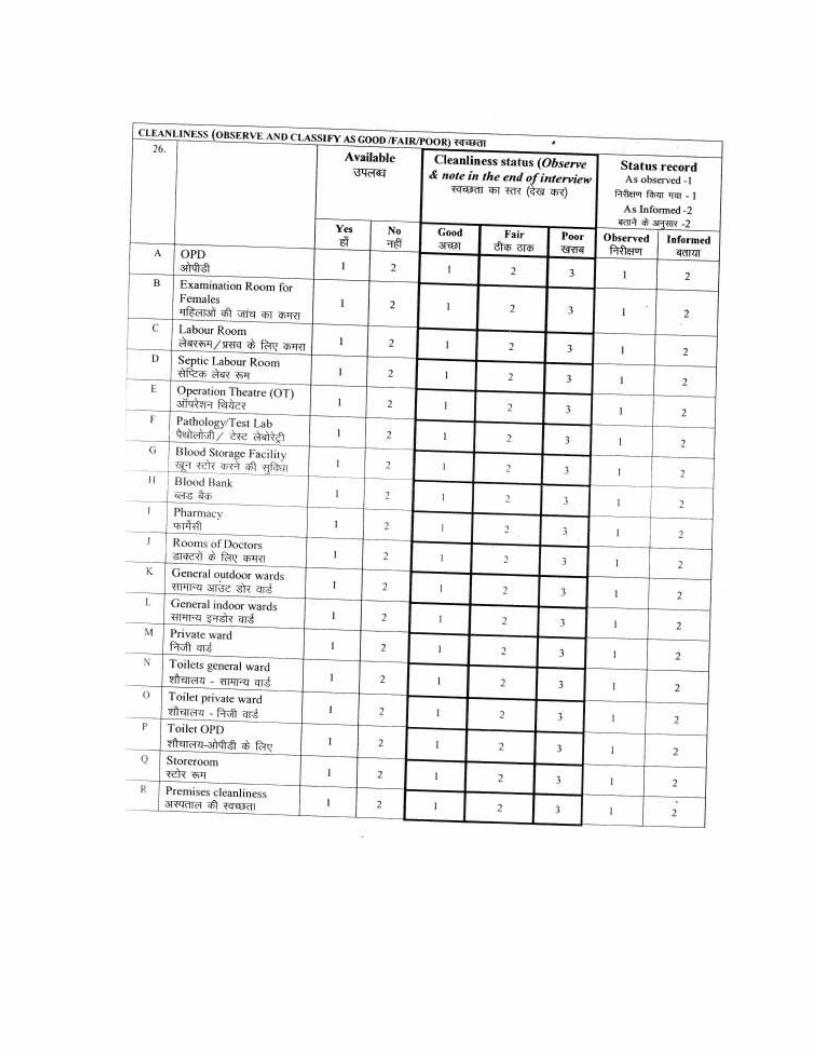
The study examined the availability of services and cleanliness status at the in-patient health facilities mapped. In 96% of the in-patient facilities an out-patient department
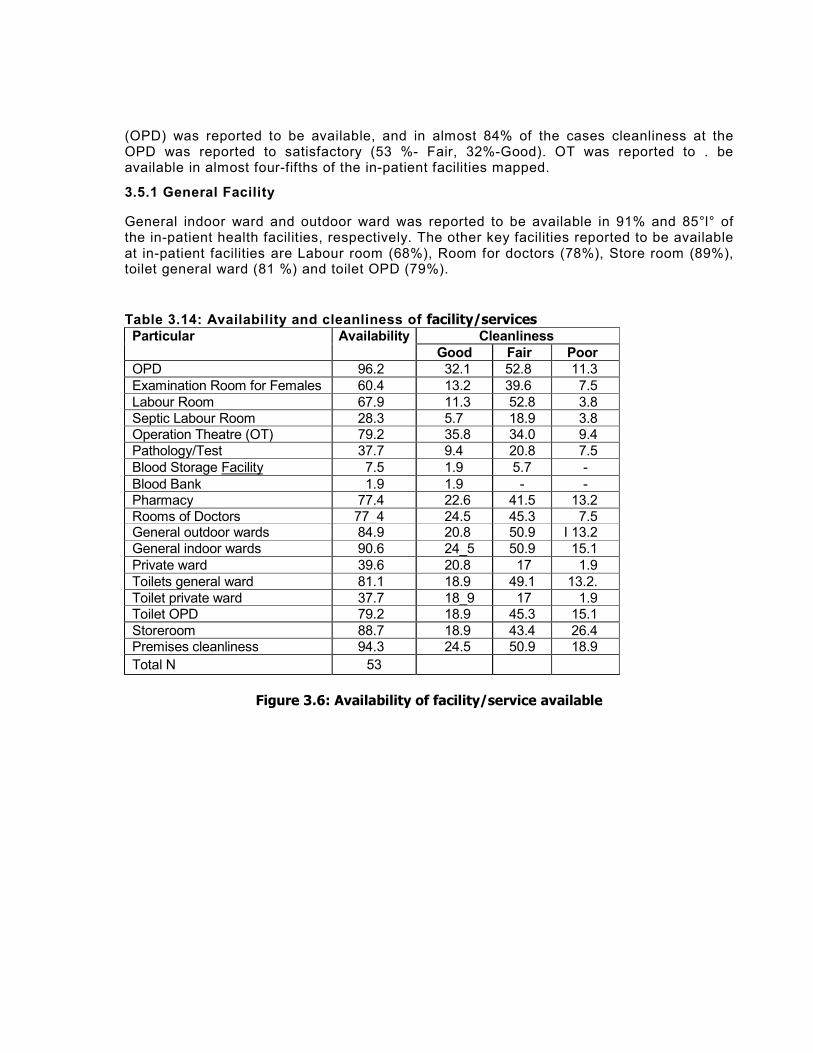
(OPD) was reported to be available, and in almost 84% of the cases cleanliness at the OPD was reported to satisfactory (53 %- Fair, 32%-Good). OT was reported to . be available in almost four-fifths of the in-patient facilities mapped.
3.5.1 General Facility
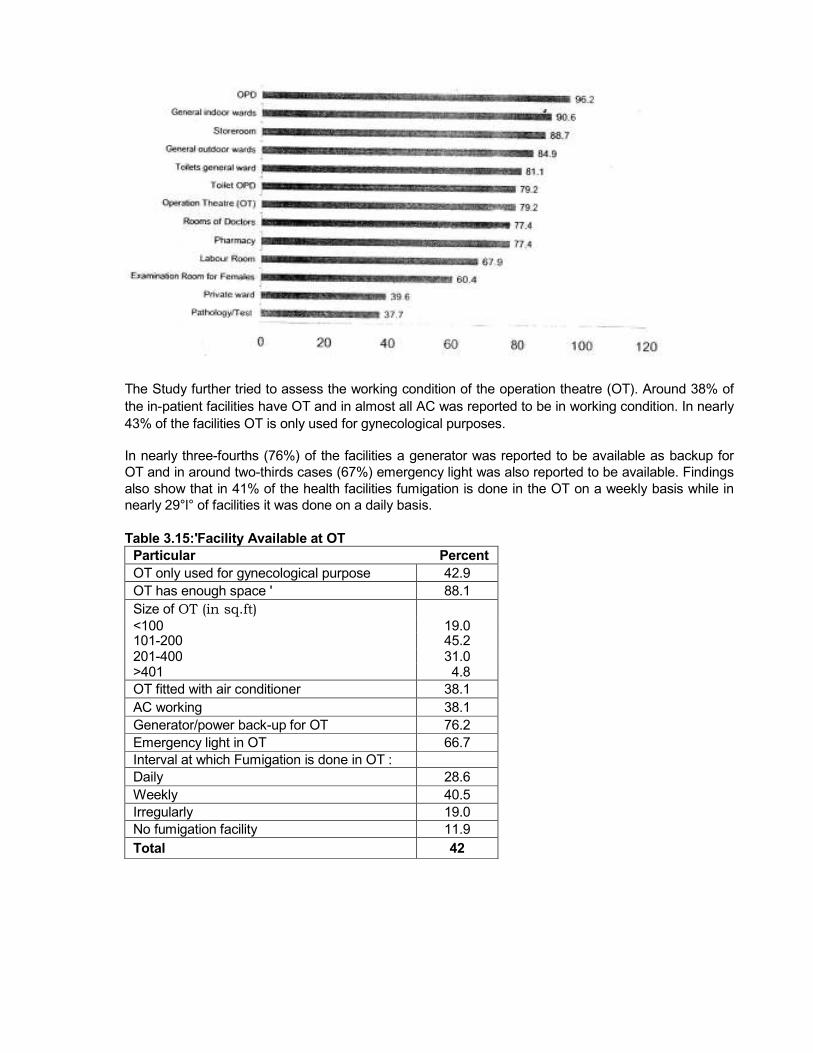
General indoor ward and outdoor ward was reported to be available in 91% and 85°l° of the in-patient health facilities, respectively. The other key facilities reported to be available at in-patient facilities are Labour room (68%), Room for doctors (78%), Store room (89%), toilet general ward (81 %) and toilet OPD (79%).
Table 3.14: Availability and cleanliness of facility/services Particular Availability Cleanliness
Good Fair Poor
OPD 96.2 32.1 52.8 11.3
Examination Room for Females 60.4 13.2 39.6 7.5
Labour Room 67.9 11.3 52.8 3.8
Septic Labour Room 28.3 5.7 18.9 3.8 Operation Theatre (OT) 79.2 35.8 34.0 9.4
Pathology/Test 37.7 9.4 20.8 7.5
Blood Storage Facility 7.5 1.9 5.7 -
Blood Bank 1.9 1.9 - - Pharmacy 77.4 22.6 41.5 13.2
Rooms of Doctors 77_4 24.5 45.3 7.5 General outdoor wards 84.9 20.8 50.9 I 13.2
General indoor wards 90.6 24_5 50.9 15.1
Private ward 39.6 20.8 17 1.9
Toilets general ward 81.1 18.9 49.1 13.2.
Toilet private ward 37.7 18_9 17 1.9 Toilet OPD 79.2 18.9 45.3 15.1
Storeroom 88.7 18.9 43.4 26.4 Premises cleanliness 94.3 24.5 50.9 18.9
Total N 53
Figure 3.6: Availability of facility/service available
The Study further tried to assess the working condition of the operation theatre (OT). Around 38% of
the in-patient facilities have OT and in almost all AC was reported to be in working condition. In nearly
43% of the facilities OT is only used for gynecological purposes.
In nearly three-fourths (76%) of the facilities a generator was reported to be available as backup for
OT and in around two-thirds cases (67%) emergency light was also reported to be available. Findings
also show that in 41% of the health facilities fumigation is done in the OT on a weekly basis while in
nearly 29°l° of facilities it was done on a daily basis.
Table 3.15:'Facility Available at OT
Particular Percent
OT only used for gynecological purpose 42.9
OT has enough space ' 88.1
Size of OT (in sq.ft) <100 19.0 101-200 45.2 201-400 31.0 >401 4.8
OT fitted with air conditioner 38.1
AC working 38.1
Generator/power back-up for OT 76.2
Emergency light in OT 66.7
Interval at which Fumigation is done in OT :
Daily 28.6
Weekly 40.5
Irregularly 19.0
No fumigation facility 11.9
Total 42
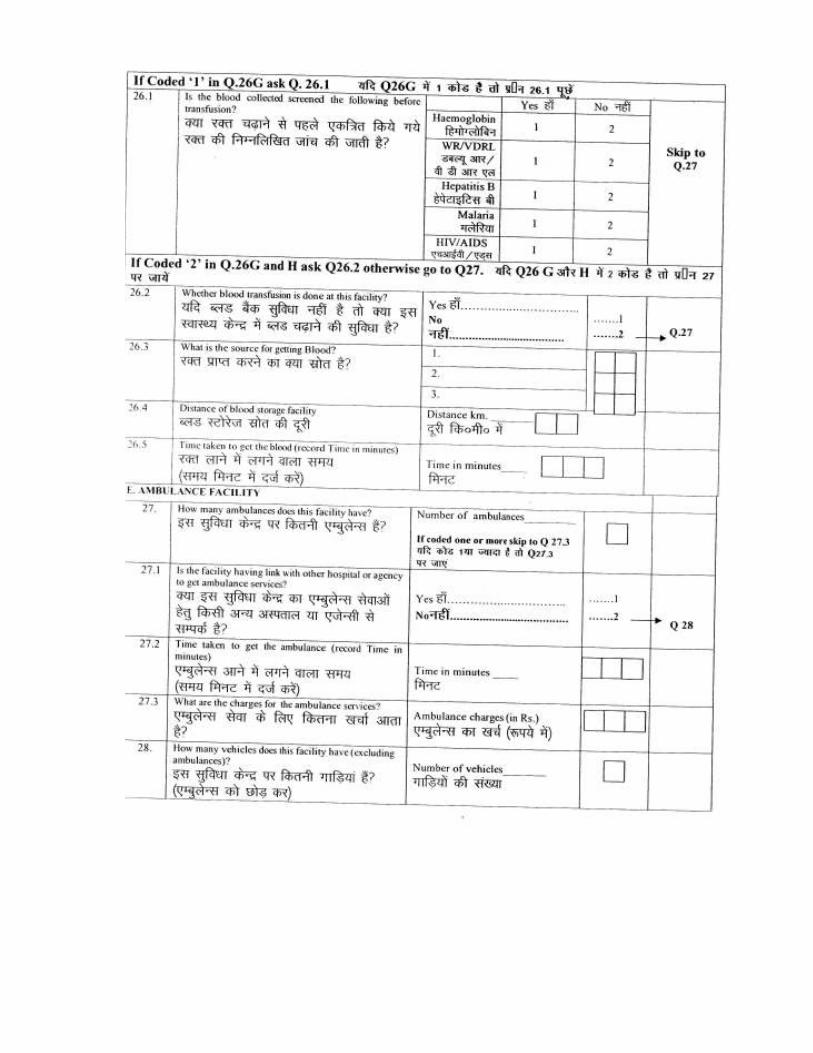
Among the health facilities where blood storage facility is available (N=4), in half the facilities collected blood is screened for Hemoglobin, WRNDRL and Malaria before transfusion. In spite of non-availability of blood storage facility, blood transfusion is carried out in nearly 45% of the facilities. For this blood is generally taken from other facilities located within the range of 26-27 kms.
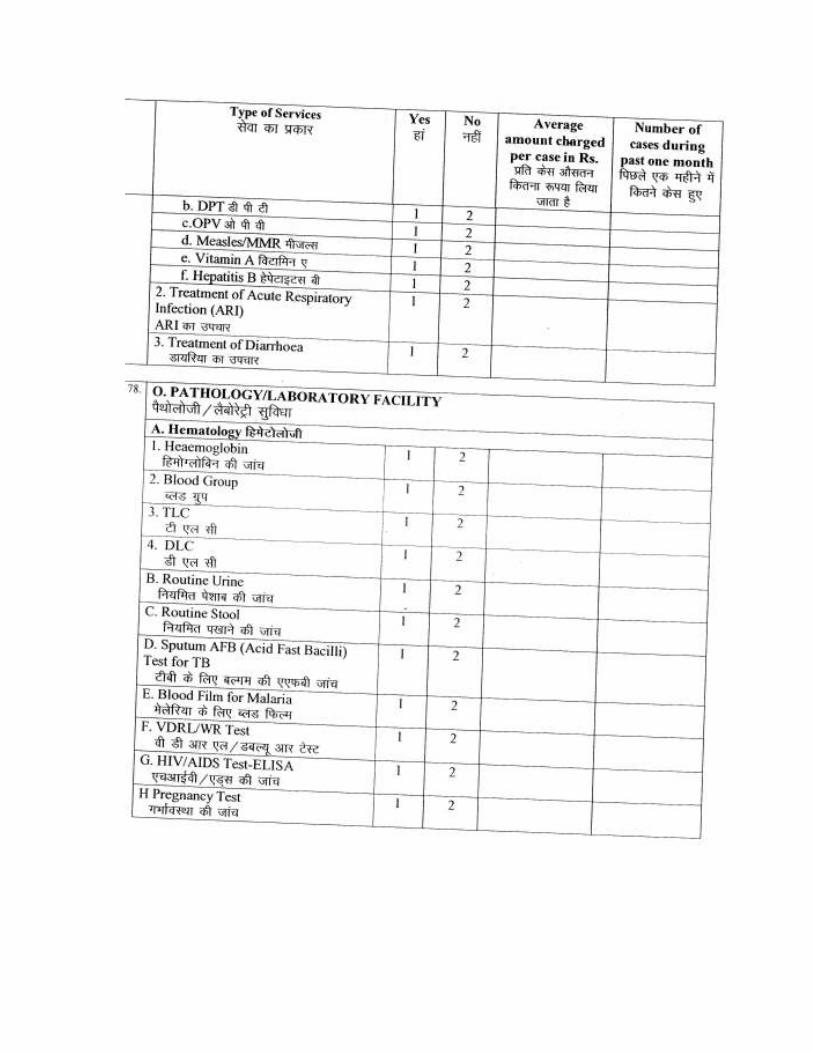
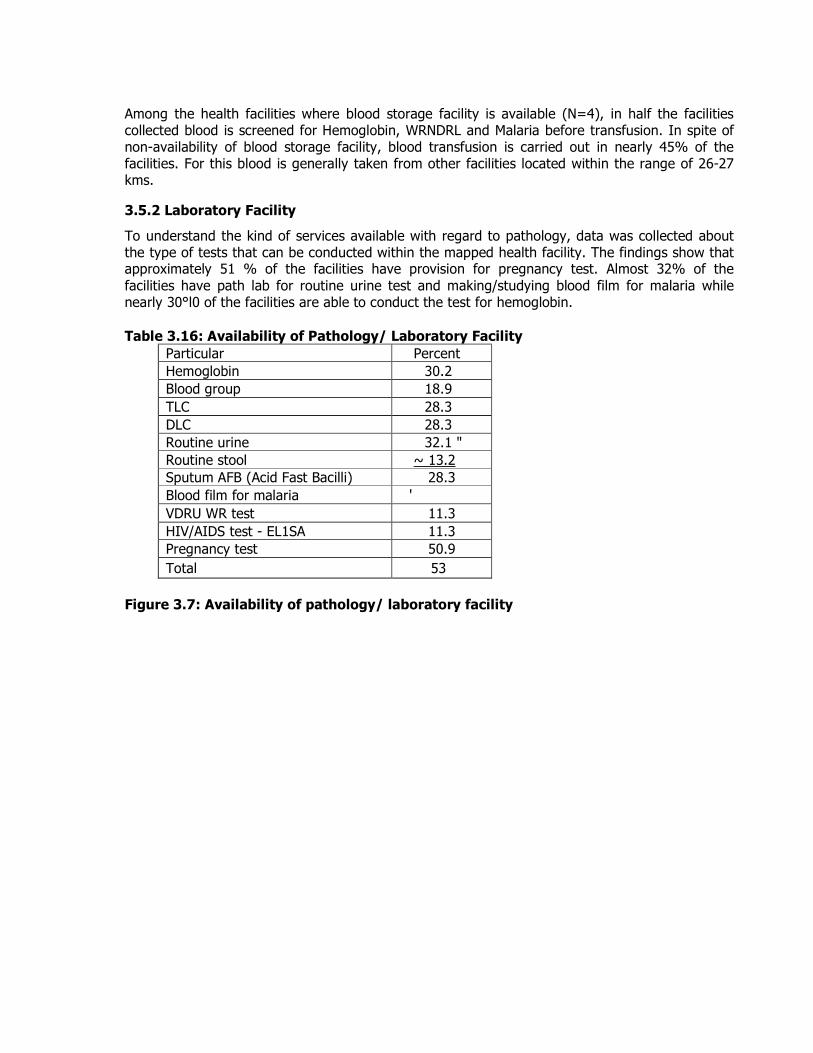
3.5.2 Laboratory Facility
To understand the kind of services available with regard to pathology, data was collected about the type of tests that can be conducted within the mapped health facility. The findings show that approximately 51 % of the facilities have provision for pregnancy test. Almost 32% of the
facilities have path lab for routine urine test and making/studying blood film for malaria while nearly 30°l0 of the facilities are able to conduct the test for hemoglobin.
Table 3.16: Availability of Pathology/ Laboratory Facility
Particular Percent
Hemoglobin 30.2
Blood group 18.9
TLC 28.3
DLC 28.3
Routine urine 32.1 "
Routine stool ~ 13.2
Sputum AFB (Acid Fast Bacilli) 28.3
Blood film for malaria ' 32.1 VDRU WR test 11.3
HIV/AIDS test - EL1SA 11.3
Pregnancy test 50.9
Total 53
Figure 3.7: Availability of pathology/ laboratory facility
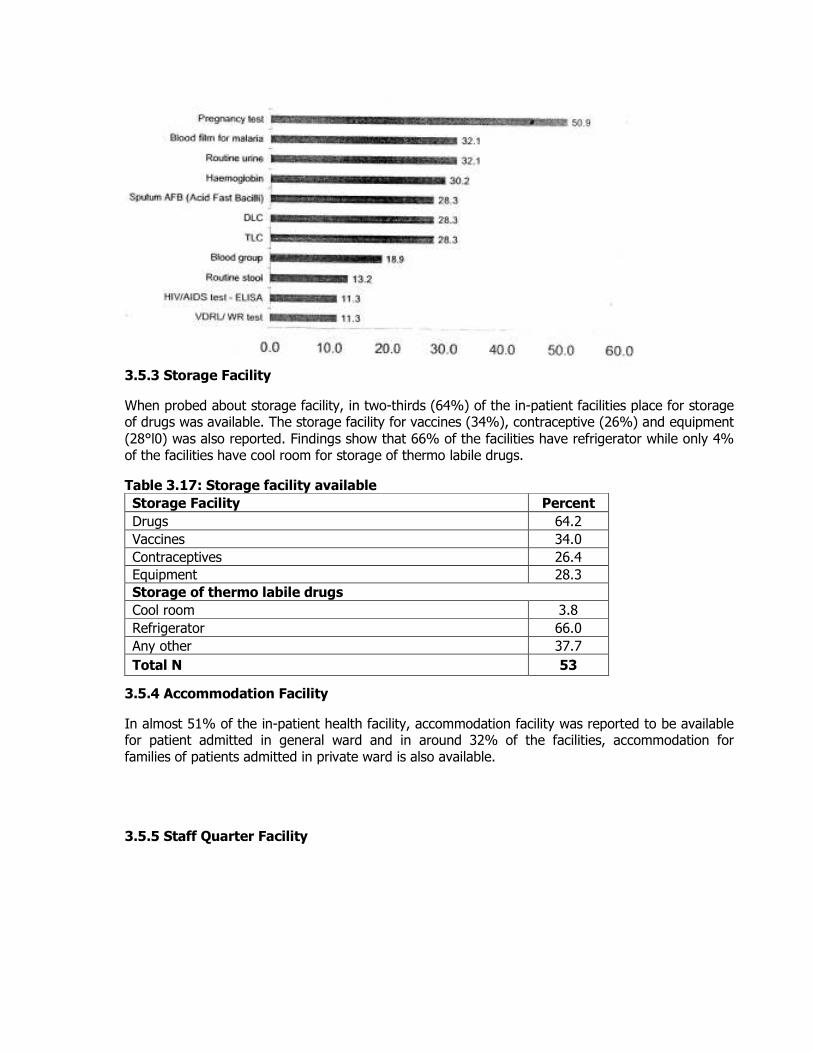
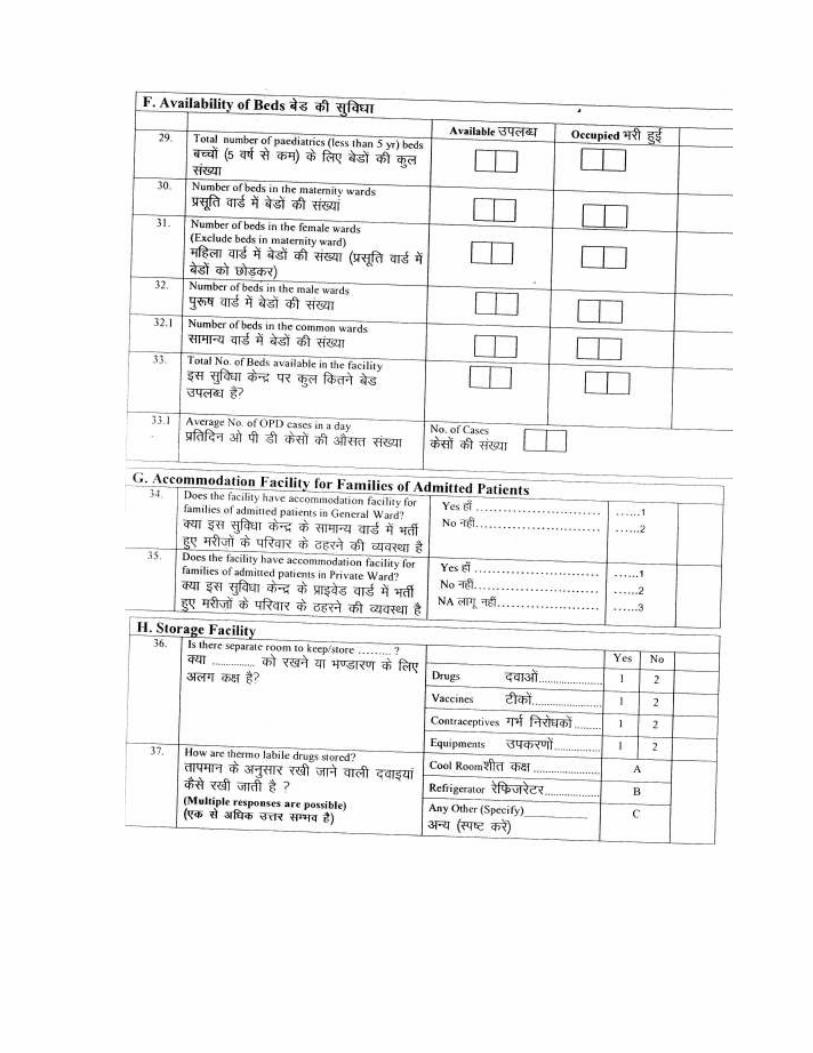
3.5.3 Storage Facility
When probed about storage facility, in two-thirds (64%) of the in-patient facilities place for storage of drugs was available. The storage facility for vaccines (34%), contraceptive (26%) and equipment
(28°l0) was also reported. Findings show that 66% of the facilities have refrigerator while only 4% of the facilities have cool room for storage of thermo labile drugs.
Table 3.17: Storage facility available
Storage Facility Percent
Drugs 64.2
Vaccines 34.0
Contraceptives 26.4
Equipment 28.3
Storage of thermo labile drugs
Cool room 3.8
Refrigerator 66.0
Any other 37.7
Total N 53
3.5.4 Accommodation Facility
In almost 51% of the in-patient health facility, accommodation facility was reported to be available for patient admitted in general ward and in around 32% of the facilities, accommodation for families of patients admitted in private ward is also available.
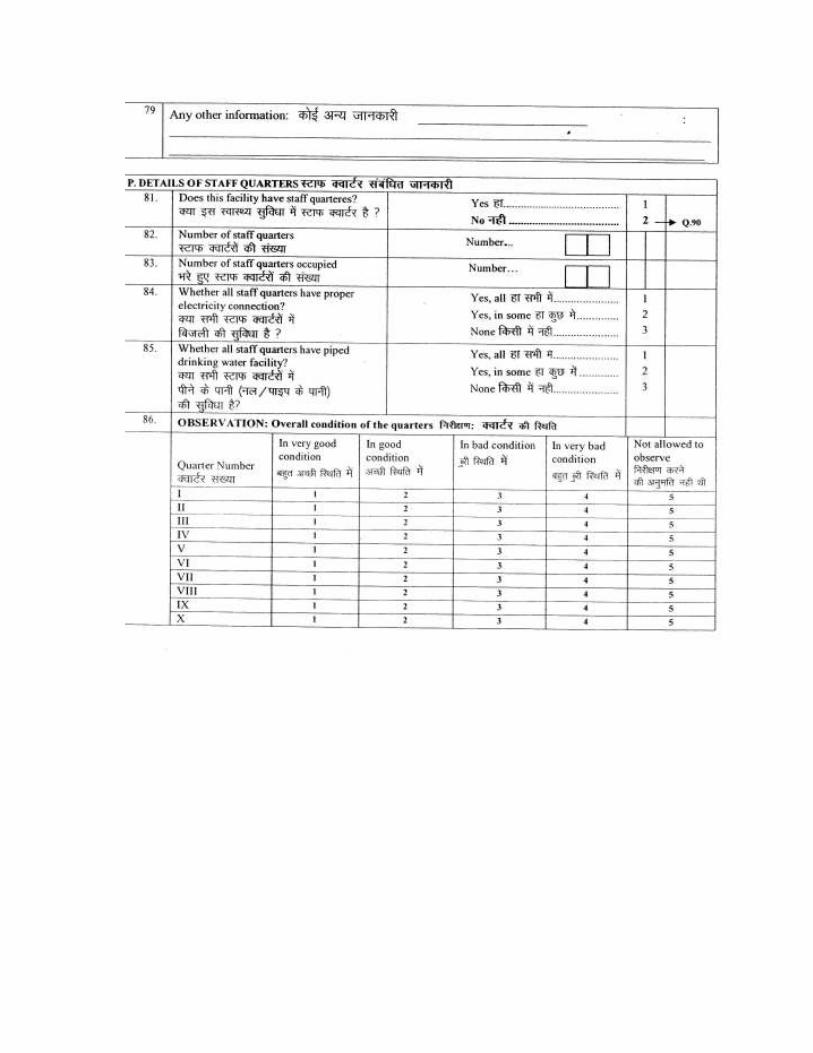
3.5.5 Staff Quarter Facility
Findings show that staff quarters are available in almost 57% of the mapped health facilities. Most of them have provision of electricity and piped drinking water. Table 3.18: Availability of Staff Quarter
Particular Percent
Available 56.6
Not available 43_4
Total 53
Electricity connection in staff quarters
Yes, all 73.3
Yes, in some 23.3
None 3.3
Total 30
Piped drinking water facility in staff quarter
Yes, all 76.7
Yes, in some 23.3
Total 30
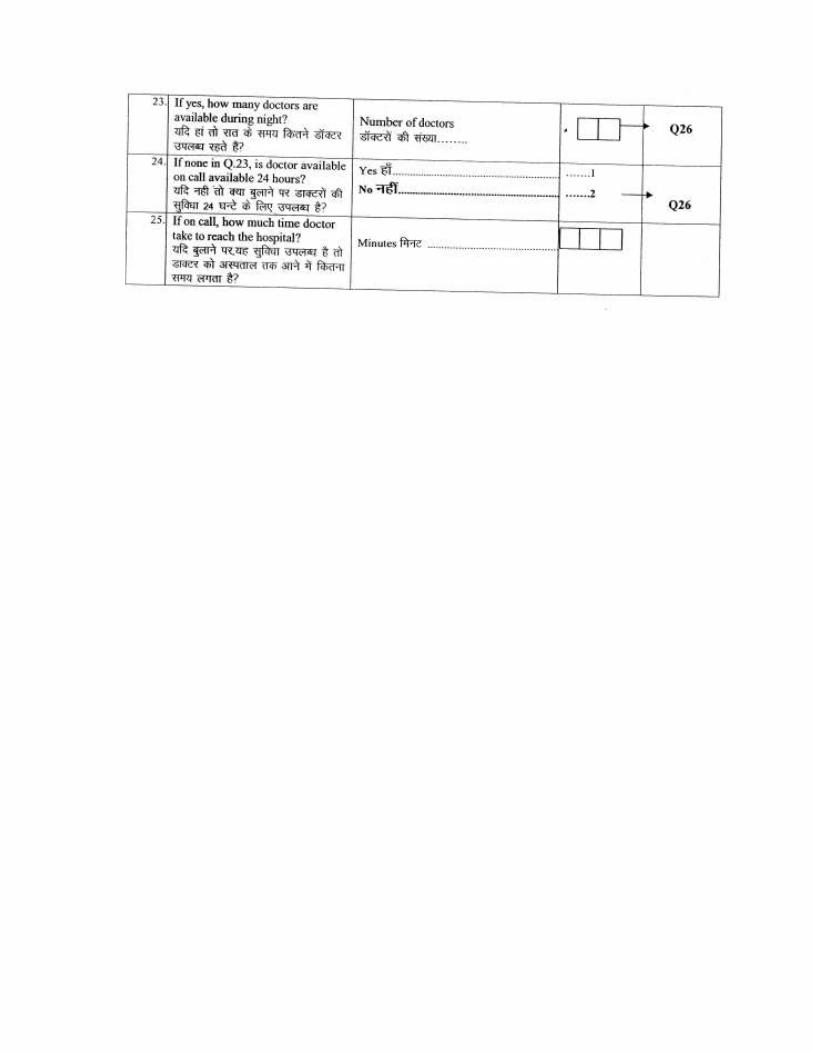
3.5.6 Availability of Ambulance The study further explores the availability of ambulance in the health facility. It is found that almost 68% of the in-patient health facilities do not have availability of ambulance. Nearly 26% of the facilities have 1 ambulance while around 6% of the facilities have 2 ambulances for providing in-patient services. Nearly 23% of the health facilities which do not have ambulance of their own, maintain link with other hospitals/ agency to get ambulance service as and when required. Table 3.19: Availability of Ambulance
Number of Ambulances available Percent
0 67.9 1 26.4 2 5.7
Link with other hospital/agency to et ambulance services
Yes 22.6 No 77.4
Total 53
3.5.7 Availability of Beds When probed about availability of beds it is found that most of the mapped health facilities (47%) have total 1-5 beds available for in-patient services while around 23% of the facilities have more than 20 beds within the facility. In many (around 41%) of the health facilities beds are lying vacant. Table 3.20: Availability of Beds
Percent Total number of beds Available Occupied
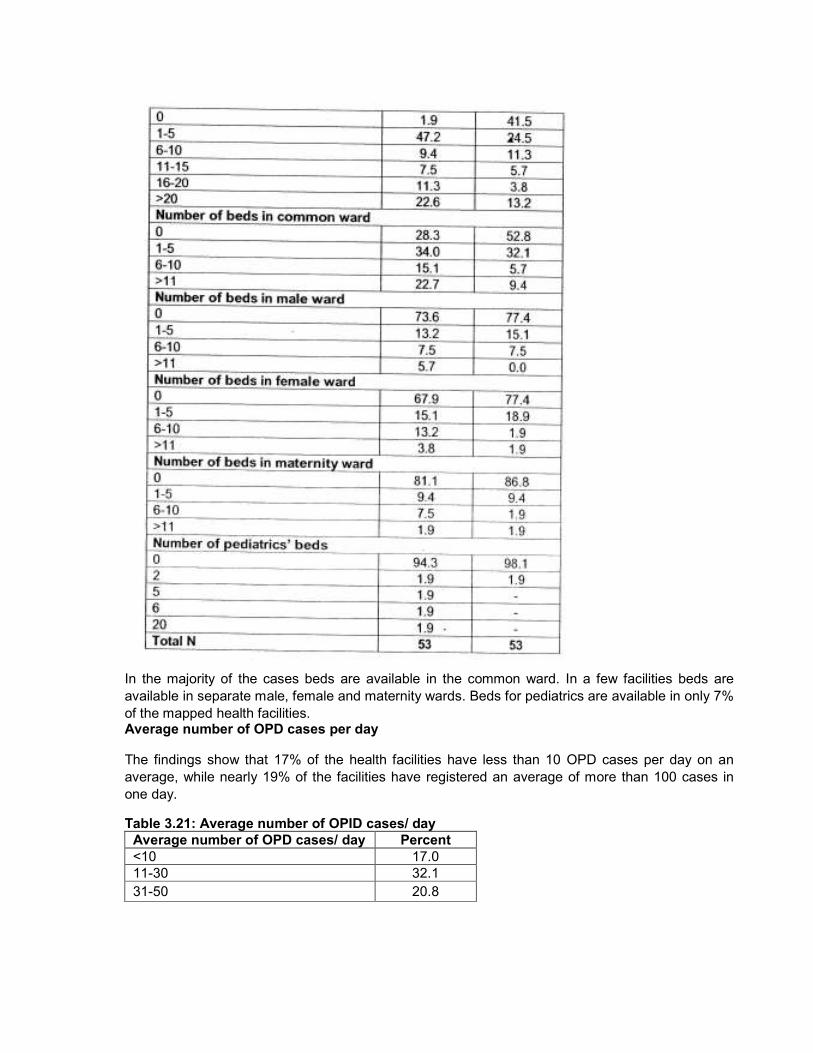
In the majority of the cases beds are available in the common ward. In a few facilities beds are
available in separate male, female and maternity wards. Beds for pediatrics are available in only 7%
of the mapped health facilities. Average number of OPD cases per day
The findings show that 17% of the health facilities have less than 10 OPD cases per day on an
average, while nearly 19% of the facilities have registered an average of more than 100 cases in
one day.
Table 3.21: Average number of OPID cases/ day
Average number of OPD cases/ day Percent
<10 17.0
11-30 32.1
31-50 20.8
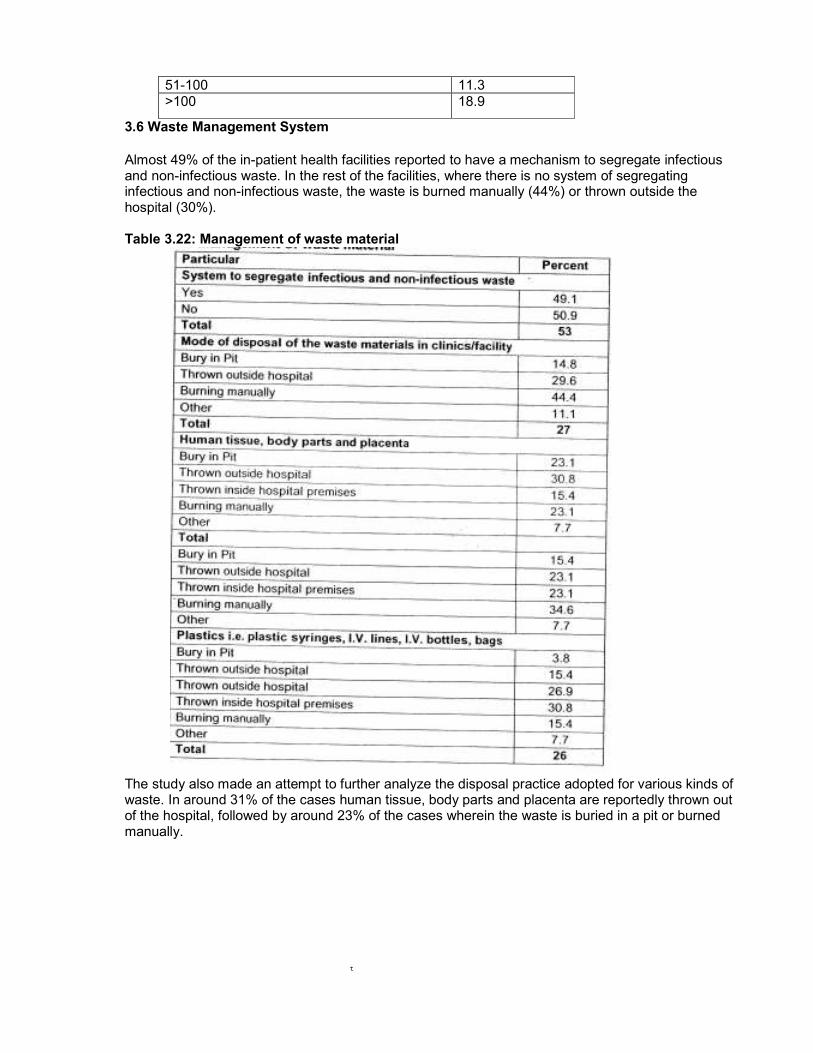
51-100 11.3
>100 18.9
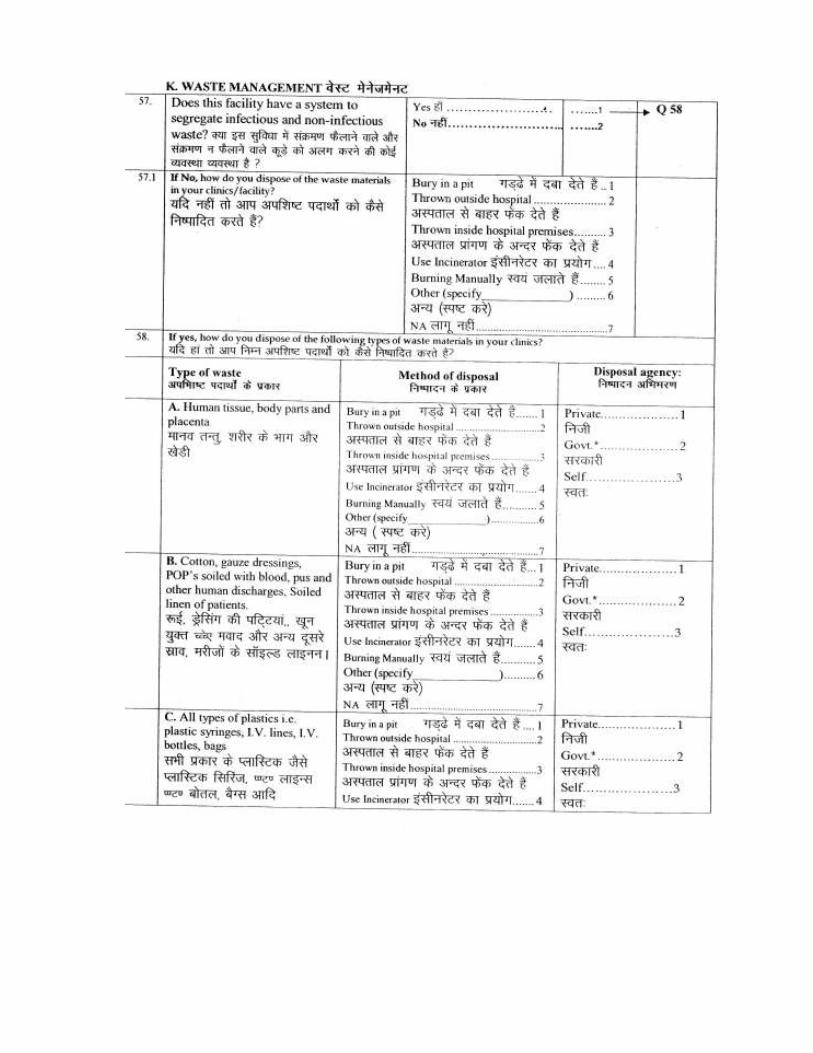
3.6 Waste Management System
Almost 49% of the in-patient health facilities reported to have a mechanism to segregate infectious and non-infectious waste. In the rest of the facilities, where there is no system of segregating infectious and non-infectious waste, the waste is burned manually (44%) or thrown outside the hospital (30%). Table 3.22: Management of waste material
The study also made an attempt to further analyze the disposal practice adopted for various kinds of waste. In around 31% of the cases human tissue, body parts and placenta are reportedly thrown out of the hospital, followed by around 23% of the cases wherein the waste is buried in a pit or burned manually.
t
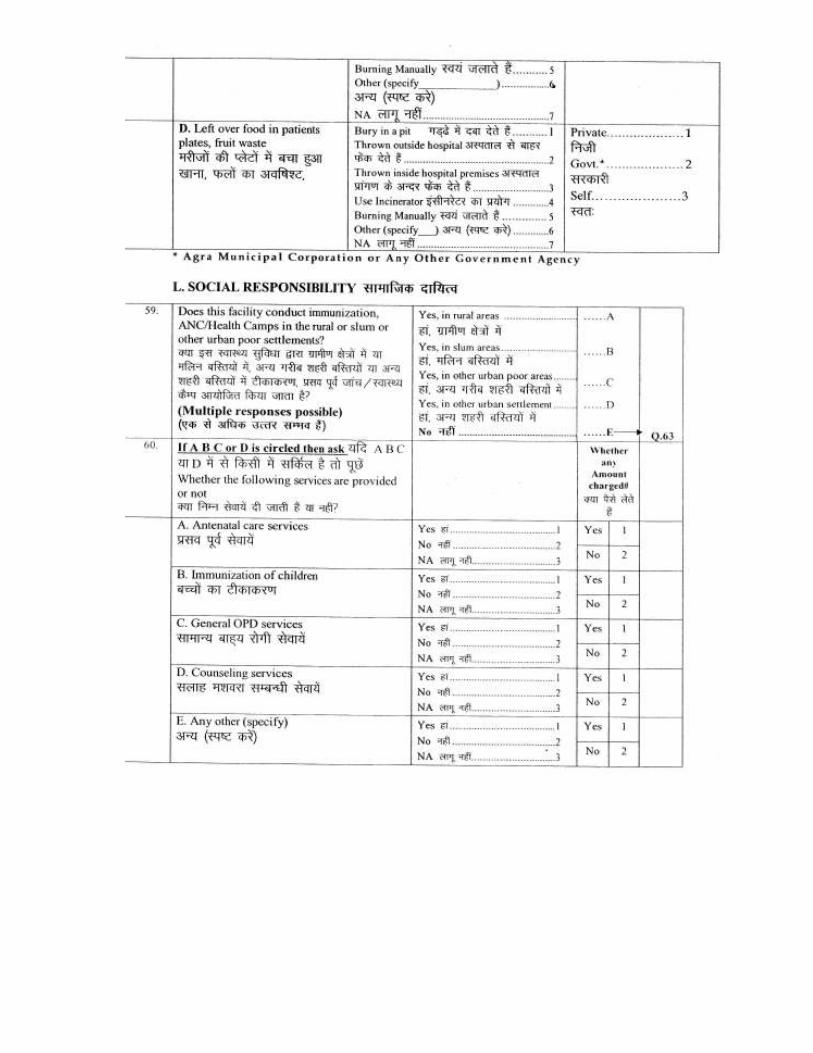
In 50% of the facilities all types of plastic are usually burned manually-and in 27% of the cases it
is thrown inside the hospital premise. Further analysis shows that in nearly 31 % of the facilities
left over food from the patients' plates and fruits are thrown inside the hospital premises; while
in 27% of the facilities waste is thrown outside the hospital.
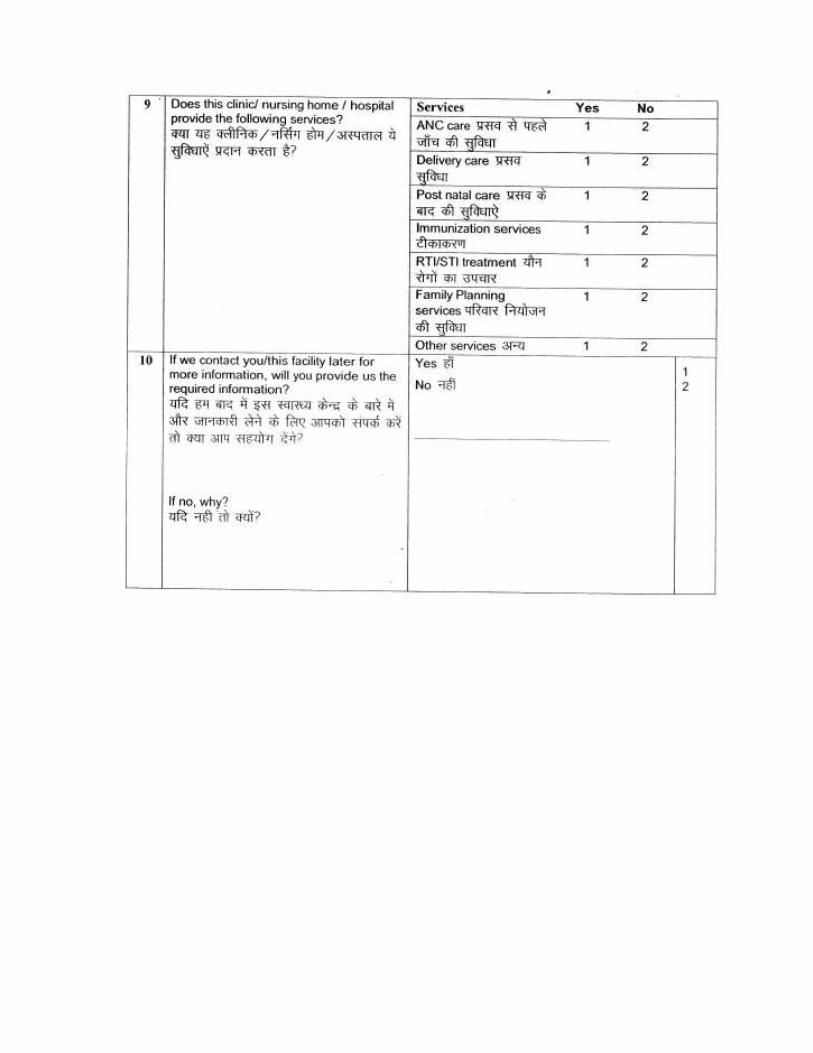
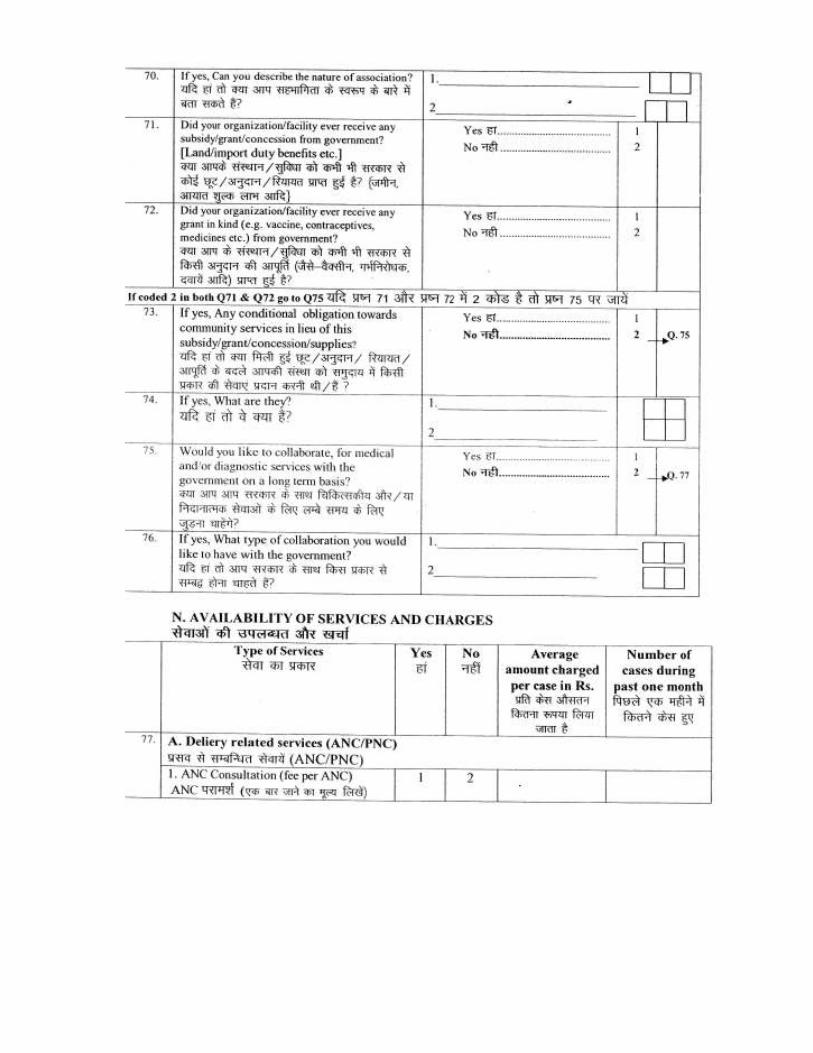
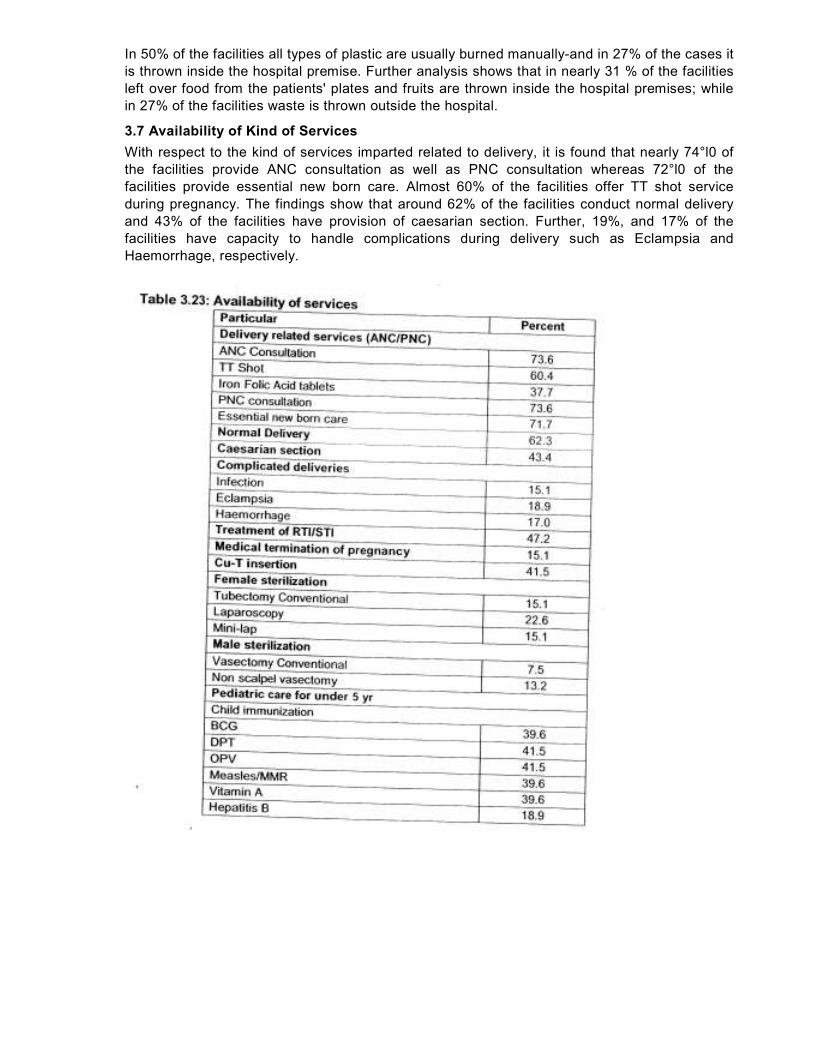
3.7 Availability of Kind of Services
With respect to the kind of services imparted related to delivery, it is found that nearly 74°l0 of
the facilities provide ANC consultation as well as PNC consultation whereas 72°l0 of the
facilities provide essential new born care. Almost 60% of the facilities offer TT shot service
during pregnancy. The findings show that around 62% of the facilities conduct normal delivery
and 43% of the facilities have provision of caesarian section. Further, 19%, and 17% of the
facilities have capacity to handle complications during delivery such as Eclampsia and
Haemorrhage, respectively.
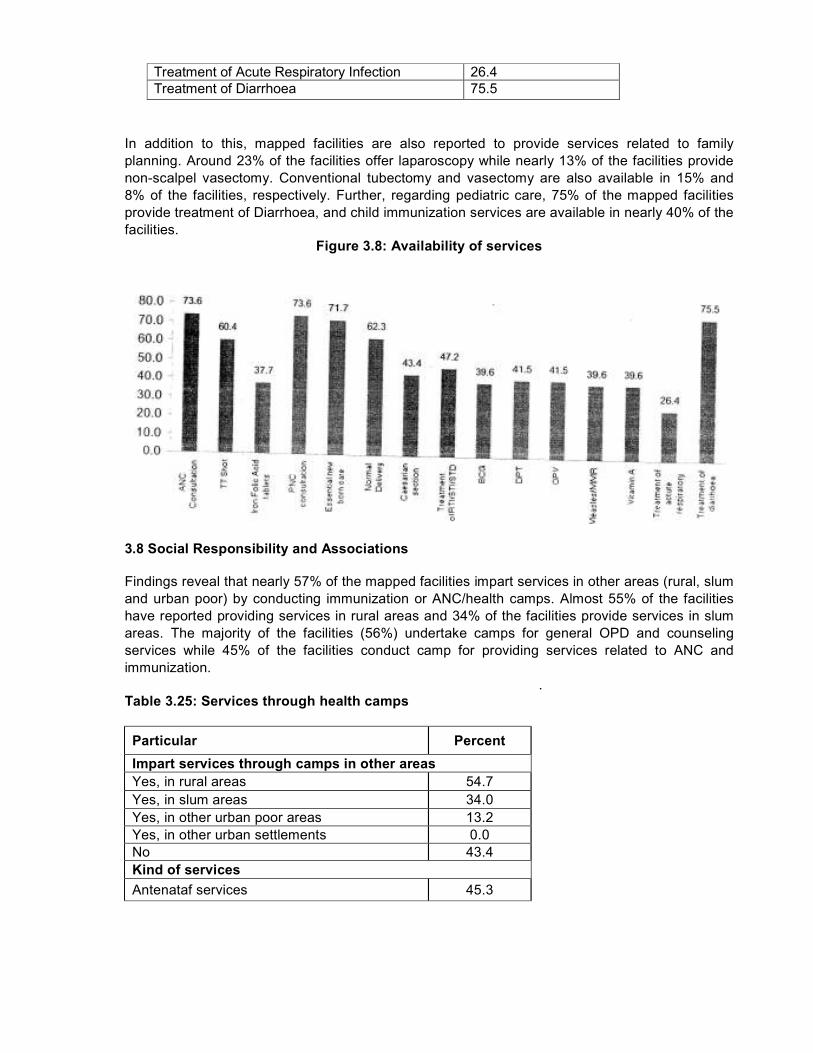
Treatment of Acute Respiratory Infection 26.4
Treatment of Diarrhoea 75.5
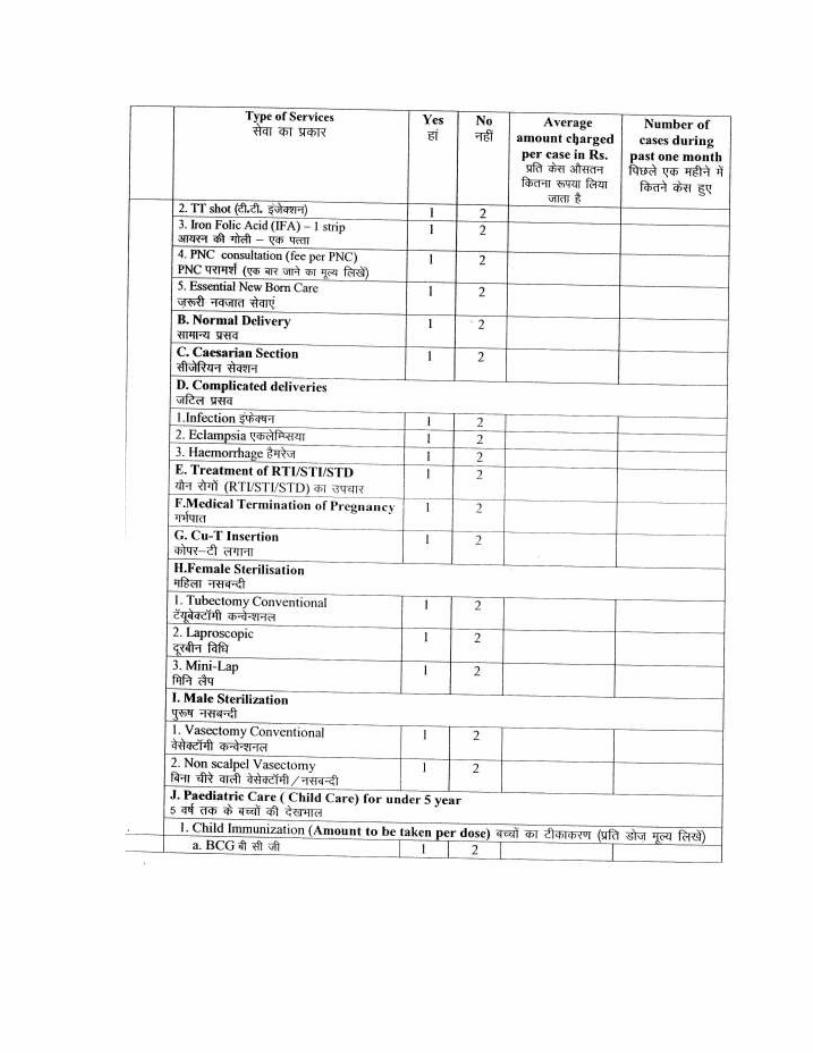
In addition to this, mapped facilities are also reported to provide services related to family
planning. Around 23% of the facilities offer laparoscopy while nearly 13% of the facilities provide
non-scalpel vasectomy. Conventional tubectomy and vasectomy are also available in 15% and
8% of the facilities, respectively. Further, regarding pediatric care, 75% of the mapped facilities
provide treatment of Diarrhoea, and child immunization services are available in nearly 40% of the
facilities.
Figure 3.8: Availability of services
3.8 Social Responsibility and Associations
Findings reveal that nearly 57% of the mapped facilities impart services in other areas (rural, slum
and urban poor) by conducting immunization or ANC/health camps. Almost 55% of the facilities
have reported providing services in rural areas and 34% of the facilities provide services in slum
areas. The majority of the facilities (56%) undertake camps for general OPD and counseling
services while 45% of the facilities conduct camp for providing services related to ANC and
immunization.
.
Table 3.25: Services through health camps
Particular Percent
Impart services through camps in other areas
Yes, in rural areas 54.7
Yes, in slum areas 34.0
Yes, in other urban poor areas 13.2
Yes, in other urban settlements 0.0
No 43.4
Kind of services
Antenataf services 45.3
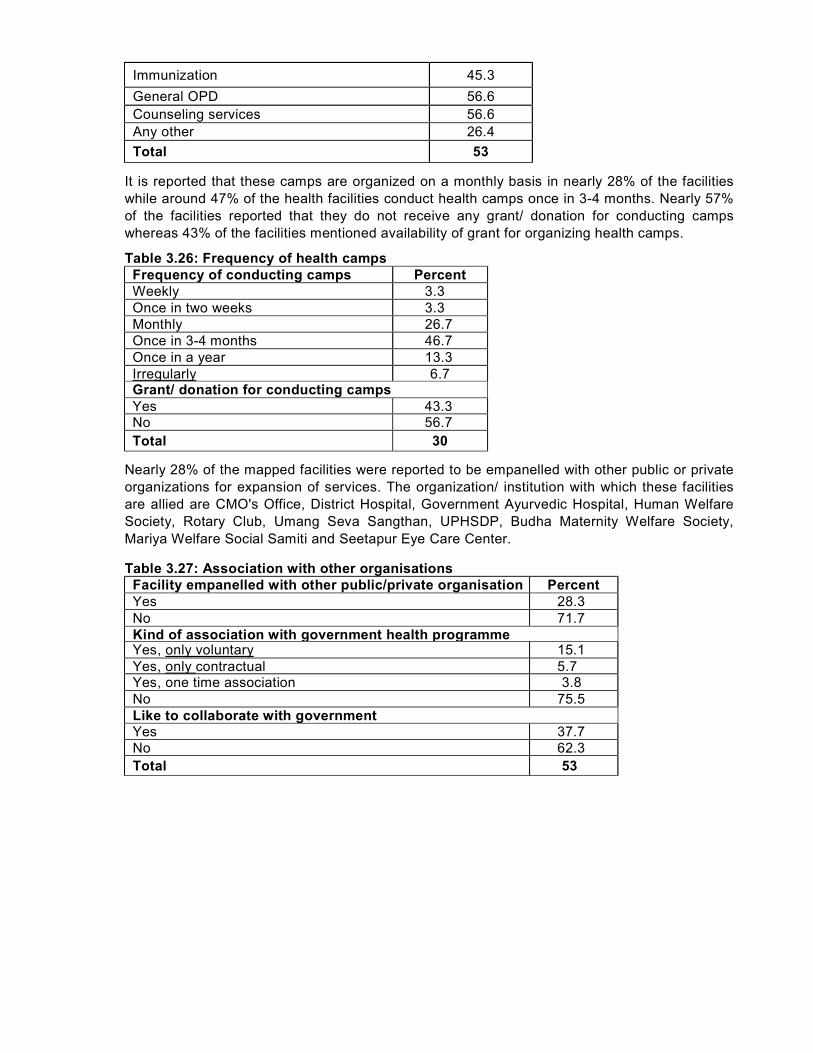
Immunization 45.3
General OPD 56.6
Counseling services 56.6
Any other 26.4
Total 53
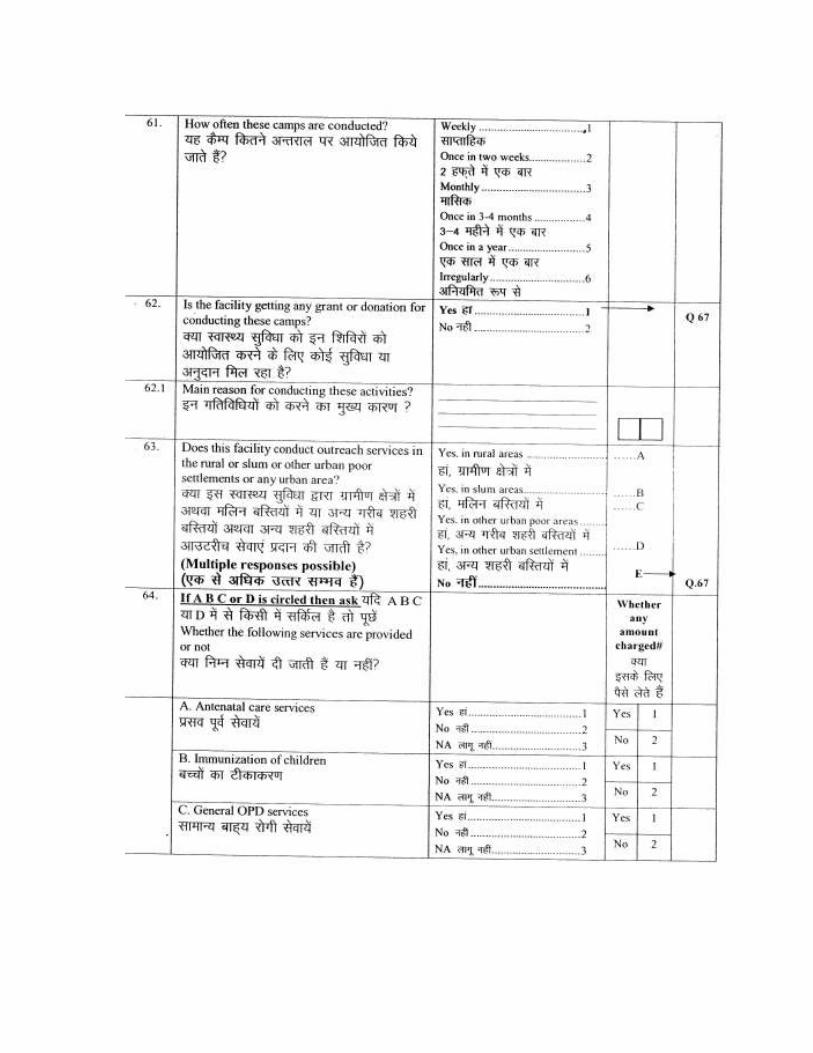
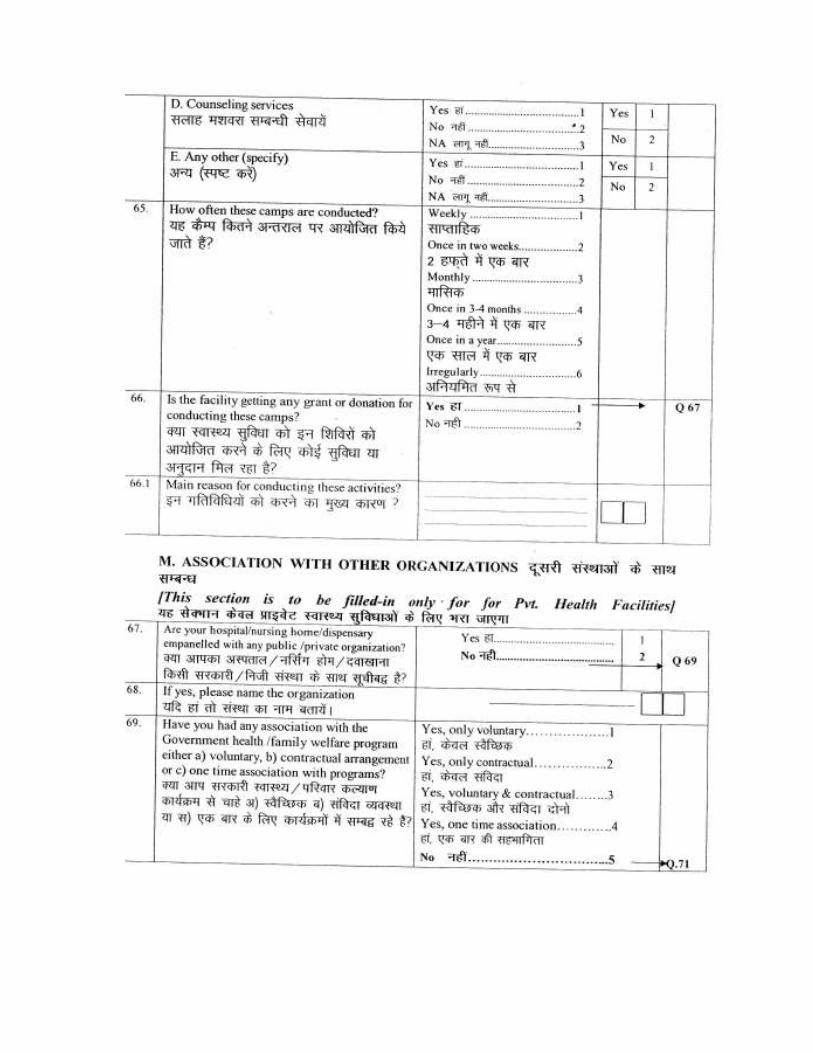
It is reported that these camps are organized on a monthly basis in nearly 28% of the facilities
while around 47% of the health facilities conduct health camps once in 3-4 months. Nearly 57%
of the facilities reported that they do not receive any grant/ donation for conducting camps
whereas 43% of the facilities mentioned availability of grant for organizing health camps.
Table 3.26: Frequency of health camps
Frequency of conducting camps Percent
Weekly 3.3
Once in two weeks 3.3
Monthly 26.7
Once in 3-4 months 46.7
Once in a year 13.3
Irregularly 6.7 Grant/ donation for conducting camps
Yes 43.3 No 56.7
Total 30
Nearly 28% of the mapped facilities were reported to be empanelled with other public or private
organizations for expansion of services. The organization/ institution with which these facilities
are allied are CMO's Office, District Hospital, Government Ayurvedic Hospital, Human Welfare
Society, Rotary Club, Umang Seva Sangthan, UPHSDP, Budha Maternity Welfare Society,
Mariya Welfare Social Samiti and Seetapur Eye Care Center.
Table 3.27: Association with other organisations
Facility empanelled with other public/private organisation Percent
Yes 28.3
No 71.7
Kind of association with government health programme Yes, only voluntary 15.1
Yes, only contractual 5.7 Yes, one time association 3.8
No 75.5
Like to collaborate with government Yes 37.7
No 62.3
Total 53

Further analysis shows that nearly 15% of the health facilities have voluntary association with government health programmes while in 6% of the facilities it is contractual. Almost 62% of the mapped health facilities are willing to collaborate with the government on a long term basis for medical/ diagnostic services.