Embed Size (px)
Citation preview
M&A Market Analysis and
Capital Markets Update
Q3 2015
Facility, Industrial & Rental Services Report A Middle-Market Perspective
Peter S. Kies Head of Technology & Business Services [email protected] 414 765-7262
John R. Lanza Head of Industrial Services [email protected] 414 298-7669
Ross W. Williams Head of Facility Services [email protected] 414 298-6235
David M. Silver Managing Director, Europe [email protected] +44 (0) 20 7667 8216
Jonathan J. Harrison Managing Director, Europe [email protected] +44 (0) 20 7667 8414
Tim H. Shea Vice President [email protected] 414 298-6203
In This Issue Page
Please refer to Appendix – Disclaimers & Other Disclosures on page 19.
Quarterly Report Overview ................................................................................. 1
Relevant Baird Research Coverage ..................................................................... 3
Industry Trends ................................................................................................. 4
Facility Services Operating / Valuation Metrics ................................................. 5
Industrial Services Operating / Valuation Metrics .............................................. 6
Rental Services Operating / Valuation Metrics ................................................... 7
M&A Market Overview ........................................................................................ 8
Facility, Industrial & Rental Services M&A Activity ............................................. 9
Deal Spotlight .................................................................................................. 10
Equity Offering Market Overview ..................................................................... 11
Facility, Industrial & Rental Services Equity Activity ........................................ 12
Robert W. Baird & Co........................................................................................ 13
Appendix
Current Trading Statistics ............................................................................... 14
Current Market Multiples ................................................................................. 15
Current Operating Metrics ................................................................................ 16
Current Return and Leverage Analysis ............................................................. 17
Historical and Projected Results ...................................................................... 18
Disclaimers & Other Disclosures ...................................................................... 19
Glossary of Terms & Other Important Information .......................................... 20
The following report has been prepared by the Investment Banking Department of
Robert W. Baird & Co. This report is an overview and analysis of consolidation trends
and is not intended to provide investment recommendations on any specific industry
or company. A complete listing of all companies covered by Baird U.S. Equity
Research and applicable research disclosures can be accessed at
http://www.rwbaird.com/researchdisclosure. You can also call 1-800-792-2473 or
write: Robert W. Baird & Co., Equity Research, 24th Floor, 777 E. Wisconsin Avenue,
Milwaukee, WI 53202.

Quarterly Report Overview
1
The Facility, Industrial & Rental Services report, created by Baird’s Investment Banking Department, highlights capital markets trends and events that impact middle-market companies within these sectors. Detailed below are the report’s three areas of focus, relevant subsectors and representative companies within each group. The statistics at the right of each group represent the current median for the group and the arrows indicate movement up or down from last quarter.
ABM Industries
Aramark
CBRE Group
Colliers International Group
Comfort Systems USA
Compass Group plc
Ecolab
EMCOR Group
FirstService
G4S plc
GDI Integrated Facility
Healthcare Services Group
ISS
Jones Lang LaSalle
Mitie Group plc
Prosegur SA
Rentokil Initial plc
Rollins
Scotts Miracle-Gro
Securitas AB
ServiceMaster
Sodexo
Standard Parking
AECOM Technology
Aegion
Babcock & Wilcox
Chicago Bridge & Iron Company
Clean Harbors
Dycom Industries
Exponent
Fluor
Granite Construction
Jacobs Engineering Group
KBR
MasTec
McDermott International
MYR Group
Primoris Services
Quanta Services
Stantec
Team
Tetra Tech
TRC Companies
Tutor Perini Corp.
US Ecology
Willbros Group
Ashtead Group plc
Brinks
Cintas
G&K Services
H&E Equipment Services
Heritage-Crystal Clean
Hertz Global Holdings
Iron Mountain
McGrath Rentcorp
Mobile Mini
Neff
UniFirst
United Rentals
_____________________
Source: Capital IQ and Q3 as of September 30, 2015. Q2 2015 as of June 30, 2015.
Please see glossary on page 20 for definitions and other important information.
Security
Janitorial
Food Service
HVAC
Pest Control
Landscaping
Facility Services
Security
Janitorial
Food Service
HVAC
Pest Control
Landscaping
Facility Services
11.5x 11.4x
Q2 2015 Q3 2015
LTM EBITDA Multiple
9.6x8.9x
Q2 2015 Q3 2015
LTM EBITDA Multiple
RentalServices
Mobile Storage
ModularOfficeSpace
Equipment
VendingMachines
Uniformsand Linen
RentalServices
Mobile Storage
ModularOfficeSpace
Equipment
VendingMachines
Uniformsand Linen
9.7x9.0x
Q2 2015 Q3 2015
LTM EBITDA Multiple
Industrial Services
Environmental
Engineering
Hazardous Waste
Construction
Non - Hazardous Waste
Electrical
Quarterly Report Overview
2
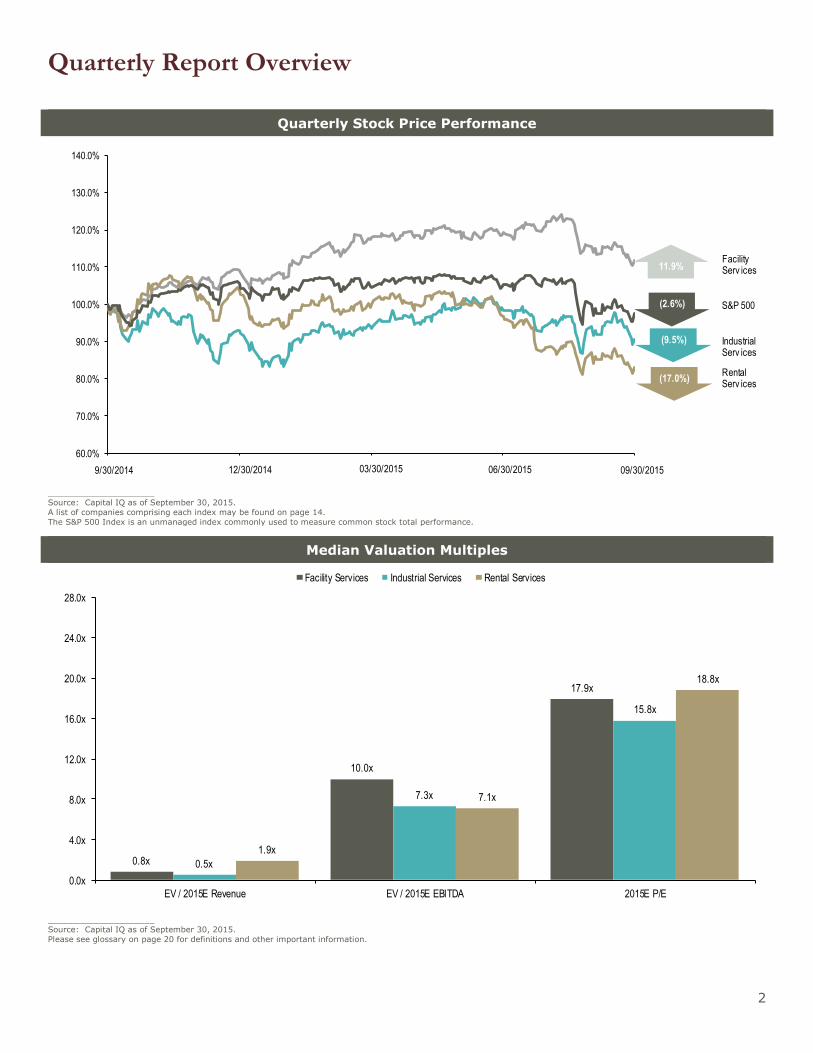
Quarterly Stock Price Performance
_____________________ Source: Capital IQ as of September 30, 2015.
A list of companies comprising each index may be found on page 14.
The S&P 500 Index is an unmanaged index commonly used to measure common stock total performance.
Median Valuation Multiples
_____________________
Source: Capital IQ as of September 30, 2015.
Please see glossary on page 20 for definitions and other important information.
60.0%
70.0%
80.0%
90.0%
100.0%
110.0%
120.0%
130.0%
140.0%
9/30/2014 12/30/2014 3/31/2015 6/30/2015 9/30/2015
Industrial Serv ices
(17.0%)
S&P 500
11.9%
Rental Serv ices
(9.5%)
FacilityServ ices
(2.6%)
9/30/2014 12/30/2014 03/30/2015 06/30/2015 09/30/2015
0.8x
10.0x
17.9x
0.5x
7.3x
15.8x
1.9x
7.1x
18.8x
0.0x
4.0x
8.0x
12.0x
16.0x
20.0x
24.0x
28.0x
EV / 2015E Revenue EV / 2015E EBITDA 2015E P/E
Facility Services Industrial Services Rental Services

Relevant Baird Research Coverage
3
Coverage Data
($ in millions, except per share values)
Company Ticker
Current
Price
Market Value
of Equity Rating Target Price
Facility Services
ABM Industries, Inc. ABM $27.3 $1,585 Outperform $35
ARAMARK Holdings Corporation ARMK 29.6 6,205 Outperform 35
Ecolab, Inc. ECL 109.7 33,156 Neutral 124
ServiceMaster Global Holdings, Inc. SERV 33.6 4,648 Outperform 42
Industrial Services
AECOM Technology Corporation ACM $27.5 $4,155 Neutral $33
Chicago Bridge & Iron Company N.V.
CBI 39.7 4,275 Neutral 58
Clean Harbors, Inc. CLH 44.0 2,586 Neutral 57
Fluor Corporation FLR 42.4 6,177 Neutral 58
Jacobs Engineering Group Inc. JEC 37.4 4,638 Neutral 47
MYR Group, Inc. MYRG 26.2 569 Outperform 34
Quanta Services, Inc. PWR 24.2 5,199 Outperform 30
Tetra Tech, Inc. TTEK 24.3 1,484 Neutral 29
Rental Services
Cintas Corporation CTAS $85.8 $9,890 Neutral $89
G&K Services, Inc. GK 66.6 1,374 Neutral 74
Heritage-Crystal Clean, Inc. HCCI 10.3 230 Neutral 15
Iron Mountain, Inc. IRM 31.0 6,612 Neutral 37
Mobile Mini, Inc. MINI 30.8 1,398 Neutral 46
UniFirst Corp. UNF 106.8 2,175 Outperform 126
_____________________
Source: Capital IQ as of September 30, 2015. *Email [email protected] for access to company research reports.
Industry Trends
4
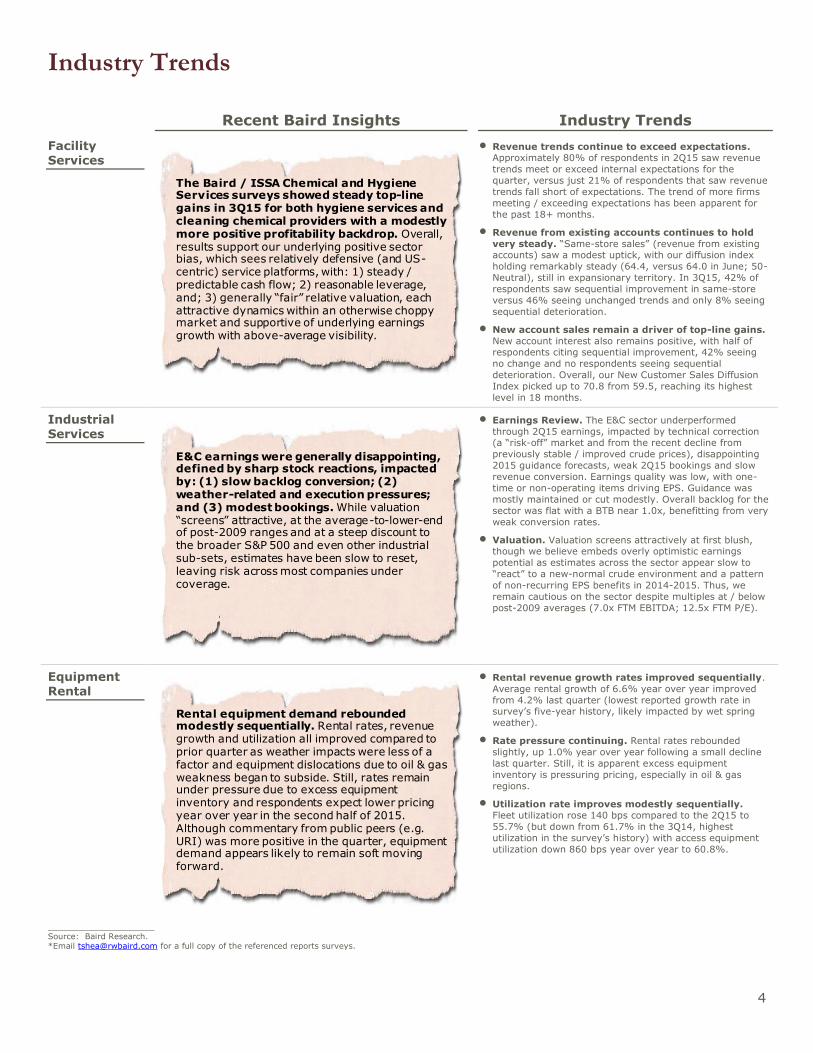
Recent Baird Insights Industry Trends
Facility Services
Revenue trends continue to exceed expectations. Approximately 80% of respondents in 2Q15 saw revenue
trends meet or exceed internal expectations for the
quarter, versus just 21% of respondents that saw revenue
trends fall short of expectations. The trend of more firms
meeting / exceeding expectations has been apparent for
the past 18+ months.
Revenue from existing accounts continues to hold
very steady. “Same-store sales” (revenue from existing accounts) saw a modest uptick, with our diffusion index
holding remarkably steady (64.4, versus 64.0 in June; 50-
Neutral), still in expansionary territory. In 3Q15, 42% of
respondents saw sequential improvement in same-store
versus 46% seeing unchanged trends and only 8% seeing
sequential deterioration.
New account sales remain a driver of top-line gains.
New account interest also remains positive, with half of respondents citing sequential improvement, 42% seeing
no change and no respondents seeing sequential
deterioration. Overall, our New Customer Sales Diffusion
Index picked up to 70.8 from 59.5, reaching its highest
level in 18 months.
Industrial Services
Earnings Review. The E&C sector underperformed
through 2Q15 earnings, impacted by technical correction (a “risk-off” market and from the recent decline from
previously stable / improved crude prices), disappointing
2015 guidance forecasts, weak 2Q15 bookings and slow
revenue conversion. Earnings quality was low, with one-
time or non-operating items driving EPS. Guidance was
mostly maintained or cut modestly. Overall backlog for the
sector was flat with a BTB near 1.0x, benefitting from very
weak conversion rates.
Valuation. Valuation screens attractively at first blush, though we believe embeds overly optimistic earnings
potential as estimates across the sector appear slow to
“react” to a new-normal crude environment and a pattern
of non-recurring EPS benefits in 2014-2015. Thus, we
remain cautious on the sector despite multiples at / below
post-2009 averages (7.0x FTM EBITDA; 12.5x FTM P/E).
Equipment Rental
Rental revenue growth rates improved sequentially.
Average rental growth of 6.6% year over year improved
from 4.2% last quarter (lowest reported growth rate in survey’s five-year history, likely impacted by wet spring
weather).
Rate pressure continuing. Rental rates rebounded
slightly, up 1.0% year over year following a small decline
last quarter. Still, it is apparent excess equipment
inventory is pressuring pricing, especially in oil & gas
regions.
Utilization rate improves modestly sequentially. Fleet utilization rose 140 bps compared to the 2Q15 to
55.7% (but down from 61.7% in the 3Q14, highest
utilization in the survey’s history) with access equipment
utilization down 860 bps year over year to 60.8%.
_____________________
Source: Baird Research. *Email [email protected] for a full copy of the referenced reports surveys.
The Baird / ISSA Chemical and Hygiene Services surveys showed steady top-line gains in 3Q15 for both hygiene services and cleaning chemical providers with a modestly more positive profitability backdrop. Overall, results support our underlying positive sector bias, which sees relatively defensive (and US-centric) service platforms, with: 1) steady / predictable cash flow; 2) reasonable leverage, and; 3) generally “fair” relative valuation, each attractive dynamics within an otherwise choppy market and supportive of underlying earnings growth with above-average visibility.
E&C earnings were generally disappointing, defined by sharp stock reactions, impacted by: (1) slow backlog conversion; (2) weather-related and execution pressures; and (3) modest bookings. While valuation “screens” attractive, at the average-to-lower-end of post-2009 ranges and at a steep discount to the broader S&P 500 and even other industrial sub-sets, estimates have been slow to reset, leaving risk across most companies under coverage.
Rental equipment demand rebounded modestly sequentially. Rental rates, revenue growth and utilization all improved compared to prior quarter as weather impacts were less of a factor and equipment dislocations due to oil & gas weakness began to subside. Still, rates remain under pressure due to excess equipment inventory and respondents expect lower pricing year over year in the second half of 2015. Although commentary from public peers (e.g. URI) was more positive in the quarter, equipment demand appears likely to remain soft moving forward.

Facility Services Operating / Valuation Metrics
5
Facility Services Operating Margins
Facility Services Valuation Multiples
_____________________
Source: Capital IQ as of September 30, 2015. Margins and Multiples are LTM.
EBIT EBITDA
11.7%
18.9%
14.6%
15.9%
10.9%
9.7%
8.8%
9.6%
4.9%
9.7%
5.8%
7.2%
5.8%
5.5%
5.3%
4.9%
4.0%
4.7%
4.3%
3.0%
4.2%
2.7%
1.7%
22.8%
22.8%
20.8%
19.0%
12.8%
12.5%
11.7%
11.4%
10.4%
10.3%
9.3%
9.1%
8.0%
6.8%
6.7%
6.5%
6.3%
6.3%
5.8%
5.5%
5.3%
5.2%
2.8%
Rentokil Initial plc
ServiceMaster Global Holdings, Inc.
Ecolab Inc.
Rollins Inc.
The Scot ts Miracle-Gro Company
Prosegur Compañía de Seguridad, S.A.
CBRE Group, Inc.
Jones Lang LaSalle Incorpora ted
G4S p lc
Healthcare Services Group Inc.
SP Plus Corporation
Compass Group PLC
Colliers Internat ional Group Inc.
MITIE Group PLC
Sodexo S.A.
ISS A /S
Aramark
Securitas AB
Comfort Systems USA Inc.
GDI Integra ted Facility Services Inc.
EMCOR Group Inc.
FirstService Corporation
ABM Indust ries Incorporated
EBIT EBITDA
21.1x
19.1x
16.6x
13.7x
12.5x
12.5x
12.4x
12.3x
12.0x
11.8x
11.5x
11.4x
10.9x
10.8x
9.9x
9.3x
8.7x
8.6x
8.3x
8.3x
8.1x
7.6x
6.9x
25.2x
N/M
17.5x
19.6x
14.8x
15.9x
20.3x
14.8x
22.2x
16.0x
15.3x
15.1x
12.9x
14.4x
12.5x
14.8x
17.0x
10.6x
11.6x
13.1x
10.3x
16.1x
8.9x
Rollins Inc.
FirstService Corporation
Healthcare Services Group Inc.
Ecolab Inc.
The Scot ts Miracle-Gro Company
Compass Group PLC
ABM Indust ries Incorporated
ServiceMaster Global Holdings, Inc.
GDI Integra ted Facility Services Inc.
Comfort Systems USA Inc.
CBRE Group, Inc.
ISS A /S
Jones Lang LaSalle Incorpora ted
Securitas AB
Sodexo S.A.
SP Plus Corporation
Rentokil Initial plc
MITIE Group PLC
Colliers Internat ional Group Inc.
Aramark
EMCOR Group Inc.
G4S p lc
Prosegur Compañía de Seguridad, S.A.
Industrial Services Operating / Valuation Metrics
6
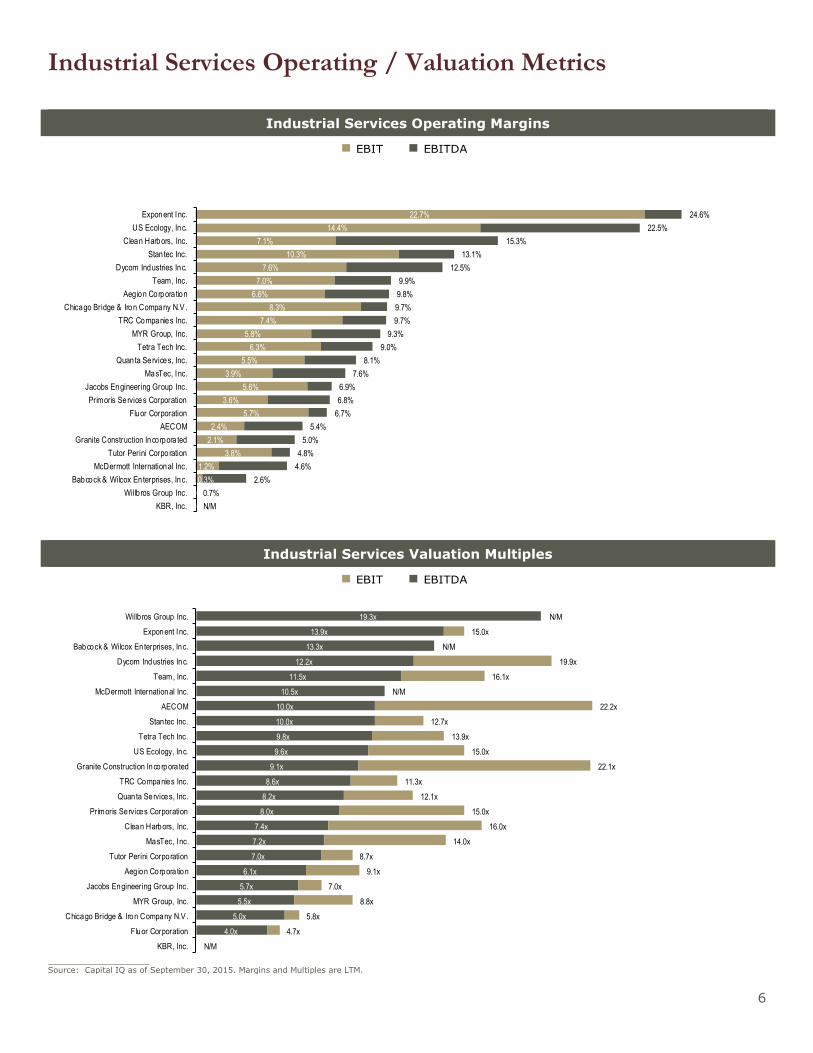
Industrial Services Operating Margins
Industrial Services Valuation Multiples
____________________ Source: Capital IQ as of September 30, 2015. Margins and Multiples are LTM.
EBIT EBITDA
22.7%
14.4%
7.1%
10.3%
7.6%
7.0%
6.6%
8.3%
7.4%
5.8%
6.3%
5.5%
3.9%
5.6%
3.6%
5.7%
2.4%
2.1%
3.8%
1.2%
0.3%
0.0%
0.0%
24.6%
22.5%
15.3%
13.1%
12.5%
9.9%
9.8%
9.7%
9.7%
9.3%
9.0%
8.1%
7.6%
6.9%
6.8%
6.7%
5.4%
5.0%
4.8%
4.6%
2.6%
0.7%
N/M
Exponent Inc.
US Ecology, Inc.
Clean Harbors, Inc.
Stantec Inc.
Dycom Industries Inc.
Team, Inc.
Aeg ion Corpora tion
Chicago Bridge & Iron Company N.V .
TRC Companies Inc.
MYR Group, Inc.
Tetra Tech Inc.
Quanta Services, Inc.
MasTec, Inc.
Jacobs Engineering Group Inc.
Primoris Services Corporation
Fluor Corporation
AECOM
Granite Construction Incorpora ted
Tutor Perini Corporation
McDermott International Inc.
Babcock & Wilcox Enterprises, Inc.
Willb ros Group Inc.
KBR, Inc.
EBIT EBITDA
19.3x
13.9x
13.3x
12.2x
11.5x
10.5x
10.0x
10.0x
9.8x
9.6x
9.1x
8.6x
8.2x
8.0x
7.4x
7.2x
7.0x
6.1x
5.7x
5.5x
5.0x
4.0x
N/M
N/M
15.0x
N/M
19.9x
16.1x
N/M
22.2x
12.7x
13.9x
15.0x
22.1x
11.3x
12.1x
15.0x
16.0x
14.0x
8.7x
9.1x
7.0x
8.8x
5.8x
4.7x
N/M
Willb ros Group Inc.
Exponent Inc.
Babcock & Wilcox Enterprises, Inc.
Dycom Industries Inc.
Team, Inc.
McDermott International Inc.
AECOM
Stantec Inc.
Tetra Tech Inc.
US Ecology, Inc.
Granite Construction Incorpora ted
TRC Companies Inc.
Quanta Services, Inc.
Primoris Services Corporation
Clean Harbors, Inc.
MasTec, I nc.
Tutor Perini Corporation
Aegion Corpora tion
Jacobs Engineering Group Inc.
MYR Group, Inc.
Chicago Bridge & Iron Company N.V .
Fluor Corporation
KBR, Inc.

Rental Services Operating / Valuation Metrics
7
Rental Services Operating Margins
Rental Services Valuation Multiples
_____________________
Source: Capital IQ as of September 30, 2015. Margins and Multiples are LTM.
EBIT EBITDA
26.1%
26.5%
24.7%
17.9%
25.4%
12.7%
20.0%
13.9%
15.7%
11.5%
1.2%
1.6%
5.6%
4.7%
45.9%
44.6%
37.7%
34.9%
29.7%
28.0%
25.8%
22.1%
19.1%
19.1%
14.9%
United Renta ls, Inc.
Ashtead Group plc
Hertz Global Holdings, Inc.
Mobile Mini, Inc.
Iron Mountain Incorporated
Neff Corp .
H&E Equipment Services Inc.
McGrath Rentcorp
UniFirst Corp.
Cintas Corporat ion
G&K Services Inc.
Heritage-Crysta l Clean, Inc
The Brink's Company
EBIT EBITDA
13.1x
12.9x
12.6x
12.4x
11.4x
11.4x
9.0x
8.4x
7.0x
7.0x
6.7x
5.6x
5.2x 9.2x
N/M
18.2x
15.3x
20.6x
14.9x
12.6x
N/M
N/M
9.6x
7.7x
11.2x
11.4x
Heritage-Crysta l Clean, Inc
Mobile Mini, Inc.
Cintas Corporat ion
Iron Mountain Incorporated
G&K Services Inc.
McGrath Rentcorp
The Brink's Company
Hertz Global Holdings, Inc.
UniFirst Corp.
Neff Corp .
Ashtead Group plc
H&E Equipment Services Inc.
United Renta ls, Inc.
M&A Market Overview
8
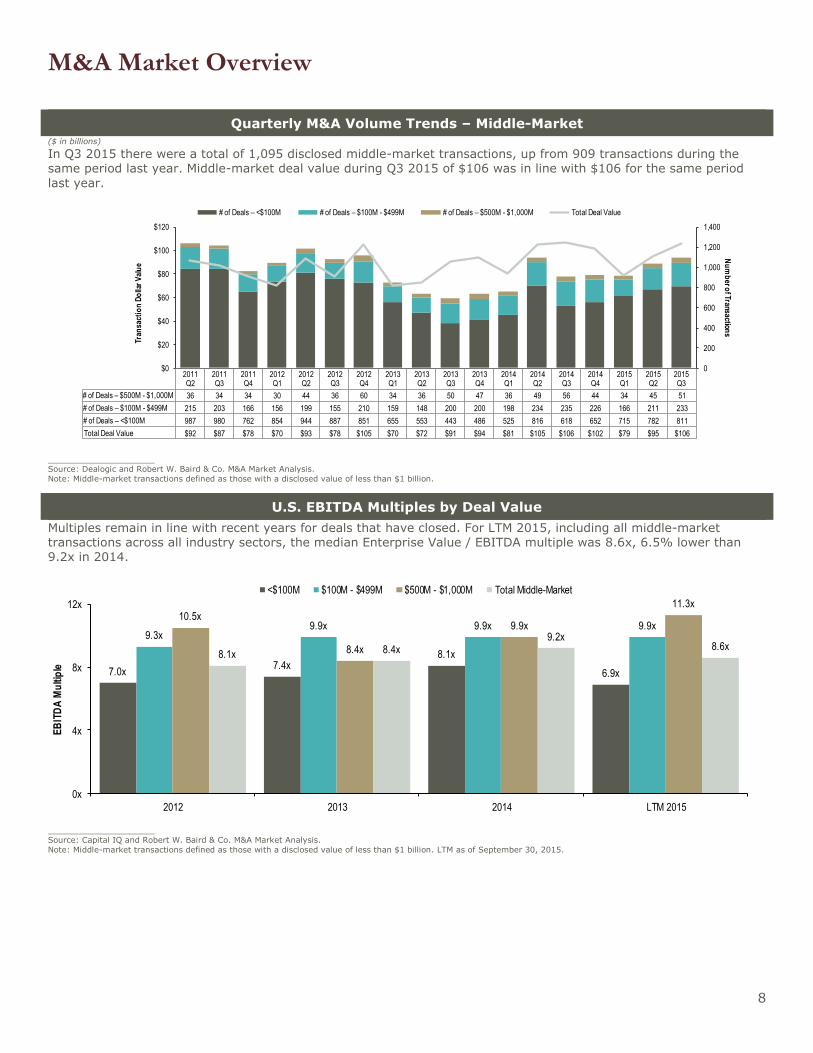
Quarterly M&A Volume Trends – Middle-Market ($ in billions)
In Q3 2015 there were a total of 1,095 disclosed middle-market transactions, up from 909 transactions during the same period last year. Middle-market deal value during Q3 2015 of $106 was in line with $106 for the same period
last year.
_____________________ Source: Dealogic and Robert W. Baird & Co. M&A Market Analysis.
Note: Middle-market transactions defined as those with a disclosed value of less than $1 billion.
U.S. EBITDA Multiples by Deal Value
Multiples remain in line with recent years for deals that have closed. For LTM 2015, including all middle-market transactions across all industry sectors, the median Enterprise Value / EBITDA multiple was 8.6x, 6.5% lower than 9.2x in 2014.
_____________________
Source: Capital IQ and Robert W. Baird & Co. M&A Market Analysis.
Note: Middle-market transactions defined as those with a disclosed value of less than $1 billion. LTM as of September 30, 2015.
2011Q2
2011Q3
2011Q4
2012Q1
2012Q2
2012Q3
2012Q4
2013Q1
2013Q2
2013Q3
2013Q4
2014Q1
2014Q2
2014Q3
2014Q4
2015Q1
2015Q2
2015Q3
# of Deals – $500M - $1,000M 36 34 34 30 44 36 60 34 36 50 47 36 49 56 44 34 45 51
# of Deals – $100M - $499M 215 203 166 156 199 155 210 159 148 200 200 198 234 235 226 166 211 233
# of Deals – <$100M 987 980 762 854 944 887 851 655 553 443 486 525 816 618 652 715 782 811
Total Deal Value $92 $87 $78 $70 $93 $78 $105 $70 $72 $91 $94 $81 $105 $106 $102 $79 $95 $106
0
200
400
600
800
1,000
1,200
1,400
$0
$20
$40
$60
$80
$100
$120
Nu
mb
er of Transaction
s
Tran
sact
ion
Do
llar
Val
ue
# of Deals – <$100M # of Deals – $100M - $499M # of Deals – $500M - $1,000M Total Deal Value
7.0x7.4x
8.1x
6.9x
9.3x9.9x 9.9x 9.9x
10.5x
8.4x
9.9x
11.3x
8.1x 8.4x9.2x
8.6x
0x
4x
8x
12x
2012 2013 2014 LTM 2015
EB
ITD
A M
ulti
ple
<$100M $100M - $499M $500M - $1,000M Total Middle-Market
Facility, Industrial & Rental Services M&A Activity
9
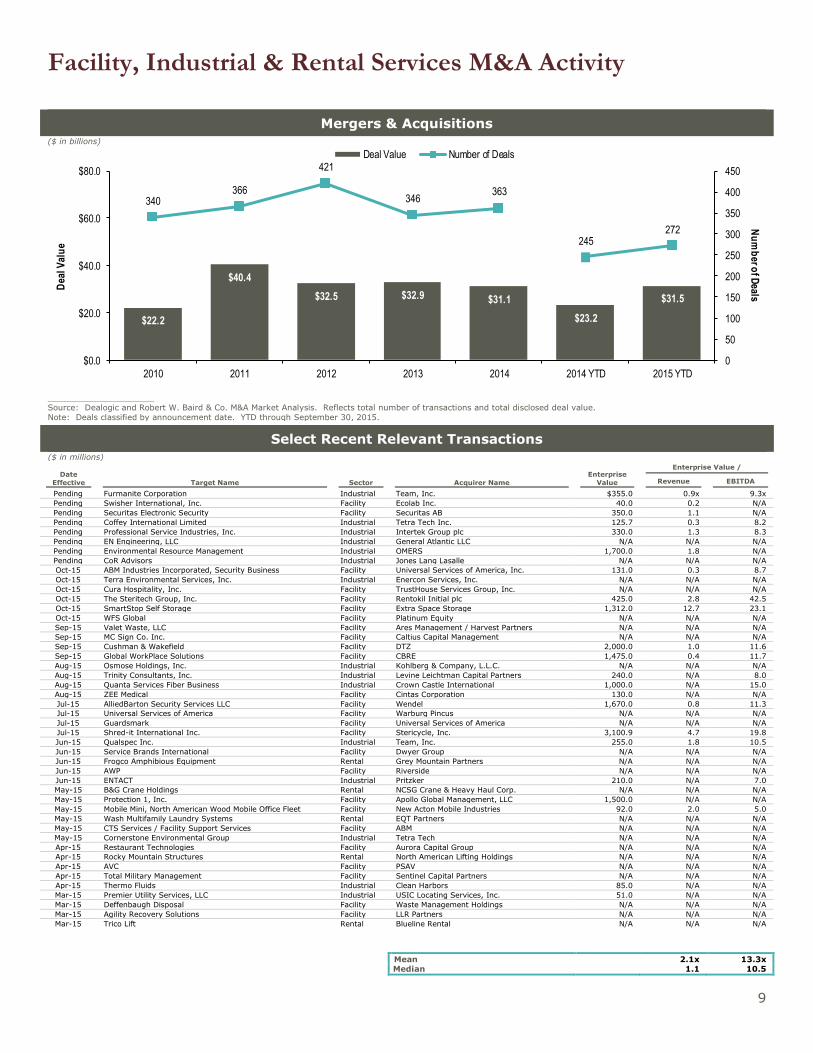
Mergers & Acquisitions ($ in billions)
_____________________
Source: Dealogic and Robert W. Baird & Co. M&A Market Analysis. Reflects total number of transactions and total disclosed deal value.
Note: Deals classified by announcement date. YTD through September 30, 2015.
Select Recent Relevant Transactions
($ in millions)
Date
Effective Target Name Sector Acquirer Name
Enterprise
Value
Enterprise Value /
Revenue EBITDA
Pending Furmanite Corporation Industrial Team, Inc. $355.0 0.9x 9.3x
Pending Swisher International, Inc. Facility Ecolab Inc. 40.0 0.2 N/A
Pending Securitas Electronic Security Facility Securitas AB 350.0 1.1 N/A
Pending Coffey International Limited Industrial Tetra Tech Inc. 125.7 0.3 8.2
Pending Professional Service Industries, Inc. Industrial Intertek Group plc 330.0 1.3 8.3
Pending EN Engineering, LLC Industrial General Atlantic LLC N/A N/A N/A
Pending Environmental Resource Management Industrial OMERS 1,700.0 1.8 N/A
Pending CoR Advisors Industrial Jones Lang Lasalle N/A N/A N/A
Oct-15 ABM Industries Incorporated, Security Business Facility Universal Services of America, Inc. 131.0 0.3 8.7
Oct-15 Terra Environmental Services, Inc. Industrial Enercon Services, Inc. N/A N/A N/A
Oct-15 Cura Hospitality, Inc. Facility TrustHouse Services Group, Inc. N/A N/A N/A
Oct-15 The Steritech Group, Inc. Facility Rentokil Initial plc 425.0 2.8 42.5
Oct-15 SmartStop Self Storage Facility Extra Space Storage 1,312.0 12.7 23.1
Oct-15 WFS Global Facility Platinum Equity N/A N/A N/A
Sep-15 Valet Waste, LLC Facility Ares Management / Harvest Partners N/A N/A N/A
Sep-15 MC Sign Co. Inc. Facility Caltius Capital Management N/A N/A N/A
Sep-15 Cushman & Wakefield Facility DTZ 2,000.0 1.0 11.6
Sep-15 Global WorkPlace Solutions Facility CBRE 1,475.0 0.4 11.7
Aug-15 Osmose Holdings, Inc. Industrial Kohlberg & Company, L.L.C. N/A N/A N/A
Aug-15 Trinity Consultants, Inc. Industrial Levine Leichtman Capital Partners 240.0 N/A 8.0
Aug-15 Quanta Services Fiber Business Industrial Crown Castle International 1,000.0 N/A 15.0
Aug-15 ZEE Medical Facility Cintas Corporation 130.0 N/A N/A
Jul-15 AlliedBarton Security Services LLC Facility Wendel 1,670.0 0.8 11.3
Jul-15 Universal Services of America Facility Warburg Pincus N/A N/A N/A
Jul-15 Guardsmark Facility Universal Services of America N/A N/A N/A
Jul-15 Shred-it International Inc. Facility Stericycle, Inc. 3,100.9 4.7 19.8
Jun-15 Qualspec Inc. Industrial Team, Inc. 255.0 1.8 10.5
Jun-15 Service Brands International Facility Dwyer Group N/A N/A N/A
Jun-15 Frogco Amphibious Equipment Rental Grey Mountain Partners N/A N/A N/A
Jun-15 AWP Facility Riverside N/A N/A N/A
Jun-15 ENTACT Industrial Pritzker 210.0 N/A 7.0
May-15 B&G Crane Holdings Rental NCSG Crane & Heavy Haul Corp. N/A N/A N/A
May-15 Protection 1, Inc. Facility Apollo Global Management, LLC 1,500.0 N/A N/A
May-15 Mobile Mini, North American Wood Mobile Office Fleet Facility New Acton Mobile Industries 92.0 2.0 5.0
May-15 Wash Multifamily Laundry Systems Rental EQT Partners N/A N/A N/A
May-15 CTS Services / Facility Support Services Facility ABM N/A N/A N/A
May-15 Cornerstone Environmental Group Industrial Tetra Tech N/A N/A N/A
Apr-15 Restaurant Technologies Facility Aurora Capital Group N/A N/A N/A
Apr-15 Rocky Mountain Structures Rental North American Lifting Holdings N/A N/A N/A
Apr-15 AVC Facility PSAV N/A N/A N/A
Apr-15 Total Military Management Facility Sentinel Capital Partners N/A N/A N/A
Apr-15 Thermo Fluids Industrial Clean Harbors 85.0 N/A N/A
Mar-15 Premier Utility Services, LLC Industrial USIC Locating Services, Inc. 51.0 N/A N/A
Mar-15 Deffenbaugh Disposal Facility Waste Management Holdings N/A N/A N/A
Mar-15 Agility Recovery Solutions Facility LLR Partners N/A N/A N/A
Mar-15 Trico Lift Rental Blueline Rental N/A N/A N/A
Mean
2.1x 13.3x Median
1.1 10.5
$22.2
$40.4
$32.5 $32.9 $31.1
$23.2
$31.5
340366
421
346363
245272
0
50
100
150
200
250
300
350
400
450
$0.0
$20.0
$40.0
$60.0
$80.0
2010 2011 2012 2013 2014 2014 YTD 2015 YTD
Nu
mb
er of D
ealsD
eal V
alu
e
Deal Value Number of Deals

Baird Deal Spotlight
10
Deal Spotlight
Target Company
Headquarters:
Tampa, FL
Acquiring
Company
Headquarters:
Los Angeles, CA / New York, NY
Industry Sector Facility Services
Transaction
Overview
Valet Waste Holdings, Inc. (“Valet” or the “Company”), a portfolio company of New Mountain Capital, LLC (“New Mountain”), was acquired by Ares Management L.P. (“Ares”) and Harvest Partners, LP (“Harvest”). Terms of the transaction were not disclosed.
Target Company
Description
Since 1995, Valet Waste has been the Multifamily Housing Industry's leading provider of five-nights-per-week doorstep trash and recycling collection. It currently services over 440 management companies and owner groups throughout the multifamily housing industry
that represent over 3.4 million units nationwide. Valet Waste offers the most requested resident amenities and services along with unparalleled and proven customer satisfaction. Its fully insured and uniformed professional valets collect waste and recyclables from
residents' doorsteps and manage multifamily communities' on-site trash issues by streamlining waste from the doorstep to the dumpster with our proven systems.
Advisory Role Baird served as the financial advisor to Valet on this transaction.
Ross Williams Managing Director [email protected] 414 298-6235
Jonathan Harrison Managing Director [email protected] +44 (0) 20 7667 8414
Tim H. Shea Vice President [email protected] 414 298-6203

Equity Offering Market Overview
11
IPO PRICING ACTIVITY
IPO issuance remained slow during September, with 7 IPO pricings raising $1.1 billion, compared to 16 IPOs raising $30.8
billion ($5.8 billion excluding Alibaba) in September 2014 – The pricing environment in September was challenging as volatility continued during the month; 5 of the 7
IPOs priced below the range
IPO Pricing Statistics
2014 YTD (206 deals)
2015 YTD (123 deals)
Price Change Offer to
Current
_____________________
Source: Dealogic as of September 30, 2015. Note: Excludes deals under $15 million.
FOLLOW-ON OFFERING PRICING ACTIVITY
Consistent with overall activity, Follow-On issuances remained subdued with 27 pricings, raising $5.7 billion during September, bringing the YTD total to 539 offerings raising $160.4 billion
– The median file-to-offer discount in increased significantly in September to 5.9% compared to 3.3% in August. Bought deals continue to be a popular execution method as they represent 26% of all follow-ons YTD, the highest percentage since 2012
Price Change
File to Offer
Discount
Last Trade to Offer
Price Change
Offer to Current
_____________________
Source: Dealogic as of September 30, 2015.
Note: Follow-on offering pricing and performance statistics exclude bought deals.
Excludes deals under $15 million.
Within the Range43.7%
Above the Range18.0%
Below the Range38.3%
Within the Range42.3%
Above the Range28.4%
Below the Range29.3%
(5.4%)
(10.0%)
2014 2015 YTD
(4.1% )(4.6%)
2014 2015 YTD
(2.9%) (3.0%)
2014 2015 YTD
(13.1% )(12.7%)
2014 2015 YTD
Facility, Industrial & Rental Services Equity Activity
12
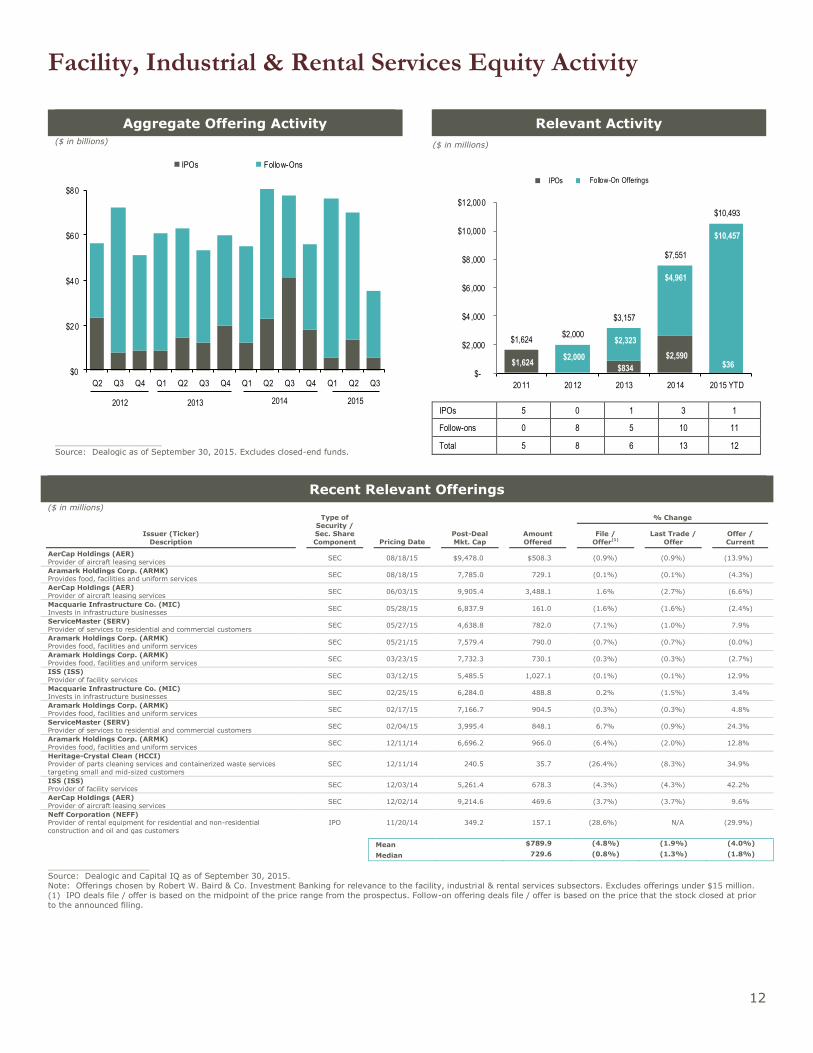
Aggregate Offering Activity ($ in billions)
_____________________
Source: Dealogic as of September 30, 2015. Excludes closed-end funds.
Relevant Activity
($ in millions)
IPOs 5 0 1 3 1
Follow-ons 0 8 5 10 11
Total 5 8 6 13 12
Recent Relevant Offerings
($ in millions)
Issuer (Ticker)
Description
Type of Security / Sec. Share
Component Pricing Date Post-Deal
Mkt. Cap
Amount
Offered
% Change
File /
Offer(1)
Last Trade /
Offer
Offer /
Current
AerCap Holdings (AER) Provider of aircraft leasing services
SEC 08/18/15 $9,478.0 $508.3 (0.9%) (0.9%) (13.9%)
Aramark Holdings Corp. (ARMK) Provides food, facilities and uniform services
SEC 08/18/15 7,785.0 729.1 (0.1%) (0.1%) (4.3%)
AerCap Holdings (AER) Provider of aircraft leasing services
SEC 06/03/15 9,905.4 3,488.1 1.6% (2.7%) (6.6%)
Macquarie Infrastructure Co. (MIC) Invests in infrastructure businesses
SEC 05/28/15 6,837.9 161.0 (1.6%) (1.6%) (2.4%)
ServiceMaster (SERV) Provider of services to residential and commercial customers
SEC 05/27/15 4,638.8 782.0 (7.1%) (1.0%) 7.9%
Aramark Holdings Corp. (ARMK) Provides food, facilities and uniform services
SEC 05/21/15 7,579.4 790.0 (0.7%) (0.7%) (0.0%)
Aramark Holdings Corp. (ARMK) Provides food, facilities and uniform services
SEC 03/23/15 7,732.3 730.1 (0.3%) (0.3%) (2.7%)
ISS (ISS) Provider of facility services
SEC 03/12/15 5,485.5 1,027.1 (0.1%) (0.1%) 12.9%
Macquarie Infrastructure Co. (MIC) Invests in infrastructure businesses
SEC 02/25/15 6,284.0 488.8 0.2% (1.5%) 3.4%
Aramark Holdings Corp. (ARMK) Provides food, facilities and uniform services
SEC 02/17/15 7,166.7 904.5 (0.3%) (0.3%) 4.8%
ServiceMaster (SERV) Provider of services to residential and commercial customers
SEC 02/04/15 3,995.4 848.1 6.7% (0.9%) 24.3%
Aramark Holdings Corp. (ARMK) Provides food, facilities and uniform services
SEC 12/11/14 6,696.2 966.0 (6.4%) (2.0%) 12.8%
Heritage-Crystal Clean (HCCI) Provider of parts cleaning services and containerized waste services targeting small and mid-sized customers
SEC 12/11/14 240.5 35.7 (26.4%) (8.3%) 34.9%
ISS (ISS) Provider of facility services
SEC 12/03/14 5,261.4 678.3 (4.3%) (4.3%) 42.2%
AerCap Holdings (AER) Provider of aircraft leasing services
SEC 12/02/14 9,214.6 469.6 (3.7%) (3.7%) 9.6%
Neff Corporation (NEFF) Provider of rental equipment for residential and non-residential construction and oil and gas customers
IPO 11/20/14 349.2 157.1 (28.6%) N/A (29.9%)
Mean $789.9 (4.8%) (1.9%) (4.0%)
Median 729.6 (0.8%) (1.3%) (1.8%)
____________________ Source: Dealogic and Capital IQ as of September 30, 2015.
Note: Offerings chosen by Robert W. Baird & Co. Investment Banking for relevance to the facility, industrial & rental services subsectors. Excludes offerings under $15 million.
(1) IPO deals file / offer is based on the midpoint of the price range from the prospectus. Follow-on offering deals file / offer is based on the price that the stock closed at prior
to the announced filing.
$0
$20
$40
$60
$80
Q2 Q3 Q4 Q1 Q2 Q3 Q4 Q1 Q2 Q3 Q4 Q1 Q2 Q3
IPOs Follow-Ons
2012 2013 2014 2015
$1,624 $834
$2,590 $36
$2,000
$2,323
$4,961
$10,457
$1,624$2,000
$3,157
$7,551
$10,493
2011 2012 2013 2014 2015 YTD
$-
$2 ,000
$4,000
$6,000
$8,000
$10,000
$12,000
Series4 Series5 Series1IPOs Follow-On Offerings
Robert W. Baird & Co.
13
OVERVIEW
Baird’s comprehensive M&A and capital raising capabilities make it a leading middle-market investment bank
– Over $137.0 billion in M&A deal value since 2000, with typical transactions ranging from $100 to $500 million
– Over $181.8 billion of equity raised since 2008, with typical transactions ranging from $30 to $300 million
With twenty capital markets locations worldwide, Baird has access to the best partners for its clients
– Contact us if you would like more information or would like to learn more about our advisory capabilities
U.S. OFFICES
Atlanta Madison Philadelphia
Boston Milwaukee San Francisco
Charlotte Nashville Stamford
Chicago New York City Tampa
Denver Palo Alto Washington, D.C.
INTERNATIONAL LOCATIONS *
Beijing Hamburg Shanghai
Frankfurt London
BAIRD CONTACTS
Peter S. Kies Head of Technology & Business Services [email protected] 414 765-7262
John R. Lanza Head of Industrial Services [email protected] 414 298-7669
Ross W. Williams Head of Facility Services [email protected] 414 298-6235
David M. Silver Managing Director, Europe [email protected] +44 (0) 20 7667 8216
Jonathan J. Harrison Managing Director, Europe [email protected] +44 (0) 20 7667 8414
Tim H. Shea Vice President [email protected] 414 298-6203
Baird and its operating affiliates have offices in the United States, Europe and Asia. Robert W. Baird Ltd. and Baird Capital Partners Europe are authorized and regulated in the U.K. by the Financial Conduct Authority.

Appendix

Current Trading Statistics
14
Current Trading Statistics ($ in millions, except per share values)
_____________________
Please see glossary on page 20 for definitions and other important information.
Source: Capital IQ as of September 30, 2015.
(1) Information provided by Capital IQ (2) Includes fully-diluted options calculated using the treasury method.
Fully Price Market Latest Twelve Month Results
Fiscal Latest Diluted Per Share Value of Enterprise 52 Week Price % of 52-
Ticker Company (1)
Year End Quarter Shares (2)
9/30/2015 Equity Value Low High Week High
Facility Services
ABM ABM Industries Incorporated 10/31/2014 07/31/2015 58.1 $27.31 $1,585.4 $1,839.4 $24.97 $34.00 80.3%
ARMK Aramark 10/03/2014 07/03/2015 209.4 29.64 6,205.7 11,550.9 25.03 33.78 87.7%
CBG CBRE Group, Inc. 12/31/2014 06/30/2015 333.4 32.00 10,668.0 12,800.2 27.49 39.77 80.5%
CIGI Colliers International Group Inc. 12/31/2014 06/30/2015 36.3 40.59 1,473.3 1,872.0 37.22 70.17 57.8%
FIX Comfort Systems USA Inc. 12/31/2014 06/30/2015 38.0 27.26 1,036.6 1,032.8 12.63 30.32 89.9%
CPG Compass Group PLC 09/30/2014 03/31/2015 1,653.9 15.93 26,353.7 30,421.4 13.99 18.51 86.1%
ECL Ecolab Inc. 12/31/2014 06/30/2015 302.2 109.72 33,156.0 40,222.8 97.78 118.27 92.8%
EME EMCOR Group Inc. 12/31/2014 06/30/2015 63.7 44.25 2,818.2 2,787.1 38.68 48.89 90.5%
TSX:FSV FirstService Corporation 12/31/2014 06/30/2015 34.6 32.20 1,114.0 1,185.6 22.51 35.17 91.6%
GFS G4S plc 12/31/2014 06/30/2015 1,545.2 3.49 5,394.2 8,067.6 3.42 4.68 74.5%
TSX:GDI GDI Integrated Facility Services Inc. 12/31/2014 06/30/2015 21.2 11.20 237.9 344.2 10.45 16.33 68.6%
HCSG Healthcare Services Group Inc. 12/31/2014 09/30/2015 74.4 33.70 2,506.1 2,402.5 26.54 35.49 95.0%
ISS ISS A/S 12/31/2014 06/30/2015 183.9 33.13 6,092.3 8,291.6 22.30 36.39 91.0%
JLL Jones Lang LaSalle Incorporated 12/31/2014 06/30/2015 45.7 143.77 6,571.5 7,070.1 118.79 179.97 79.9%
MTO MITIE Group PLC 03/31/2015 03/31/2015 366.8 4.62 1,693.8 1,973.0 3.99 4.99 92.5%
CATS:PSG Prosegur Compañía de Seguridad, S.A. 12/31/2014 06/30/2015 598.4 4.80 2,871.5 3,680.7 4.49 6.28 76.4%
RTO Rentokil Initial plc 12/31/2014 06/30/2015 1,816.9 2.23 4,044.3 5,170.6 1.68 2.33 95.4%
ROL Rollins Inc. 12/31/2014 06/30/2015 220.7 26.87 5,929.2 5,819.5 18.41 30.42 88.3%
SMG The Scotts Miracle-Gro Company 09/30/2014 06/27/2015 62.5 60.82 3,798.5 4,796.3 53.23 69.27 87.8%
SECU B Securitas AB 12/31/2014 06/30/2015 365.1 12.17 4,442.5 5,904.9 8.47 15.73 77.3%
SERV ServiceMaster Global Holdings, Inc. 12/31/2014 06/30/2015 138.5 33.55 4,648.3 7,110.3 20.32 38.45 87.3%
SW Sodexo S.A. 08/31/2014 02/28/2015 153.6 82.58 12,684.2 14,485.0 77.55 106.87 77.3%
SP SP Plus Corporation 12/31/2014 06/30/2015 22.8 23.15 527.3 762.6 18.50 27.41 84.5%
Mean 84.0%
Median 87.3%
Industrial Services
ACM AECOM 09/30/2014 06/30/2015 151.1 $27.51 $4,155.4 $8,588.7 $24.04 $35.40 77.7%
AEGN Aegion Corporation 12/31/2014 06/30/2015 36.4 16.48 600.7 808.9 15.31 22.61 72.9%
BW Babcock & Wilcox Enterprises, Inc. 12/31/2014 06/30/2015 54.8 16.80 920.4 612.1 16.40 21.95 76.5%
CBI Chicago Bridge & Iron Company N.V. 12/31/2014 06/30/2015 107.8 39.66 4,275.5 6,288.3 32.16 59.45 66.7%
CLH Clean Harbors, Inc. 12/31/2014 06/30/2015 58.8 43.97 2,586.5 3,807.9 43.00 59.29 74.2%
DY Dycom Industries Inc. 07/25/2015 07/25/2015 35.2 72.36 2,547.5 3,073.1 24.84 80.85 89.5%
EXPO Exponent Inc. 01/02/2015 07/03/2015 25.9 44.56 1,156.3 1,006.5 34.92 48.50 91.9%
FLR Fluor Corporation 12/31/2014 06/30/2015 145.9 42.35 6,177.2 5,384.8 40.70 69.69 60.8%
GVA Granite Construction Incorporated 12/31/2014 06/30/2015 39.4 29.67 1,168.4 1,050.3 28.94 39.09 75.9%
JEC Jacobs Engineering Group Inc. 09/26/2014 06/26/2015 123.9 37.43 4,638.1 4,815.8 36.27 49.90 75.0%
KBR KBR, Inc. 12/31/2014 06/30/2015 145.6 16.66 2,426.0 1,759.0 14.00 20.77 80.2%
MTZ MasTec, Inc. 12/31/2014 06/30/2015 81.1 15.83 1,283.8 2,498.3 14.48 30.70 51.6%
MDR McDermott International Inc. 12/31/2014 06/30/2015 243.5 4.30 1,047.2 1,380.1 2.10 5.93 72.5%
MYRG MYR Group, Inc. 12/31/2014 06/30/2015 21.7 26.20 569.5 522.6 22.81 32.24 81.3%
PRIM Primoris Services Corporation 12/31/2014 06/30/2015 51.8 17.91 927.7 1,076.7 15.97 29.57 60.6%
PWR Quanta Services, Inc. 12/31/2014 06/30/2015 214.8 24.21 5,199.1 5,364.0 21.35 36.34 66.6%
STN Stantec Inc. 12/31/2014 06/30/2015 94.7 21.78 2,062.2 2,339.2 21.48 28.43 76.6%
TISI Team, Inc. 05/31/2015 08/31/2015 21.0 32.12 675.2 994.3 30.81 47.55 67.5%
TTEK Tetra Tech Inc. 09/28/2014 06/28/2015 61.0 24.31 1,483.7 1,546.6 22.98 27.84 87.3%
TRR TRC Companies Inc. 06/30/2015 06/30/2015 32.4 11.83 383.4 346.0 6.15 12.30 96.2%
TPC Tutor Perini Corporation 12/31/2014 06/30/2015 50.9 16.46 837.4 1,623.4 14.95 29.25 56.3%
ECOL US Ecology, Inc. 12/31/2014 06/30/2015 21.9 43.65 954.8 1,305.9 38.42 52.99 82.4%
WG Willbros Group Inc. 12/31/2014 06/30/2015 63.5 1.26 80.0 231.4 0.68 8.52 14.8%
Mean 72.0%
Median 75.0%
Rental Services
LSE: AHT Ashtead Group plc 04/30/2015 07/31/2015 501.4 $14.07 $7,056.7 $9,878.6 $12.68 $18.63 75.5%
BCO The Brink's Company 12/31/2014 06/30/2015 49.9 27.01 1,347.2 1,671.0 19.15 33.62 80.3%
CTAS Cintas Corporation 05/31/2015 08/31/2015 115.3 85.75 9,890.3 10,990.1 66.75 89.74 95.6%
GK G&K Services Inc. 06/27/2015 06/27/2015 20.6 66.62 1,374.3 1,602.0 53.62 74.11 89.9%
HEES H&E Equipment Services Inc. 12/31/2014 06/30/2015 35.3 16.72 589.5 1,538.4 13.47 40.33 41.5%
HCCI Heritage-Crystal Clean, Inc 01/03/2015 06/20/2015 22.4 10.27 230.3 289.5 9.73 19.13 53.7%
HTZ Hertz Global Holdings, Inc. 12/31/2014 06/30/2015 463.7 16.73 7,757.4 17,188.9 14.85 25.72 65.0%
IRM Iron Mountain Incorporated 12/31/2014 06/30/2015 213.1 31.02 6,611.6 11,297.0 26.49 41.53 74.7%
MGRC McGrath Rentcorp 12/31/2014 06/30/2015 26.2 26.69 699.8 1,036.2 23.48 38.79 68.8%
MINI Mobile Mini, Inc. 12/31/2014 06/30/2015 45.4 30.79 1,398.0 2,242.5 29.07 45.48 67.7%
NEFF Neff Corp. 12/31/2014 06/30/2015 10.6 5.59 59.0 742.3 5.31 15.78 35.4%
UNF UniFirst Corp. 08/30/2014 05/30/2015 20.4 106.81 2,174.7 1,942.4 93.97 124.61 85.7%
URI United Rentals, Inc. 12/31/2014 06/30/2015 96.5 60.05 5,795.2 14,005.2 56.66 119.35 50.3%
Mean 68.0%
Median 68.8%
75th Percentile 87.8%
50th Percentile 77.3%
25th Percentile 68.2%
Current Market Multiples
15
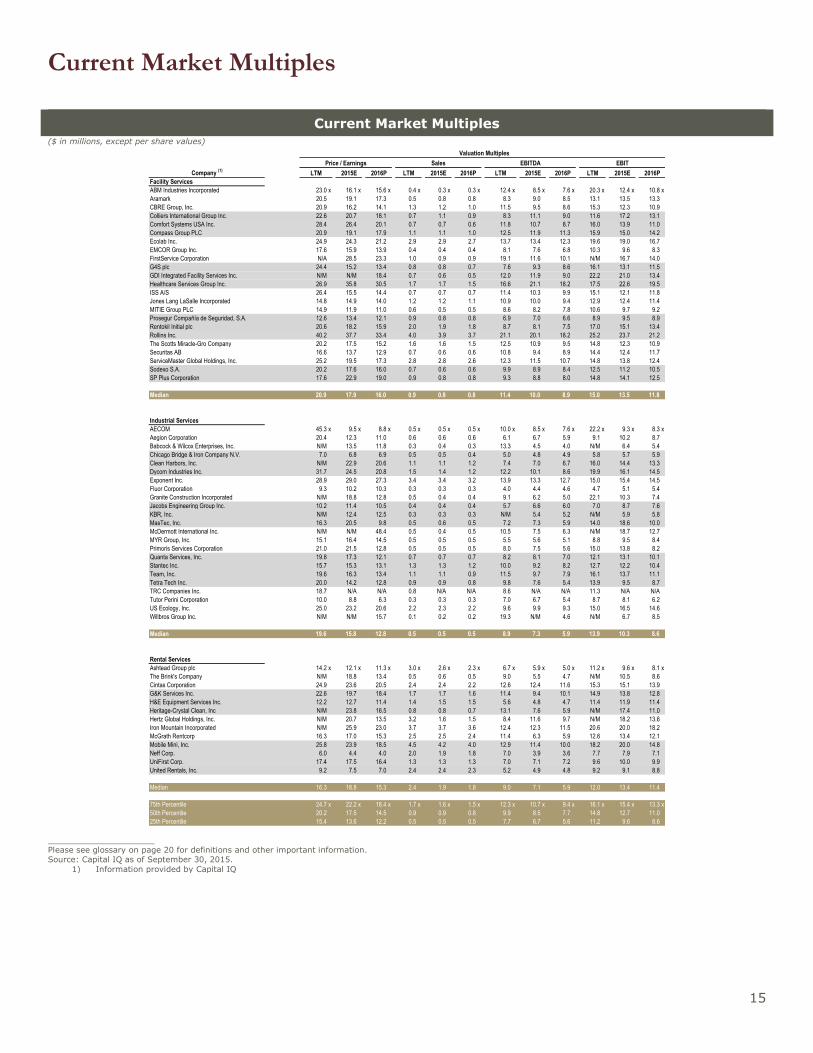
Current Market Multiples ($ in millions, except per share values)
_____________________
Please see glossary on page 20 for definitions and other important information. Source: Capital IQ as of September 30, 2015.
1) Information provided by Capital IQ
Valuation Multiples
Price / Earnings Sales EBITDA EBIT
Company (1)
LTM 2015E 2016P LTM 2015E 2016P LTM 2015E 2016P LTM 2015E 2016P
Facility Services
ABM Industries Incorporated 23.0 x 16.1 x 15.6 x 0.4 x 0.3 x 0.3 x 12.4 x 8.5 x 7.6 x 20.3 x 12.4 x 10.8 x
Aramark 20.5 19.1 17.3 0.5 0.8 0.8 8.3 9.0 8.5 13.1 13.5 13.3
CBRE Group, Inc. 20.9 16.2 14.1 1.3 1.2 1.0 11.5 9.5 8.6 15.3 12.3 10.9
Colliers International Group Inc. 22.6 20.7 18.1 0.7 1.1 0.9 8.3 11.1 9.0 11.6 17.2 13.1
Comfort Systems USA Inc. 28.4 26.4 20.1 0.7 0.7 0.6 11.8 10.7 8.7 16.0 13.9 11.0
Compass Group PLC 20.9 19.1 17.9 1.1 1.1 1.0 12.5 11.9 11.3 15.9 15.0 14.2
Ecolab Inc. 24.9 24.3 21.2 2.9 2.9 2.7 13.7 13.4 12.3 19.6 19.0 16.7
EMCOR Group Inc. 17.6 15.9 13.9 0.4 0.4 0.4 8.1 7.6 6.8 10.3 9.6 8.3
FirstService Corporation N/A 28.5 23.3 1.0 0.9 0.9 19.1 11.6 10.1 N/M 16.7 14.0
G4S plc 24.4 15.2 13.4 0.8 0.8 0.7 7.6 9.3 8.6 16.1 13.1 11.5
GDI Integrated Facility Services Inc. N/M N/M 18.4 0.7 0.6 0.5 12.0 11.9 9.0 22.2 21.0 13.4
Healthcare Services Group Inc. 26.9 35.8 30.5 1.7 1.7 1.5 16.6 21.1 18.2 17.5 22.6 19.5
ISS A/S 26.4 15.5 14.4 0.7 0.7 0.7 11.4 10.3 9.9 15.1 12.1 11.8
Jones Lang LaSalle Incorporated 14.8 14.9 14.0 1.2 1.2 1.1 10.9 10.0 9.4 12.9 12.4 11.4
MITIE Group PLC 14.9 11.9 11.0 0.6 0.5 0.5 8.6 8.2 7.8 10.6 9.7 9.2
Prosegur Compañía de Seguridad, S.A. 12.6 13.4 12.1 0.9 0.8 0.8 6.9 7.0 6.6 8.9 9.5 8.9
Rentokil Initial plc 20.6 18.2 15.9 2.0 1.9 1.8 8.7 8.1 7.5 17.0 15.1 13.4
Rollins Inc. 40.2 37.7 33.4 4.0 3.9 3.7 21.1 20.1 18.2 25.2 23.7 21.2
The Scotts Miracle-Gro Company 20.2 17.5 15.2 1.6 1.6 1.5 12.5 10.9 9.5 14.8 12.3 10.9
Securitas AB 16.6 13.7 12.9 0.7 0.6 0.6 10.8 9.4 8.9 14.4 12.4 11.7
ServiceMaster Global Holdings, Inc. 25.2 19.5 17.3 2.8 2.8 2.6 12.3 11.5 10.7 14.8 13.8 12.4
Sodexo S.A. 20.2 17.6 16.0 0.7 0.6 0.6 9.9 8.9 8.4 12.5 11.2 10.5
SP Plus Corporation 17.6 22.9 19.0 0.9 0.8 0.8 9.3 8.8 8.0 14.8 14.1 12.5
Median 20.9 17.9 16.0 0.9 0.8 0.8 11.4 10.0 8.9 15.0 13.5 11.8
Industrial Services
AECOM 45.3 x 9.5 x 8.8 x 0.5 x 0.5 x 0.5 x 10.0 x 8.5 x 7.6 x 22.2 x 9.3 x 8.3 x
Aegion Corporation 20.4 12.3 11.0 0.6 0.6 0.6 6.1 6.7 5.9 9.1 10.2 8.7
Babcock & Wilcox Enterprises, Inc. N/M 13.5 11.8 0.3 0.4 0.3 13.3 4.5 4.0 N/M 6.4 5.4
Chicago Bridge & Iron Company N.V. 7.0 6.8 6.9 0.5 0.5 0.4 5.0 4.8 4.9 5.8 5.7 5.9
Clean Harbors, Inc. N/M 22.9 20.6 1.1 1.1 1.2 7.4 7.0 6.7 16.0 14.4 13.3
Dycom Industries Inc. 31.7 24.5 20.8 1.5 1.4 1.2 12.2 10.1 8.6 19.9 16.1 14.5
Exponent Inc. 28.9 29.0 27.3 3.4 3.4 3.2 13.9 13.3 12.7 15.0 15.4 14.5
Fluor Corporation 9.3 10.2 10.3 0.3 0.3 0.3 4.0 4.4 4.6 4.7 5.1 5.4
Granite Construction Incorporated N/M 18.8 12.8 0.5 0.4 0.4 9.1 6.2 5.0 22.1 10.3 7.4
Jacobs Engineering Group Inc. 10.2 11.4 10.5 0.4 0.4 0.4 5.7 6.6 6.0 7.0 8.7 7.6
KBR, Inc. N/M 12.4 12.5 0.3 0.3 0.3 N/M 5.4 5.2 N/M 5.9 5.8
MasTec, Inc. 16.3 20.5 9.8 0.5 0.6 0.5 7.2 7.3 5.9 14.0 18.6 10.0
McDermott International Inc. N/M N/M 48.4 0.5 0.4 0.5 10.5 7.5 6.3 N/M 18.7 12.7
MYR Group, Inc. 15.1 16.4 14.5 0.5 0.5 0.5 5.5 5.6 5.1 8.8 9.5 8.4
Primoris Services Corporation 21.0 21.5 12.8 0.5 0.5 0.5 8.0 7.5 5.6 15.0 13.8 8.2
Quanta Services, Inc. 19.8 17.3 12.1 0.7 0.7 0.7 8.2 8.1 7.0 12.1 13.1 10.1
Stantec Inc. 15.7 15.3 13.1 1.3 1.3 1.2 10.0 9.2 8.2 12.7 12.2 10.4
Team, Inc. 19.6 16.3 13.4 1.1 1.1 0.9 11.5 9.7 7.9 16.1 13.7 11.1
Tetra Tech Inc. 20.0 14.2 12.8 0.9 0.9 0.8 9.8 7.6 5.4 13.9 9.5 8.7
TRC Companies Inc. 18.7 N/A N/A 0.8 N/A N/A 8.6 N/A N/A 11.3 N/A N/A
Tutor Perini Corporation 10.0 8.8 6.3 0.3 0.3 0.3 7.0 6.7 5.4 8.7 8.1 6.2
US Ecology, Inc. 25.0 23.2 20.6 2.2 2.3 2.2 9.6 9.9 9.3 15.0 16.5 14.6
Willbros Group Inc. N/M N/M 15.7 0.1 0.2 0.2 19.3 N/M 4.6 N/M 6.7 8.5
Median 19.6 15.8 12.8 0.5 0.5 0.5 8.9 7.3 5.9 13.9 10.3 8.6
Rental Services
Ashtead Group plc 14.2 x 12.1 x 11.3 x 3.0 x 2.6 x 2.3 x 6.7 x 5.9 x 5.0 x 11.2 x 9.6 x 8.1 x
The Brink's Company N/M 18.8 13.4 0.5 0.6 0.5 9.0 5.5 4.7 N/M 10.5 8.6
Cintas Corporation 24.9 23.6 20.5 2.4 2.4 2.2 12.6 12.4 11.6 15.3 15.1 13.9
G&K Services Inc. 22.6 19.7 18.4 1.7 1.7 1.6 11.4 9.4 10.1 14.9 13.8 12.8
H&E Equipment Services Inc. 12.2 12.7 11.4 1.4 1.5 1.5 5.6 4.8 4.7 11.4 11.9 11.4
Heritage-Crystal Clean, Inc N/M 23.8 16.5 0.8 0.8 0.7 13.1 7.6 5.9 N/M 17.4 11.0
Hertz Global Holdings, Inc. N/M 20.7 13.5 3.2 1.6 1.5 8.4 11.6 9.7 N/M 18.2 13.6
Iron Mountain Incorporated N/M 25.9 23.0 3.7 3.7 3.6 12.4 12.3 11.5 20.6 20.0 18.2
McGrath Rentcorp 16.3 17.0 15.3 2.5 2.5 2.4 11.4 6.3 5.9 12.6 13.4 12.1
Mobile Mini, Inc. 25.8 23.9 18.5 4.5 4.2 4.0 12.9 11.4 10.0 18.2 20.0 14.8
Neff Corp. 6.0 4.4 4.0 2.0 1.9 1.8 7.0 3.9 3.6 7.7 7.9 7.1
UniFirst Corp. 17.4 17.5 16.4 1.3 1.3 1.3 7.0 7.1 7.2 9.6 10.0 9.9
United Rentals, Inc. 9.2 7.5 7.0 2.4 2.4 2.3 5.2 4.9 4.8 9.2 9.1 8.8
Median 16.3 18.8 15.3 2.4 1.9 1.8 9.0 7.1 5.9 12.0 13.4 11.4
75th Percentile 24.7 x 22.2 x 18.4 x 1.7 x 1.6 x 1.5 x 12.3 x 10.7 x 9.4 x 16.1 x 15.4 x 13.3 x
50th Percentile 20.2 17.5 14.5 0.9 0.9 0.8 9.9 8.5 7.7 14.8 12.7 11.0
25th Percentile 15.4 13.6 12.2 0.5 0.5 0.5 7.7 6.7 5.6 11.2 9.6 8.6
Current Operating Metrics
16
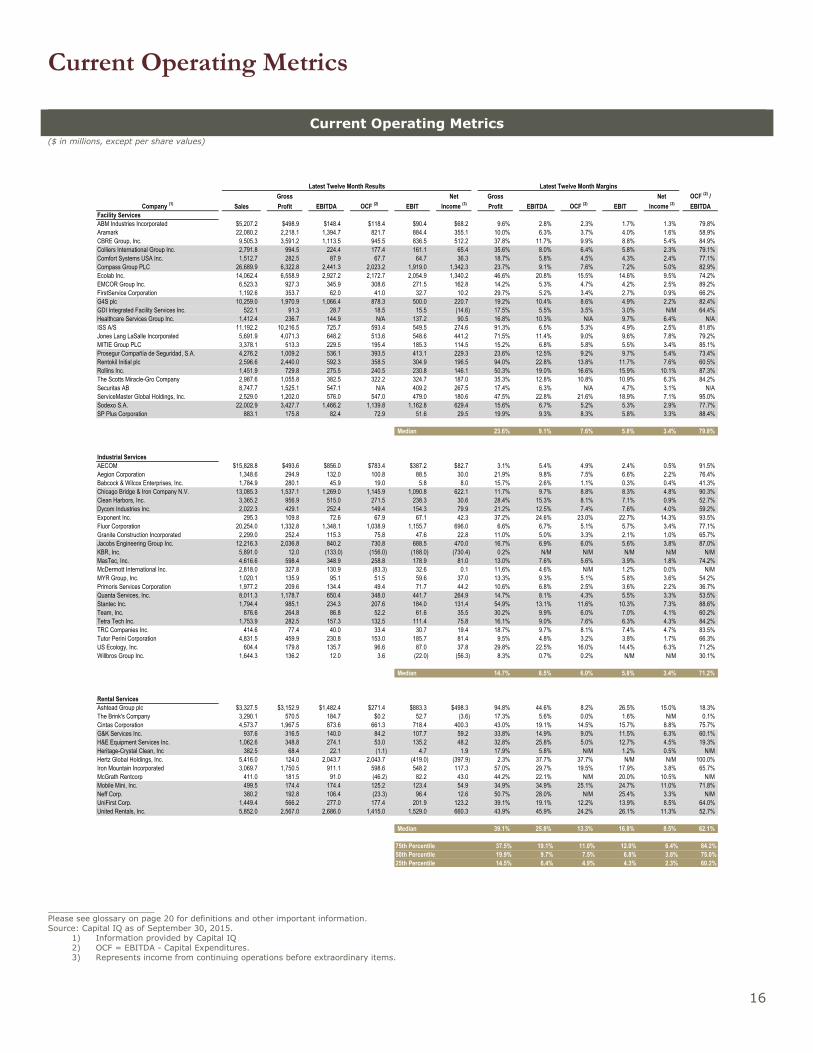
Current Operating Metrics ($ in millions, except per share values)
_____________________ Please see glossary on page 20 for definitions and other important information.
Source: Capital IQ as of September 30, 2015.
1) Information provided by Capital IQ
2) OCF = EBITDA - Capital Expenditures.
3) Represents income from continuing operations before extraordinary items.
Latest Twelve Month Results Latest Twelve Month Margins
Gross Net Gross Net OCF (2)
/
Company (1)
Sales Profit EBITDA OCF (2)
EBIT Income (3)
Profit EBITDA OCF (2)
EBIT Income (3)
EBITDA
Facility Services
ABM Industries Incorporated $5,207.2 $498.9 $148.4 $118.4 $90.4 $68.2 9.6% 2.8% 2.3% 1.7% 1.3% 79.8%
Aramark 22,080.2 2,218.1 1,394.7 821.7 884.4 355.1 10.0% 6.3% 3.7% 4.0% 1.6% 58.9%
CBRE Group, Inc. 9,505.3 3,591.2 1,113.5 945.5 836.5 512.2 37.8% 11.7% 9.9% 8.8% 5.4% 84.9%
Colliers International Group Inc. 2,791.8 994.5 224.4 177.4 161.1 65.4 35.6% 8.0% 6.4% 5.8% 2.3% 79.1%
Comfort Systems USA Inc. 1,512.7 282.5 87.9 67.7 64.7 36.3 18.7% 5.8% 4.5% 4.3% 2.4% 77.1%
Compass Group PLC 26,689.9 6,322.8 2,441.3 2,023.2 1,919.0 1,342.3 23.7% 9.1% 7.6% 7.2% 5.0% 82.9%
Ecolab Inc. 14,062.4 6,558.9 2,927.2 2,172.7 2,054.9 1,340.2 46.6% 20.8% 15.5% 14.6% 9.5% 74.2%
EMCOR Group Inc. 6,523.3 927.3 345.9 308.6 271.5 162.8 14.2% 5.3% 4.7% 4.2% 2.5% 89.2%
FirstService Corporation 1,192.6 353.7 62.0 41.0 32.7 10.2 29.7% 5.2% 3.4% 2.7% 0.9% 66.2%
G4S plc 10,259.0 1,970.9 1,066.4 878.3 500.0 220.7 19.2% 10.4% 8.6% 4.9% 2.2% 82.4%
GDI Integrated Facility Services Inc. 522.1 91.3 28.7 18.5 15.5 (14.6) 17.5% 5.5% 3.5% 3.0% N/M 64.4%
Healthcare Services Group Inc. 1,412.4 236.7 144.9 N/A 137.2 90.5 16.8% 10.3% N/A 9.7% 6.4% N/A
ISS A/S 11,192.2 10,216.5 725.7 593.4 549.5 274.6 91.3% 6.5% 5.3% 4.9% 2.5% 81.8%
Jones Lang LaSalle Incorporated 5,691.9 4,071.3 648.2 513.6 548.6 441.2 71.5% 11.4% 9.0% 9.6% 7.8% 79.2%
MITIE Group PLC 3,378.1 513.3 229.5 195.4 185.3 114.5 15.2% 6.8% 5.8% 5.5% 3.4% 85.1%
Prosegur Compañía de Seguridad, S.A. 4,276.2 1,009.2 536.1 393.5 413.1 229.3 23.6% 12.5% 9.2% 9.7% 5.4% 73.4%
Rentokil Initial plc 2,596.6 2,440.0 592.3 358.5 304.9 196.5 94.0% 22.8% 13.8% 11.7% 7.6% 60.5%
Rollins Inc. 1,451.9 729.8 275.5 240.5 230.8 146.1 50.3% 19.0% 16.6% 15.9% 10.1% 87.3%
The Scotts Miracle-Gro Company 2,987.6 1,055.8 382.5 322.2 324.7 187.0 35.3% 12.8% 10.8% 10.9% 6.3% 84.2%
Securitas AB 8,747.7 1,525.1 547.1 N/A 409.2 267.5 17.4% 6.3% N/A 4.7% 3.1% N/A
ServiceMaster Global Holdings, Inc. 2,529.0 1,202.0 576.0 547.0 479.0 180.6 47.5% 22.8% 21.6% 18.9% 7.1% 95.0%
Sodexo S.A. 22,002.9 3,427.7 1,466.2 1,139.8 1,162.8 629.4 15.6% 6.7% 5.2% 5.3% 2.9% 77.7%
SP Plus Corporation 883.1 175.8 82.4 72.9 51.6 29.5 19.9% 9.3% 8.3% 5.8% 3.3% 88.4%
Median 23.6% 9.1% 7.6% 5.8% 3.4% 79.8%
Industrial Services
AECOM $15,828.8 $493.6 $856.0 $783.4 $387.2 $82.7 3.1% 5.4% 4.9% 2.4% 0.5% 91.5%
Aegion Corporation 1,348.6 294.9 132.0 100.8 88.5 30.0 21.9% 9.8% 7.5% 6.6% 2.2% 76.4%
Babcock & Wilcox Enterprises, Inc. 1,784.9 280.1 45.9 19.0 5.8 8.0 15.7% 2.6% 1.1% 0.3% 0.4% 41.3%
Chicago Bridge & Iron Company N.V. 13,085.3 1,537.1 1,269.0 1,145.9 1,090.8 622.1 11.7% 9.7% 8.8% 8.3% 4.8% 90.3%
Clean Harbors, Inc. 3,365.2 956.9 515.0 271.5 238.3 30.6 28.4% 15.3% 8.1% 7.1% 0.9% 52.7%
Dycom Industries Inc. 2,022.3 429.1 252.4 149.4 154.3 79.9 21.2% 12.5% 7.4% 7.6% 4.0% 59.2%
Exponent Inc. 295.3 109.8 72.6 67.9 67.1 42.3 37.2% 24.6% 23.0% 22.7% 14.3% 93.5%
Fluor Corporation 20,254.0 1,332.8 1,348.1 1,038.9 1,155.7 696.0 6.6% 6.7% 5.1% 5.7% 3.4% 77.1%
Granite Construction Incorporated 2,299.0 252.4 115.3 75.8 47.6 22.8 11.0% 5.0% 3.3% 2.1% 1.0% 65.7%
Jacobs Engineering Group Inc. 12,216.3 2,036.8 840.2 730.8 688.5 470.0 16.7% 6.9% 6.0% 5.6% 3.8% 87.0%
KBR, Inc. 5,891.0 12.0 (133.0) (156.0) (188.0) (730.4) 0.2% N/M N/M N/M N/M N/M
MasTec, Inc. 4,616.6 598.4 348.9 258.8 178.9 81.0 13.0% 7.6% 5.6% 3.9% 1.8% 74.2%
McDermott International Inc. 2,818.0 327.8 130.9 (83.3) 32.6 0.1 11.6% 4.6% N/M 1.2% 0.0% N/M
MYR Group, Inc. 1,020.1 135.9 95.1 51.5 59.6 37.0 13.3% 9.3% 5.1% 5.8% 3.6% 54.2%
Primoris Services Corporation 1,977.2 209.6 134.4 49.4 71.7 44.2 10.6% 6.8% 2.5% 3.6% 2.2% 36.7%
Quanta Services, Inc. 8,011.3 1,178.7 650.4 348.0 441.7 264.9 14.7% 8.1% 4.3% 5.5% 3.3% 53.5%
Stantec Inc. 1,794.4 985.1 234.3 207.6 184.0 131.4 54.9% 13.1% 11.6% 10.3% 7.3% 88.6%
Team, Inc. 876.6 264.8 86.8 52.2 61.6 35.5 30.2% 9.9% 6.0% 7.0% 4.1% 60.2%
Tetra Tech Inc. 1,753.9 282.5 157.3 132.5 111.4 75.8 16.1% 9.0% 7.6% 6.3% 4.3% 84.2%
TRC Companies Inc. 414.6 77.4 40.0 33.4 30.7 19.4 18.7% 9.7% 8.1% 7.4% 4.7% 83.5%
Tutor Perini Corporation 4,831.5 459.9 230.8 153.0 185.7 81.4 9.5% 4.8% 3.2% 3.8% 1.7% 66.3%
US Ecology, Inc. 604.4 179.8 135.7 96.6 87.0 37.8 29.8% 22.5% 16.0% 14.4% 6.3% 71.2%
Willbros Group Inc. 1,644.3 136.2 12.0 3.6 (22.0) (56.3) 8.3% 0.7% 0.2% N/M N/M 30.1%
Median 14.7% 8.5% 6.0% 5.8% 3.4% 71.2%
Rental Services
Ashtead Group plc $3,327.5 $3,152.9 $1,482.4 $271.4 $883.3 $498.3 94.8% 44.6% 8.2% 26.5% 15.0% 18.3%
The Brink's Company 3,290.1 570.5 184.7 $0.2 52.7 (3.6) 17.3% 5.6% 0.0% 1.6% N/M 0.1%
Cintas Corporation 4,573.7 1,967.5 873.6 661.3 718.4 400.3 43.0% 19.1% 14.5% 15.7% 8.8% 75.7%
G&K Services Inc. 937.6 316.5 140.0 84.2 107.7 59.2 33.8% 14.9% 9.0% 11.5% 6.3% 60.1%
H&E Equipment Services Inc. 1,062.6 348.8 274.1 53.0 135.2 48.2 32.8% 25.8% 5.0% 12.7% 4.5% 19.3%
Heritage-Crystal Clean, Inc 382.5 68.4 22.1 (1.1) 4.7 1.9 17.9% 5.8% N/M 1.2% 0.5% N/M
Hertz Global Holdings, Inc. 5,416.0 124.0 2,043.7 2,043.7 (419.0) (397.9) 2.3% 37.7% 37.7% N/M N/M 100.0%
Iron Mountain Incorporated 3,069.7 1,750.5 911.1 598.6 548.2 117.3 57.0% 29.7% 19.5% 17.9% 3.8% 65.7%
McGrath Rentcorp 411.0 181.5 91.0 (46.2) 82.2 43.0 44.2% 22.1% N/M 20.0% 10.5% N/M
Mobile Mini, Inc. 499.5 174.4 174.4 125.2 123.4 54.9 34.9% 34.9% 25.1% 24.7% 11.0% 71.8%
Neff Corp. 380.2 192.8 106.4 (23.3) 96.4 12.6 50.7% 28.0% N/M 25.4% 3.3% N/M
UniFirst Corp. 1,449.4 566.2 277.0 177.4 201.9 123.2 39.1% 19.1% 12.2% 13.9% 8.5% 64.0%
United Rentals, Inc. 5,852.0 2,567.0 2,686.0 1,415.0 1,529.0 660.3 43.9% 45.9% 24.2% 26.1% 11.3% 52.7%
Median 39.1% 25.8% 13.3% 16.8% 8.5% 62.1%
75th Percentile 37.5% 19.1% 11.0% 12.0% 6.4% 84.2%
50th Percentile 19.9% 9.7% 7.5% 6.8% 3.8% 75.0%
25th Percentile 14.5% 6.4% 4.9% 4.3% 2.3% 60.2%
Current Return and Leverage Analysis
17
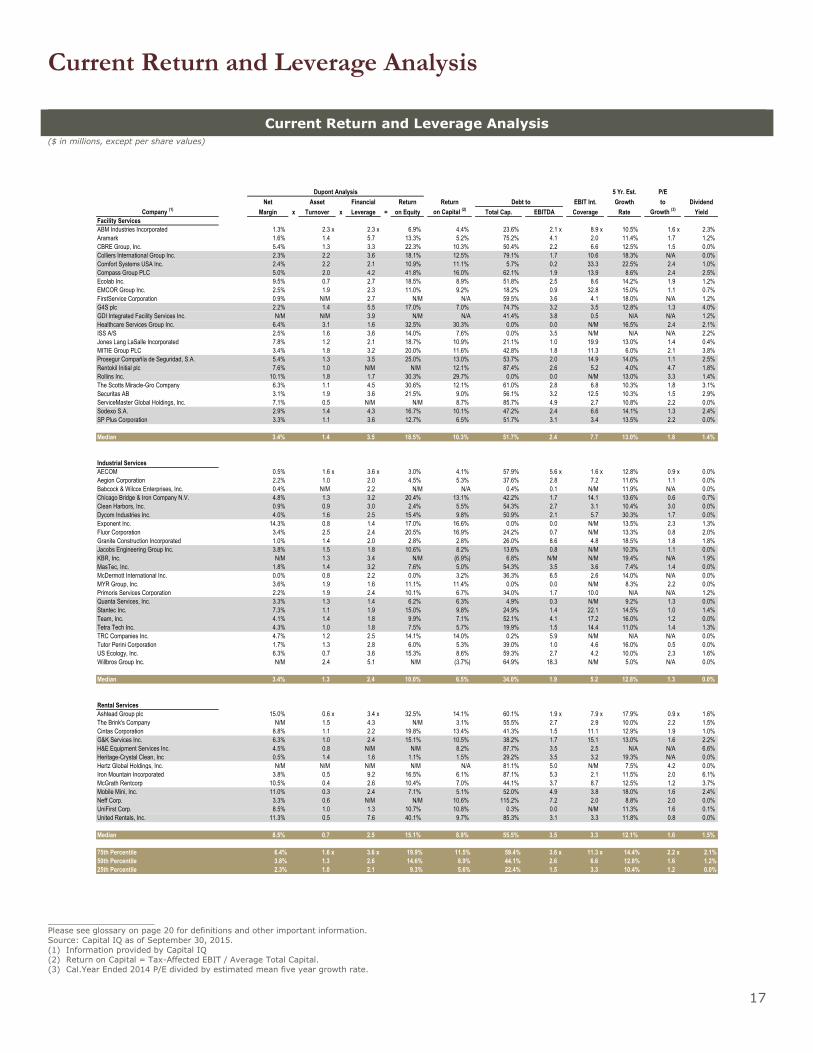
Current Return and Leverage Analysis ($ in millions, except per share values)
_____________________ Please see glossary on page 20 for definitions and other important information.
Source: Capital IQ as of September 30, 2015.
(1) Information provided by Capital IQ
(2) Return on Capital = Tax-Affected EBIT / Average Total Capital.
(3) Cal.Year Ended 2014 P/E divided by estimated mean five year growth rate.
Dupont Analysis 5 Yr. Est. P/E
Net Asset Financial Return Return Debt to EBIT Int. Growth to Dividend
Company (1)
Margin x Turnover x Leverage = on Equity on Capital (2)
Total Cap. EBITDA Coverage Rate Growth (3)
Yield
Facility Services
ABM Industries Incorporated 1.3% 2.3 x 2.3 x 6.9% 4.4% 23.6% 2.1 x 8.9 x 10.5% 1.6 x 2.3%
Aramark 1.6% 1.4 5.7 13.3% 5.2% 75.2% 4.1 2.0 11.4% 1.7 1.2%
CBRE Group, Inc. 5.4% 1.3 3.3 22.3% 10.3% 50.4% 2.2 6.6 12.5% 1.5 0.0%
Colliers International Group Inc. 2.3% 2.2 3.6 18.1% 12.5% 79.1% 1.7 10.6 18.3% N/A 0.0%
Comfort Systems USA Inc. 2.4% 2.2 2.1 10.9% 11.1% 5.7% 0.2 33.3 22.5% 2.4 1.0%
Compass Group PLC 5.0% 2.0 4.2 41.8% 16.0% 62.1% 1.9 13.9 8.6% 2.4 2.5%
Ecolab Inc. 9.5% 0.7 2.7 18.5% 8.9% 51.8% 2.5 8.6 14.2% 1.9 1.2%
EMCOR Group Inc. 2.5% 1.9 2.3 11.0% 9.2% 18.2% 0.9 32.8 15.0% 1.1 0.7%
FirstService Corporation 0.9% N/M 2.7 N/M N/A 59.5% 3.6 4.1 18.0% N/A 1.2%
G4S plc 2.2% 1.4 5.5 17.0% 7.0% 74.7% 3.2 3.5 12.8% 1.3 4.0%
GDI Integrated Facility Services Inc. N/M N/M 3.9 N/M N/A 41.4% 3.8 0.5 N/A N/A 1.2%
Healthcare Services Group Inc. 6.4% 3.1 1.6 32.5% 30.3% 0.0% 0.0 N/M 16.5% 2.4 2.1%
ISS A/S 2.5% 1.6 3.6 14.0% 7.6% 0.0% 3.5 N/M N/A N/A 2.2%
Jones Lang LaSalle Incorporated 7.8% 1.2 2.1 18.7% 10.9% 21.1% 1.0 19.9 13.0% 1.4 0.4%
MITIE Group PLC 3.4% 1.8 3.2 20.0% 11.6% 42.8% 1.8 11.3 6.0% 2.1 3.8%
Prosegur Compañía de Seguridad, S.A. 5.4% 1.3 3.5 25.0% 13.0% 53.7% 2.0 14.9 14.0% 1.1 2.5%
Rentokil Initial plc 7.6% 1.0 N/M N/M 12.1% 87.4% 2.6 5.2 4.0% 4.7 1.8%
Rollins Inc. 10.1% 1.8 1.7 30.3% 29.7% 0.0% 0.0 N/M 13.0% 3.3 1.4%
The Scotts Miracle-Gro Company 6.3% 1.1 4.5 30.6% 12.1% 61.0% 2.8 6.8 10.3% 1.8 3.1%
Securitas AB 3.1% 1.9 3.6 21.5% 9.0% 56.1% 3.2 12.5 10.3% 1.5 2.9%
ServiceMaster Global Holdings, Inc. 7.1% 0.5 N/M N/M 8.7% 85.7% 4.9 2.7 10.8% 2.2 0.0%
Sodexo S.A. 2.9% 1.4 4.3 16.7% 10.1% 47.2% 2.4 6.6 14.1% 1.3 2.4%
SP Plus Corporation 3.3% 1.1 3.6 12.7% 6.5% 51.7% 3.1 3.4 13.5% 2.2 0.0%
Median 3.4% 1.4 3.5 18.5% 10.3% 51.7% 2.4 7.7 13.0% 1.8 1.4%
Industrial Services
AECOM 0.5% 1.6 x 3.6 x 3.0% 4.1% 57.9% 5.6 x 1.6 x 12.8% 0.9 x 0.0%
Aegion Corporation 2.2% 1.0 2.0 4.5% 5.3% 37.6% 2.8 7.2 11.6% 1.1 0.0%
Babcock & Wilcox Enterprises, Inc. 0.4% N/M 2.2 N/M N/A 0.4% 0.1 N/M 11.9% N/A 0.0%
Chicago Bridge & Iron Company N.V. 4.8% 1.3 3.2 20.4% 13.1% 42.2% 1.7 14.1 13.6% 0.6 0.7%
Clean Harbors, Inc. 0.9% 0.9 3.0 2.4% 5.5% 54.3% 2.7 3.1 10.4% 3.0 0.0%
Dycom Industries Inc. 4.0% 1.6 2.5 15.4% 9.8% 50.9% 2.1 5.7 30.3% 1.7 0.0%
Exponent Inc. 14.3% 0.8 1.4 17.0% 16.6% 0.0% 0.0 N/M 13.5% 2.3 1.3%
Fluor Corporation 3.4% 2.5 2.4 20.5% 16.9% 24.2% 0.7 N/M 13.3% 0.8 2.0%
Granite Construction Incorporated 1.0% 1.4 2.0 2.8% 2.8% 26.0% 8.6 4.8 18.5% 1.8 1.8%
Jacobs Engineering Group Inc. 3.8% 1.5 1.8 10.6% 8.2% 13.6% 0.8 N/M 10.3% 1.1 0.0%
KBR, Inc. N/M 1.3 3.4 N/M (6.9%) 6.8% N/M N/M 19.4% N/A 1.9%
MasTec, Inc. 1.8% 1.4 3.2 7.6% 5.0% 54.3% 3.5 3.6 7.4% 1.4 0.0%
McDermott International Inc. 0.0% 0.8 2.2 0.0% 3.2% 36.3% 6.5 2.6 14.0% N/A 0.0%
MYR Group, Inc. 3.6% 1.9 1.6 11.1% 11.4% 0.0% 0.0 N/M 8.3% 2.2 0.0%
Primoris Services Corporation 2.2% 1.9 2.4 10.1% 6.7% 34.0% 1.7 10.0 N/A N/A 1.2%
Quanta Services, Inc. 3.3% 1.3 1.4 6.2% 6.3% 4.9% 0.3 N/M 9.2% 1.3 0.0%
Stantec Inc. 7.3% 1.1 1.9 15.0% 9.8% 24.9% 1.4 22.1 14.5% 1.0 1.4%
Team, Inc. 4.1% 1.4 1.8 9.9% 7.1% 52.1% 4.1 17.2 16.0% 1.2 0.0%
Tetra Tech Inc. 4.3% 1.0 1.8 7.5% 5.7% 19.9% 1.5 14.4 11.0% 1.4 1.3%
TRC Companies Inc. 4.7% 1.2 2.5 14.1% 14.0% 0.2% 5.9 N/M N/A N/A 0.0%
Tutor Perini Corporation 1.7% 1.3 2.8 6.0% 5.3% 39.0% 1.0 4.6 16.0% 0.5 0.0%
US Ecology, Inc. 6.3% 0.7 3.6 15.3% 8.6% 59.3% 2.7 4.2 10.0% 2.3 1.6%
Willbros Group Inc. N/M 2.4 5.1 N/M (3.7%) 64.9% 18.3 N/M 5.0% N/A 0.0%
Median 3.4% 1.3 2.4 10.0% 6.5% 34.0% 1.9 5.2 12.8% 1.3 0.0%
Rental Services
Ashtead Group plc 15.0% 0.6 x 3.4 x 32.5% 14.1% 60.1% 1.9 x 7.9 x 17.9% 0.9 x 1.6%
The Brink's Company N/M 1.5 4.3 N/M 3.1% 55.5% 2.7 2.9 10.0% 2.2 1.5%
Cintas Corporation 8.8% 1.1 2.2 19.8% 13.4% 41.3% 1.5 11.1 12.9% 1.9 1.0%
G&K Services Inc. 6.3% 1.0 2.4 15.1% 10.5% 38.2% 1.7 15.1 13.0% 1.6 2.2%
H&E Equipment Services Inc. 4.5% 0.8 N/M N/M 8.2% 87.7% 3.5 2.5 N/A N/A 6.6%
Heritage-Crystal Clean, Inc 0.5% 1.4 1.6 1.1% 1.5% 29.2% 3.5 3.2 19.3% N/A 0.0%
Hertz Global Holdings, Inc. N/M N/M N/M N/M N/A 81.1% 5.0 N/M 7.5% 4.2 0.0%
Iron Mountain Incorporated 3.8% 0.5 9.2 16.5% 6.1% 87.1% 5.3 2.1 11.5% 2.0 6.1%
McGrath Rentcorp 10.5% 0.4 2.6 10.4% 7.0% 44.1% 3.7 8.7 12.5% 1.2 3.7%
Mobile Mini, Inc. 11.0% 0.3 2.4 7.1% 5.1% 52.0% 4.9 3.8 18.0% 1.6 2.4%
Neff Corp. 3.3% 0.6 N/M N/M 10.6% 115.2% 7.2 2.0 8.8% 2.0 0.0%
UniFirst Corp. 8.5% 1.0 1.3 10.7% 10.8% 0.3% 0.0 N/M 11.3% 1.6 0.1%
United Rentals, Inc. 11.3% 0.5 7.6 40.1% 9.7% 85.3% 3.1 3.3 11.8% 0.8 0.0%
Median 8.5% 0.7 2.5 15.1% 8.9% 55.5% 3.5 3.3 12.1% 1.6 1.5%
75th Percentile 6.4% 1.6 x 3.6 x 19.9% 11.5% 59.4% 3.6 x 11.3 x 14.4% 2.2 x 2.1%
50th Percentile 3.8% 1.3 2.6 14.6% 8.9% 44.1% 2.6 6.6 12.8% 1.6 1.2%
25th Percentile 2.3% 1.0 2.1 9.3% 5.6% 22.4% 1.5 3.3 10.4% 1.2 0.0%

Historical and Projected Results
18
Historical and Projected Results ($ in millions, except per share values)
_____________________
Please see glossary on page 20 for definitions and other important information.
Source: Capital IQ as of September 30, 2015.
(1) Information provided by Capital IQ
Calendar EPS Sales EBITDA EBIT
Company (1)
LTM 2015E 2016P LTM 2015E 2016P LTM 2015E 2016P LTM 2015E 2016P
Facility Services
ABM Industries Incorporated $1.19 $1.70 $1.76 $5,207.2 $5,321.7 $5,550.6 $148.4 $216.3 $243.2 $90.4 $148.8 $170.7
Aramark 1.44 1.55 1.71 22,080.2 14,429.1 15,101.2 1,394.7 1,289.4 1,355.1 884.4 853.2 866.0
CBRE Group, Inc. 1.53 1.97 2.27 9,505.3 10,441.4 12,398.1 1,113.5 1,351.8 1,488.4 836.5 1,038.0 1,174.0
Colliers International Group Inc. 1.79 1.96 2.24 2,791.8 1,762.7 2,165.3 224.4 168.1 207.0 161.1 108.8 143.0
Comfort Systems USA Inc. 0.96 1.03 1.36 1,512.7 1,577.8 1,712.9 87.9 96.1 118.2 64.7 74.3 94.3
Compass Group PLC 0.76 0.83 0.89 26,689.9 27,885.4 29,066.4 2,441.3 2,550.9 2,686.8 1,919.0 2,028.3 2,136.5
Ecolab Inc. 4.41 4.51 5.17 14,062.4 13,925.9 14,828.5 2,927.2 2,995.4 3,264.0 2,054.9 2,111.8 2,407.1
EMCOR Group Inc. 2.51 2.78 3.18 6,523.3 6,634.6 7,057.8 345.9 366.5 409.7 271.5 291.8 334.0
FirstService Corporation N/A 1.13 1.38 1,192.6 1,255.9 1,365.6 62.0 102.0 117.4 32.7 70.8 84.5
G4S plc 0.14 0.23 0.26 10,259.0 10,561.1 11,056.5 1,066.4 872.0 941.2 500.0 617.8 699.3
GDI Integrated Facility Services Inc. (2.86) 0.10 0.61 522.1 551.1 688.6 28.7 29.0 38.3 15.5 16.4 25.8
Healthcare Services Group Inc. 1.25 0.94 1.11 1,412.4 1,441.6 1,597.8 144.9 114.0 132.2 137.2 106.2 123.5
ISS A/S 1.25 2.14 2.30 11,192.2 12,122.6 12,398.6 725.7 802.6 833.4 549.5 685.5 701.6
Jones Lang LaSalle Incorporated 9.73 9.64 10.28 5,691.9 5,898.6 6,392.1 648.2 709.4 751.3 548.6 571.8 618.9
MITIE Group PLC 0.31 0.39 0.42 3,378.1 3,621.8 3,787.3 229.5 241.2 254.0 185.3 202.9 214.0
Prosegur Compañía de Seguridad, S.A. 0.38 0.36 0.40 4,276.2 4,612.2 4,761.3 536.1 523.5 558.3 413.1 388.0 412.9
Rentokil Initial plc 0.11 0.12 0.14 2,596.6 2,719.9 2,916.3 592.3 640.2 689.6 304.9 342.9 385.0
Rollins Inc. 0.67 0.71 0.81 1,451.9 1,488.7 1,563.9 275.5 290.1 319.2 230.8 245.2 274.0
The Scotts Miracle-Gro Company 3.01 3.47 3.99 2,987.6 3,019.5 3,156.8 382.5 439.6 506.6 324.7 388.7 440.7
Securitas AB 0.73 0.89 0.95 8,747.7 9,925.9 10,337.8 547.1 627.8 664.4 409.2 475.1 504.0
ServiceMaster Global Holdings, Inc. 1.33 1.72 1.94 2,529.0 2,582.9 2,707.4 576.0 617.5 662.9 479.0 514.0 574.7
Sodexo S.A. 4.09 4.70 5.17 22,002.9 22,779.1 23,727.9 1,466.2 1,619.6 1,724.3 1,162.8 1,289.7 1,383.0
SP Plus Corporation 1.31 1.01 1.22 883.1 921.2 968.1 82.4 86.7 94.8 51.6 54.0 60.8
Industrial Services
AECOM $0.61 $2.88 $3.11 $15,828.8 $18,413.1 $19,019.4 $856.0 $1,013.3 $1,136.9 $387.2 $926.0 $1,029.1
Aegion Corporation 0.81 1.34 1.50 1,348.6 1,353.5 1,422.6 132.0 120.7 137.8 88.5 79.1 93.4
Babcock & Wilcox Enterprises, Inc. N/M 1.25 1.43 1,784.9 1,718.4 1,767.6 45.9 135.7 152.1 5.8 95.5 113.7
Chicago Bridge & Iron Company N.V. 5.69 5.83 5.74 13,085.3 13,735.8 14,106.6 1,269.0 1,305.8 1,273.8 1,090.8 1,103.4 1,072.4
Clean Harbors, Inc. 0.52 1.92 2.14 3,365.2 3,394.1 3,252.0 515.0 547.3 567.2 238.3 264.4 285.5
Dycom Industries Inc. 2.28 2.95 3.48 2,022.3 2,224.1 2,537.2 252.4 305.6 355.8 154.3 190.7 212.0
Exponent Inc. 1.54 1.54 1.63 295.3 297.1 314.3 72.6 75.6 79.5 67.1 65.2 69.4
Fluor Corporation 4.54 4.16 4.12 20,254.0 19,808.3 20,203.8 1,348.1 1,219.6 1,177.2 1,155.7 1,049.2 1,002.9
Granite Construction Incorporated 0.57 1.57 2.32 2,299.0 2,433.3 2,696.6 115.3 169.4 210.9 47.6 102.1 142.1
Jacobs Engineering Group Inc. 3.66 3.28 3.58 12,216.3 11,914.2 12,190.9 840.2 727.2 799.6 688.5 553.7 630.3
KBR, Inc. (5.04) 1.34 1.34 5,891.0 5,403.5 5,138.4 (133.0) 323.1 339.9 (188.0) 300.6 304.9
MasTec, Inc. 0.97 0.77 1.62 4,616.6 4,266.9 4,633.5 348.9 340.9 420.3 178.9 134.6 249.1
McDermott International Inc. 0.00 (0.07) 0.09 2,818.0 3,149.8 2,730.4 130.9 184.9 218.4 32.6 73.8 108.3
MYR Group, Inc. 1.74 1.60 1.81 1,020.1 1,082.5 1,147.5 95.1 93.1 102.0 59.6 55.1 62.0
Primoris Services Corporation 0.85 0.83 1.40 1,977.2 2,051.7 2,265.3 134.4 142.7 193.2 71.7 78.3 131.0
Quanta Services, Inc. 1.22 1.40 2.01 8,011.3 7,581.0 8,015.6 650.4 659.4 761.7 441.7 409.0 531.6
Stantec Inc. 1.39 1.42 1.66 1,794.4 1,861.9 2,018.0 234.3 254.1 285.9 184.0 191.5 224.1
Team, Inc. 1.64 1.97 2.40 876.6 934.1 1,094.7 86.8 102.2 126.6 61.6 72.3 90.0
Tetra Tech Inc. 1.21 1.72 1.91 1,753.9 1,744.8 1,836.7 157.3 202.6 286.9 111.4 162.2 177.6
TRC Companies Inc. 0.63 N/A N/A 414.6 N/A N/A 40.0 N/A N/A 30.7 N/A N/A
Tutor Perini Corporation 1.65 1.86 2.63 4,831.5 5,193.9 5,567.2 230.8 242.1 300.5 185.7 201.4 261.5
US Ecology, Inc. 1.74 1.88 2.12 604.4 575.2 585.4 135.7 132.2 140.2 87.0 78.9 89.4
Willbros Group Inc. (1.08) (0.77) 0.08 1,644.3 1,239.4 1,164.7 12.0 7.7 50.5 (22.0) 34.8 27.4
Rental Services
Ashtead Group plc $0.99 $1.17 $1.24 $3,327.5 $3,768.0 $4,236.2 $1,482.4 $1,685.9 $1,970.1 $883.3 $1,033.9 $1,220.9
The Brink's Company (0.07) 1.44 2.02 3,290.1 3,014.7 3,043.2 184.7 304.6 359.0 52.7 158.5 195.2
Cintas Corporation 3.45 3.64 4.18 4,573.7 4,664.9 5,005.8 873.6 884.2 947.8 718.4 728.1 788.3
G&K Services Inc. 2.95 3.38 3.63 937.6 955.6 990.2 140.0 169.7 158.3 107.7 116.0 124.7
H&E Equipment Services Inc. 1.37 1.32 1.47 1,062.6 1,040.6 1,049.6 274.1 318.8 330.5 135.2 129.1 135.1
Heritage-Crystal Clean, Inc 0.09 0.43 0.62 382.5 367.1 404.9 22.1 38.2 49.3 4.7 16.6 26.3
Hertz Global Holdings, Inc. (0.88) 0.81 1.24 5,416.0 10,800.9 11,237.7 2,043.7 1,484.0 1,773.6 (419.0) 946.3 1,260.9
Iron Mountain Incorporated 0.57 1.20 1.35 3,069.7 3,040.5 3,126.4 911.1 916.9 980.8 548.2 565.0 619.1
McGrath Rentcorp 1.64 1.57 1.74 411.0 408.2 434.2 91.0 165.0 176.3 82.2 77.5 85.5
Mobile Mini, Inc. 1.19 1.29 1.66 499.5 529.6 560.7 174.4 197.2 223.8 123.4 112.0 151.5
Neff Corp. 0.93 1.26 1.41 380.2 386.9 407.2 106.4 190.4 205.8 96.4 94.2 104.8
UniFirst Corp. 6.15 6.10 6.52 1,449.4 1,469.1 1,465.4 277.0 273.8 269.2 201.9 195.2 196.1
United Rentals, Inc. 6.53 7.99 8.54 5,852.0 5,847.4 6,046.2 2,686.0 2,870.4 2,948.3 1,529.0 1,533.5 1,592.5

Disclaimers & Other Disclosures
19
DISCLAIMER
This is not a complete analysis of every material fact regarding any company, industry or security. The opinions expressed here reflect our judgment at this date and are subject to change. The information has been obtained from sources we consider to be reliable, but we cannot guarantee the accuracy.
ADDITIONAL INFORMATION ON COMPANIES MENTIONED HEREIN IS AVAILABLE UPON REQUEST
Baird is exempt from the requirement to hold an Australian financial services license. Baird is regulated by the United States Securities and Exchange Commission, FINRA and various other self-regulatory organizations and those laws and
regulations may differ from Australian laws. This report has been prepared in accordance with the laws and regulations governing United States broker-dealers and not Australian laws.
OTHER DISCLOSURES
UK disclosure requirements for the purpose of distributing this research into the UK and other countries for which
Robert W. Baird Limited holds an ISD passport.
This report is for distribution into the United Kingdom only to persons who fall within Article 19 or Article 49(2) of the Financial Services and Markets Act 2000 (financial promotion) order 2001 being persons who are investment
professionals and may not be distributed to private clients. Issued in the United Kingdom by Robert W. Baird Limited, which has offices at Mint House 77 Mansell Street, London, E1 8AF, and is a company authorized and regulated by the Financial Conduct Authority. For the purposes of the Financial Conduct Authority requirements, this investment research report is classified as objective.
Robert W. Baird Limited ("RWBL") is exempt from the requirement to hold an Australian financial services license. RWBL is regulated by the Financial Conduct Authority ("FCA") under UK laws and those laws may differ from Australian laws. This document has been prepared in accordance with FCA requirements and not Australian laws.

Glossary of Terms & Other Important Information
20
EBITDA – Earnings before interest, taxes, depreciation & amortization. An approximate measure of a company's operating cash flow based on data from the company's income statement.
EBIT – Earnings before interest and taxes. A measure of a company's earning power from ongoing operations, equal to earnings before deduction of interest payments and income taxes.
Enterprise Value (EV) – Market value of equity plus debt less cash. A measure of what the market believes a company's ongoing operations are worth.
GDP - Gross Domestic Product – The total market value of all final goods and services produced in a country in a given
year, equal to total consumer, investment and government spending, plus the value of exports, minus the value of imports.
LTM – Last twelve months. Time period used when referencing a financial statistic.
P/E – Price per share divided by earnings per share. The most common measure of how expensive a stock is.
The S&P 500 – An unmanaged stock index commonly used to measure and report common stock performance.
E – Represents estimates of a company’s financial performance for the next fiscal period.
P – Represents projections of a company’s financial performance following the next fiscal period.
© 2014 Robert W. Baird & Co. Incorporated
Robert W. Baird & Co. www.rwbaird.com 800.RW.BAIRD
Equity Capital Markets and Private Equity Office Locations
Atlanta
One Buckhead Plaza
3060 Peachtree Road
Suite 1815
Atlanta, GA 30305
Boston One Post Office Square
Suite 3617
Boston, MA 02109
Boulder
One Boulder Plaza
1301 Canyon Blvd. - Suite 220
Boulder, CO 80302
Charlotte
6000 Fairview Road
Suite 1100
Charlotte, NC 28210
Chicago
227 West Monroe Street Suite 2100
Chicago, IL 60606
Denver
210 University Boulevard
Suite 700
Denver, CO 80206
Frankfurt*
Neue Mainzer Strasse 28
60311 Frankfurt
Germany
London*
Finsbury Circus House 15 Finsbury Circus
London EC2M 7EB
UK
Milwaukee
777 East Wisconsin Avenue
Milwaukee, WI 53202
Nashville
2525 West End Avenue
Suite 1000
Nashville, TN 37203
New York City
3 Rockefeller Plaza
610 Fifth Avenue New York, NY 10020
Palo Alto
1661 Page Mill Road
Suite A
Palo Alto, CA 94304
San Francisco
50 California Street
Suite 450
San Francisco, CA 94111
555 California Street
Suite 4900
San Francisco, CA 94104
Shanghai*
Rm 42-022, 42/F, Hang Seng Bank Tower
No.1000 Lujiazui Ring Road
Pudong Shanghai 200120, China
St. Louis
8000 Maryland Avenue Suite 500
St. Louis, MO 63105
Stamford
100 First Stamford Place
3rd Floor
Stamford, CT 06902
Tampa
3000 Bayport Drive
Suite 760
Tampa, FL 33607
Washington, D.C.
1717 K Street NW
Suite 910 Washington, DC 20006
Baird and its operating affiliates have offices in the United States, Europe and Asia.
Robert W. Baird & Co. Incorporated. Member SIPC.
Robert W. Baird Ltd. and Baird Capital Partners Europe are authorized and regulated in the UK by the Financial Conduct Authority.
©2014 Robert W. Baird & Co. Incorporated.