Embed Size (px)
Citation preview

Using Visual Reflection Tools to Build Capacity for
Partnership Improvement
Fa c i l i t a t o r s : Starla D. Officer, Mary F. Price, Indiana University Purdue University IndianapolisCenter for Service and LearningFriday, June 1, 2012
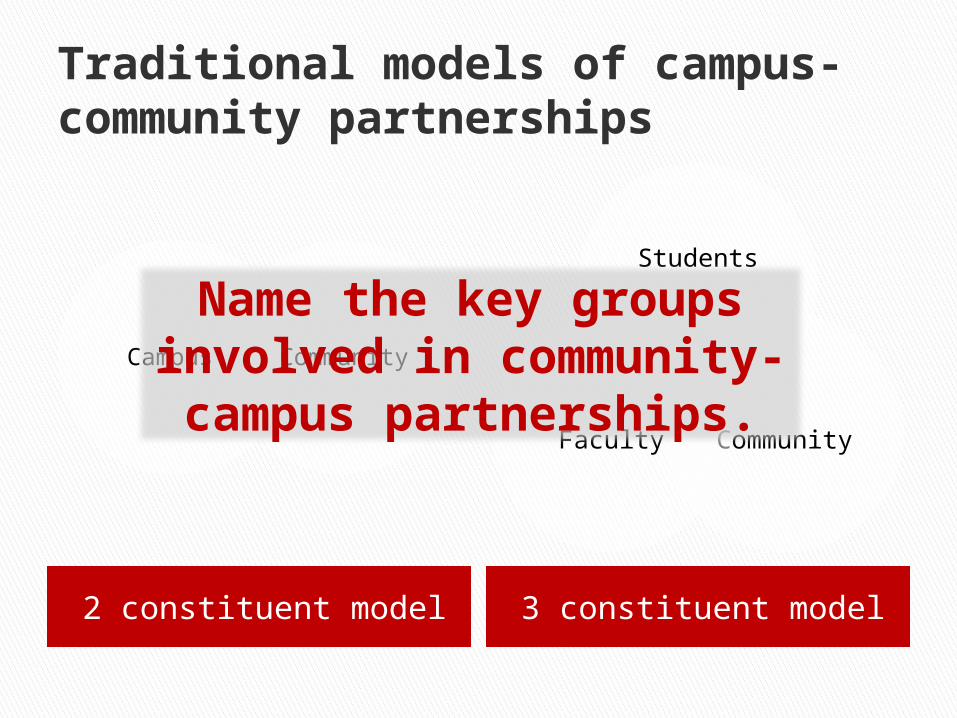
Traditional models of campus-community partnerships
2 constituent model 3 constituent model
Campus Community
Students
CommunityFaculty
Name the key groups involved in community-campus
partnerships.

Individuals/Groups/Organizations
Relationships
Infrastructure and embedded processes
THREE Ways of thinking about Partnerships
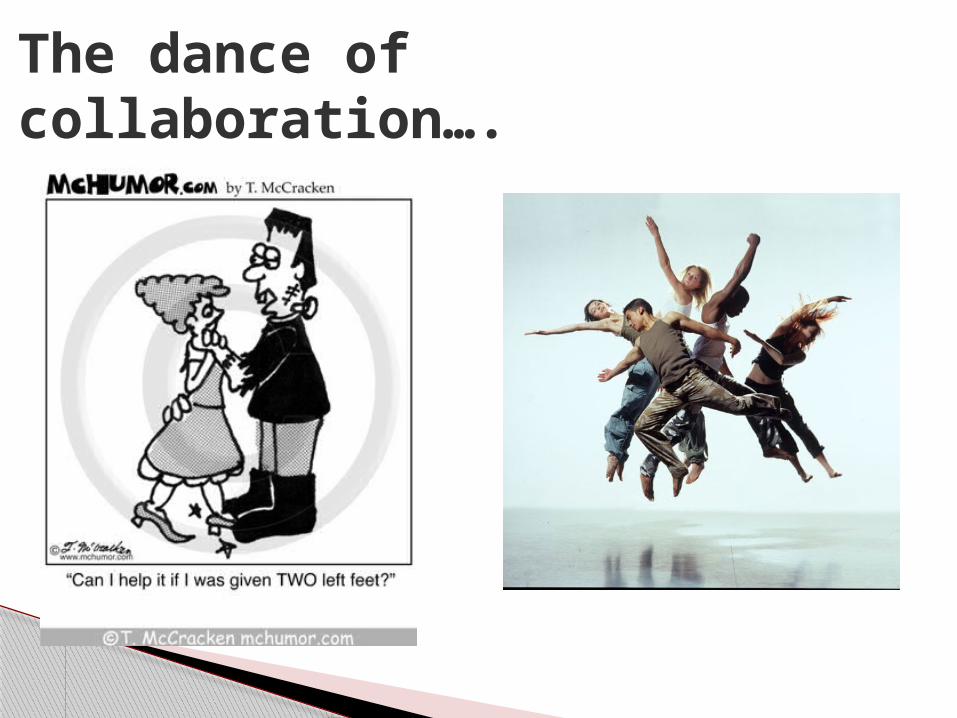
The dance of collaboration….

So the question is…How do we build capacity among colleges /universities and community partners to collaborate reciprocally and/or transformatively?

Grounded in scholarship related to informal relationships and community development
Development of shared belief that working together people can change their situations and challenge injustice
GOOD READ: The Well-Connected Community—Alison Gilchrist (2009)
Collective efficacy (Bandura 2001)
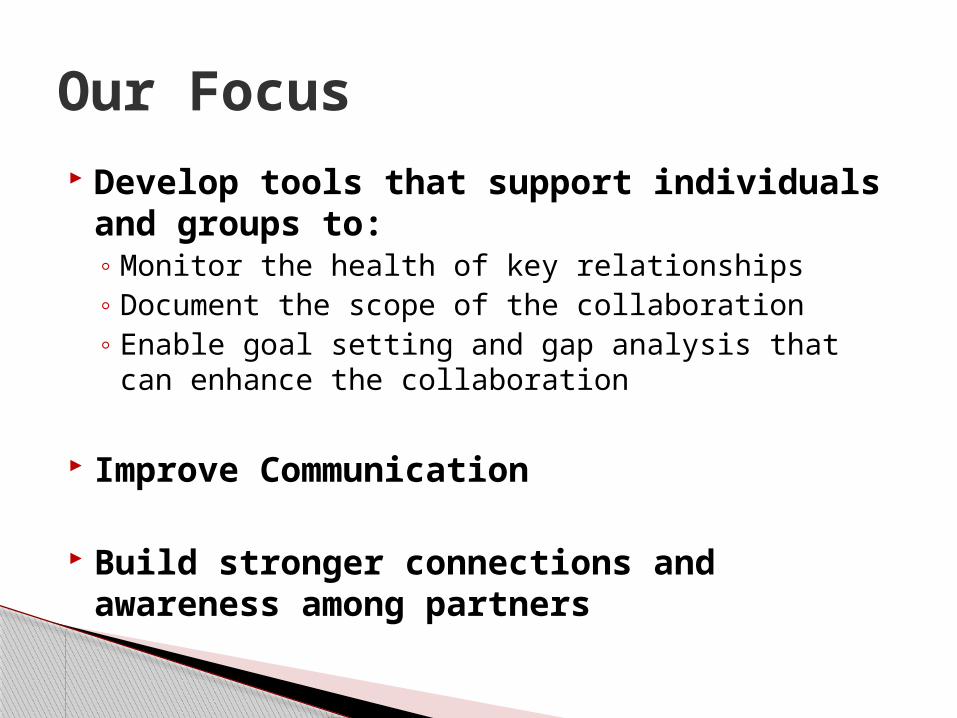
Develop tools that support individuals and groups to:◦ Monitor the health of key relationships◦ Document the scope of the collaboration◦ Enable goal setting and gap analysis that can
enhance the collaboration
Improve Communication
Build stronger connections and awareness among partners
Our Focus

Conceptual Foundations
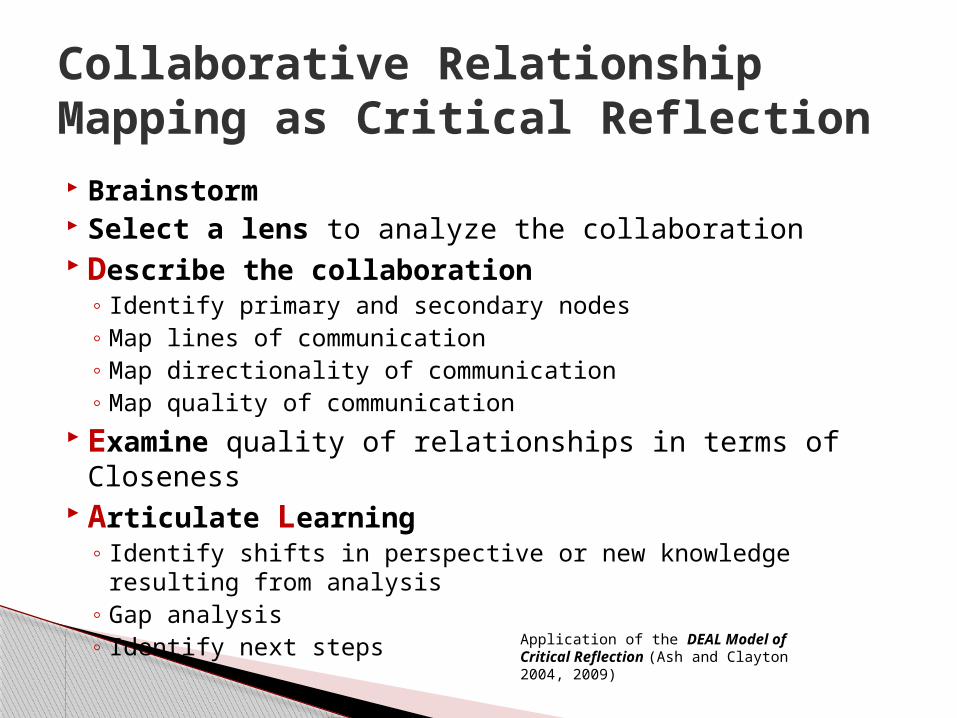
Brainstorm Select a lens to analyze the collaboration Describe the collaboration
◦ Identify primary and secondary nodes◦ Map lines of communication◦ Map directionality of communication◦ Map quality of communication
Examine quality of relationships in terms of Closeness
Articulate Learning◦ Identify shifts in perspective or new knowledge resulting from
analysis◦ Gap analysis◦ Identify next steps
Collaborative Relationship Mapping as Critical Reflection
Application of the DEAL Model of Critical Reflection (Ash and Clayton 2004, 2009)

SOFAR Relational Model of Partnerships
Bringle, Clayton and Price 2009. Partnerships in Service Learning and Civic Engagement. Partnerships: A Journal of Service Learning & Civic Engagement. 1(1): 1-20.
Students
Organizations
• Refers to staff based in community based organizations (government, non-profit, for-profit, foundations)
Faculty
Administrators
• Refers to campus based staff at any level of the organization
Residents
• Depending on the context , community residents may be referred to as clients, patients, etc.

Getting Started…
GRAB SOME SCRATCH PAPER.
REFLECTION ACTIVITY: Mapping Community-Campus
Collaborations

STEP 1: Select a Collaboration
NOTES Consider your relationships only within the
context of this collaboration.
Level of analysis can either be a single project or a range of work/programs at your institution.
Exercise in perspective taking.
If you have multiple roles, you will need to pick one.

STEP 2:Brainstorm Collaborators
List individuals, groups, organizations, etc. that are involved in this collaboration.
Make sure to:• List first/last names of individuals,• List full name of organizations,• You can assign acronyms for use on your map.

STEP 3:Organize CollaboratorsKey Questions:• Do I think of my relationship
primarily as one with an individual or one with unit/ organization/group levels?
• Do I know individuals and their roles by name or only the organization, roles/titles of individuals?
TIP: group related individuals together in cases where you have contacts with more than one individual in a dept. or organization.

Size Differences = how central person/group is within this collaboration
◦ Larger circles = more primary to the collaboration
◦ Smaller circles = less primary or active in the collaboration or a specific relationship within a organization/group
Visual Cues
Color Differences= indicative of qualitative differencesLine type Differences = types of connections
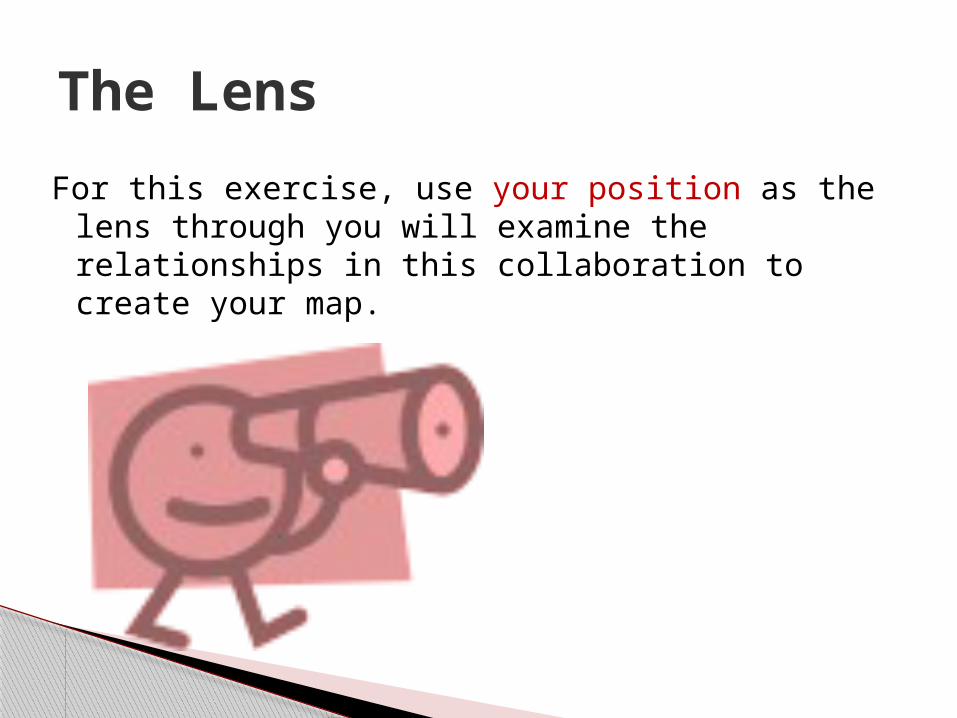
The Lens
For this exercise, use your position as the lens through you will examine the relationships in this collaboration to create your map.

Drafting your map

STEP 4: Who’s at the Center?
Using blue or black pen, draw a circle at the center of your paper that represents you and label it with your name.
YOURNAME
List the name of the collaboration at top of page
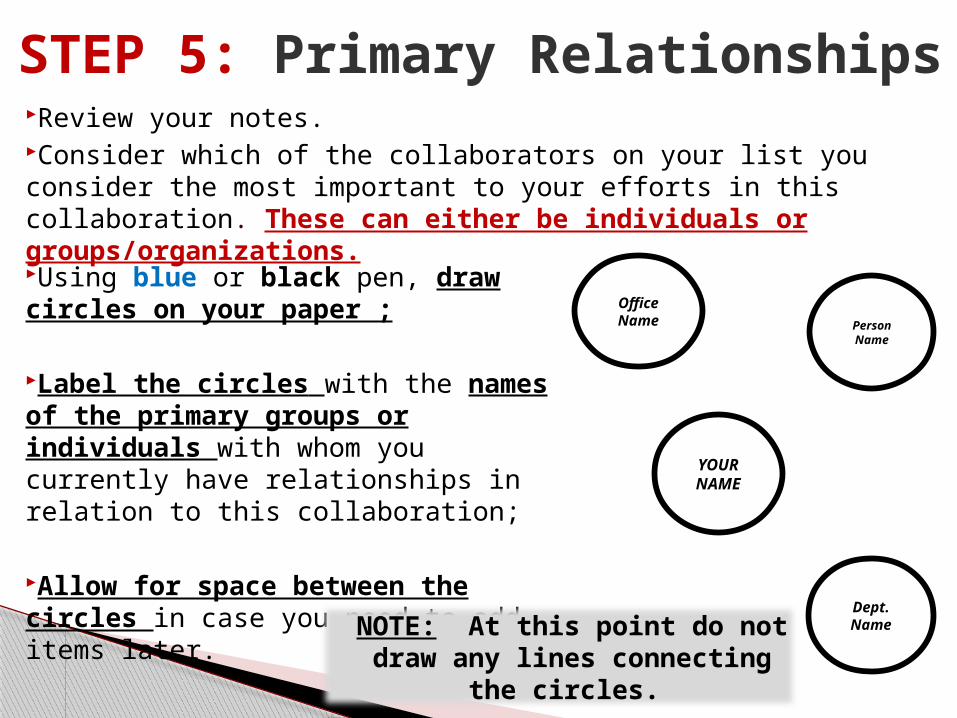
STEP 5: Primary RelationshipsReview your notes.Consider which of the collaborators on your list you consider the most important to your efforts in this collaboration. These can either be individuals or groups/organizations.
YOURNAME
PersonName
Office Name
Dept. Name
Using blue or black pen, draw circles on your paper ;
Label the circles with the names of the primary groups or individuals with whom you currently have relationships in relation to this collaboration;
Allow for space between the circles in case you need to add items later.NOTE: At this point do not
draw any lines connecting the circles.
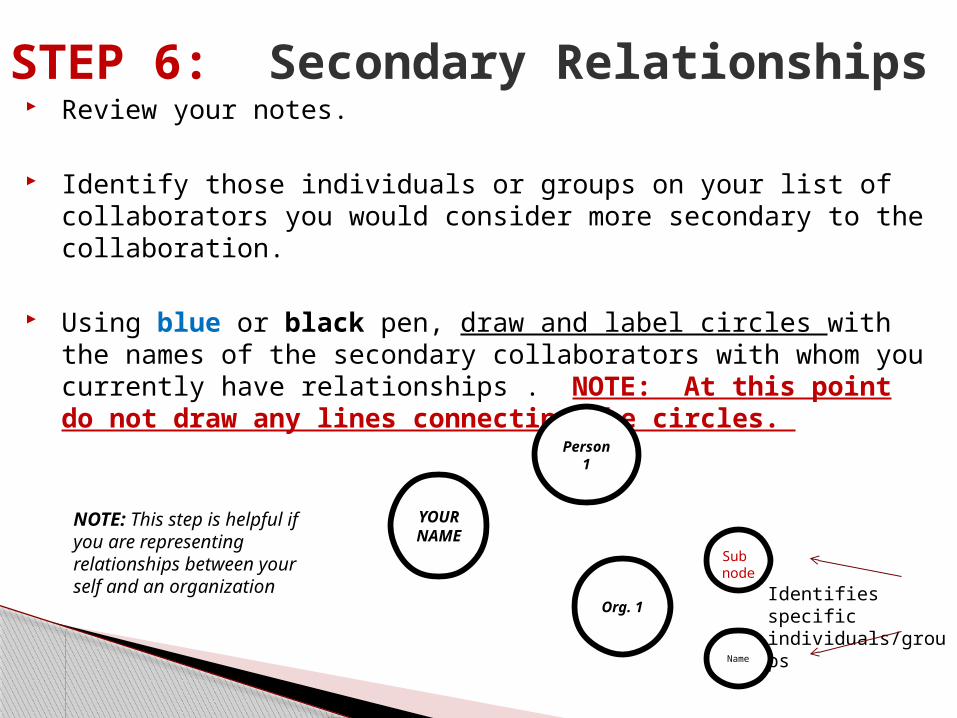
STEP 6: Secondary Relationships Review your notes.
Identify those individuals or groups on your list of collaborators you would consider more secondary to the collaboration.
Using blue or black pen, draw and label circles with the names of the secondary collaborators with whom you currently have relationships . NOTE: At this point do not draw any lines connecting the circles.
YOUR
NAME
Org. 1
NOTE: This step is helpful if you are representing relationships between your self and an organization
Identifies specific individuals/groups
Name
Sub node
Person 1
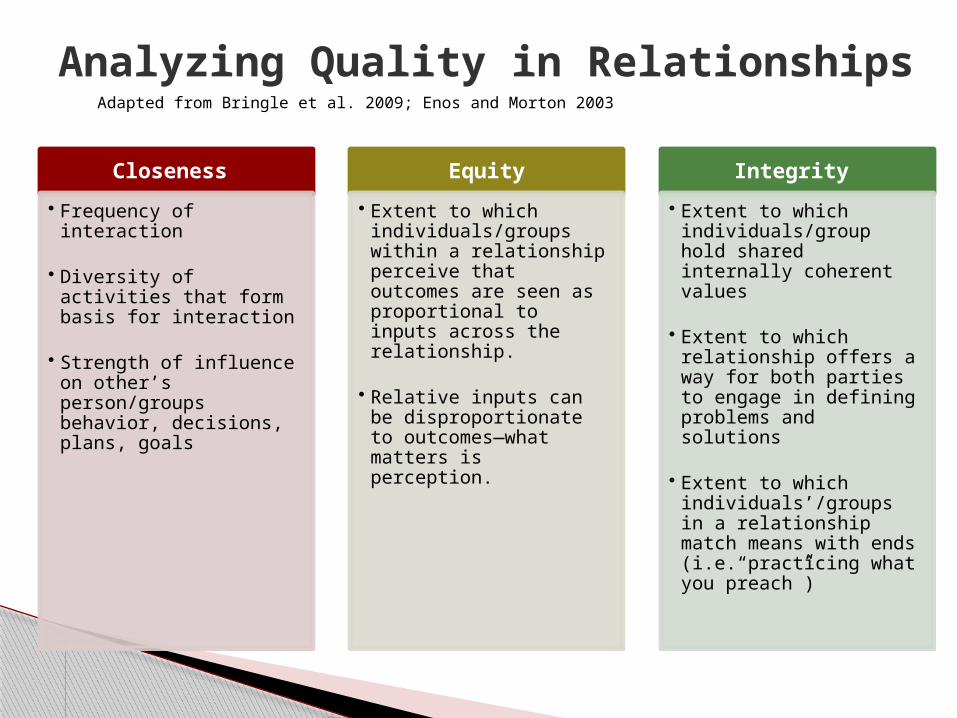
Analyzing Quality in RelationshipsAdapted from Bringle et al. 2009; Enos and Morton 2003
Closeness
• Frequency of interaction
• Diversity of activities that form basis for interaction
• Strength of influence on other’s person/groups behavior, decisions, plans, goals
Equity
• Extent to which individuals/groups within a relationship perceive that outcomes are seen as proportional to inputs across the relationship.
• Relative inputs can be disproportionate to outcomes—what matters is perception.
Integrity
• Extent to which individuals/group hold shared internally coherent values
• Extent to which relationship offers a way for both parties to engage in defining problems and solutions
• Extent to which individuals’/groups in a relationship match means with ends (i.e.“practicing what you preach”)

STEP 7: Communication Flow Using blue or black pen and the legend
below, draw directional arrows between the circles.
DIRECTIONALITY OF COMMUNICATION ◦ “Unidirectional” Flow of Communication = Indicate by
drawing one line with unidirectional arrow
◦ “Bidirectional” Flow of Communication= Indicate by drawing two lines with bidirectional arrows

STEP 8: Communication StrengthUsing the legend below, trace over the directional lines on your map based on your assessment of the strength of communication between yourself and the individuals/ groups identified in STEPS 5-6.STRENGTH OF COMMUNICATION
“Emergent” Communication = Leave line (s) as is.• Use in situations where there is
insufficient information to evaluate
“Weak” Communication = Trace “red” line over directional arrows • Episodic interaction often with delayed
or no response, • Little to no face-to-face contact; mostly
electronic modes of interaction• Collaboration on single activity; • Little no influence on activities or
planning; • Complete lack of awareness of the
other party
“Moderate” Communication=
Trace “yellow” line over directional arrows• Periodic interaction (may be more or
less concentrated/distributed) • Reciprocal effort to respond/initiate; • Mode of contact varies;• Limited range of activities; • Some perceived influence on activities
and planning; • Influence confined to a single or narrow
range of activities
“Strong” Communication = Trace “green” line over directional arrows• Consistent interaction;• Reciprocal effort to respond/initiate; • Engages multiple modes of contact;• Diverse range activities; • Definite influence on planning and
decision making;• Influence extends across a broad range
of activities.

Characterizing RelationshipsEmergentUndeveloped or Unbalanced Transactional Transformational
·Each party benefits·Goals converge at some points·Short-term·Project-based·Decision making in consultation with partner·Limited, planned commitments·Both deal with conflict but with discomfort·One party has somewhat more power but both benefit·Work within own system and increased awareness of others’ systems·Maintain separate identities
·Each benefits equally and the relationship grows as a result·Develop and work towards common goals·Long-term; indefinite·Issue-based·Decision making is shared and consensus-based·Dynamic, open commitments·Both deal with conflict openly with shared expectation resolution·Power is equally shared·Create new systems·Create shared identity(ies)
Adapted from Clayton et al. 2010 , Enos and Morton 2003
·Benefits negligible or one-sided·Goals at odds·Short-term or Long-term·Project-based·Decision making made in isolation·Commitment to own interest and not others·One or both parties avoid dealing with conflicts·Nearly all power in the hands of one·Work within own system·Maintain separate identities
EACH BENEFITS EACH GROWSOUTCOMES FOR EACH?

STEP 9: Evaluate the Quality of the Collaborative Relationships (CLOSENESS)
Using the legend below, trace colored lines over the circles drawn in STEPS 2-3 based on your rating of each relationship along the Relationship Continuum (refer handout—E,T,T).Factors related to closeness Frequency of interaction Diversity of activities that form basis for interaction Strength of influence on other’s person/groups behavior,
decisions, plans, goals QUALITY OF RELATIONSHIP◦ “Emergent” Relationship = Leave circle(s) “black/blue”◦ “Exploitative” Relationship = Outline circle(s) in“red”◦ “Transactional” Relationship= Outline circle(s) in “yellow”◦ “Transformational” Relationship = Outline circle(s) in
“green”
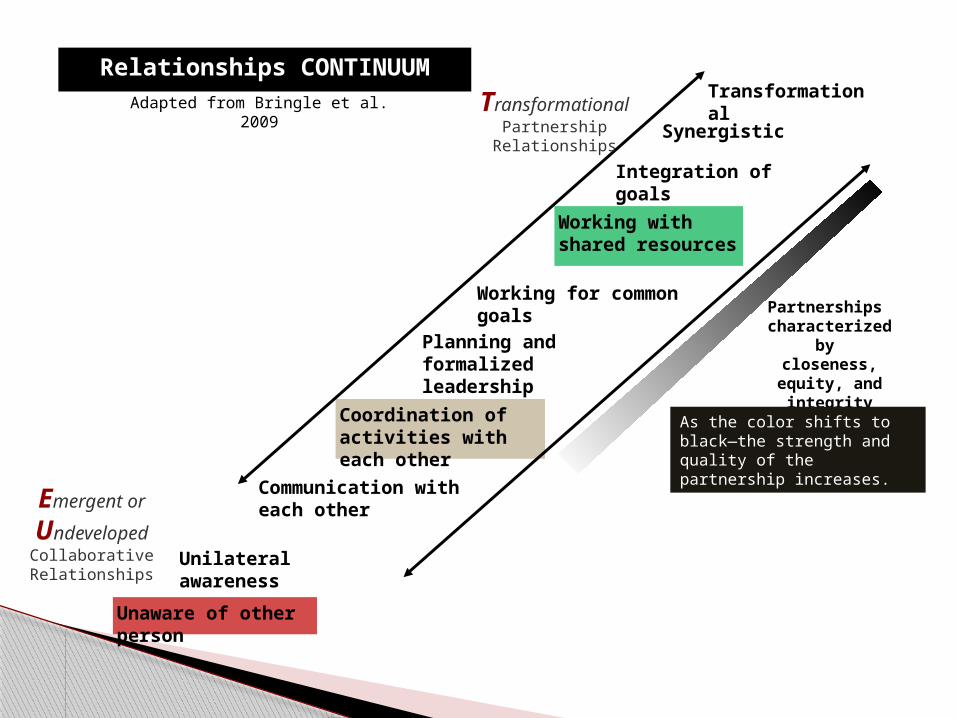
Unaware of other person
Relationships CONTINUUM
Working for common goals
Planning and formalized leadership
Coordination of activities with each other
Communication with each other
Unilateral awareness
Working with shared resources
Integration of goals
Synergistic
Transformational
Partnerships characterized by closeness, equity,
and integrity
As the color shifts to black—the strength and quality of the partnership increases.
Transformational
Partnership Relationships
Adapted from Bringle et al. 2009
Emergent or
UndevelopedCollaborative Relationships

STEP 7: GAP Analysis and Prospects
Review your map and your brainstorming list.
Are there any new individuals or groups that you would like or need to include on your map that aren’t currently represented?
If yes, add these persons/groups to
your map using dotted circles, to indicate these new prospects.
Hawthorne Community
CenterNew board
chair
Mary Price
Community Learning Network
New Primary
Mary Price New
Secondary

Discussion and Analysis

•Describe the general state of communication among the collaborators on your map?
•Describe the patterns you note in the direction of communication between you and others in the collaboration? Any surprises?
•Do you note any particular clusters or density nodes on your map?
•Are there any mismatches between how you evaluated a relationship versus how you assessed the quality of communication? (i.e. Did you have a green circle but a single yellow or red line?) What other factors might explain the divergence?
Analysis: Map Description

Analysis: Map Description (con’t)
•Were there any relationships that need careful attention in the near future or did you note any gaps on your map?
•What opportunities for growth/improvement and/or constraints/challenges did you identify?
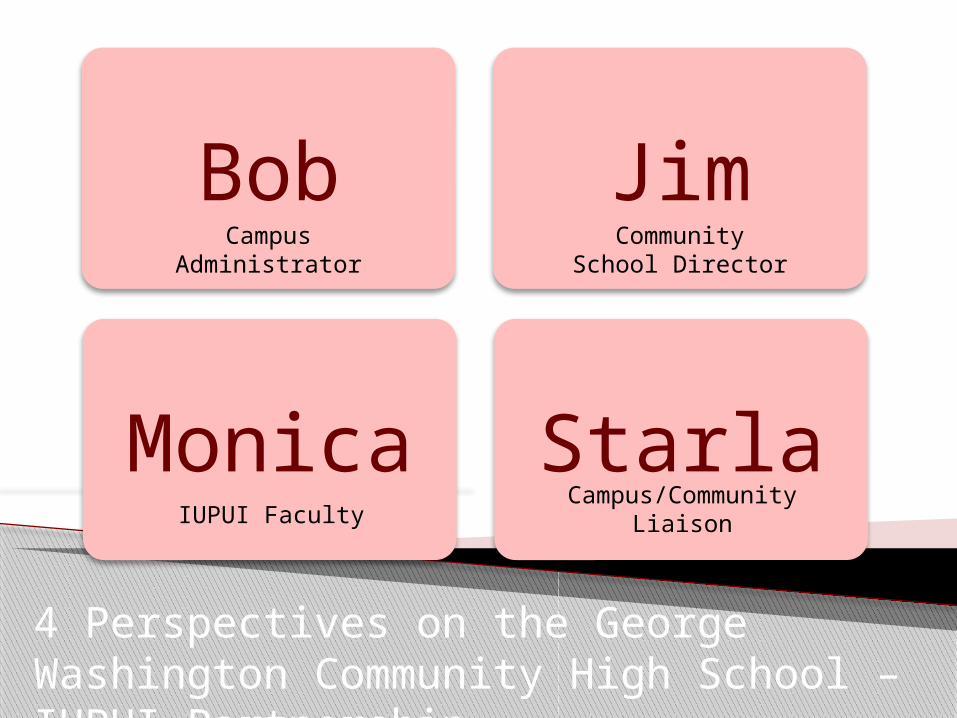
Bob Jim
Monica Starla
4 Perspectives on the George Washington Community High School – IUPUI Partnership
IUPUI Faculty
Campus Administrator
Community School Director
Campus/Community Liaison
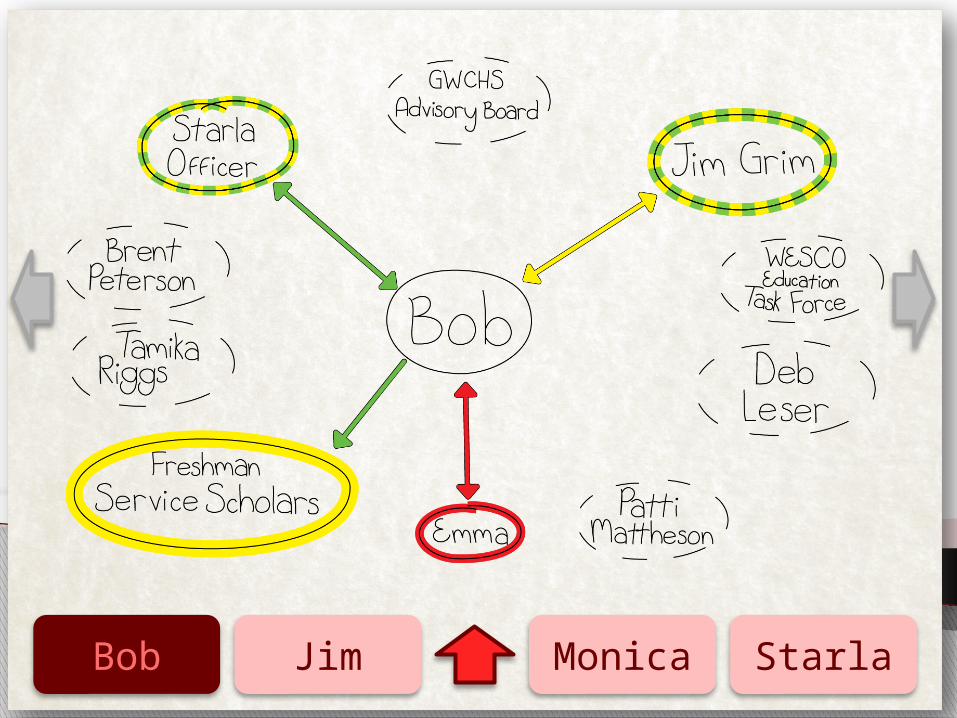
Bob Jim Monica Starla

Bob Jim Monica Starla

Bob Jim Monica Starla

Bob Jim Monica Starla

Comparing Maps and Next Steps
Based on your analysis, what “next steps” can you identify to improve the quality of communication in this collaboration? Individual Strategies Program-level Strategies School/Organizational level Strategies?
With whom will you focus your efforts?
Of these which can you enact in the next month, 6 months, year, etc.?

Possible applications

Process for Learning Focus is on capacity building Reflection-in-action (retrospective/prospective) Alternative to written reflection Development programs (any constituency) Planning
◦ Organizational development programs (deans, departments, CBOs, Community foundations)
◦ Neighborhood associations◦ Team based projects◦ Transition planning (one-on-one, organizational or
collaboration level) Action oriented
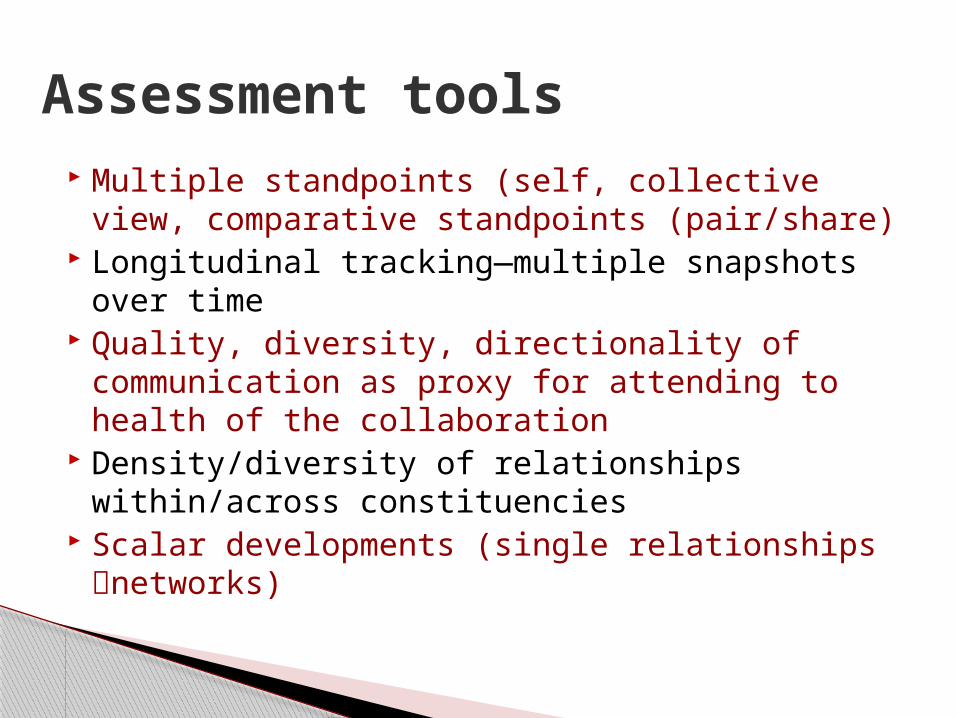
Assessment tools Multiple standpoints (self, collective view,
comparative standpoints (pair/share) Longitudinal tracking—multiple snapshots
over time Quality, diversity, directionality of
communication as proxy for attending to health of the collaboration
Density/diversity of relationships within/across constituencies
Scalar developments (single relationships networks)

Guide our learning

1. How might you envision using this tool in your own work? Under what circumstances might you use the SOFAR relationship mapping tools with the constituencies in collaboration you mapped today?
2. As a participant in the activity, what materials, tools, handouts would improve this learning experience for you?
3. Taking the standpoint of a facilitator of this activity, what materials would be helpful for you to have on hand?

Contact InformationIUPUI Center for Service and LearningStarla D. OfficerCoordinator, Office of Neighborhood [email protected]; 317-278-3475
Mary F. PriceCoordinator, Office of Service [email protected], 317-278-2539

Thank you.


![The Indianapolis Star - Indianapolis, IN - Publisher ... · The Indianapolis Star - Indianapolis, IN - Publisher, Broadcasting & Media Production | Facebook 1/10/2013 4:09:30 PM]](https://img.pdfslide.us/doc/110x75/5b84ed5a7f8b9a317e8cea29/the-indianapolis-star-indianapolis-in-publisher-the-indianapolis-star.jpg)


![The Indianapolis times. (Indianapolis [Ind.]) 1932-11-05](https://img.pdfslide.us/doc/110x75/6190c3bd602f303e2d37f096/the-indianapolis-times-indianapolis-ind-1932-11-05-.jpg)