Embed Size (px)
Citation preview

Florida International UniversityFIU Digital Commons
FIU Electronic Theses and Dissertations University Graduate School
9-26-2016
Facilitators for Software Development AgilityShekhar RathorFlorida International University, [email protected]
DOI: 10.25148/etd.FIDC001175Follow this and additional works at: https://digitalcommons.fiu.edu/etd
Part of the Management Information Systems Commons
This work is brought to you for free and open access by the University Graduate School at FIU Digital Commons. It has been accepted for inclusion inFIU Electronic Theses and Dissertations by an authorized administrator of FIU Digital Commons. For more information, please contact [email protected].
Recommended CitationRathor, Shekhar, "Facilitators for Software Development Agility" (2016). FIU Electronic Theses and Dissertations. 3059.https://digitalcommons.fiu.edu/etd/3059

FLORIDA INTERNATIONAL UNIVERSITY
Miami, Florida
FACILITATORS FOR SOFTWARE DEVELOPMENT AGILITY
A dissertation submitted in partial fulfillment of the
requirements for the degree of
DOCTOR OF PHILOSOPHY
in
BUSINESS ADMINISTRATION
by
Shekhar Rathor
2016

ii
To: Acting Dean Jose M. Aldrich College of Business
This dissertation, written by Shekhar Rathor, and entitled Facilitators for Software
Development Agility, having been approved in respect to style and intellectual
content, is referred to you for judgment.
We have read this dissertation and recommend that it be approved.
_________________________________ Weidong Xia
_________________________________
Monica Chiarini Tremblay
_________________________________ Mido Chang
_________________________________
Dinesh Batra, Major Professor Date of Defense: September 26, 2016 The dissertation of Shekhar Rathor is approved.
_________________________________ Acting Dean Jose M. Aldrich
College of Business
_________________________________ Andrés G. Gil
Vice President for Research and Economic Development and Dean of the University Graduate School
Florida International University, 2016

iii
© Copyright 2016 by Shekhar Rathor
All rights reserved.

iv
DEDICATION
I dedicate this dissertation to my parents, Vijay Rathor and Swarna Rathor.
Without their sacrifices, understanding, support, and love, the completion of this
dissertation would not have been possible.

v
ACKNOWLEDGMENTS
Many people have guided and helped me during my Ph.D. program. First and
foremost, I am thankful to Dr. Dinesh Batra for his mentorship during dissertation
and help in data collection. He has guided me throughout the writing of my
dissertation. I would like to express my deepest gratitude toward Dr. Weidong Xia
for his continuous guidance, encouragement, and support from the very first day
of the Ph.D. program until its completion. His passion and dedication for his
Ph.D. students kept me motivated to continuously work hard. This dissertation
would not have been possible without the guidance and inspiration from Dr.
Dinesh Batra and Dr. Weidong Xia.
I am grateful to Dr. Monica Chiarini Tremblay for her unconditional support and
help in data collection. She was always there to help me in getting this
dissertation done successfully. I would like to thank Dr. Mido Chang for her
support and feedback on data analysis. Her feedback helped me in improving my
dissertation.
My sincere thanks to all my Ph.D. classmates, Mingyu, Peng, Arturo, Alfred,
Inkyoung and John, for their support and cooperation. They were always there to
help me. My deepest gratitude to all the faculty members of the Department of
Information Systems and Business Analytics (ISBA) for teaching and guiding me
during the Ph.D. program. I have learned a lot from them during my journey. I
am thankful to the ISBA staff members. They were always so supportive.

vi
I am particularly indebted to the Department of Information Systems and
Business Analytics at the Florida International University for providing the
financial support for the Ph.D. program. Thank you.
vii
ABSTRACT OF THE DISSERTATION
FACILITATORS FOR SOFTWARE DEVELOPMENT AGILITY
by
Shekhar Rathor
Florida International University, 2016
Miami, Florida
Professor Dinesh Batra, Major Professor
Software development methodologies provide guidelines and practices for
developing information systems. They have evolved over time from traditional
plan-driven methodologies to incremental and iterative software development
methodologies. The Agile Manifesto was released in 2001, which provides values
and principles for agile software development. Over the last few years, agile
software development has become popular because its values and principles
focus on addressing the needs of contemporary software development. IT and
Business teams need agility to deal with changes that can emerge during
software development due to changing business needs. Agile software
development practices claim to provide the ability to deal with such changes.
Various research studies have identified many factors/variables that are
important for agile software development such as team autonomy,
communication, and organizational culture. Most of these empirical studies on
viii
agile software development focus on just a few variables. The relationships
among the variables is still not understood. The dimensions of agility and the
relationship between agility and other variables have not been studied
quantitatively in the literature. Also, there is no comprehensive framework to
explain agile software development. This research study addresses these
research gaps.
This study analyzed a comprehensive research model that included antecedent
variables (team autonomy, team competence), process variables (collaborative
decision making, iterative development, communication), delivery capability,
agility, and project outcomes (change satisfaction, customer satisfaction). It
presents key dimensions of agility and quantitatively analyzes the relationship
between agility and other variables. The PLS analysis of one hundred and sixty
survey responses show that process variables mediate the relationship between
antecedent variables and delivery capability and agility. The findings show that
the delivery capability of the teams contributes to agility, antecedents and
process variables contribute to agility, and delivery capability for better customer
satisfaction. These results will help IS practitioners to understand the variables
that are necessary to achieve agility for better project outcomes. Also, these
quantitative findings provide better conceptual clarity about the relationship
between various key variables related to agile software development.

ix
TABLE OF CONTENTS
CHAPTER
PAGE
I INTRODUCTION…………………………………………………... 1
Background………………………………………………………… 1
Problem Statement and Research Questions………………….. 4
II LITERATURE REVIEW…………………………………………… 8
Agile Software Development……………………………….......... 8
Traditional and Agile Methodologies…………………………….. 11
Key Variables in Agile Software Development…………………. 14
Delivery Capability………………………………………………… 15
Agility………………………………………………………….......... 17
Process Variables…………………………………………………. 21
Collaborative Decision Making…………………………….......... 21
Communication……………………………………………………. 25
Iterative Development……………………………………………. 28
Antecedent Variables……………………………………………… 30
Team Autonomy…………………………………………….......... 30
Team Competence………………………………………….......... 32
Project Outcomes………………………………………………….. 33
III RESEARCH MODEL AND HYPOTHESIS DEVELOPMENT 37
Research Model…………………………………………………… 37
Hypothesis Development…………………………………………. 38
Team Autonomy and Process variables……………………….. 38
Team Competence and Process Variables…………………… 39
Collaborative Decision Making, Delivery Capability and Agility 41
Communication, Delivery Capability and Agility………………. 42
Iterative Development, Delivery Capability and Agility………. 44
Delivery Capability, Agility and Project Outcomes……………. 46
IV RESEARCH METHODOLOGY………………………………….. 49
Conceptual Development and Measures Identification……….. 49

x
Conceptual Refinement and Measure Modification……………. 50
Data Collection…………………………………………………….. 54
Data Analysis and Measurement Validation…………………… 54
V DATA ANALYSIS AND REPORTING…………………….......... 56
Descriptive Statistics……………………………………………… 56
Reliability and Validity……………………………………………. 59
Formative Indicators……………………………………………… 61
Discriminant Validity………………………………………………. 66
Structural Model Assessment……………………………………. 68
Path Coefficients………………………………………………….. 69
Coefficient of Determination (R2)……………………………….. 72
Effect Size (F2)……………………………………………………. 73
Indirect Effects……………………………………………………. 75
VI DISCUSSION…………………………………………………….. 81
Discussion and Implications…………………………………….. 81
Limitations and Future Research………………………………. 92
Contributions……………………………………………………… 93
REFERENCES…………………………………………….......... 96
APPENDIX……………………………………………………….. 111
VITA……………………………………………………………….. 128
xi
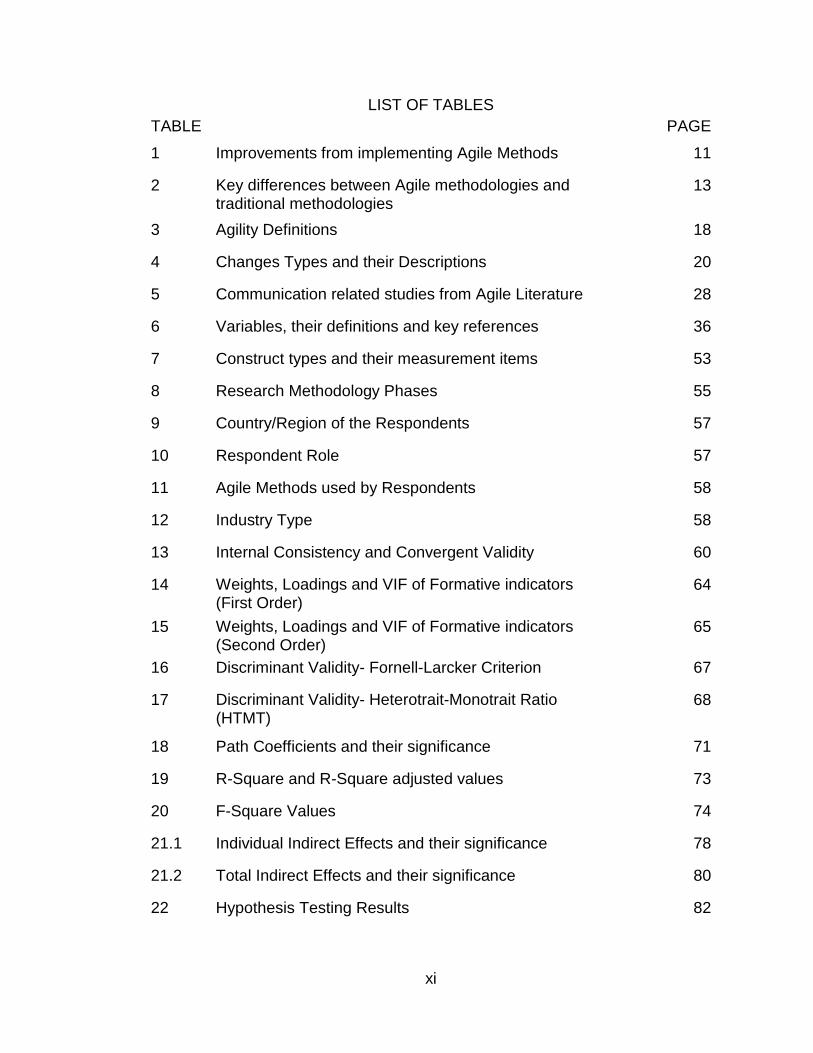
LIST OF TABLES
TABLE PAGE
1 Improvements from implementing Agile Methods 11
2 Key differences between Agile methodologies and traditional methodologies
13
3 Agility Definitions 18
4 Changes Types and their Descriptions 20
5 Communication related studies from Agile Literature 28
6 Variables, their definitions and key references 36
7 Construct types and their measurement items
53
8 Research Methodology Phases 55
9 Country/Region of the Respondents 57
10 Respondent Role 57
11 Agile Methods used by Respondents 58
12 Industry Type 58
13 Internal Consistency and Convergent Validity 60
14 Weights, Loadings and VIF of Formative indicators (First Order)
64
15 Weights, Loadings and VIF of Formative indicators (Second Order)
65
16 Discriminant Validity- Fornell-Larcker Criterion 67
17 Discriminant Validity- Heterotrait-Monotrait Ratio (HTMT)
68
18 Path Coefficients and their significance 71
19 R-Square and R-Square adjusted values 73
20 F-Square Values 74
21.1 Individual Indirect Effects and their significance 78
21.2 Total Indirect Effects and their significance 80
22 Hypothesis Testing Results 82

1
CHAPTER I
INTRODUCTION
Background
In the contemporary business environment, information systems have become
indispensable to each organization. Information systems are not used just as
work automation tools, but also as tools for competitive advantage. Organizations
use information systems to provide new products and services, to manage
customer relationship, and to manage business processes effectively and
efficiently. Information systems are critical for organizations because they can
help them achieve a competitive edge over their competitors. Organizations need
information systems that can adapt to their changing business needs. The
process of defining, planning, developing, managing, and implementing these
information systems is a complex process (Schmidt, Lyytinen, & Mark Keil, 2001;
Xia & Lee, 2003).
Software development methodologies provide procedural guidelines and
framework to define, plan, and develop information systems. Software
development methodologies are constantly evolving due to changes in user
needs and technologies (Nerur, Mahapatra, & Mangalaraj, 2005). These software
development methodologies have evolved over time from traditional plan-driven
methodologies to incremental and iterative software development methodologies.
Software development is inherently complex due to the various kinds of
complexities (technical and organizational complexities) involved (Xia & Lee,

2
2003). Due to the complexities of IT projects, it is difficult to anticipate and plan
everything before starting a project. Thus, many IT projects fail due to the
uncertainties involved. According to a research study conducted by McKinsey &
Company in collaboration with the University of Oxford, about half of all large IT
projects with initial price tags exceeding $15 million fail to meet their budgets,
and on the average, these large IT projects run 45 percent over budget and
seven percent over time, while delivering 56 percent less value than predicted
(McKinsey&Company, 2012).
In the contemporary business world, organizations work in a very dynamic
business environment, and they need to adapt their structures, strategies, and
policies continuously to suit the new environment. Thus, organizations need
information systems which can adapt to their changing environment (Nerur et al.,
2005). While developing information systems for such dynamic business
environments, it is difficult to anticipate all the requirements at the beginning of
the software development. Over the years, the nature of software development
has changed from implementing pre-defined business requirements to accepting
emerging requirement changes from changing business needs. The business
needs are continuously changing because of the frequent changes in user
needs. The plan-driven methodologies lack the flexibility to adapt to the
development process to embrace the changing requirements during the project.
The need for adapting to changing business needs has resulted in shifting from
plan-driven traditional software development methodologies to incremental and

3
iterative development methodologies such as agile software development
methodologies. The agile software development projects are often three times
more successful than projects based on traditional methodologies (Bakalova,
2014; StandishGroup, 2015). In the last few years, the use of agile methods such
as Scrum has increased in software development projects (Hossain, Babar, &
Paik, 2009). In the surveys conducted by Versionone, 84% of the respondents in
2006, 90% of the respondents in 2010 and 94% of the respondents in 2015 said
that their organizations were using some agile practices (VersionOne, 2015).
In 2001, the Agile Manifesto was announced by a group of leading information
systems (IS) practitioners. Since then, it has become popular because its values
and principles focus on addressing the needs of contemporary software
development. Many methods that are termed agile like Scrum, Dynamic Systems
Development Method (DSDM), Crystal Clear and Extreme Programming were
known before 2001. These methods recommend various types of practices and
guidelines for software development, some of which are contradictory (Tripp,
2012), but largely they have the same essence. In essence, all agile methods
mainly focus on individuals and their interactions, iterative and incremental
development, customer collaboration, and responding to changes. The agile
practices recommended by various agile methods claim to make activities in the
project more effective and efficient to embrace changes during the project. These
practices not only claim to provide the capability to deliver solutions to the given

4
planned requirements but also the agility to deal with changes during the project.
The ability of the team to deliver given requirements is the basic necessity for
any software development project. In additional to basic ability (e.g. delivery
capability), teams need agility to deal with various kinds of changes in agile
software development projects. Agile software development purports to facilitate
both delivery capability to implement given requirements and agility to manage
project changes. It is characterized as incremental, cooperative, straightforward,
and adaptive (Abrahamsson, Warsta, Siponen, & Ronkainen, 2003).
Problem Statement and Research Questions
In the last few years, agile methodologies have become popular among IS
practitioners and IS researchers (Baskerville, Pries-Heje, & Madsen, 2011).
Many studies have been done to understand the theoretical and practical aspects
related to agile software development. These studies have identified many
important factors related to agile software development such as communication
(Fontana, Fontana, da Rosa Garbuio, Reinehr, & Malucelli, 2014; Korkala &
Abrahamsson, 2007), customer collaboration (Chow & Cao, 2008; Hoda, Noble,
& Marshall, 2011), delivery strategy (Chow & Cao, 2008), management support
(Chow & Cao, 2008; Senapathi & Srinivasan, 2012), iterative approach (Abbas,
Gravell, & Wills, 2010; Batra, Xia, & Rathor, 2016), and team autonomy (Batra et
al., 2016; Lee & Xia, 2010).
All these factors are important for agile software development and the interaction
between these factors can affect project outcomes. Individually, a given

5
empirical study has focused on only a few factors/variables. Thus, the
interactions among the variables are not well understood. Consequently, there is
no comprehensive framework to enable a better theoretical understanding of
agile software development and present generalizable findings (Abrahamsson,
Conboy, & Wang, 2009; Goh, Pan, & Zuo, 2013). To address this concern,
Convoy (2009) developed a definition and taxonomy for agility to provide better
conceptual clarity about agility, which is treated as a multidimensional concept
but few studies have focused on developing measures for agility (Lee & Xia,
2010; Sheffield & Lemétayer, 2013). The understanding of agility is lacking in
clarity, particularly about its underlying dimensions (Balijepally, DeHondt,
Sugumaran, & Nerur, 2014). There is no common understanding of what
constitutes agility (Wendler, 2013). There is a lack of empirical studies focusing
on software development agility (Sheffield & Lemétayer, 2013). It is important to
investigate what constitutes agility and identify rigorous ways by which agility can
be measured and assessed (Conboy, 2009). There is a need for further research
to create indicators of software development agility (Sheffield & Lemétayer,
2013). Because of the lack of such studies, it is challenging for IT managers to
identify important factors that facilitate agility and understand their impact on
project outcomes.
In this study, the factors related to the various project activities that are needed in
achieving agility and delivery capability are termed as process variables. The
factors that are responsible for creating a conducive environment for agility and

6
delivery capability are termed as antecedent factors. Antecedent variables are
necessary but not sufficient to explain the agility of a project. Without process
variables, antecedent variables cannot contribute to agility and project success.
For example, team autonomy is necessary to provide a conducive environment
for agile development so it may have an indirect effect on agility. In contrast,
communication is necessary for various activities during the development
process so it may have a direct effect on agility and delivery capability. Based on
the agile literature, four key research gaps are identified. First, agility dimensions
are not well understood due to the lack of empirical measures. Empirical
measures are required to study agility quantitatively and are need to further
develop a clearer understanding of agility and its relationship with other
variables. Second, there is a lack of studies that quantitatively investigate the
relationships between the antecedent and process factors, and agility. Third,
there is no study that distinguishes between delivery capability and agility, and
studies relationship between these two abilities. Lastly, how delivery capability
and agility affect project outcomes have not been studied.
This research attempts to fill these research gaps. The specific research
questions for this research are (a) What are the dimensions and empirical
measures for agility? (b) What process factors affect agility and what are the
antecedents to these process factors? (c) What is the relationship between agility
and delivery capability and, (d) What kinds of relationships exist between agility,
delivery capability and project outcomes? The empirical investigation of these
7
research questions is important to bring new insights for IS researchers and IS
practitioners. This study contributes to IS literature by developing new empirical
measures for the key variables related to software development agility. It
identifies key dimensions of agility and their empirical measures. It quantitatively
explains the relationship between antecedent variables, process variables,
delivery capability, agility and customer satisfaction in agile software
development. The understanding of these relationships is important in identifying
mediating variables for a better conceptual clarity about agile software
development. The interactions between these variables have not been studied in
agile literature. The findings of this study imply that IS practitioners need to focus
on these antecedents and process factor for achieving delivery capability and
agility which in turn leads to better customer satisfaction.
8
CHAPTER II
LITERATURE REVIEW
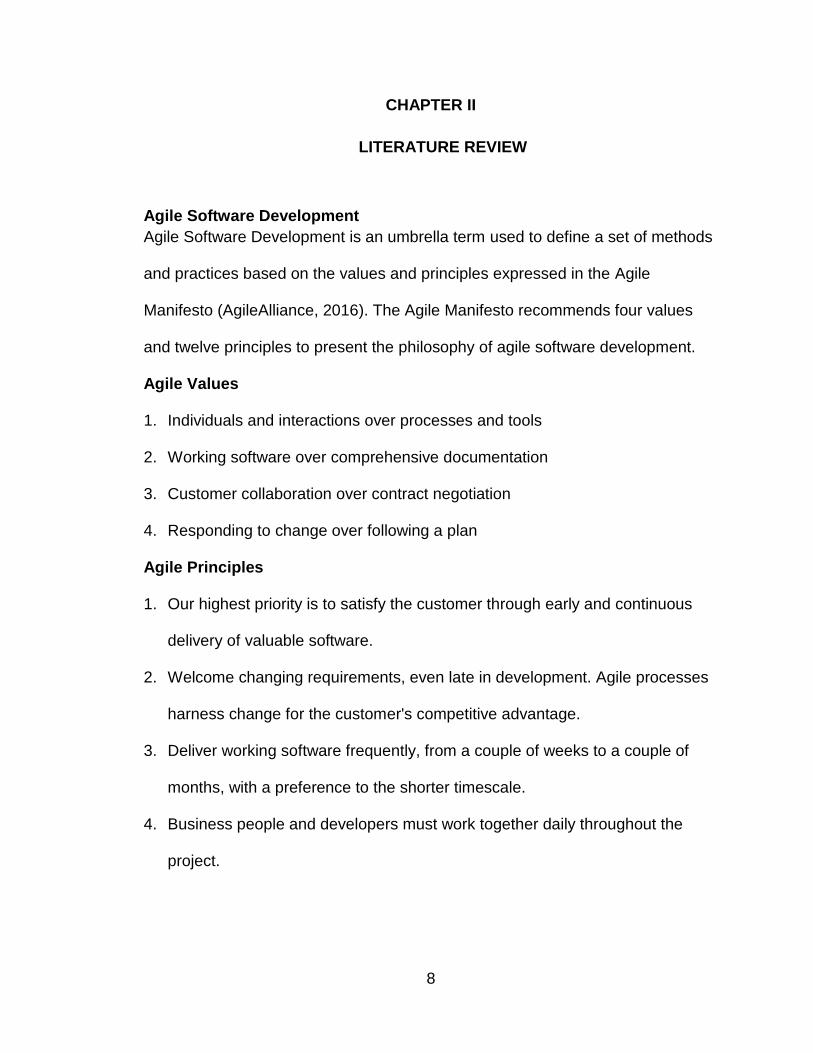
Agile Software Development
Agile Software Development is an umbrella term used to define a set of methods
and practices based on the values and principles expressed in the Agile
Manifesto (AgileAlliance, 2016). The Agile Manifesto recommends four values
and twelve principles to present the philosophy of agile software development.
Agile Values
1. Individuals and interactions over processes and tools
2. Working software over comprehensive documentation
3. Customer collaboration over contract negotiation
4. Responding to change over following a plan
Agile Principles
1. Our highest priority is to satisfy the customer through early and continuous
delivery of valuable software.
2. Welcome changing requirements, even late in development. Agile processes
harness change for the customer's competitive advantage.
3. Deliver working software frequently, from a couple of weeks to a couple of
months, with a preference to the shorter timescale.
4. Business people and developers must work together daily throughout the
project.

9
5. Build projects around motivated individuals. Give them the environment and
support they need, and trust them to get the job done.
6. The most efficient and effective method of conveying information to, and
within, a development team is face-to-face conversation.
7. Working software is the primary measure of progress.
8. Agile processes promote sustainable development. The sponsors,
developers, and users should be able to maintain a constant pace indefinitely.
9. Continuous attention to technical excellence and good design enhances
agility.
10. Simplicity – the art of maximizing the amount of work not done – is essential.
11. The best architectures, requirements, and designs emerge from self-
organizing teams.
12. At regular intervals, the team reflects on how to become more effective, then
tunes and adjusts its behavior accordingly.
Various methods have been used to implement the agile values and principles.
The most popular agile methods include Scrum, Extreme Programming (XP),
Crystal, Kanban, Dynamic Systems Development Method (DSDM), Lean
Development, and Feature-Driven Development (FDD). According to the ninth
state of agile report by Versionone, nearly 70% of respondents said that they use
some Scrum practices (VersionOne, 2015).
Agile software development is a term used for many iterative and incremental
software development methodologies. It provides a lightweight framework for IT
teams to develop systems based on continually evolving technical and business

10
requirements to maximize the business value and to minimize the risks
associated with the project. Ambler (2009) defined agile software development
as, “an evolutionary (iterative and incremental) approach which regularly
produces high quality software in a cost effective and timely manner via a value
driven lifecycle. It is performed in a highly collaborative, disciplined, and self-
organizing manner with active stakeholder participation to ensure that the team
understands and addresses the changing needs of its stakeholders. Agile
software development teams provide repeatable results by adopting just the right
amount of ceremony for the situation they face” (p. 6). Agile development
practices focus on delivering business value through a process of continuous
planning and customer feedback cycles to ensure that business values increase
during the development process. The use of agile practices has become very
popular because of the benefits perceived by many organizations. Table 1 shows
the perceived benefits of the agile methods based on a survey conducted by
VersionOne (VersionOne, 2015).

11
Improvements from implementing agile % of respondent (out of 3925)
Ability to manage changing priorities 87%
Increased team productivity 84%
Improved project visibility 82%
Increased team morale/motivation 79%
Better delivery predictability 79%
Enhanced software quality 78%
Faster time to market 77%
Reduced project risk 76%
Improved business/IT alignment 75%
Improved engineering discipline 72%
Enhanced software maintainability 68%
Better manage distributed teams 59%
Table 1: Improvements from implementing Agile Methods (9th State of agile survey, Versionone)
Traditional and Agile Methodologies
The failure of traditional plan-driven methodologies to take into consideration of
emerging user requirement changes has prompted the adoption of agile
methodologies in software projects. Agile methodologies and traditional
methodologies differ in many aspects. Table 2 presents some key differences
between agile methodologies and traditional methodologies. IT organizations see
the use of agile methodologies as promising alternative methods to develop

12
quality software systems, which can create business value for their customers.
Agile software development is the defining factor for future businesses because
there is a need for innovation to survive the intense competition (Kar, 2006). It is
not just a set of principles and values; it provides the capability to respond to
change, to innovate, and to balance structure and flexibility (Highsmith, 2002). It
helps development teams to deal with an unpredictable environment (Beck,
2000; Maruping, Venkatesh, & Agarwal, 2009). It is characterized as iterative and
incremental (Abrahamsson, 2002; Lindvall et al., 2002), flexible to frequent
requirement changes (Boehm, 2002; Highsmith & Cockburn, 2001), cooperative
(Abrahamsson, 2002), collaborative (Highsmith, 2002), and adaptive
(Abrahamsson, 2002). It is most suitable for complex and high-requirement
change projects and operates best in a people-centered, collaborative
organizational culture (Cockburn & Highsmith, 2001). In agile projects, business
requirements can emerge because business and IT teams work closely to
understand changing business needs and generate new ideas for creating
business value. The plan-driven methodologies are efficient in projects where not
much requirement changes are expected. The primary goal of plan-driven
methods is predictability, stability and high assurance whereas the primary goal
of the agile methods is rapid value and responsiveness to change (Boehm &
Turner, 2003a).
Agile methodologies are not suitable for every kind of software project and
organizations. There is not enough evidence to show that agile methodologies
work in large projects. Agile principles and practices are likely to fail if imposed

13
on process-centric, non-collaborative, and optimizing organizations (Cockburn &
Highsmith, 2001).
Traditional Methodologies Agile Methodologies
Fundamental Assumptions
Systems are fully specifiable, predictable, and can be built through meticulous and extensive planning.
High quality, adaptive software can be developed by small teams using the principles of continuous design improvement and testing based on rapid feedback and change
Requirements Knowable early; largely stable Largely emergent; rapid change
Control Process-centric People-centric
Customers Access to knowledgeable, collaborative, representative and empowered customers
Dedicated, knowledgeable, collocated, collaborative, representative and empowered customers
Management Style Command-and-control Leadership-and-collaboration
Knowledge Management
Explicit Implicit
Communication Formal Informal
Customer’s Role Important Critical
Project Cycle Guided by tasks or activities Guided by product features
Development Model
Life cycle model (Waterfall, Spiral or some variation)
The evolutionary-delivery model
Desired Organizational Form/Structure
Mechanistic (bureaucratic with high formalization)
Organic (flexible and participative encouraging cooperative social action)
Technology No restriction Favors object-oriented technology
Communicating with customer
Less frequent More frequent
Feedback from customer
After few months After few weeks
Documentation Heavy Minimal
Primary Objective High assurance Rapid business value
Architecture Designed for current and foreseeable requirements
Designed for current requirements but adaptable
Table 2: Key differences between Agile methodologies and traditional methodologies*
*adapted from (Nerur et al., 2005), (Dyba & Dingsoyr, 2008), and (Boehm, 2002)

14
IT organizations that are considering the use of the agile approach need to
understand the key issues and challenges in adopting agile practices
(Mangalaraj, Mahapatra, & Nerur, 2009). Agile methodologies have become a
topic of interest for academic research after the release of the Agile Manifesto in
2001. Abrahamsson (2002) mentioned that there is anecdotal evidence to show
that agile methods are effective and suitable for specific situations and
environments creating a need for more empirical studies. The meaning and
practice of agile methodologies have evolved in the last decade and will continue
to evolve (Baskerville et al., 2011). Agile methodologies can be seen as a
philosophy rather than just a set of principles and values. To present the true
meaning of the agile development Highsmith stated that “Agile development
defines a strategic capability, a capability to create and respond to change, a
capability to balance flexibility and structure, a capability to draw creativity and
innovation out of a development team, and a capability to lead organizations
through turbulence and uncertainty” (Highsmith, 2002) (p. 8).
Key Variables in Agile Software Development
Over the years, studies have explored various aspects related to agile
methodologies and have identified key factors for success in agile projects. Many
empirical studies have been conducted on agile methodology (Chow & Cao,
2008; Maruping et al., 2009; Senapathi & Srinivasan, 2012). Nerur et al. (2005)
identified key management, organizational, people, process, and technological
issues related to adoption of agile methodologies. A literature study presented 12

15
possible critical success factors for agile projects and consolidated them into five
different categories: organizational, people, process, technical, and project
(Chow & Cao, 2008). Using a survey method, Sheffield et al. (2013) identified
critical agility factors that addressed process design issues in agile projects and
environmental factors. These studies have reported many important factors such
as team autonomy, team competence, communication, customer collaboration
and iterative development. What is missing in the literature is how these factors
interact and affect project outcomes. The factors that relate to practices followed
in agile projects and are directly responsible for agility are termed as process
factors (communication, collaborative decision-making, and iterative
development). The factors that are important for creating a suitable environment
for achieving agility are termed as antecedent factors (team autonomy and team
competence). In the next section of this chapter, these key antecedent and
process variables, delivery capability, agility and project outcomes variables are
presented.
Delivery Capability
Agile practices capitalize on each individual and each team’s unique capability
(Cockburn & Highsmith, 2001). Team capability is one of the critical success
factors for agile software development projects (Chow & Cao, 2008) and affects
software project quality (Vinod, Dhanalakshmi, & Sahadev, 2009). IT and
business team members should have the capability to deliver the task given to
them. In this study, two capabilities are considered. First is the delivery capability,

16
which refers to the ability of the project team to effectively and efficiently apply
their skills (technical, business, interpersonal, problem-solving and management
skills) for successfully implementing the given requirements in software
development project. It refers to the project team’s routine or essential ability to
deliver a solution to a given set of requirements in the project. Second is agility,
which is the ability to deal with various changes that can occur during the project,
in addition to the given requirements. Delivery capability is the ability of the team
to deliver the planned tasks. In the software development literature, competency
and capability terms are used to refer to the skills of the team members. In this
research, there is a differentiation between competency and capability.
Competency refers to the individual skills of the project team members.
Capability is the ability to effectively use the competencies for various tasks in
the project. A competent team may not be a capable team if they are not able to
use their skills properly to complete successfully the given tasks. To understand
the capability of the software development team requires insight into the team's
collective skills (Misra, Kumar, & Kumar, 2009). Usually, in software development
projects, technical and business skills are considered as key skills, but task skills
(know how) is also important for project success along with business and
technical skills (Chan & Thong, 2009). Specialized skills of the project team
members alone are insufficient to produce high-quality work output, and these
skills need to be managed and coordinated properly to leverage its potential
(Faraj & Sproull, 2000). Task skills are practical skills that are required to
understand how to work effectively in a project team and how to do the project

17
tasks effectively and efficiently (Chan, Jiang, & Klein, 2008). The appropriate use
of team member’s skills is required to create team capability to achieve success
in a software development project. A project needs process factors that can
bridge the gap between competencies and capability.
Agility
The practices and values recommend by agile methodologies help in providing
agility in contemporary software development; and agile methods provide a
platform to achieve agility (Sarker & Sarker, 2009). Agility is not a prior
characteristic of agile software development, but an emergent property due to
use of agile methods (Iivari & Iivari, 2011; Vidgen & Wang, 2009). In the
literature, agility has been defined as a multidimensional concept (Conboy, 2009;
Sheffield & Lemétayer, 2013). According to a study by Vial et al. flexibility,
cooperation, learning and leanness are key facets of agility (Vial & Rivard, 2015).
Conboy (2009) derived a comprehensive definition of agility. Agility is “the
continual readiness of an ISD method to rapidly or inherently create change, pro-
actively or reactively embrace change, and learn from change while contributing
to perceived customer value (economy, quality, and simplicity), through its
collective components and relationships with its environment” (Conboy, 2009) (p.
340).
Agility has been conceptualized in many different ways (Cockburn, 2006;
Conboy, 2009; Highsmith, 2004b; Lee & Xia, 2010; Lyytinen & Rose, 2006;
Sarker & Sarker, 2009; Sheffield & Lemétayer, 2013). Table 3 shows the agility

18
Agility Definitions References
Agility is the ability to balance flexibility and stability. It is the ability to both create and respond to change in order to profit in a turbulent business environment.
(Highsmith, 2004b), (Highsmith, 2009)
Agility is defined as the continual readiness of an entity to rapidly or inherently, proactively or reactively embrace change through high-quality, simplistic, economical components and relationships within its environment
(Conboy & Fitzgerald, 2004)
Agility applies memory and history to adjust to new environments, react and adapt, take advantage of unexpected opportunities and update the experience base for the future
(Boehm & Turner, 2003b)
Agility is rapid and flexible response to change (Larman, 2004)
Agility is often associated with such related concepts as nimbleness, suppleness, quickness, dexterity, liveliness or alertness. At its core, agility means to take out as much of the heaviness, commonly associated with traditional software-development methodologies, to promote quick response to changing environments, changes in user requirements and accelerated project deadlines.
(Erickson, Lyytinen, & Siau, 2005), (Dyba & Dingsoyr, 2008)
Agility refers to readiness for action or change. It has two dimensions: (1) the ability to adapt to various changes and (2) the ability to fine-tune and reengineer software development processes when needed.
(Henderson-Sellers & Serour, 2005)
Agility is defined as the ability to sense and respond swiftly to technical changes and new business opportunities; it is enacted by exploration-based learning and exploitation-based learning.
(Lyytinen & Rose, 2006)
Agility is being light, barely sufficient, and maneuverable (Cockburn, 2006)
Agility is a persistent behavior or ability of an entity that exhibits flexibility to accommodate expected or unexpected changes rapidly, follows the shortest time span, and uses economical, simple and quality instruments in a dynamic environment. Agility can be evaluated by flexibility, speed, leanness, learning and responsiveness.
(Qumer & Henderson-Sellers, 2006), (Qumer & Henderson-Sellers, 2008)
Agility in a distributed information systems development (ISD) setting is the capability of a distributed team to speedily accomplish ISD tasks and to adapt and reconfigure itself to the changing conditions in a rapid manner by (a) drawing on appropriate IS personnel and technological resources; (b) utilizing appropriate ISD methodologies, mechanisms for bridging temporal distances and routines to anticipate, sense and react to changes in the distributed team’s project environment; and (c) forging and maintaining linkages across communicative and cultural barriers existing among the distributed team members.
(Sarker & Sarker, 2009)
Agility is the software team’s capability to efficiently and effectively respond to and incorporate user requirement changes during the project life cycle.
(Lee & Xia, 2010)
Agility is a multidimensional concept. (Sheffield & Lemétayer, 2013)
Table 3: Agility Definitions (adapted from (Lee & Xia, 2010) and (Vial & Rivard, 2015))

19
definitions from the agile methodology literature. To demonstrated the effect of
agility on software project performance parameters, Lee and Xia presented agility
as the software team’s ability to respond to changes and measured it in terms of
the software team’s response extensiveness and response efficiency (Lee & Xia,
2010).
A survey study presented agility in terms of agile values mentioned in the Agile
Manifesto and revealed that the project environment factor (organizational
culture) and a project factor (empowerment of the project team) are the indicators
of software development agility (Sheffield & Lemétayer, 2013). Balijepally et al.
defined stakeholder collaboration, system validation, reflective improvement and
self-organization as four dimensions of agility and found that these dimensions
have positive impacts on creating business value (Balijepally et al., 2014).
In this study, three key dimensions of agility are conceptualized: sense changes
(Conboy, 2009; Henderson-Sellers & Serour, 2005; Li, Chang, Chen, & Jiang,
2010; Lyytinen & Rose, 2006), respond to changes (Conboy, 2009; Larman,
2004; Lyytinen & Rose, 2006; Sarker & Sarker, 2009) and learn from changes
(Conboy, 2009; Henderson-Sellers & Serour, 2005). According to adaptive
software development approach, speculate, collaborate and learn cycles help
when teams need to deliver fast and changes are high (Highsmith, 2000). These
cycles provide agility to the development process. Agility reflects the ability to
manage the changes that can come up during the project.

20
A software development project may have many types of changes such as
human and IT resource (hardware/software) changes, but user requirement
changes are the most common and important. Table 4 shows various types of
changes that can emerge in agile software development projects.
Types of Changes Description Key References
Technical Requirement Changes
Changes in technical attributes of the system, such as performance, scalability, reliability, and availability attributes
(Conboy, 2009), (Li et al., 2010)
Business Requirement Changes
Changes in functionalities or features of the software systems that can bring more business value to the customer
(Conboy, 2009), (Li et al., 2010)
Technological Resource Requirement Changes
Changes (addition or removal) in hardware and software resources that help IT and Business team members to make system development more effective and efficient during the project.
(Conboy, 2009), (Li et al., 2010)
Human Resource Requirement Changes
Changes in human resources with necessary skills which are required to make system development more effective and efficient. i.e. a member left or joined the team
(Boehm & Turner, 2005), (Conboy, 2009)
Budget and Schedule Changes
Changes in resources (time and budget) required to deliver the given requirements. i.e. priority of the requirement changed so need to deliver early
(Conboy, 2009), (Vidgen & Wang, 2009)
Table 4: Changes Types and their Descriptions*
*adapted from (Rathor, Batra, Xia, & Zhang, 2016)
Frequent interactions between the IT-business team and between the IT team
members help create a better understanding of the client’s needs and help
anticipate future requirements. Project teams implement the requirements to
create business values for the customer. These teams learn from their
experience to become more effective and efficient in future. The definitions and
research on agility indicate that agility is closely related to sensing and

21
responding to changes, learning from changes, and creating business value for
customers.
Process Variables
The process variables refer to the factors related to the various project activities
that are helpful in achieving delivery capability and agility. Based on the literature
review and a qualitative study on agility facilitators (Batra et al., 2016), the most
important process variables were identified. In this research, communication,
collaborative decision-making, and iterative development are key process
variables that facilitate agility and delivery capability. The role of process
variables in facilitating agility and delivery capability can be seen from a dynamic
capability perspective. According to the dynamic capability theory, organizations
use, configure, build and integrate their competencies to develop dynamic
capabilities to deal with changing business environments (Eisenhardt & Martin,
2000; Teece, Pisano, & Shuen, 1997). In the context of agile software
development, team autonomy and team competencies are key resources. These
process variables are the ways by which IT and Business teams can use their
competencies in an autonomous environment to develop agility and delivery
capability to deal with changes during the software development process.
Collaborative Decision Making
Agile software development is collaborative in nature and promotes collaboration
among team members and the client (Highsmith, 2002). The collaboration among
various stakeholders is an important aspect of agile methodology. According to

22
Moe, Aurum, & Dyba (2012), agile methodology has not changed any
fundamental knowledge requirements for software development, but it has
changed the nature of coordination and collaboration among various
stakeholders. Collaboration and collaborative/shared decision-making have been
used interchangeably in agile methodology literature. Coordination and
collaboration activities in an agile team are highly inter-related (Sharp &
Robinson, 2008). Collaboration is defined as working together to accomplish a
task and discussing with other people in solving difficult problems; whereas
coordination is defined as the harmonious adjustment or interaction of different
people or things to achieve a goal or effect (Misra et al., 2009). Collaboration is a
complex and multidimensional process described by constructs such as
coordination, communication, relationship, trust, and aims to achieve some
specific outputs through team efforts (Kotlarsky & Oshri, 2005). It is an act of
creating together and is based on trust and respect (Orr, 2011). In a software
development project, coordination leads to many benefits like shorter
development cycles, cost savings, and better-integrated products (Espinosa,
Slaughter, Kraut, & Herbsleb, 2007).
Agile projects involve anticipating and implementing frequent requirement
changes and thus, need a collaborative approach (Moe et al., 2012).
Collaborative decision-making among various stakeholders is required for
creating a shared vision for the project’s success. Collaborative decision-making
is an interactive process that involves multiple stakeholders with diverse
backgrounds and goals (Moe et al., 2012; Nerur et al., 2005). IT and Business

23
teams are the key stakeholders in decision-making in agile projects. In agile
software development projects, collaborative decision-making is challenging and
requires effort, time and patience (Hoda, Noble, & Marshall, 2013). A few factors
such as team distribution, resource drain, lack or delay in customer involvement,
estimation process, level of experience, time constraints and influence of experts
can negatively affect decision-making in agile project teams (Drury & McHugh,
2011). A multiple case study identified the main challenges in shared decision-
making and recommended that the alignment of decisions on the strategic,
tactical, and operational levels is important to overcome these challenges.
Collaborative decision-making at the operational level is essential for the success
of agile development (Moe et al., 2012). The decision-making process includes
taking operational, tactical, and strategic decision and can occur between various
stakeholders. In agile project, collaborative decision-making happens between
IT-business teams and within IT teams. In agile teams, decisions are made
through an interactive process involving team members (Moe et al., 2012; Moe,
Dingsoyr, & Dyba, 2009). The knowledge about each other’s work and overall
project progress helps in collaboration between agile team members (Sharp &
Robinson, 2008). Some problems, like group-think or the Abilene paradox can
negatively affect the efficacy of decision-making by agile teams (McAvoy &
Butler, 2009).
Customer involvement is one of the key success factors for agile (Chow & Cao,
2008; Hoda et al., 2011). IT team and customers or customer representatives
(business team) co-create business values as they interact continuously during

24
the development stages (Babb & Keith, 2011). The customer is actively involved
in various activities such as discussing and prioritizing requirements,
clarifications and providing feedback (Bosch & Bosch-Sijtsema, 2011). Usually,
business teams are the representatives of the customer in agile projects.
Collaborative decision-making between business and IT teams refers to the
collaborative process in which business and IT team members participate in
making decisions about project activities such as defining project goals and risks,
defining and prioritizing requirements, and setting up project schedule and
budget. The agile projects are more likely to succeed if there is more
collaboration with the customer (Mishra & Mishra, 2009). Agile projects are
based on close interactions with the customer and assume that the customer will
be available for the quickest possible feedback because customer feedback is
viewed as a critical success factor (Lindvall et al., 2002). The lack of customer
collaboration can lead to adverse effects on a project’s success (Hoda et al.,
2011).
Agile practices enable collaborative decision-making among IT teams and
business teams (Yu & Petter, 2014). In small projects, collaboration between
teams is easy because team members work physically close to each other.
However, in large projects where teams are globally distributed, collaboration can
be a challenge. The large projects may need additional mechanisms or tools for
collaboration. The constant collaboration between IT and Business teams is
important to explore new ideas for business value.
25
Communication
Communication is the “imparting or interchanging of thoughts, opinions, or
information by speech, writing, or signs” (Mishra, Mishra, & Ostrovska, 2012). It
is a dialogue that attempts to balance creativity and constraints (Eisenberg &
Goodall, 2004). Many studies have been conducted on the importance of
communication in the agile projects. Table 5 shows the findings from a few
important studies on communication from agile methodology literature. Some
contradictions can be seen in these studies (Hummel, 2013). Whereas most
studies have mentioned communication as an important factor for the agile
projects (Koskela & Abrahamsson, 2004; Xiaohu, Bin, Zhijun, & Maddineni,
2004), a few studies state that communication has not contributed to the agile
project success (Abbas et al., 2010; Mishra & Mishra, 2009). A study states that
while developing complex systems, verbal communication is prone to memory
lapses so it may be difficult to recall why certain choices were made (Nawrocki,
Jasiñski, Walter, & Wojciechowski, 2002). Whereas, another study states that, for
a complex project, understanding comes more from a face-to-face interaction
than from documentation (Highsmith, 2002). These contradictions show that
communication approaches are contextual. Hummel et al. conducted structured
and systematic literature reviews to provide an integrated view of the role of
communication in agile software development (M. Hummel, C. Rosenkranz, & R.
Holten, 2013). It presented the impacts of communication mechanism on agile
teams, and identified research gaps based on 333 studies on communication
from agile methodology literature. Another study identified the challenges of

26
communications in agile projects in seven categories: people, distance, team,
technology, architectural, process, and customer communication (Alzoubi & Gill,
2014).
Regardless of the software development approach being used, communication is
an important factor for project success (Beck, 2000; Korkala & Abrahamsson,
2007). In agile software development projects, communication is a key factor (M.
Hummel et al., 2013; Karhatsu, Ikonen, Kettunen, Fagerholm, & Abrahamsson,
2010; Mishra et al., 2012). Agile development is people-centric and emphasizes
frequent communication among people (Nerur et al., 2005). It is characterized by
extensive communication and collaboration for collective action (Cockburn &
Highsmith, 2001; Nerur et al., 2005). Communication in agile projects can have
varying levels of information transfer between various parties involved in the
communication process. It ranges from simple information exchange, where one
party sends any information to another (i.e. email) to a dialogue, where there are
negotiations and clarifications among multiple parties. Communication means
that interactions between various IT and Business teams result in creating a
shared understanding of the project scope, project tasks and activities, project
milestones and future goals. It is important for better coordination, building
trusted relationships, and knowledge sharing. Agile principles and values
emphasize collaboration between IT and Business teams, for which,
communication between IT and Business teams is necessary. Communication
between IT and Business teams is important for clarification, feedback and for
having a common understanding of the project scope and goals. Existing studies

27
Reference Key points
Agile manifesto The most efficient and effective method of conveying information to, and within, a development team is face-to-face conversation.
(Melnik & Maurer, 2004)
Verbal face-to-face interactions facilitate achieving higher productivity by software development teams.
(Xiaohu et al., 2004) Extreme programming practices reduce the communication issues and improve communication quality for global software development efforts.
(Layman et al., 2006) The XP development methodology requires informal communication between customer and developer. Even with barriers of time, language, and distance, the use of informal communication-centric practices can be used to produce successful projects.
(Korkala, Abrahamsson, & Kyllonen, 2006)
Face-to-face communication is the most efficient means of communication between participants.
(Korkala & Abrahamsson, 2007)
Recommendations for communication in distributed agile software development are made.
(Sutherland, Viktorov, Blount, & Puntikov, 2007)
In distributed agile projects, communication problems can be caused due to differences in working styles.
(Pikkarainen, Haikara, Salo, Abrahamsson, & Still, 2008)
Agile practices had positive effects on the communication within the development teams, external communication and facilitates dependencies between the tasks – subtasks, feature – requirements between software development teams and stakeholders.
(Summers, 2008) Cultural difference can lead to miscommunication in distributed agile projects
(Mishra & Mishra, 2009)
Physical environment and the effective use of tools like whiteboards, status-boards, and so forth, played an important role in communication
(Hossain et al., 2009) Communication related issues are the major challenges when using Scrum in distributed software development projects.
(Mishra et al., 2012) Communication plays a major role in improving coordination and collaboration and open physical environment helps in communication among team members.
(Dorairaj, Noble, & Malik, 2012)
To promote effective team interaction in distributed Agile teams use
these six strategies: ‘one team’ mindset, personal touch, open communication, team collocation, team ambassadors, and coach travels.
(Hummel, 2013) Highlights the role of communication within the project team as a critical success factor and develop measurement instruments
(Markus Hummel, Christoph Rosenkranz, & Roland Holten, 2013)
This study developed a research model to explain relationship the impact of agile practices and communication in agile ISD teams. The exact nature of the relationship between agile practices and communication is less understood within the ISD domain.
(Ryan & O’Connor, 2013)
Face-to-face social interaction helps in acquiring and sharing team tacit knowledge

28
(M. Hummel et al., 2013)
The results on the precise role of communication in agile projects are scattered, inconclusive as well as contradictory. No rigorous studies to show relationships between agile practices, improved communication and project success. Most studies are qualitative and exploratory in nature, and there is lack of confirmatory and explanatory studies.
(Alzoubi & Gill, 2014) Challenges of communication in agile projects is categorized in seven categories: people, distance, team, technology, architectural, process and customer communication.
(Hummel, 2014) Defined the role of social agile practices for direct and indirect communication in information systems development teams
Table 5: Communication-related studies from Agile Literature
have discussed the importance of communication between IT and Business
teams (Abbas et al., 2010; Fontana et al., 2014; Xiaohu et al., 2004). In
distributed agile projects, communication is more challenging because teams are
not co-located (Korkala & Abrahamsson, 2007; Layman, Williams, Damian, &
Bures, 2006). It is crucial in distributed agile software development, where team
members are scattered across different geographic locations and are often
across several time zones (Dorairaj, Noble, & Malik, 2011). Inefficient
communication combined with volatile requirements can lead to severe issues,
even in very small-scale agile projects (Korkala & Abrahamsson, 2007).
Iterative Development
The agile manifesto recommends to the customer continuous delivery of working
software in short iterations (i.e. 2-4 weeks in Scrum). For each iteration, the IT
team plans to work on a few requirements that are prioritized by the business
team in a time bound manner (Cockburn, 2006). A working version of the
software system is delivered to the customer at the end of every iteration. This

29
approach of developing a software system in short iterations of a few weeks is
termed as an iterative development approach. In traditional projects, the
customer has to wait for months to see working software and an IT team has to
wait for months to get feedback from the customer. The iterative development
approach of delivering the system in short iteration reduces the wait time for
customer feedback and helps in responding to requirement changes quickly
(Cockburn, 2006; Highsmith, 2004b). Chow et al. (2008) state that the delivery
strategy is a critical success factor for agile software development projects.
Continuous integration (CI) and testing are key processes in agile methods. For
example, one of the values mentioned in extreme programming is “testing.” At
the end of each iteration, the new code is merged with existing code and system
can be deployed. CI is the process of integrating the entire code base in an
automated fashion as often as possible (Tripp, 2012). Automated testing
and test-driven development are the core of agile development processes
(Cockburn, 2006). According to a study by Fontana et al. (2014), development
practices like continuous delivery of software and test driven development
defines agile software development maturity (Fontana et al., 2014). Continuous
integration and testing help in ensuring quality by early identification of quality
issues. An iterative approach is associated with higher project success rate
(Abbas et al., 2010).

30
Antecedent Variables
The antecedent variables refer to the factors that are responsible for creating a
conducive environment for agility and delivery capability. These variables are
helpful in creating a suitable environment for the IT and Business teams in agile
software development projects. Based on literature review and a qualitative study
on agility facilitators (Batra et al., 2016), a few key antecedent variables were
identified that are important in agile software development. A qualitative study
identified that team autonomy and team competence as key antecedent variables
that facilitate agility and delivery capability (Batra et al., 2016). A few other
factors such as organizational culture and facilitative management were not
found to be much important so they were not included in the research model.
Team Autonomy
The effectiveness of software development practices depends on the
environment in which they are used (Barki & Suzanne Rivard, 2001). The Agile
Manifesto and agile studies emphasize many environment factors that are
required for the success of agile methodology. One such factor is team
autonomy. In agile literature, self-organizing and autonomous attributes are used
interchangeably to characterize agile teams. Agile software development
emphasizes the importance of self-organizing and autonomous teams (Lee &
Xia, 2010). Self-organizing teams are essential for agile development (Sharp &
Robinson, 2004) and are considered the heart of agile software development
(Hoda et al., 2013). Agile teams are self-organizing (Cockburn & Highsmith,
2001) and are composed of members that plan their own work based on need

31
and best fit (Highsmith, 2009; Hoda et al., 2013). A self-organizing agile team is
capable of making collaborative decisions at the operational and tactical levels,
whereas strategic level decisions are made by senior management, for example,
product owner (Moe et al., 2012). In agile projects, IT team is empowered to
make decisions, whereas decision-making in traditional software development
projects lies with the project manager (McAvoy & Butler, 2009). Such teams
require autonomy to plan and manage their work.
Team autonomy refers to the degree of discretion and independence granted to
the team in scheduling the work, determining the procedures and methods to be
used, selecting and deploying resources, hiring and firing team members,
assigning tasks to team members, and carrying out assigned tasks (Breaugh,
1985; Lee & Xia, 2010). The autonomous teams collaborate, improvise according
to problem context and use their collective mindfulness to solve problems (Nerur
& Balijepally, 2007). In order to overcome the new challenges during software
development process, autonomous teams must have mutual trust, common
focus, collaboration and prompt decision-making (Cockburn & Highsmith, 2001).
Team autonomy is required to provide the team with authority and control over
what they want to do and how they want to do it because they are the best
decision makers to solve project problems, for example, managing changing
requirements. The members of autonomous teams collaborate to use their
collective knowledge and skills to find a solution to the given problems (Nerur &
Balijepally, 2007). It increases the speed and effectiveness of the problem-

32
solving by shifting decision-making control to the people who actually face the
problems (Larman, 2004). Team autonomy decentralizes the decision-making
process and provides control of the decision-making to project team members (IT
and Business teams) and positively affects team’s efficiency for responding to
changes in the project (Lee & Xia, 2010).
Team Competence
The software development process is inherently a complex process (Xia & Lee,
2003), so it requires specific skills. The skills of team members significantly affect
software product development and software project management (Vinod et al.,
2009). Individual competence of each team member is important for the success
of the project (Cockburn & Highsmith, 2001). A study found that both technical
and non-technical skills are important for IS professionals (Gallagher, Kaiser,
Simon, Beath, & Goles, 2010). Information system professionals should have
multi-dimensional skills (Lee, Trauth, & Farwell, 1995). Team competence refers
to the various types of skills possessed by project team members that are
required for a software development project. Software development and agile
methodology literature states that technical skills (Chow & Cao, 2008; Fontana et
al., 2014; McLeod & MacDonell, 2011; Senapathi & Srinivasan, 2012), business
skills (Chow & Cao, 2008; McLeod & MacDonell, 2011; Senapathi & Srinivasan,
2012), communication and inter-personal skills (Fontana et al., 2014; Siau, Tan,
& Sheng, 2010), and analytical and problem-solving skills (McLeod & MacDonell,
2011) are important for the success of software development projects. Business

33
skills are required for identifying the requirements that can create business value
for the customer. Technical skills (programming knowledge, applications and
hardware skills, etc.) and problem-solving skills are needed to develop solutions
for business requirements in an efficient and effective way. Interpersonal skills
are necessary for collaboration and coordination among project team members
to create a shared understanding of the project. These skills are fundamental in
any software development project.
Project Outcomes
Information system development (ISD) is a complex process, which involves
many interconnected resources, stakeholders, and outcomes (Siau, Long, &
Ling, 2010). The success of the project depends on the way the project
outcomes can satisfy the expectations of various stakeholders. An information
system is successful if the stakeholders perceive it to be successful (Myers,
1995). The success of IT projects is an elusive concept and depends on the
perspectives of the stakeholders (Thomas & Fernández, 2008). Project success
is a multi-dimensional concept that can be measured using many subjective and
objective output parameters. The Project Management Institute (PMI) has
defined project success in terms of three constraints: on Time, on Budget, and on
Target. These constraints are also called as Triple constraints. For agile projects,
Time, Cost, Quality, and Scope are the success attributes (Chow & Cao, 2008).
Lee and Xia (2010) presented the project success in an agile project in terms of
on-time completion, on-budget completion and software functionality.
34
Traditionally, project success is measured in terms of time, budget and scope. It
refers to achieving a fixed project scope within a fixed time and a fixed budget. It
is possible that a project meets these triple constraints, but does not satisfy the
customers or return any business benefits to them. A software development
project is of little value for the customer if it is within schedule and budget, but
lacks the features and functionalities the customer thought they were paying for
(Wallace, Keil, & Rai, 2004). A study defined the success of an IT project and
categorized it into three categories: project management (on-time, on budget,
customer satisfaction and team satisfaction), technical (system quality and
meeting requirements) and business (business value and benefits) (Thomas &
Fernández, 2008). Another study measured agile project success with three
parameters: project management success, project quality, and perceived project
impacts (Tripp, 2012). Senapathi and Srinivasan (2012) analyzed the
effectiveness of agile practices using three main factors: improved quality of the
development process, improved productivity during the development process,
and customer satisfaction.
In agile projects, scope is not clearly defined at the beginning of the project
because requirements keep evolving during the project. In such cases, where the
project scope is not clearly defined, traditional measures of project success may
not represent a holistic view of project success. Agile principles explicitly
emphasize business values (Abrahamsson, 2002; Racheva, Daneva, & Sikkel,
2009) and customer satisfaction making these parameters relevant for measuring

35
project success. According to a survey conducted by VersionOne, project quality,
customer satisfaction and business value are the top indicators mentioned by
respondents from agile projects for measuring project success in agile software
development projects (VersionOne, 2015).
In this study, project success parameters were presented from an effectiveness
perspective. The traditional project success indicators: time, budget and scope
are project efficiency parameters. Customer satisfaction is a parameter for
project effectiveness. Effectiveness refers to the extent to which the project
achieved its intended goals. It includes measuring the success of the new system
in terms of its benefits such as organizational benefits (Atkinson, 1999), business
value and customer satisfaction. Customer satisfaction is an important criterion to
measure the effectiveness of the project. It indicates the level of customer’s
expectations about system functionalities, system quality, business value from
the system and overall working conditions of the project. The agile software
development projects with greater customer satisfaction are more likely to
succeed (Misra et al., 2009). In this study, it is argued that antecedents, process,
delivery capability and agility contribute to the effectiveness of agile practices.
Table 6 summarizes all the variables used in this study.
Variables Definitions Key References
Team Autonomy
It refers to the degree of discretion and independence granted to the team in scheduling the work, determining the procedures and methods to be used, selecting and deploying resources, hiring and firing team members, assigning tasks to team members, and carrying out assigned tasks.
(Breaugh, 1985), (Cockburn & Highsmith, 2001), (Lee & Xia, 2010), (Batra et al., 2016)

36
Team Competence
It refers to the various types of skills (technical, business, interpersonal and problem-solving) possessed by project team members that are required for a software development project.
(Chow & Cao, 2008), (McLeod & MacDonell, 2011), (Fontana et al., 2014), (Batra et al., 2016)
Collaborative Decision Making
It refers to the collaborative process in which business and IT team members participate to make decisions about project activities such as defining projects goals, iteration planning, defining and prioritizing requirements, the project schedule, and budget.
(Chow & Cao, 2008), (Hoda et al., 2011), (Drury, Conboy, & Power, 2012), (Rathor, Batra, Xia, et al., 2016)
Iterative Development Approach
It refers to the development software system in short iterations of two to eight weeks with continual testing and integration.
(Chow & Cao, 2008), (Fontana et al., 2014), (Batra et al., 2016), (Rathor, Batra, Xia, et al., 2016)
Communication It means that interaction among various IT and Business teams resulting in creating a shared understanding of project scope, project tasks and activities, project milestones, and future goals.
(Dorairaj et al., 2011), (M. Hummel et al., 2013), (Batra et al., 2016)
Agility It is the ability of the software development process to sense changes, respond to changes and learn from changes during the project to improve customer satisfaction due to effective communication, collaborative decision-making and iterative development process.
(Highsmith, 2004a; Lyytinen & Rose, 2006), (Conboy, 2009), (Sarker & Sarker, 2009), (Sheffield & Lemetayer, 2013), (Batra et al., 2016)
Delivery Capability
It refers to the ability of the project team to apply their skills effectively and efficiently (technical, business, interpersonal, problem-solving, and management skills) for successfully implementing the given requirements in software development projects.
(Chow & Cao, 2008), (Chan et al., 2008), (Rathor, Batra, Xia, et al., 2016)
Customer Satisfaction
It is an indicator of meeting customer expectations about the time and budget of the project, system functionalities, system quality, business value from the system, and change management during the project.
(Sheffield & Lemetayer, 2013), (Serrador & Pinto, 2015), (Rathor, Batra, Xia, et al., 2016)
Change Satisfaction
It indicates how satisfied the customer feels with the way various types of changes (business, technical, human resources, etc.) were handled by IT and Business teams during the project.
(Sheffield & Lemetayer, 2013), (Serrador & Pinto, 2015), (Rathor, Batra, Xia, et al., 2016)
Table 6: Variables, their definitions and key references

37
CHAPTER III
RESEARCH MODEL AND HYPOTHESIS DEVELOPMENT
Research Model
The research model for this study consists of different types of variables such as
antecedent variables (team autonomy, team competence), process variables
(collaborative decision-making, communication, iterative development), agility
(sense, respond, learn), delivery capability and outcome variables (customer
satisfaction, change satisfaction). Agility is conceptualized as a second-order
variable with sensing, responding and learning as three first-order factors. Figure
1 shows the research model for this study. Each arrow represents a hypothesis.
Figure 1: Research Model

38
Hypothesis Development
Team Autonomy and Process variables
Team autonomy is an important aspect of agile methodology (Larman, 2004;
Lee & Xia, 2010). Team autonomy helps in moving the decision-making control
to team members who face the business problems, which increases the speed
and effectiveness of decision-making (Larman, 2004; Lee & Xia, 2010). Such
teams have the authority to estimate, plan and coordinate their work (Batra et al.,
2016), which helps to achieve successful delivery of work in small iterations. In
agile projects, team members need to communicate frequently and decide
collectively on the best solution for the business problems. If someone from
outside the team decides to solve the problems, then team members may not be
able to find the best solution for the unpredictable business problems they
encounter during the software development project. Teams with high autonomy
levels can make decisions on the spot without going through formal procedures
for approvals from higher management. This enables the teams to complete
given tasks in small iterations. Teams then have a locus of decision-making at
the team level, which would enable them to be more proactive and engaging.
The peer-driven coordination and control helps in planning and managing work
because team members can optimize the resources to deliver given work in each
iteration. Team autonomy positively affects the shared decision-making in the
team (Hoegl & Parboteeah, 2006) because ownership of the decision is shared
by all members instead of by any external member (i.e. higher management). In
autonomous teams, team members freely express their opinions about problem-

39
solving and required implementation because all the team members collectively
own the responsibility of work. They have more freedom to voice their opinions in
planning and executing various project activities, which facilitates
communication. Free and open exchange of opinions enables effective
communications among project team members. In the absence of autonomy,
when some external members (i.e. higher management) influence the team
members then the collaborative process within the team decreases because it
leads to more focus on communication vertically (with external member) rather
than horizontally (within the team) (Hoegl & Parboteeah, 2006). Therefore, it is
hypothesized that autonomy effects iterative development, communication and
collaborative decision-making.
H1: Team autonomy positively correlates with communication
H2: Team autonomy positively correlates with collaborative decision-making
H3: Team autonomy positively correlates with iterative development
Team Competence and Process Variables
A software development project requires professionals with multiple skills
because of the complexities involved (Lee et al., 1995). A highly competent team
is an important success factor for agile software development projects (Chow &
Cao, 2008). A team with the right skills is more likely to be effective and efficient
in information system development (Siau, et al., 2010). Good technical expertise
of the team members is required to find the best technical solutions to the given

40
business problems. Good business expertise is necessary to identify the
requirements, which can add value to the customer’s business. In addition to
good technical and business skills, the members with higher analytical and
problem-solving skills are more likely to make better decisions to implement the
requirements. Better decision-making has a positive effect on the project
success. Team members’ communication and interpersonal skills are helpful for
better coordination and collaboration in the project. Team members working
together with good communication skills can work at noticeably higher levels than
when they work independently (Cockburn & Highsmith, 2001). Good
communication skills facilitate effective communication to create shared
understanding of project activities and help in collaboration between IT and
Business team members. The competencies of team members help a team to
successfully plan and execute tasks for each iteration. A competent team can
develop solutions to given business problems successfully in shorter iterations
more easily as compared to a less competent team. In other words, good skills of
the team members make various development processes (i.e. communication,
collaborative decision- making and iterative development) more effective and
efficient. Therefore, it is hypothesized that:
H4: Team competence positively correlates with communication.
H5: Team competence positively correlates with collaborative decision-making.
H6: Team competence positively correlates with iterative development.

41
Collaborative Decision Making, Delivery Capability and Agility
Communication and collaboration are at the core of agile software development
(M. Hummel et al., 2013; Karhatsu et al., 2010). In agile projects, customer or
customer representatives (e.g. business teams) are not only available for just
clarifications, but actively engaged in various other activities (Hoda et al., 2011;
Nerur et al., 2005). The decisions are made after an exchange of ideas among IT
team, project managers, and customer or business team (Highsmith, 2009).
During the agile software development process, the IT and the Business teams
collaborate to achieve common defined goals. Collaborative decision-making
between the business and the IT teams refers to the collaborative process in
which the business and IT team members participate to make decisions about
project activities, such as defining project goals and risks, defining and prioritizing
requirements, defining project schedule and budget. Such approaches help in
collectively using competencies for finding solutions to the given requirements
and to accomplish various project tasks successfully. A team’s collaborative
approach to implementing the given requirements increases their productivity,
which enhances delivery capability. Therefore, it is hypothesized that:
H7: Collaborative decision making positively correlates with delivery capability.
In agile projects, various stakeholders (IT and Business teams) need to
collaborate to share information and clarifications to develop a common
understanding of the various types of changes in various stages of the project. If
IT and Business teams don’t collaborate regularly during the project, then it is
difficult to identify and manage the various types of changes (i.e. requirement

42
changes) that can occur during the project. Effective collaboration is important
when there are changes in the project (Maruping et al., 2009). A weak IT-
Business collaboration is an agility inhibitor in software development (Vidgen &
Wang, 2009). This collaborative decision making approach among various
stakeholders is necessary for anticipating and responding to frequent
requirement changes, which is important for having agility in the project. A
collaborative environment helps IT teams learn about business changes and
helps the customer (e.g., business teams) learn about technology (Vidgen &
Wang, 2009). Therefore, it is hypothesized that:
H8: Collaborative decision making positively correlates with agility.
Communication, Delivery Capability and Agility
Effective communication between development team members is important to
improve the software development processes (Korkala & Maurer, 2014).
Communication means that interactions between various IT and Business teams
result in creating a shared understanding about project scope, project tasks and
activities, project milestones and future goals. Communication helps in
managing, planning and executing team tasks in the project, which is necessary
for delivery capability. Due to communication in the team, team members have
knowledge about other team members’ work and shared understanding of team
goals. This leads to better team productivity, coordination and contributes to the
higher delivery capability. Therefore, it is hypothesized that:
H9: Communication positively correlates with delivery capability.

43
Communication between IT and Business teams is important for clarification,
feedback and having a common understanding of the project scope and goals. In
distributed agile software development, it becomes more crucial because IT and
Business team members are scattered across different geographic locations and
are often across several time zones (Dorairaj et al., 2011). Unlike in traditional
development projects, communication is very important in agile projects. This is
because in agile projects requirements keep changing so stakeholders (e.g. IT
and business teams) need to communicate frequently for clarifications and
discussing future ideas and requirements. Even in small projects, communication
issues combined with frequent requirement changes can lead to severe problems
for the success of the project (Korkala & Abrahamsson, 2007). Communication
between IT and Business teams helps anticipate various types of changes,
mainly requirement changes, which contribute to agility. IT and Business teams
communicate continuously to respond to various changes whenever there are
new changes in the software development project. By responding to changes,
communication helps in facilitating agility. Also, communication is important for
learning in the agile projects. The Agile Manifesto emphasizes regular learning
from experience in order to become more effective and efficient. In agile projects,
there is just enough documentation (Ramesh, Cao, Mohan, & Xu, 2006) so there
is less explicit knowledge transfer as compared to tacit knowledge transfer
(Chau, Maurer, & Melnik, 2003). Tacit knowledge transfer mainly happens
through verbal communication. Therefore, it is hypothesized that:
H10: Communication positively correlates with agility.

44
Iterative Development, Delivery Capability and Agility
The Agile Manifesto recommends delivering working software in short iterations
(two to eight weeks) to the customer. Iterative development with continuous
integration and testing are key features of agile development process. The
approach of developing software systems in short iterations of a few weeks is
termed as an iterative development approach. In an iteration, IT teams
implement a small part of the requirements that are prioritized by the customer.
Then a working version of the software system is delivered to the customer for
their feedback. For IT team members, it is easy to estimate and reconfigure
resources, plan executions and identify issues when they are working on
delivering a small portion of the work. The team members can use their
resources effectively and efficiently when the amount of deliverable work is small.
This enhances the delivery capability of the team members. Therefore, it is
hypothesized that:
H11: Iterative development process positively correlates with delivery capability.
In agile projects, user requirement changes are often expected. These changes
are prioritized by the customers or customer representatives (e.g. Business
teams) based on their business value. IT team members implement a few high-
priority requirement changes and deliver them to the customers for their
feedback. Due to small iteration time, IT team members are able to respond to
high-priority changes quickly. The iterative approach with short cycles enables
quick customer feedback and helps the IT team to quickly identify requirement
changes (Cockburn, 2006; Highsmith, 2004b). Due to a small delivery time,

45
customers can have a look at the implemented changes and in turn are able
identify further changes that can bring them more business value. Because of the
iterative approach, new requirement changes are anticipated and implemented
early in the project, which contributes to agility.
At the end of each iteration, team members meet to review and reflect on their
work. For example, in Scrum, each iteration ends with a review and retrospective
meeting (Schwaber, 2004; Schwaber & Sutherland, 2014). In these meetings,
team members discuss if they have achieved their goal for the current iteration
and how they can improve in the future (Cockburn, 2006; Schwaber, 2004). Such
activities help in learning from experiences so that teams can be more efficient
and effective in the future. Learning from previous iterations increases team
productivity and contributes to agility. The iterative development approach also
helps team members become more effective and efficient because it provides
early feedback for their work. If the iteration is long (e.g. a few months), then the
implementation of the requirement changes will be slow and late. The delayed
implementation of requirement changes can have a negative effect on the
customer’s business. An iterative approach contributes to agility because it helps
to anticipate and implement changes early and to get customer feedback quickly
for learning purposes. Therefore, it is hypothesized that:
H12: Iterative development process positively correlates with agility.

46
Delivery Capability, Agility and Project Outcomes
Delivery capability as defined above refers to the routine or essential software
development ability of the team to deliver results as per the given requirements.
It is a fundamental necessity for any software development project. This means
that team members can effectively use all the required skills to accomplish given
tasks. Agility, as defined above, refers to the team’s ability to sense, respond
and learn from changes that were not in the given set of requirements. In an agile
project, there are many changes that come up during the project, especially user
requirement changes. In this study, it is argued that agile processes facilitate
both delivery capability and agility in the software development process. If team
members do not have the delivery capability, they can’t deal with the changes
that come up during the software development project (Rathor, Batra, & Xia,
2016). When team members have a higher delivery capability, they are more
likely to have the agility that is needed to deal with the changes they face during
the project. Therefore:
H13: Delivery capability positively correlates with agility.
Customer satisfaction is the main focus of agile values and principles (Serrador &
Pinto, 2015). One of the agile principles states that “our highest priority is to
satisfy the customer through early and continuous delivery of valuable software”.
Early delivery of working software to customers help improve the systems so
customers feel satisfied because they can actually see the system and provide
feedback. Agile methods increase customer satisfaction by frequently delivering
value (Fontana et al., 2014; Melo et al., 2013). Agile software development

47
emphasizes creating business value so the requirements are prioritized based on
their business value to the customer. IT teams implement a prioritized set of
requirements and deliver working software to the customer in a few weeks.
Before the end of each iteration, new code is integrated into existing code and
then testing is done. The continuous integration and testing help early detection
of defects and improves quality. Agile methods have quality practices integrated
into their development processes which ensure software quality (Huo, Verner,
Zhu, & Babar, 2004). System quality is one of the important perceived outcomes
from agile practices (Melo et al., 2013). The team with a higher delivery capability
is more likely to develop, test and integrate the given requirements efficiently and
effectively to deliver better quality and functionalities. At the end of each
iteration, the customer gets to see the working software and can provide quick
feedback to the IT team. The continuous collaboration between IT and Business
teams during the project help in learning about the customer’s needs. Such
agility practices lead to shared understanding and transparency in the project
activities, which contribute to customer satisfaction. A team may be very good at
doing known or planned tasks, but they may not be able to perform equally well
where there are unexpected changes during the project. Agility helps in
anticipating and managing changes in the project in an efficient and effective
manner. Customer change satisfaction refers to the perceptions and evaluations
of the project team’s handling of changes during the project (Rathor, Batra, Xia,
et al., 2016). How IT and Business team members deal with various types of
changes contributes to customer change satisfaction. If team members have

48
higher levels of delivery capability and agility, the project team can anticipate and
implement changes in a more effective and efficient manner. This results in
better quality, functionalities and business value and hence, enhanced customer
satisfaction from changes. If the change satisfaction is high, it will also enhance
overall customer satisfaction. Therefore, it is hypothesized that:
H14: Delivery capability positively correlates with customer satisfaction.
H15: Delivery capability positively correlates with change satisfaction.
H16: Agility positively influences correlates with satisfaction.
H17: Agility positively correlates with change satisfaction.
H18: Change satisfaction positively correlates with customer satisfaction.

49
CHAPTER IV
RESEARCH METHODOLOGY
A quantitative methodology was used to study relationships among the various
variables of interest. The methodology for this study includes four key phases.
These steps are explained below in detail. Table 8 contains the different phases
of research methodology used in this study.
Conceptual Development and Measures Identification
For this study, a comprehensive literature review was conducted to understand
key aspects of agile software development. It helped to identify research gaps
and hypothesize relationships between the various constructs. The literature
review is important to understand the dimensions of the constructs and helps in
the operationalization of the constructs of interest (Bhattacherjee, 2012). In
addition to the literature review, interviews with thirteen agile project
professionals were conducted to understand the key constructs, their dimensions
and relationship between constructs. These interviews were conducted with agile
professionals working in software companies located in the northern part of India.
All the interviews were done in the English. These interviews were audio
recorded and transcribed for qualitative analysis. A coding technique was used to
analyze interview transcripts (Charmaz, 2006; Corbin & Strauss, 1990; Locke,
1996; Urquhart, 2007). The qualitative analysis of the interviews helped to
identify key facilitators of agility and delivery capability.

50
Conceptual Refinement and Measure Modification
In this study, whenever appropriate, existing measures were used or adapted
from the agile and software development literature. For example, measures for
team autonomy were adapted from Lee and Xia (2010). New measures were
created for a few variables (e.g., agility, delivery capability) based on the
literature and a qualitative analysis of interviews with thirteen agile project
professionals. A list of measures for each construct was created after literature
and qualitative analysis of the interviews were done with agile project
professionals. Q-Sorting procedures were conducted with five experts for face
and construct validity of the measures (Straub, Boudreau, & Gefen, 2004).
Construct validity is important to find the extent to which a measure adequately
represents the underlying construct that it is supposed to measure
(Bhattacherjee, 2012). Q-Sorting helped to identify issues that could hinder a
survey respondent’s ability to relate items to the corresponding construct. After a
sorting process, a few survey items were changed or rephrased. After Q-Sorting,
a pilot test was done with eighteen agile software professionals for content
validation of the survey. The pre-testing of the survey instrument was important
to make sure that the survey was effective in getting the required information
(Converse & Presser, 1986). It helped in early detection of potential problems in
the research design and survey instruments (Bhattacherjee, 2012). A few items
were dropped or merged with other items after the pilot test was completed. In
this study, both reflective and formative constructs were used. Agility is
conceptualized as a second-order formative construct with three first-order

51
factors or dimensions. Sense changes, respond to changes, and learn from
changes are three key dimensions of agility. These three dimensions are
conceptualized as first-order formative constructs for agility. Table 7 shows
measures, their types, items and key references. The final items of all the
measures are given in the Appendix (Table A3.1, A3.2, A3.3, A3.4).
Variables Items Key References
Team autonomy (Reflective)
Project team members were allowed to choose tools and technologies. (1)
(Lee & Xia, 2010), (Batra et al., 2016)
Project team members had control over their tasks. (2)
Project team members had the discretion on how to handle user requirement changes. (3)
Project team members were free to self-organize as needed (4)
Team Competence (Formative)
Project team members possess required technical skills. (1)
(Batra et al., 2016)
Project team members possess required business skills. (2)
Project team members possess required interpersonal skills. (3)
Project team members possess required problem-solving skills. (4)
Iterative development process (Formative)
The software system was developed in smaller iterations of few weeks (two-eight weeks). (1)
(Hummel, Rosenkranz, & Holten, 2015), (Batra et al., 2016)
The software system was tested as it was being developed. (2)
Each iteration provided working software that could be demonstrated. (3)
The software system was continually integrated as it was being developed. (4)

52
Communication (Reflective)
IT and Business team members had sufficient interactions during the project. (1)
(Markus Hummel et al., 2013), (Batra et al., 2016)
IT and Business team members developed a shared understanding about the project. (2)
IT and Business team members did not have communication problems during the project. (3)
IT and Business team members effectively communicated their thoughts and opinions to others. (4)
Collaborative Decision Making (Reflective)
IT and Business teams worked jointly for deciding features for each iteration. (1)
(Hoegl & Wagner, 2005), (Batra et al., 2016)
IT and Business teams worked jointly for deciding the scope of the requirements for each iteration. (2)
IT and Business teams worked jointly for prioritizing the requirements for each iteration. (3)
IT and Business teams worked jointly for deciding changes in the requirements. (4)
Agility-Sense (Formative)
During the project, project team(s) were able to sense changes in business requirements. (1)
(Conboy, 2009), (Batra et al., 2016)
During the project, project team(s) were able to sense changes in technical requirements. (2)
During the project, project team(s) were able to sense changes in human resource requirements. (3)
During the project, project team(s) were able to sense changes in schedule. (4)
Agility-Respond (Formative)
During the project, project team(s) were able to respond to changes in business requirements. (1)
(Conboy, 2009), (Batra et al., 2016)
During the project, project team(s) were able to respond to changes in technical requirements. (2)
During the project, project team(s) were able to respond to changes in human resource requirements. (3)
During the project, project team(s) were able to respond to changes in schedule. (4)
Agility-Learn (Formative)
As the project progressed, project team member(s) were able to learn and enhance their ability to sense and respond to changes in business requirements. (1)
(Conboy, 2009), (Batra et al., 2016)

53
As the project progressed, project team member(s) were able to learn and enhance their ability to sense and respond to changes in technical requirements. (2)
As the project progressed, project team member(s) were able to learn and enhance their ability to sense and respond to changes in human resource requirements. (3)
As the project progressed, project team member(s) were able to learn and enhance their ability to sense and respond to changes in schedule (4)
Delivery Capability (Formative)
Project team(s) were able to deliver solutions that met business requirements. (1)
(Chow & Cao, 2008), (Chan & Thong, 2009)
Project team(s) were able to deliver solutions that met technical requirements. (2)
Project team(s) were able to deliver solutions that met functional requirements. (3)
Project team(s) were able to deliver solutions that met non-functional requirements. (4)
Customer Satisfaction (Formative)
The customer is satisfied with the functionalities of the new system. (1)
(Wallace et al., 2004), (Palvia, King, Xia, & Palvia, 2010)
The customer is satisfied with the quality of the new system. (2)
The customer is satisfied with the delivery time of the system. (3)
The customer is satisfied with the cost of the new system. (4)
The customer is satisfied with the benefits/value from the new system. (5)
Change Satisfaction (Formative)
The customer is satisfied with the way changes in business requirements were managed in the project. (1)
(Rathor, Batra, Xia, et al., 2016)
The customer is satisfied with the way changes in technical requirements were managed in the project. (2)
The customer is satisfied with the way changes in human resource requirements were managed in the project. (3)
The customer is satisfied with the way changes in schedule was managed in the project. (4)
Table 7: Construct types and their measurement items

54
Data Collection
An online survey was used to collect the data for this research. Quantitative
surveys are suitable for test relationships among various constructs of interest
(Creswell, 2013). Quantitative surveys help to quantify information about the
constructs, which can be later used for statistical analysis. The online survey was
developed using Qualtrics. Online surveys are easy to distribute across different
locations and help collect data faster (Cooper & Schindler, 2011). Data collection
was done from multiple sources to get responses from diverse projects. The
online survey was sent to respondents (developers, business analysts,
managers) working on agile software development projects by contacting IT
companies located mainly in India and US. Also, respondents were randomly
approached through online professional communities on social networking sites
(LinkedIn, Facebook) and using snowball sampling.
Data Analysis and Measurement Validation
The final phase of methodology includes analyzing the survey data. In this
phase, data screening, descriptive data analysis, measurement and structural
validation with result reporting was provided. The next chapter provides a
complete description of data analysis steps.

55
Phase 1-Conceptual Development and Measure Identification
Literature Review To understand existing relevant research models, key factors and existing measures of the factors
Field Interviews For new measures and insights about the factors
Qualitative Data Analysis To generate new factors, their dimensions and sub-dimensions
Phase 2-Conceptual Refinement and Measure Modification
Item Selection/Creation
Creating new items or adapting existing items
Q-Sorting Procedure For qualitative assessment of face and construct validity
Pilot test For assessment of content validity
Finalizing items Final items for the measures
Phase 3-Data Collection
Online survey Data collection using online survey
Phase 4-Data Analysis and Measurement Validation
Data Screening and Descriptive Analysis
Removing incomplete survey responses
Validation Reliability, Discriminant and Convergent Validity
Result Reporting Path coefficients, R2, F2, Indirect Effects
Table 8: Research Methodology Phases (adapted from (Xia & Lee, 2003))

56
CHAPTER V
DATA ANALYSIS AND REPORTING
Data Analysis
Structural equation modeling (SEM) techniques help to understand the complex
relationship between latent variables (Kline, 2015). It is used to evaluate how well
the sample data supports the theoretical research model hypothesized by the
researcher (Lomax & Schumacker, 2012). It not only assesses the structural
model (causation between independent and dependent variables) but also
evaluates measurement model (loadings of the measurement items) in the same
analysis (Gefen, Straub, & Boudreau, 2000). For this research, the partial least
square-structure equation modeling (PLS-SEM) was used for data analysis using
SmartPLS3 software. The use of PLS-SEM is appropriate when there are
formative variables (i.e. agility, delivery capability) in the model (F. Hair Jr,
Sarstedt, Hopkins, & G. Kuppelwieser, 2014; Lowry & Gaskin, 2014; Straub et
al., 2004). PLS-SEM is a non-parametric method that estimates coefficients to
maximize the explained variance (R2 value) of endogenous variables (Hair Jr,
Hult, Ringle, & Sarstedt, 2016).
Descriptive Statistics
The data analysis were conducted using 160 complete survey responses after
thirty-four responses that had more than 15% of missing values were removed
from the initial sample (Hair Jr et al., 2016). The tables given in the appendix
show the descriptive statistics of the survey items (See table A1.1, A1.2, A1.3,

57
A1.4). The respondents included different stakeholders from agile software
development projects such as software developers, business analysts, project
managers. The majority of the respondents were from IT teams (i.e. developers,
scrum masters). Tables 9 and 10 show the countries and roles of the survey
respondents respectively.
Country/Region Frequency Percent
India 73 45.6
US/Canada 55 34.4
Europe 24 15.0
Others (China, Latin America)
8 5.0
Total 160 100.0
Table 9: Country/Region of the respondents
Respondent Role Frequency Percent
Software Developer 51 31.9
Project Manager 17 10.6
Senior Management (Technical) 10 6.3
Business Analyst 5 3.1
Senior Management (Business) 5 3.1
Scrum Master 26 16.3
Product Owner 9 5.6
Tester 30 18.8
Others 7 4.4
Total 160 100.0
Table 10: Respondent Role
These survey respondents used different agile methods in their projects. Table
13 shows the agile methods used by respondents. Most of the respondents used

58
the Scrum method. Some software teams or companies modified practices
recommended by an agile method or combined practices suggested by more
than one method (i.e. Scrum +Kanban) to fit their project and team needs. Such
methods are termed as modified agile methods and hybrid agile method,
respectively. The survey respondents were working on software projects for a
variety of industries. Tables 11 and 12 show agile methods used by respondents
and industry type, respectively.
Agile Method Frequency Percent
Scrum 84 52.5
Extreme Programming 3 1.9
Lean 1 .6
Modified Agile Method 32 20.0
Hybrid (Multiple Agile Methods) 24 15.0
Others 16 10.0
Total 160 100.0
Table 11: Agile Methods used by Respondents
Industry Type Frequency Percent
Banking, Insurance, or Financial Services 51 31.9
Telecom 13 8.1
Education, Research 4 2.5
Healthcare, Medical 15 9.4
Aviation, Transportation, or Travel Industry 14 8.8
Manufacturing 11 6.9
Media and Entertainment 8 5.0
Other 44 27.5
Total 160 100.0
Table 12: Industry Type

59
Reliability and Validity
Adequate construct validity is important to know whether the measures behave
as expected and to check if the measure of same constructs correlate (Churchill
Jr, 1979). In PLS, it is important to know the strength of relationships between
latent constructs with their indicators (measurement model) and the relationship
between various constructs (structural model) (Hair Jr et al., 2016). It is important
to check the reliability and validity of constructs for model estimation. In PLS-
SEM, measurement model assessment is done before the structural model
estimation. The structural model assessment is not done until the reliability and
validity of measurement model are established.
The research model for this study included both reflective and formative
constructs. For the measurement model estimation of reflective constructs,
internal consistency reliability (Cronbach’s alpha, composite reliability),
convergent validity (average variance extracted) and discriminant validity are
checked (Hair Jr et al., 2016). Internal consistency reliability (ICR) indicates how
well the indicators of a reflective construct measure that construct. It is measured
by the correlation between the indicators of the reflective measures. The
Cronbach’s alpha has traditionally been used as the criterion to estimate the
internal consistency reliability (MacKenzie, Podsakoff, & Podsakoff, 2011). It is
sensitive to the number of indicators and shows a conservative value for
measuring reliability, as compared to composite reliability (Hair Jr et al., 2016).
Composite reliability shows a little higher value for reliability as compared to
Cronbach’s alpha.

60
Convergent validity refers to the extent to which an indicator correlates with the
other indicators of the same construct (Hair Jr et al., 2016). It represents how
well the indicators of a construct are actually measuring that construct (Teo,
Srivastava, & Jiang, 2008). In SmartPLS, outer loading value indicates how
much common an indicator has with its construct (Hair Jr et al., 2016). It shows
how well an indicator converges to its construct. The average variance extracted
(AVE) is the average amount of variance in indicators that is explained by the
focal construct. It is used as a measure to establish convergent validity (Hair Jr et
al., 2016).
Constructs
Convergent Validity Internal Consistency
Reflective Indicators
Outer Loadings
Average Variance Extracted (AVE)
Cronbach's Alpha
Composite Reliability
Collaborative Decision Making
Q14_CDM1 0.763 0.680
0.841
0.894
Q14_CDM2 0.899
Q14_CDM3 0.769
Q14_CDM4 0.859
Communication
Q13_Comm1 0.772 0.654
0.818
0.882
Q13_Comm2 0.886
Q13_Comm3 0.659
Q13_Comm4 0.895
Team Autonomy
Q18_Atny1 0.687
0.650 0.819 0.881 Q18_Atny2 0.863
Q18_Atny3 0.805
Q18_Atny4 0.858
Table 13: Internal Consistency and Convergent Validity

61
The AVE value for each construct can be obtained by averaging the squared
completely standardized factor loadings of the indicators, or by averaging the
squared multiple correlations for the indicators (Fornell & Larcker, 1981;
MacKenzie et al., 2011).
The Cronbach’s alpha and composite reliability values should be more than 0.7
to have good internal consistency for reflective indicators (MacKenzie et al.,
2011). All the reflective constructs of this research had Cronbach’s alphas and
composite reliability values more than the recommended value (0.7) (See Table
13). The average variance extracted (AVE) should be more than 0.5 (Fornell &
Larcker, 1981; MacKenzie et al., 2011) and outer loadings value of indicators
should be more than 0.7 for achieving convergent validity of reflective indicators
(Hair Jr et al., 2016). In this study, the AVE values of all the reflective constructs
were more than 0.5. Two reflective indicators (i.e. Comm3, Atny1) had outer
loadings just below 0.7 and they were kept in the analysis. Table 13 shows the
internal consistency and convergent validity values of the reflective constructs
used in this study.
Formative Indicators
For the assessment of the formative constructs, it is important to check
collinearity between indicators (variance inflation factor) and significance of the
indicator weights (Cenfetelli & Bassellier, 2009). The indicators of a formative
construct represent different dimensions of that construct (Petter, Straub, & Rai,
2007). Unlike reflective indicators, a high correlation between indicators is

62
undesirable for formative constructs because indicators with high correlation
imply that they represent the same dimension of the construct. A high correlation
between formative indicators leads to the problem of multi-collinearity
(MacKenzie et al., 2011). It can be problematic because it is difficult to determine
how each indicator influences the latent construct when multi-collinearity is high
(Bollen, 1989). It impacts the estimation of weights and their significance (Hair Jr
et al., 2016). The level of collinearity can be assessed by estimating tolerance,
which represents the amount of variance of one formative indicator not explained
by other indicators (Hair Jr et al., 2016). In IS research, variance inflation factor
(VIF) statistics is used to check multi-collinearity problems in constructs with
formative indicators (Gefen et al., 2000; Petter et al., 2007).
VIF is used as an indicator of multicollinearity in multiple regression analysis. It
measures the comparative increase in the variances of the estimated regression
coefficients as compared to when the predictor variables that are not linearly
related (Kutner, Nachtsheim, Neter, & Li, 2005). It is always greater than or equal
to 1. Statistically, it is calculated as the reciprocal of tolerance: 1 / (1 - R2)
(O’brien, 2007). Here, R2 represents the multiple correlation coefficient and
indicates how well the data fits a statistical model. A value of VIF greater than 10
indicates there is problem of multicollinearity (MacKenzie et al., 2011; Petter et
al., 2007). Some authors suggest a more conservative value of VIF greater than
3.3 to conclude that multi collinearity is present or not (Diamantopoulos &
Siguaw, 2006; Petter et al., 2007). In PLS, a VIF value of 5 or higher indicates
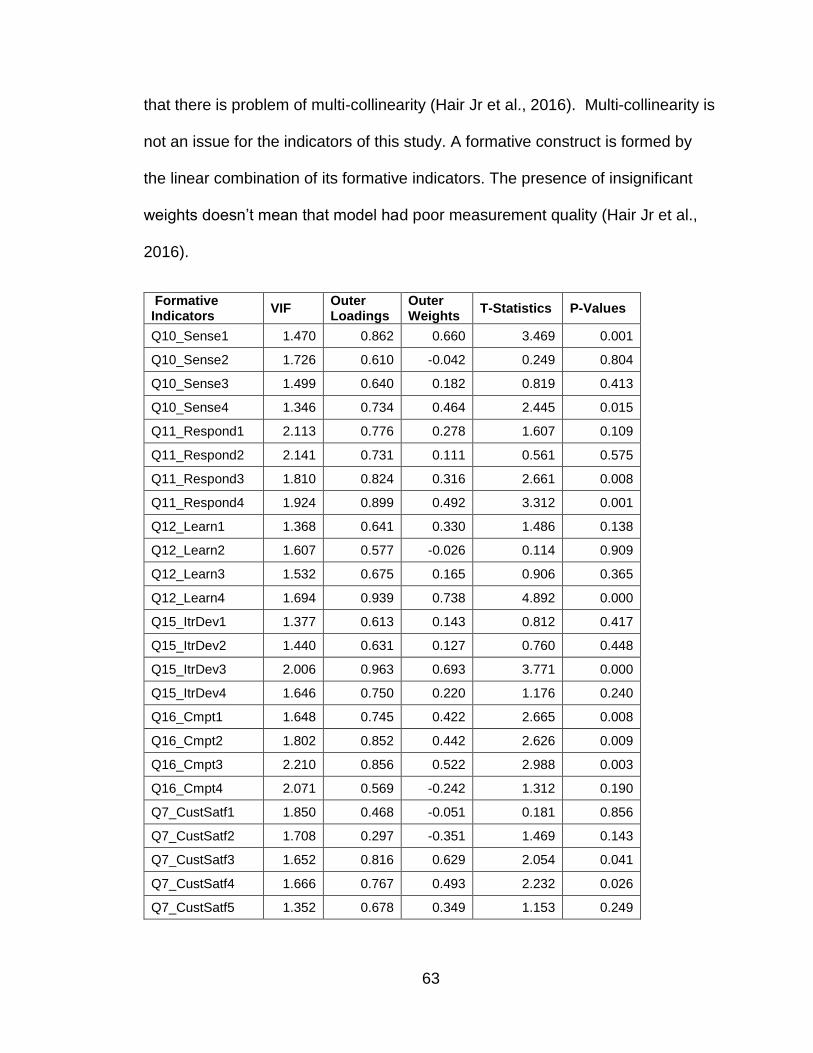
63
that there is problem of multi-collinearity (Hair Jr et al., 2016). Multi-collinearity is
not an issue for the indicators of this study. A formative construct is formed by
the linear combination of its formative indicators. The presence of insignificant
weights doesn’t mean that model had poor measurement quality (Hair Jr et al.,
2016).
Formative Indicators
VIF Outer Loadings
Outer Weights
T-Statistics P-Values
Q10_Sense1 1.470 0.862 0.660 3.469 0.001
Q10_Sense2 1.726 0.610 -0.042 0.249 0.804
Q10_Sense3 1.499 0.640 0.182 0.819 0.413
Q10_Sense4 1.346 0.734 0.464 2.445 0.015
Q11_Respond1 2.113 0.776 0.278 1.607 0.109
Q11_Respond2 2.141 0.731 0.111 0.561 0.575
Q11_Respond3 1.810 0.824 0.316 2.661 0.008
Q11_Respond4 1.924 0.899 0.492 3.312 0.001
Q12_Learn1 1.368 0.641 0.330 1.486 0.138
Q12_Learn2 1.607 0.577 -0.026 0.114 0.909
Q12_Learn3 1.532 0.675 0.165 0.906 0.365
Q12_Learn4 1.694 0.939 0.738 4.892 0.000
Q15_ItrDev1 1.377 0.613 0.143 0.812 0.417
Q15_ItrDev2 1.440 0.631 0.127 0.760 0.448
Q15_ItrDev3 2.006 0.963 0.693 3.771 0.000
Q15_ItrDev4 1.646 0.750 0.220 1.176 0.240
Q16_Cmpt1 1.648 0.745 0.422 2.665 0.008
Q16_Cmpt2 1.802 0.852 0.442 2.626 0.009
Q16_Cmpt3 2.210 0.856 0.522 2.988 0.003
Q16_Cmpt4 2.071 0.569 -0.242 1.312 0.190
Q7_CustSatf1 1.850 0.468 -0.051 0.181 0.856
Q7_CustSatf2 1.708 0.297 -0.351 1.469 0.143
Q7_CustSatf3 1.652 0.816 0.629 2.054 0.041
Q7_CustSatf4 1.666 0.767 0.493 2.232 0.026
Q7_CustSatf5 1.352 0.678 0.349 1.153 0.249

64
Q8_CngSatf1 1.749 0.727 0.157 0.947 0.344
Q8_CngSatf2 1.586 0.672 0.149 0.822 0.412
Q8_CngSatf3 1.558 0.765 0.340 2.284 0.023
Q8_CngSatf4 1.567 0.897 0.586 3.774 0.000
Q9_DvlCap1 1.961 0.826 0.442 2.772 0.006
Q9_DvlCap2 1.596 0.759 0.277 1.681 0.093
Q9_DvlCap3 2.184 0.761 0.079 0.510 0.610
Q9_DvlCap4 1.458 0.801 0.455 2.934 0.004
Table 14: Weights, Loadings and VIF of formative indicators (First Order)
Formative Indicators
VIF Outer Loadings
Outer Weights
T-Statistics
P-Values
Q7_CustSatf1 1.850 0.486 -0.046 0.181 0.857
Q7_CustSatf2 1.708 0.331 -0.313 1.358 0.175
Q7_CustSatf3 1.652 0.856 0.687 3.163 0.002
Q7_CustSatf4 1.666 0.756 0.455 2.870 0.004
Q7_CustSatf5 1.352 0.650 0.298 1.245 0.214
Q8_CngSatf1 1.749 0.728 0.156 1.033 0.302
Q8_CngSatf2 1.586 0.681 0.164 0.974 0.331
Q8_CngSatf3 1.558 0.767 0.341 3.046 0.002
Q8_CngSatf4 1.567 0.893 0.575 4.339 0.000
Q9_DvlCap1 1.961 0.820 0.377 2.649 0.008
Q9_DvlCap2 1.596 0.734 0.218 1.641 0.101
Q9_DvlCap3 2.184 0.822 0.230 1.604 0.109
Q9_DvlCap4 1.458 0.799 0.428 3.183 0.002
Q15_ItrDev1 1.377 0.646 0.181 1.024 0.306
Q15_ItrDev2 1.440 0.690 0.216 1.317 0.189
Q15_ItrDev3 2.006 0.950 0.651 3.578 0.000
Q15_ItrDev4 1.646 0.716 0.161 0.839 0.402
Q16_Cmpt1 1.648 0.753 0.431 2.620 0.009
Q16_Cmpt2 1.802 0.850 0.439 2.470 0.014
Q16_Cmpt3 2.210 0.854 0.512 2.942 0.003

65
Q16_Cmpt4 2.071 0.574 -0.235 1.276 0.203
Respond 1.530 0.923 0.645 3.691 0.000
Sense 1.550 0.728 0.234 1.535 0.125
Learn 1.521 0.756 0.310 2.327 0.020
Table 15: Weights, Loadings and VIF of formative indicators (Second Order)
The insignificant weight of an indicator shows that its contribution to the construct
is relatively insignificant as compared to other indicators. In SmartPLS, outer
loadings show the absolute importance of an indicator. Outer weights show the
relative importance of an indicator in defining a formative construct. Usually, an
indicator with insignificant weight, but with an outer loading greater than 0.5 is
included in the measurement model (Hair Jr et al., 2016). When the outer weight
is insignificant and the outer loading is low, then the researcher can decide to
include or exclude that indicator based on its theoretical importance (Cenfetelli &
Bassellier, 2009; Hair Jr et al., 2016). In this research, formative indicators with
non-significant weights and low loadings (CustSatf1, CustSatf2) were included for
data analysis because they are important for defining the construct. CustSatf1
represents customer satisfaction from functionality of the new systems and
CustSatf2 represents customer satisfaction from the quality of the new systems.
Both these items represent important aspects of customer satisfaction so they
can’t be excluded. Tables 14 and 15 shows the first and second order outer
loadings, outer weights and their significance and VIF of the formative indicators.
66
Discriminant Validity
Discriminant validity means that the indicators of a construct are distinct from the
indicators of other constructs. The indicators of a variable should only influence
the variance of the construct to which they are theoretically or conceptually
related to. When discriminant validity is not established, the indicators can
influence the variance of other variables, which are not theoretically related. In
such cases, it is difficult to conclude whether the results confirming hypothesized
structural paths are real or whether they are a result of statistical discrepancies
(Farrell, 2010). The Fornell-Larcker criterion, examining the cross loadings and
Heterotrait-monotrait ratio (HTMT) are used to establish discriminant validity
(Hair Jr et al., 2016; MacKenzie et al., 2011).
The Fornell-Larcker criterion states that the square root of AVE of any variable
should be more than its correlation with other variables (Fornell & Larcker, 1981).
It indicates that a variable shares more variance with its indicators than with other
variables. The Fornell-Larcker criterion and cross loadings examination do not
reliably detect the lack of discriminant validity (Henseler, Ringle, & Sarstedt,
2015). “Cross loadings fail to indicate a lack of discriminant validity when two
constructs are perfectly correlated, which renders this criterion ineffective for
empirical research. Similarly, the Fornell-Larcker criterion performs poorly,
especially when indicator loadings of the construct under consideration differed
only slightly (e.g., all indicators loadings varied between 0.60 and 0.80)” (Hair Jr
et al., 2016) p118. Table 16 shows the Fornell-Larcker criterion values of the
constructs used in this study. The square root of the AVE of the reflective

67
constructs is less than their correlation will other constructs. All the indicators
load more strongly with indicators of the same construct than with the others, so
there is no issue of cross loading. The cross loadings of the indicators are shown
in appendix (See table A4).
Constructs 1 2 3 4 5 6 7 8 9 10 11
1 Change Satisfaction NA
2 Collaborative Decision Making 0.465 0.825
3 Communication 0.587 0.708 0.809
4 Customer Satisfaction 0.591 0.334 0.430 NA
5 Delivery Capability 0.480 0.486 0.525 0.510 NA
6 Iterative Development 0.369 0.463 0.444 0.386 0.463 NA
7 Learn 0.516 0.383 0.487 0.404 0.397 0.356 NA
8 Respond 0.605 0.610 0.571 0.410 0.515 0.358 0.505 NA
9 Sense 0.462 0.386 0.389 0.366 0.490 0.400 0.515 0.519 NA
10 Team Autonomy 0.416 0.547 0.460 0.337 0.464 0.417 0.339 0.498 0.332 0.806
11 Team Competence 0.413 0.446 0.397 0.326 0.512 0.375 0.353 0.664 0.369 0.511 NA
Table 16: Discriminant Validity- Fornell-Larcker Criterion*
* Square root of AVE in the diagonal for reflective constructs
Heterotrait-monotrait ratio (HTMT) is a new approach for discriminant validity of
constructs with reflective indicators (Henseler et al., 2015). It represents the
mean of all correlations of the indicators across constructs measuring different

68
constructs relative to the geometric mean of the average correlations of
indicators measuring the same constructs (Hair Jr et al., 2016). A HTMT value
lower than the threshold value suggests that discriminant validity is established.
The threshold value suggested for HTMT is 0.90 (Gold & Arvind Malhotra, 2001;
Teo et al., 2008) or 0.85 (Clark & Watson, 1995; Kline, 2015). Table 17 shows
that the Heterotrait-Monotrait Ratio (HTMT) values of the reflective constructs
used in this study are all below the suggested threshold, suggesting adequate
discriminant validity of these reflect constructs.
Reflective Constructs Collaborative Decision Making
Communication Team Autonomy
Collaborative Decision Making
Communication 0.847
Team Autonomy 0.651 0.563
Table 17: Discriminant Validity- Heterotrait-Monotrait Ratio (HTMT) ratio
Structural Model Assessment
The structural model assessment was done after the measurement model was
validated. It tells the relationships between constructs and the overall model’s
predictive capabilities. Unlike covariance-based structural equation modeling,
goodness-of-fit measures like chi-square are not applicable in PLS-SEM (Hair Jr
et al., 2016). In this research model, agility is a second-order hierarchal construct
with first-order formative indicators and second-order formative indicators. The
two-stage approach was used for estimating latent hierarchal variables. This

69
approach is appropriate when the research model has a formative hierarchal
variable at the endogenous position (Ringle, Sarstedt, & Straub, 2012; Becker,
Klein, & Wetzels, 2012). In the two-stage approach, model estimation is done in
two steps. In the first step, latent scores of the lower order constructs are
estimated, which are used as indicators for the higher order construct in the
second step. The latent scores of sense, respond and learn changes were used
as indicators for agility. Structural model assessment includes assessing path
coefficients and their significance, assessment of variance explained (R2 value)
and assessment of effect size (F2 value) (Hair Jr et al., 2016).
Path Coefficients
The path coefficients show the strength of the relationships between various
latent variables. It represents the hypothesized relationships and how latent
variables are related to each other. The standardized scores of path coefficients
lie between -1 and +1. In PLS, a non-parametric bootstrapping procedure is used
to check the significance levels of the path coefficients (Davison & Hinkley, 1997;
Efron & Tibshirani, 1994; Hair Jr et al., 2016). It is helpful when general
assumptions about data such as small sample size and non-normal data are not
met (Davison & Hinkley, 1997). Bootstrapping uses a given sample to make
inference about the population characteristics and doesn’t make any
assumptions about the distribution of the parameters (Sharma & Kim, 2013). In
this procedure, a large number of samples are taken from the original data with a
replacement for estimating parameters (Hair Jr et al., 2016).

70
Figure 2: Path Coefficients and their significance (P-value)
The PLS bootstrap procedure is more accurate and efficient for estimating
parameters than other bootstrap procedures (e.g. Maximum Likelihood) for
smaller sample sizes (e.g. less than 200) (Sharma & Kim, 2013). The
bootstrapping procedure provides a good approximation of the sampling
distribution of the parameters when sample data is a good representation of the
actual population. The number of samples used for bootstrapping should be
more than the number of observations in the given sample (e.g. 160) (Hair Jr et
al., 2016). In this study, the bootstrapping procedure was done with 500 samples.

71
Paths Original Sample (O)
Sample Mean (M)
Standard Deviation (STDEV)
T-Statistics (|O/STDEV|)
P-Values
Agility -> Change Satisfaction
0.579 0.573 0.090 6.441 0.000
Agility -> Customer Satisfaction
0.006 0.037 0.142 0.039 0.969
Change Satisfaction -> Customer Satisfaction
0.471 0.488 0.151 3.120 0.002
Collaborative DecisionMaking -> Agility
0.248 0.239 0.106 2.348 0.019
Collaborative DecisionMaking -> DeliveryCapability
0.152 0.145 0.111 1.371 0.171
Communication -> Agility 0.244 0.242 0.107 2.293 0.022
Communication -> DeliveryCapability
0.307 0.321 0.113 2.722 0.007
DeliveryCapability -> Agility
0.308 0.306 0.089 3.474 0.001
DeliveryCapability -> Change Satisfaction
0.136 0.167 0.113 1.198 0.232
DeliveryCapability -> Customer Satisfaction
0.262 0.237 0.149 1.760 0.079
Iterative Development -> Agility
0.065 0.089 0.094 0.693 0.489
Iterative Development -> DeliveryCapability
0.259 0.261 0.089 2.923 0.004
TeamAutonomy -> Collaborative DecisionMaking
0.433 0.431 0.072 5.985 0.000
TeamAutonomy -> Communication
0.348 0.343 0.082 4.228 0.000
TeamAutonomy -> Iterative Development
0.310 0.305 0.088 3.543 0.000
TeamCompetence -> Collaborative DecisionMaking
0.224 0.235 0.078 2.885 0.004
TeamCompetence -> Communication
0.218 0.239 0.096 2.274 0.023
TeamCompetence -> Iterative Development
0.226 0.257 0.095 2.384 0.017
Table 18: Path Coefficients and their significance
The estimates obtained by using each sample is used to create an approximation
of the sampling distribution of the parameters (Hair Jr et al., 2016; Sharma &
Kim, 2013). This sampling distribution is then used to determine the standard
errors and the standard deviations of the estimated coefficients. The t-statistics

72
and p-values are then obtained using these standard errors. The path
coefficients with p-values below 0.05 are considered significant. For example,
path coefficient between agility and change satisfaction is significant, which
indicates that agility has a significant relationship with change satisfaction. Table
18 and figure 2 show the path coefficients between the various latent variables
and their significance levels. The table shows path coefficient values from the
original sample (O), the mean value of path coefficients from a bootstrap sample
(M), their standard deviations (STDEV), t- statistics, and p-values.
Coefficient of Determination (R2)
The coefficient of determination (R2) is used as a measure to evaluate the
structural model and represents the predictive strength of the model. It shows the
exogenous latent construct’s total effects on the endogenous latent construct and
the amount of variance in the endogenous constructs that is explained by all
exogenous constructs (Hair Jr et al., 2016). It is “squared correlation between a
specific endogenous construct’s actual and predicted values” (Hair Jr et al.,
2016, p198). R2 can have a value from 0 to 1. PLS- SEM focuses on maximizing
the variance explained (R2 Value) of the endogenous variable by the exogenous
variables. R2 Value of 0.25, 0.50 and 0.75 are considered as weak, moderate
and substantial respectively (Hair Jr et al., 2016; Henseler, Ringle, & Sinkovics,
2009). A higher value indicates that the independent variables can explain the
dependent variables with a greater level of accuracy. Higher R2 values shouldn’t
be considered as the key parameter to select the structural model. In complex

73
models, the addition of more independent variables (insignificant) can inflate the
R2 value of the model, but it is not good for the parsimony of the structural model
(Hair Jr et al., 2016). R2 adjusted value can be used to avoid this issue in
complex structural models. It adjusts the value of R2 based on sample size and
the number of independent variables to reduce the effect of insignificant
independent variables on the model (Hair Jr et al., 2016).Table 19 shows the R-
square and R-square adjusted values of the structural models.
Endogenous Constructs R-Square R-Square Adjusted
Agility 0.507 0.494
Change Satisfaction 0.446 0.439
Collaborative Decision Making 0.337 0.329
Communication 0.247 0.237
Customer Satisfaction 0.413 0.402
Delivery Capability 0.356 0.344
Iterative Development 0.219 0.209
Table 19: R-Square and R-Square adjusted values
Effect Size (F2)
The effect size (F2) estimates the effect of any exogenous construct in explaining
the endogenous variable. More specifically, it allows the estimation of the
contribution of an exogenous variable in explaining the variance (R2 value) of an
endogenous variable. It indicates the impact on the R2 value of an endogenous
variable if a specific exogenous construct is removed (Hair Jr et al., 2016). For
example, the first row (Agility -> Change Satisfaction) of Table 20 indicates the
impact of removing agility on change satisfaction.

74
F Square T Statistics P Values
Agility -> Change Satisfaction 0.396 2.417 0.016
Agility -> Customer Satisfaction 0.000 0.001 0.999
Change Satisfaction -> Customer Satisfaction 0.209 1.182 0.238
Collaborative DecisionMaking -> Agility 0.057 0.906 0.365
Collaborative DecisionMaking -> DeliveryCapability 0.017 0.586 0.558
Communication -> Agility 0.055 1.025 0.306
Communication -> DeliveryCapability 0.071 1.219 0.223
DeliveryCapability -> Agility 0.123 1.427 0.154
DeliveryCapability -> Change Satisfaction 0.022 0.372 0.710
DeliveryCapability -> Customer Satisfaction 0.075 0.687 0.493
Iterative Development -> Agility 0.006 0.197 0.844
Iterative Development -> DeliveryCapability 0.079 1.251 0.211
TeamAutonomy -> Collaborative DecisionMaking 0.209 2.484 0.013
TeamAutonomy -> Communication 0.119 1.641 0.101
TeamAutonomy -> Iterative Development 0.091 1.564 0.118
TeamCompetence -> Collaborative DecisionMaking 0.056 1.214 0.226
TeamCompetence -> Communication 0.047 0.834 0.405
TeamCompetence -> Iterative Development 0.048 0.893 0.372
Table 20: F-Square Values
F2 values of 0.02, 0.15 and 0.35 are considered as small, medium, and large
respectively (Cohen, 1988). F2 values of less than 0.02 indicates that there is no
effect of exogenous variable on endogenous variable.
F2 = (R2 included - R2
excluded) / (1- R2 included)
R2 included = R2 value when an exogenous variable is included
R2 excluded = R2 value when an exogenous variable is excluded

75
Indirect Effects
The PLS-SEM technique is used to understand the cause and effect relationship
among independent and dependent variables. In some cases, the relationship
between an independent variable and a dependent variable depends on other
variables that cause intervention between the independent variable and the
dependent variable. Such variables are referred to as mediator variables. The
relationships of a mediator variable with the independent and the dependent
variables determine the relationship between independent and dependent
variables, so it is important to check the mediating effects in PLS path models.
Traditionally, Sobel test is used to check mediating effects. The Sobel test is not
suitable for testing mediating effects in PLS-SEM because it assumes normality
of data, so it is not appropriate for non-parametric methods like PLS-SEM
(Preacher & Hayes, 2004; Sattler, Völckner, Riediger, & Ringle, 2010). If indirect
effects are significant, then there is mediation effect in PLS (Hair Jr et al., 2016;
Hayes, 2013). In PLS-SEM, the bootstrapping procedure can be used to check
the significance of indirect effects. For this study, bootstrapping was done with
five hundred samples to check the significance of indirect effects. Table 21.1
shows the complete details about the individual indirect effects and their
significance between the various variables of this study. The table shows the
individual mediation paths between variables. For example, the first row shows
the mediation effect of Communication on the relationship between Team
autonomy and Delivery capability. The Original sample (O) value shows the
indirect effect value from the original data sample, whereas, Sample mean (M)

76
value shows the average of the indirect effect obtained from five hundred
bootstrap data samples. The standard error represents the standard deviation of
the indirect effects obtained from the bootstrap samples. These standard errors
are used to calculate T-statistics and P-values. The indirect effects with P-values
less than 0.05 are considered significant. The individual indirect effect shows an
interesting relationship between variables. These results of mediation of process
variables on the relationship between team autonomy and agility show that
various process variables have different mediating effects. Between team
autonomy and agility, the mediation effect of collaborative decision making
(0.107, p< 0.05) is significant, communication (0.085, p=0.06) is marginally
significant, and iterative development is not significant. Similarly, between team
autonomy and delivery capability, the mediation effects of communication (0.107,
p< 0.05) and iterative development (0.080, p<0.05 are significant, but the
mediation effect of collaborative decision making is insignificant. Table 21.2
shows the total effects of all the mediators and their significance levels between
variables. For example, the first row presents the total effects of two mediators
(e.g. agility and deliver capability) between collaborative decision making and
change satisfaction. These total effects bring very interesting insights about the
relationships between these variables in agile software development. In this
study, the effects of antecedent variables on delivery capability and agility are
mediated by process variables. Both the antecedent variables team autonomy
(0.291, p<0.01) and team competence (0.173, p<0.01) have significant indirect
effects on agility.

77
Individual Indirect Paths
Original Sample (O)
Sample Mean (M)
Standard Error (STERR)
T Statistics (|O/STERR|) P Values
TeamAutonomy -> Communication-> DeliveryCapability 0.107 0.110 0.046 2.314 0.021
TeamAutonomy -> Collaborative DecisionMaking -> DeliveryCapability 0.066 0.063 0.051 1.308 0.191
TeamAutonomy -> Iterative Development -> DeliveryCapability 0.080 0.080 0.036 2.221 0.027
TeamAutonomy -> Communication-> Agility
0.085 0.084 0.046 1.838 0.067
TeamAutonomy -> Collaborative DecisionMaking -> Agility 0.107 0.103 0.050 2.144 0.032
TeamAutonomy -> Iterative Development -> Agility 0.020 0.025 0.030 0.679 0.498
TeamCompetence -> Communication-> DeliveryCapability 0.067 0.082 0.049 1.354 0.176
TeamCompetence -> Collaborative DecisionMaking -> DeliveryCapability 0.034 0.034 0.030 1.134 0.257
TeamCompetence -> Iterative Development -> DeliveryCapability 0.080 0.071 0.041 1.962 0.050
TeamCompetence -> Communication-> Agility
0.053 0.060 0.039 1.356 0.176
TeamCompetence -> Collaborative DecisionMaking -> Agility 0.056 0.058 0.036 1.537 0.125
TeamCompetence -> Iterative Development -> Agility 0.015 0.026 0.028 0.517 0.605
Communication -> DeliveryCapability-> CustomerSatisfaction 0.080 0.078 0.061 1.310 0.191
Communication -> DeliveryCapability-> ChangeSatisfaction 0.042 0.058 0.046 0.908 0.364
Communication -> Agility-> CustomerSatisfaction 0.001 0.009 0.036 0.037 0.970
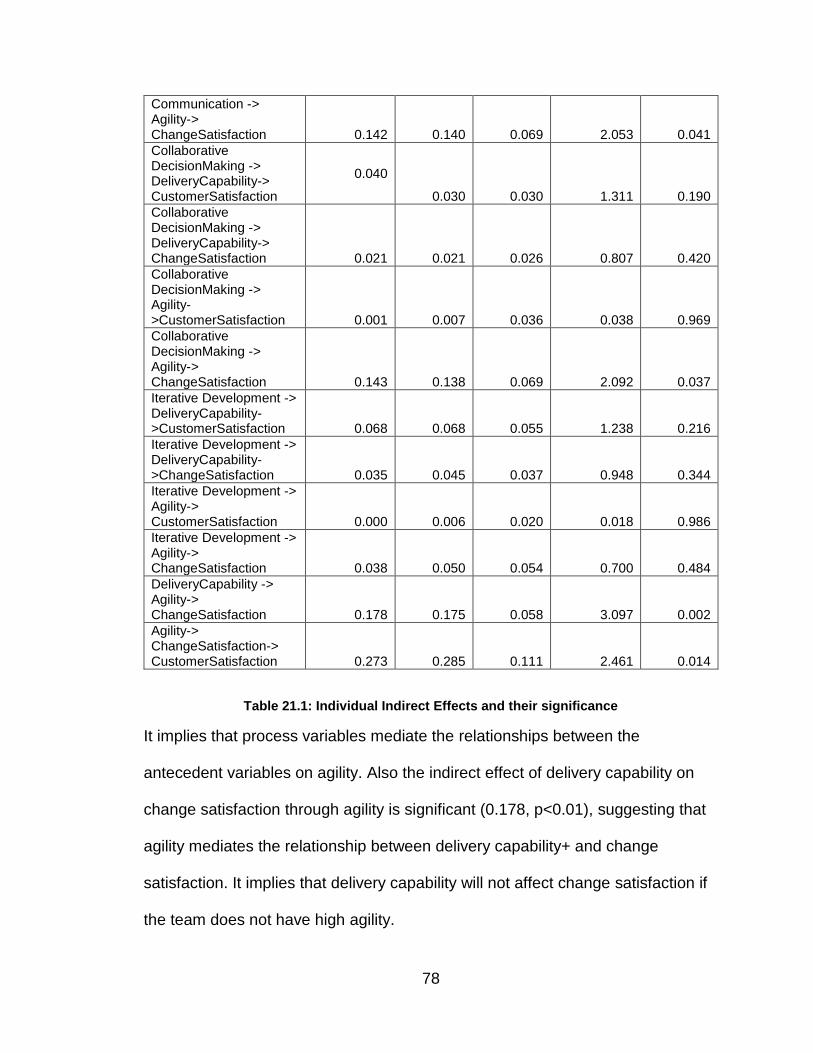
78
Communication -> Agility-> ChangeSatisfaction 0.142 0.140 0.069 2.053 0.041
Collaborative DecisionMaking -> DeliveryCapability-> CustomerSatisfaction
0.040
0.030 0.030 1.311 0.190
Collaborative DecisionMaking -> DeliveryCapability-> ChangeSatisfaction 0.021 0.021 0.026 0.807 0.420
Collaborative DecisionMaking -> Agility->CustomerSatisfaction 0.001 0.007 0.036 0.038 0.969
Collaborative DecisionMaking -> Agility-> ChangeSatisfaction 0.143 0.138 0.069 2.092 0.037
Iterative Development -> DeliveryCapability->CustomerSatisfaction 0.068 0.068 0.055 1.238 0.216
Iterative Development -> DeliveryCapability->ChangeSatisfaction 0.035 0.045 0.037 0.948 0.344
Iterative Development -> Agility-> CustomerSatisfaction 0.000 0.006 0.020 0.018 0.986
Iterative Development -> Agility-> ChangeSatisfaction 0.038 0.050 0.054 0.700 0.484
DeliveryCapability -> Agility-> ChangeSatisfaction 0.178 0.175 0.058 3.097 0.002
Agility-> ChangeSatisfaction-> CustomerSatisfaction 0.273 0.285 0.111 2.461 0.014
Table 21.1: Individual Indirect Effects and their significance
It implies that process variables mediate the relationships between the
antecedent variables on agility. Also the indirect effect of delivery capability on
change satisfaction through agility is significant (0.178, p<0.01), suggesting that
agility mediates the relationship between delivery capability+ and change
satisfaction. It implies that delivery capability will not affect change satisfaction if
the team does not have high agility.

79
Original Sample (O)
Sample Mean (M)
Standard Deviation (STDEV)
T Statistics (|O/STDEV|)
P Values
Collaborative DecisionMaking -> Change Satisfaction
0.191 0.185 0.073 2.631 0.009
Collaborative DecisionMaking -> Customer Satisfaction
0.132 0.132 0.068 1.949 0.052
Communication -> Agility 0.094 0.097 0.044 2.142 0.033
Communication -> Change Satisfaction
0.238 0.253 0.074 3.214 0.001
Communication -> Customer Satisfaction
0.194 0.213 0.078 2.497 0.013
DeliveryCapability -> Change Satisfaction
0.178 0.175 0.057 3.100 0.002
DeliveryCapability -> Customer Satisfaction
0.150 0.172 0.060 2.494 0.013
Iterative Development -> Agility
0.080 0.078 0.033 2.434 0.015
Iterative Development -> Change Satisfaction
0.119 0.140 0.065 1.832 0.068
Iterative Development -> Customer Satisfaction
0.125 0.142 0.071 1.761 0.079
TeamAutonomy -> Agility 0.291 0.289 0.054 5.376 0.000
TeamAutonomy -> Change Satisfaction
0.203 0.209 0.045 4.513 0.000
TeamAutonomy -> Customer Satisfaction
0.164 0.174 0.055 2.986 0.003
TeamAutonomy -> DeliveryCapability
0.253 0.253 0.053 4.765 0.000
TeamCompetence -> Agility 0.173 0.199 0.055 3.111 0.002
TeamCompetence -> Change Satisfaction
0.122 0.147 0.045 2.711 0.007

80
TeamCompetence -> Customer Satisfaction
0.100 0.125 0.048 2.069 0.039
TeamCompetence -> DeliveryCapability
0.160 0.187 0.053 3.028 0.003
Agility -> Customer Satisfaction
0.273 0.285 0.111 2.464 0.014
Collaborative DecisionMaking -> Agility
0.047 0.045 0.039 1.200 0.231
Table 21.2: Total Indirect Effects and their significance

81
CHAPTER 6
DISCUSSION
Discussion and Implications
One of the key objectives of this study was to test empirically the complex
relationships among key variables related to agile software development. This
study identified the relationships between antecedent variables (team autonomy,
team competence), process variables (iterative development, communication,
collaborative decision-making), delivery capability, agility and project outcomes
(change satisfaction, customer satisfaction). This model explained 24.7%
variance in communication, 33.7% in collaborative decision making, 21.9% in
iterative development, 35% in delivery capability, 50% in agility, 44% in change
satisfaction and 41% in customer satisfaction. The survey data analysis showed
support for thirteen of the eighteen hypotheses. Table 22 shows the hypothesis
testing results.
As hypothesized, both antecedent variables significantly affect process variables.
This implies that antecedent factors like team autonomy affect key processes in
agile software development, such as collaborative decision-making,
communication and iterative development which in turn are important facilitators
for achieving agility and delivery capability. Team autonomy is an important
factor for agile software development (Maruping et al., 2009) and the results of
this study support that. It decentralizes the decision-making process and
provides control of the decision-making to project team members (IT and

82
Business teams) (Lee & Xia, 2010). The empowerment of teams is related to
software development agility (Sheffield & Lemétayer, 2013).
Hypothesis Results
H1: Team autonomy positively influences communication. Supported
H2: Team autonomy positively influences collaborative decision-making. Supported
H3: Team autonomy positively influences iterative development. Supported
H4: Team competence positively influences communication. Supported
H5: Team competence positively influences collaborative decision-making. Supported
H6: Team competence positively influences iterative development. Supported
H7: Collaborative decision making positively influences delivery capability. Not Supported
H8: Collaborative decision making positively influences agility. Supported
H9: Communication positively influences delivery capability. Supported
H10: Communication positively influences agility. Supported
H11: Iterative development process positively influences delivery capability. Supported
H12: Iterative development process positively influences agility. Not Supported
H13: Delivery capability positively influences agility. Supported
H14: Delivery capability positively influences customer satisfaction. Marginally
Supported
H15: Delivery capability positively influences change satisfaction. Not Supported
H16: Agility positively influences customer satisfaction. Not Supported
H17: Agility positively influences change satisfaction. Supported
H18: Change satisfaction positively influences customer satisfaction. Supported
Table 22: Hypothesis Testing Results

83
The decision-making in agile team is impacted by the empowerment of team
members (Drury-Grogan & O'dwyer, 2013). The results of this study are
consistent with existing studies which state that team autonomy contributes to
agility (Lee & Xia, 2010; Sheffield & Lemétayer, 2013; Vidgen & Wang, 2009).
Existing studies have conceptualized team autonomy as a factor that directly
affects agility. In this study, team autonomy is hypothesized as an antecedent
factor that doesn’t affect agility and delivery capability directly, but directly affects
the agile processes that facilitates agility and delivery capability. The PLS results
show that the indirect effect of team autonomy on delivery capability through
process variables is significant (0.253, p<0.01). Also, the indirect effect of team
autonomy on agility through process variables is significant (0.291, p<0.01). It
indicates that the effects of team autonomy on delivery capability and agility are
mediated by agile processes such as communication, collaborative decision-
making and iterative development. The reason for these mediation effects are
that team autonomy is necessary for creating a suitable environment for agile
software development. It alone can’t facilitate delivery capability and agility. In
autonomous teams, members collaborate to use their collective knowledge and
skills to find solutions to given problems (Nerur & Balijepally, 2007; Vidgen &
Wang, 2009). They have more freedom to voice their opinions in planning and
executing various project activities that facilitate communication. Such teams
have authority to estimate, plan and coordinate their work (Batra et al., 2016),
which helps in the successful delivery of work in small iterations. Based on the

84
status of ongoing work, team members can coordinate to deliver on time. Team
autonomy empowers the team to make decisions related to their work in order to
get the best results. It helps in building an environment, where IT and Business
team members can carry out agile processes in an effective and efficient manner
with high levels of delivery capability and agility.
One other important environment or antecedent factor is team competence. The
analysis results show that team competence (technical competence, business
competence, interpersonal skills and problem-solving skills) is significantly
related to communication (0.218, p<0.05), collaborative decision-making (0.310,
p<0.01), and iterative development (0.226, p<0.05). In the software development
literature, these skills are considered to be important and fundamental for a
software development project (McLeod & MacDonell, 2011; Siau, Long, et al.,
2010). Without these competencies, it would not be possible for team members
to deliver solutions to meet the customer’s requirements. In the literature,
competencies are conceptualized as a direct enabler of agility (Eshlaghy,
Mashayekhi, Rajabzadeh, & Razavian, 2010). In this study, it is argued that
competence doesn’t enable agility directly, but it enables agile processes
(communication, collaborative decision-making, iterative development) which in
turn facilitate agility. The results support this. The indirect effects of team
competence, through process variables, on delivery capability (0.160, p<0.01)
and agility (0.173, p<0.01) are significant. The reason for this mediation effect is
that team competence provides skills that are necessary for the project. IT and

85
Business team members need to use their skills effectively in these agile
processes for project success. If IT and Business team members have
appropriate skills, but they are not able to use them effectively then merely
having competence will be of no real value for the project success. For example,
communication skills can’t contribute to delivery capability or agility, if team
members don’t use these skills to communicate effectively during the project to
create a shared understanding among stakeholders about the project activities.
Similarly, technical and business skills need to be used properly to make better
decisions during the project. Li et. al (2010) state that business and technical
skills and experiences of stakeholders (e.g. developers, users/ customers) help
in making right decisions in reacting to new situations. Team members’
capabilities and skills help in making better decisions related to estimating task in
the project (Drury & McHugh, 2011). These results provide a better
conceptualization of the relationship between competency and agility. Similar to
team autonomy, team competency is necessary, but not sufficient to have
delivery capability and agility.
A close collaboration between IT and Business teams is necessary to understand
requirements and enhance agility (Sarker & Sarker, 2009). This study’s results
show that collaborative decision-making significantly affects (0.248, p<0.05)
agility, but not delivery capability. This relationship implies that IT-business
collaboration is required when agility is needed to deal with various changes in
the project. It may not be required when team members are working on delivering

86
planned requirements because they already have planned tasks. Effective
collaboration is important when there are changes in the project (Maruping et al.,
2009). The IT and Business team members need to collaborate to develop a
shared understanding of planning and executing various changes during the
project. User (e.g. customer) involvement helps in anticipating technical and
business changes (Barki & Hartwick, 1989; Li et al., 2010), which is an important
dimension of agility. The practices for IT-Business collaboration such as having
customers onsite helps in achieving agility (Conboy, 2009). The results of this
study are consistent with the literature findings that collaborative decision-making
contributes to agility. Customer collaboration is critical in agile projects (Chow &
Cao, 2008). The findings of this research provide quantitative support that
collaboration is important. Interestingly, communication is related more strongly
to agility and delivery capability than to collaborative decision-making. It implies
that the interplay between these agile processes leads to delivery capability and
agility and hence project success.
Communication has significant effects on delivery capability (0.307, p<0.01) and
agility (0.244, p<0.05). It implies that IT and Business teams need to
communicate effectively to deliver on time and to deal with various changes in an
effective and efficient manner. Communication helps in creating a shared
understanding about user requirements, planning and execution of various
project activities and about the resources required for the success of the project.
Conboy (2009) mentioned that communication mechanisms like stand-up

87
meetings contribute to agility when used effectively. Communication with
stakeholders helps team members anticipate technical and business changes
(Barki & Hartwick, 1989; Li et al., 2010), which is an important dimension of
agility. Communication can be a challenge in distributed agile teams and can
hinder the success of the project (Hossain et al., 2009). In a distributed
environment, seamless communication among team members helps in achieving
agility (Sarker & Sarker, 2009). A qualitative study found that the maturity of agile
teams depends on communication and collaboration (Fontana et al., 2014). The
results of this research provide quantitative support to these findings. Existing
studies have qualitatively examined the role of communication and claimed that
communication helps in achieving agility. The results of this study quantitatively
affirm that communication helps in achieving agility and delivery capability.
Frequent and short releases help in accommodating constantly changing
requirements (Meso & Jain, 2006), so it facilitates agility. A few studies from the
literature state that delivering in short iteration helps in having agility in
information systems development (Lyytinen & Rose, 2006; Vidgen & Wang,
2009). Interestingly, the results of this study present new insights about the
relationship between iterative development and agility in software development.
These results show that iterative development has a significant effect (0.259,
p<0.01) on delivery capability, but not on agility; and delivery capability has a
significant effect (0.308, p<0.01) on agility. Also, the indirect effect of iterative
development on agility through delivery capability is significant (0.08, p<0.5). This
88
means that delivery capability mediates the relationship between iterative
development and agility. Iterative development contributes to delivery capability,
which in turn contributes to agility. This implies delivery capability complements
agility (Rathor, Batra, & Xia, 2016). If team members don’t have delivery
capabilities, then they can’t have agility to deal with various changes during the
project. A delivery strategy and team capability are critical for a project’s success
in agile projects (Chow & Cao, 2008). While the results of this study support
these findings in the literature, they provide additional insights that delivery
strategy doesn’t affect project outcomes directly. The effect of delivery strategy
(e.g. iterative delivery) on project success (e.g. customer satisfaction) is
mediated by delivery capability. It implies that delivery strategy contributes to
delivery capability, which further contributes to project success.
The results of this study help in quantitatively understanding the distinction
between delivery capability and agility, which are two types of capabilities that
have not been well studied in the literature. As hypothesized, delivery capability
has a significant (0.308, p< 0.01) effect on agility, which shows that delivery
capability complements agility. It implies that the routine capability of the team
helps team members develop the capability in dealing with changes. Delivery
capability has a significant effect (0.262, p=0.07) on customer satisfaction, but
doesn’t have a significant effect on change satisfaction. The indirect effect of
delivery capability on change satisfaction through agility is significant (0.178,
p<0.01). It implies that the routine capabilities of the team (e.g. delivery

89
capability) have a direct relationship with customer satisfaction. A capable team
can deliver given requirements as per customer’s expectations that enhance
customer satisfaction. If team members don’t have this basic capability to deliver
given tasks, then they will not be able to fulfill the customer’s expectations about
the new system. The result shows that agility mediates the relationship between
delivery capability and change satisfaction. This mediation relationship suggests
that agility and delivery capability are distinct capabilities. Delivery capability is
not associated with dealing with changes. Unlike delivery capability, agility is the
ability to sense, respond and learn from changes, so it is directly related to
change satisfaction.
Customer satisfaction and value are the main focus of agile software
development. A quantitative study showed that use of agile practices/ processes
impacts customer satisfaction (Serrador & Pinto, 2015). The results of this study
support the results from earlier studies that agile practices impact customer
satisfaction with some additional conceptual insights. This study’s results show
that agile processes don’t directly affect project outcomes, rather, they enable
emergent capabilities (e.g. delivery capability and agility), which in turn impact
customer satisfaction. Agility significantly (0.579, p<0.01) affects change
satisfaction, and its indirect effect on customer satisfaction through change
satisfaction is also significant (0.273, p<0.05). Also, change satisfaction is
significantly (0.471, p<0.05) related to customer satisfaction. These results show
that the effect of agility on customer satisfaction is mediated by change

90
satisfaction. This mediation effect occurs because agility is the ability to deal with
changes so it has a direct relationship with change satisfaction. Overall customer
satisfaction doesn’t just represent customer’s expectations about the way
changes were taken care of during the project, but also the way other given
requirements were delivered. Because of this reason, agility doesn’t have a
significant relationship with overall customer satisfaction. Agile projects can have
many changes, especially user requirement changes. The way these changes
were managed during the project contributed to overall customer satisfaction.
In this study, agility is conceptualized as a second-order variable with three first-
order factors or dimensions. The results show that all three dimensions are
important for defining agility. Communication and collaborative decision-making
significantly affect agility, which implies that agility is a dynamic capability
resulted from effective collaboration and communication between the IT and the
Business teams. It shows that agility is the outcome of these agile processes and
validates the dynamic nature of agility. Without focusing on these processes,
teams can’t have agility that is required to deal with changes occurred during the
project.
For agile practices, context and environment factors are important, so practices
need to be tailored accordingly (Fitzgerald, Hartnett, & Conboy, 2006). The
results of this study support that premise that contextual factors such as team
autonomy, and process factors such as communication and collaborative
decision-making, are important for project success. IT practitioners need to focus

91
on these factors in their project context to have agility and delivery capability for
better project outcomes. According to a study by Fitzgerald et al. (2006),
technical factors such as competence and iterative development are important
for agile projects. The results of this study are consistent with Fitzgerald et al.
(2006) and provide additional insights. The results show that technical factors are
important, but organizational factors (e.g. team autonomy) and behavioral factors
(e.g. communication and collaborative decision making) are also important.
Usually, team members and managers focus more on technical factors, and non-
technical factors are not considered as important. The results of this study imply
that IT practitioners should focus on non-technical factors as well as technical
factors in order to enhance delivery capability and agility in the agile projects.
Another contextual factor that is important for agile project is the size of the
project. Agile methods are considered to be more suitable for small software
development projects than for large software projects (Cohen, Lindvall, & Costa,
2004; Dyba & Dingsoyr, 2008). The total number of IT and Business team
members is a good indicator of project size. Team size can influence the project
outcomes (McLeod & MacDonell, 2011). In this study, more than 33% of the
survey respondents were working on projects that have a total of members more
than twenty people; such projects can’t be considered small projects. The results
of this study show that these factors are generic regardless of the project size.
This study statistically tested a comprehensive model of key variables related to
agile software development to unearth the complex relationship among these

92
variables. The results of this study show that antecedent variables (team
competence, team autonomy) are necessary for creating a conducive
environment for agile software development, but they are not sufficient to have
agility and delivery capability in the project. The IT and Business team members
need to also focus on process variables (communication, collaborative decision-
making, iterative development) for having agility in the project. The delivery
capability of the team is necessary for agility. If IT and Business teams don’t
have delivery capability, then they may not have the bases for having agility
which is a higher order capability than delivery capability. These results explain
the intricacies of the relationships among these key variables and provide a
theoretical rationale behind using agile practices in projects where changes are
expected. The PLS analysis results of this study show interesting results and
present a better conceptual clarity about the agile software development. The
conceptual insights drawn from these results in this study will help IT
practitioners have a better understanding of agile processes and their
relationship with project outcomes.
Limitations and Future Research
This research had a few limitations. First, in this study the project outcomes were
considered in terms of customer satisfaction only. It represented just one aspect
of project outcomes. Future studies may consider software quality, business
value, project time and cost as additional outcome variables.

93
Second, most of the respondents of the survey were from IT teams. The
responses about project outcomes (e.g., customer satisfaction, change
satisfaction) were collected mainly from an IT team’s perspective. Survey
responses represent IT team members’ perceptions about project outcomes.
Actual users or customers didn’t provide assessment for project outcomes.
Third, the research model for this study is complex, so some of the important
antecedent variables such as organizational culture was not included in this
model. Future studies may include other antecedent variables such as
organizational and team culture. It is important to investigate how these variables
facilitate or inhibit the adoption and utilization of agile processes.
Future studies can study agility from other perspectives and find out its
relationship with other outcome variables such as business value, quality. Also,
future studies can examine the tradeoffs between team delivery capability and
agility, and their effects on project efficiency (time, cost) and project effectiveness
(customer satisfaction, business value).
Contributions
This research makes several contributions relevant to both IS research and IS
practice. First, this study explained the agile environment and agile processes
that facilitate agility and delivery capability in the agile projects. For IS
practitioners, it is important to focus on these antecedent and process factors in
order to enhance agility in their projects, because they need agility to deal with
various kinds of changes in the project. This study will guide them in focusing on
94
tailoring the processes so that they can have agility in their software development
process.
Second, this study contributes to IS literature by developing new empirical
measures for a few key variables (e.g. agility) related to agile software
development methodology. Previous studies have called for developing
measures for important variables like agility (Abrahamsson et al., 2009; Conboy,
2009) and empirically understanding what constitutes agility (Wendler, 2013).
Empirical indicators are important for quantitatively studying the relationships
between agility and other variables. Without empirical measures, it is difficult to
understand the multi-facet nature of agility and its relationships with other
variables.
Third, this study quantitatively analyzed a comprehensive model that includes
key antecedent variables, process variables, agility and outcome variables. It
covers most of the key aspects of agile principles and values. A literature search
could not identify a study that has presented important variables of agile
methodology in such a comprehensive way. A comprehensive model provides a
better conceptual clarity about the various variables and their relationships.
Fourth, this research quantitatively studied the relationships among constructs
which are shown to be mediated by other constructs. Thus, the results suggest
that the relationships among key agile variables are more complex than the direct
effects that have been portrayed in the literature. Specifically, process variables
mediated the relationships between antecedent variables and delivery capability

95
and agility. Also, agility mediated the relationship between delivery capability and
change satisfaction.
Fifth, in the agile literature, there are not enough empirical studies to show that
agile methodologies work well in large software development projects. More than
thirty-three percent of the survey respondents were working on software projects
involving teams of more than twenty members; such projects can be considered
fairly large. This research shows that agile methods also work well in large
software development projects.
Finally, the empirical investigation of the relationships among these variables
helps in having a better conceptual understanding of the practices in agile
projects. Better conceptual understanding helps in understanding the theoretical
rationale behind agile software development. The lack of theoretical glue behind
agile practices is a key shortcoming (Abrahamsson et al., 2009; Conboy, 2009).
This study represents one step forward towards understanding the theoretical
underpinnings of agile software development.

96
REFERENCES
Abbas, N., Gravell, A. M., & Wills, G. B. (2010). Using factor analysis to generate clusters of agile practices (a guide for agile process improvement). Paper presented at the Agile Conference (AGILE).
Abrahamsson, P. (2002). Agile Software Development Methods: Review and
Analysis. Oulu, Finland: Booksurge Publishing. Abrahamsson, P., Conboy, K., & Wang, X. (2009). “Lots done, more to do”: the
current state of agile systems development research. European Journal of Information Systems, 281-284.
Abrahamsson, P., Warsta, J., Siponen, M. T., & Ronkainen, J. (2003). New
directions on agile methods: a comparative analysis. Paper presented at the 25th International Conference on Software Engineering, Portland, OR, USA
AgileAlliance. (2016). What is Agile?, from
https://www.agilealliance.org/agile101/what-is-agile/ Alzoubi, Y. I., & Gill, A. Q. (2014). Agile global software development
communication challenges: A systematic review. Paper presented at the Pacific Asia Conference on Information Systems (PACIS), Chengdu, China.
Atkinson, R. (1999). Project management: cost, time and quality, two best
guesses and a phenomenon, its time to accept other success criteria. International Journal of Project Management, 17(6), 337-342.
Babb, J., & Keith, M. (2011). Co-creating value in systems development: A shift
towards service-dominant logic. Paper presented at the Conference for Information Systems Applied Research (CONISAR), Wilmington North Carolina, USA.
Bakalova, Z. G. (2014). Towards understanding the value-creation in agile
projects. Enschede. Retrieved from http://doc.utwente.nl/89650/ Balijepally, V., DeHondt, J., Sugumaran, V., & Nerur, S. (2014). Value
Proposition of Agility in Software Development–An Empirical Investigation. Paper presented at the 20th Americas Conference on Information Systems, Savannah, Georgia, USA.

97
Barki, H., & Hartwick, J. (1989). Rethinking the concept of user involvement. MIS quarterly, 53-63.
Barki, H., & Suzanne Rivard, J. T. (2001). An integrative contingency model of
software project risk management. Journal of Management Information Systems, 17(4), 37-69.
Baskerville, R., Pries-Heje, J., & Madsen, S. (2011). Post-agility: What follows a
decade of agility? Information and Software Technology, 53(5), 543-555. Batra, D., Xia, W., & Rathor, S. (2016). Agility Facilitators for Contemporary
Software Development. Journal of Database Management (JDM), 27(1), 1-28.
Beck, K. (2000). Extreme programming explained: embrace change. Boston,
USA: Addison-Wesley Professional. Becker, J.-M., Klein, K., & Wetzels, M. (2012). Hierarchical latent variable models
in PLS-SEM: guidelines for using reflective-formative type models. Long Range Planning, 45(5), 359-394.
Bhattacherjee, A. (2012). Social science research: principles, methods, and
practices. Boehm, B. (2002). Get ready for agile methods, with care. IEEE Computer, 35(1),
64-69. Boehm, B., & Turner, R. (2003a). Balancing Agility and Discipline: A Guide for
the Perplexed. Boston, USA: Addison-Wesley Professional. Boehm, B., & Turner, R. (2003b). Using risk to balance agile and plan-driven
methods. Computer, 36(6), 57-66. Boehm, B., & Turner, R. (2005). Management challenges to implementing agile
processes in traditional development organizations. Software, IEEE, 22(5), 30-39.
Bollen, K. (1989). Structural equations with latent variables. New York: John
Wiley. Bosch, J., & Bosch-Sijtsema, P. M. (2011). Introducing agile customer-centered
development in a legacy software product line. Software-Practice & Experience, 41(8), 871-882. doi: Doi 10.1002/Spe.1063

98
Breaugh, J. A. (1985). The measurement of work autonomy. Human relations, 38(6), 551-570.
Cenfetelli, R. T., & Bassellier, G. (2009). Interpretation of formative measurement
in information systems research. MIS quarterly, 689-707. Chan, C.-L., Jiang, J. J., & Klein, G. (2008). Team task skills as a facilitator for
application and development skills. Ieee Transactions on Engineering Management, 55(3), 434-441.
Chan, F. K., & Thong, J. Y. (2009). Acceptance of agile methodologies: A critical
review and conceptual framework. Decision Support Systems, 46(4), 803-814.
Charmaz, K. (2006). Constructing grounded theory: A practical guide through
qualitative research: London: Sage. Chau, T., Maurer, F., & Melnik, G. (2003). Knowledge sharing: Agile methods vs.
tayloristic methods. Paper presented at the 21st International Workshop on Enabling Technologies: Infrastructure for Collaborative Enterprises (WETICE’03), Linz, Austria.
Chow, T., & Cao, D.-B. (2008). A survey study of critical success factors in agile
software projects. Journal of Systems and Software, 81(6), 961-971. doi: http://dx.doi.org/10.1016/j.jss.2007.08.020
Churchill Jr, G. A. (1979). A paradigm for developing better measures of
marketing constructs. Journal of marketing research, 64-73. Clark, L. A., & Watson, D. (1995). Constructing validity: Basic issues in objective
scale development. Psychological assessment, 7(3), 309. Cockburn, A. (2006). Agile software development: the cooperative game (2nd
ed.). Upper Saddle River, NJ: Pearson Education, Inc. Cockburn, A., & Highsmith, J. (2001). Agile software development, the people
factor. Computer, 34(11), 131-133. Cohen, D., Lindvall, M., & Costa, P. (2004). An introduction to agile methods.
Advances in computers, 62, 1-66. Cohen, J. (1988). Statistical power analysis for the behavior science (2nd ed.).
Hillsdale, New Jersey: Lawrance Eribaum

99
Conboy, K. (2009). Agility from First Principles: Reconstructing the Concept of Agility in Information Systems Development. Information Systems Research, 20(3), 329-354. doi: 10.1287/isre.1090.0236
Conboy, K., & Fitzgerald, B. (2004). Toward a conceptual framework of agile
methods. Extreme Programming and Agile Methods - Xp/ Agile Universe 2004, Proceedings, 3134, 105-116.
Converse, J. M., & Presser, S. (1986). Survey questions: Handcrafting the
standardized questionnaire. Thousand Oaks, California: Sage Publications, Inc.
Cooper, D. R., & Schindler, P. S. (2011). Business Research Methods (Eleventh
ed.): McGraw-hill education. Corbin, J. M., & Strauss, A. (1990). Grounded theory research: Procedures,
canons, and evaluative criteria. Qualitative sociology, 13(1), 3-21. Creswell, J. W. (2013). Research design: Qualitative, quantitative, and mixed
methods approaches. Thousand Oaks, California: Sage Publications, Inc. Davison, A. C., & Hinkley, D. V. (1997). Bootstrap methods and their application
(Vol. 1): Cambridge university press. Diamantopoulos, A., & Siguaw, J. A. (2006). Formative versus reflective
indicators in organizational measure development: A comparison and empirical illustration. British Journal of Management, 17(4), 263-282.
Dorairaj, S., Noble, J., & Malik, P. (2011). Effective communication in distributed
Agile software development teams. Paper presented at the 13th International Conference on Agile Software Development, Malmö, Sweden.
Dorairaj, S., Noble, J., & Malik, P. (2012). Understanding team dynamics in
distributed Agile software development Agile Processes in Software Engineering and Extreme Programming (pp. 47-61): Springer.
Drury-Grogan, M. L., & O'dwyer, O. (2013). An Investigation Of The Decision-
Making Process In Agile Teams. International Journal of Information Technology & Decision Making, 12(06), 1097-1120.
Drury, M., Conboy, K., & Power, K. (2012). Obstacles to decision making in Agile
software development teams. Journal of Systems and Software, 85(6), 1239-1254. doi: DOI 10.1016/j.jss.2012.01.058

100
Drury, M., & McHugh, O. (2011). Factors that influence the decision-making process in agile project teams using scrum practices. Paper presented at the 6th International Research Workshop on Information Technology Project Management (IRWITPM), Shanghai, China.
Dyba, T., & Dingsoyr, T. (2008). Empirical studies of agile software development:
A systematic review. Information and Software Technology, 50(9-10), 833-859.
Efron, B., & Tibshirani, R. J. (1994). An introduction to the bootstrap. New York:
Chapman and Hall/CRC. Eisenberg, E. M., & Goodall, H. L. (2004). Organizational communication:
Balancing creativity and constraint: Bedford/St. Martin's Boston. Eisenhardt, K. M., & Martin, J. A. (2000). Dynamic capabilities: what are they?
Strategic Management Journal, 21(10-11), 1105-1121. Erickson, J., Lyytinen, K., & Siau, K. (2005). Agile modeling, agile software
development, and extreme programming: The state of research. Journal of Database Management, 16(4), 88-100.
Eshlaghy, A. T., Mashayekhi, A. N., Rajabzadeh, A., & Razavian, M. M. (2010).
Applying path analysis method in defining effective factors in organisation agility. International Journal of Production Research, 48(6), 1765-1786.
Espinosa, J. A., Slaughter, S. A., Kraut, R. E., & Herbsleb, J. D. (2007). Team
knowledge and coordination in geographically distributed software development. Journal of Management Information Systems, 24(1), 135-169.
F. Hair Jr, J., Sarstedt, M., Hopkins, L., & G. Kuppelwieser, V. (2014). Partial
least squares structural equation modeling (PLS-SEM) An emerging tool in business research. European Business Review, 26(2), 106-121.
Faraj, S., & Sproull, L. (2000). Coordinating expertise in software development
teams. Management Science, 46(12), 1554-1568. Farrell, A. M. (2010). Insufficient discriminant validity: A comment on Bove,
Pervan, Beatty, and Shiu (2009). Journal of Business Research, 63(3), 324-327.
Fitzgerald, B., Hartnett, G., & Conboy, K. (2006). Customising agile methods to
software practices at Intel Shannon. European Journal of Information Systems, 15(2), 200-213. doi: DOI 10.1027/palgrave.ejis.300605

101
Fontana, R. M., Fontana, I. M., da Rosa Garbuio, P. A., Reinehr, S., & Malucelli,
A. (2014). Processes versus people: How should agile software development maturity be defined? Journal of Systems and Software, 97, 140-155.
Fornell, C., & Larcker, D. F. (1981). Evaluating structural equation models with
unobservable variables and measurement error. Journal of marketing research, 39-50.
Gallagher, K. P., Kaiser, K. M., Simon, J. C., Beath, C. M., & Goles, T. (2010).
The requisite variety of skills for IT professionals. Communications of the ACM, 53(6), 144-148.
Gefen, D., Straub, D. W., & Boudreau, M.-C. (2000). Structural equation
modeling and regression: Guidelines for research practice. Communications of the Association for Information Systems, 4 (1).
Goh, J. C. L., Pan, S. L., & Zuo, M. Y. (2013). Developing the Agile IS
Development Practices in Large-Scale IT Projects: The Trust-Mediated Organizational Controls and IT Project Team Capabilities Perspectives. Journal of the Association for Information Systems, 14(12).
Gold, A. H., & Arvind Malhotra, A. H. S. (2001). Knowledge management: An
organizational capabilities perspective. Journal of management information systems, 18(1), 185-214.
Hair Jr, J. F., Hult, G. T. M., Ringle, C., & Sarstedt, M. (2016). A primer on partial
least squares structural equation modeling (PLS-SEM) (Second Ed.). Los Angeles: SAGE Publications, Inc.
Hayes, A. F. (2013). Introduction to mediation, moderation, and conditional
process analysis: A regression-based approach. Newyork, USA: The Guilford Press.
Henderson-Sellers, B., & Serour, M. (2005). Creating a dual-agility method: The
value of method engineering. Journal of Database Management (JDM), 16(4), 1-24.
Henseler, J., Ringle, C. M., & Sarstedt, M. (2015). A new criterion for assessing
discriminant validity in variance-based structural equation modeling. Journal of the academy of marketing science, 43(1), 115-135.

102
Henseler, J., Ringle, C. M., & Sinkovics, R. R. (2009). The use of partial least squares path modeling in international marketing. Advances in international marketing, 20(1), 277-319.
Highsmith, J. (2004a). Agile Project Management. Boston: Addison-Wesley. Highsmith, J. (2004b). Agile Project Management. Boston, MA: Addison-
Wesley. Highsmith, J. (2009). Agile project management: creating innovative products
(2nd ed.). Boston, USA: Addison Wesley Professional. Highsmith, J., & Cockburn, A. (2001). Agile software development: the business
of innovation. IEEE Computer Society, 34(9), 120-127. doi: 10.1109/2.947100
Highsmith, J. A. (2000). Adaptive software development: a collaborative
approach to managing complex systems. New York, USA: Dorset House Publishing Co., Inc.
Highsmith, J. A. (2002). What is Agile Software Development? . The Journal of
Defense Software Engineering, 15, 4-9. Hoda, R., Noble, J., & Marshall, S. (2011). The impact of inadequate customer
collaboration on self-organizing Agile teams. Information and Software Technology, 53(5), 521-534.
Hoda, R., Noble, J., & Marshall, S. (2013). Self-Organizing Roles on Agile
Software Development Teams. Ieee Transactions on Software Engineering, 39(3), 422-444. doi: Doi 10.1109/Tse.2012.30
Hoegl, M., & Parboteeah, P. (2006). Autonomy and teamwork in innovative
projects. Human Resource Management, 45(1), 67-79. Hoegl, M., & Wagner, S. M. (2005). Buyer-supplier collaboration in product
development projects. Journal of Management, 31(4), 530-548. Hossain, E., Babar, M. A., & Paik, H. (2009). Using scrum in global software
development: a systematic literature review. Paper presented at the 4th IEEE International Conference on Global Software Engineering, Limerick, Ireland.
Hummel, M. (2013). Measuring the impact of communication in agile
development: A research model and pilot test. Paper presented at the 9th Americas Conference on Information Systems (AMCIS), Chicago, Illinois.

103
Hummel, M. (2014). State-of-the-art: A systematic literature review on agile
information systems development. Paper presented at the 47th Hawaii International Conference on System Sciences (HICSS).
Hummel, M., Rosenkranz, C., & Holten, R. (2013). Explaining The Changing
Communication Paradigm Of Agile Information Systems Development: A Research Model, Measurement Development And Pretest. Paper presented at the European Conference on Information Systems (ECIS), Utrecht, Netherlands.
Hummel, M., Rosenkranz, C., & Holten, R. (2013). The Role of Communication in
Agile Systems Development An Analysis of the State of the Art. Business & Information Systems Engineering, 5(5), 338-350. doi: DOI 10.1007/s12599-013-0282-4
Hummel, M., Rosenkranz, C., & Holten, R. (2015). The Role of Social Agile
Practices for Direct and Indirect Communication in Information Systems Development Teams. Communications of the Association for Information Systems, 36(1), 273-300.
Huo, M., Verner, J., Zhu, L., & Babar, M. A. (2004). Software quality and agile
methods. Paper presented at the 28th Annual International Computer Software and Applications Conference (COMPSAC’04), Hong Kong, China.
Iivari, J., & Iivari, N. (2011). The relationship between organizational culture and
the deployment of agile methods. Information and Software Technology, 53(5), 509-520.
Kar, N. J. (2006). Adopting Agile Methodologies of Software Development.
SETLabs Briefings, 4(1), 1-8. Karhatsu, H., Ikonen, M., Kettunen, P., Fagerholm, F., & Abrahamsson, P.
(2010). Building blocks for self-organizing software development teams a framework model and empirical pilot study. Paper presented at the 2nd International Conference on Software Technology and Engineering (ICSTE) San Juan, Puerto Rico, USA.
Kline, R. B. (2015). Principles and practice of structural equation modeling:
Guilford publications. Korkala, M., & Abrahamsson, P. (2007). Communication in distributed agile
development: A case study. Paper presented at the 33rd EUROMICRO

104
Conference on Software Engineering and Advanced Applications (SEAA 2007), Lubeck, Germany.
Korkala, M., Abrahamsson, P., & Kyllonen, P. (2006). A case study on the impact
of customer communication on defects in agile software development. Paper presented at the Agile Conference, 2006.
Korkala, M., & Maurer, F. (2014). Waste identification as the means for improving
communication in globally distributed agile software development. Journal of Systems and Software, 95, 122-140.
Koskela, J., & Abrahamsson, P. (2004). On-site customer in an XP project:
empirical results from a case study Software Process Improvement (pp. 1-11). Berlin Heidelberg: Springer.
Kotlarsky, J., & Oshri, I. (2005). Social ties, knowledge sharing and successful
collaboration in globally distributed system development projects. European Journal of Information Systems, 14(1), 37-48.
Kutner, M. H., Nachtsheim, C. J., Neter, J., & Li, W. (2005). Applied linear
statistical models (5th ed.). Chicago, IL: McGraw-Hill/Irwin. Larman, C. (2004). Agile and iterative development: a manager's guide. Boston,
USA: Addison-Wesley Professional. Layman, L., Williams, L., Damian, D., & Bures, H. (2006). Essential
communication practices for Extreme Programming in a global software development team. Information and Software Technology, 48(9), 781-794.
Lee, D. M., Trauth, E. M., & Farwell, D. (1995). Critical skills and knowledge
requirements of IS professionals: a joint academic/industry investigation. MIS Quarterly, 19(3), 313-340.
Lee, G., & Xia, W. (2010). Toward agile: an integrated analysis of quantitative
and qualitative field data on software development agility. MIS Quarterly, 34(1), 87-114.
Li, Y., Chang, K.-C., Chen, H.-G., & Jiang, J. J. (2010). Software development
team flexibility antecedents. Journal of Systems and Software, 83(10), 1726-1734.
Lindvall, M., Basili, V., Boehm, B., Costa, P., Dangle, K., Shull, F., . . . Zelkowitz,
M. (2002). Empirical findings in agile methods. Paper presented at the Extreme Programming and Agile Methods—XP/Agile Universe Chicago, IL, USA.

105
Locke, K. (1996). Rewriting the discovery of grounded theory after 25 years?
Journal of Management Inquiry, 5(3), 239-245. Lomax, R. G., & Schumacker, R. E. (2012). A beginner's guide to structural
equation modeling (Third ed.). New Jersey: Routledge Academic New York, NY.
Lowry, P. B., & Gaskin, J. (2014). Partial least squares (PLS) structural equation
modeling (SEM) for building and testing behavioral causal theory: When to choose it and how to use it. Professional Communication, IEEE Transactions on, 57(2), 123-146.
Lyytinen, K., & Rose, G. M. (2006). Information system development agility as
organizational learning. European Journal of Information Systems, 15(2), 183-199. doi: http://dx.doi.org/10.1057/palgrave.ejis.3000604
MacKenzie, S. B., Podsakoff, P. M., & Podsakoff, N. P. (2011). Construct
measurement and validation procedures in MIS and behavioral research: Integrating new and existing techniques. MIS quarterly, 35(2), 293-334.
Mangalaraj, G., Mahapatra, R., & Nerur, S. (2009). Acceptance of software
process innovations–the case of extreme programming. European Journal of Information Systems, 18(4), 344-354.
Maruping, L. M., Venkatesh, V., & Agarwal, R. (2009). A control theory
perspective on agile methodology use and changing user requirements. Information Systems Research, 20(3), 377-399.
McAvoy, J., & Butler, T. (2009). The role of project management in ineffective
decision making within Agile software development projects. European Journal of Information Systems, 18(4), 372-383.
McKinsey&Company. (2012). Delivering large-scale IT projects on time, on
budget, and on value. McLeod, L., & MacDonell, S. G. (2011). Factors that affect software systems
development project outcomes: A survey of research. ACM Computing Surveys (CSUR), 43(4), 24.
Melnik, G., & Maurer, F. (2004). Direct verbal communication as a catalyst of
agile knowledge sharing. Paper presented at the Agile Development Conference, 2004.

106
Melo, C. d. O., Santos, V., Katayama, E., Corbucci, H., Prikladnicki, R., Goldman, A., & Kon, F. (2013). The evolution of agile software development in Brazil. Journal of the Brazilian Computer Society, 19(4), 523-552.
Meso, P., & Jain, R. (2006). Agile software development: adaptive systems
principles and best practices. Information Systems Management, 23(3), 19-30.
Mishra, D., & Mishra, A. (2009). Effective communication, collaboration, and
coordination in eXtreme Programming: Human‐centric perspective in a small organization. Human Factors and Ergonomics in Manufacturing & Service Industries, 19(5), 438-456.
Mishra, D., Mishra, A., & Ostrovska, S. (2012). Impact of physical ambiance on
communication, collaboration and coordination in agile software development: An empirical evaluation. Information and Software Technology, 54(10), 1067-1078.
Misra, S. C., Kumar, V., & Kumar, U. (2009). Identifying some important success
factors in adopting agile software development practices. Journal of Systems and Software, 82(11), 1869-1890.
Moe, N. B., Aurum, A., & Dyba, T. (2012). Challenges of shared decision-making:
A multiple case study of agile software development. Information and Software Technology, 54(8), 853-865.
Moe, N. B., Dingsoyr, T., & Dyba, T. (2009). Overcoming barriers to self-
management in software teams. Software, IEEE, 26(6), 20-26. Myers, M. D. (1995). Dialectical hermeneutics: a theoretical framework for the
implementation of information systems. Information Systems Journal, 5(1), 51-70.
Nawrocki, J., Jasiñski, M., Walter, B., & Wojciechowski, A. (2002, 9-13 Sept.
2002). Extreme programming modified: embrace requirements engineering practices. Paper presented at the IEEE Joint International Conference on Requirements Engineering (RE’02), Essen, Germany.
Nerur, S., & Balijepally, V. (2007). Theoretical reflections on agile development
methodologies. Communications of the ACM, 50(3), 79-83. doi: 10.1145/1226736.1226739
Nerur, S., Mahapatra, R., & Mangalaraj, G. (2005). Challenges of migrating to
agile methodologies. Communications of the ACM, 48(5), 72-78.

107
O’brien, R. M. (2007). A caution regarding rules of thumb for variance inflation
factors. Quality & Quantity, 41(5), 673-690. Orr, K. (2011). Adaptive Software Development. Cutter Consortium Summit, 173-
179. Palvia, P. C., King, R. C., Xia, W., & Palvia, S. C. J. (2010). Capability, quality,
and performance of offshore IS vendors: a theoretical framework and empirical investigation. Decision Sciences, 41(2), 231-270.
Petter, S., Straub, D., & Rai, A. (2007). Specifying formative constructs in
information systems research. MIS quarterly, 623-656. Pikkarainen, M., Haikara, J., Salo, O., Abrahamsson, P., & Still, J. (2008). The
impact of agile practices on communication in software development. Empirical Software Engineering, 13(3), 303-337.
Preacher, K. J., & Hayes, A. F. (2004). SPSS and SAS procedures for estimating
indirect effects in simple mediation models. Behavior research methods, instruments, & computers, 36(4), 717-731.
Qumer, A., & Henderson-Sellers, B. (2006). Crystallization of agility back to
basics. Paper presented at the International Conference on Software and Data Technologies (ICSOFT), Setúbal, Portugal.
Qumer, A., & Henderson-Sellers, B. (2008). An evaluation of the degree of agility
in six agile methods and its applicability for method engineering. Information and Software Technology, 50(4), 280-295.
Racheva, Z., Daneva, M., & Sikkel, K. (2009). Value creation by agile projects:
methodology or mystery? Product-Focused Software Process Improvement (pp. 141-155): Springer.
Ramesh, B., Cao, L., Mohan, K., & Xu, P. (2006). Can distributed software
development be agile? Communications of the ACM, 49(10), 41-46. Rathor, S., Batra, D., & Xia, W. (2016). Tradeoffs between Delivery Capability
and Agility in Software Development. Paper presented at the 15th AIS SIGSAND Symposium, Lubbock, TX, USA.
Rathor, S., Batra, D., Xia, W., & Zhang, M. (2016). What constitutes Software
Development Agility? Paper presented at the Americas Conference on Information Systems (AMCIS), San Diego, USA.

108
Ringle, C. M., Sarstedt, M., & Straub, D. (2012). A critical look at the use of PLS-SEM in MIS Quarterly. MIS quarterly, 36(1).
Ryan, S., & O’Connor, R. V. (2013). Acquiring and sharing tacit knowledge in
software development teams: An empirical study. Information and Software Technology, 55(9), 1614-1624.
Sarker, S., & Sarker, S. (2009). Exploring Agility in Distributed Information
Systems Development Teams: An Interpretive Study in an Offshoring Context. Information Systems Research, 20(3), 440-461. doi: 10.1287/isre.1090.0241
Sattler, H., Völckner, F., Riediger, C., & Ringle, C. M. (2010). The impact of
brand extension success drivers on brand extension price premiums. International Journal of research in Marketing, 27(4), 319-328.
Schmidt, R., Lyytinen, K., & Mark Keil, P. C. (2001). Identifying software project
risks: an international Delphi study. Journal of Management Information Systems, 17(4), 5-36.
Schwaber, K. (2004). Agile project management with Scrum. Redmond, WA,
USA: Microsoft Press. Schwaber, K., & Sutherland, J. (2014). The Scrum Guide (pp. 1-16): Scrum.Org
and ScrumInc. Senapathi, M., & Srinivasan, A. (2012). Understanding post-adoptive agile
usage: An exploratory cross-case analysis. Journal of Systems and Software, 85(6), 1255-1268. doi: DOI 10.1016/j.jss.2012.02.025
Serrador, P., & Pinto, J. K. (2015). Does Agile work?—A quantitative analysis of
agile project success. International Journal of Project Management, 33(5), 1040-1051.
Sharma, P. N., & Kim, K. H. (2013). A comparison of PLS and ML bootstrapping
techniques in SEM: A Monte Carlo study New perspectives in partial least squares and related methods (pp. 201-208). New York: Springer.
Sharp, H., & Robinson, H. (2004). An ethnographic study of XP practice.
Empirical Software Engineering, 9(4), 353-375. Sharp, H., & Robinson, H. (2008). Collaboration and co-ordination in mature
eXtreme programming teams. International Journal of Human-Computer Studies, 66(7), 506-518.

109
Sheffield, J., & Lemetayer, J. (2013). Factors associated with the software development agility of successful projects. International Journal of Project Management, 31(3), 459-472. doi: DOI 10.1016/j.ijproman.2012.09.011
Sheffield, J., & Lemétayer, J. (2013). Factors associated with the software
development agility of successful projects. International Journal of Project Management, 31(3), 459-472.
Siau, K., Long, Y., & Ling, M. (2010). Toward a unified model of information
systems development success. Journal of Database Management (JDM), 21(1), 80-101.
Siau, K., Tan, X., & Sheng, H. (2010). Important characteristics of software
development team members: an empirical investigation using Repertory Grid. Information Systems Journal, 20(6), 563-580.
StandishGroup. (2015). CHAOS Report 2015. Straub, D., Boudreau, M.-C., & Gefen, D. (2004). Validation guidelines for IS
positivist research. Communications of the Association for Information Systems, 13(24), 380-427.
Summers, M. (2008). Insights into an agile adventure with offshore partners.
Paper presented at the AGILE'08 Conference, Toronto, Canada. Sutherland, J., Viktorov, A., Blount, J., & Puntikov, N. (2007). Distributed scrum:
Agile project management with outsourced development teams. Paper presented at the 40th Annual Hawaii International Conference on System Sciences (HICSS)
Teece, D. J., Pisano, G., & Shuen, A. (1997). Dynamic capabilities and strategic
management. Strategic Management Journal, 509-533. Teo, T. S., Srivastava, S. C., & Jiang, L. (2008). Trust and electronic government
success: An empirical study. Journal of management information systems, 25(3), 99-132.
Thomas, G., & Fernández, W. (2008). Success in IT projects: A matter of
definition? International Journal of Project Management, 26(7), 733-742. Tripp, J. F. (2012). The impacts of agile development methodology use on
project success: A contingency view. (3523854 Ph.D.), Michigan State University, Ann Arbor. ProQuest Dissertations & Theses A&I; ProQuest Dissertations & Theses Global database.

110
Urquhart, C. (2007). The evolving nature of grounded theory method: The case of the information systems discipline. The Sage handbook of grounded theory, 339-359.
VersionOne, I. (2015). 9th Annual State of agile survey (pp. 16). Vial, G., & Rivard, S. (2015). Understanding Agility in ISD Projects. Paper
presented at the 36th International Conference on Information Systems (ICIS), Fort Worth, Texas, USA.
Vidgen, R., & Wang, X. (2009). Coevolving systems and the organization of agile
software development. Information Systems Research, 20(3), 355-376. Vinod, V., Dhanalakshmi, J., & Sahadev, S. (2009). Software team skills on
software product quality. Asian Journal of Information Technology, 8(1), 8-13.
Wallace, L., Keil, M., & Rai, A. (2004). Understanding software project risk: a
cluster analysis. Information & Management, 42(1), 115-125. Wendler, R. (2013, 8 - 11 September, 2013). The Structure of Agility from
Different Perspectives. Paper presented at the Federated Conference on Computer Science and Information Systems (FedCSIS), Kraków, Poland.
Xia, W., & Lee, G. (2003). Complexity of information systems development
projects: conceptualization and measurement development. Journal of Management Information Systems, 22(1), 45-83.
Xiaohu, Y., Bin, X., Zhijun, H., & Maddineni, S. (2004). Extreme programming in
global software development. Paper presented at the Canadian Conference on Electrical and Computer Engineering.
Yu, X., & Petter, S. (2014). Understanding agile software development practices
using shared mental models theory. Information and Software Technology, 56(8), 911-921.

111
Appendix
Descriptive Statistics
Descriptive Statistics: Project Outcomes
Customer Satisfaction N Minimum Maximum Mean Std. Deviation
Q7_CustSatf1 160 1 7 6.05 1.069
Q7_CustSatf2 160 1 7 5.94 1.056
Q7_CustSatf3 160 1 7 5.68 1.348
Q7_CustSatf5 160 1 7 6.05 .937
Q7_CustSatf4 160 1 7 5.56 1.248
Change Satisfaction
Q8_CngSatf1 160 2 7 5.81 1.071
Q8_CngSatf2 160 3 7 5.89 .945
Q8_CngSatf3 160 1 7 5.41 1.210
Q8_CngSatf4 160 1 7 5.68 1.325
Table A1.1: Descriptive Statistics of Project Outcomes Variables
Descriptive Statistics: Delivery Capability and Agility
Delivery Capability N Minimum Maximum Mean Std. Deviation
Q9_DvlCap1 160 1 7 6.18 .889
Q9_DvlCap2 160 1 7 6.21 .855
Q9_DvlCap3 160 1 7 6.08 .883
Q9_DvlCap4 160 1 7 5.67 1.056
Agility-Sense
Q10_Sense1 160 2 7 5.79 1.036
Q10_Sense2 160 1 7 5.83 1.193
Q10_Sense3 160 1 7 5.32 1.329
Q10_Sense4 160 2 7 5.79 1.101
Agility-Respond
Q11_Respond1 160 2 7 5.86 .987
Q11_Respond2 160 1 7 5.95 .944
Q11_Respond3 160 1 7 5.46 1.253

112
Q11_Respond4 160 2 7 5.69 1.116
Agility-Learn
Q12_Learn1 160 2 7 5.94 .927
Q12_Learn2 160 1 7 6.03 1.018
Q12_Learn3 160 1 7 5.55 1.120
Q12_Learn4 160 1 7 5.78 1.108
Table A1.2: Descriptive Statistics of Agility
Descriptive Statistics: Process Variables
Communication N Minimum Maximum Mean Std. Deviation
Q13_Comm2 160 1 7 5.63 1.297
Q13_Comm1 160 2 7 5.82 1.045
Q13_Comm3 160 1 7 5.26 1.450
Q13_Comm4 160 1 7 5.69 1.224
Collaborative
Decision Making
Q14_CDM1 160 1 7 5.51 1.327
Q14_CDM2 160 1 7 5.50 1.308
Q14_CDM3 160 2 7 5.63 1.227
Q14_CDM4 160 1 7 5.59 1.275
Q14_CDM5 160 1 7 5.51 1.432
Iterative
Development
Q15_ItrDev1 160 1 7 6.07 1.100
Q15_ItrDev2 160 2 7 6.02 1.130
Q15_ItrDev4 160 1 7 5.84 1.248

113
Q15_ItrDev3 160 1 7 5.94 1.260
Table A1.3: Descriptive Statistics of Process Variables
Descriptive Statistics: Antecedent Variables
Team Competence N Minimum Maximum Mean Std. Deviation
Q16_Cmpt1 160 1 7 6.26 .935
Q16_Cmpt2 160 1 7 5.81 1.124
Q16_Cmpt3 160 1 7 5.91 1.018
Q16_Cmpt4 160 2 7 6.21 .891
Team Autonomy
Q18_Atny1 160 1 7 5.09 1.751
Q18_Atny2 160 1 7 5.77 1.117
Q18_Atny3 160 1 7 5.36 1.411
Q18_Atny4 160 1 7 5.69 1.419
Table A1.4: Descriptive Statistics of Antecedent Variables
Total Members Frequency Percent
No Response 2 1.3
1-10 66 41.3
11-20 38 23.8
21-50 37 23.1
51-100 11 6.9
101+ 6 3.8
Total 160 100.0
Table A2: Total Number of members in IT and Business teams

114
Graphs
Composite Reliability
Figure A1: Composite Reliability

115
Cronbach’s Alpha
Figure A2: Cronbach’s Alpha

116
Average Variance Explained (AVE)
Figure A3: Average Variance Explained

117
Heterotrait-Monotraits Ration (MTMT)
Figure A4: Heterotrait-Monotraits Ration (HTMT)

118
Path Coefficients
Figure A5: Path Coefficients

119
R-Square
Figure A6: R-Square

120
R-Square Adjusted
Figure A7: R-Square Adjusted

121
F-Square
Figure A8: F-Square

122
Survey Questionnaire
Process Variables
Communication Item ID
IT and Business team members had sufficient interactions during the project (1) Q13_Comm1
IT and Business team members developed a shared understanding about the project (2)
Q13_Comm3
IT and Business team members did not have communication problems during the project (3)
Q13_Comm2
IT and Business team members effectively communicated their thoughts and opinions to others (4)
Q13_Comm4
Collaborative Decision Making
IT and Business teams worked jointly:
for deciding features for each iteration (1) Q14_CDM1
for deciding the scope of the requirements for each iteration (2) Q14_CDM2
for prioritizing the requirements for each iteration (3) Q14_CDM3
for deciding changes in the requirements (4) Q14_CDM4
Iterative Development
The software system was developed in smaller iterations of few weeks (2-8 weeks) (1)
Q15_ItrDev1
The software system was tested as it was being developed (2) Q15_ItrDev2
Each iteration provided working software that could be demonstrated (3) Q15_ItrDev3
The software system was continually integrated as it was being developed (4) Q15_ItrDev4
Table A3.1: Survey Items for Process Variables

123
Antecedents Variables
Team Autonomy Item ID
Project team members:
were allowed to choose tools and technologies (1) Q18_Atny1
had control over their tasks (2) Q18_Atny2
had the discretion on how to handle user requirement changes (3) Q18_Atny3
were free to self-organize as needed (4) Q18_Atny4
Team Competence
Project team members possess required:
technical skills (1) Q16_Cmpt1
business skills (2) Q16_Cmpt2
interpersonal skills (3) Q16_Cmpt3
problem solving skills (4) Q16_Cmpt4
Table A3.2: Survey Items for Antecedent Variables
Agility and Delivery Capability
Delivery Capability Item ID
Project team(s) were able to deliver solutions that met:
business requirements (1) Q9_DvlCap1
technical requirements (2) Q9_DvlCap2
functional requirements (3) Q9_DvlCap3
non-functional requirements (4) Q9_DvlCap4

124
Agility and its Dimensions
Sense Change Item ID
During the project, project team(s) were able to sense changes in:
business requirements (1) Q10_Sense1
technical requirements (2) Q10_Sense2
human resource requirements (3) Q10_Sense3
schedule (4) Q10_Sense4
Respond to Change Item ID
During the project, project team(s) were able to respond to changes in:
business requirements (1) Q11_Respond1
technical requirements (2) Q11_Respond2
human resource requirements (3) Q11_Respond3
schedule (4) Q11_Respond4
Learn from Change Item ID
As the project progressed, project team member(s) were able to learn and enhance their ability to sense and respond to changes in:
business requirements (1) Q12_Learn1
technical requirements (2) Q12_Learn2
human resource requirements (3) Q12_Learn3
schedule (4) Q12_Learn4
Table A3.3: Survey Items for Delivery Capability and Agility

125
Project Outcomes
Customer Satisfaction Item ID
The customer is satisfied with:
the functionalities of the new system (1) Q7_CustSatf1
the quality of the new system (2) Q7_CustSatf2
the delivery time of the system (3) Q7_CustSatf3
the cost of the new system (4) Q7_CustSatf4
the benefits/value from the new system (5) Q7_CustSatf5
Change Satisfaction Item ID
The customer is satisfied with the way changes in:
business requirements were managed in the project (1) Q8_CngSatf1
technical requirements were managed in the project (2) Q8_CngSatf2
human resource requirements were managed in the project (3) Q8_CngSatf3
schedule was managed in the project (4) Q8_CngSatf4
Table A3.4: Survey Items for Project Outcome Variables

126
Cross Loadings
Change Satisfacti-on
Collaborati-ve Decision Making
Comm-unicati-on
Customer Satisfacti-on
Delivery Capabili-ty
Iterative Develop-ment
Learn Respo-nd
Sense Team Autono-my
Team Compete-nce
Q10_Sense1 0.348 0.385 0.366 0.320 0.428 0.379 0.368 0.462 0.862 0.285 0.354
Q10_Sense2 0.264 0.239 0.242 0.251 0.278 0.231 0.414 0.330 0.610 0.281 0.236
Q10_Sense3 0.362 0.242 0.240 0.186 0.277 0.213 0.467 0.308 0.640 0.344 0.236
Q10_Sense4 0.382 0.211 0.246 0.284 0.365 0.260 0.440 0.371 0.734 0.202 0.221
Q11_Respond1 0.464 0.511 0.421 0.304 0.459 0.268 0.338 0.776 0.445 0.373 0.527
Q11_Respond2 0.442 0.482 0.395 0.280 0.501 0.250 0.249 0.731 0.394 0.382 0.599
Q11_Respond3 0.519 0.482 0.485 0.323 0.407 0.264 0.422 0.824 0.412 0.405 0.543
Q11_Respond4 0.533 0.532 0.520 0.391 0.412 0.350 0.508 0.899 0.449 0.454 0.567
Q12_Learn1 0.297 0.285 0.345 0.262 0.319 0.242 0.641 0.401 0.350 0.182 0.264
Q12_Learn2 0.295 0.199 0.237 0.287 0.365 0.190 0.577 0.275 0.489 0.162 0.254
Q12_Learn3 0.346 0.285 0.388 0.272 0.288 0.110 0.675 0.352 0.419 0.237 0.219
Q12_Learn4 0.500 0.335 0.427 0.380 0.344 0.357 0.939 0.437 0.465 0.331 0.321
Q13_Comm1 0.395 0.520 0.772 0.247 0.413 0.376 0.339 0.385 0.269 0.314 0.276
Q13_Comm2 0.532 0.609 0.886 0.400 0.432 0.333 0.448 0.538 0.304 0.398 0.362
Q13_Comm3 0.416 0.451 0.659 0.259 0.339 0.265 0.292 0.396 0.279 0.328 0.317
Q13_Comm4 0.537 0.682 0.895 0.449 0.499 0.450 0.469 0.508 0.395 0.434 0.328
Q14_CDM1 0.324 0.763 0.519 0.183 0.358 0.375 0.235 0.466 0.215 0.472 0.339
Q14_CDM2 0.424 0.899 0.577 0.308 0.454 0.375 0.292 0.598 0.319 0.463 0.396
Q14_CDM3 0.320 0.769 0.554 0.270 0.406 0.423 0.313 0.408 0.401 0.369 0.355
Q14_CDM4 0.453 0.859 0.677 0.328 0.381 0.362 0.413 0.528 0.335 0.500 0.380
Q15_ItrDev1 0.133 0.373 0.251 0.193 0.302 0.613 0.109 0.216 0.276 0.303 0.255
Q15_ItrDev2 0.272 0.331 0.184 0.247 0.303 0.631 0.115 0.279 0.198 0.323 0.321
Q15_ItrDev3 0.365 0.427 0.454 0.380 0.450 0.963 0.376 0.336 0.373 0.398 0.341
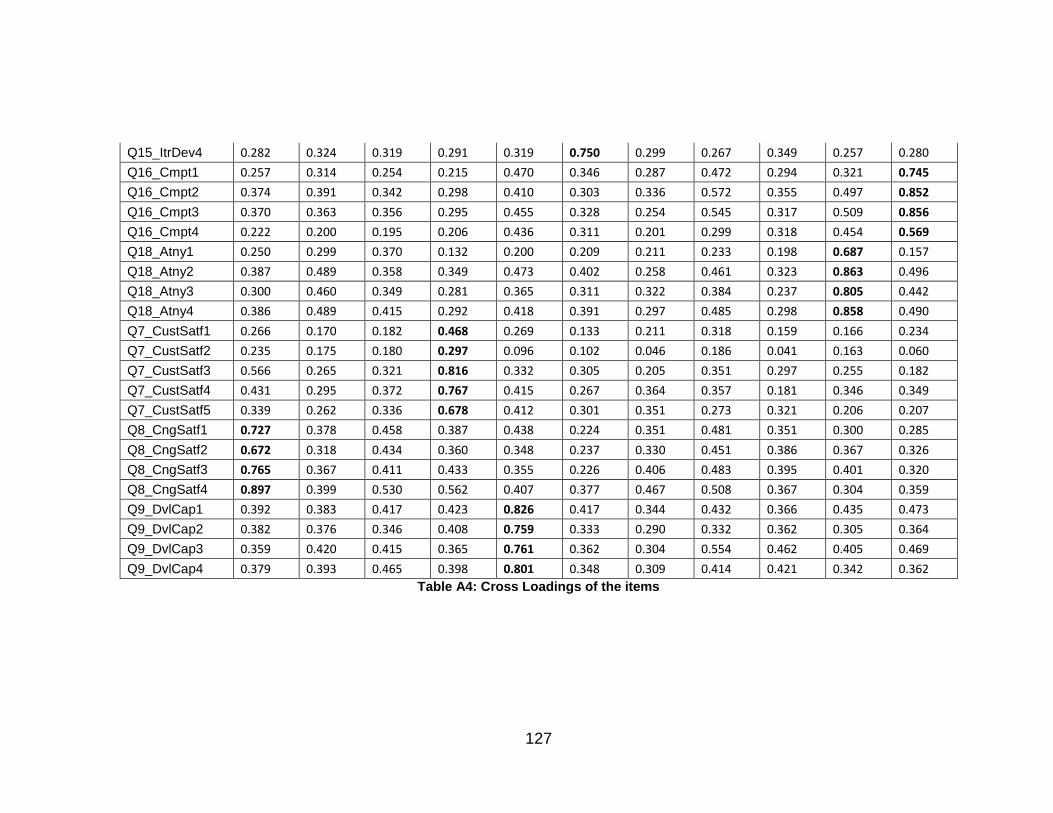
127
Q15_ItrDev4 0.282 0.324 0.319 0.291 0.319 0.750 0.299 0.267 0.349 0.257 0.280
Q16_Cmpt1 0.257 0.314 0.254 0.215 0.470 0.346 0.287 0.472 0.294 0.321 0.745
Q16_Cmpt2 0.374 0.391 0.342 0.298 0.410 0.303 0.336 0.572 0.355 0.497 0.852
Q16_Cmpt3 0.370 0.363 0.356 0.295 0.455 0.328 0.254 0.545 0.317 0.509 0.856
Q16_Cmpt4 0.222 0.200 0.195 0.206 0.436 0.311 0.201 0.299 0.318 0.454 0.569
Q18_Atny1 0.250 0.299 0.370 0.132 0.200 0.209 0.211 0.233 0.198 0.687 0.157
Q18_Atny2 0.387 0.489 0.358 0.349 0.473 0.402 0.258 0.461 0.323 0.863 0.496
Q18_Atny3 0.300 0.460 0.349 0.281 0.365 0.311 0.322 0.384 0.237 0.805 0.442
Q18_Atny4 0.386 0.489 0.415 0.292 0.418 0.391 0.297 0.485 0.298 0.858 0.490
Q7_CustSatf1 0.266 0.170 0.182 0.468 0.269 0.133 0.211 0.318 0.159 0.166 0.234
Q7_CustSatf2 0.235 0.175 0.180 0.297 0.096 0.102 0.046 0.186 0.041 0.163 0.060
Q7_CustSatf3 0.566 0.265 0.321 0.816 0.332 0.305 0.205 0.351 0.297 0.255 0.182
Q7_CustSatf4 0.431 0.295 0.372 0.767 0.415 0.267 0.364 0.357 0.181 0.346 0.349
Q7_CustSatf5 0.339 0.262 0.336 0.678 0.412 0.301 0.351 0.273 0.321 0.206 0.207
Q8_CngSatf1 0.727 0.378 0.458 0.387 0.438 0.224 0.351 0.481 0.351 0.300 0.285
Q8_CngSatf2 0.672 0.318 0.434 0.360 0.348 0.237 0.330 0.451 0.386 0.367 0.326
Q8_CngSatf3 0.765 0.367 0.411 0.433 0.355 0.226 0.406 0.483 0.395 0.401 0.320
Q8_CngSatf4 0.897 0.399 0.530 0.562 0.407 0.377 0.467 0.508 0.367 0.304 0.359
Q9_DvlCap1 0.392 0.383 0.417 0.423 0.826 0.417 0.344 0.432 0.366 0.435 0.473
Q9_DvlCap2 0.382 0.376 0.346 0.408 0.759 0.333 0.290 0.332 0.362 0.305 0.364
Q9_DvlCap3 0.359 0.420 0.415 0.365 0.761 0.362 0.304 0.554 0.462 0.405 0.469
Q9_DvlCap4 0.379 0.393 0.465 0.398 0.801 0.348 0.309 0.414 0.421 0.342 0.362
Table A4: Cross Loadings of the items

128
VITA
SHEKHAR RATHOR
2003 Bachelor of Science (B.Sc.)
Himachal Pradesh University
Shimla, India
2008 Master of Computer Applications (MCA)
Panjab University
Chandigarh, India
2011 Specializing Master in E-Business and ICT for Management
Politecnico di Torino
Torino, Italy
2016 Ph.D., Business Administration
Florida International University
Miami, USA
PUBLICATIONS AND PRESENTATIONS
Batra, D., Xia, W., & Rathor, S. (2016). Agility Facilitators for Contemporary Software Development. Journal of Database Management (JDM), 27(1), 1-28.
Rathor, S., Batra, D., & Xia, W. (2016). Tradeoffs between Delivery Capability and Agility in Software Development. Paper presented at the 15th AIS SIGSAND Symposium, Lubbock, TX, USA.
Rathor, S., Batra, D., Xia, W., & Zhang, M. (2016). What constitutes Software Development Agility? Paper presented at the Americas Conference on Information Systems (AMCIS), San Diego, USA.
Zhang, M., Xia, W., Batra, D., & Rathor, S. (2016). Contextual Influences on IS Offshoring Client-Vendor Collaboration. Paper presented at the TREO Talks, Americas Conference on Information Systems (AMCIS), San Diego, USA.