Embed Size (px)
Citation preview
Facilitating Robotic Grasping using Pushing and Toppling
Christopher Correa
Electrical Engineering and Computer SciencesUniversity of California at Berkeley
Technical Report No. UCB/EECS-2019-80http://www2.eecs.berkeley.edu/Pubs/TechRpts/2019/EECS-2019-80.html
May 17, 2019

Copyright © 2019, by the author(s).All rights reserved.
Permission to make digital or hard copies of all or part of this work forpersonal or classroom use is granted without fee provided that copies arenot made or distributed for profit or commercial advantage and that copiesbear this notice and the full citation on the first page. To copy otherwise, torepublish, to post on servers or to redistribute to lists, requires prior specificpermission.
Facilitating Robotic Grasping using Pushing and Toppling
by
Christopher Correa
A thesis submitted in partial satisfaction of the
requirements for the degree of
Master of Science
in
Electrical Engineering and Computer Science
in the
Graduate Division
of the
University of California, Berkeley
Committee in charge:
Professor Ken Goldberg, ChairProfessor Ruzena Bajcsy
Spring 2019
The thesis of Christopher Correa, titled Facilitating Robotic Grasping using Pushing andToppling, is approved:
Chair Date
Date
Date
University of California, Berkeley
Facilitating Robotic Grasping using Pushing and Toppling
Copyright 2019by
Christopher Correa
1
Abstract
Facilitating Robotic Grasping using Pushing and Toppling
by
Christopher Correa
Master of Science in Electrical Engineering and Computer Science
University of California, Berkeley
Professor Ken Goldberg, Chair
Robots are expected to grasp complex 3D objects in a wide variety of situations. This taskcan be difficult when the object’s pose prevents the robot from perceiving or executing graspson the object. When robust grasps are not accessible, robots can execute non-prehensileactions such as pushing and toppling to change an object’s 3D pose to provide access to robustgrasps. We develop two planar pushing policies and evaluate each policy’s ability to increaseaccess to robust grasps for both parallel jaw grippers and vacuum suction grippers. Using anABB YuMi arm, we execute each pushing policy on the same 1000 simulated and physicalscenarios in which the quality of all accessible grasps is low, and measure the predictedgrasp reliability before and after the push. These experiments suggest that pushing can beused effectively to expose robust parallel jaw grasps, but are less effective in exposing robustvacuum suction grasps. As a result, we explore using toppling to reveal flat object faces forvacuum suction grippers. We present a toppling model which characterizes the robustness oftoppling a 3D object specified by a triangular mesh, using Monte Carlo sampling to accountfor uncertainty in object apose, friction coefficients, and push direction. We run 700 physicaltoppling experiments using the ABB Yumi arm to compare the performance of the proposedmodel against empirical outcomes. We find that the toppling model outperforms a baselinemodel by an absolute 26.9% when comparing the total variation distance between eachmodel’s predicted probability distribution and the empirical distribution. We use the robustmodel as the state transition function in a Markov Decision Process (MDP) to plan optimalsequences of toppling actions to expose access to robust suction grasps. Data from 20,000simulated experiments suggests the toppling policy can increase suction grasp reliability by33.6%.
i
Contents
Contents i
List of Figures iii
List of Tables v
1 Introduction 11.1 Overview . . . . . . . . . . . . . . . . . . . . . . . . . . . . . . . . . . . . . . 11.2 Summary of Contribution . . . . . . . . . . . . . . . . . . . . . . . . . . . . 21.3 Related Work . . . . . . . . . . . . . . . . . . . . . . . . . . . . . . . . . . . 2
1.3.1 Planar Pushing . . . . . . . . . . . . . . . . . . . . . . . . . . . . . . 21.3.2 Reorienting to a New Stable Pose . . . . . . . . . . . . . . . . . . . . 31.3.3 Toppling . . . . . . . . . . . . . . . . . . . . . . . . . . . . . . . . . . 3
2 Problem Statement 42.1 Assumptions . . . . . . . . . . . . . . . . . . . . . . . . . . . . . . . . . . . . 42.2 Definitions . . . . . . . . . . . . . . . . . . . . . . . . . . . . . . . . . . . . . 42.3 Objective . . . . . . . . . . . . . . . . . . . . . . . . . . . . . . . . . . . . . 5
3 Linear Pushing 63.1 Overview . . . . . . . . . . . . . . . . . . . . . . . . . . . . . . . . . . . . . . 6
3.1.1 Pushing Assumptions . . . . . . . . . . . . . . . . . . . . . . . . . . . 73.2 Pushing Policies . . . . . . . . . . . . . . . . . . . . . . . . . . . . . . . . . . 7
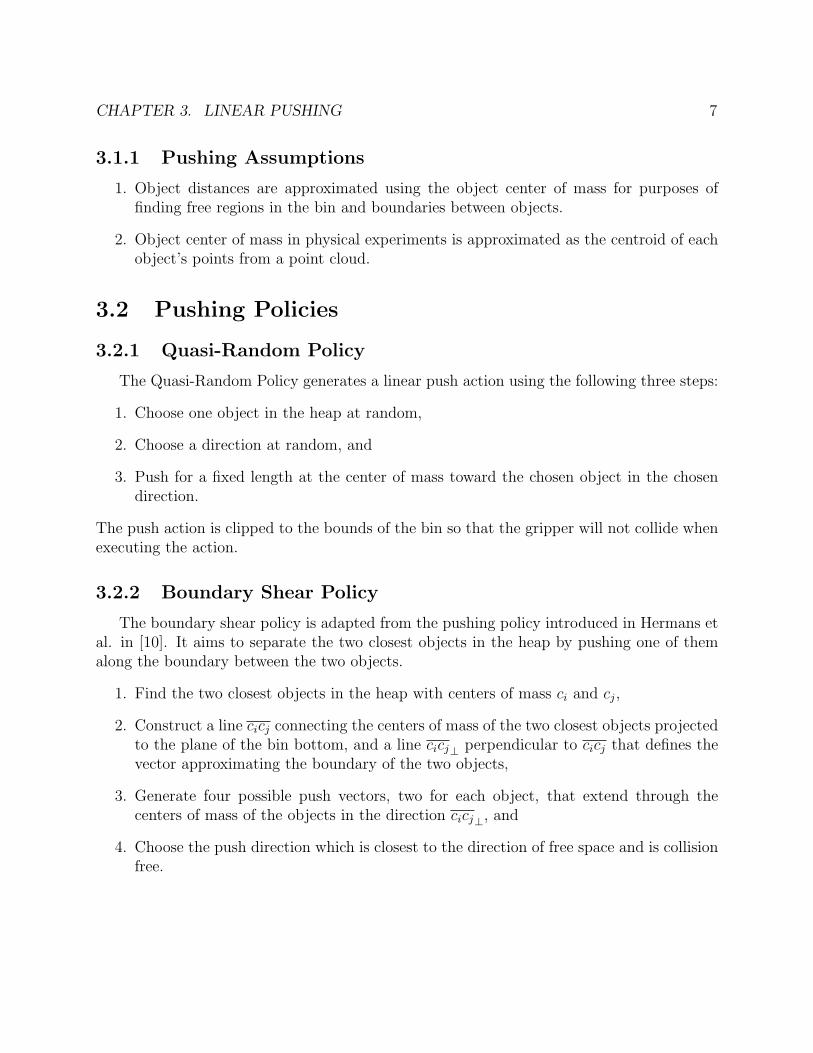
3.2.1 Quasi-Random Policy . . . . . . . . . . . . . . . . . . . . . . . . . . . 73.2.2 Boundary Shear Policy . . . . . . . . . . . . . . . . . . . . . . . . . . 73.2.3 Free Space Policy . . . . . . . . . . . . . . . . . . . . . . . . . . . . . 83.2.4 Maximum Clearance Ratio Policy . . . . . . . . . . . . . . . . . . . . 83.2.5 Cluster Diffusion Policy . . . . . . . . . . . . . . . . . . . . . . . . . 8
3.3 Pushing Experiments . . . . . . . . . . . . . . . . . . . . . . . . . . . . . . . 93.3.1 Simulated Experiments . . . . . . . . . . . . . . . . . . . . . . . . . . 93.3.2 Physical Experiments . . . . . . . . . . . . . . . . . . . . . . . . . . . 10
3.4 Failure Modes and Limitations . . . . . . . . . . . . . . . . . . . . . . . . . . 11
ii
4 Toppling 134.1 Overview . . . . . . . . . . . . . . . . . . . . . . . . . . . . . . . . . . . . . . 13
4.1.1 Definitions . . . . . . . . . . . . . . . . . . . . . . . . . . . . . . . . . 144.1.2 Toppling Assumptions . . . . . . . . . . . . . . . . . . . . . . . . . . 15
4.2 Toppling Model . . . . . . . . . . . . . . . . . . . . . . . . . . . . . . . . . . 164.2.1 Condition 1: Contact Slip . . . . . . . . . . . . . . . . . . . . . . . . 164.2.2 Condition 2: Workspace Slip . . . . . . . . . . . . . . . . . . . . . . . 174.2.3 Condition 3: Minimum Push Force . . . . . . . . . . . . . . . . . . . 174.2.4 Predicting Toppling Final Resting Pose . . . . . . . . . . . . . . . . . 184.2.5 Toppling Reliability . . . . . . . . . . . . . . . . . . . . . . . . . . . . 184.2.6 Toppling Model Baselines . . . . . . . . . . . . . . . . . . . . . . . . 19
4.3 Toppling Policies . . . . . . . . . . . . . . . . . . . . . . . . . . . . . . . . . 204.3.1 Max-Height Baseline . . . . . . . . . . . . . . . . . . . . . . . . . . . 204.3.2 Greedy Baseline . . . . . . . . . . . . . . . . . . . . . . . . . . . . . . 204.3.3 Value Iteration Policy . . . . . . . . . . . . . . . . . . . . . . . . . . 21
4.4 Experiments . . . . . . . . . . . . . . . . . . . . . . . . . . . . . . . . . . . . 214.4.1 Dataset Generation . . . . . . . . . . . . . . . . . . . . . . . . . . . . 214.4.2 Toppling Model Experiments . . . . . . . . . . . . . . . . . . . . . . 214.4.3 Toppling Policy Experiments . . . . . . . . . . . . . . . . . . . . . . . 26
4.5 Failure Modes and Limitations . . . . . . . . . . . . . . . . . . . . . . . . . . 27
5 Discussion and Future Work 285.1 Pushing Future Work . . . . . . . . . . . . . . . . . . . . . . . . . . . . . . . 285.2 Toppling Future Work . . . . . . . . . . . . . . . . . . . . . . . . . . . . . . 295.3 Shared Future Work . . . . . . . . . . . . . . . . . . . . . . . . . . . . . . . 29
Bibliography 30
iii
List of Figures
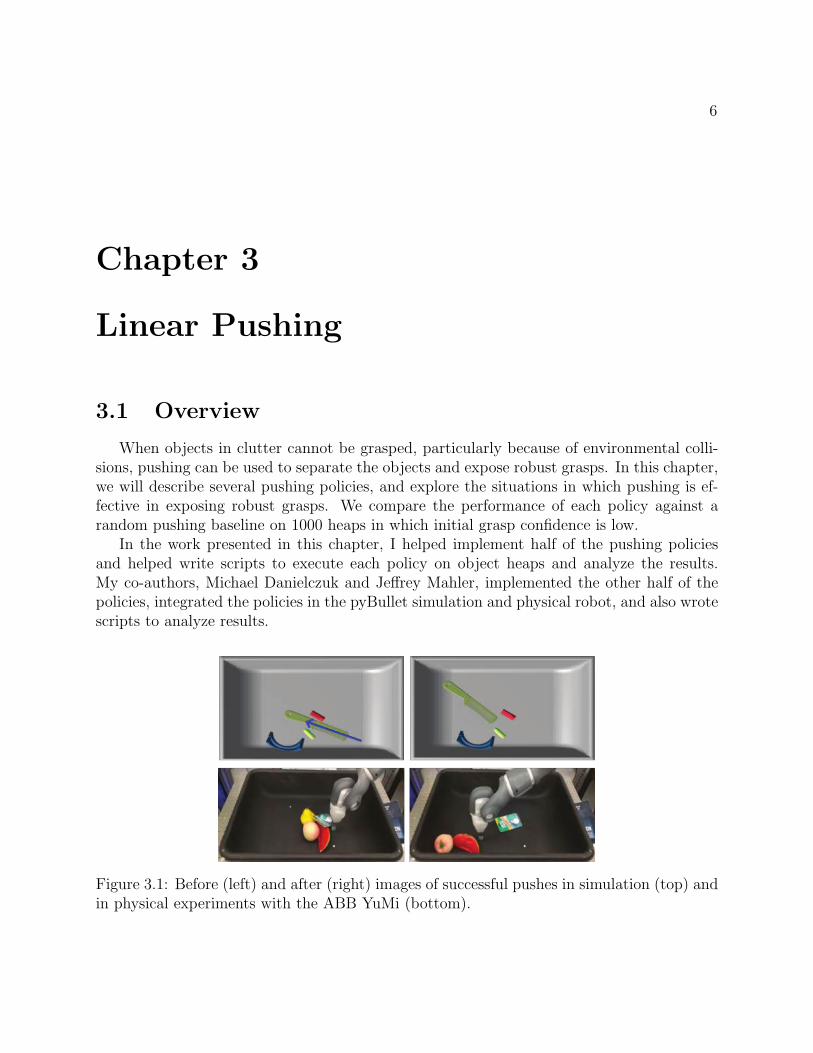
3.1 Before (left) and after (right) images of successful pushes in simulation (top) andin physical experiments with the ABB YuMi (bottom). . . . . . . . . . . . . . . 6
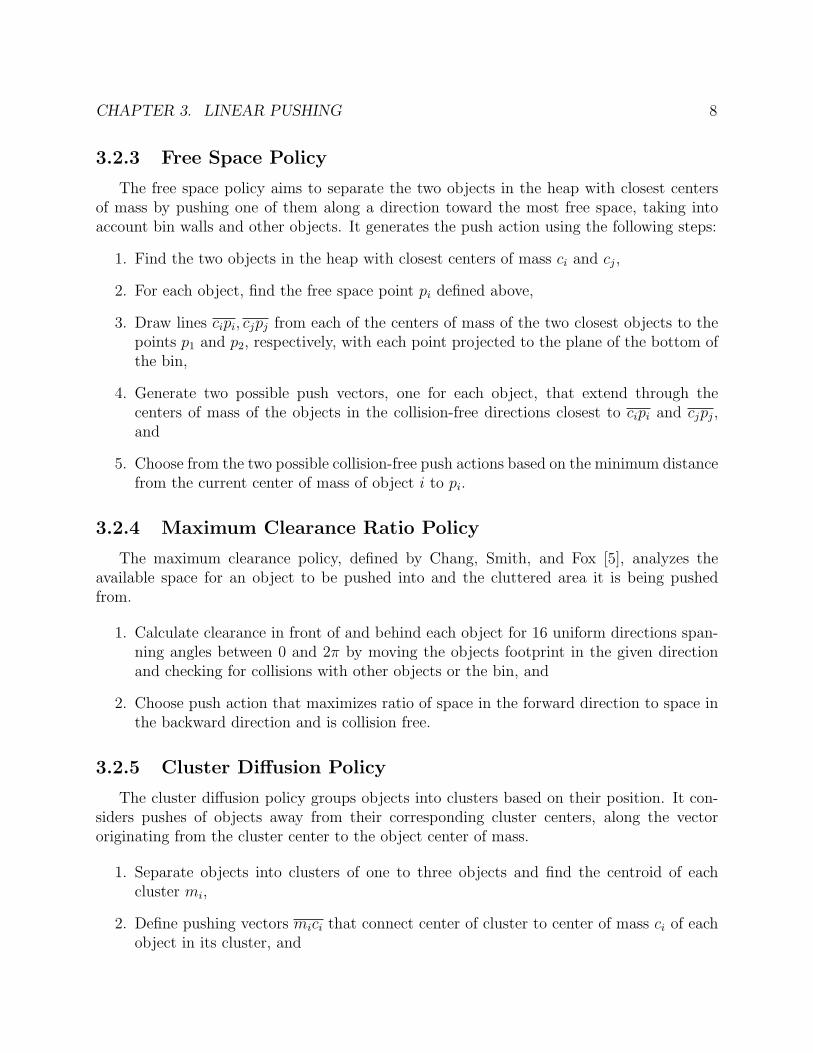
3.2 Means and standard errors of the mean for each policy and each type of endeffector. These results suggest pushing has a larger effect on the parallel jaws. Wespeculate that this effect occurs due to suction grasps relying on faces of objectsbeing available, and are thus less likely to be affected by pushing, whereas paralleljaw grasps are heavily affected by space around the object. . . . . . . . . . . . . 10
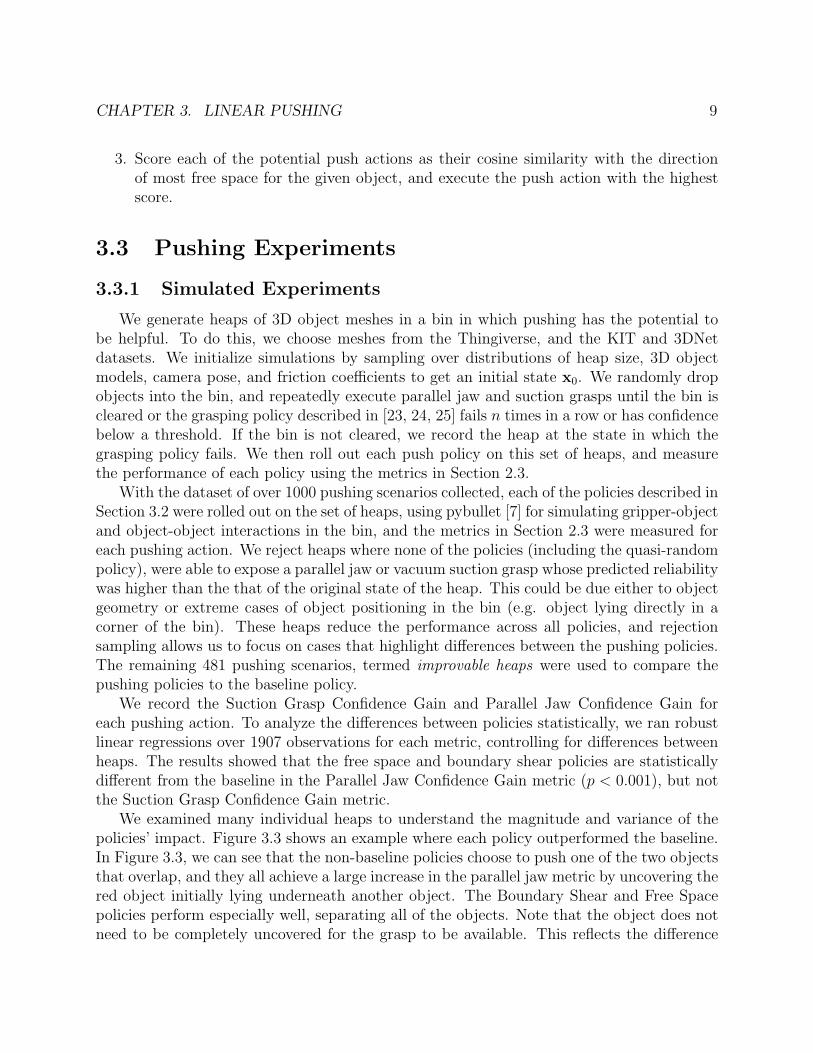
3.3 For this heap, each policy outperforms the baseline. The initial state with theplanned action (top row) and final state after executing the planned action (bot-tom row) are shown for each policy. The blue arrow represents the planned pushand the the initial gripper position is represented by the tail of the arrow, whilethe final position is represented by the head. . . . . . . . . . . . . . . . . . . . . 10
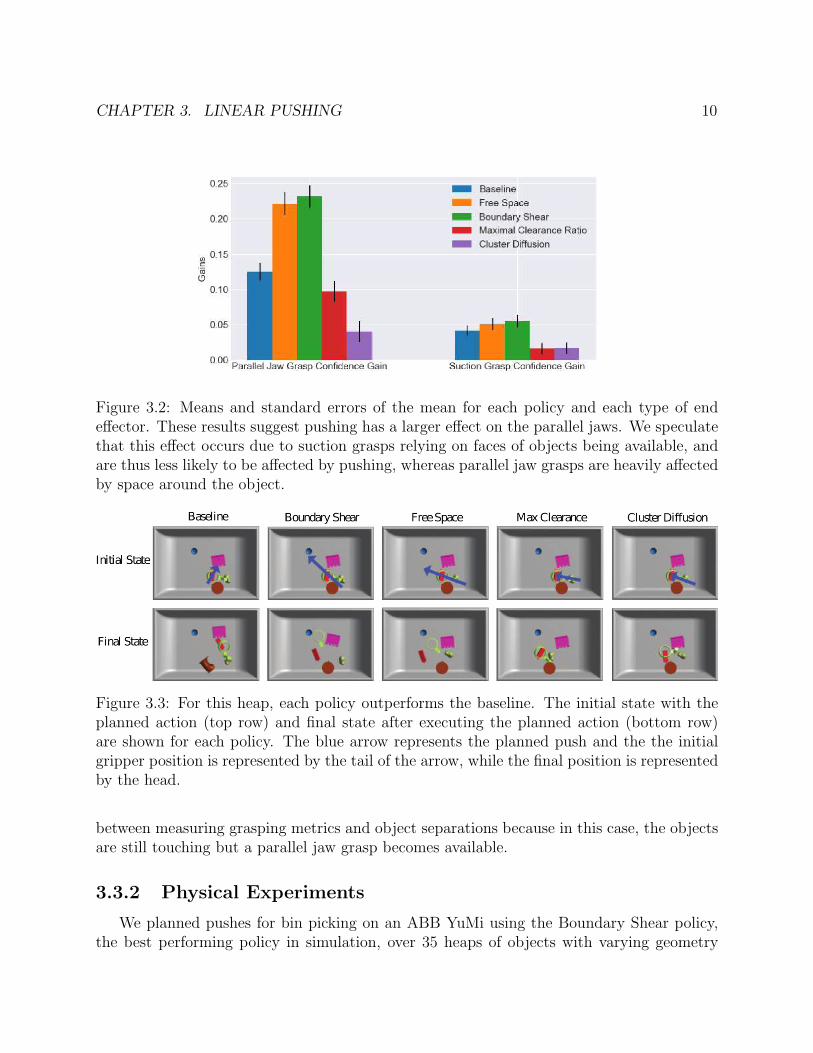
3.4 The baseline marginally outperforms all the other policies. The initial state withthe planned action (top row) and final state after executing the planned action(bottom row) are shown for each policy. The blue arrow represents the plannedpush and the the initial gripper position is represented by the tail of the arrow,while the final position is represented by the head. . . . . . . . . . . . . . . . . . 11
4.1 Toppling the “Yoda Piggybank” object exposes access to a robust vacuum suctiongrasp. . . . . . . . . . . . . . . . . . . . . . . . . . . . . . . . . . . . . . . . . . 13
4.2 Illustration of the forces acting on the object. The point pusher produces a wrenchaccording to the force ff and the moment arm rf , defined between the contactpoint and its projection on the edge. Gravity produces a wrench according tothe gravitational force fg and the moment arm rg, defined between the center ofmass and its projection onto the edge. . . . . . . . . . . . . . . . . . . . . . . . 14
4.3 (a) The topple action produces unit velocity vectors v(sn) across the topplingedge, which the object-workspace interaction resists via its pressure distributionp(sn). The coordinate frame origin is at the projection of the center of mass ontothe toppling edge, and the y-axis is parallel to the toppling edge. (b) and (c)demonstrate the dichotomy between the maximal ft (b) and τz (c) the object canresist, depending on the direction of v(sn). . . . . . . . . . . . . . . . . . . . . . 15
iv
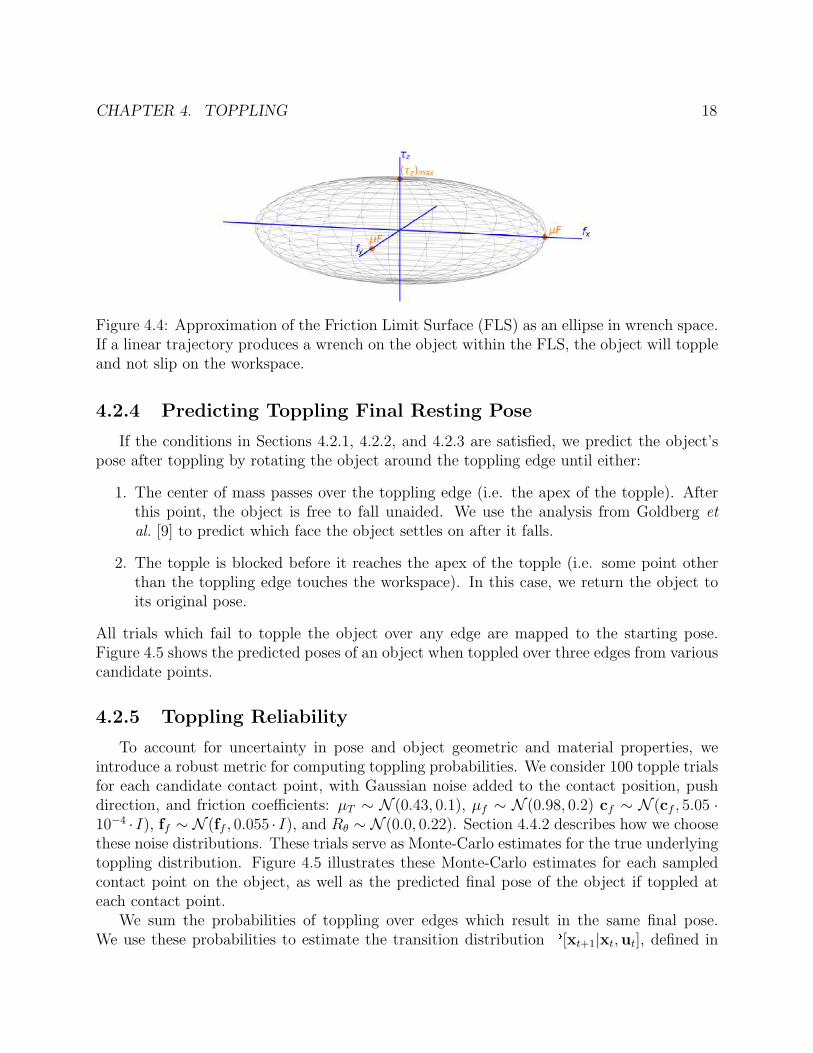
4.4 Approximation of the Friction Limit Surface (FLS) as an ellipse in wrench space.If a linear trajectory produces a wrench on the object within the FLS, the objectwill topple and not slip on the workspace. . . . . . . . . . . . . . . . . . . . . . 18
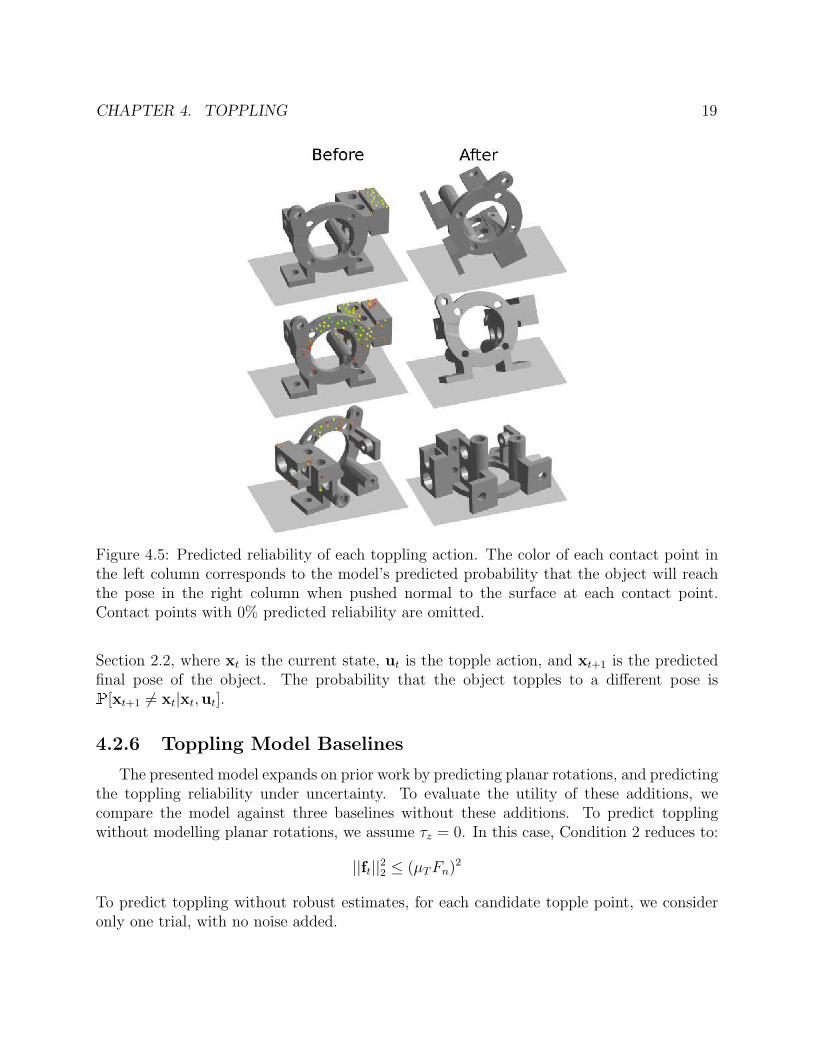
4.5 Predicted reliability of each toppling action. The color of each contact point inthe left column corresponds to the model’s predicted probability that the objectwill reach the pose in the right column when pushed normal to the surface ateach contact point. Contact points with 0% predicted reliability are omitted. . . 19
4.6 Toppling Graph: The object in Figure 4.5 starts at Pose 0. All poses that areattainable via linear topple actions are shown. The border color corresponds tothe reliability of the best available suction grasp of the object in the pose, andthe edges are labelled with the probability of success for the best linear toppleaction. . . . . . . . . . . . . . . . . . . . . . . . . . . . . . . . . . . . . . . . . . 22
4.7 The objects used in physical experiments. . . . . . . . . . . . . . . . . . . . . . 224.8 Each point in the t-SNE visualization represents a model with a different choice of
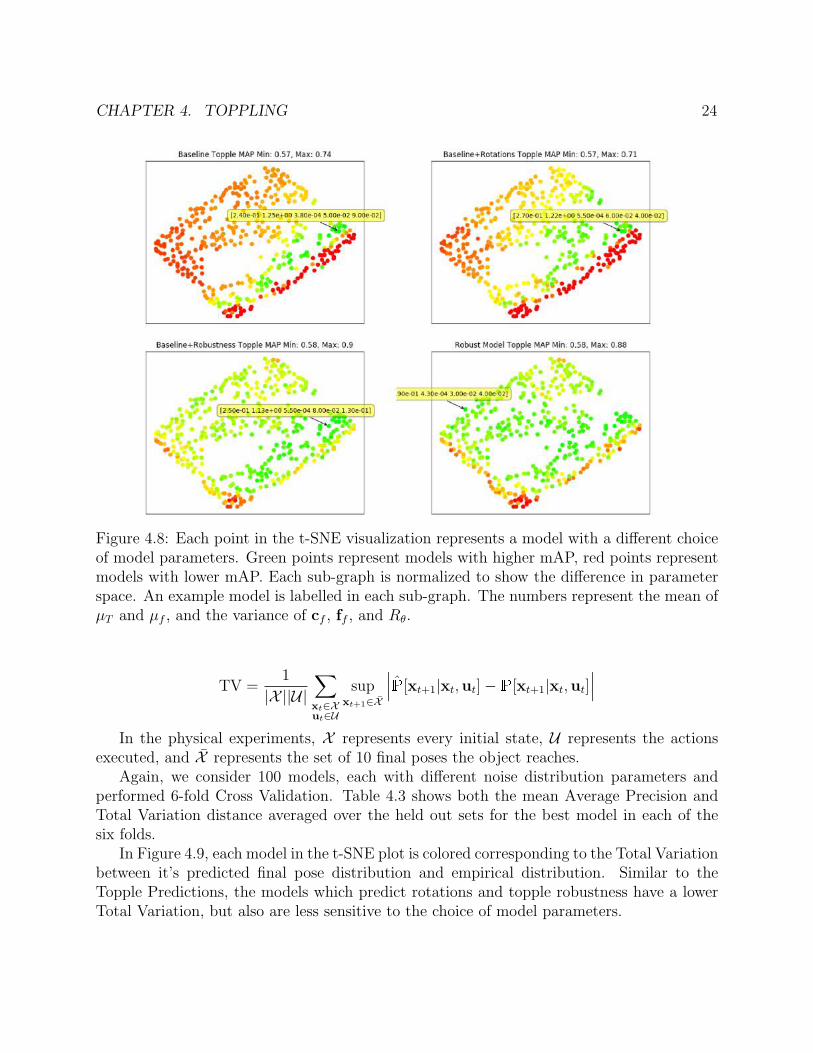
model parameters. Green points represent models with higher mAP, red pointsrepresent models with lower mAP. Each sub-graph is normalized to show thedifference in parameter space. An example model is labelled in each sub-graph.The numbers represent the mean of µT and µf , and the variance of cf , ff , and Rθ. 24
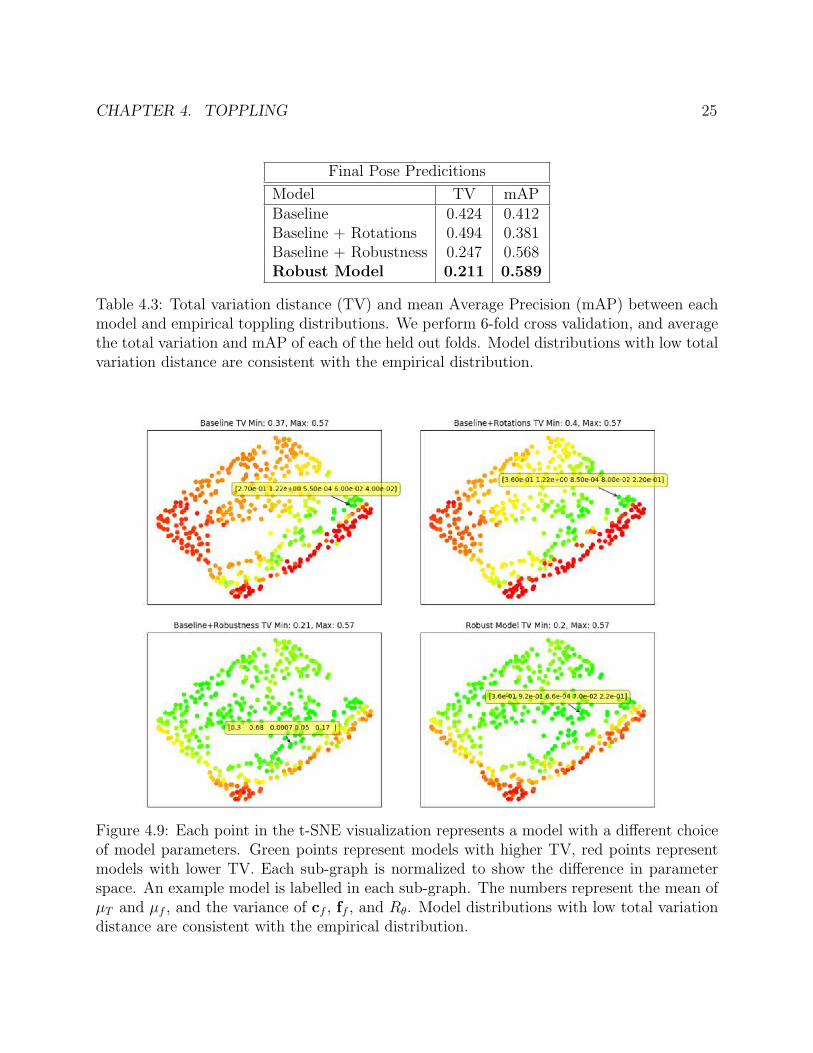
4.9 Each point in the t-SNE visualization represents a model with a different choiceof model parameters. Green points represent models with higher TV, red pointsrepresent models with lower TV. Each sub-graph is normalized to show the dif-ference in parameter space. An example model is labelled in each sub-graph.The numbers represent the mean of µT and µf , and the variance of cf , ff , andRθ. Model distributions with low total variation distance are consistent with theempirical distribution. . . . . . . . . . . . . . . . . . . . . . . . . . . . . . . . . 25
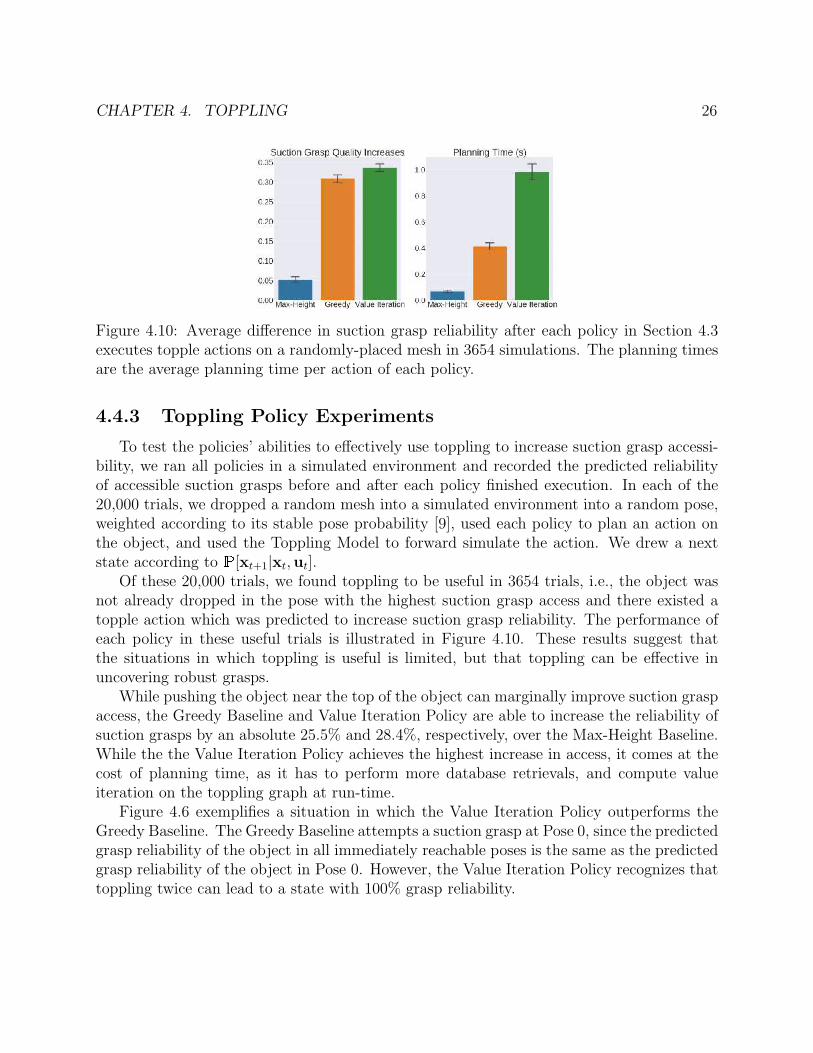
4.10 Average difference in suction grasp reliability after each policy in Section 4.3executes topple actions on a randomly-placed mesh in 3654 simulations. Theplanning times are the average planning time per action of each policy. . . . . . 26
4.11 Failure modes from physical experiments. (a) Momentum causes the object toroll further than predicted (b) the model correctly predicts the point pusher willslip, but the object still topples as the point pusher slips (c) the model correctlypredicts the object will slip on the workspace, but the object first rotates thentopples. . . . . . . . . . . . . . . . . . . . . . . . . . . . . . . . . . . . . . . . . 27
v
List of Tables
4.1 Robust Model and all considered baselines to evaluate performance against phys-ical experiments. . . . . . . . . . . . . . . . . . . . . . . . . . . . . . . . . . . . 20
4.2 Mean Average Precision (mAP) for each model’s prediction of toppling into anynew pose, based on the empirical data collected. We perform k-fold cross valida-tion, and average the mAP of each of the held-out folds. . . . . . . . . . . . . . 23
4.3 Total variation distance (TV) and mean Average Precision (mAP) between eachmodel and empirical toppling distributions. We perform 6-fold cross validation,and average the total variation and mAP of each of the held out folds. Modeldistributions with low total variation distance are consistent with the empiricaldistribution. . . . . . . . . . . . . . . . . . . . . . . . . . . . . . . . . . . . . . . 25
vi
Acknowledgments
I would like to thank my research advisor Ken Goldberg. Professor Goldberg challengedme to critically analyze my work, which allowed me to become the best researcher I couldbecome.
I also would like to thank my mentors Jeffrey Mahler and Michael Danielczuk. Theirguidance helped shape not only my research, but also the way I approach increasingly com-plex problems and I will remember their advice for all of my future endeavors.
I would also like to thank Professor Ruzena Bajcsy for her mentorship in the field ofRobotics, and her advice through my academic career. I also thank Professor Bajcsy for herhelp as part of my Master’s Thesis committee.
Finally, I would like to thank my family for their support throughout my undergraduateand graduate career at the University of California, Berkeley.
1
Chapter 1
Introduction
1.1 Overview
Grasping a wide variety of objects is essential in home de-cluttering, e-commerce ware-house manipulation, manufacturing, and service robotics. However, the ability to perceiveand execute reliable grasps may be limited due to a lack of visibility of graspable pointson the object, kinematic feasibility or environment collisions. Non-prehensile actions suchas pushing and toppling can be attempted before grasping in order to reorient objects intoposes with increased visibility and access to robust grasps.
Planar pushing has the the potential to separate objects from environmental obstacles,exposing antipodal surfaces for parallel jaw grasps. Previous pushing work measures thesuccess of pushes as the degree of separation between objects and attempts to minimizethe number of push actions to achieve separation [5, 8]. We explore directly using graspconfidence metrics instead of an indirect metric such as object separation for comparisonof push policies, and attempt to maximize grasp confidence over a single push action. Thismetric differs from previous formulations because a push does not need to completely separatean object to reveal a grasp. In addition, to increase access to grasps on every object, therobot may not need to execute several pushes, as pushing to reveal a grasp, and subsequentlyexecute that grasp could reveal more grasps of nearby objects.
We observe that planar pushing is able to expose robust parallel jaw grasps, but is lesseffective in exposing robust vacuum suction grasps. In contrast, toppling, the act of pushingan object into a new static resting pose with a robotic point contact, can be used to exposenew surfaces for robust vacuum suction grasps.
Models of toppling for extruded 2D shapes have been developed in prior work by Lynch [17,19] and Zhang et al. [37]. In this thesis, we extend these models to 3D objects by predictingplanar rotations and topple actions that are not perpendicular to the topple edge, and esti-mate topple reliability under uncertainty in object and gripper position, friction coefficients,and push direction.
We find that it is sometimes necessary to execute intermediate topple actions in order to
CHAPTER 1. INTRODUCTION 2
expose a robust suction grasp. Therefore, we develop toppling policies which plan sequencesof toppling actions to increase access to robust suction grasps, using suction grasp analysisfrom Dex-Net 3.0 [25].
1.2 Summary of Contribution
This thesis presents a novel metric for evaluating non-prehensile actions. We evaluate anon-prehensile action based on its ability to expose robust grasps. We present a formulationof sequential pushing and toppling as a Markov Decision Process (MDP). We present twonovel pushing policies based on targeting free space and diffusing clusters of objects, atoppling policy and two toppling baseline policies targeting poses with exposed flat surfaces.We use the proposed metrics to evaluate these policies by their ability to expose robustparallel jaw and vacuum suction grasps. In 20,000 simulated experiments, the proposedtoppling policy increases suction grasp reliability by an absolute 28.4% over the Max-HeightBaseline.
This thesis also presents a quasi-static dynamics model for the MDP that estimates topplereliability for a 3D polyhedral mesh when pushed at a given point under uncertainty in objectand gripper position, friction coefficients, and push direction. We run 700 physical topplingexperiments using an ABB YuMi robot and 3D printed objects. We run a parameter sweepover the uncertainty parameters for object and gripper position, friction coefficients, pushdirection, and object pose to match the model’s predictions with empirical outcomes. Usingthe optimal parameters, we generate a dataset of 1,257,000 candidate toppling points on189 3D CAD models in a total of 1257 stable poses, each labelled with associated topplingreliabilities. The proposed model outperforms the baseline model by an absolute 26.9%, whencomparing the total variation of each predicted distribution with the empirical distribution.
1.3 Related Work
1.3.1 Planar Pushing
Mason pioneered research on analytic models of push mechanics [26]. Lynch and Akelladescribed the mechanics of stable pushing and described how to create a plan for controlledpushing of an object through a series of obstacles [2, 18, 20, 21]. “Singulation” appliespushing mechanics and planning to the task of separating or extracting objects that lie closetogether, and it is often required for successful object recognition or grasping. Model-basedapproaches such as the one proposed by Cosgun et al. [6] planned a series of robot actions toclear space for a target object in two-dimensional, tabletop pushing scenarios. Eitel et al. [8]explore singulation in clutter using a push proposal convolutional neural network, showingthat they can separate up to 8 objects with at least a 40% success rate in an average of 11push actions. In contrast to their work, which seeks to minimize the number of push actions
CHAPTER 1. INTRODUCTION 3
to separate all objects, we find one push at each opportunity, take into account bin wallsand corners, and analyze push success based on new metrics.
1.3.2 Reorienting to a New Stable Pose
One approach to reorient objects to new stable poses designs robotic grippers with multi-ple contact points designed specifically for the objects of interest, in order to execute severalpinching motions while closing the gripper around the object [36, 35]. These grippers per-form well with a single object, but do not generalize to the arbitrary objects on which robotsare expected to operate. Pivoting, another reorienting motion primitive, is the act of looselypicking up objects so that they can rotate around the parallel jaw gripper’s axis due togravity [4, 31]. Holladay et al. [11] introduce a pivot dynamics model and Hou et al. [12]combine pivoting and “rolling”, rotating the arm while stiffly gripping the object, to moreefficiently reorient objects. However, these papers assume two-finger grasps are available onthe object, in which case toppling to find robust grasps is unnecessary. We extend thesepapers by reorienting when grasps are not available.
1.3.3 Toppling
Previous work has developed physics-based quasi-static models of toppling behavior onconveyor belts [17, 19, 37] and with robotic hands to move heavy objects [1]. Yamashitaet al. [34] explore the use of multiple cooperative robots to topple objects. However, thesemodels only predict motions of 2D extruded shapes, do not model object resistance to planarrotations, and only model pushes perpendicular to the toppling edge. Lee et al. [16] discretizeall possible poses of the object, search for the contact points necessary to hold the object ineach pose, and determine a trajectory to topple the object over. Learning-based approacheshave been developed to predict object motions from just RGB images [14, 28, 15], and to learna toppling policy from demonstrations [30]. These approaches do not require knowledge ofthe object geometry, but also only operate on 2D extruded shapes. In this paper, we presenta model which predicts the toppling behavior of pushes in arbitrary directions for 3D objectsbeyond 2D extrusions.
4
Chapter 2
Problem Statement
Given a rigid polyhedral object or set of objects which are not graspable in their currentorientation, our goal is to use non-prehensile motions like pushing or toppling to exposea grasp for a robotic parallel jaw gripper or vacuum suction gripper. We formulate thisproblem as a Markov Decision Process (MDP) and present policies for pushing and topplingto maximize the predicted grasp robustness following the non-prehensile actions.
2.1 Assumptions
Throughout this thesis, we make the following assumptions:
1. Quasi-static physics (i.e., inertial terms are negligible).
2. The forces and torques applied by the robot are consistent with the point contact withfriction model [29].
Chapters 3 and 4 describe the assumptions specific to pushing and toppling respectively.
2.2 Definitions
1. State: Let xt = {(O, To)}Nn=0 ∈ X represent the state of every object in a heap at timet. O represents the object’s geometrical properties, material properties, and center ofmass, and To represents the pose of the object.
2. Actions: Let ut = (p,q) ∈ U be the linear trajectory of the point pusher manipulatorin 3D space between the start point p = (x, y, z) and the end point q = (x′, y′, z′).Pushing actions are linear trajectories in which the object slides on the ground andTopple actions are linear trajectories in which the object does not slip, but rotates overan edge.
CHAPTER 2. PROBLEM STATEMENT 5
3. Rewards: The reward for executing each non-prehensile action is 0. After executingall actions, the robot gets a reward Vj(xT ) or Vs(xT ), the predicted reliability of thebest accessible parallel jaw or suction grasp, respectively, of any object in the heap.
4. Transition Distribution: Let P[xt+1|xt,ut] be the probability that the object heaptransitions into state xt+1 when the robot executes action ut.
2.3 Objective
Our ultimate goal is to develop a policy which plans an action or sequence of actions{ut}Tt=1 that maximizes the reliability of the best available grasp at time T . The planarpushing policies execute a single action, as grasps revealed from pushing can be executed,therefore revealing further robust grasps of the other objects. The toppling policies executea sequence of actions, as it is often necessary to topple the object more than once to revealan optimal face for suction grasps. We consider a subset of the toppling problem where theobject is singulated and on a planar workspace to simplify the problem for the presentedtoppling model.
For the purpose of this analysis, the multi-step policies pick a fixed time horizon trajec-tory, and execute “no-op” actions ∅ if they predict no action will increase access to suctiongrasps.
∆V = maxu0..T
E [V (xT )]− V (x1)
s.t. ut ∈ U ∪ {∅}This formulation differs from the standard MDP formulation in that the reward is only
applicable for the final action. Although the fixed horizon formulation doesn’t explicitlypenalize taking unnecessary actions, the policies presented in this thesis attempt to reachthe goal state with the fewest actions.
We define the Parallel Jaw Grasp Confidence Gain and Suction Grasp Confidence Gainto be ∆V when V (xt) = Vj(xt) and V (xt) = Vs(xt) respectively. While previous work usesobject separation as a metric for non-prehensile actions, we use the grasp quality gain as ametric.
To achieve this goal, we develop several policies to plan and execute non-prehensilemotions with a robot. For topple actions, we develop a model to robustly estimate thetransition distribution under uncertainty in contact point position, friction coefficients, andpush direction. The topple policies use this model to plan future actions and compute anexpected reward for the MDP.
6
Chapter 3
Linear Pushing
3.1 Overview
When objects in clutter cannot be grasped, particularly because of environmental colli-sions, pushing can be used to separate the objects and expose robust grasps. In this chapter,we will describe several pushing policies, and explore the situations in which pushing is ef-fective in exposing robust grasps. We compare the performance of each policy against arandom pushing baseline on 1000 heaps in which initial grasp confidence is low.
In the work presented in this chapter, I helped implement half of the pushing policiesand helped write scripts to execute each policy on object heaps and analyze the results.My co-authors, Michael Danielczuk and Jeffrey Mahler, implemented the other half of thepolicies, integrated the policies in the pyBullet simulation and physical robot, and also wrotescripts to analyze results.
Figure 3.1: Before (left) and after (right) images of successful pushes in simulation (top) andin physical experiments with the ABB YuMi (bottom).
CHAPTER 3. LINEAR PUSHING 7
3.1.1 Pushing Assumptions
1. Object distances are approximated using the object center of mass for purposes offinding free regions in the bin and boundaries between objects.
2. Object center of mass in physical experiments is approximated as the centroid of eachobject’s points from a point cloud.
3.2 Pushing Policies
3.2.1 Quasi-Random Policy
The Quasi-Random Policy generates a linear push action using the following three steps:
1. Choose one object in the heap at random,
2. Choose a direction at random, and
3. Push for a fixed length at the center of mass toward the chosen object in the chosendirection.
The push action is clipped to the bounds of the bin so that the gripper will not collide whenexecuting the action.
3.2.2 Boundary Shear Policy
The boundary shear policy is adapted from the pushing policy introduced in Hermans etal. in [10]. It aims to separate the two closest objects in the heap by pushing one of themalong the boundary between the two objects.
1. Find the two closest objects in the heap with centers of mass ci and cj,
2. Construct a line cicj connecting the centers of mass of the two closest objects projectedto the plane of the bin bottom, and a line cicj⊥ perpendicular to cicj that defines thevector approximating the boundary of the two objects,
3. Generate four possible push vectors, two for each object, that extend through thecenters of mass of the objects in the direction cicj⊥, and
4. Choose the push direction which is closest to the direction of free space and is collisionfree.
CHAPTER 3. LINEAR PUSHING 8
3.2.3 Free Space Policy
The free space policy aims to separate the two objects in the heap with closest centersof mass by pushing one of them along a direction toward the most free space, taking intoaccount bin walls and other objects. It generates the push action using the following steps:
1. Find the two objects in the heap with closest centers of mass ci and cj,
2. For each object, find the free space point pi defined above,
3. Draw lines cipi, cjpj from each of the centers of mass of the two closest objects to thepoints p1 and p2, respectively, with each point projected to the plane of the bottom ofthe bin,
4. Generate two possible push vectors, one for each object, that extend through thecenters of mass of the objects in the collision-free directions closest to cipi and cjpj,and
5. Choose from the two possible collision-free push actions based on the minimum distancefrom the current center of mass of object i to pi.
3.2.4 Maximum Clearance Ratio Policy
The maximum clearance policy, defined by Chang, Smith, and Fox [5], analyzes theavailable space for an object to be pushed into and the cluttered area it is being pushedfrom.
1. Calculate clearance in front of and behind each object for 16 uniform directions span-ning angles between 0 and 2π by moving the objects footprint in the given directionand checking for collisions with other objects or the bin, and
2. Choose push action that maximizes ratio of space in the forward direction to space inthe backward direction and is collision free.
3.2.5 Cluster Diffusion Policy
The cluster diffusion policy groups objects into clusters based on their position. It con-siders pushes of objects away from their corresponding cluster centers, along the vectororiginating from the cluster center to the object center of mass.
1. Separate objects into clusters of one to three objects and find the centroid of eachcluster mi,
2. Define pushing vectors mici that connect center of cluster to center of mass ci of eachobject in its cluster, and
CHAPTER 3. LINEAR PUSHING 9
3. Score each of the potential push actions as their cosine similarity with the directionof most free space for the given object, and execute the push action with the highestscore.
3.3 Pushing Experiments
3.3.1 Simulated Experiments
We generate heaps of 3D object meshes in a bin in which pushing has the potential tobe helpful. To do this, we choose meshes from the Thingiverse, and the KIT and 3DNetdatasets. We initialize simulations by sampling over distributions of heap size, 3D objectmodels, camera pose, and friction coefficients to get an initial state x0. We randomly dropobjects into the bin, and repeatedly execute parallel jaw and suction grasps until the bin iscleared or the grasping policy described in [23, 24, 25] fails n times in a row or has confidencebelow a threshold. If the bin is not cleared, we record the heap at the state in which thegrasping policy fails. We then roll out each push policy on this set of heaps, and measurethe performance of each policy using the metrics in Section 2.3.
With the dataset of over 1000 pushing scenarios collected, each of the policies described inSection 3.2 were rolled out on the set of heaps, using pybullet [7] for simulating gripper-objectand object-object interactions in the bin, and the metrics in Section 2.3 were measured foreach pushing action. We reject heaps where none of the policies (including the quasi-randompolicy), were able to expose a parallel jaw or vacuum suction grasp whose predicted reliabilitywas higher than the that of the original state of the heap. This could be due either to objectgeometry or extreme cases of object positioning in the bin (e.g. object lying directly in acorner of the bin). These heaps reduce the performance across all policies, and rejectionsampling allows us to focus on cases that highlight differences between the pushing policies.The remaining 481 pushing scenarios, termed improvable heaps were used to compare thepushing policies to the baseline policy.
We record the Suction Grasp Confidence Gain and Parallel Jaw Confidence Gain foreach pushing action. To analyze the differences between policies statistically, we ran robustlinear regressions over 1907 observations for each metric, controlling for differences betweenheaps. The results showed that the free space and boundary shear policies are statisticallydifferent from the baseline in the Parallel Jaw Confidence Gain metric (p < 0.001), but notthe Suction Grasp Confidence Gain metric.
We examined many individual heaps to understand the magnitude and variance of thepolicies’ impact. Figure 3.3 shows an example where each policy outperformed the baseline.In Figure 3.3, we can see that the non-baseline policies choose to push one of the two objectsthat overlap, and they all achieve a large increase in the parallel jaw metric by uncovering thered object initially lying underneath another object. The Boundary Shear and Free Spacepolicies perform especially well, separating all of the objects. Note that the object does notneed to be completely uncovered for the grasp to be available. This reflects the difference
CHAPTER 3. LINEAR PUSHING 10
Figure 3.2: Means and standard errors of the mean for each policy and each type of endeffector. These results suggest pushing has a larger effect on the parallel jaws. We speculatethat this effect occurs due to suction grasps relying on faces of objects being available, andare thus less likely to be affected by pushing, whereas parallel jaw grasps are heavily affectedby space around the object.
Figure 3.3: For this heap, each policy outperforms the baseline. The initial state with theplanned action (top row) and final state after executing the planned action (bottom row)are shown for each policy. The blue arrow represents the planned push and the the initialgripper position is represented by the tail of the arrow, while the final position is representedby the head.
between measuring grasping metrics and object separations because in this case, the objectsare still touching but a parallel jaw grasp becomes available.
3.3.2 Physical Experiments
We planned pushes for bin picking on an ABB YuMi using the Boundary Shear policy,the best performing policy in simulation, over 35 heaps of objects with varying geometry
CHAPTER 3. LINEAR PUSHING 11
Figure 3.4: The baseline marginally outperforms all the other policies. The initial state withthe planned action (top row) and final state after executing the planned action (bottom row)are shown for each policy. The blue arrow represents the planned push and the the initialgripper position is represented by the tail of the arrow, while the final position is representedby the head.
such as tools, toys, produce, and industrial parts. Each heap contained between two andten objects in configurations with few accessible grasps, such as two bottles side-by-side.For each heap, the robot acquired a point cloud of the bin with a Photoneo PhoXi depthsensor, segmented the point cloud using Euclidean Cluster Extraction implemented in thePoint Cloud Library [32], and planned a push using point clusters as objects and the clustercentroid as an estimate of the center of mass of each object. The robot then executed thepush by closing the parallel jaw gripper and following the linear push trajectory. Each pushtook approximately 1.0 seconds to plan.
For each push, we measured the Overall Grasp Confidence Gain of parallel-jaw andsuction grasps planned by a Grasp Quality Neural Network policy [24, 25]. We categorizedperformance based on the grasp confidence for the best grasp in the initial heap (pre-pushing).Heaps with Qo < 0.25 had an Overall Grasp Quality Gain of 0.24 ± 0.07, while heaps withQo < 0.5 had an Overall Grasp Quality Gain of 0.12± 0.06.
3.4 Failure Modes and Limitations
In Figure 3.4, we can see that the non-baseline policies fail to find a collision-free pushthat can move one of the objects away from the corner of the bin. The baseline policy’s actionis clipped so that it does not collide with the bin, and results in it slightly increasing theparallel jaw grasp confidence by nudging the green object further from the other object. Thenon-baseline policies have no effect on the grasp confidence metrics. This figure illustratesone of the current failure modes with the pushing policies that we have implemented. Bytaking a conservative approach and avoiding collisions at all costs, we are sometimes unableto plan a push that moves the objects away from the bin edges.
In addition, the results in Figure 3.2 imply that pushing affects the parallel jaw grasps
CHAPTER 3. LINEAR PUSHING 12
more than it affects suction grasps. Pushing actions typically move objects around the bin,but rarely topple them onto a new face or side. Suction relies on sampling grasps on thetop faces of the objects; if the face does not change, then it is unlikely that the suctiongrasp confidence will change significantly. However, for the parallel jaws, grasp confidencedepends strongly on available space around the object. Thus, pushing an object to a morefree location can shift the parallel jaw grasp confidence more dramatically.
13
Chapter 4
Toppling
4.1 Overview
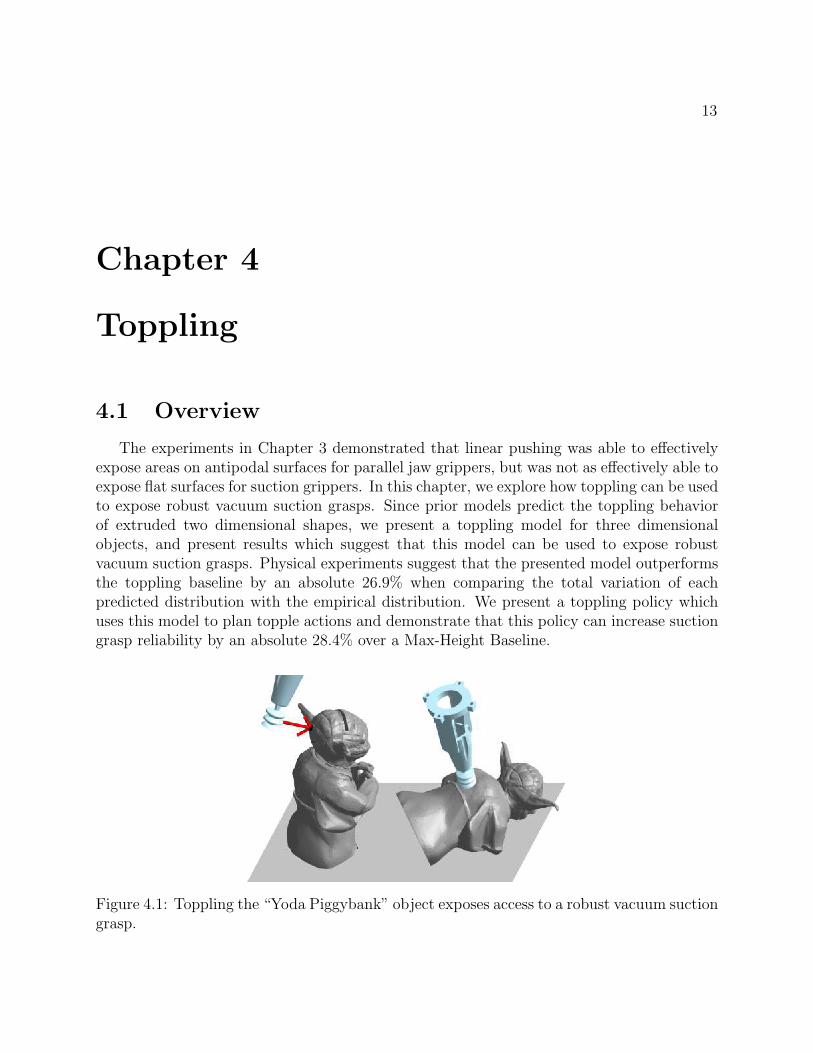
The experiments in Chapter 3 demonstrated that linear pushing was able to effectivelyexpose areas on antipodal surfaces for parallel jaw grippers, but was not as effectively able toexpose flat surfaces for suction grippers. In this chapter, we explore how toppling can be usedto expose robust vacuum suction grasps. Since prior models predict the toppling behaviorof extruded two dimensional shapes, we present a toppling model for three dimensionalobjects, and present results which suggest that this model can be used to expose robustvacuum suction grasps. Physical experiments suggest that the presented model outperformsthe toppling baseline by an absolute 26.9% when comparing the total variation of eachpredicted distribution with the empirical distribution. We present a toppling policy whichuses this model to plan topple actions and demonstrate that this policy can increase suctiongrasp reliability by an absolute 28.4% over a Max-Height Baseline.
Figure 4.1: Toppling the “Yoda Piggybank” object exposes access to a robust vacuum suctiongrasp.
CHAPTER 4. TOPPLING 14
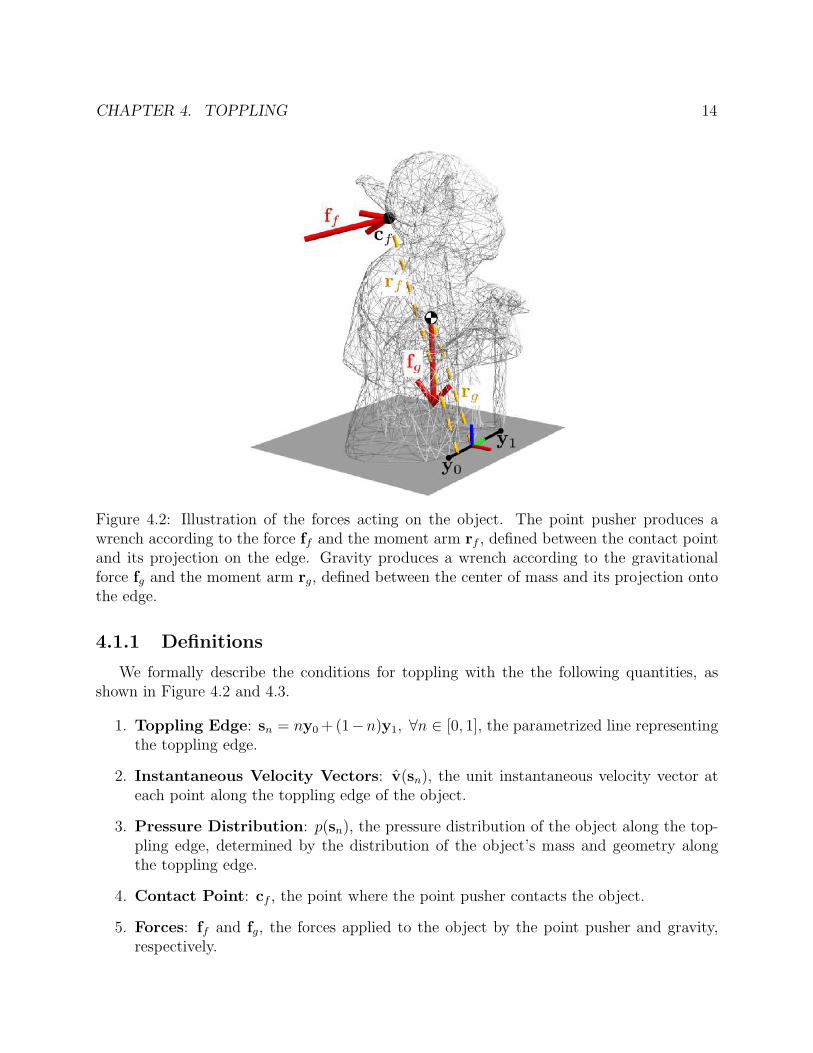
Figure 4.2: Illustration of the forces acting on the object. The point pusher produces awrench according to the force ff and the moment arm rf , defined between the contact pointand its projection on the edge. Gravity produces a wrench according to the gravitationalforce fg and the moment arm rg, defined between the center of mass and its projection ontothe edge.
4.1.1 Definitions
We formally describe the conditions for toppling with the the following quantities, asshown in Figure 4.2 and 4.3.
1. Toppling Edge: sn = ny0 + (1−n)y1, ∀n ∈ [0, 1], the parametrized line representingthe toppling edge.
2. Instantaneous Velocity Vectors: v(sn), the unit instantaneous velocity vector ateach point along the toppling edge of the object.
3. Pressure Distribution: p(sn), the pressure distribution of the object along the top-pling edge, determined by the distribution of the object’s mass and geometry alongthe toppling edge.
4. Contact Point: cf , the point where the point pusher contacts the object.
5. Forces: ff and fg, the forces applied to the object by the point pusher and gravity,respectively.
CHAPTER 4. TOPPLING 15
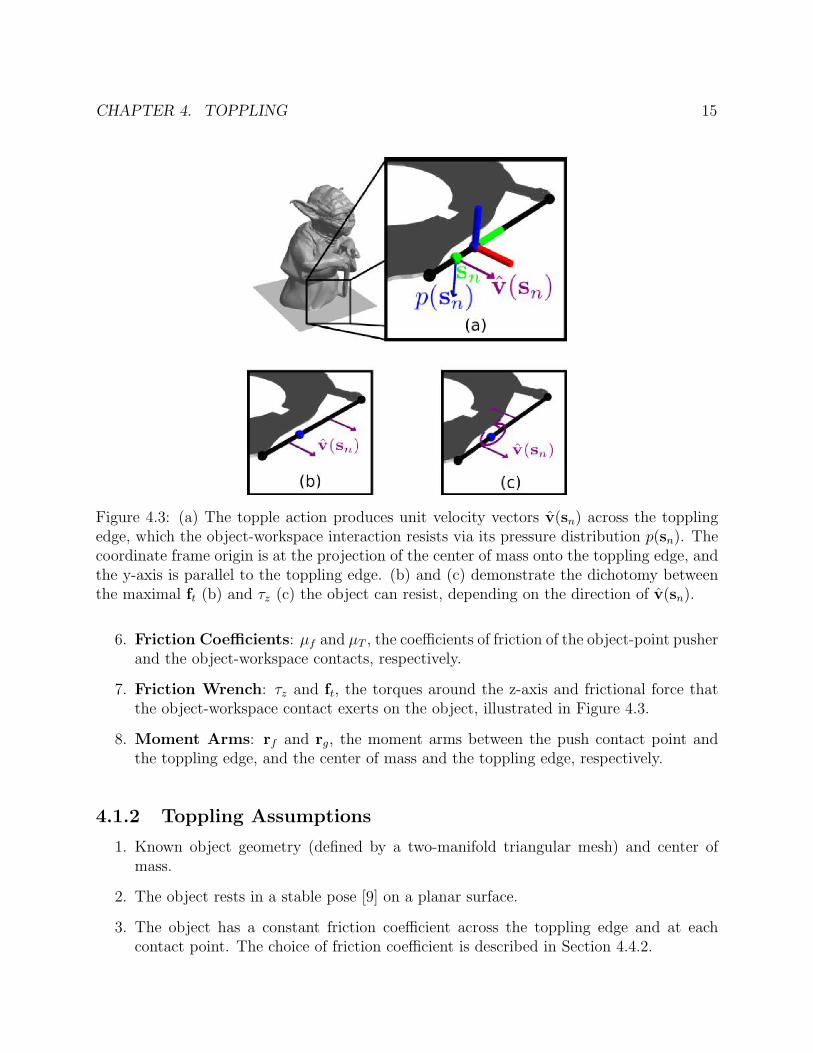
Figure 4.3: (a) The topple action produces unit velocity vectors v(sn) across the topplingedge, which the object-workspace interaction resists via its pressure distribution p(sn). Thecoordinate frame origin is at the projection of the center of mass onto the toppling edge, andthe y-axis is parallel to the toppling edge. (b) and (c) demonstrate the dichotomy betweenthe maximal ft (b) and τz (c) the object can resist, depending on the direction of v(sn).
6. Friction Coefficients: µf and µT , the coefficients of friction of the object-point pusherand the object-workspace contacts, respectively.
7. Friction Wrench: τz and ft, the torques around the z-axis and frictional force thatthe object-workspace contact exerts on the object, illustrated in Figure 4.3.
8. Moment Arms: rf and rg, the moment arms between the push contact point andthe toppling edge, and the center of mass and the toppling edge, respectively.
4.1.2 Toppling Assumptions
1. Known object geometry (defined by a two-manifold triangular mesh) and center ofmass.
2. The object rests in a stable pose [9] on a planar surface.
3. The object has a constant friction coefficient across the toppling edge and at eachcontact point. The choice of friction coefficient is described in Section 4.4.2.
CHAPTER 4. TOPPLING 16
4. The object’s pressure distribution is modelled as two point contacts on the endpointsof the toppling edge.
5. The object is singulated and rests in a stable pose on a planar workspace.
4.2 Toppling Model
We develop a quasi-static models to estimate the topple reliability for a given contactpoint and push direction. We define the base of the object to be the convex hull of theobject’s vertices touching the workspace. For each edge on the base, we check the followingthree conditions, to determine if ut will topple the object.
1. Contact Slip: The point pusher does not slip on the object.
2. Workspace Slip: The contact between the toppling edge and the workspace can resistthe wrench applied by the point pusher.
3. Minimum Push Force: The wrench applied by the point pusher has a magnitudelarge enough to rotate the object over the given edge.
If multiple edges satisfy these conditions, the model predicts the object will topple over theedge which requires the least force applied by the point pusher. We then use quasi-staticanalysis to predict the pose of the object after it topples over the predicted edge [9].
The model presented in this section expands on the model by Lynch et al. [19] by usingthe Friction Limit Surface [13] to predict planar rotations and by using Monte Carlo samplingto predict topple reliability under uncertainty.
4.2.1 Condition 1: Contact Slip
If the point pusher slips on the contact point, the proposed quasi-static model predicts itwill not be able to apply the required force to topple the object. The point pusher will notslip on the object as long as the it presses on the object in a direction within the object’sfriction cone at the point of contact.[
(ff )x′ (ff )y′ (ff )z′]T
= Tcff√(ff )2
x′ + (ff )2y′ ≤ µf (ff )z′
Tc ∈ SE(3) is the rigid transformation from the world coordinate system to the coordinatesystem defined at the contact point cf . (ff )x′ , (ff )y′ , (ff )z′ are the x, y, and z components offf relative to a coordinate frame defined at the contact point.
CHAPTER 4. TOPPLING 17
4.2.2 Condition 2: Workspace Slip
If the object slips either tangentially on the workspace or rotationally along an axisperpendicular to the workspace, the force applied at the contact point will result in theobject moving in the plane instead of toppling. To determine whether a predicted push willtopple the object or cause the object to slip on the workspace, we apply the friction limitsurface model described in [13]. The friction limit surface describes the set of wrenches theobject-workspace contact can resist before the object slips on the workspace. If the wrenchapplied by the point pusher is within this set of resistable wrenches, the object will topple.
We can integrate the infinitesimal forces applied by the object along the toppling edgeto find the tangential force ft and torque around the z-axis τz which the object-workspacecontact can resist due to friction:
ft = −∫ 1
n=0
µT v(sn)p(sn)dn
τz =
∫ 1
n=0
µT ||sn × v(sn)||2p(sn)dn
The tangential force that the object-workspace contact can resist is maximized whenv(sn) is constant across the toppling edge (Figure 4.3b), and the torque around the z-axisis maximized when the instantaneous velocities all produce torques in the same directionaround the z-axis (Figure 4.3c), where Fn = mg.
||ft||2 ≤ µTFn
τz ≤∫ 1
n=0
µT ||sn||2p(sn)dn
≤ (τz)max
For our experiments, we assume the object’s pressure distribution is defined as two pointmasses on the endpoints of the toppling edge, though other distributions can be substituted.In this case, (τz)max = µTFn
2[y1 + y0].
We approximate the set of wrenches the friction contact can exert (the Friction LimitSurface) with an ellipse in wrench space [13], defined by the maximum tangential force androtational torque. The friction limit surface in wrench space is visualized in Figure 4.4.
||ft||22(µTFn)2
+τ 2z
(τz)2max
≤ 1
4.2.3 Condition 3: Minimum Push Force
The applied force produces a torque around the toppling edge. If the magnitude ofthis torque is less than the magnitude of the torque caused by gravity, then the object willnot topple. An object such as the one in Figure 4.2 will rotate at the toppling edge if||rf × f ′f ||2 ≥ ||rg × fg||2, where f ′f is the component of ff orthogonal to the toppling edge.
CHAPTER 4. TOPPLING 18
Figure 4.4: Approximation of the Friction Limit Surface (FLS) as an ellipse in wrench space.If a linear trajectory produces a wrench on the object within the FLS, the object will toppleand not slip on the workspace.
4.2.4 Predicting Toppling Final Resting Pose
If the conditions in Sections 4.2.1, 4.2.2, and 4.2.3 are satisfied, we predict the object’spose after toppling by rotating the object around the toppling edge until either:
1. The center of mass passes over the toppling edge (i.e. the apex of the topple). Afterthis point, the object is free to fall unaided. We use the analysis from Goldberg etal. [9] to predict which face the object settles on after it falls.
2. The topple is blocked before it reaches the apex of the topple (i.e. some point otherthan the toppling edge touches the workspace). In this case, we return the object toits original pose.
All trials which fail to topple the object over any edge are mapped to the starting pose.Figure 4.5 shows the predicted poses of an object when toppled over three edges from variouscandidate points.
4.2.5 Toppling Reliability
To account for uncertainty in pose and object geometric and material properties, weintroduce a robust metric for computing toppling probabilities. We consider 100 topple trialsfor each candidate contact point, with Gaussian noise added to the contact position, pushdirection, and friction coefficients: µT ∼ N (0.43, 0.1), µf ∼ N (0.98, 0.2) cf ∼ N (cf , 5.05 ·10−4 · I), ff ∼ N (ff , 0.055 · I), and Rθ ∼ N (0.0, 0.22). Section 4.4.2 describes how we choosethese noise distributions. These trials serve as Monte-Carlo estimates for the true underlyingtoppling distribution. Figure 4.5 illustrates these Monte-Carlo estimates for each sampledcontact point on the object, as well as the predicted final pose of the object if toppled ateach contact point.
We sum the probabilities of toppling over edges which result in the same final pose.We use these probabilities to estimate the transition distribution P[xt+1|xt,ut], defined in
CHAPTER 4. TOPPLING 19
Figure 4.5: Predicted reliability of each toppling action. The color of each contact point inthe left column corresponds to the model’s predicted probability that the object will reachthe pose in the right column when pushed normal to the surface at each contact point.Contact points with 0% predicted reliability are omitted.
Section 2.2, where xt is the current state, ut is the topple action, and xt+1 is the predictedfinal pose of the object. The probability that the object topples to a different pose isP[xt+1 6= xt|xt,ut].
4.2.6 Toppling Model Baselines
The presented model expands on prior work by predicting planar rotations, and predictingthe toppling reliability under uncertainty. To evaluate the utility of these additions, wecompare the model against three baselines without these additions. To predict topplingwithout modelling planar rotations, we assume τz = 0. In this case, Condition 2 reduces to:
||ft||22 ≤ (µTFn)2
To predict toppling without robust estimates, for each candidate topple point, we consideronly one trial, with no noise added.
CHAPTER 4. TOPPLING 20
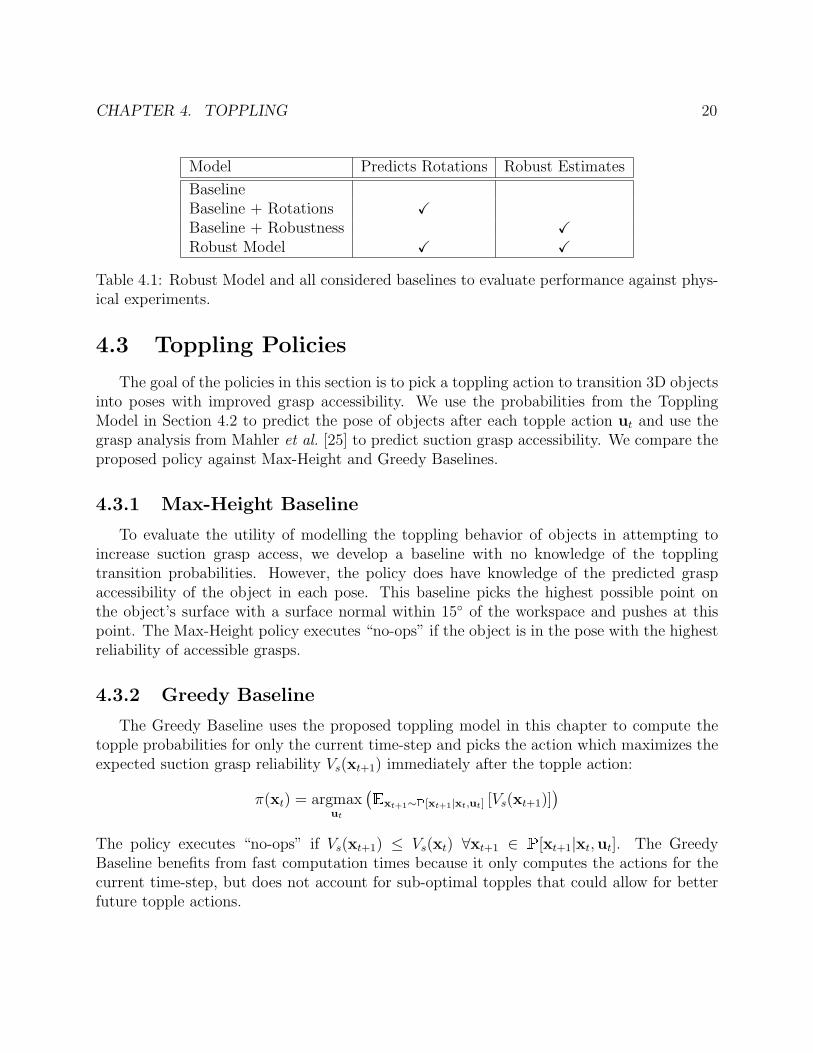
Model Predicts Rotations Robust Estimates
BaselineBaseline + Rotations XBaseline + Robustness XRobust Model X X
Table 4.1: Robust Model and all considered baselines to evaluate performance against phys-ical experiments.
4.3 Toppling Policies
The goal of the policies in this section is to pick a toppling action to transition 3D objectsinto poses with improved grasp accessibility. We use the probabilities from the TopplingModel in Section 4.2 to predict the pose of objects after each topple action ut and use thegrasp analysis from Mahler et al. [25] to predict suction grasp accessibility. We compare theproposed policy against Max-Height and Greedy Baselines.
4.3.1 Max-Height Baseline
To evaluate the utility of modelling the toppling behavior of objects in attempting toincrease suction grasp access, we develop a baseline with no knowledge of the topplingtransition probabilities. However, the policy does have knowledge of the predicted graspaccessibility of the object in each pose. This baseline picks the highest possible point onthe object’s surface with a surface normal within 15◦ of the workspace and pushes at thispoint. The Max-Height policy executes “no-ops” if the object is in the pose with the highestreliability of accessible grasps.
4.3.2 Greedy Baseline
The Greedy Baseline uses the proposed toppling model in this chapter to compute thetopple probabilities for only the current time-step and picks the action which maximizes theexpected suction grasp reliability Vs(xt+1) immediately after the topple action:
π(xt) = argmaxut
(Ext+1∼P[xt+1|xt,ut] [Vs(xt+1)]
)The policy executes “no-ops” if Vs(xt+1) ≤ Vs(xt) ∀xt+1 ∈ P[xt+1|xt,ut]. The GreedyBaseline benefits from fast computation times because it only computes the actions for thecurrent time-step, but does not account for sub-optimal topples that could allow for betterfuture topple actions.
CHAPTER 4. TOPPLING 21
4.3.3 Value Iteration Policy
The Value Iteration Toppling Policy considers sub-optimal poses by assigning a valueto each pose defined as the maximum suction grasp reliability for any pose reachable withlinear topple actions, according to the transition probabilities generated by the model inSection 4.2.5.
The policy generates a graph of the toppling MDP, such as the one in Figure 4.6, wherethe nodes represent the object’s stable poses, and the edges represent topple actions. Thepolicy assigns each action a value QT (xt,ut), based on the discounted suction grasp reliabilityof future object states following action ut, using Value Iteration [33]:
QT (xt,ut) = Ext+1∼P[xt+1|xt,ut] [VT (xt+1)]
VT (xt) = max
(Vs(xt), γ max
ut
QT (xt,ut)
)We choose γ = 0.95 as our discount factor. After computing Value Iteration, the
policy executes the action with the highest q-value QT (xt,ut), or “no-ops” if VT (xt+1) ≤VT (xt) ∀xt+1 ∈ P[xt+1|xt,ut].
4.4 Experiments
4.4.1 Dataset Generation
Our goal was to predict the toppling behavior of objects with dense samples of contactpoints across the object’s surface and with a high number of Monte-Carlo trials per sampledcontact point. Since this can be computationally expensive, we pre-computed the toppleprobabilities and final poses for every stable pose of the desired objects, and store these valuesin a database. The pre-computation allowed us to quickly retrieve the toppling probabilitiesfor a wide variety of objects.
We generated a dataset of 1000 candidate topple points on 189 objects in 1257 stableposes, for a total of 1,257,000 candidate topple points. We chose objects which satisfy thefollowing conditions: 1) The object has a stable pose with high grasp reliability (> 50%)and a stable pose with low grasp reliability (< 25%) and 2) the object’s center of mass ishigher in the high grasp reliability pose than in the low grasp reliability pose. We chose acomplex set of objects whose convex hulls had an average of 1437 faces. The average time tocompute the toppling probabilities and final poses for 1000 candidate topple points with 100samples per point is 40.47 seconds per object stable pose on a desktop computer runningUbuntu 16.04 with a 3.6 GHz Intel Core i7-6850k CPU.
4.4.2 Toppling Model Experiments
To compare the predictions of the model and the baselines in Section 4.2.6 with empiricaloutcomes, we ran physical experiments of topple actions on the seven 3D printed objects
CHAPTER 4. TOPPLING 22
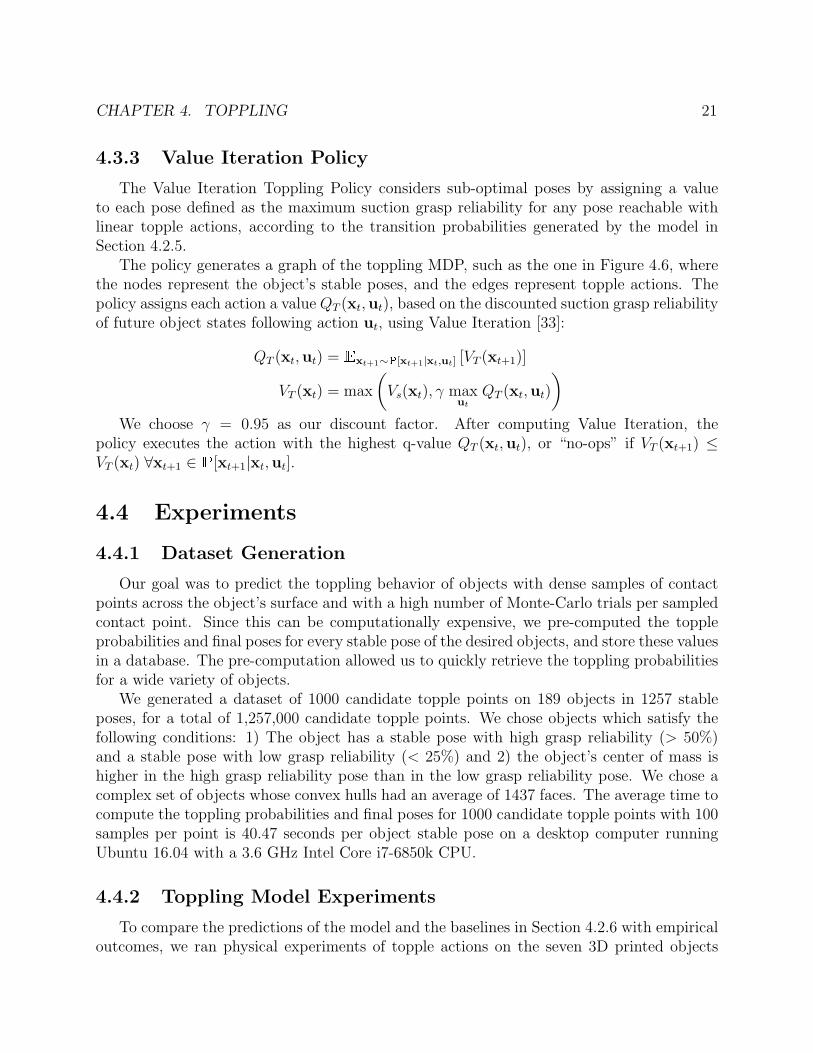
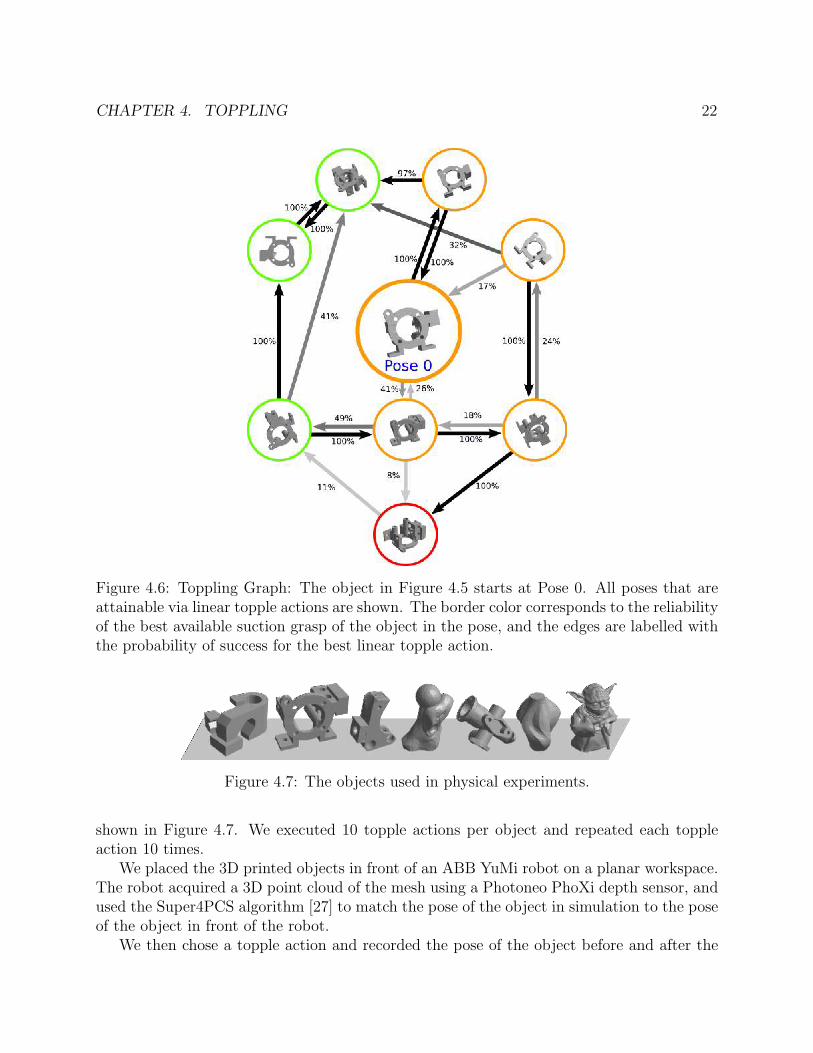
Figure 4.6: Toppling Graph: The object in Figure 4.5 starts at Pose 0. All poses that areattainable via linear topple actions are shown. The border color corresponds to the reliabilityof the best available suction grasp of the object in the pose, and the edges are labelled withthe probability of success for the best linear topple action.
Figure 4.7: The objects used in physical experiments.
shown in Figure 4.7. We executed 10 topple actions per object and repeated each toppleaction 10 times.
We placed the 3D printed objects in front of an ABB YuMi robot on a planar workspace.The robot acquired a 3D point cloud of the mesh using a Photoneo PhoXi depth sensor, andused the Super4PCS algorithm [27] to match the pose of the object in simulation to the poseof the object in front of the robot.
We then chose a topple action and recorded the pose of the object before and after the
CHAPTER 4. TOPPLING 23
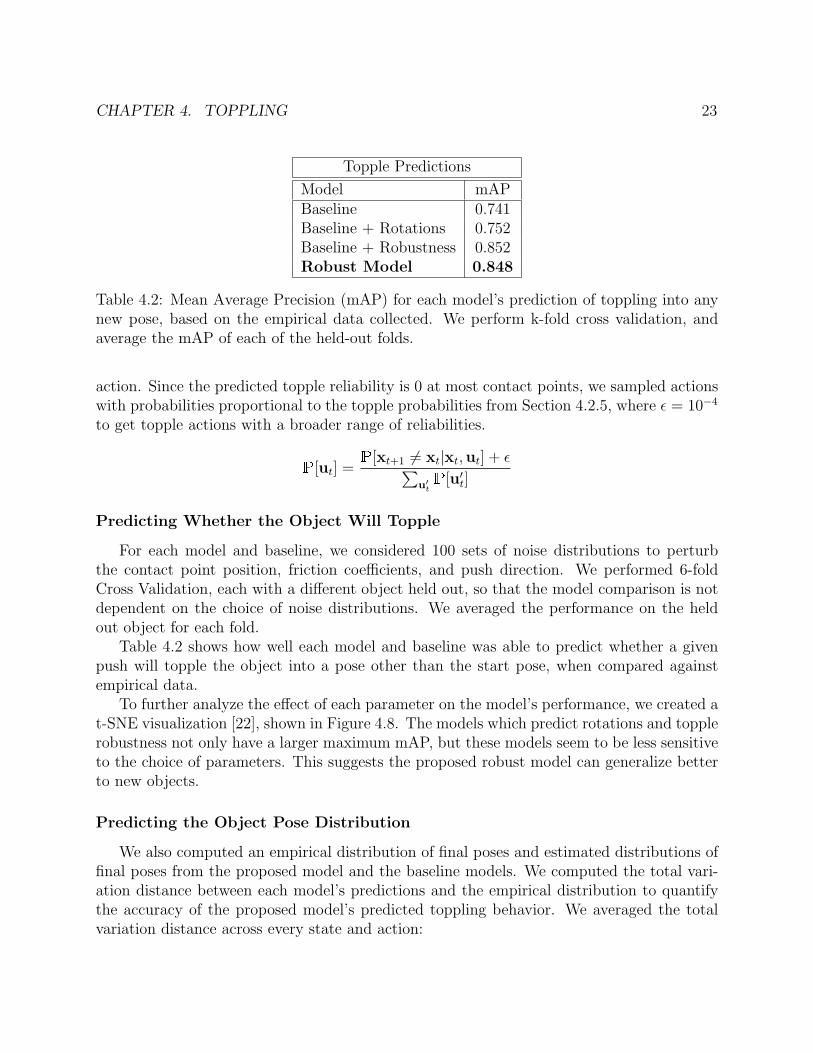
Topple Predictions
Model mAPBaseline 0.741Baseline + Rotations 0.752Baseline + Robustness 0.852Robust Model 0.848
Table 4.2: Mean Average Precision (mAP) for each model’s prediction of toppling into anynew pose, based on the empirical data collected. We perform k-fold cross validation, andaverage the mAP of each of the held-out folds.
action. Since the predicted topple reliability is 0 at most contact points, we sampled actionswith probabilities proportional to the topple probabilities from Section 4.2.5, where ε = 10−4
to get topple actions with a broader range of reliabilities.
P[ut] =P[xt+1 6= xt|xt,ut] + ε∑
u′tP[u′t]
Predicting Whether the Object Will Topple
For each model and baseline, we considered 100 sets of noise distributions to perturbthe contact point position, friction coefficients, and push direction. We performed 6-foldCross Validation, each with a different object held out, so that the model comparison is notdependent on the choice of noise distributions. We averaged the performance on the heldout object for each fold.
Table 4.2 shows how well each model and baseline was able to predict whether a givenpush will topple the object into a pose other than the start pose, when compared againstempirical data.
To further analyze the effect of each parameter on the model’s performance, we created at-SNE visualization [22], shown in Figure 4.8. The models which predict rotations and topplerobustness not only have a larger maximum mAP, but these models seem to be less sensitiveto the choice of parameters. This suggests the proposed robust model can generalize betterto new objects.
Predicting the Object Pose Distribution
We also computed an empirical distribution of final poses and estimated distributions offinal poses from the proposed model and the baseline models. We computed the total vari-ation distance between each model’s predictions and the empirical distribution to quantifythe accuracy of the proposed model’s predicted toppling behavior. We averaged the totalvariation distance across every state and action:
CHAPTER 4. TOPPLING 24
Figure 4.8: Each point in the t-SNE visualization represents a model with a different choiceof model parameters. Green points represent models with higher mAP, red points representmodels with lower mAP. Each sub-graph is normalized to show the difference in parameterspace. An example model is labelled in each sub-graph. The numbers represent the mean ofµT and µf , and the variance of cf , ff , and Rθ.
TV =1
|X ||U|∑xt∈Xut∈U
supxt+1∈X
∣∣∣P[xt+1|xt,ut]−P[xt+1|xt,ut]∣∣∣
In the physical experiments, X represents every initial state, U represents the actionsexecuted, and X represents the set of 10 final poses the object reaches.
Again, we consider 100 models, each with different noise distribution parameters andperformed 6-fold Cross Validation. Table 4.3 shows both the mean Average Precision andTotal Variation distance averaged over the held out sets for the best model in each of thesix folds.
In Figure 4.9, each model in the t-SNE plot is colored corresponding to the Total Variationbetween it’s predicted final pose distribution and empirical distribution. Similar to theTopple Predictions, the models which predict rotations and topple robustness have a lowerTotal Variation, but also are less sensitive to the choice of model parameters.
CHAPTER 4. TOPPLING 25
Final Pose Predicitions
Model TV mAPBaseline 0.424 0.412Baseline + Rotations 0.494 0.381Baseline + Robustness 0.247 0.568Robust Model 0.211 0.589
Table 4.3: Total variation distance (TV) and mean Average Precision (mAP) between eachmodel and empirical toppling distributions. We perform 6-fold cross validation, and averagethe total variation and mAP of each of the held out folds. Model distributions with low totalvariation distance are consistent with the empirical distribution.
Figure 4.9: Each point in the t-SNE visualization represents a model with a different choiceof model parameters. Green points represent models with higher TV, red points representmodels with lower TV. Each sub-graph is normalized to show the difference in parameterspace. An example model is labelled in each sub-graph. The numbers represent the mean ofµT and µf , and the variance of cf , ff , and Rθ. Model distributions with low total variationdistance are consistent with the empirical distribution.
CHAPTER 4. TOPPLING 26
Figure 4.10: Average difference in suction grasp reliability after each policy in Section 4.3executes topple actions on a randomly-placed mesh in 3654 simulations. The planning timesare the average planning time per action of each policy.
4.4.3 Toppling Policy Experiments
To test the policies’ abilities to effectively use toppling to increase suction grasp accessi-bility, we ran all policies in a simulated environment and recorded the predicted reliabilityof accessible suction grasps before and after each policy finished execution. In each of the20,000 trials, we dropped a random mesh into a simulated environment into a random pose,weighted according to its stable pose probability [9], used each policy to plan an action onthe object, and used the Toppling Model to forward simulate the action. We drew a nextstate according to P[xt+1|xt,ut].
Of these 20,000 trials, we found toppling to be useful in 3654 trials, i.e., the object wasnot already dropped in the pose with the highest suction grasp access and there existed atopple action which was predicted to increase suction grasp reliability. The performance ofeach policy in these useful trials is illustrated in Figure 4.10. These results suggest thatthe situations in which toppling is useful is limited, but that toppling can be effective inuncovering robust grasps.
While pushing the object near the top of the object can marginally improve suction graspaccess, the Greedy Baseline and Value Iteration Policy are able to increase the reliability ofsuction grasps by an absolute 25.5% and 28.4%, respectively, over the Max-Height Baseline.While the the Value Iteration Policy achieves the highest increase in access, it comes at thecost of planning time, as it has to perform more database retrievals, and compute valueiteration on the toppling graph at run-time.
Figure 4.6 exemplifies a situation in which the Value Iteration Policy outperforms theGreedy Baseline. The Greedy Baseline attempts a suction grasp at Pose 0, since the predictedgrasp reliability of the object in all immediately reachable poses is the same as the predictedgrasp reliability of the object in Pose 0. However, the Value Iteration Policy recognizes thattoppling twice can lead to a state with 100% grasp reliability.
CHAPTER 4. TOPPLING 27
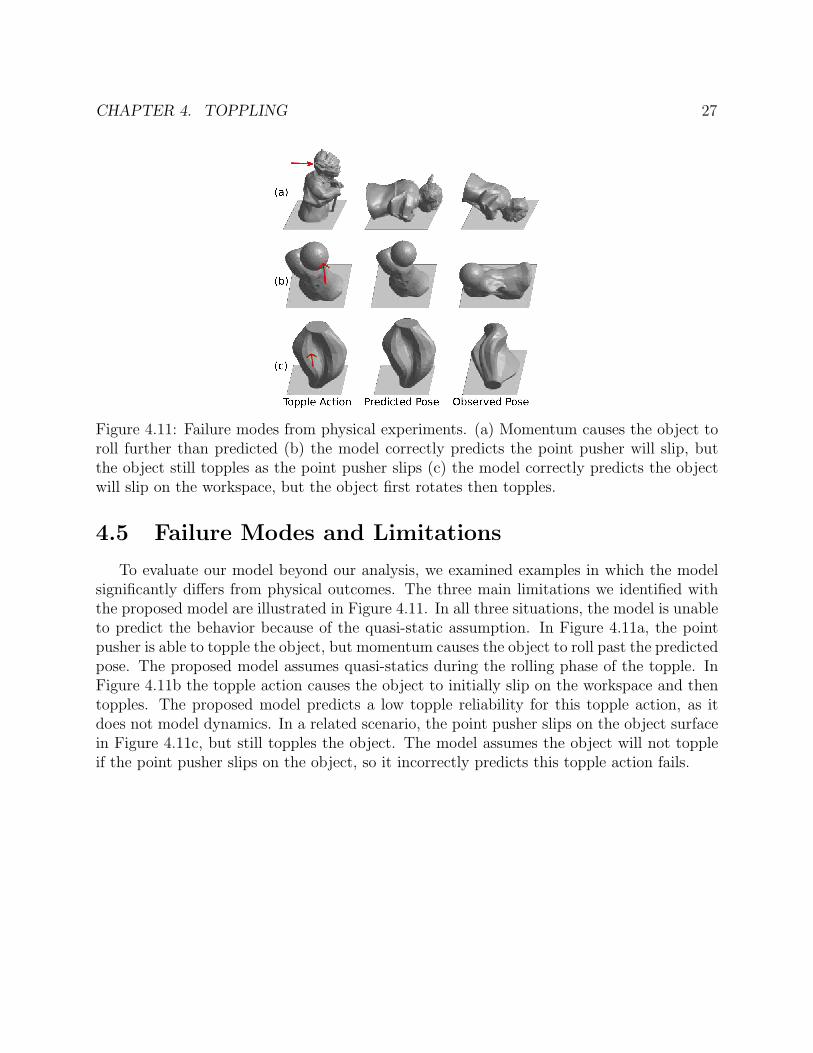
Figure 4.11: Failure modes from physical experiments. (a) Momentum causes the object toroll further than predicted (b) the model correctly predicts the point pusher will slip, butthe object still topples as the point pusher slips (c) the model correctly predicts the objectwill slip on the workspace, but the object first rotates then topples.
4.5 Failure Modes and Limitations
To evaluate our model beyond our analysis, we examined examples in which the modelsignificantly differs from physical outcomes. The three main limitations we identified withthe proposed model are illustrated in Figure 4.11. In all three situations, the model is unableto predict the behavior because of the quasi-static assumption. In Figure 4.11a, the pointpusher is able to topple the object, but momentum causes the object to roll past the predictedpose. The proposed model assumes quasi-statics during the rolling phase of the topple. InFigure 4.11b the topple action causes the object to initially slip on the workspace and thentopples. The proposed model predicts a low topple reliability for this topple action, as itdoes not model dynamics. In a related scenario, the point pusher slips on the object surfacein Figure 4.11c, but still topples the object. The model assumes the object will not toppleif the point pusher slips on the object, so it incorrectly predicts this topple action fails.
28
Chapter 5
Discussion and Future Work
In this thesis, we explored several policies for pushing and toppling. Simulated andphysical experiments suggest that pushing can be used when object grasps are occluded byenvironmental obstacles by separating target objects from other objects or bin walls. Pushingcan be used to expose robust parallel jaw grasps, because parallel jaws require exposedantipodal faces, but is less useful in exposing robust vacuum suction grasps, because suctiongrippers require exposed flat surfaces at the top of the object. In contrast, toppling can beused when vacuum suction grasps are inaccessible because of rough local surface geometry,by transitioning target objects to new stable poses, exposing new flat surfaces. Simulatedexperiments suggest that toppling can be used to expose vacuum suction grasps. In orderto plan toppling actions, we expand upon prior toppling models in this thesis, to predicttoppling behavior of 3D polyhedral objects, predict planar rotations and translations, andpredict toppling under uncertainty. Physical experiments comparing the proposed model andseveral baselines against physical outcomes suggest that the model outperforms the baselinemodel by an absolute 26.9% when using the Total Variation metric.
5.1 Pushing Future Work
In this work, we assume that if none of the five policies were able to prove grasp quality,then the heap is not improvable. Some heaps may be improvable by a policy not tested inthis work. In the future, we will determine why some heaps are not able to be improved andseek a method for determining when heaps can be improved without testing several policieson them. For example, when objects are entangled, or cannot easily be pushed due to objectpose or shape, we could attempt a different push or grasp action. Additionally, we madestrong assumptions about the boundaries, geometries, and poses of the objects that wereanalyzed by representing them as points at their center of mass for finding free space in thebin. We seek to modify our simulations to calculate minimum distances between meshesmore efficiently while still accounting for the entirety of the objects. We also will look toexploit quicker free space computation in image space as an alternative to our current object
CHAPTER 5. DISCUSSION AND FUTURE WORK 29
assumptions.
5.2 Toppling Future Work
In future work, we would explore toppling in clutter, where objects may be resting onother objects and not on a stable resting pose. In addition, the model will have to predictwhether a topple action would result in the object toppling into a stable pose or rest onto anew object. We would also like to relax the model’s assumptions, such as the approximationof the object’s pressure distribution as two point masses at the endpoints of each edge. Wealso hope to explore more complex toppling policies such as multi-arm topple actions, suchas the one presented by Yamashita et al. [34] and non-linear topple motions. In addition toevaluating the proposed model with physical experiments, we would like to execute toppleactions in simulation and compare its performance to that of the proposed model. In certainsituations, objects lie in flat stable poses, and no topple action is able to change the objectspose. We hope to design a manipulator that can flip objects over from the bottom usingsimilar toppling analysis in order to reorient the object. Finally, we would like to explorepre-computing a dataset of the topple Q-Values, to decrease planning time for the ValueIteration Policy.
5.3 Shared Future Work
A composite policy which chooses a pushing or toppling action would be the most naturalextension of the work presented in this thesis. This would involve extending toppling toclutter. When toppling in clutter, an action which fails to the object may still expose arobust grasp by clearing away environmental obstacles. Since the presented pushing policiesdon’t predict the grasp reliability after the push, they cannot be directly compared to thetoppling policies in a composite policy. Another extension would be to explore the use ofnon-prehensile motions in active perception [3]. Pushing and toppling are tools in order toaccomplish higher level tasks, such as bin de-cluttering and mechanical search. In futurework, we would like to explore how to use the policies explored in this thesis in these morecomplicated tasks. Finally, we would like to explore actions that are more complex thanlinear trajectories for pushing and toppling.
30
Bibliography
[1] Yasumichi Aiyama, Masayuki Inaba, and Hirochika Inoue. “Pivoting: A new method ofgraspless manipulation of object by robot fingers”. In: Intelligent Robots and Systems’93, IROS’93. Proceedings of the 1993 IEEE/RSJ International Conference on. Vol. 1.IEEE. 1993, pp. 136–143.
[2] Srinivas Akella and Matthew T Mason. “Posing polygonal objects in the plane bypushing”. In: Int. Journal of Robotics Research (IJRR) 17.1 (1998), pp. 70–88.
[3] Ruzena Bajcsy. “Active perception”. In: Proceedings of the IEEE 76.8 (1988), pp. 966–1005.
[4] Brian Carlisle et al. “A pivoting gripper for feeding industrial parts”. In: ICRA. 1994,pp. 1650–1655.
[5] Lillian Chang, Joshua R Smith, and Dieter Fox. “Interactive singulation of objectsfrom a pile”. In: Proc. IEEE Int. Conf. Robotics and Automation (ICRA). IEEE.2012, pp. 3875–3882.
[6] Akansel Cosgun et al. “Push planning for object placement on cluttered table surfaces”.In: Proc. IEEE/RSJ Int. Conf. on Intelligent Robots and Systems (IROS). IEEE. 2011,pp. 4627–4632.
[7] E Coumans, Y Bai, and J Hsu. Pybullet physics simulator. url: http://pybullet.org.
[8] Andreas Eitel, Nico Hauff, and Wolfram Burgard. “Learning to Singulate Objects usinga Push Proposal Network”. In: Int. S. Robotics Research (ISRR). 2017.
[9] Ken Goldberg et al. “Part pose statistics: Estimators and experiments”. In: IEEETransactions on Robotics and Automation 15.5 (1999), pp. 849–857.
[10] Tucker Hermans, James M Rehg, and Aaron Bobick. “Guided pushing for object sin-gulation”. In: Proc. IEEE/RSJ Int. Conf. on Intelligent Robots and Systems (IROS).IEEE. 2012, pp. 4783–4790.
[11] Anne Holladay, Robert Paolini, and Matthew T Mason. “A general framework foropen-loop pivoting”. In: Robotics and Automation (ICRA), 2015 IEEE InternationalConference on. IEEE. 2015, pp. 3675–3681.
BIBLIOGRAPHY 31
[12] Yifan Hou, Zhenzhong Jia, and Matthew T Mason. “Fast Planning for 3D Any-Pose-Reorienting Using Pivoting”. In: 2018 IEEE International Conference on Robotics andAutomation (ICRA). IEEE. 2018, pp. 1631–1638.
[13] Imin Kao, Kevin Lynch, and Joel Burdick. “Contact Modeling and Manipulation”. In:Springer Handbook of Robotics. Springer, 2008, pp. 946–949.
[14] Marek Kopicki, Jeremy Wyatt, and Rustam Stolkin. “Prediction learning in roboticpushing manipulation”. In: 2009 International Conference on Advanced Robotics. IEEE.2009, pp. 1–6.
[15] Marek Kopicki et al. “Learning to predict how rigid objects behave under simple ma-nipulation”. In: 2011 IEEE International Conference on Robotics and Automation.IEEE. 2011, pp. 5722–5729.
[16] Gilwoo Lee, Tomas Lozano-Perez, and Leslie Pack Kaelbling. “Hierarchical planningfor multi-contact non-prehensile manipulation”. In: Intelligent Robots and Systems(IROS), 2015 IEEE/RSJ International Conference on. IEEE. 2015, pp. 264–271.
[17] Kevin M Lynch. “Inexpensive conveyor-based parts feeding”. In: Assembly Automation19.3 (1999), pp. 209–215.
[18] Kevin M Lynch. “The mechanics of fine manipulation by pushing”. In: Robotics andAutomation, 1992. Proceedings., 1992 IEEE International Conference on. IEEE. 1992,pp. 2269–2276.
[19] Kevin M Lynch. “Toppling manipulation”. In: ICRA. 1999, pp. 2551–2557.
[20] Kevin M Lynch and Matthew T Mason. “Controllability of pushing”. In: Roboticsand Automation, 1995. Proceedings., 1995 IEEE International Conference on. Vol. 1.IEEE. 1995, pp. 112–119.
[21] Kevin M Lynch and Matthew T Mason. “Stable pushing: Mechanics, controllabil-ity, and planning”. In: The International Journal of Robotics Research 15.6 (1996),pp. 533–556.
[22] Laurens van der Maaten and Geoffrey Hinton. “Visualizing data using t-SNE”. In:Journal of machine learning research 9.Nov (2008), pp. 2579–2605.
[23] Jeffrey Mahler and Ken Goldberg. “Learning deep policies for robot bin picking by sim-ulating robust grasping sequences”. In: Conference on Robot Learning. 2017, pp. 515–524.
[24] Jeffrey Mahler et al. “Dex-net 2.0: Deep learning to plan robust grasps with syntheticpoint clouds and analytic grasp metrics”. In: Proc. Robotics: Science and Systems(RSS). 2017.
[25] Jeffrey Mahler et al. “Dex-Net 3.0: Computing Robust Robot Suction Grasp Targetsin Point Clouds using a New Analytic Model and Deep Learning”. In: arXiv preprintarXiv:1709.06670 (2017).
BIBLIOGRAPHY 32
[26] Matthew T Mason. Mechanics of robotic manipulation. MIT press, 2001.
[27] Nicolas Mellado, Dror Aiger, and Niloy J Mitra. “Super 4pcs fast global pointcloudregistration via smart indexing”. In: Computer Graphics Forum. Vol. 33. 5. WileyOnline Library. 2014, pp. 205–215.
[28] Thomas Morwald et al. “Predicting the unobservable visual 3d tracking with a proba-bilistic motion model”. In: Robotics and Automation (ICRA), 2011 IEEE InternationalConference on. IEEE. 2011, pp. 1849–1855.
[29] Richard M Murray. A mathematical introduction to robotic manipulation. CRC press,2017.
[30] Nancy S Pollard and Jessica K Hodgins. “Generalizing demonstrated manipulationtasks”. In: Algorithmic Foundations of Robotics V. Springer, 2004, pp. 523–539.
[31] Anil Rao, David J Kriegman, and Kenneth Y Goldberg. “Complete algorithms forfeeding polyhedral parts using pivot grasps”. In: IEEE Transactions on Robotics andAutomation 12.2 (1996), pp. 331–342.
[32] Radu Bogdan Rusu and Steve Cousins. “3d is here: Point cloud library (pcl)”. In: Proc.IEEE Int. Conf. Robotics and Automation (ICRA). IEEE. 2011, pp. 1–4.
[33] Richard S Sutton and Andrew G Barto. Reinforcement learning: An introduction. MITpress, 2018.
[34] Atsushi Yamashita et al. “Motion planning of multiple mobile robots for cooperativemanipulation and transportation”. In: IEEE Transactions on Robotics and Automation19.2 (2003), pp. 223–237.
[35] Mike Tao Zhang and Ken Goldberg. “Designing robot grippers: optimal edge contactsfor part alignment”. In: Robotica 25.3 (2006), pp. 341–349.
[36] Mike Tao Zhang and Ken Goldberg. “Gripper point contacts for part alignment”. In:IEEE Transactions on Robotics and Automation 18.6 (2002), pp. 902–910.
[37] Tao Zhang et al. “The toppling graph: Designing pin sequences for part feeding”. In:Robotics and Automation, 2000. Proceedings. ICRA’00. IEEE International Confer-ence on. Vol. 1. IEEE. 2000, pp. 139–146.