Embed Size (px)
Citation preview
TKK Research Reports in Computer Science and Engineering AEspoo 2009 TKK-CSE-A3/09
FACILITATING ALGORITHM VISUALIZATION
CREATION AND ADOPTION IN EDUCATION
Doctoral Dissertation
Ville Karavirta
Dissertation for the degree of Doctor of Science in Technology to be presented with due permission
of the Faculty of Information and Natural Sciences for public examination and debate in Auditorium
AS1 at Helsinki University of Technology (Espoo, Finland) on 14th of December, 2009, at 12 noon.
Helsinki University of TechnologyFaculty of Information and Natural SciencesDepartment of Computer Science and Engineering
Teknillinen korkeakouluInformaatio- ja luonnontieteiden tiedekuntaTietotekniikan laitos
Distribution:Helsinki University of TechnologyFaculty of Information and Natural SciencesDepartment of Computer Science and EngineeringP.O.Box 5400FI-02015 TKKFINLANDURL: http://www.cse.hut.fi/Tel: +358-9-470 23228Fax: +358-9-470 23293E-mail: [email protected]
© Ville KaravirtaCover photo ©iStockphoto.com/Viorika
ISBN 978–952–248–169–6ISBN 978–952–248–170–2 (PDF)ISSN 1797–6928ISSN 1797–6936 (PDF)URL: http://lib.tkk.fi/Diss/isbn9789522481702/
Multiprint OyEspoo 2009
ABABSTRACT OF DOCTORAL DISSERTATION HELSINKI UNIVERSITY OF TECHNOLOGY
P. O. BOX 1000, FI-02015 TKKhttp://www.tkk.fi
Author Ville Karavirta
Name of the dissertation
Manuscript submitted 29.5.2009 Manuscript revised 6.11.2009
Date of the defence 14.12.2009
Article dissertation (summary + original articles)MonographFacultyDepartmentField of researchOpponent(s)SupervisorInstructor
Abstract
Keywords algorithm animation, effortlessness, algorithm animation language, XAAL
ISBN (printed) 978–952–248–169–6
ISBN (pdf) 978–952–248–170–2
Language English
ISSN (printed) 1797–6928
ISSN (pdf) 1797–6936
Number of pages 120 + app. 100
Publisher Department of Computer Science and Engineering
Print distribution Department of Computer Science and Engineering
The dissertation can be read at http://lib.tkk.fi/Diss/isbn9789522481702/
Facilitating Algorithm Visualization Creation and Adoption in Education
X
Faculty of Information and Natural SciencesDepartment of Computer Science and EngineeringSoftware SystemsProfessor Susan RodgerProfessor Lauri MalmiDocent Ari Korhonen
X
The research question of this thesis is: How can we develop algorithm animations (AA) and AA systems further tobetter facilitate the creation and adoption of AA in education?
The motivation for tackling this issue is that algorithm animation has not been widely used in teaching computerscience. One of the main reasons for not taking full advantage of AA in teaching is the lack of time on behalf of theinstructors. Furthermore, there is a shortage of ready-made, good quality algorithm visualizations.
The main contributions are as follows:
• Effortless Creation of Algorithm Animation. We define a Taxonomy of Effortless Creation of AlgorithmAnimations. In addition, we introduce a new approach for teachers to create animations by allowing effortlesson-the-fly creation of algorithm animations by applying visual algorithm simulation through a simple userinterface.
• Proposed Standard for Algorithm Animation language. We define a Taxonomy of Algorithm AnimationLanguages to help comparing the different AA languages. The taxonomy and work by an internationalworking group is used to define a new algorithm animation language, eXtensible Algorithm AnimationLanguage, XAAL.
• Applications of XAAL in education. We provide two different processing approaches for using andproducing XAAL animations with existing algorithm animation systems. In addition, we have a frameworkaiding in this integration as well as prototype implementations of the processes. Furthermore, we provide anovel solution to the problem of seamlessly integrating algorithm animations with hypertext. In our approach,the algorithm animation viewer is implemented purely with JavaScript and HTML. Finally, we introduce aprocessing model to easily produce lecture slides for a common presentation tool of XAAL animations.

ABVÄITÖSKIRJAN TIIVISTELMÄ TEKNILLINEN KORKEAKOULU
PL 1000, 02015 TKKhttp://www.tkk.fi
Tekijä Ville Karavirta
Väitöskirjan nimi
Käsikirjoituksen päivämäärä 29.5.2009 Korjatun käsikirjoituksen päivämäärä 6.11.2009
Väitöstilaisuuden ajankohta 14.12.2009
Yhdistelmäväitöskirja (yhteenveto + erillisartikkelit)MonografiaTiedekuntaLaitosTutkimusalaVastaväittäjä(t)Työn valvojaTyön ohjaaja
Tiivistelmä
Asiasanat algoritmianimaatio, vaivattomuus, algoritmianimaatiokieli, XAAL
ISBN (painettu) 978–952–248–169–6
ISBN (pdf) 978–952–248–170–2
Kieli Englanti
ISSN (painettu) 1797–6928
ISSN (pdf) 1797–6936
Sivumäärä 120 + liit. 100
Julkaisija Tietotekniikan laitos
Painetun väitöskirjan jakelu Tietotekniikan laitos
Luettavissa verkossa osoitteessa http://lib.tkk.fi/Diss/isbn9789522481702/
Algoritmivisualisaatioiden luomisen ja käyttöönoton helpottaminen opetuksessa
X
Informaatio- ja luonnontieteiden tiedekuntaTietotekniikan laitosOhjelmistojärjestelmätProfessori Susan RodgerProfessori Lauri MalmiDosentti Ari Korhonen
X
Tämän työn tutkimuksen lähtökohtana oli tutkimuskysymys: Miten algoritmivisualisaatioiden luomista jakäyttöönottoa opetuksessa voidaan helpottaa visualisaatioita ja niiden tuottamiseen käytettyjä välineitä kehittämällä?
Motivaationa tutkimukseen on, että algoritmianimaatio ei ole saavuttanut suurta suosiota opettajien keskuudessa.Pääsyy tähän on, että opettajilla ei ole tarpeeksi aikaa animaatioiden luomiseen. Lisäksi valmiista, korkealaatuisistaanimaatioista on pulaa.
Työn keskeiset tulokset ovat seuraavat:
• Algoritmianimaatioiden vaivaton luonti. Ensin työssä tutkitaan miten animaatioiden tekemisestä saataisiinvähemmän vaivalloista. Tähän kysymykseen etsitään ratkaisua määrittämällä tapa mitataanimaatiojärjestelmien vaivattomuutta. Lisäksi esitellään järjestelmä, MatrixPro, joka on vaivatonluentotyökalu opettajille.
• Ehdotus standardiksi algoritmianimaatiokieleksi. Työkaluksi järjestelmien yhteisenalgoritmianimaatiokielen kehittämiseen määrittelemme taksonomian algoritmianimaatiokielten arvioimiseen.Tätä taksonomiaa käytetään hyödyksi määriteltäessä laajennettava algoritmianimaatiokieli (XAAL, eXtensibleAlgorithm Animation Language). Kielen määrittelyssä käytetään hyväksi myös kansainvälisen työryhmänvisiota yhteisestä algoritmianimaatiokielestä.
• XAAL-kielen käyttö opetuksessa. Työssä esittelemme toteutuksen joukolle työkaluja, joka mahdollistaaXAAL-animaatioiden käytön ja luomisen algoritmianimaatiojärjestelmillä. Lisäksi esittelemme uuden tavanliittää animaatioita hyperdokumentteihin. Lopuksi esittelemme mallin tuottaa helposti luentokalvoja yleiselleesitystyökalulle XAAL-animaatioista.

Preface
“A book like this is largely the work of one person. There’s no other single human being
who’s spent as much time as I have thinking about it, persevating over it, changing the
same sentence back and forth between two di!erent versions over and over.”– Steve Krug, Don’t make me think!
While the above quote from Steve Krug is spot on, there are a number of
people without who this thesis would never have been done. First and foremost
I would like to thank my supervisor Professor Lauri Malmi and instructor
Docent Ari Korhonen for providing the facilities to do this work. Their input
and feedback to the work during this process has been highly valuable. Ari
was also the one who hired me as a research assistant back in 2002. This work
has been done in the Software Visualization Group and Computer Science
Education Research Group and I would like to thank all former, current, and
future colleagues.
I am also grateful to the participants of the ITiCSE XML Working Group
for the discussions and ideas during the intensive five-day spell in Portugal. I
would especially want to thank Tom Naps and Guido Roßling for giving me the
chance to be part of the group. Tom also read and gave insightful comments
on an early draft.
Furthermore, I wish to thank my friends and family for the tremendous
support over the years. My greatest gratitude goes to Linda for being special.
Finally, I would like to thank the pre-examiners Professor Scott Grissom
and Professor Pierluigi Crescenzi for their comments to improve this work.
And it is an honor to have Professor Susan Rodger as my opponent.
Otaniemi, 6.11.2009
Ville Karavirta
vii

List of publications and the
contributions of the author
This thesis consists of an introduction and the following publications [P1] - [P7]
[P1] Petri Ihantola, Ville Karavirta, Ari Korhonen, and Jussi Nikander. Tax-onomy of e!ortless creation of algorithm visualizations. In Proceedings of the2005 International workshop on Computing Education Research (ICER), pages123–133, New York, NY, USA, 2005.
This paper introduces a taxonomy of e!ortless creation of algorithm visu-alizations and evaluates some of the existing AV systems. All the authors ofthe paper contributed evenly on all parts of the paper.
[P2] Ville Karavirta, Ari Korhonen, Lauri Malmi, and Kimmo Stalnacke.MatrixPro - A tool for on-the-fly demonstration of data structures and algo-rithms. In Proceedings of the Third Program Visualization Workshop (PVW),pages 26–33, The University of Warwick, UK, 2004.
In this paper, an algorithm animation system called MatrixPro is intro-duced. The system supports on-the-fly creation of animations using visualalgorithm simulation. The work presented in this paper included significantconstructive part. The author of this thesis implemented the system basedon the Matrix algorithm simulation framework. The authors of the papercontributed evenly in writing of the paper, while the main contribution ofKaravirta was in the section describing the system.
[P3] Ville Karavirta, Ari Korhonen, Lauri Malmi, and Thomas Naps. AComprehensive Taxonomy of Algorithm Animation Languages. Journal ofVisual Languages and Computing (accepted).
This paper introduces a taxonomy of algorithm animation languages. Inaddition, there is an evaluation of several existing AA languages.
A first version of the taxonomy was presented in the Master’s thesis ofthe author of this thesis. Karavirta, Korhonen, and Malmi published a pol-ished version of the taxonomy in a conference paper. Finally, this paper wasextended significantly to the current version by all the authors.
ix
[P4] Thomas Naps, Guido Roßling, Peter Brusilovsky, John English, DuaneJarc, Ville Karavirta, Charles Leska, Myles McNally, Andres Moreno, Rock-ford J. Ross, and Jaime Urquiza-Fuentes. Development of XML-based toolsto support user interaction with algorithm visualization. SIGCSE Bulletin,37(4):123–138, 2005.
This paper discusses requirements for a common algorithm animation lan-guage to be used by multiple AA systems. It gives examples and specificationsfor the di!erent elements of AA. The author’s main contributions were in thespecification of the graphical primitives and transformations on them, as wellas the parts of the paper discussing them.
[P5] Ville Karavirta. Integrating algorithm visualization systems. In Pro-ceedings of the Fourth Program Visualization Workshop (PVW), volume 178of Electronic Notes in Theoretical Computer Science, pages 79–87, 2007.
This paper describes a new algorithm animation language called ExtensibleAlgorithm Animation Language, Xaal. In addition, the paper shows howXaal can be used to transfer algorithm animations between AA systems.The work presented in this paper included significant constructive part. Theauthor of this thesis is the sole author of this work.
[P6] Ville Karavirta. Seamless merging of hypertext and algorithm anima-tion. ACM Transactions on Computing Education, 9(2):1–17, 2009.
This paper presents an algorithm animation viewer implemented purelyusing HTML and JavaScript making this solution suitable to be used in hy-pertext learning material due to the advanced interaction possibilities betweenlearning material (HTML) and the animation. The work presented in this pa-per included significant constructive part. The author of this thesis is the soleauthor of this work.
[P7] Ville Karavirta, Guido Roßling, and Otto Seppala. Automatic gener-ation of algorithm animations for lecture slides. TKK Technical Reports inComputer Science and Engineering, B, TKK-CSE-B7, 2009.
In this paper, we present a process to easily generate algorithm animationsin lecture slide format with an existing AV system. The work presented in thispaper included significant constructive part.
Karavirta and Seppala presented the initial idea of automatic lecture slidegeneration in a previous paper where both of the authors contributed equally.For this version, the author of this thesis implemented the Xaal language toAnimal with the help of Roßling, as well as the Xaal to Open DocumentFormat transformation. The writing of the paper was done collaborativelyamong the authors.
Contents
I Introduction and Background 1
1 Introduction 31.1 The Problem and Research Questions . . . . . . . . . . . . . . 41.2 Main Contributions and Structure of this Thesis . . . . . . . . 7
2 Software Visualization 92.1 Information Visualization . . . . . . . . . . . . . . . . . . . . . 92.2 Software Visualization and Algorithm Animation . . . . . . . . 11
2.2.1 Roles in Software Visualization . . . . . . . . . . . . . . . 122.2.2 Algorithm Animation Language . . . . . . . . . . . . . . 14
2.3 Taxonomies of Software Visualization Systems . . . . . . . . . . 14
3 Algorithm Animation 173.1 History of Algorithm Animation . . . . . . . . . . . . . . . . . 173.2 Research Questions in Algorithm Animation . . . . . . . . . . . 18
3.2.1 Scope: What Platform Should be used? . . . . . . . . . . 193.2.2 Content: What is visualized? . . . . . . . . . . . . . . . . 213.2.3 Form: How to integrate the use of animations to teaching? 223.2.4 Method: How the animation is generated? . . . . . . . . 233.2.5 Interaction: How to make animations interactive? . . . . 263.2.6 E!ectiveness: Are Algorithm Animations E!ective? . . . 28
3.3 Visualizations and Teachers . . . . . . . . . . . . . . . . . . . . 32
II E!ortless Algorithm Animation 35
4 Taxonomy of E!ortless Creation of Algorithm Visualizations 37
5 MatrixPro 41
III Algorithm Animation Languages 45
6 Features of Algorithm Animation Languages 476.1 Representation Format . . . . . . . . . . . . . . . . . . . . . . . 486.2 Level of Abstraction . . . . . . . . . . . . . . . . . . . . . . . . 486.3 Animation . . . . . . . . . . . . . . . . . . . . . . . . . . . . . . 49
xi
6.4 Programming Concepts . . . . . . . . . . . . . . . . . . . . . . 506.5 Interaction . . . . . . . . . . . . . . . . . . . . . . . . . . . . . 51
7 Taxonomy of Algorithm Animation Languages 53
8 Proposal for Standard Algorithm Animation Language 578.1 ITiCSE XML Working Group . . . . . . . . . . . . . . . . . . . 578.2 Xaal . . . . . . . . . . . . . . . . . . . . . . . . . . . . . . . . . 60
8.2.1 Taxonomic Evaluation . . . . . . . . . . . . . . . . . . . 62
IV Applications of Xaal in Education 69
9 Xaal in Algorithm Animation Systems 719.1 Implementation Approaches . . . . . . . . . . . . . . . . . . . . 719.2 Using Xaal Animations . . . . . . . . . . . . . . . . . . . . . . 739.3 Producing Xaal Animations . . . . . . . . . . . . . . . . . . . . 759.4 Implementation-based Evaluation . . . . . . . . . . . . . . . . . 76
10Algorithm Animations as Online Learning Material 7910.1 Main Features . . . . . . . . . . . . . . . . . . . . . . . . . . . 8010.2 Underlying Technologies . . . . . . . . . . . . . . . . . . . . . . 82
11Algorithm Animations as Lecture Material 8511.1 First Prototype . . . . . . . . . . . . . . . . . . . . . . . . . . . 8511.2 The Process of Generating Slides . . . . . . . . . . . . . . . . . 86
V Discussion and Conclusions 89
12Discussion 9112.1 Research Questions Revisited . . . . . . . . . . . . . . . . . . . 91
12.1.1 E!ortless creation of AV . . . . . . . . . . . . . . . . . . 9112.1.2 System independent description of AVI . . . . . . . . . . 9212.1.3 Processes to use the AVI in AA systems . . . . . . . . . . 9212.1.4 Processing the AVI for di!erent learning situations. . . . 94
12.2 Critical Overview . . . . . . . . . . . . . . . . . . . . . . . . . . 95
13Conclusions 9913.1 Benefits of This Work . . . . . . . . . . . . . . . . . . . . . . . 9913.2 Future Work . . . . . . . . . . . . . . . . . . . . . . . . . . . . 100
Bibliography 103
Part I
Introduction and Background
1

Chapter 1
Introduction
Due to the rapidly increased performance of computerized devices, software
products have grown to be more and more complex. As a result, software
developers need to understand very large parts of the software. At the same
time, people are constantly required to be more e"cient at whatever they
do. To help software developers achieve this, various Software Visualization
(SV) tools have been developed. Software Visualization can be defined as “the
visualization of artifacts related to software and its development process” [32].
Many di!erent areas of software engineering can apply and benefit from
Software Visualization. Software developers can get insights on the class or
package structures of an object-oriented software. UML diagrams are a good
example of an often used visualization [99]. SV tools can also provide detailed
information of the state of the program through visual debuggers. In addition,
developers can test their software using visual testing [78]. On the other hand,
algorithm developers and researchers can get a better view of the behaviour
of algorithms through visualizations. In education, students can use visualiza-
tions to help them understand and learn new concepts in software development
and algorithmics. Project managers can get an overview of the progress of a
software project from visualizations of the software evolution.
In general, SV can be divided into visualizing the structure, behaviour, and
evolution of software. Structure is the visualization of static parts and relations
of the system. Behaviour is the visualization of the program execution with
real or abstract data. Finally, evolution is the visualization of the development
process of the software. [32]
3
4 Chapter 1. Introduction
Algorithm animation (AA)1 is one form of visualization of behaviour where
the goal is to visualize the execution of an algorithm [32]. The main purpose of
algorithm animation development is aimed toward use in educational context.
This is also the focus in this thesis, although the ideas can be applied to
di!erent areas of SV, as well.
1.1 The Problem and Research Questions
Algorithm animation has been used in education for a few decades with the
goal of helping students to learn the di"cult concepts of data structures and
algorithms. In a survey by Naps et al. [95], most of the 93 respondents stated
that they believe visualizations to help students learn computing concepts.
Only five indicated neutral or no opinion while none disagreed with the helpful
e!ect of visualizations.
Recent studies indicate that to be educationally e!ective (i.e. aid students’
learning) algorithm visualizations cannot be merely passive animations, the
users must interact with the animation [50, 95]. This discovery has led to the
development of a wide variety of interactive visualization tools.
The confidence of teachers and the demonstrated learning benefits of ani-
mations have not helped AV to reach a wide audience. To the disappointment
of the AV system developers, most of the AV tools have been used only in
the institutions they were developed in. According to the survey by Naps et
al. [95], the key reasons for not adopting AV are the following.
• Teachers do not have time to search for good examples.
• Teachers do not have time to learn the new tools.
• Teachers do not have time to develop visualizations.
• Teachers feel there is a lack of e!ective development tools.
Furthermore, there is a shortage of ready-made, good quality algorithm visu-
alizations usable in teaching [125].
As the hope of the AV developer community is to get visualizations more
widely into use among educators, the main research question we will tackle in
this work is:1Another term widely used is Algorithm Visualization (AV). Some see this as a wider topic, but in this
work, we will use both terms interchangeably to refer to the definition of Algorithm Animation.
Chapter 1. Introduction 5
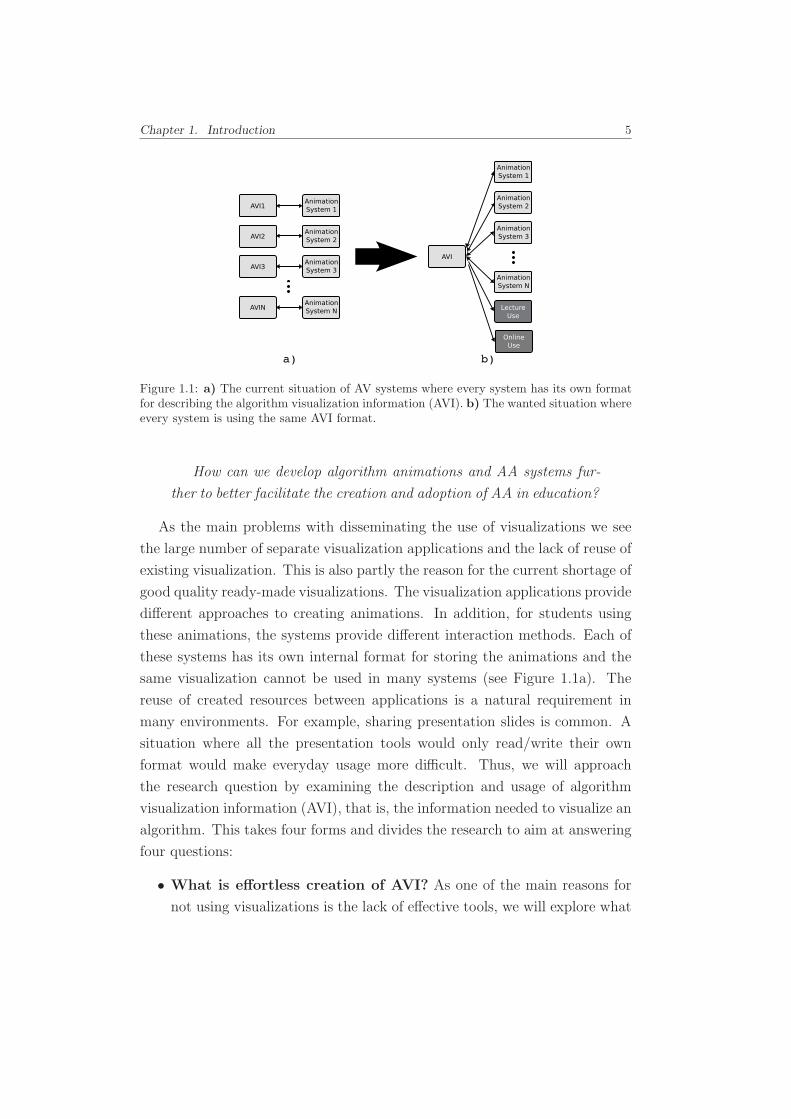
Figure 1.1: a) The current situation of AV systems where every system has its own formatfor describing the algorithm visualization information (AVI). b) The wanted situation whereevery system is using the same AVI format.
How can we develop algorithm animations and AA systems fur-
ther to better facilitate the creation and adoption of AA in education?
As the main problems with disseminating the use of visualizations we see
the large number of separate visualization applications and the lack of reuse of
existing visualization. This is also partly the reason for the current shortage of
good quality ready-made visualizations. The visualization applications provide
di!erent approaches to creating animations. In addition, for students using
these animations, the systems provide di!erent interaction methods. Each of
these systems has its own internal format for storing the animations and the
same visualization cannot be used in many systems (see Figure 1.1a). The
reuse of created resources between applications is a natural requirement in
many environments. For example, sharing presentation slides is common. A
situation where all the presentation tools would only read/write their own
format would make everyday usage more di"cult. Thus, we will approach
the research question by examining the description and usage of algorithm
visualization information (AVI), that is, the information needed to visualize an
algorithm. This takes four forms and divides the research to aim at answering
four questions:
• What is e!ortless creation of AVI? As one of the main reasons for
not using visualizations is the lack of e!ective tools, we will explore what
6 Chapter 1. Introduction
makes an algorithm animation system e!ortless. With this information,
novel approaches to AV production can be introduced. The aim is, that
although creating good examples will remain di"cult, it should be di"cult
because of pedagogical considerations instead of the limitations of the
available tools.
We will start by exploring what makes an algorithm animation system ef-
fortless and introduce a taxonomy of e!ortless creation of AV (Formulative-
taxonomy, FT2). This was carried out by thoroughly analyzing responses
on a survey to users of AV systems. We will also introduce a new approach
for teachers to create algorithm visualization using visual algorithm sim-
ulation, thus allowing e!ortless use in a limited application area (Descrip-
tive system, DS and Concept implementation, CI).
• How to specify a system independent description of AVI? The
introduction of a system independent format to describe AVI would allow
all the AV systems to use the same visualizations (see Figure 1.1b).
In the second part of this work, we will analyze the languages used by the
existing AV systems to store the visualizations and aim at identifying the
key features of algorithm animation languages (Review of literature, DR).
We summarize the results of the analysis by introducing a taxonomy of
algorithm animation languages (FT). This taxonomy together with the
work of an international working group is used to specify a proposal for
a standard algorithm animation language, Xaal (eXtensible Algorithm
Animation Language) (Formative-standards, FG). Furthermore, we use
the newly defined taxonomy to evaluate the Xaal language (Evaluative-
other, EO).
• How can we process the AVI to use in AA systems? A survey
by Bassil and Keller concluded that integration of SV tools and import-
ing/exporting visualizations from SV tools are the main challenges for
the future of SV tool builders [6]. Understandably, merely having a stan-
dard language for AVI is not enough. Thus, we need to provide processes
that enable importing/exporting visualizations. Evidently, all the created
visualizations would then be available for all the AV systems.
2For each part of this work, we will refer to the applied research approaches and methods in softwareengineering defined by Glass et al. [38].
Chapter 1. Introduction 7
For the proposed standard to be useful, we will introduce two di!erent
processes on how to add Xaal import/export to existing AV systems
(Formulative-process, FP). In addition, we introduce a framework that
implementing this in AV systems (Formulative-framework, FF).
• How can we process the AVI for di!erent learning situations?
According to Roßling et al., merging visualizations into hypertext is an
important step in allowing online learning and promoting the use of
AV [119]. Our aim is to make this merging as seamless as possible for
the students. Another learning situation (where AV is used) is lectures.
Typically, this requires the teacher to switch between lecture slides and
an AV system. Here, we aim at providing the teacher with the possibility
to use the animations in the lecture slides, thus ensuring the coherency
of the learning materials.
For the hypertext merging, we will first do a literature review on require-
ments of a visualization system (DR). Based on these requirements, we
will introduce a proof of concept implementation of a seamless way to
merge visualizations into hypertext (DS and CI). For the lecture use, we
apply the Xaal framework to introduce an approach to use Xaal ani-
mations in lecture slides (DS and CI).
It has to be mentioned that this is a software engineering thesis, although
the main application area is in education. So we are not as much considering
the pedagogical aspects as we are interested in software to be used in educa-
tion. Furthermore, this thesis incorporates a significant amount of constructive
work. The applicability of the framework and the introduced integration ap-
proaches have been tested by proof of concept implementations with enough
functionality to see that the ideas could be thoroughly implemented.
1.2 Main Contributions and Structure of this Thesis
The following points summarize the main contributions of this work as well as
introduces the contents of the di!erent parts of this thesis.
• Part II: E!ortless Creation of Algorithm Animation. In Publica-
tion [P1], we define a Taxonomy of E!ortless Creation of Algorithm Ani-
mations. This work is summarized in Chapter 4. In Publication [P2] (sum-
8 Chapter 1. Introduction
marized in Chapter 5), we introduce a new approach for teachers to create
animations by allowing e!ortless on-the-fly creation of algorithm anima-
tions by applying visual algorithm simulation through a simple user in-
terface.
• Part III: Proposed Standard for Algorithm Animation language.
We define a Taxonomy of Algorithm Animation Languages to help com-
paring the di!erent AA languages (Publication [P3] and Chapter 7).
The taxonomy and work by an international working group (Publica-
tion [P4] and Section 8.1) is used to define a new algorithm animation
language, eXtensible Algorithm Animation Language, Xaal. Xaal is
introduced in Publication [P5] and in Section 8.2.
• Part IV: Applications of Xaal in education. We provide two di!er-
ent processing approaches for using and producing Xaal animations with
existing algorithm animation systems. In addition, we have a framework
aiding in this integration as well as prototype implementations of the pro-
cesses (Publication [P5] and Chapter9). Furthermore, we provide a novel
solution to the problem of seamlessly integrating algorithm animations
with hypertext (Publication [P6] and Chapter 10). In our approach, the
algorithm animation viewer is implemented purely with JavaScript and
HTML. Moreover, we introduce a processing model to easily produce lec-
ture slides for a common presentation tool from Xaal animations (Pub-
lication [P7] and Chapter 11).
Finally, Part V discusses and concludes the results of this thesis.
Chapter 2
Software Visualization
This chapter briefly defines the concepts used in the rest of this thesis. We
start by defining the field of Information Visualization and proceed to Soft-
ware Visualization (SV) and Algorithm Animation (AA). Furthermore, we
discuss the di!erent roles in the SV production process as well as taxonomies
to characterize SV systems.
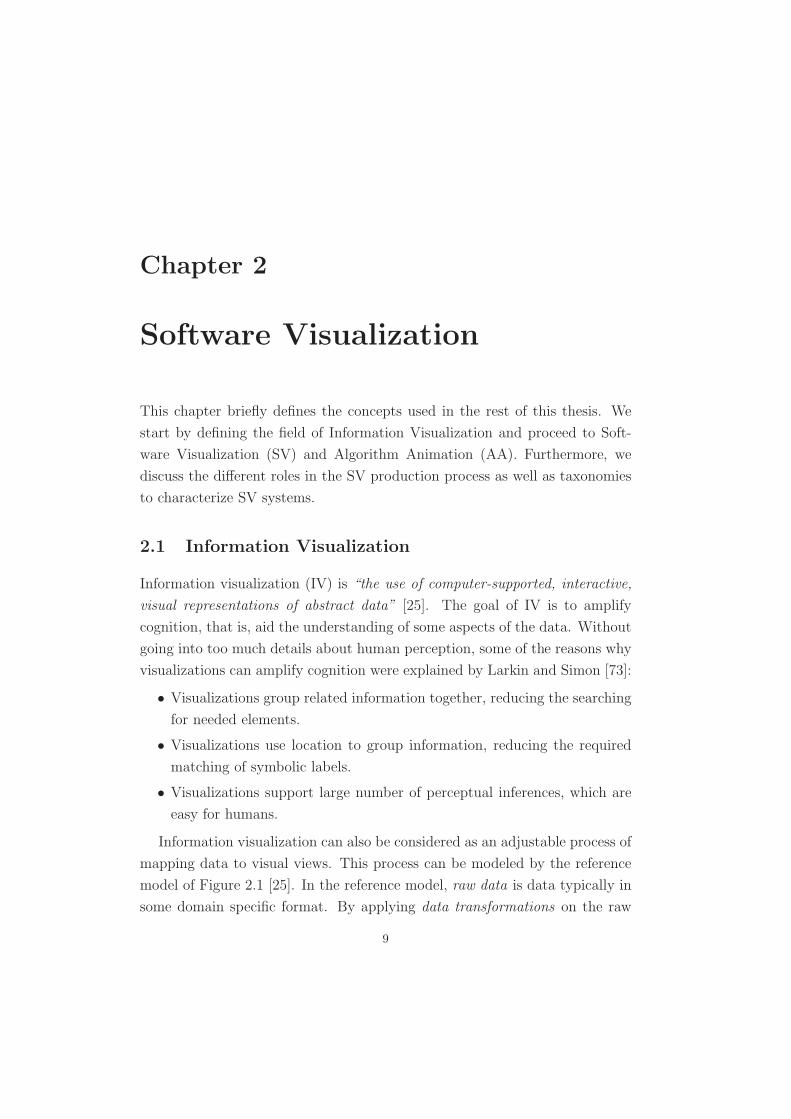
2.1 Information Visualization
Information visualization (IV) is “the use of computer-supported, interactive,
visual representations of abstract data” [25]. The goal of IV is to amplify
cognition, that is, aid the understanding of some aspects of the data. Without
going into too much details about human perception, some of the reasons why
visualizations can amplify cognition were explained by Larkin and Simon [73]:
• Visualizations group related information together, reducing the searching
for needed elements.
• Visualizations use location to group information, reducing the required
matching of symbolic labels.
• Visualizations support large number of perceptual inferences, which are
easy for humans.
Information visualization can also be considered as an adjustable process of
mapping data to visual views. This process can be modeled by the reference
model of Figure 2.1 [25]. In the reference model, raw data is data typically in
some domain specific format. By applying data transformations on the raw
9
10 Chapter 2. Software Visualization
data, relational descriptions in the form of data tables are achieved. Through
visual mappings, these data tables are mapped to visual structures. Visual
structures combine the spatial substrates, graphical primitives, and graphical
properties. Finally, after view transformations, the view intended for a human
observer is achieved. Throughout this thesis, this will be the underlying model
when discussing the creation process of algorithm visualizations.
Figure 2.1: Information Visualization reference model [25].
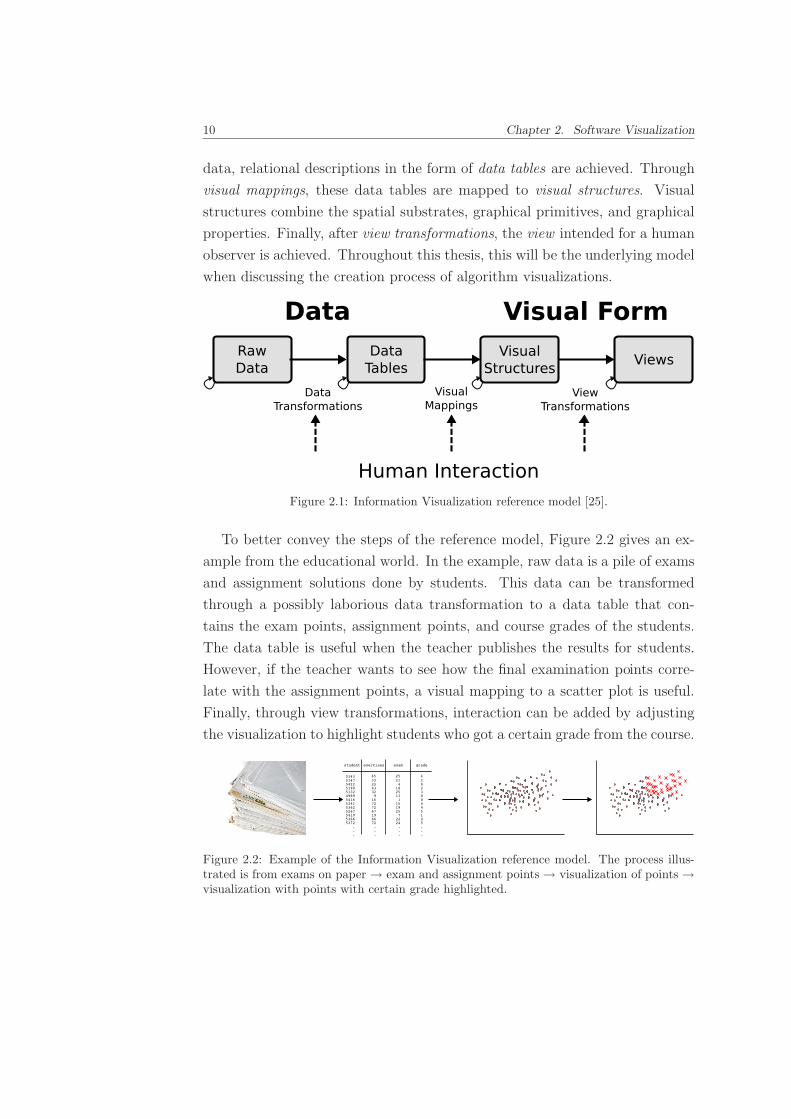
To better convey the steps of the reference model, Figure 2.2 gives an ex-
ample from the educational world. In the example, raw data is a pile of exams
and assignment solutions done by students. This data can be transformed
through a possibly laborious data transformation to a data table that con-
tains the exam points, assignment points, and course grades of the students.
The data table is useful when the teacher publishes the results for students.
However, if the teacher wants to see how the final examination points corre-
late with the assignment points, a visual mapping to a scatter plot is useful.
Finally, through view transformations, interaction can be added by adjusting
the visualization to highlight students who got a certain grade from the course.
Figure 2.2: Example of the Information Visualization reference model. The process illus-trated is from exams on paper ! exam and assignment points ! visualization of points !visualization with points with certain grade highlighted.
Chapter 2. Software Visualization 11
2.2 Software Visualization and Algorithm Animation
Software Visualization can be defined as “the visualization of artifacts related
to software and its development process” [32]. As mentioned earlier, SV can be
divided in visualizing the structure, behaviour, and evolution of software [32]:
• Structure is the visualization of static parts and relations of the system.
The information visualized is available by statically analyzing the source
code without executing it. Examples of structure visualization are pretty
printing, control flow graphs, and UML class diagrams, just to mention
a few.
• Behaviour is the visualization of the program execution with real or ab-
stract data. Topics of behaviour visualization are dynamic architecture
visualization, algorithm animation, visual debugging, and visual testing.
Of these, algorithm animation is of special interest in this thesis. In al-
gorithm animation, the goal is to visualize the behaviour of an algorithm
as opposed to Program Visualization (PV) where the aim is to visualize
the implementation details.
• Evolution is the visualization of the development process of the software.
Evolution visualization can be, for example, visualizing software metrics
changes, visualizing structural changes, or visualizing software archives
such as CVS or Subversion.
Maletic et al. [79] discuss the information visualization reference model
in the context of software visualization. In SV, the raw data is source code,
documentation, execution trace, and so on. Data tables can be abstract syntax
trees, dependency graphs, or class/objects relationships. Visual structures are
the visualizations specific to some visualization software.
Algorithm animation can also be mapped to the reference model of Fig-
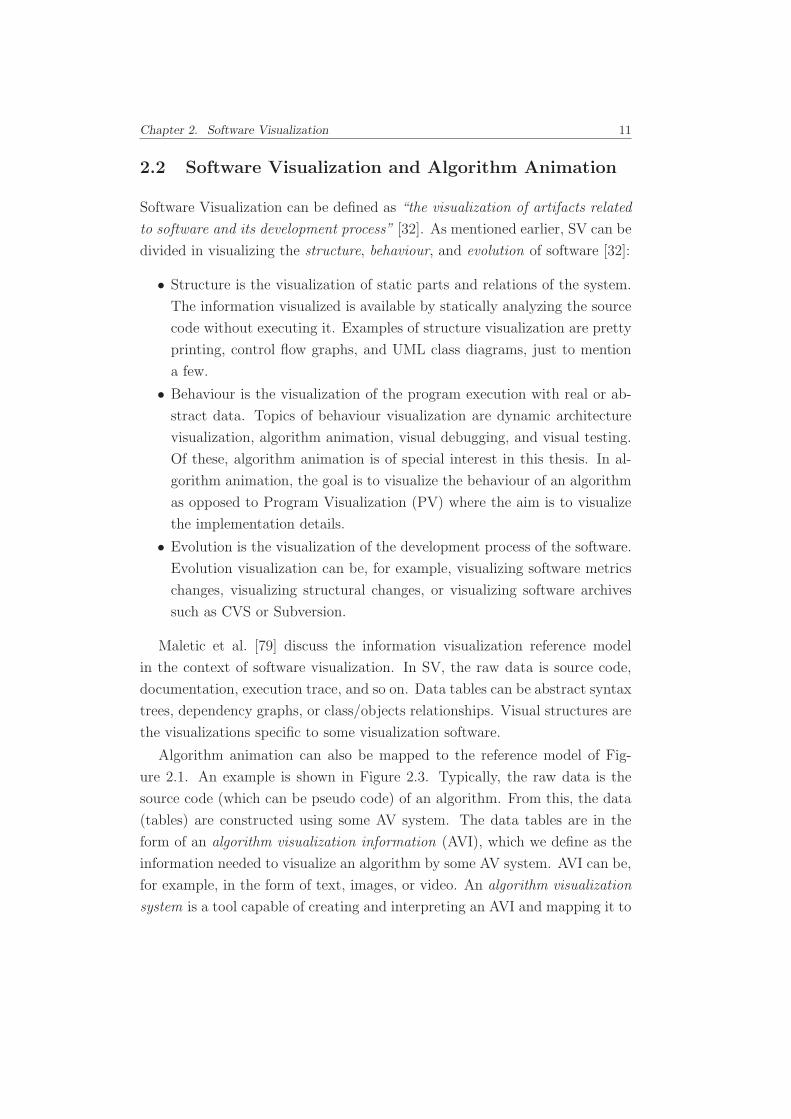
ure 2.1. An example is shown in Figure 2.3. Typically, the raw data is the
source code (which can be pseudo code) of an algorithm. From this, the data
(tables) are constructed using some AV system. The data tables are in the
form of an algorithm visualization information (AVI), which we define as the
information needed to visualize an algorithm by some AV system. AVI can be,
for example, in the form of text, images, or video. An algorithm visualization
system is a tool capable of creating and interpreting an AVI and mapping it to
12 Chapter 2. Software Visualization
visual structures. The system can be interacted with to form the view. This
is only one possible way for the algorithm animation process to work, and the
actual model depends heavily on the animation specification approach of the
AA system. Thus, the way the mappings are specified and what the AVI looks
like will be discussed more in the following chapters.
Figure 2.3: Example of algorithm animation in the Information Visualization referencemodel. The process illustrated is from pseudo code of an algorithm ! animation as Ani-
malScript [113] ! visualization in Animal [114] ! zoomed visualization playing in An-
imal.
The software visualization community has not agreed upon one definition
for the field. The most common of the other definitions is by Price et al. [102]
who have defined software visualization as “the use of the crafts of typography,
graphic design, animation, and cinematography with modern human-computer
interaction technology to facilitate both the human understanding and e!ective
use of computer software.” They divided SV into two separate fields: algo-
rithm visualization and program visualization. Program visualization is the use
of visualization to enhance the human understanding of computer programs.
Algorithm visualization (AV) is the visualization of a high-level representation
of a piece of code. They further divided AV into static algorithm visualization
and algorithm animation (AA). Algorithm animation is a dynamic algorithm
visualization. The dynamic behavior can range from a series of static pictures
to an animation requiring interaction from the user. The problem with this
disjoint division of SV is that the line between algorithm visualization and pro-
gram visualization has become fuzzy – PV systems include AV functionality
and vice versa.
2.2.1 Roles in Software Visualization
The four di!erent roles of persons who take advantage of software visualiza-
tion have been introduced by Price et al [102]. Programmer is a person who
develops the algorithm or program – the raw data of the reference model of
Chapter 2. Software Visualization 13
Figure 2.1 – without considering whether or not it is (going to be) visualized.
SV software developer is a person who designs and implements software for
SV. This software typically handles transforming the raw data to data (tables)
and mapping them to visual structures. A person creating the visualization
is called visualizer. Ideally, a visualizer configures how the SV software does
the transformation and mapping using the existing features implemented by
the SV software developer. Finally, the person using the visualization is ad-
dressed as user. The user interacts with the view transformations. In practice,
these roles are often overlapping and it is common that, for example, the SV
software developer is also a visualizer and a programmer.
In this thesis, the main focus is on the educational use of SV. Thus, the
persons involved are student and instructor. When considering the roles in
SV, the usual case is that student is the user and instructor has the rest of the
roles. However, for example, in a situation where the students are required to
create their own visualizations, the student is in the role of visualizer. In this
thesis, we will use the terms student and instructor and indicate which of the
SV roles we are discussing, unless it is clear from the context.
Until recently, the instructor has often been in the role of the developer.
This stems from the fact that many of the visualization systems are not widely
used outside the original university where they were developed. Usually, sys-
tem development is a task that requires a lot of e!ort and understanding of
the underlying system. Thus, to gain wider audience, SV systems need to
allow the instructor to be able to work only in the roles of programmer and
visualizer.
When considering the student using the visualization, research has shown
that passively viewing algorithm animations does not have a significant e!ect
on learning outcomes [50]. Therefore, engagement (activity) by the student is
needed for a tool to be pedagogically useful. The di!erent levels of engagement
according to the engagement taxonomy [95] are viewing, responding, changing,
constructing, and presenting. Viewing is passive watching of an animation
where student only controls the visualization’s execution. In responding, the
student is engaged by asking questions about the visualization. Changing re-
quires the student to modify the visualization, for example, by changing the
input data. In constructing, the student is required to construct his/her own
algorithm animation. At the highest level, presenting, the student presents
14 Chapter 2. Software Visualization
a visualization for an audience. Engagement will be discussed more in Sec-
tion 3.2.5.
2.2.2 Algorithm Animation Language
Throughout this thesis we will talk about algorithm animation languages (AAL,
or simply language). With this term we mean a textual representation de-
scribing an algorithm animation or visualization. The language should have
a well-defined set of concepts, syntax, and semantics defined in the language
specification. An algorithm animation language is one type of algorithm visu-
alization information. Thus, in the reference model of Figure 2.1, an algorithm
animation language is a way to store the data (tables).
2.3 Taxonomies of Software Visualization Systems
It is di"cult to choose a proper tool for software visualization from the vast
amount of di!erent SV tools supporting di!erent features, target scope, and
interaction techniques. The best suitable tool depends heavily on the type
of the task. To help this process, taxonomies characterizing SV tools have
been defined [11, 68, 79, 84, 85, 102, 107, 134]. In the following, we will briefly
introduce these taxonomies. However, we suggest the interested reader to read
the cited articles to get a deeper understanding of the taxonomies.
One of the most well-known ways to categorize and evaluate Software Vi-
sualization systems is the Taxonomy of Software Visualization by Price et
al. [102]. The taxonomy defines a structure of characteristics of SV systems
that consists of six categories. These categories and the questions they should
answer are the following.
• Scope — “What is the range of programs that the SV system may take as
input for visualization?”
• Content — “What subset of information about the software is visualized
by the SV system?”
• Form — “What are the characteristics of the output of the system (the
visualization)?”
• Method — “How is the visualization specified?”
Chapter 2. Software Visualization 15
• Interaction — “How does the user of the SV system interact with and
control it?”
• E!ectiveness — “How well does the system communicate information to
the user?”
The classification scheme by Myers [84] concentrates on program visualiza-
tion systems. The taxonomy has two dimensions: the program aspect (is code
or data illustrated) and the display style (static or dynamic visualization). In
a later version of the taxonomy [85], a third level, algorithm, was added to the
program aspect.
Brown [11] introduced a taxonomy which had three dimensions: content,
persistence, and transformation. Content ranges from direct representation of
code or data in the program to synthetic images showing information gathered
not directly from the code. Persistence ranges from display of the current state
only to displays showing the complete history of the information. Transfor-
mation ranges from discrete changes to incremental continuous changes.
Roman and Cox [107] have five categories: scope (answers the question
What aspect of the program is visualized?), abstraction (What kind of infor-
mation is conveyed by the visualization?), specification method (What mecha-
nisms does the animator use to construct the visualization?), interface (What
facilities does the system provide for the visual presentation of information?),
and presentation (How does the system convey information?).
Stasko and Patterson [134] introduced a model with four characteristics:
aspect, abstractness, animation, and automation. Aspect is the aspect of the
program that is visualized, for example, program code or data structures.
Abstractness is the level of abstraction of the visualization. Animation refers
to whether or not the system supports animation in the strict sense that the
authors specify. Automation characterizes the level of automation provided
for the visualizer.
Kraemer and Stasko [68] presented a characterization on two levels: visu-
alization task being performed and the purpose of the visualization. Another
task oriented framework was introduced by Maletic et al. [79]. Although the
framework is developed from the point of view of large-scale software systems,
it can be applied to algorithm animation as well. The categories and the
questions they aim at answering are the following.
16 Chapter 2. Software Visualization
• Tasks — Why is the visualization needed?
• Audience — Who will use the visualization?
• Target — What is the data source to represent?
• Representation — How To represent it?
• Medium — Where to represent the visualization?
As can be seen, the taxonomies have quite similar categories with slight
di!erences in the terminology and the highlighted characteristics. Only the
frameworks by Kraemer and Stasko and Maletic et al. are significantly di!er-
ent. In the end, the choice of a taxonomy depends on the needs. For example,
the taxonomy by Myers provides a simple way to classify the systems, whereas
the taxonomy by Price et al. o!ers a comprehensive way to analyze systems.
Chapter 3
Algorithm Animation
This chapter will introduce history of algorithm animation, as well as relevant
research questions in the evolution of AA. We will conclude the chapter with
a discussion on teachers and visualizations.
3.1 History of Algorithm Animation
The research on algorithm animation is often considered to have begun from
the Sorting out Sorting video [3] by Ronald M. Baecker in 1981. It was a
30 minutes long video animating the behavior of nine di!erent sorting algo-
rithms. However, the first algorithm animations we are aware of were created
in 1966 by Ken Knowlton, who made a movie about list processing using the
L6 programming language [64]. More of the early work was done by Hopgood
who presented a set of films on hash tables in 1974 [44]. In 1975, Baecker pre-
sented two systems that made it “possible for an instructor to produce short
quick-and-dirty single-concept film clips with only hours of e!ort” [2].
The field has evolved a lot since the first videos and systems were intro-
duced. The first well-known computerized system was BALSA (Brown AL-
gorithm Simulator and Animator) [16]. BALSA is an interactive algorithm
animation framework that has a support for multiple dynamic views of an
algorithm and the data structures associated to it. It introduced the inter-
esting events paradigm where algorithm code was annotated at interesting
points by calling a separate animator. Another recognized system of the early
years of algorithm animation is TANGO (Transition-based ANimation Gener-
17
18 Chapter 3. Algorithm Animation
Figure 3.1: History of some Algorithm Animation and Program Visualization Systems. Thevertical positioning is merely for improving readability.
atiOn) [129]. It is an AA system that introduced the path-transition paradigm
and supported smooth animation, a feature first included in Animus [33]. Color
and sound were first used by Zeus [13]. Another of the significant features was
3D graphics, first used in POLKA-3D [135] and Zeus3D [14].
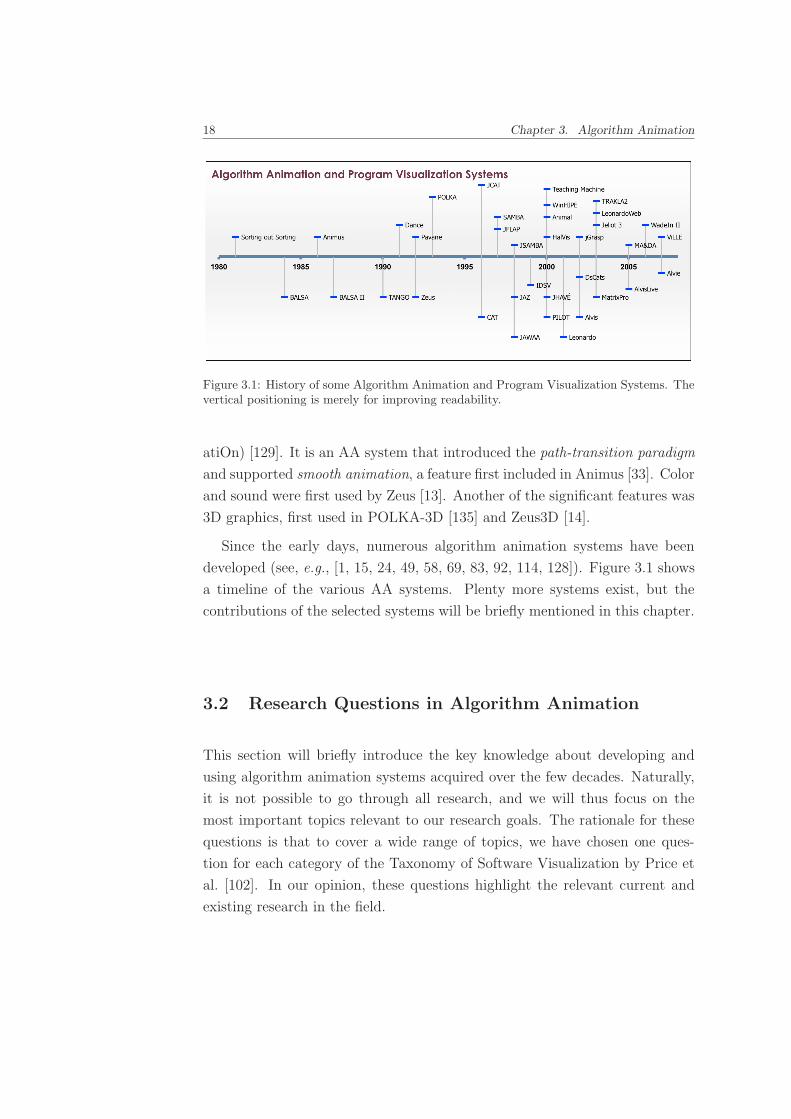
Since the early days, numerous algorithm animation systems have been
developed (see, e.g., [1, 15, 24, 49, 58, 69, 83, 92, 114, 128]). Figure 3.1 shows
a timeline of the various AA systems. Plenty more systems exist, but the
contributions of the selected systems will be briefly mentioned in this chapter.
3.2 Research Questions in Algorithm Animation
This section will briefly introduce the key knowledge about developing and
using algorithm animation systems acquired over the few decades. Naturally,
it is not possible to go through all research, and we will thus focus on the
most important topics relevant to our research goals. The rationale for these
questions is that to cover a wide range of topics, we have chosen one ques-
tion for each category of the Taxonomy of Software Visualization by Price et
al. [102]. In our opinion, these questions highlight the relevant current and
existing research in the field.
Chapter 3. Algorithm Animation 19
3.2.1 Scope: What Platform Should be used?
In the past, selecting an algorithm animation system could depend on the
platform the system used. This was illustrated as one subcategory in the
Taxonomy of Software Visualization.
Earlier systems were often targeted on some specific platform(s). For ex-
ample, POLKA used C++ and X window system [133], POLKA-3D Silicon
Graphics GL [133], HalVis [41] was implemented using Asymmetrix Toolbook,
which was for Microsoft Windows 3.0, and Alvis [49] and AlvisLive [48] using
.NET.
The current situation is that a system needs to be platform independent
to be used [109]. This had led to the uprising of a multitude of Java-based
systems, such as Animal [114], JAWAA [1], JAZ [9], MatrixPro, Jeliot 3 [83],
ViLLE [103], and so on. Thus, the advice for system developers nowadays is
to use Java or open web standards like HTML and JavaScript [117] and to
integrate them with hypertext. Technologies capable of this will be discussed
in the following.
Java Applets Early work on algorithm visualization in hypertext has been
done by Ross and Grinder [109]. In their hypertextbooks, the inclusion of vi-
sualizations is done using Java applets. This is currently a common way used
in, for example, WinHIPE [137], JAWAA [1], LeonardoWeb [10], ViLLE [104],
and TRAKLA2 [80]. In addition, there is a multitude of topic-specific anima-
tions implemented as applets.
There are some problems in using applets. First of all, they require a plugin
to be installed. Luckily, this is already installed on almost all computers. In
addition, the permissions of applets are limited, unless signed and trusted by
the user. A minor usability issue is the slow startup of the Java plugin and
thus the visualization. When integrating with HTML, the biggest problem is
that communication between HTML and the applet is di"cult at best. For
example, updating information (such as points gained by a student) in the
HTML, based on user actions in the applet, cannot be done reliably. This
is a problem, for example, in TRAKLA2, which has been worked around by
showing the updated points in the applet until the HTML page is refreshed
by the user.
20 Chapter 3. Algorithm Animation
Java Web Start Visualization systems using Java Web Start include Ani-
mal [114], Jeliot 3 [83], JHAVE [92], and MatrixPro [58]. Of these, Jeliot 3
and Animal have been integrated with Moodle, which is a popular learning
environment [82, 122].
In principle, Web Start applications are similar to applets, but they are
launched through a link or a button instead of embedding into a web page.
As with applets, communication between HTML and visualization is almost
impossible. For example, dynamic documentation in browser that is changed
based on the state of the visualization is di"cult to achieve. To solve this, for
example, JHAVE includes documentation within Java. Although this solution
works, real browsers are better at rendering HTML than Java. The main
advantage of Web Start is that the same tool can be used as a traditional
application.
(Other) Rich Internet Application Technologies Several rich internet applica-
tion (RIA) technologies have been introduced lately. These technologies allow
creating complex applications that run in web browsers. For an overview,
best practices, and comparisons of technologies, see [98]. One of the most
prominent technologies is JavaScript. A multitude of JavaScript libraries aid-
ing in web development have been developed, and new ones are popping up
constantly. Some of the most well-known libraries include Dojo1, Prototype2,
Scriptaculous3, jQuery4, and YUI5, just to mention a few. In algorithm an-
imation, JavaScript has been used in WinHIPE to change images on a web
page and thus allowing viewing of animations [89].
When building rich internet applications, JavaScript is not the only choice.
In fact, the Java based technologies can be considered as RIA technologies.
In addition, there is an increasing number of promising technologies available.
The most potential candidates include Adobe Flash and Flex6, Microsoft Sil-
verlight7, and Sun Microsystems JavaFX8.
1http://www.dojotoolkit.org/2http://prototypejs.org/3http://script.aculo.us/4http://jquery.com/5http://developer.yahoo.com/yui/6http://www.adobe.com/products/flex/7http://silverlight.net/8http://www.javafx.com/
Chapter 3. Algorithm Animation 21
Adobe’s Flash and Flex provide technology for building cross-platform
RIAs. Flash is used to visualize sorting algorithms in the Flash version of
Sorting out Sorting by [37]. The tools for developing applications are quite
sophisticated and powerful. However, the tools are commercial software prod-
ucts developed by Adobe. Another rising technology is Microsoft Silverlight,
which uses many of the same technologies as the .NET framework making it
suitable for developers familiar with .NET. However, Silverlight is not cross-
platform compatible. Finally, we mention JavaFX, a family of products from
Sun Microsystems based on Java technology. However, this technology is not
ready for production use at the moment. On a positive side, Sun plans on
releasing parts of the JavaFX family as open source. It should also be men-
tioned that, in the end, JavaFX applications are included in hypertext as Java
applets.
In general, the newer RIA technologies have not been much utilized in
algorithm animation. Thus, they have potential for future research and more
creative solutions.
Other Technologies There are also other methods used to incorporate AA
into hypertext. Ross’s original hypertextbooks included videos [109]. Accord-
ing to current knowledge, the problem with videos is that they provide almost
no interaction between the user and the visualization. Despite this, screen-
casting, that is, capture of actions on a computer screen often with audio
explanation [51], is becoming more and more popular on the web. However,
we are not aware of using screencasting to replace algorithm animations.
3.2.2 Content: What is visualized?
In the taxonomy of Price et al., the subcategories of Content measured things
like support for visualization of program and algorithm. Although algorithm
animation has typically focused on visualizing the data in the algorithm, lately
the visualization of both code and data has become increasingly popular.
Code visualization is a mapping between the changes in the code and the
visualization of the data. Code visualization can be done in various ways, for
example, by highlighting single code lines or showing several codes of the same
algorithm on di!erent abstraction levels [17]. In addition to highlighting the
22 Chapter 3. Algorithm Animation
current line, the code visualization can show things such as executed lines of
codes (distinguished from the ones not executed) and the lines executed just
before the current line [67]. More and more AV systems nowadays include
pseudocode like presentation of the algorithm and highlight the current line
of code. The inclusion of pseudocode has in fact been found to guide students
to spend more time with the visualization [123].
In algorithm animation, the lower extreme of data being visualized is a
system that uses only graphical primitives to describe the data structures.
An example of such a system is SAMBA [131]. The other extreme is a sys-
tem that visualizes only high level data structures, like, for example, Matrix-
Pro [58]. These di!erent approaches have both benefits and drawbacks. By
using graphical primitives, the system can visualize almost any kind of struc-
tures, but the creation of such animations can require quite a lot of e!ort.
On the other hand, systems using data structures can provide an e!ortless
way to create the animation, but are typically limited to the set of structures
supported by the system.
Animations often include other elements besides code and data structures.
In explanatory visualization, the idea is to include an explanation in every
step of the visualization [19]. Blumenkrants et al. take this even further by
introducing narrative visualizations where AVs are created as stories with a
plot [8]. In addition, their visualizations include voice narration.
Typically, AVs have been constructed with the mindset that the same visu-
alization is suitable for all users. Adaptivity has been long used, for example, in
adaptive hypermedia [20]. In adaptive visualization, the basic idea is to adapt
the visualization content to the users profile [22]. Adaptive visualization has
been used, for example, in WADEIn II together with explanations [22]. Loboda
et al. have also presented a distributed framework for adaptive explanatory
visualization [77].
3.2.3 Form: How to integrate the use of animations to teaching?
In the original taxonomy, Medium was one subcategory of Form that focused
on the target medium of the system. Here, we take a broader point of view
and consider the di!erent ways to integrate animations into teaching and the
medium used. Hundhausen et al. presented a taxonomy of scenarios of AV use
Chapter 3. Algorithm Animation 23
in education identifying the following scenarios: lectures, study, assignments,
class discussion, labs, o"ce hours, and tests [50].
In most use scenarios, studies researching the e!ect of visualizations on
learning have been carried out. Many of these studies will be introduced in
Section 3.2.6. Naps et al. state that few teachers tightly integrate visual-
izations with other parts of their courses [95]. Lahtinen suggests that to get
students use visualizations, all course material and learning situations – course
website, printed materials, assignments, and lecture slides – should point the
students to visualizations of the topic [71]. Furthermore, Kehoe et al. hypoth-
esize that animations are pedagogically more valuable when used ”in open,
interactive learning situations [...] than in closed exam-style situations” [61].
Crescenzi and Nocentini have integrated visualizations into a traditional
textbook [29]. The textbook they use [28] contains descriptions of the algo-
rithms, analyzes them, and points the readers to the visualizations presented
using ALVIE system. In addition to the textbook, visualizations are used on
all the engagement levels (see Section 3.2.5) on their CS2 course. Another
system that comes with examples for a textbook [31] is LeonardoWeb [10].
Finally, the JFLAP system [7] has a supporting book that goes through the
concepts of automata theory using JFLAP [106].
A report of an international working group proposed enhancements to gen-
eral learning management systems (LMS) to better support computer science.
One of their scenarios is integration of visualizations and visualization systems
into an LMS [117]. For visualization system developers, the report suggests to
use Java or open web standards like HTML and JavaScript. An earlier simi-
lar report focused only on how to merge visualizations and hypertext to add
pedagogical value for both students and teachers [119]. Thus, web can be seen
as the main target medium for visualizations. Technologies for developing for
the web were discussed in Section 3.2.1.
3.2.4 Method: How the animation is generated?
In the taxonomy by Price et al., Visualization Specification Style describes the
way visualizations are specified. In the original taxonomy, this was measured
using terms like hand-coded, library, and automatic. However, since the tax-
onomy was introduced, many di!erent visualization specification styles have
24 Chapter 3. Algorithm Animation
emerged. Thus the list above is out-dated and we will introduce an alternative
categorization in the following. The list is loosely based on [110]. It should be
noted, that many of the current systems include several of the techniques.
Topic-Specific Animation Topic-specific animations are, as the name suggests,
built specifically for some topic. Usually these are stand-alone animations in-
stead of algorithm animation systems. For example, the software packages by
Khuri and Hsu concentrate on image compression algorithms [63], EVEGA [62]
and IAPPGA [144] concentrate on graph algorithms, and GASP-II on geomet-
ric algorithms [126]. Not much can be said about this approach in the context
of the visualization reference model introduced in the previous chapter, since
the form of the animation data depends completely on the way the animation
is implemented.
Direct Manipulation In direct manipulation [127], the animation is specified
by manipulating graphical objects. In the context of the reference model, the
mappings from raw data to data rows and to visual structures is done through
creating and manipulating graphical objects. The raw data in this case can be,
for example, a pseudo code of an algorithm in a book or merely a mental model
of the visualizer. The concept of direct manipulation was first introduced in
Dance [130]. Examples of other AA systems using direct manipulation are
Animal [114], JAWAA editor [1, 101], and ALVIS [49].
Visual algorithm simulation [65] takes direct manipulation one step fur-
ther by allowing the animation to be specified by manipulating concrete data
structures through visualizations. In visual algorithm simulation, data struc-
tures can be thought as data rows. The mapping to visual structures is done
automatically, and the data rows can be modified by manipulating the vi-
sual structures. Animation systems using visual algorithm simulation include
MatrixPro [58] and MA&DA [69].
API-based Generation In API-based generation, the animations are gener-
ated through method invocations of an application programmer’s interface
(API). The method invocations are typically included when something in-
teresting happens, thus this approach is often called the interesting events
paradigm. The raw data in this case is the program making the API calls.
Chapter 3. Algorithm Animation 25
These calls create the data rows, which are then used to create the visual
structures.
The first system using API-based generation was BALSA [16] followed
by Zeus [12] and TANGO [129]. Later systems using this approach include
JCAT [15, 90], JHAVE’s API to generate GaigsXML [81, 91], and Animal’s
API [118].
Scripting-based Generation In scripting-based generation, the animations are
described using some intermediate format, usually a textual format. Com-
mands using this format are then outputted from the execution of the visual-
ized algorithm. Thus, the implementation of the algorithm is the raw data and
the transformations to data tables are specified by the output of commands.
SAMBA [131] was the first system to introduce the scripting-based generation.
Examples of other systems o!ering scripting-based generation are ALVIE [29],
Animal [113], JHAVE [92], JAWAA [1], and JSAMBA [128]. Often, API-
based generation is used to create scripts, thus o!ering an alternative, often
more convenient way to use scripting-based generation.
Declarative Visualization Declarative visualization specifies the visualization
by declaring mappings between a program state and a graphical representa-
tion. This is done by using mathematical expressions. Examples of this ap-
proach are Pavane [108] and the ALPHA language [30] used in the Leonardo
system [27]. For example, in Pavane the mapping is defined as several sim-
ple mappings, each mapping being a collection of rules. These rules describe
logical relationship between the input and output spaces: v : Q(v) " P (v).
Code Interpretation Code interpretation is also a popular style due to its
e!ortlessness. In this approach, the visualizations are automatically gener-
ated from a program code (raw data). Systems using code interpretation are
typically visual debuggers or program visualization tools. Examples of such
systems include Jeliot 3 [83] and jGrasp [42, 52] that automatically visualize
Java programs. ViLLE [103, 104] allows automatic creation of visualizations
in multiple languages from simple Java programs. WinHIPE [100, 139] allows
automatic creation of visualization from a functional programming language.
This topic of visualization specification styles is relevant for the implementa-
26 Chapter 3. Algorithm Animation
tion strategies of adding system independent AVI support to existing systems.
In discussion in Chapter 12, we will consider how these di!erent approaches
fit to the idea of data exchange among systems.
3.2.5 Interaction: How to make animations interactive?
In the taxonomy of Price et al., temporal control, speed, and direction had their
own subcategories, but the support for them in the analyzed systems was rare.
However, today all these are seen as requirements for AV systems [120, 121]
and are included in most systems. There is even a design pattern for how to
implement reverse execution [111]. Still, AV system developers have strived
to make visualizations more interactive, especially since the Engagement tax-
onomy [95] was introduced by an ITiCSE Working Group in 2002. It has
gained almost a standard like recognition in the field. The taxonomy defined
the di!erent levels of engagement as the following.
No viewing is the lowest level on the taxonomy. On this level, no visualization
is used.
Viewing is the core level of engagement. It is passive watching of an ani-
mation. However, the student can have controls to move backward/forward
in the visualization, change the speed, etc. It should be noted, that viewing
is included in all of the higher levels of engagement and is supported by all
visualization systems.
Responding adds engagement by asking the student questions about the vi-
sualization. The question can be, for example, “What will happen in the next
step of the algorithm?”. The main idea is that students use the visualization
to find the answer for the questions.
Responding has been used in many visualization systems. The first we are
aware of is IDSV [54] in 1999. IDSV engaged students in di!erent ways by
requiring, for example, them to click the node visited next in a tree traversal
algorithm. Other systems supporting responding include JHAVE [92, 93],
ViLLE [103], Teaching Machine [18], and Animal [114]. In Animal, the
support for popup questions is achieved by an extension which o!ers tool
independent support for responding [116]. This extension has been used also
in Jeliot 3 [86] and an extension to TRAKLA2 [56].
Chapter 3. Algorithm Animation 27
Changing requires the student to modify the visualization. This can be, for
example, changing the input data of the algorithm allowing the student to
explore the algorithm’s behavior in di!erent situations.
AV systems supporting this level of interaction include Alvis [49], ALVIE [29],
and DsCats [24] where the student can give their own input to the algorithms.
Furthermore, some algorithms in JHAVE allow custom input by students.
Constructing level requires the student to construct his/her own algorithm
animation. This can be done, for example, in terms of direct manipulation
in some algorithm animation system. It should be noted, that coding of the
algorithm is not a requirement on this level.
In MA&DA [69], PILOT [4], and TRAKLA2 [80], students are given a data
structure and an algorithm, and they are expected to solve the exercise by
simulating algorithm. That is, they are constructing an algorithm animation.
Other systems that have been used to require students to construct animations
include WinHIPE [137], JHAVE, and ALVIE.
Presenting At the highest level, presenting, the student presents a visualiza-
tion for an audience. This can be, for example, a situation where a student
presents a visualization for the instructor and peers. The visualization can be
made by the student or a third-party.
Nearly all AV systems can be used to present animations. However, some
have more features designed to support this level of engagement. Animal
supports presenting by having features for changing the animation speed and
the magnification, a slider for fast navigation, a table of contents view to
jump to points of interest, and generators to enable animation creation on-
the-fly [112]. Alvis has a presentation pointer which allows pointing to objects
in the animation, the markup pen to dynamically annotate the animation,
and the presenter can dynamically change the animation as it is executing.
MatrixPro [58] has the possibility of on-the-fly use, automatic node labeling
in data structures, and a library of ready-made data structures.
Changes and extensions to the taxonomy have been proposed. For example,
it has been suggested that the constructing level be divided into constructive
simulation and code-based constructing and viewing be divided into active
viewing and passive viewing [75].
28 Chapter 3. Algorithm Animation
Another extension has been proposed by Myller et al. [87]. They consider
the engagement taxonomy in the context of program visualization, where they
argue that four additional levels should be added. These levels are the follow-
ing.
• Controlled viewing is a higher level of viewing, where the student can
control the visualization, for example, by changing its speed or selecting
objects to inspect.
• Entering input is the next highest level after controlled viewing. On this
level, the student should be able to enter input to a program or parameters
to a method.
• On the modifying level (higher than changing in the original ET), modifi-
cations to the visualization are done, for example, by changing the source
code or input data.
• Reviewing is the highest level of interaction in the extended taxonomy.
On this level, visualizations are viewed for giving comments and feedback
on the visualization itself.
Since these suggested extensions have not yet received a wide recognition
like the original taxonomy, we will use the original engagement taxonomy in
the rest of this thesis.
3.2.6 E!ectiveness: Are Algorithm Animations E!ective?
An important question in pedagogical use of algorithm visualizations is their
e!ectiveness in students’ learning. The hypothesis by Hundhausen et al. [50]
and Naps et al. [96] is that animations are e!ective, if they are interactive
enough. Not all research on the levels of the engagement have been conclusive
by finding statistically significant results supporting this hypothesis, though.
In this work, usage of animation is taken as a presumption and thus we
will not examine many evaluation studies comparing no viewing with viewing.
Still, we feel obligated to introduce one of the first studies that compared
reading from textbook to text with animation [132]. In the post-test, questions
about the algorithm were asked. The results of the test showed no significant
di!erences, but the trend favored the group with animation.
The following introduces some of the e!ectiveness studies done over the
years. Note, that the studies presented here include only experiments com-
Chapter 3. Algorithm Animation 29
paring di!erent levels of the engagement taxonomy. We have not included
pseudo-experimental studies (i.e. that had no control group) where di!erent
engagement levels have not been compared. In addition, we focus on experi-
ments that compare learning outcomes instead of other variables like attitude
or time spent. More thorough surveys of the evaluation studies related to the
engagement taxonomy can be found in [50, 138].
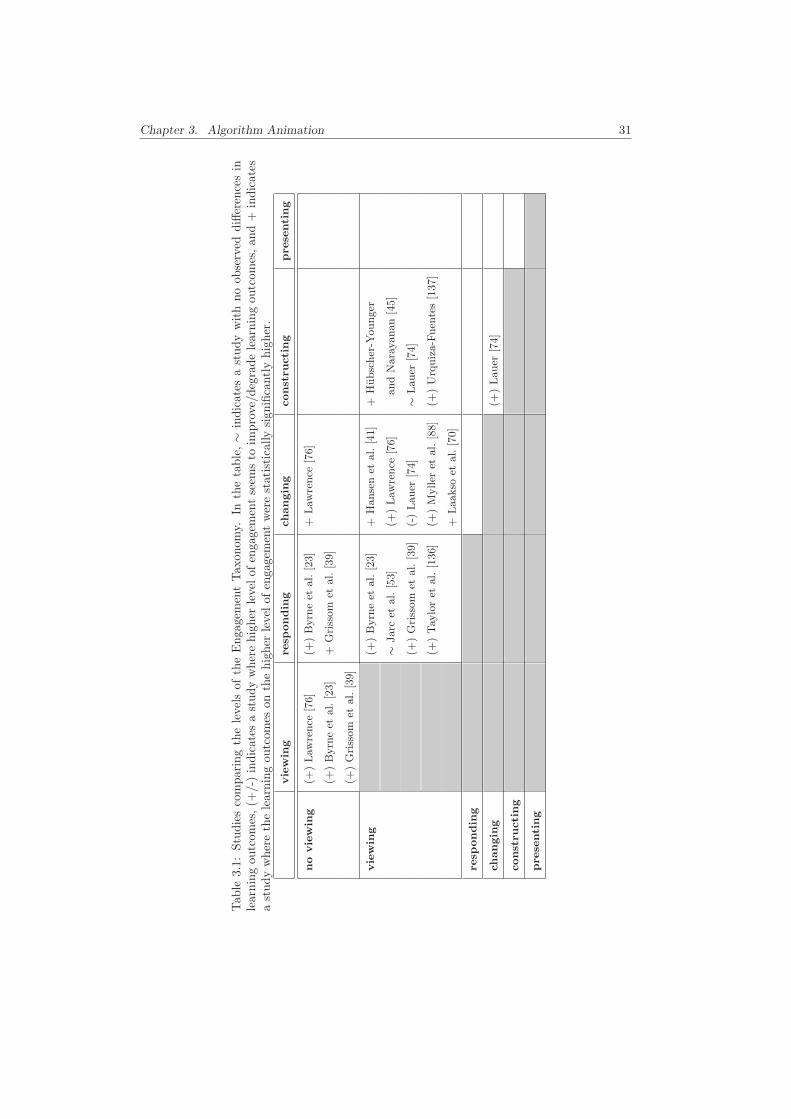
no viewing - viewing - changing 1994 Already in 1994, a study that com-
pared levels no viewing, viewing, and changing was performed [76]. The
results showed improvement in learning outcomes as the level of engage-
ment increased. The di!erence between no viewing and changing was
statistically significant.
no viewing - viewing - responding 1999 Byrne et al. [23] compared lev-
els no viewing, viewing, and responding. The no viewing was further
divided to no animation and prediction without animation. The results
show a trend towards benefit of animations and responding.
viewing - responding 2000 In 2000, an experiment comparing levels view-
ing and responding was conducted [53]. The results of the survey found
no statistically significant di!erences. However, the data indicated that
the students working on level responding scored better on di"cult topics,
but poorly overall.
viewing - changing 2000 The HalVis system was used in an experiment
comparing levels viewing and changing [41]. The viewing group used
TANGO [129]. The results report (statistically significant) better learning
outcomes for the changing group.
no viewing - viewing - responding 2003 Grissom et al. [39] experimented
to compare levels no viewing, viewing, and responding using JHAVE. The
results show that learning improves as the level of student engagement
increases. The di!erence between no viewing and responding was statis-
tically significant.
viewing - constructing 2003 Hubscher-Younger and Narayanan did an ex-
periment with student constructed representations9 of algorithms and
viewed peer-created representations [45]. The results showed significantly
better learning results for the students authoring visualizations.9These representations were not necessarily visual in the sense of algorithm animation.
30 Chapter 3. Algorithm Animation
viewing - changing - constructing 2006 Lauer [74] reports on a compari-
son of levels viewing, changing, and constructing. The group using chang-
ing performed slightly worse on average, but the di!erence was not sta-
tistically significant.
viewing - constructing 2007 In 2007, a study comparing levels viewing and
constructing was conducted [137]. The study detected (in some topics,
statistically significant) improvements in learning results on the higher
level.
viewing - changing 2007 Myller, Laakso, and Korhonen compared levels
viewing and changing in a collaborative environment [88]. Their results
indicated that students in changing performed better, although the re-
sults were not statistically significant. A second experiment by the same
authors in 2008 again compared levels viewing10 and changing. This time
they found statistically significant di!erences between the learning out-
comes in favor of the level changing [70].
viewing - responding 2009 Taylor et al. compared students using passive
and predictive animations of graph algorithms [136]. They conclude that
students working on the responding level learned better than students
viewing passive animations. It is unclear, though, whether or not their
results were statistically significant.
Table 3.1 summarizes the results of the surveys introduced above. Notably,
no evaluations have been done comparing the level of presenting with the other
levels. Presenting AVs has been researched, though, for example, in [46, 47]. In
addition, comparisons between responding and the higher levels of engagement
seem to be missing as well.
When looking at a larger number of studies including those comparing view-
ing and no viewing, the results are encouraging. In a meta-study of educational
experiments using visualizations, 24 experiments were examined and in 46%
of those a significant result was found where the visualization had a positive
impact [50]. Only one experiment reported a significant result in the opposite
direction.
Although the meta-study by Hundhausen et al. claimed that the engage-
ment with the visualization is more important than the content of the visu-10The paper discusses an extended version of the engagement taxonomy. However, the controlled viewing
level they use is, in a sense, a slightly higher level of viewing.
Chapter 3. Algorithm Animation 31
Tab
le3.
1:Stu
die
sco
mpar
ing
the
leve
lsof
the
Enga
gem
ent
Tax
onom
y.In
the
table
,#
indic
ates
ast
udy
wit
hno
obse
rved
di!
eren
ces
inle
arnin
gou
tcom
es,(+
/-)
indic
ates
ast
udy
wher
ehig
her
leve
lof
enga
gem
ent
seem
sto
impro
ve/d
egra
de
lear
nin
gou
tcom
es,an
d+
indic
ates
ast
udy
wher
eth
ele
arnin
gou
tcom
eson
the
hig
her
leve
lof
enga
gem
ent
wer
est
atis
tica
llysi
gnifi
cantl
yhig
her
.
vie
win
gre
spondin
gch
angin
gco
nst
ruct
ing
pre
senti
ng
no
vie
win
g(+
)Law
rence
[76]
(+)
Byrn
eet
al.[2
3]+
Law
rence
[76]
(+)
Byrn
eet
al.[2
3]+
Gri
ssom
etal
.[3
9]
(+)
Gri
ssom
etal
.[3
9]
vie
win
g(+
)B
yrn
eet
al.[2
3]+
Han
sen
etal
.[4
1]+
Hubsc
her
-You
nge
r
!Ja
rcet
al.[5
3](+
)Law
rence
[76]
and
Nar
ayan
an[4
5]
(+)
Gri
ssom
etal
.[3
9](-
)Lau
er[7
4]!
Lau
er[7
4]
(+)
Tay
lor
etal
.[1
36]
(+)
Myller
etal
.[8
8](+
)U
rquiz
a-Fuen
tes
[137
]
+Laa
kso
etal
.[7
0]
resp
ondin
g
changin
g(+
)Lau
er[7
4]
const
ruct
ing
pre
senti
ng
32 Chapter 3. Algorithm Animation
alization [50], other contributing factors have been studied as well. General
problems with experimental settings (e.g. multiple variables and lack of con-
trol group) were present in several experiments [40]. In addition, according to
the same survey, there are often animation specific problems, such as usabil-
ity issues, lack of student training, low quality animations, and inappropriate
di"culty of topics. A survey of successful experiments found narrative and
textual contents, feedback to students’ answers, and student centered design
as common features [138]. Rhodes et al. propose a system called VizEval
for easing the evaluation of visualization e!ectiveness [105]. In their study,
they experimented how some perceptual/cognitive characteristics a!ected the
detection of changes in animations.
3.3 Visualizations and Teachers
A well known fact brought up by many of the articles about algorithm visual-
ization is that visualizations are not as widely adopted by teachers as hoped by
AV system developers. Mainly, this belief is based on the most comprehensive
survey on teachers and visualizations that was reported by an ITiCSE working
group in 2002 [95]. Here, we will summarize the key findings; the interested
reader should read the cited article. The report consists of three di!erent sur-
veys (named pre-conference survey, Grissom survey, and index card survey in
the report) with a total of 186 responses.
Teachers’ attitudes towards visualizations are positive. In the pre-conference
survey, all respondents strongly agreed (59%) or agreed (41%) with visualiza-
tions being helpful for students. In the index card survey, 43% strongly agreed,
49% agreed, and 8% were neutral or had no opinion. The major benefits
teachers believe visualizations have can be categorized to creating discussion,
anecdotal evidence of ”benefit” for student, and improved teaching experience.
The top reasons were
• teaching experience is more enjoyable (90%)
• improved student participation (86%)
• anecdotal evidence of class being more fun for students (83%)
Despite the positive attitude, frequent use of visualizations is quite rare. In
the Grissom survey, over half of the respondents used dynamic visualizations
Chapter 3. Algorithm Animation 33
in classroom only a few times per term, while 13% never used dynamic visual-
izations. Outside of classroom, 23% never used dynamic visualizations. In the
pre-conference survey, 97% used at least occasionally during lectures, while
two-thirds made visualizations available outside class. The main reasons for
not using are lack of time and e!ective tools, with the top reasons mentioned
were
• no time to search for good examples (93%)
• no time to learn the new tools (90%)
• no time to develop visualizations (90%)
• lack of e!ective development tools (83%)
The time required to find good examples can be largely explained by the
findings of a survey of existing visualizations [125]. The survey concludes that
there is a lack of ready-made, good quality visualizations, especially on more
di"cult topics.
In another survey for teachers about program visualization, 61% of the 61
respondents were aware of visualization tools [21]. Of those who were aware,
71% used such tools in their teaching. When asking about their interest of us-
ing visualizations in teaching, only 41% of the respondents were very interested
or interested, while 59% were only somewhat interested. On a side note, the
responses revealed that 89% thought explanations would make visualizations
more valuable, and 89% thought adaptivity would be valuable.

34 Chapter 3. Algorithm Animation
Part II
E!ortless Algorithm Animation
35

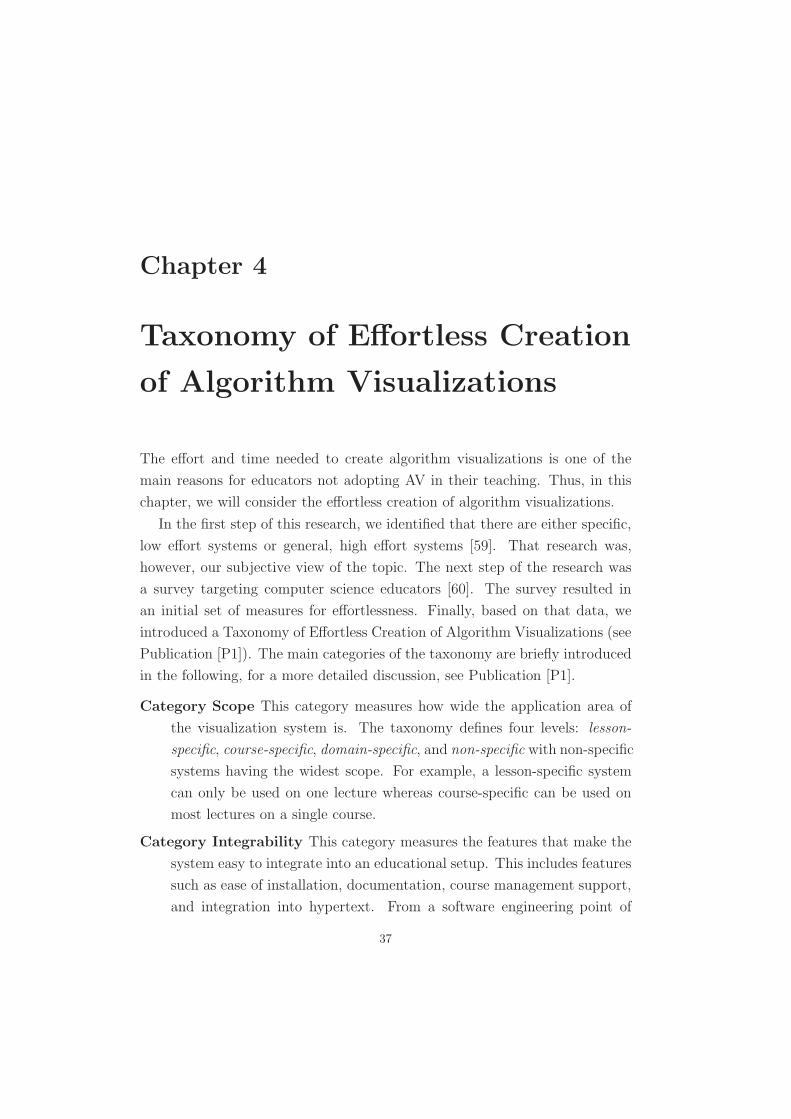
Chapter 4
Taxonomy of E!ortless Creation
of Algorithm Visualizations
The e!ort and time needed to create algorithm visualizations is one of the
main reasons for educators not adopting AV in their teaching. Thus, in this
chapter, we will consider the e!ortless creation of algorithm visualizations.
In the first step of this research, we identified that there are either specific,
low e!ort systems or general, high e!ort systems [59]. That research was,
however, our subjective view of the topic. The next step of the research was
a survey targeting computer science educators [60]. The survey resulted in
an initial set of measures for e!ortlessness. Finally, based on that data, we
introduced a Taxonomy of E!ortless Creation of Algorithm Visualizations (see
Publication [P1]). The main categories of the taxonomy are briefly introduced
in the following, for a more detailed discussion, see Publication [P1].
Category Scope This category measures how wide the application area of
the visualization system is. The taxonomy defines four levels: lesson-
specific, course-specific, domain-specific, and non-specific with non-specific
systems having the widest scope. For example, a lesson-specific system
can only be used on one lecture whereas course-specific can be used on
most lectures on a single course.
Category Integrability This category measures the features that make the
system easy to integrate into an educational setup. This includes features
such as ease of installation, documentation, course management support,
and integration into hypertext. From a software engineering point of
37
38 Chapter 4. Taxonomy of E!ortless Creation of Algorithm Visualizations
view, most of these are simple to implement to a visualization system.
However, integration into hypertext is one of the most di"cult. Thus, we
will present our solution for this in Chapter 10.
Category Interaction This category measures the interaction provided by
the system. It distinguishes two types of interaction: producer-system
interaction and visualization-consumer interaction. Producer-system in-
teraction measures the level of preparation needed for di!erent tasks such
as lecture examples or creating an exercise for examination. Visualization-
consumer interaction measures the level of interaction (or engagement)
provided for the user of the visualization.
Publication [P1] includes evaluations of four systems (Animal [114],
JAWAA [1], Jeliot 3 [83], and MatrixPro) as an example of using this taxon-
omy. These four were selected due to their di!erent perspectives for learning
and teaching. In addition, we required them to fulfill certain criteria, mainly
the systems should have similar application areas, be freely available, be still
developed further, be platform independent, and provide ways to create ani-
mations instead of just viewing them. The main finding in the evaluation is
that there are no generic systems that can be used without prior preparation
(see Figure 4.1). We believe this to be true for the existing AA systems, al-
though the evaluation included only four systems. Thus, the final question in
the article is, can such a system be developed? The AA systems are headed
to this direction by developing more ways the systems can be used without
prior preparation and for wider application areas. In the next chapter, we will
introduce the MatrixPro system that is course-specific and that can be used
on-the-fly.
Chapter 4. Taxonomy of E!ortless Creation of Algorithm Visualizations 39
Figure 4.1: Evaluation of e!ortlessness of four AA systems. A single system might supportseveral levels of producer-system interaction, but only the most typical level is marked.

40 Chapter 4. Taxonomy of E!ortless Creation of Algorithm Visualizations
Chapter 5
MatrixPro
Publication [P2] introduces a new algorithm animation system called Matrix-
Pro (see Figure 5.1) that allows on-the-fly creation of algorithm animations.
It is based on the Matrix algorithm simulation framework [66]. The follow-
ing will briefly summarize the main features of the system. A more detailed
description can be found in Publication [P2].
In MatrixPro, the animations are created using visual algorithm simula-
tion [65]. In this approach, the user manipulates visualizations of the underly-
ing structure and creates a sequence of simulation steps. These steps include
basic variable assignments, reference manipulation, and operation invocations
such as insertions and deletions. All the operations are done using direct ma-
nipulation, that is, by drag and dropping. In the reference model of Figure 2.1
on page 10, visual algorithm simulation is di!erent from the other approaches.
There is no raw data1, and the data tables are created and modified through
interacting with the visual structures or the view.
The main window of MatrixPro is shown in Figure 5.1. The main function-
ality of the system is in the toolbar on the left and the menubar (not shown
in the figure). The toolbar is an essential component which enables users to
modify the created animations. Through the toolbar the user can modify the
animation easily, for example, by changing the granularity of the animation
sequence. In addition, the toolbar (as well as the menubar) contains controls
for moving backward and forward in the animation.
1Unless one wants to think the mental model of the person doing the simulation as the raw data.
41
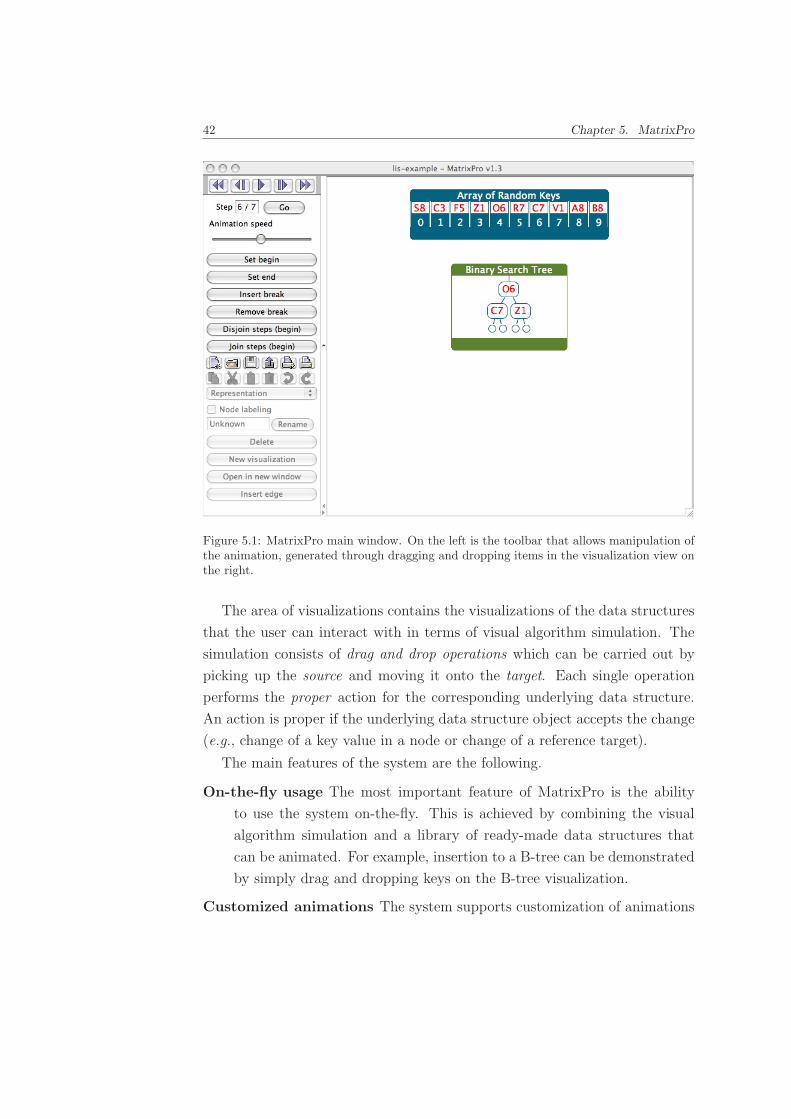
42 Chapter 5. MatrixPro
Figure 5.1: MatrixPro main window. On the left is the toolbar that allows manipulation ofthe animation, generated through dragging and dropping items in the visualization view onthe right.
The area of visualizations contains the visualizations of the data structures
that the user can interact with in terms of visual algorithm simulation. The
simulation consists of drag and drop operations which can be carried out by
picking up the source and moving it onto the target. Each single operation
performs the proper action for the corresponding underlying data structure.
An action is proper if the underlying data structure object accepts the change
(e.g., change of a key value in a node or change of a reference target).
The main features of the system are the following.
On-the-fly usage The most important feature of MatrixPro is the ability
to use the system on-the-fly. This is achieved by combining the visual
algorithm simulation and a library of ready-made data structures that
can be animated. For example, insertion to a B-tree can be demonstrated
by simply drag and dropping keys on the B-tree visualization.
Customized animations The system supports customization of animations
Chapter 5. MatrixPro 43
in two ways. The instructor can use whatever input data he/she wants.
In addition, the granularity level of the animation can be changed, that
is, how large steps are shown when playing the animation.
Storing and Retrieving Animations Although the system supports on-
the-fly usage, some instructors still want to prepare their animations in
advance. For this purpose, MatrixPro supports storing and retrieving of
the created animations. The animation can be stored as serialized Java
objects or exported as Scalable Vector Graphics (SVG) [141]. In addi-
tion, single steps in the animation can be exported as Portable Network
Graphics (PNG) or TEXdraw2 pictures.
Customizable user-interface The user interface of MatrixPro can be easily
customized by changing the set of toolbar objects. This allows it to fit
the needs of various users. For example, when demonstrating ready-made
animations on lecture, the instructor probably needs only the animation
controls and the visualization view.
Library MatrixPro includes a library of data structures that can be used to
produce animations making the production process less error-prone.
The fact that MatrixPro can be used on-the-fly without prior preparation
makes it e!ortless to use. However, as Figure 4.1 illustrates, the scope of
MatrixPro is limited. Thus, this system is not the answer for the general
question of the Taxonomy of e!ortless creation of algorithm animations: can
a generic systems that can be used without prior preparation be developed?
Yet, it is a step towards the killer-application, the problem now becomes how
to generalize this system to other application areas? This will be a future
research problem.
2See http://www.ctex.org/documents/packages/graphics/texdraw.pdf for details on TEXdraw.

44 Chapter 5. MatrixPro
Part III
Algorithm Animation
Languages
45

Chapter 6
Features of Algorithm
Animation Languages
This chapter shows the main characteristics of the algorithm animation lan-
guages. As stated earlier, we see algorithm animation language as a textual
representation describing an algorithm animation or visualization and it should
have a well-defined set of concepts, syntax, and semantics.
The distinction between algorithm animation languages and other lan-
guages is slightly fuzzy. The main principle is that a language has to have
something specifically designed for animating algorithms to be considered an
algorithm animation language. This can be, for example, data structures and
operations on them, coding concepts, or interaction. These features are often
missing from general purpose graphical description languages. Typically, how-
ever, another strong indicator is that there is an algorithm animation system
that uses the language.
While reading this chapter, the reader should keep in mind that we deal
with the languages, not the systems. Some of the features considered might
be available in a system, but not through the language the system uses. In
addition, the reader should note that this introduction will not state every
feature of the languages, only the ones that are most common or distinctive.
Also, the examples shown of the languages are often not complete with all the
details required in the language and they most likely cannot be used as-is in any
system. For descriptions of the languages themselves, see Publication [P3] or
the cited articles.
47
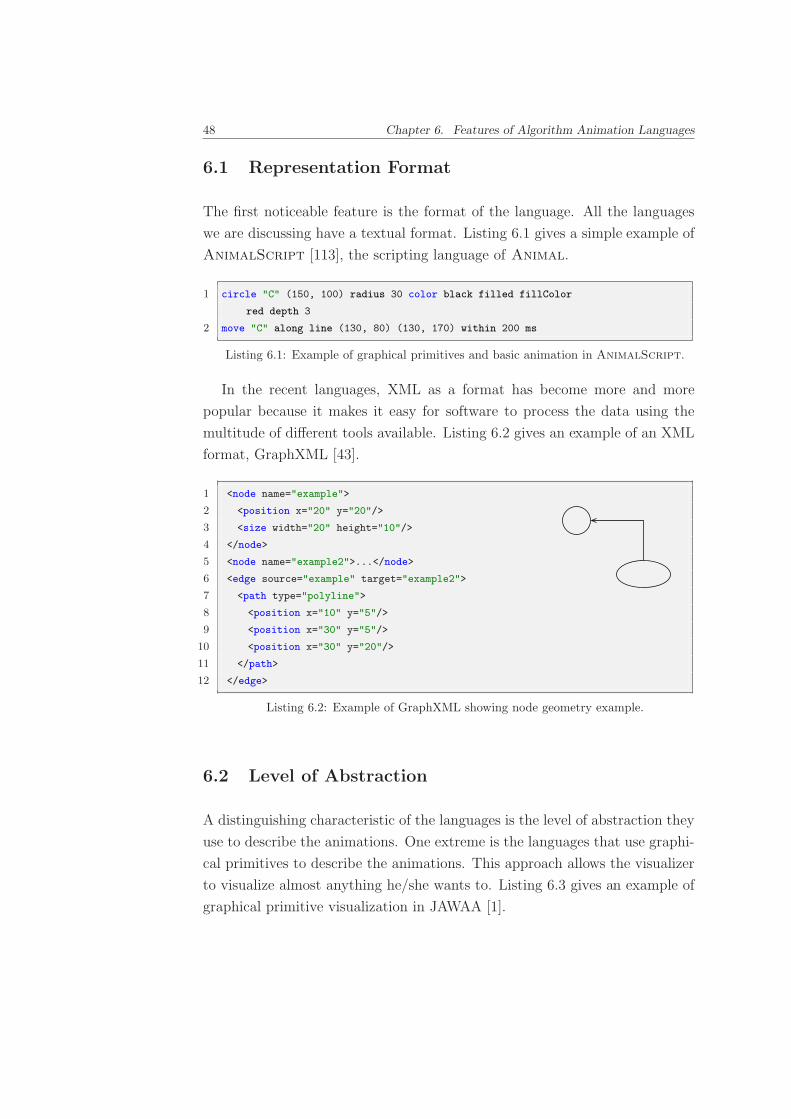
48 Chapter 6. Features of Algorithm Animation Languages
6.1 Representation Format
The first noticeable feature is the format of the language. All the languages
we are discussing have a textual format. Listing 6.1 gives a simple example of
AnimalScript [113], the scripting language of Animal.
1 circle "C" (150, 100) radius 30 color black filled fillColor
red depth 3
2 move "C" along line (130, 80) (130, 170) within 200 ms
Listing 6.1: Example of graphical primitives and basic animation in AnimalScript.
In the recent languages, XML as a format has become more and more
popular because it makes it easy for software to process the data using the
multitude of di!erent tools available. Listing 6.2 gives an example of an XML
format, GraphXML [43].
1 <node name="example">
2 <position x="20" y="20"/>
3 <size width="20" height="10"/>
4 </node>
5 <node name="example2">...</node>
6 <edge source="example" target="example2">
7 <path type="polyline">
8 <position x="10" y="5"/>
9 <position x="30" y="5"/>
10 <position x="30" y="20"/>
11 </path>
12 </edge>
Listing 6.2: Example of GraphXML showing node geometry example.
6.2 Level of Abstraction
A distinguishing characteristic of the languages is the level of abstraction they
use to describe the animations. One extreme is the languages that use graphi-
cal primitives to describe the animations. This approach allows the visualizer
to visualize almost anything he/she wants to. Listing 6.3 gives an example of
graphical primitive visualization in JAWAA [1].
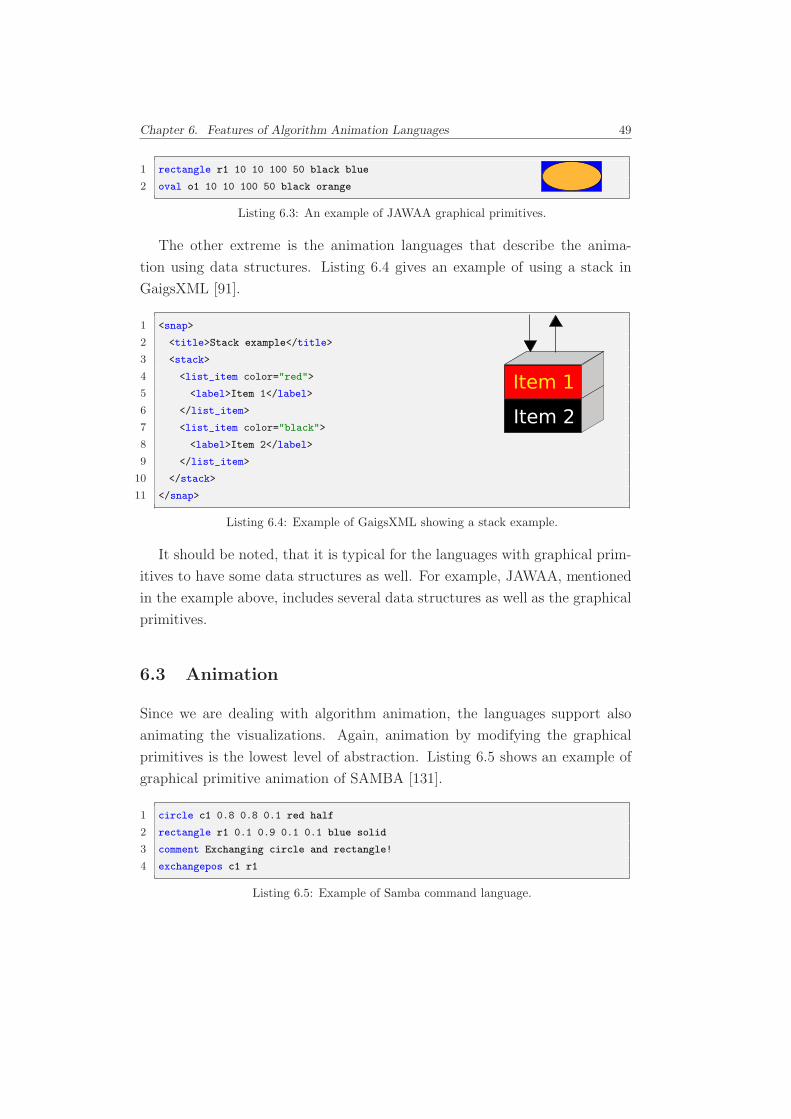
Chapter 6. Features of Algorithm Animation Languages 49
1 rectangle r1 10 10 100 50 black blue
2 oval o1 10 10 100 50 black orange
Listing 6.3: An example of JAWAA graphical primitives.
The other extreme is the animation languages that describe the anima-
tion using data structures. Listing 6.4 gives an example of using a stack in
GaigsXML [91].
1 <snap>
2 <title>Stack example</title>
3 <stack>
4 <list_item color="red">
5 <label>Item 1</label>
6 </list_item>
7 <list_item color="black">
8 <label>Item 2</label>
9 </list_item>
10 </stack>
11 </snap>
Listing 6.4: Example of GaigsXML showing a stack example.
It should be noted, that it is typical for the languages with graphical prim-
itives to have some data structures as well. For example, JAWAA, mentioned
in the example above, includes several data structures as well as the graphical
primitives.
6.3 Animation
Since we are dealing with algorithm animation, the languages support also
animating the visualizations. Again, animation by modifying the graphical
primitives is the lowest level of abstraction. Listing 6.5 shows an example of
graphical primitive animation of SAMBA [131].
1 circle c1 0.8 0.8 0.1 red half
2 rectangle r1 0.1 0.9 0.1 0.1 blue solid
3 comment Exchanging circle and rectangle!
4 exchangepos c1 r1
Listing 6.5: Example of Samba command language.
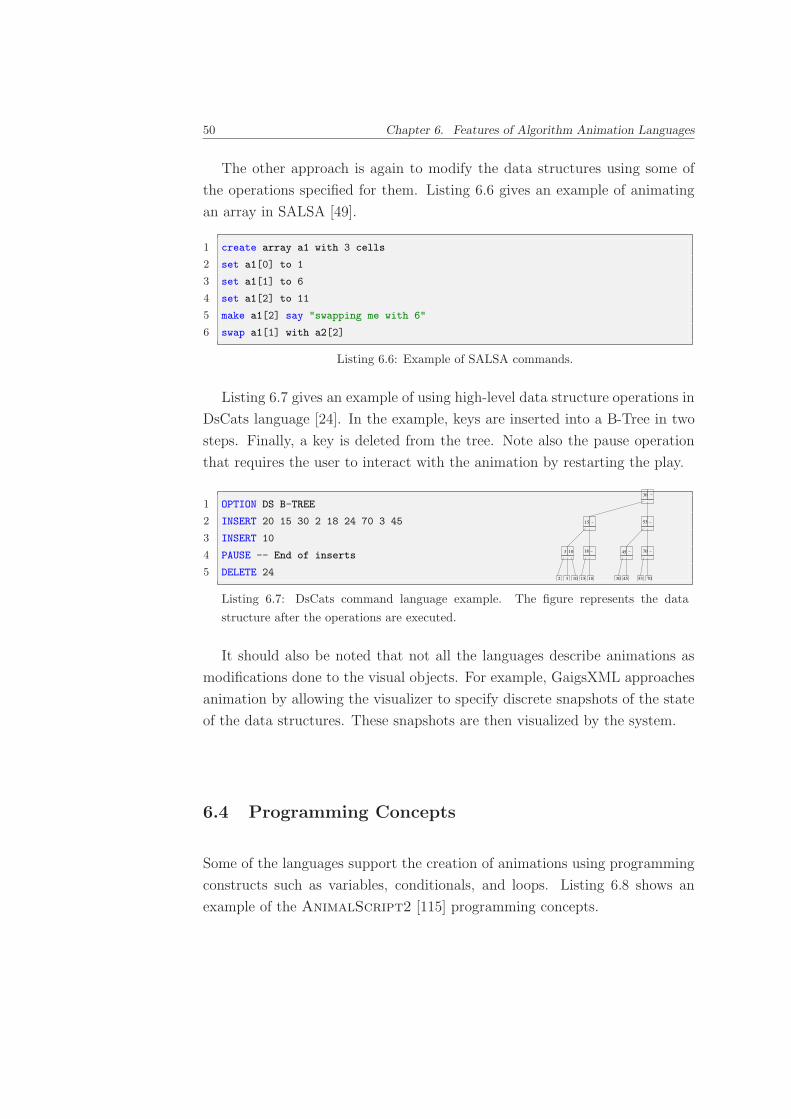
50 Chapter 6. Features of Algorithm Animation Languages
The other approach is again to modify the data structures using some of
the operations specified for them. Listing 6.6 gives an example of animating
an array in SALSA [49].
1 create array a1 with 3 cells
2 set a1[0] to 1
3 set a1[1] to 6
4 set a1[2] to 11
5 make a1[2] say "swapping me with 6"
6 swap a1[1] with a2[2]
Listing 6.6: Example of SALSA commands.
Listing 6.7 gives an example of using high-level data structure operations in
DsCats language [24]. In the example, keys are inserted into a B-Tree in two
steps. Finally, a key is deleted from the tree. Note also the pause operation
that requires the user to interact with the animation by restarting the play.
1 OPTION DS B-TREE
2 INSERT 20 15 30 2 18 24 70 3 45
3 INSERT 10
4 PAUSE -- End of inserts
5 DELETE 24
Listing 6.7: DsCats command language example. The figure represents the data
structure after the operations are executed.
30
5315
18 7045
1032 1815 4530 7053
103
It should also be noted that not all the languages describe animations as
modifications done to the visual objects. For example, GaigsXML approaches
animation by allowing the visualizer to specify discrete snapshots of the state
of the data structures. These snapshots are then visualized by the system.
6.4 Programming Concepts
Some of the languages support the creation of animations using programming
constructs such as variables, conditionals, and loops. Listing 6.8 shows an
example of the AnimalScript2 [115] programming concepts.
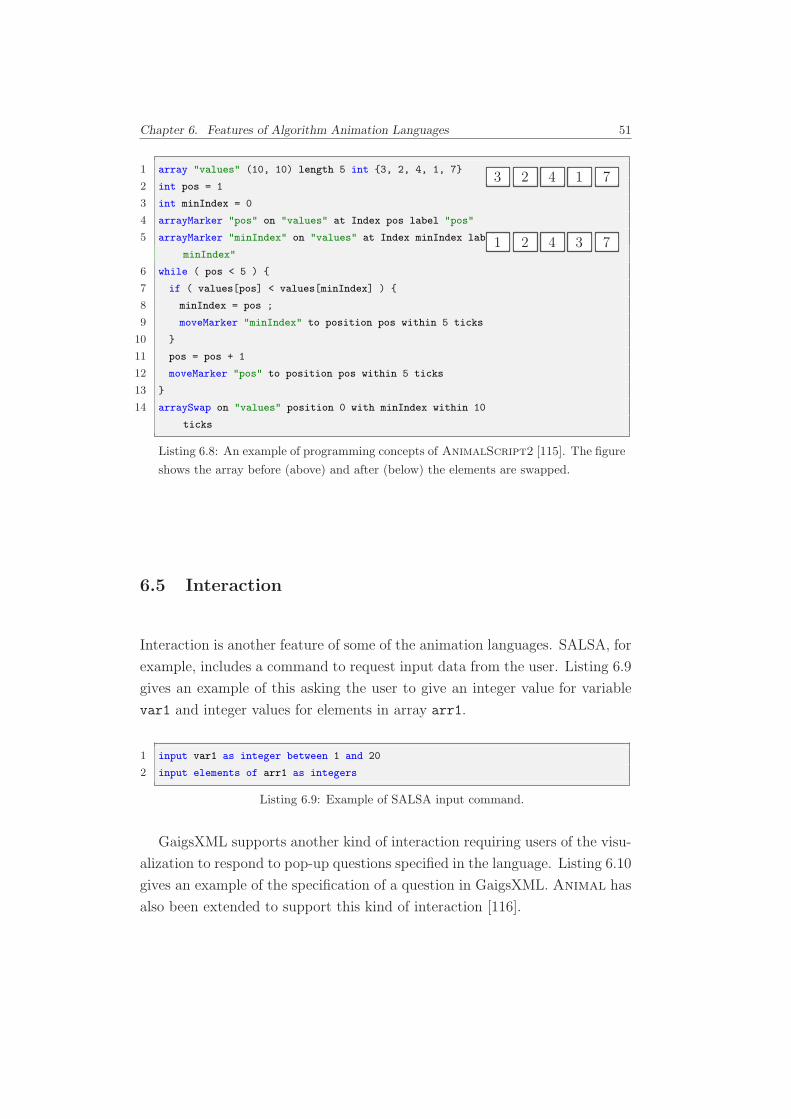
Chapter 6. Features of Algorithm Animation Languages 51
1 array "values" (10, 10) length 5 int {3, 2, 4, 1, 7}
2 int pos = 1
3 int minIndex = 0
4 arrayMarker "pos" on "values" at Index pos label "pos"
5 arrayMarker "minIndex" on "values" at Index minIndex label "
minIndex"
6 while ( pos < 5 ) {
7 if ( values[pos] < values[minIndex] ) {
8 minIndex = pos ;
9 moveMarker "minIndex" to position pos within 5 ticks
10 }
11 pos = pos + 1
12 moveMarker "pos" to position pos within 5 ticks
13 }
14 arraySwap on "values" position 0 with minIndex within 10
ticks
Listing 6.8: An example of programming concepts of AnimalScript2 [115]. The figure
shows the array before (above) and after (below) the elements are swapped.
73421
71423
6.5 Interaction
Interaction is another feature of some of the animation languages. SALSA, for
example, includes a command to request input data from the user. Listing 6.9
gives an example of this asking the user to give an integer value for variable
var1 and integer values for elements in array arr1.
1 input var1 as integer between 1 and 20
2 input elements of arr1 as integers
Listing 6.9: Example of SALSA input command.
GaigsXML supports another kind of interaction requiring users of the visu-
alization to respond to pop-up questions specified in the language. Listing 6.10
gives an example of the specification of a question in GaigsXML. Animal has
also been extended to support this kind of interaction [116].
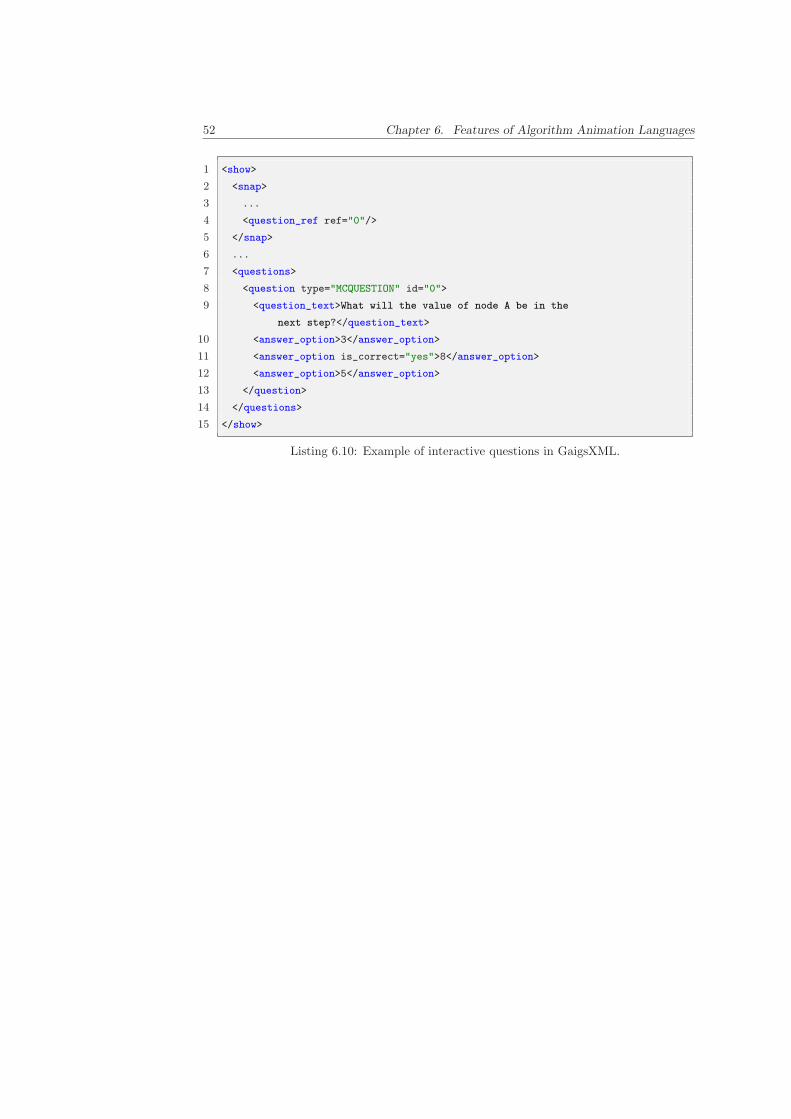
52 Chapter 6. Features of Algorithm Animation Languages
1 <show>
2 <snap>
3 ...
4 <question_ref ref="0"/>
5 </snap>
6 ...
7 <questions>
8 <question type="MCQUESTION" id="0">
9 <question_text>What will the value of node A be in the
next step?</question_text>
10 <answer_option>3</answer_option>
11 <answer_option is_correct="yes">8</answer_option>
12 <answer_option>5</answer_option>
13 </question>
14 </questions>
15 </show>
Listing 6.10: Example of interactive questions in GaigsXML.
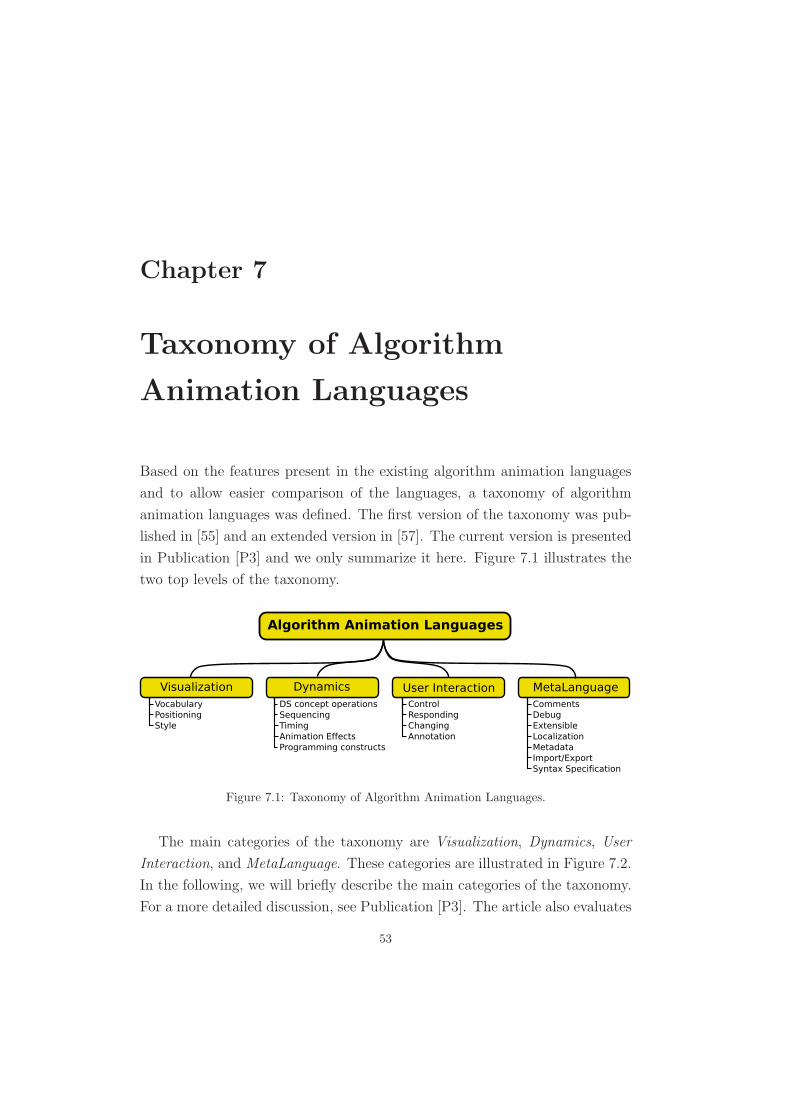
Chapter 7
Taxonomy of Algorithm
Animation Languages
Based on the features present in the existing algorithm animation languages
and to allow easier comparison of the languages, a taxonomy of algorithm
animation languages was defined. The first version of the taxonomy was pub-
lished in [55] and an extended version in [57]. The current version is presented
in Publication [P3] and we only summarize it here. Figure 7.1 illustrates the
two top levels of the taxonomy.
Figure 7.1: Taxonomy of Algorithm Animation Languages.
The main categories of the taxonomy are Visualization, Dynamics, User
Interaction, and MetaLanguage. These categories are illustrated in Figure 7.2.
In the following, we will briefly describe the main categories of the taxonomy.
For a more detailed discussion, see Publication [P3]. The article also evaluates
53
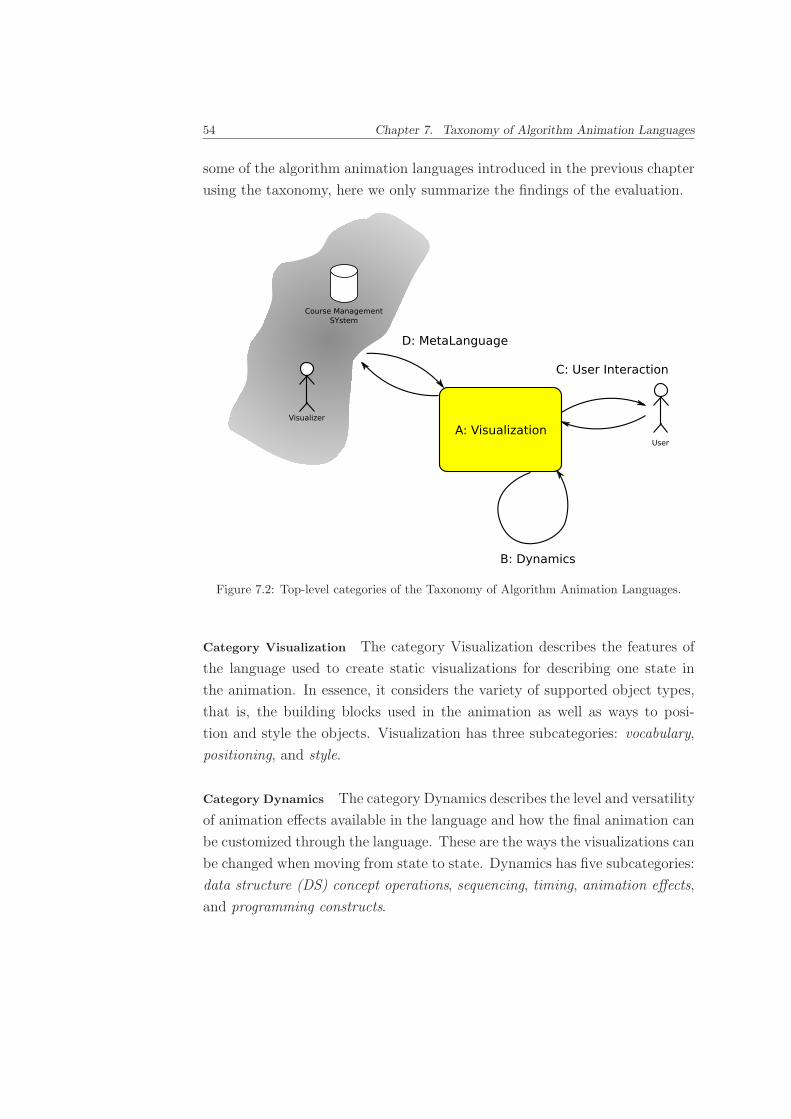
54 Chapter 7. Taxonomy of Algorithm Animation Languages
some of the algorithm animation languages introduced in the previous chapter
using the taxonomy, here we only summarize the findings of the evaluation.
Figure 7.2: Top-level categories of the Taxonomy of Algorithm Animation Languages.
Category Visualization The category Visualization describes the features of
the language used to create static visualizations for describing one state in
the animation. In essence, it considers the variety of supported object types,
that is, the building blocks used in the animation as well as ways to posi-
tion and style the objects. Visualization has three subcategories: vocabulary,
positioning, and style.
Category Dynamics The category Dynamics describes the level and versatility
of animation e!ects available in the language and how the final animation can
be customized through the language. These are the ways the visualizations can
be changed when moving from state to state. Dynamics has five subcategories:
data structure (DS) concept operations, sequencing, timing, animation e!ects,
and programming constructs.
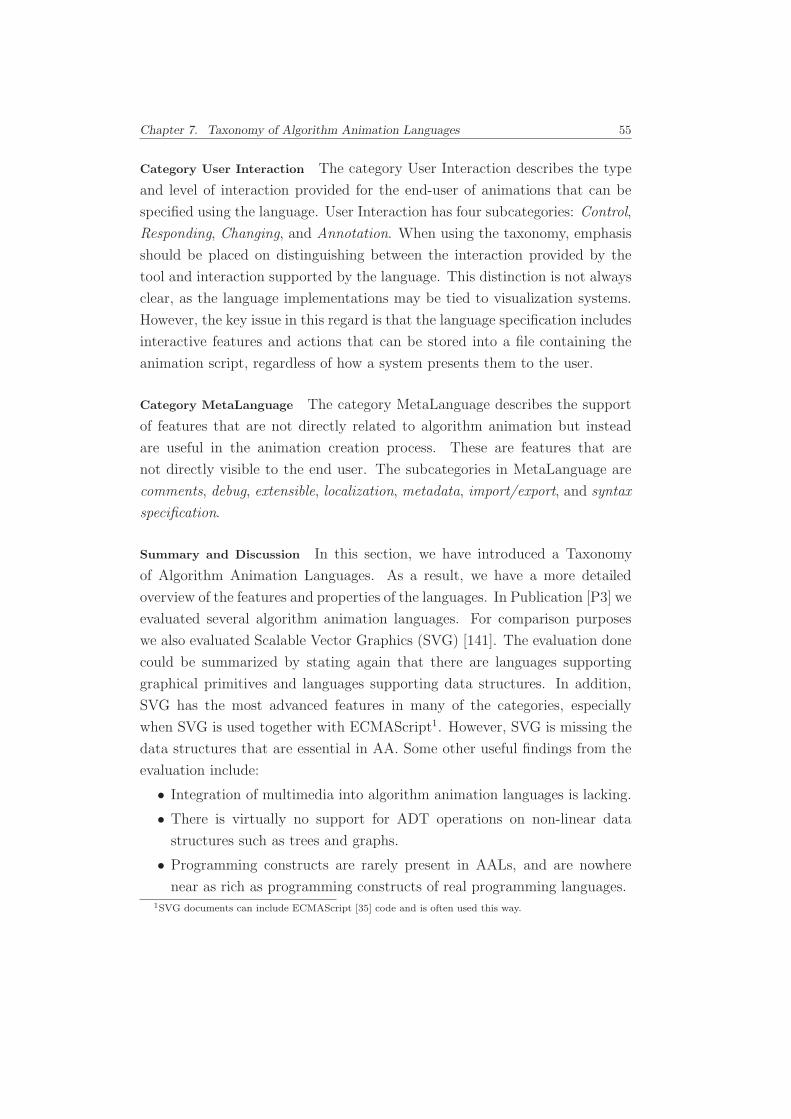
Chapter 7. Taxonomy of Algorithm Animation Languages 55
Category User Interaction The category User Interaction describes the type
and level of interaction provided for the end-user of animations that can be
specified using the language. User Interaction has four subcategories: Control,
Responding, Changing, and Annotation. When using the taxonomy, emphasis
should be placed on distinguishing between the interaction provided by the
tool and interaction supported by the language. This distinction is not always
clear, as the language implementations may be tied to visualization systems.
However, the key issue in this regard is that the language specification includes
interactive features and actions that can be stored into a file containing the
animation script, regardless of how a system presents them to the user.
Category MetaLanguage The category MetaLanguage describes the support
of features that are not directly related to algorithm animation but instead
are useful in the animation creation process. These are features that are
not directly visible to the end user. The subcategories in MetaLanguage are
comments, debug, extensible, localization, metadata, import/export, and syntax
specification.
Summary and Discussion In this section, we have introduced a Taxonomy
of Algorithm Animation Languages. As a result, we have a more detailed
overview of the features and properties of the languages. In Publication [P3] we
evaluated several algorithm animation languages. For comparison purposes
we also evaluated Scalable Vector Graphics (SVG) [141]. The evaluation done
could be summarized by stating again that there are languages supporting
graphical primitives and languages supporting data structures. In addition,
SVG has the most advanced features in many of the categories, especially
when SVG is used together with ECMAScript1. However, SVG is missing the
data structures that are essential in AA. Some other useful findings from the
evaluation include:
• Integration of multimedia into algorithm animation languages is lacking.
• There is virtually no support for ADT operations on non-linear data
structures such as trees and graphs.
• Programming constructs are rarely present in AALs, and are nowhere
near as rich as programming constructs of real programming languages.1SVG documents can include ECMAScript [35] code and is often used this way.
56 Chapter 7. Taxonomy of Algorithm Animation Languages
• There is a clear lack of user interaction features in AALs.
The evaluation of the languages is straightforward, although it requires
quite deep knowledge and understanding of the evaluated languages. In the
future, as AA languages are developed further and new features emerge, this
taxonomy is likely to be outdated. In such case, updates to the taxonomy
should be made.
Chapter 8
Proposal for Standard
Algorithm Animation Language
In this chapter, we will introduce our proposal for a standard algorithm anima-
tion language. The work is based on the report of an ITiCSE Working Group
(Publication [P4]), and we will start this chapter by describing the report and
move on to our proposed language, Xaal (eXtensible Algorithm Animation
Language).
8.1 ITiCSE XML Working Group
In the Conference on Innovation and Technology in Computer Science Educa-
tion (ITiCSE) 2005 a working group titled “Development of XML-based Tools
to Support User Interaction with Algorithm Visualization” convened to come
up with XML specifications to support algorithm animation. The group vi-
sioned a set of features of a common algorithm animation language and wrote
a report that introduces them (see Publication [P4]). In addition, the report
discusses a proposed architecture for adding support for an XML specification
to existing visualization systems. This architecture is presented in Figure 8.1.
The various parts of the architecture are responsible for handling di!er-
ent aspects of the data that is to be visualized. The responsibilities are the
following.
• Elaborator connects interesting events with objects. For example, con-
necting event insert 6 to an instance of binary search tree object.
57
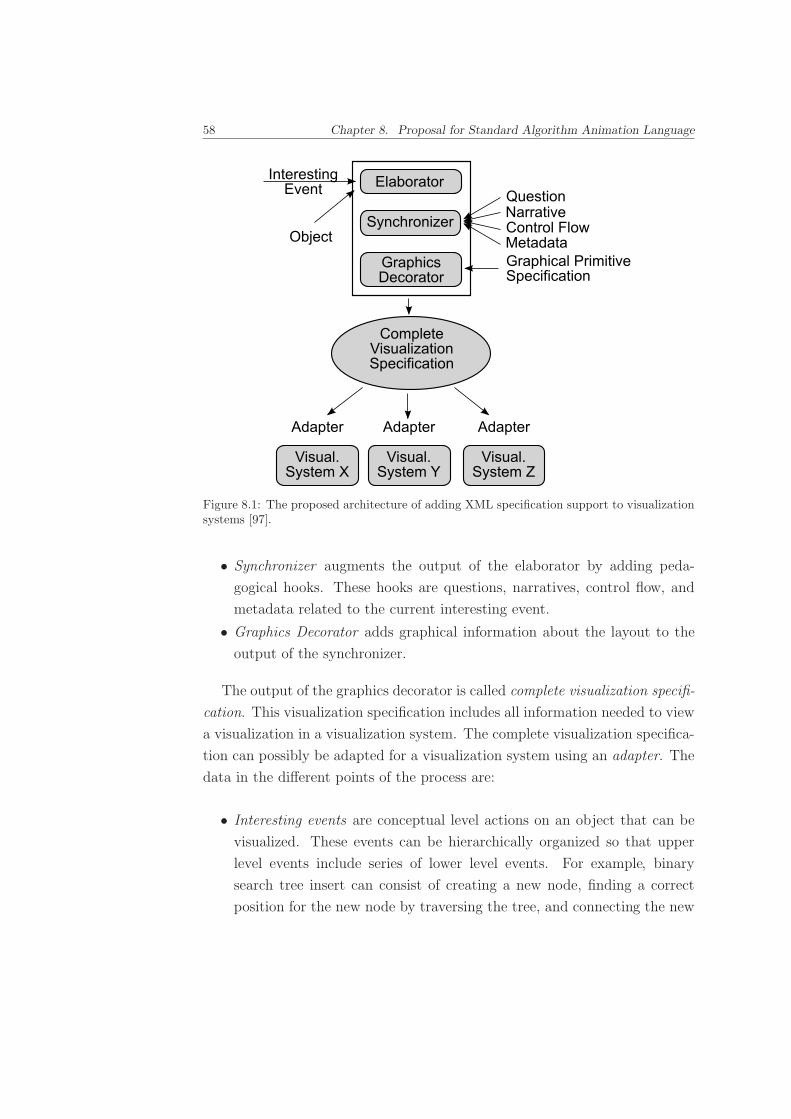
58 Chapter 8. Proposal for Standard Algorithm Animation Language
Figure 8.1: The proposed architecture of adding XML specification support to visualizationsystems [97].
• Synchronizer augments the output of the elaborator by adding peda-
gogical hooks. These hooks are questions, narratives, control flow, and
metadata related to the current interesting event.
• Graphics Decorator adds graphical information about the layout to the
output of the synchronizer.
The output of the graphics decorator is called complete visualization specifi-
cation. This visualization specification includes all information needed to view
a visualization in a visualization system. The complete visualization specifica-
tion can possibly be adapted for a visualization system using an adapter. The
data in the di!erent points of the process are:
• Interesting events are conceptual level actions on an object that can be
visualized. These events can be hierarchically organized so that upper
level events include series of lower level events. For example, binary
search tree insert can consist of creating a new node, finding a correct
position for the new node by traversing the tree, and connecting the new
Chapter 8. Proposal for Standard Algorithm Animation Language 59
node to the correct position in the tree. The interesting events can be
produced by executing a program or by a visualization author.
• High level objects are used to describe the targets of the interesting events.
Typically, in the field of algorithm animation, these are data structures.
• Questions can be associated with events in the visualization. These ques-
tions can be, for example, prediction-style questions.
• Narrations can be used to attach descriptions (text, graphics, and audio)
related to the event.
• Control flow specification can be used to associate (pseudo)code lines
with the event to be visualized.
• Metadata can be used for providing additional information.
• Graphical primitives specification is used to attach information on how
the event should be visualized in terms of graphical primitives and trans-
formations on them.
In the next section when we discuss Xaal, we have adopted some of the
ready defined and suitable parts of the WG specifications in order to support
the international goal of a uniform algorithm animation language specification.
However, most of the aspects of AA were not formally defined by the working
group. Thus, not all of these specifications are used as a part of the new
language.
Due to the fact that the working group did not come up with definite
specifications, the development of the specifications has continued in di!erent
projects. The next section will introduce our proposal for a standard algo-
rithm animation language. The other project by the members of the working
group has been done by Loboda et al. [77]. They have specified two XML lan-
guages for specifying visualizations and content. They suggest a distributed
framework for visualization that is based on the interesting events produced
by a program or an algorithm. For describing the content, they have specified
c-XML and for the visualization, v-XML.
As the main reason for two di!erent projects continuing the work of the
WG we see the lack of further meetings by the WG members. Originally, the
hope was to convene again a year after the original working group [97]. This,
however, did not happen.
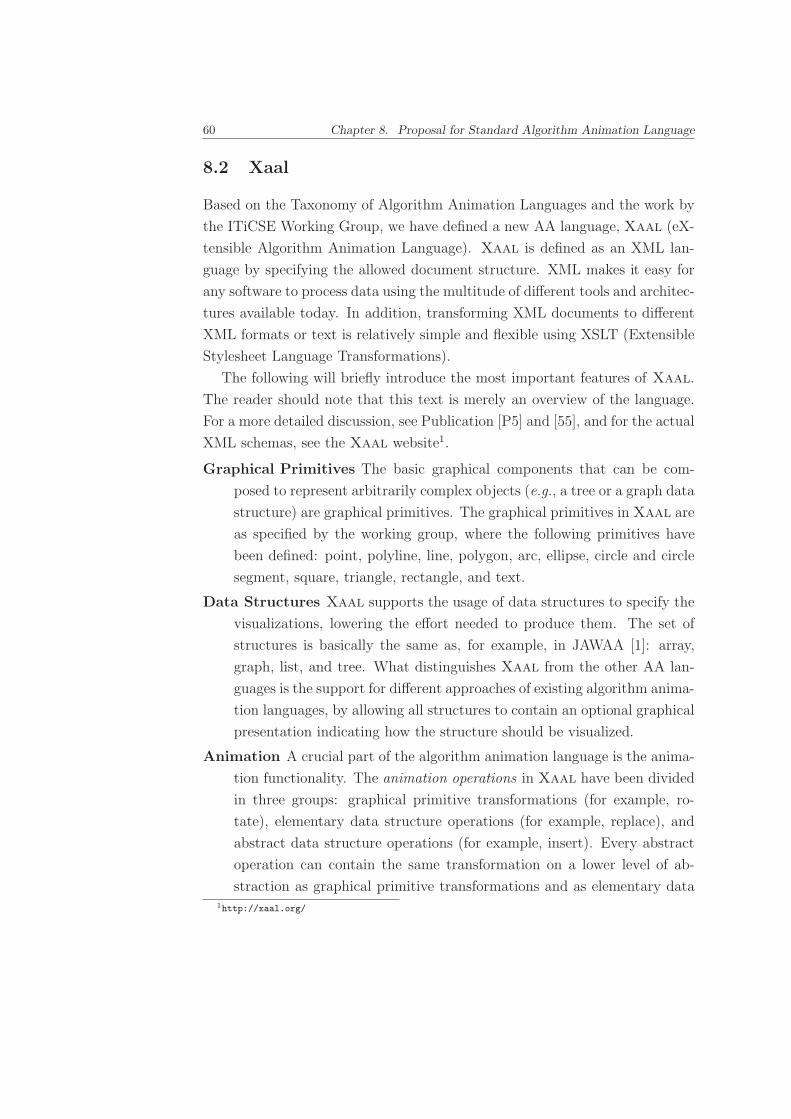
60 Chapter 8. Proposal for Standard Algorithm Animation Language
8.2 Xaal
Based on the Taxonomy of Algorithm Animation Languages and the work by
the ITiCSE Working Group, we have defined a new AA language, Xaal (eX-
tensible Algorithm Animation Language). Xaal is defined as an XML lan-
guage by specifying the allowed document structure. XML makes it easy for
any software to process data using the multitude of di!erent tools and architec-
tures available today. In addition, transforming XML documents to di!erent
XML formats or text is relatively simple and flexible using XSLT (Extensible
Stylesheet Language Transformations).
The following will briefly introduce the most important features of Xaal.
The reader should note that this text is merely an overview of the language.
For a more detailed discussion, see Publication [P5] and [55], and for the actual
XML schemas, see the Xaal website1.
Graphical Primitives The basic graphical components that can be com-
posed to represent arbitrarily complex objects (e.g., a tree or a graph data
structure) are graphical primitives. The graphical primitives in Xaal are
as specified by the working group, where the following primitives have
been defined: point, polyline, line, polygon, arc, ellipse, circle and circle
segment, square, triangle, rectangle, and text.
Data Structures Xaal supports the usage of data structures to specify the
visualizations, lowering the e!ort needed to produce them. The set of
structures is basically the same as, for example, in JAWAA [1]: array,
graph, list, and tree. What distinguishes Xaal from the other AA lan-
guages is the support for di!erent approaches of existing algorithm anima-
tion languages, by allowing all structures to contain an optional graphical
presentation indicating how the structure should be visualized.
Animation A crucial part of the algorithm animation language is the anima-
tion functionality. The animation operations in Xaal have been divided
in three groups: graphical primitive transformations (for example, ro-
tate), elementary data structure operations (for example, replace), and
abstract data structure operations (for example, insert). Every abstract
operation can contain the same transformation on a lower level of ab-
straction as graphical primitive transformations and as elementary data1http://xaal.org/
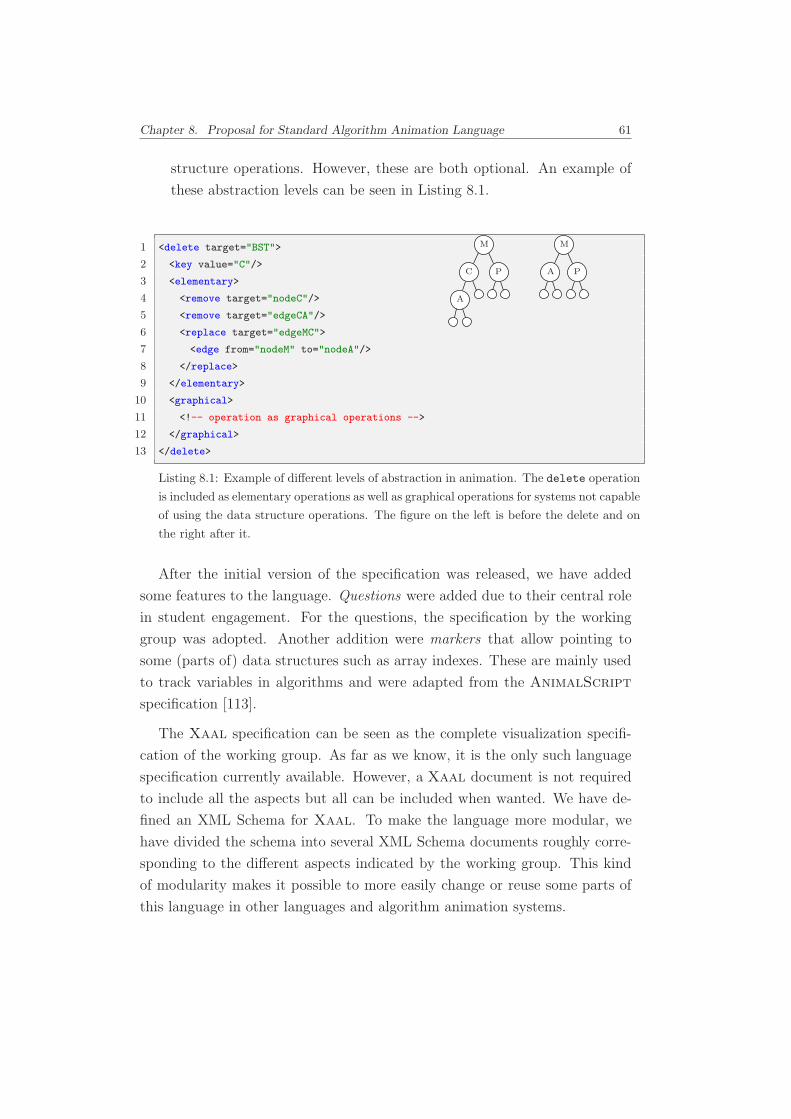
Chapter 8. Proposal for Standard Algorithm Animation Language 61
structure operations. However, these are both optional. An example of
these abstraction levels can be seen in Listing 8.1.
1 <delete target="BST">
2 <key value="C"/>
3 <elementary>
4 <remove target="nodeC"/>
5 <remove target="edgeCA"/>
6 <replace target="edgeMC">
7 <edge from="nodeM" to="nodeA"/>
8 </replace>
9 </elementary>
10 <graphical>
11 <!-- operation as graphical operations -->
12 </graphical>
13 </delete>
Listing 8.1: Example of di!erent levels of abstraction in animation. The delete operation
is included as elementary operations as well as graphical operations for systems not capable
of using the data structure operations. The figure on the left is before the delete and on
the right after it.
PA
M
P
A
C
M
After the initial version of the specification was released, we have added
some features to the language. Questions were added due to their central role
in student engagement. For the questions, the specification by the working
group was adopted. Another addition were markers that allow pointing to
some (parts of) data structures such as array indexes. These are mainly used
to track variables in algorithms and were adapted from the AnimalScript
specification [113].
The Xaal specification can be seen as the complete visualization specifi-
cation of the working group. As far as we know, it is the only such language
specification currently available. However, a Xaal document is not required
to include all the aspects but all can be included when wanted. We have de-
fined an XML Schema for Xaal. To make the language more modular, we
have divided the schema into several XML Schema documents roughly corre-
sponding to the di!erent aspects indicated by the working group. This kind
of modularity makes it possible to more easily change or reuse some parts of
this language in other languages and algorithm animation systems.
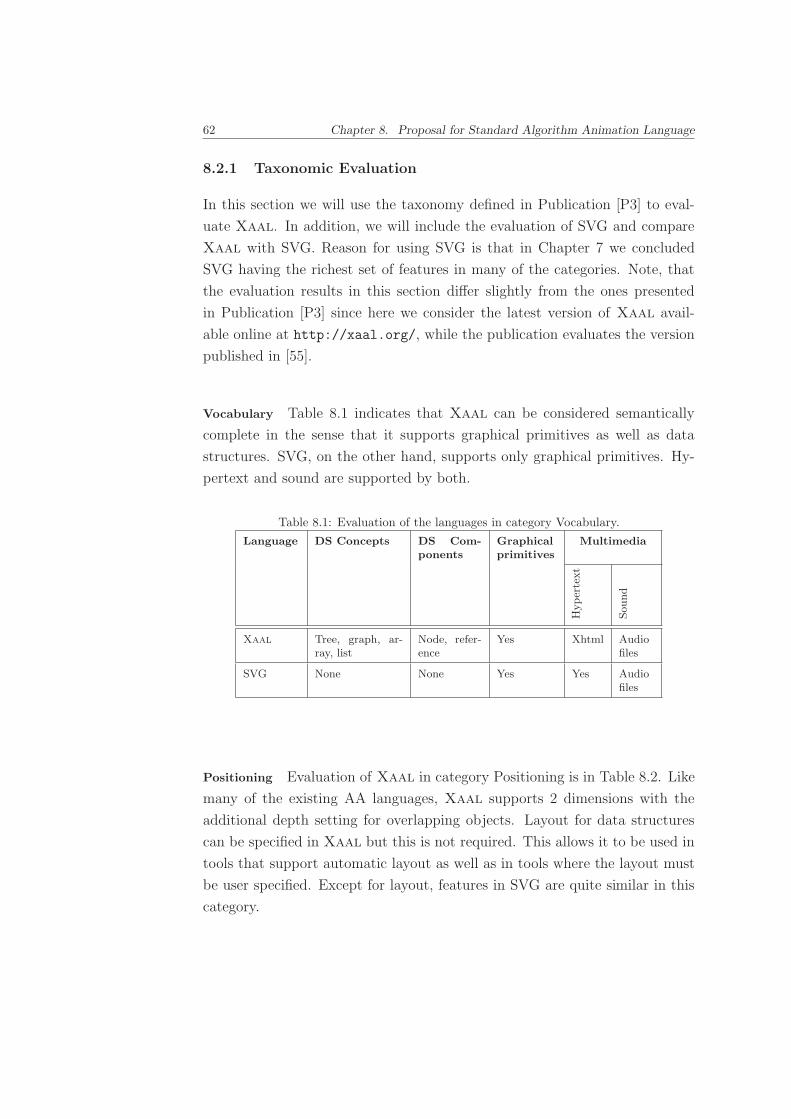
62 Chapter 8. Proposal for Standard Algorithm Animation Language
8.2.1 Taxonomic Evaluation
In this section we will use the taxonomy defined in Publication [P3] to eval-
uate Xaal. In addition, we will include the evaluation of SVG and compare
Xaal with SVG. Reason for using SVG is that in Chapter 7 we concluded
SVG having the richest set of features in many of the categories. Note, that
the evaluation results in this section di!er slightly from the ones presented
in Publication [P3] since here we consider the latest version of Xaal avail-
able online at http://xaal.org/, while the publication evaluates the version
published in [55].
Vocabulary Table 8.1 indicates that Xaal can be considered semantically
complete in the sense that it supports graphical primitives as well as data
structures. SVG, on the other hand, supports only graphical primitives. Hy-
pertext and sound are supported by both.
Table 8.1: Evaluation of the languages in category Vocabulary.
Language DS Concepts DS Com-ponents
Graphicalprimitives
Multimedia
Hyper
text
Sou
nd
Xaal Tree, graph, ar-ray, list
Node, refer-ence
Yes Xhtml Audiofiles
SVG None None Yes Yes Audiofiles
Positioning Evaluation of Xaal in category Positioning is in Table 8.2. Like
many of the existing AA languages, Xaal supports 2 dimensions with the
additional depth setting for overlapping objects. Layout for data structures
can be specified in Xaal but this is not required. This allows it to be used in
tools that support automatic layout as well as in tools where the layout must
be user specified. Except for layout, features in SVG are quite similar in this
category.
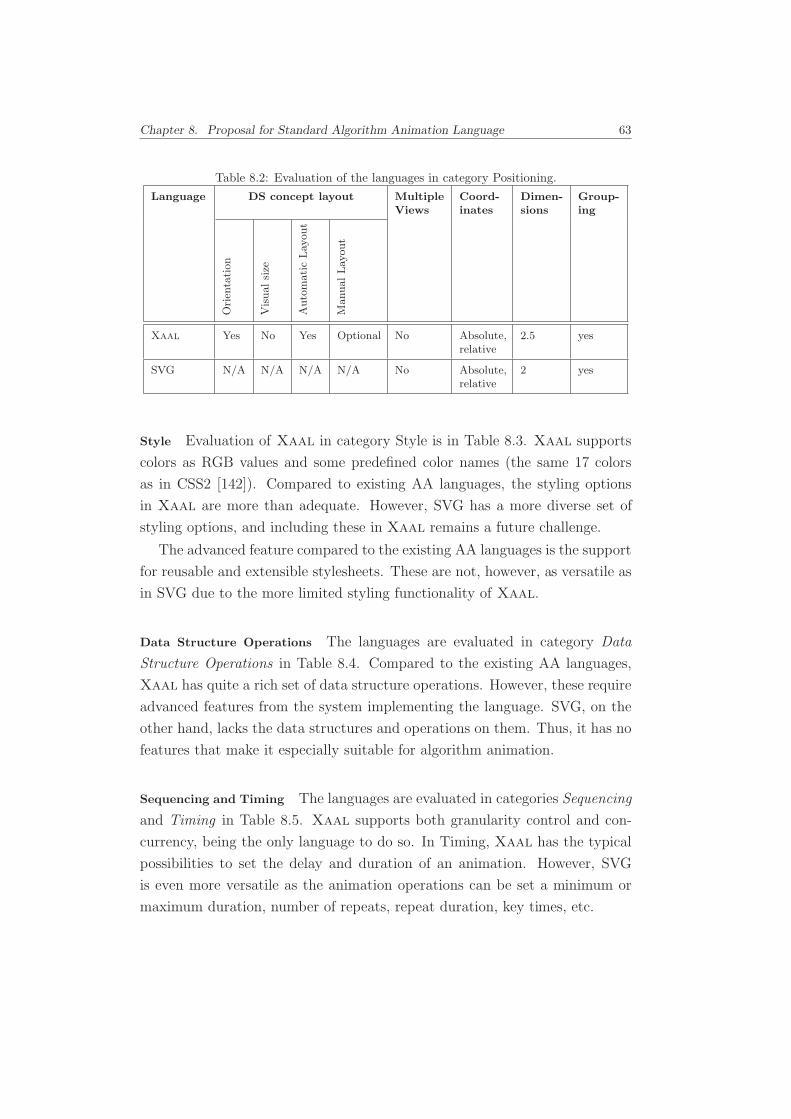
Chapter 8. Proposal for Standard Algorithm Animation Language 63
Table 8.2: Evaluation of the languages in category Positioning.
Language DS concept layout MultipleViews
Coord-inates
Dimen-sions
Group-ing
Ori
enta
tion
Vis
ual
size
Auto
mat
icLay
out
Man
ual
Lay
out
Xaal Yes No Yes Optional No Absolute,relative
2.5 yes
SVG N/A N/A N/A N/A No Absolute,relative
2 yes
Style Evaluation of Xaal in category Style is in Table 8.3. Xaal supports
colors as RGB values and some predefined color names (the same 17 colors
as in CSS2 [142]). Compared to existing AA languages, the styling options
in Xaal are more than adequate. However, SVG has a more diverse set of
styling options, and including these in Xaal remains a future challenge.
The advanced feature compared to the existing AA languages is the support
for reusable and extensible stylesheets. These are not, however, as versatile as
in SVG due to the more limited styling functionality of Xaal.
Data Structure Operations The languages are evaluated in category Data
Structure Operations in Table 8.4. Compared to the existing AA languages,
Xaal has quite a rich set of data structure operations. However, these require
advanced features from the system implementing the language. SVG, on the
other hand, lacks the data structures and operations on them. Thus, it has no
features that make it especially suitable for algorithm animation.
Sequencing and Timing The languages are evaluated in categories Sequencing
and Timing in Table 8.5. Xaal supports both granularity control and con-
currency, being the only language to do so. In Timing, Xaal has the typical
possibilities to set the delay and duration of an animation. However, SVG
is even more versatile as the animation operations can be set a minimum or
maximum duration, number of repeats, repeat duration, key times, etc.
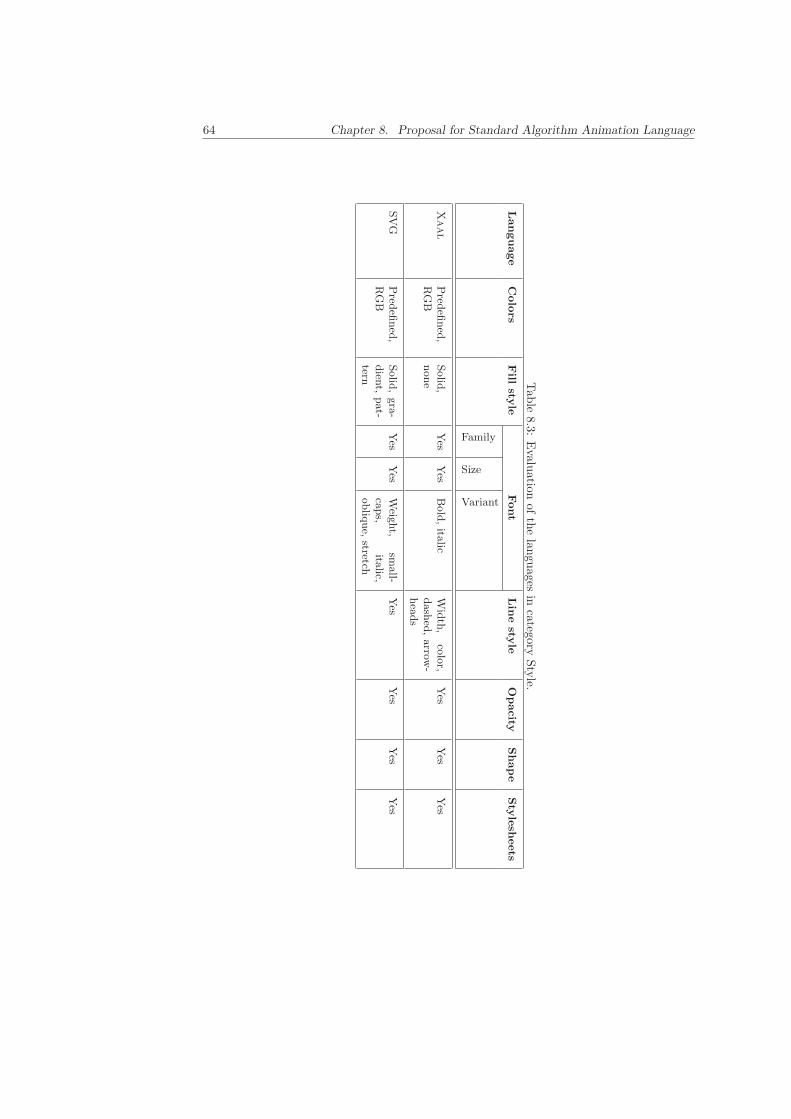
64 Chapter 8. Proposal for Standard Algorithm Animation Language
Tab
le8.3:
Evalu
ationof
the
langu
agesin
categoryStyle.
Language
Colo
rsFill
style
Font
Lin
esty
leO
pacity
Shape
Sty
lesh
eets
Family
Size
Variant
Xaal
Pred
efined
,R
GB
Solid
,non
eY
esY
esB
old,italic
Wid
th,
color,dash
ed,arrow
-head
s
Yes
Yes
Yes
SV
GP
redefi
ned
,R
GB
Solid
,gra-
dien
t,pat-
tern
Yes
Yes
Weigh
t,sm
all-cap
s,italic,
obliq
ue,
stretch
Yes
Yes
Yes
Yes
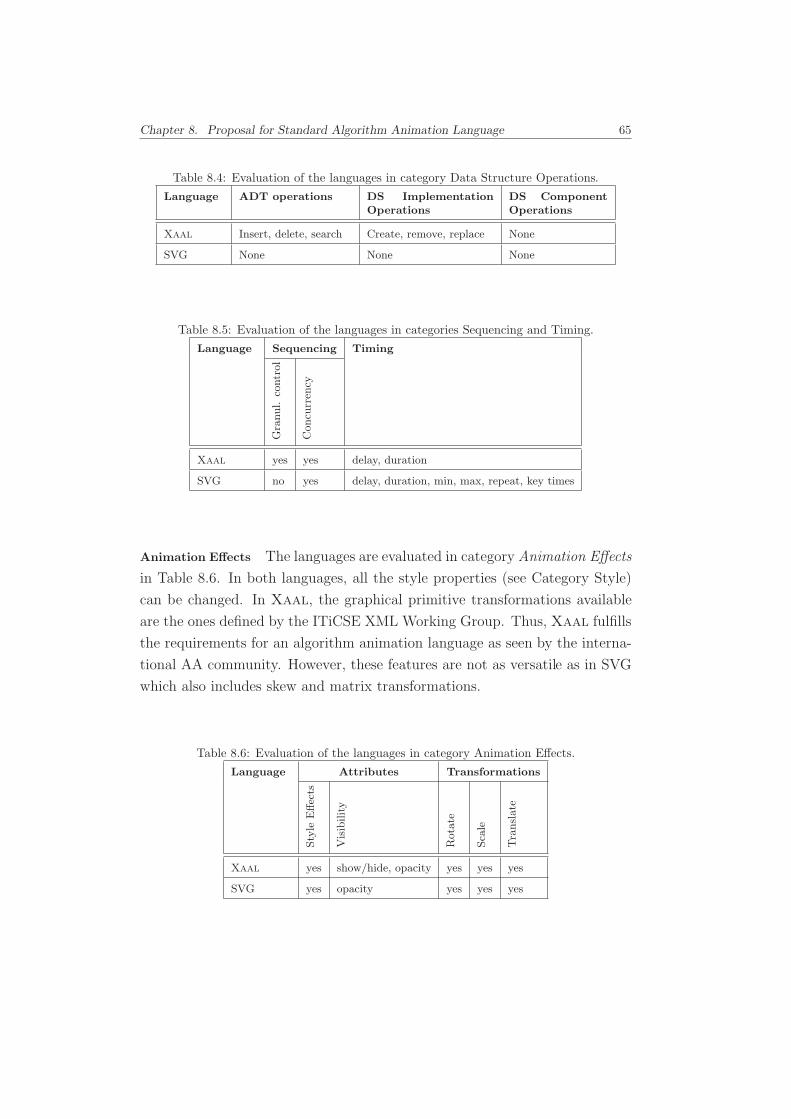
Chapter 8. Proposal for Standard Algorithm Animation Language 65
Table 8.4: Evaluation of the languages in category Data Structure Operations.
Language ADT operations DS ImplementationOperations
DS ComponentOperations
Xaal Insert, delete, search Create, remove, replace None
SVG None None None
Table 8.5: Evaluation of the languages in categories Sequencing and Timing.
Language Sequencing Timing
Gra
nul.
contr
ol
Con
curr
ency
Xaal yes yes delay, duration
SVG no yes delay, duration, min, max, repeat, key times
Animation E!ects The languages are evaluated in category Animation E!ects
in Table 8.6. In both languages, all the style properties (see Category Style)
can be changed. In Xaal, the graphical primitive transformations available
are the ones defined by the ITiCSE XML Working Group. Thus, Xaal fulfills
the requirements for an algorithm animation language as seen by the interna-
tional AA community. However, these features are not as versatile as in SVG
which also includes skew and matrix transformations.
Table 8.6: Evaluation of the languages in category Animation E!ects.
Language Attributes Transformations
Sty
leE
!ec
ts
Vis
ibility
Rot
ate
Sca
le
Tra
nsl
ate
Xaal yes show/hide, opacity yes yes yes
SVG yes opacity yes yes yes
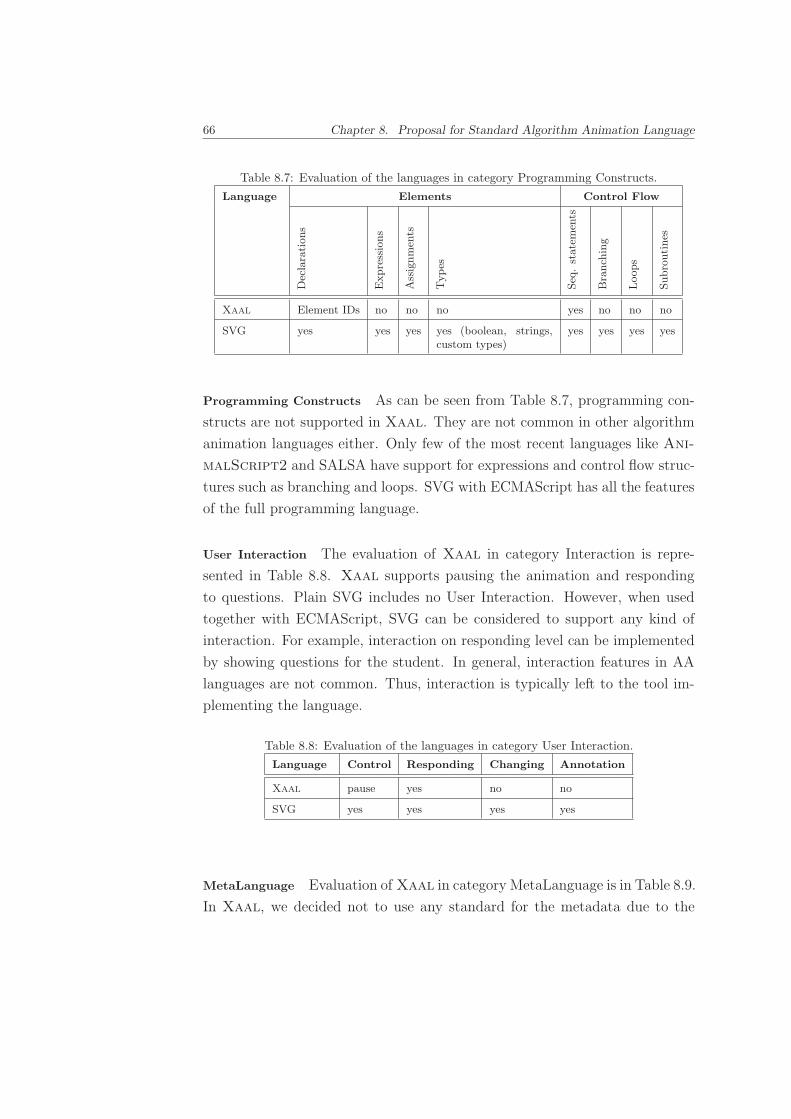
66 Chapter 8. Proposal for Standard Algorithm Animation Language
Table 8.7: Evaluation of the languages in category Programming Constructs.
Language Elements Control Flow
Dec
lara
tion
s
Expre
ssio
ns
Ass
ignm
ents
Types
Seq
.st
atem
ents
Bra
nch
ing
Loop
s
Subro
uti
nes
Xaal Element IDs no no no yes no no no
SVG yes yes yes yes (boolean, strings,custom types)
yes yes yes yes
Programming Constructs As can be seen from Table 8.7, programming con-
structs are not supported in Xaal. They are not common in other algorithm
animation languages either. Only few of the most recent languages like Ani-
malScript2 and SALSA have support for expressions and control flow struc-
tures such as branching and loops. SVG with ECMAScript has all the features
of the full programming language.
User Interaction The evaluation of Xaal in category Interaction is repre-
sented in Table 8.8. Xaal supports pausing the animation and responding
to questions. Plain SVG includes no User Interaction. However, when used
together with ECMAScript, SVG can be considered to support any kind of
interaction. For example, interaction on responding level can be implemented
by showing questions for the student. In general, interaction features in AA
languages are not common. Thus, interaction is typically left to the tool im-
plementing the language.
Table 8.8: Evaluation of the languages in category User Interaction.
Language Control Responding Changing Annotation
Xaal pause yes no no
SVG yes yes yes yes
MetaLanguage Evaluation of Xaal in category MetaLanguage is in Table 8.9.
In Xaal, we decided not to use any standard for the metadata due to the
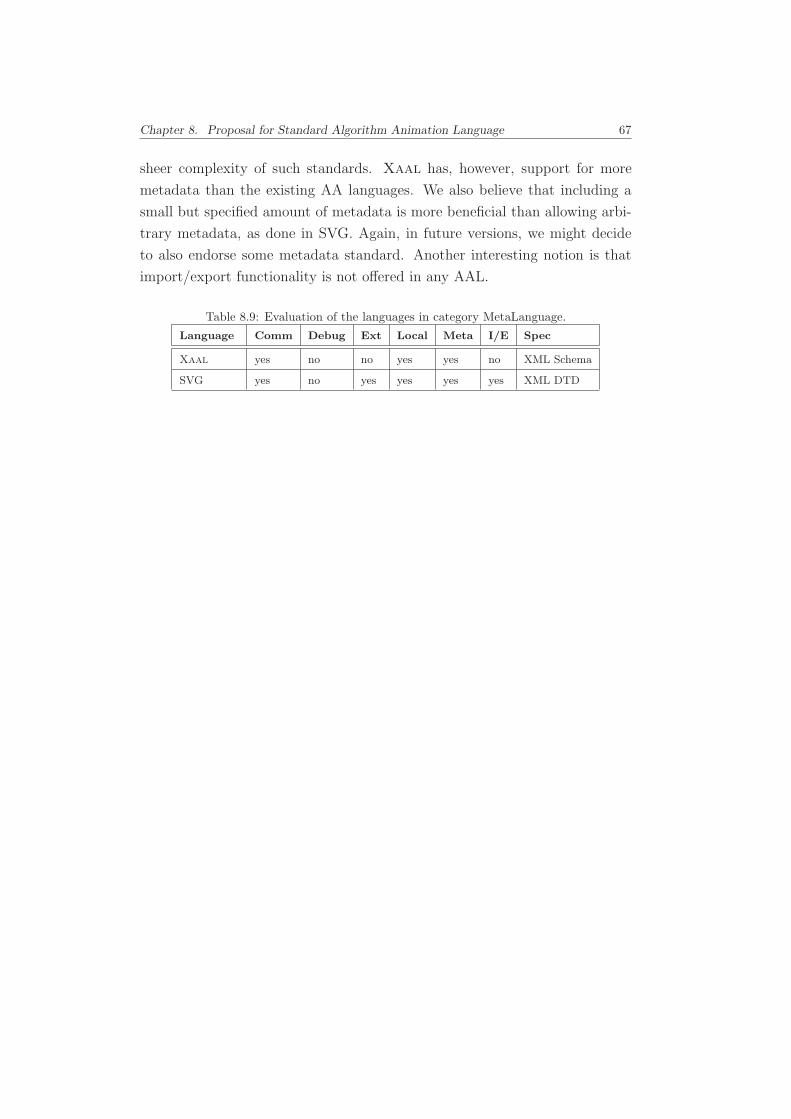
Chapter 8. Proposal for Standard Algorithm Animation Language 67
sheer complexity of such standards. Xaal has, however, support for more
metadata than the existing AA languages. We also believe that including a
small but specified amount of metadata is more beneficial than allowing arbi-
trary metadata, as done in SVG. Again, in future versions, we might decide
to also endorse some metadata standard. Another interesting notion is that
import/export functionality is not o!ered in any AAL.
Table 8.9: Evaluation of the languages in category MetaLanguage.
Language Comm Debug Ext Local Meta I/E Spec
Xaal yes no no yes yes no XML Schema
SVG yes no yes yes yes yes XML DTD

68 Chapter 8. Proposal for Standard Algorithm Animation Language
Part IV
Applications of Xaal in
Education
69

Chapter 9
Xaal in Algorithm Animation
Systems
To gain some support from the algorithm animation community, we have de-
signed a set of tools aiding in the usage of Xaal in existing and future algo-
rithm animation systems. In this chapter, we will introduce di!erent processes
to add Xaal support as well as discuss our proof of concept implementations
of these.
9.1 Implementation Approaches
We have a prototype implementation of the language and transformations
to/from various existing algorithm animation languages. In the following, we
will briefly describe these prototypes and discuss the advantages and disad-
vantages of the di!erent solutions, as well as state the level of Xaal features
supported.
The center of the Xaal implementation is Xaal Objects (XO) (see Fig-
ure 9.1). This is a collection of Java classes that correspond to the di!erent
elements and attributes in Xaal documents. The Xaal objects hierarchy can
be generated in multiple ways, the most natural of which is the Xaal parser.
The Xaal objects and Xaal parser prototype implementations support most
of the elements and functionality specified in the language. The tools also
include a graphics decorator able to add graphical information to the data
71
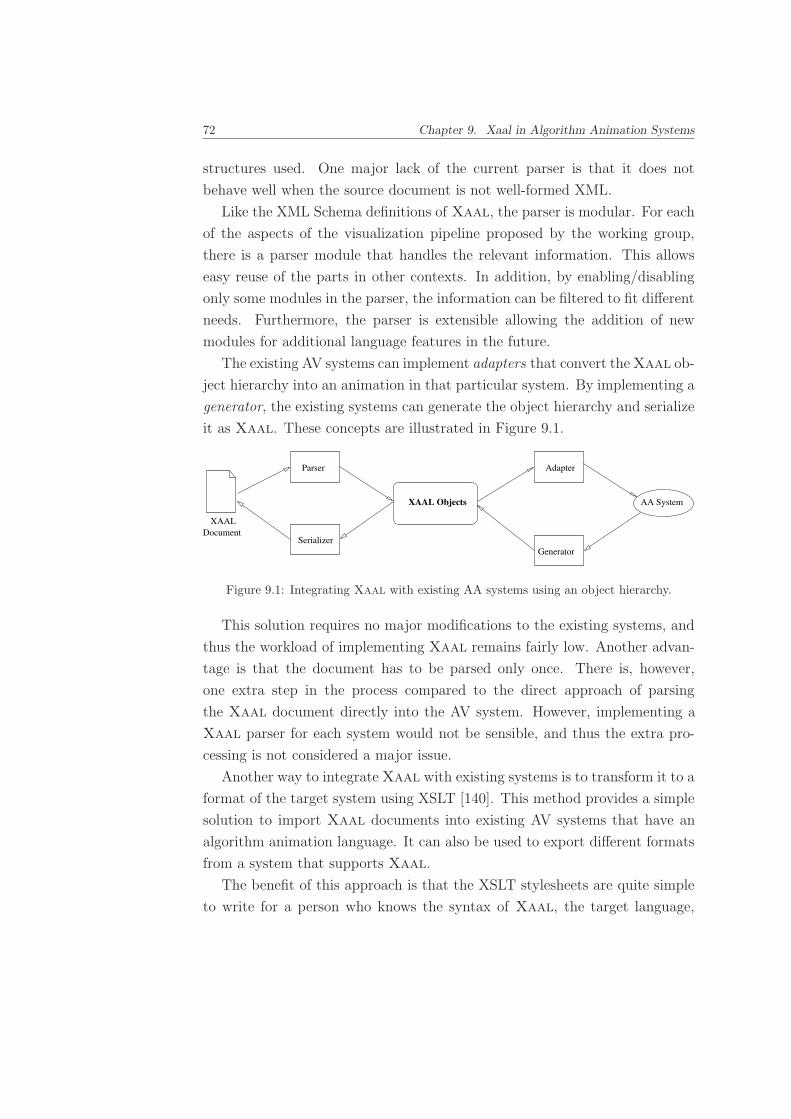
72 Chapter 9. Xaal in Algorithm Animation Systems
structures used. One major lack of the current parser is that it does not
behave well when the source document is not well-formed XML.
Like the XML Schema definitions of Xaal, the parser is modular. For each
of the aspects of the visualization pipeline proposed by the working group,
there is a parser module that handles the relevant information. This allows
easy reuse of the parts in other contexts. In addition, by enabling/disabling
only some modules in the parser, the information can be filtered to fit di!erent
needs. Furthermore, the parser is extensible allowing the addition of new
modules for additional language features in the future.
The existing AV systems can implement adapters that convert the Xaal ob-
ject hierarchy into an animation in that particular system. By implementing a
generator, the existing systems can generate the object hierarchy and serialize
it as Xaal. These concepts are illustrated in Figure 9.1.
Parser
Serializer
Adapter
XAAL Objects
Document
XAAL
Generator
AA System
Figure 9.1: Integrating Xaal with existing AA systems using an object hierarchy.
This solution requires no major modifications to the existing systems, and
thus the workload of implementing Xaal remains fairly low. Another advan-
tage is that the document has to be parsed only once. There is, however,
one extra step in the process compared to the direct approach of parsing
the Xaal document directly into the AV system. However, implementing a
Xaal parser for each system would not be sensible, and thus the extra pro-
cessing is not considered a major issue.
Another way to integrate Xaal with existing systems is to transform it to a
format of the target system using XSLT [140]. This method provides a simple
solution to import Xaal documents into existing AV systems that have an
algorithm animation language. It can also be used to export di!erent formats
from a system that supports Xaal.
The benefit of this approach is that the XSLT stylesheets are quite simple
to write for a person who knows the syntax of Xaal, the target language,
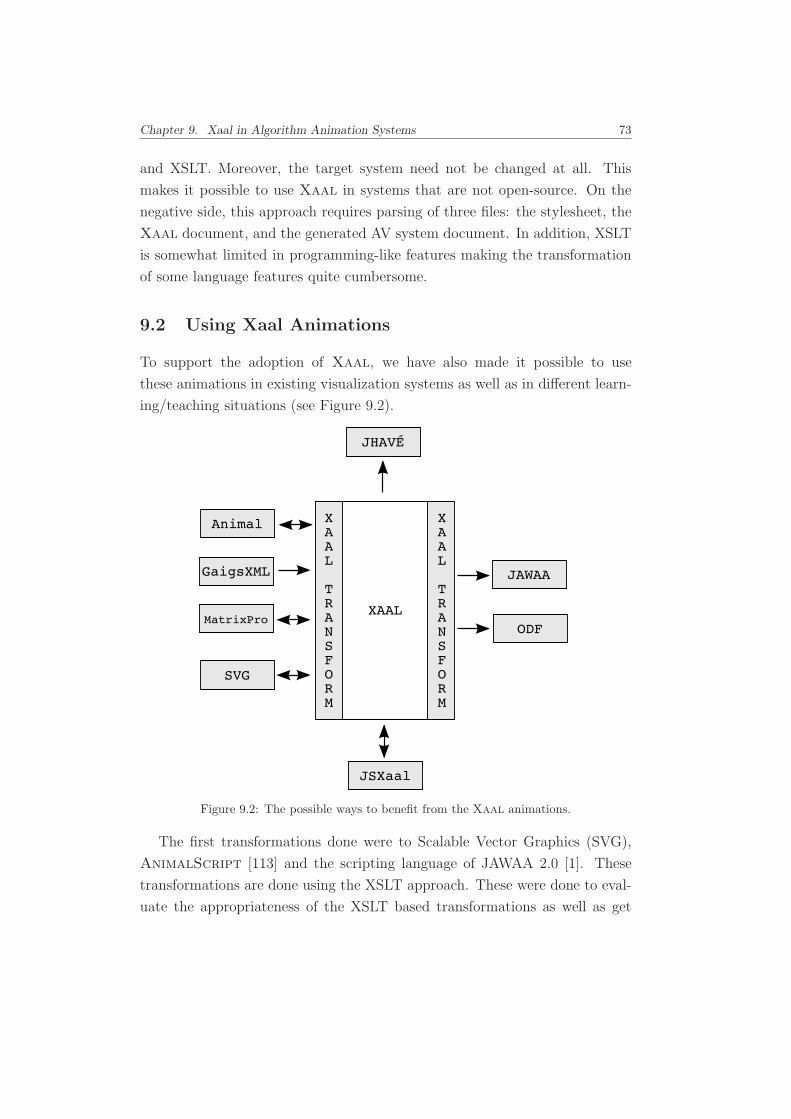
Chapter 9. Xaal in Algorithm Animation Systems 73
and XSLT. Moreover, the target system need not be changed at all. This
makes it possible to use Xaal in systems that are not open-source. On the
negative side, this approach requires parsing of three files: the stylesheet, the
Xaal document, and the generated AV system document. In addition, XSLT
is somewhat limited in programming-like features making the transformation
of some language features quite cumbersome.
9.2 Using Xaal Animations
To support the adoption of Xaal, we have also made it possible to use
these animations in existing visualization systems as well as in di!erent learn-
ing/teaching situations (see Figure 9.2).
Figure 9.2: The possible ways to benefit from the Xaal animations.
The first transformations done were to Scalable Vector Graphics (SVG),
AnimalScript [113] and the scripting language of JAWAA 2.0 [1]. These
transformations are done using the XSLT approach. These were done to eval-
uate the appropriateness of the XSLT based transformations as well as get
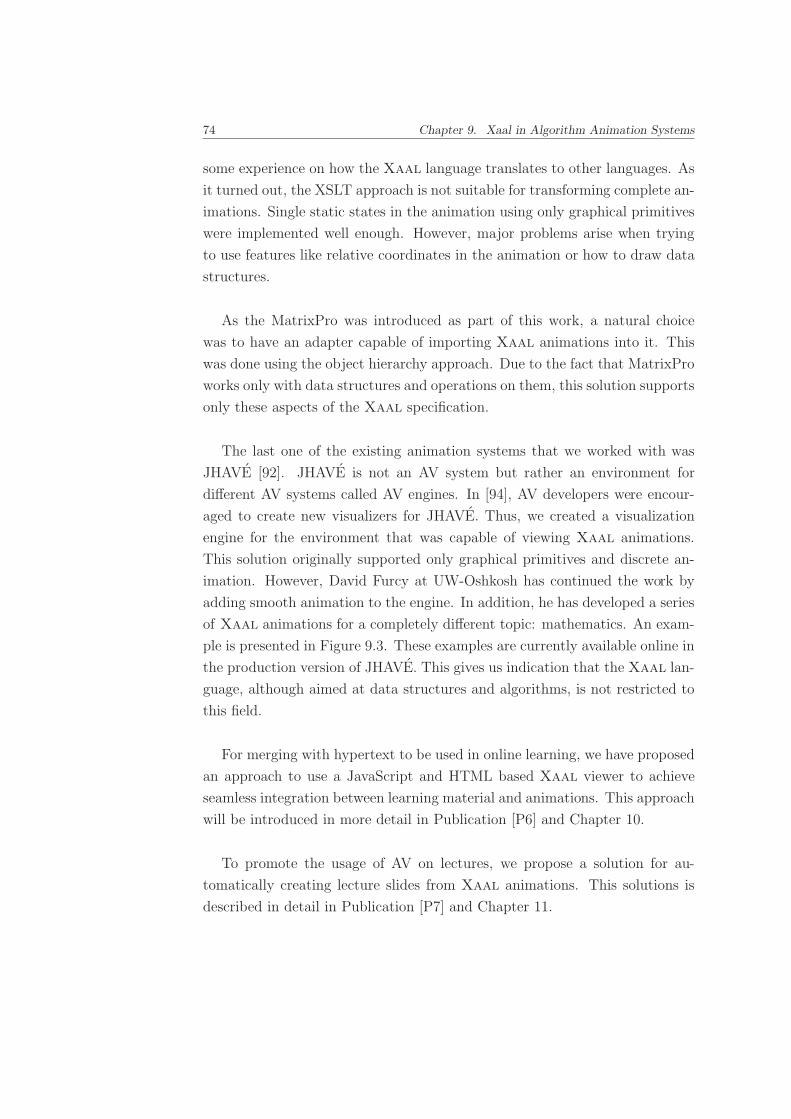
74 Chapter 9. Xaal in Algorithm Animation Systems
some experience on how the Xaal language translates to other languages. As
it turned out, the XSLT approach is not suitable for transforming complete an-
imations. Single static states in the animation using only graphical primitives
were implemented well enough. However, major problems arise when trying
to use features like relative coordinates in the animation or how to draw data
structures.
As the MatrixPro was introduced as part of this work, a natural choice
was to have an adapter capable of importing Xaal animations into it. This
was done using the object hierarchy approach. Due to the fact that MatrixPro
works only with data structures and operations on them, this solution supports
only these aspects of the Xaal specification.
The last one of the existing animation systems that we worked with was
JHAVE [92]. JHAVE is not an AV system but rather an environment for
di!erent AV systems called AV engines. In [94], AV developers were encour-
aged to create new visualizers for JHAVE. Thus, we created a visualization
engine for the environment that was capable of viewing Xaal animations.
This solution originally supported only graphical primitives and discrete an-
imation. However, David Furcy at UW-Oshkosh has continued the work by
adding smooth animation to the engine. In addition, he has developed a series
of Xaal animations for a completely di!erent topic: mathematics. An exam-
ple is presented in Figure 9.3. These examples are currently available online in
the production version of JHAVE. This gives us indication that the Xaal lan-
guage, although aimed at data structures and algorithms, is not restricted to
this field.
For merging with hypertext to be used in online learning, we have proposed
an approach to use a JavaScript and HTML based Xaal viewer to achieve
seamless integration between learning material and animations. This approach
will be introduced in more detail in Publication [P6] and Chapter 10.
To promote the usage of AV on lectures, we propose a solution for au-
tomatically creating lecture slides from Xaal animations. This solutions is
described in detail in Publication [P7] and Chapter 11.
Chapter 9. Xaal in Algorithm Animation Systems 75
Figure 9.3: Example of an algorithm animation of graphing a parabola in JHAVE using theXaal visualizer.
9.3 Producing Xaal Animations
As important as being able to use Xaal animations, is the ability to create
them. Where does one get Xaal animations, then? The first possibility is
to write the XML by hand. Although this is possible, it obviously is not the
most e!ortless choice of creating animations. Especially since there are several
other choices available.
The tools supporting Xaal allows the generation of Xaal objects through
a Java API. This can then be serialized into XML. Of course the Xaal source
can be directly written by a program, as done in the animations on mathe-
matics in JHAVE.
An e!ortless way to create Xaal animations is to use an extended version
of MatrixPro and create animations simply by dragging and dropping keys and
nodes into various data structures and export the animation as Xaal. This
approach, however, is limited to the selection of data structures and algorithms
shipped with the MatrixPro system.
76 Chapter 9. Xaal in Algorithm Animation Systems
Another source of animations is to use the existing GaigsXML animations
used in JHAVE. In addition, new animations can be created with the Java
API provided in JHAVE [91]. These GaigsXML animations can be trans-
formed into Xaal using an XSLT stylesheet. This stylesheet is probably the
most comprehensive in that it supports nearly all features of the GaigsXML
language.
The final choice is to use the proof of concept implementation of Xaal gen-
erator in Animal [114] as described in Publication [P7]. This way the multi-
tude of existing Animal generators can be used, and new generators created.
This and the GaigsXML transformation provide ways to reuse existing anima-
tions; a possibility we see extremely important.
9.4 Implementation-based Evaluation
Although the language does not include some of the most complex features that
came up (for example, programming concepts), Xaal is still quite a complex
language. The current prototype implementation is a good indicator of this,
since the original aim of this thesis was to provide a full implementation.
However, that was not achieved due to the limited time to finish the thesis.
Nevertheless, we can consider the feasibility of Xaal as an intermediate
language. The main problem in the implementation are the di!erent levels
of abstraction. Transformations of animations from one abstraction level to
another are bound to lose some information. In addition, unless the source
format includes all the necessary information, it is di"cult to transform ani-
mations between di!erent levels of abstraction. Another problem is caused by
languages such as GaigsXML, where the structure of the language is based on
snapshots of the animation. Since Xaal presents the animation as modifica-
tions to the elements, conversion of animation between these languages would
probably require some complex XSLT templates. However, we believe that
this could definitely be implemented.
Another way to evaluate implementation is to consider the number of lines
of code. This method has been used to evaluate the Pavane visualization
system [26]. In the Pavane evaluation, the system was considered the better
the fewer the required lines of code were. In our case, we can consider how
many lines of code it takes to create the adapters or generators. The status
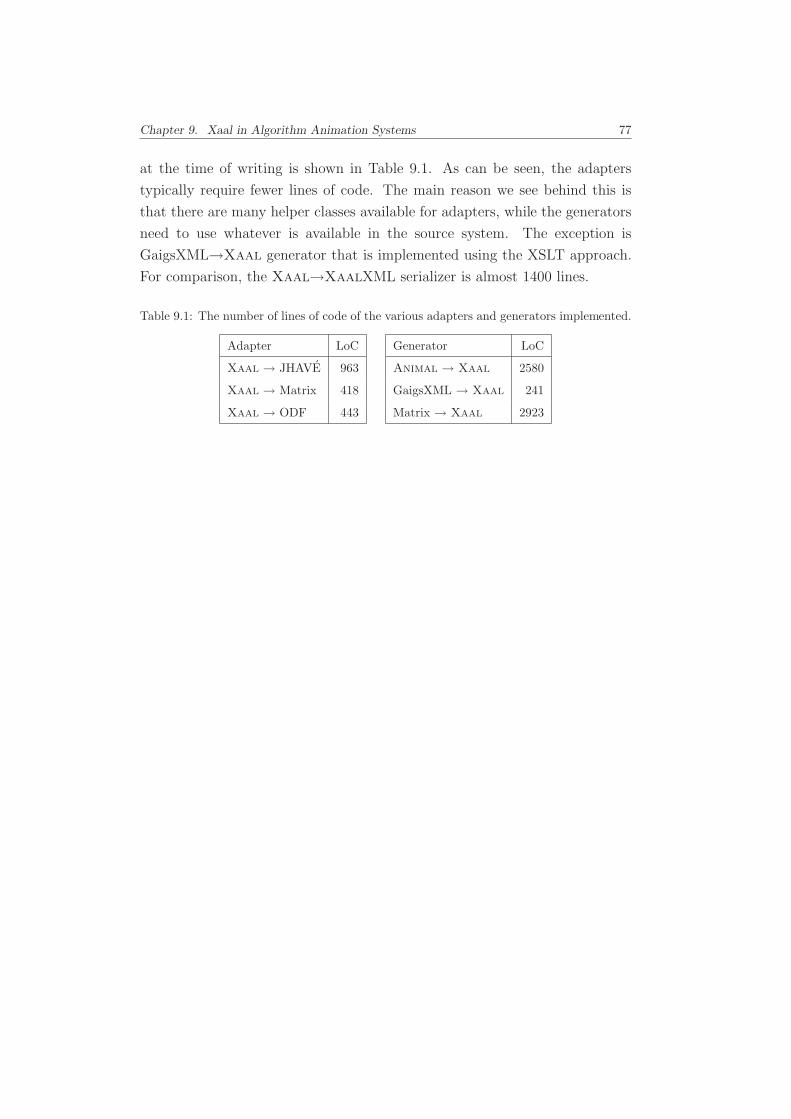
Chapter 9. Xaal in Algorithm Animation Systems 77
at the time of writing is shown in Table 9.1. As can be seen, the adapters
typically require fewer lines of code. The main reason we see behind this is
that there are many helper classes available for adapters, while the generators
need to use whatever is available in the source system. The exception is
GaigsXML!Xaal generator that is implemented using the XSLT approach.
For comparison, the Xaal!XaalXML serializer is almost 1400 lines.
Table 9.1: The number of lines of code of the various adapters and generators implemented.
Adapter LoC Generator LoC
Xaal ! JHAVE 963 Animal ! Xaal 2580
Xaal ! Matrix 418 GaigsXML ! Xaal 241
Xaal ! ODF 443 Matrix ! Xaal 2923

78 Chapter 9. Xaal in Algorithm Animation Systems
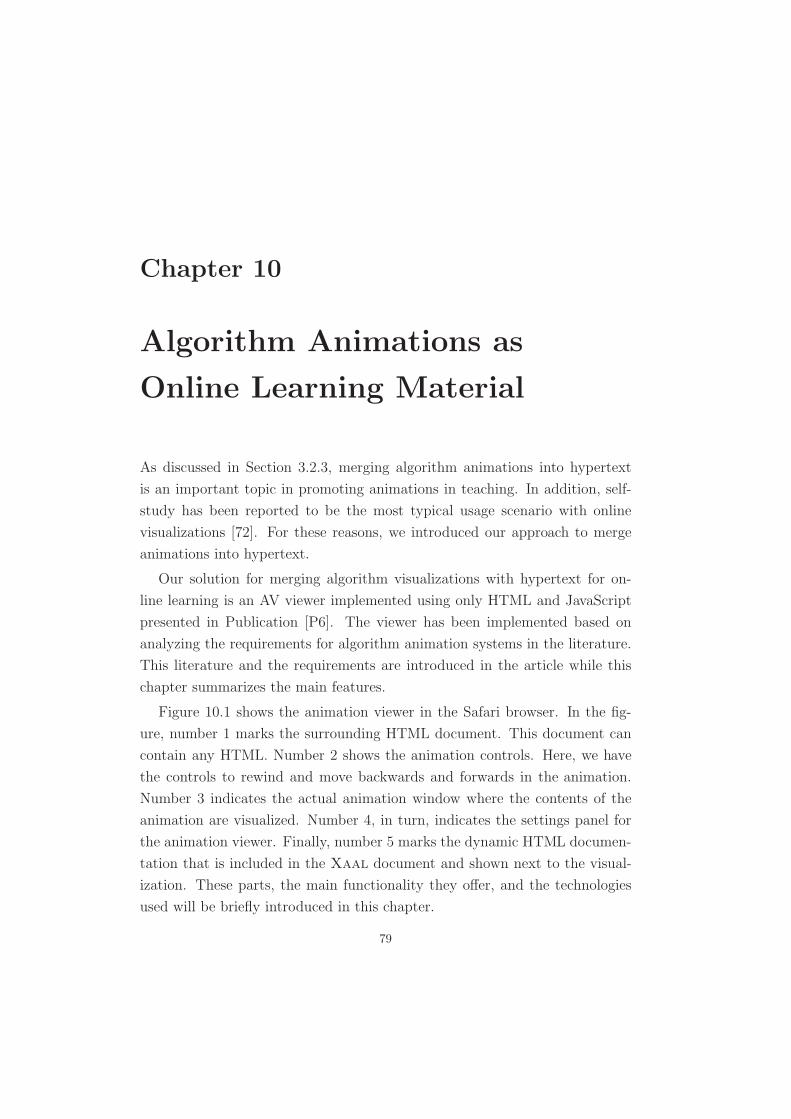
Chapter 10
Algorithm Animations as
Online Learning Material
As discussed in Section 3.2.3, merging algorithm animations into hypertext
is an important topic in promoting animations in teaching. In addition, self-
study has been reported to be the most typical usage scenario with online
visualizations [72]. For these reasons, we introduced our approach to merge
animations into hypertext.
Our solution for merging algorithm visualizations with hypertext for on-
line learning is an AV viewer implemented using only HTML and JavaScript
presented in Publication [P6]. The viewer has been implemented based on
analyzing the requirements for algorithm animation systems in the literature.
This literature and the requirements are introduced in the article while this
chapter summarizes the main features.
Figure 10.1 shows the animation viewer in the Safari browser. In the fig-
ure, number 1 marks the surrounding HTML document. This document can
contain any HTML. Number 2 shows the animation controls. Here, we have
the controls to rewind and move backwards and forwards in the animation.
Number 3 indicates the actual animation window where the contents of the
animation are visualized. Number 4, in turn, indicates the settings panel for
the animation viewer. Finally, number 5 marks the dynamic HTML documen-
tation that is included in the Xaal document and shown next to the visual-
ization. These parts, the main functionality they o!er, and the technologies
used will be briefly introduced in this chapter.
79
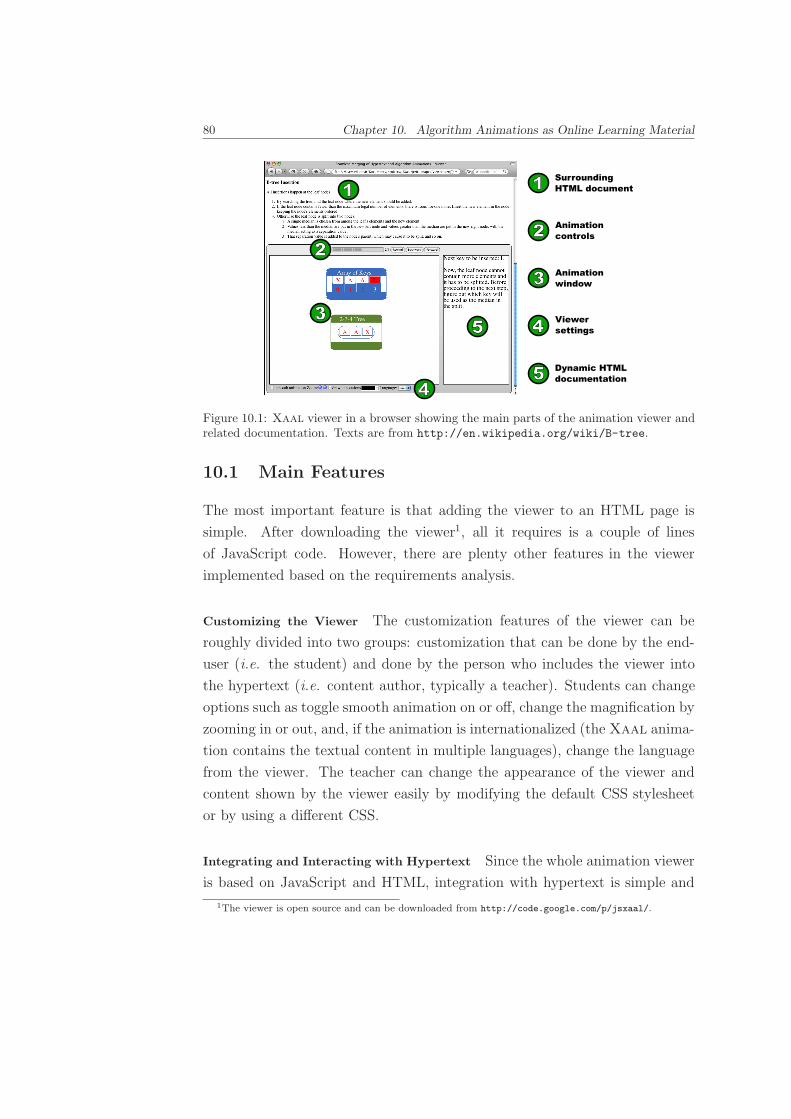
80 Chapter 10. Algorithm Animations as Online Learning Material
Figure 10.1: Xaal viewer in a browser showing the main parts of the animation viewer andrelated documentation. Texts are from http://en.wikipedia.org/wiki/B-tree.
10.1 Main Features
The most important feature is that adding the viewer to an HTML page is
simple. After downloading the viewer1, all it requires is a couple of lines
of JavaScript code. However, there are plenty other features in the viewer
implemented based on the requirements analysis.
Customizing the Viewer The customization features of the viewer can be
roughly divided into two groups: customization that can be done by the end-
user (i.e. the student) and done by the person who includes the viewer into
the hypertext (i.e. content author, typically a teacher). Students can change
options such as toggle smooth animation on or o!, change the magnification by
zooming in or out, and, if the animation is internationalized (the Xaal anima-
tion contains the textual content in multiple languages), change the language
from the viewer. The teacher can change the appearance of the viewer and
content shown by the viewer easily by modifying the default CSS stylesheet
or by using a di!erent CSS.
Integrating and Interacting with Hypertext Since the whole animation viewer
is based on JavaScript and HTML, integration with hypertext is simple and
1The viewer is open source and can be downloaded from http://code.google.com/p/jsxaal/.
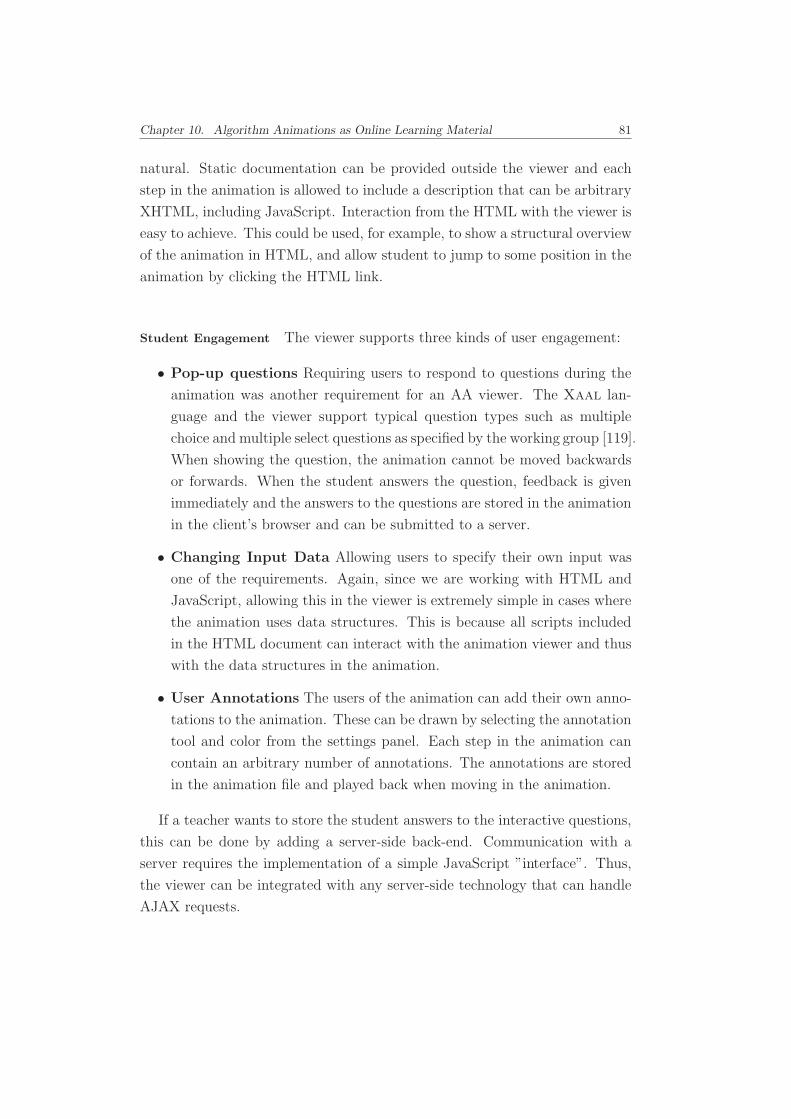
Chapter 10. Algorithm Animations as Online Learning Material 81
natural. Static documentation can be provided outside the viewer and each
step in the animation is allowed to include a description that can be arbitrary
XHTML, including JavaScript. Interaction from the HTML with the viewer is
easy to achieve. This could be used, for example, to show a structural overview
of the animation in HTML, and allow student to jump to some position in the
animation by clicking the HTML link.
Student Engagement The viewer supports three kinds of user engagement:
• Pop-up questions Requiring users to respond to questions during the
animation was another requirement for an AA viewer. The Xaal lan-
guage and the viewer support typical question types such as multiple
choice and multiple select questions as specified by the working group [119].
When showing the question, the animation cannot be moved backwards
or forwards. When the student answers the question, feedback is given
immediately and the answers to the questions are stored in the animation
in the client’s browser and can be submitted to a server.
• Changing Input Data Allowing users to specify their own input was
one of the requirements. Again, since we are working with HTML and
JavaScript, allowing this in the viewer is extremely simple in cases where
the animation uses data structures. This is because all scripts included
in the HTML document can interact with the animation viewer and thus
with the data structures in the animation.
• User Annotations The users of the animation can add their own anno-
tations to the animation. These can be drawn by selecting the annotation
tool and color from the settings panel. Each step in the animation can
contain an arbitrary number of annotations. The annotations are stored
in the animation file and played back when moving in the animation.
If a teacher wants to store the student answers to the interactive questions,
this can be done by adding a server-side back-end. Communication with a
server requires the implementation of a simple JavaScript ”interface”. Thus,
the viewer can be integrated with any server-side technology that can handle
AJAX requests.
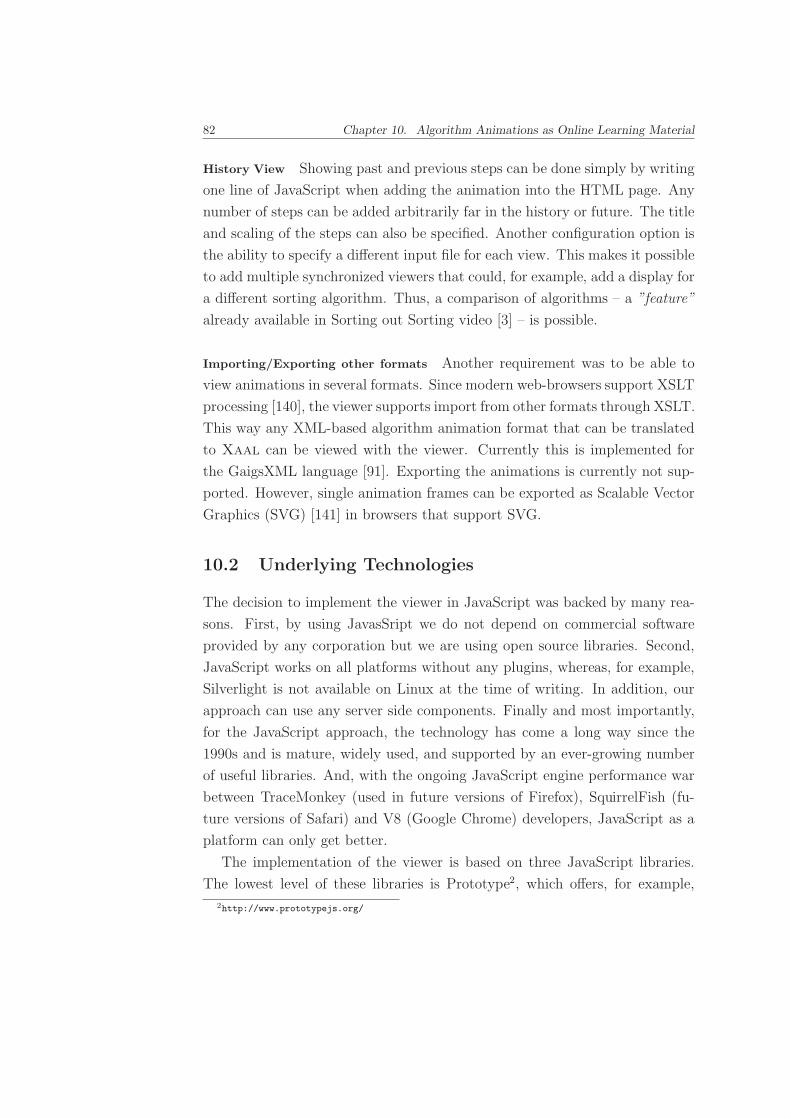
82 Chapter 10. Algorithm Animations as Online Learning Material
History View Showing past and previous steps can be done simply by writing
one line of JavaScript when adding the animation into the HTML page. Any
number of steps can be added arbitrarily far in the history or future. The title
and scaling of the steps can also be specified. Another configuration option is
the ability to specify a di!erent input file for each view. This makes it possible
to add multiple synchronized viewers that could, for example, add a display for
a di!erent sorting algorithm. Thus, a comparison of algorithms – a ”feature”
already available in Sorting out Sorting video [3] – is possible.
Importing/Exporting other formats Another requirement was to be able to
view animations in several formats. Since modern web-browsers support XSLT
processing [140], the viewer supports import from other formats through XSLT.
This way any XML-based algorithm animation format that can be translated
to Xaal can be viewed with the viewer. Currently this is implemented for
the GaigsXML language [91]. Exporting the animations is currently not sup-
ported. However, single animation frames can be exported as Scalable Vector
Graphics (SVG) [141] in browsers that support SVG.
10.2 Underlying Technologies
The decision to implement the viewer in JavaScript was backed by many rea-
sons. First, by using JavasSript we do not depend on commercial software
provided by any corporation but we are using open source libraries. Second,
JavaScript works on all platforms without any plugins, whereas, for example,
Silverlight is not available on Linux at the time of writing. In addition, our
approach can use any server side components. Finally and most importantly,
for the JavaScript approach, the technology has come a long way since the
1990s and is mature, widely used, and supported by an ever-growing number
of useful libraries. And, with the ongoing JavaScript engine performance war
between TraceMonkey (used in future versions of Firefox), SquirrelFish (fu-
ture versions of Safari) and V8 (Google Chrome) developers, JavaScript as a
platform can only get better.
The implementation of the viewer is based on three JavaScript libraries.
The lowest level of these libraries is Prototype2, which o!ers, for example,2http://www.prototypejs.org/
Chapter 10. Algorithm Animations as Online Learning Material 83
AJAX support as well as advanced features for dynamically manipulating
the client-side HTML. The visualizations are drawn using Prototype Graphic
Framework (PGF)3, a Prototype based framework that allows drawing arbi-
trary data on various browsers. PGF supports multiple rendering technologies
for di!erent browsers: Scalable Vector Graphics (SVG), HTML Canvas ele-
ment, and Vector Markup Language (VML). These di!erent renderers can be
used through a single programming interface. The animation features in our
viewer use Scriptaculous4, an animation framework based on Prototype. The
animation is achieved by extending Scriptaculous’s e!ects to modify graphical
objects drawn using PGF.
When discussing web applications, the size of the files required is essential.
The total size of the viewer and the required libraries is slightly over 400
kilobytes. This size can be reduced by minimizing the files. Then, the viewer
will end up in loading approximately 200 kilobytes. Naturally, all of this can
be cached by the browser and loaded only once.
3http://prototype-graphic.xilinus.com/4http://script.aculo.us/

84 Chapter 10. Algorithm Animations as Online Learning Material
Chapter 11
Algorithm Animations as
Lecture Material
It comes as no surprise that generic presentation tools such as Microsoft Pow-
erpoint and Open O"ce Impress are often used by teachers to prepare lecture
slides. Typically, algorithm animations are added to lecture slides. These
presentation tools are easy to use and familiar to many teachers. However,
”the lack of support for specific data structures such as lists makes animation
generation both awkward and time-consuming” [114]. Furthermore, surveys
show that demonstrations during classroom lectures are the most frequent use
of visualizations by teachers [95] as well as considered the most beneficial by
students [72].
These were our main motivations when deciding to find a solution to au-
tomating the generation of AAs as lecture material. Publication [P7] intro-
duces our solution in detail, and in this chapter we will summarize the results.
11.1 First Prototype
Our first attempt at a prototype was introduced in [124]. The solution was
based on a Java program generating graph descriptions in dot format. The
graph descriptions were transformed to Scalable Vector Graphics (SVG) using
GraphViz [36]. The SVG files were then converted to Open Document Format
(ODF) format using XSLT stylesheets. More specifically, the Java program
generated example cases of the Kruskal’s algorithm.
85
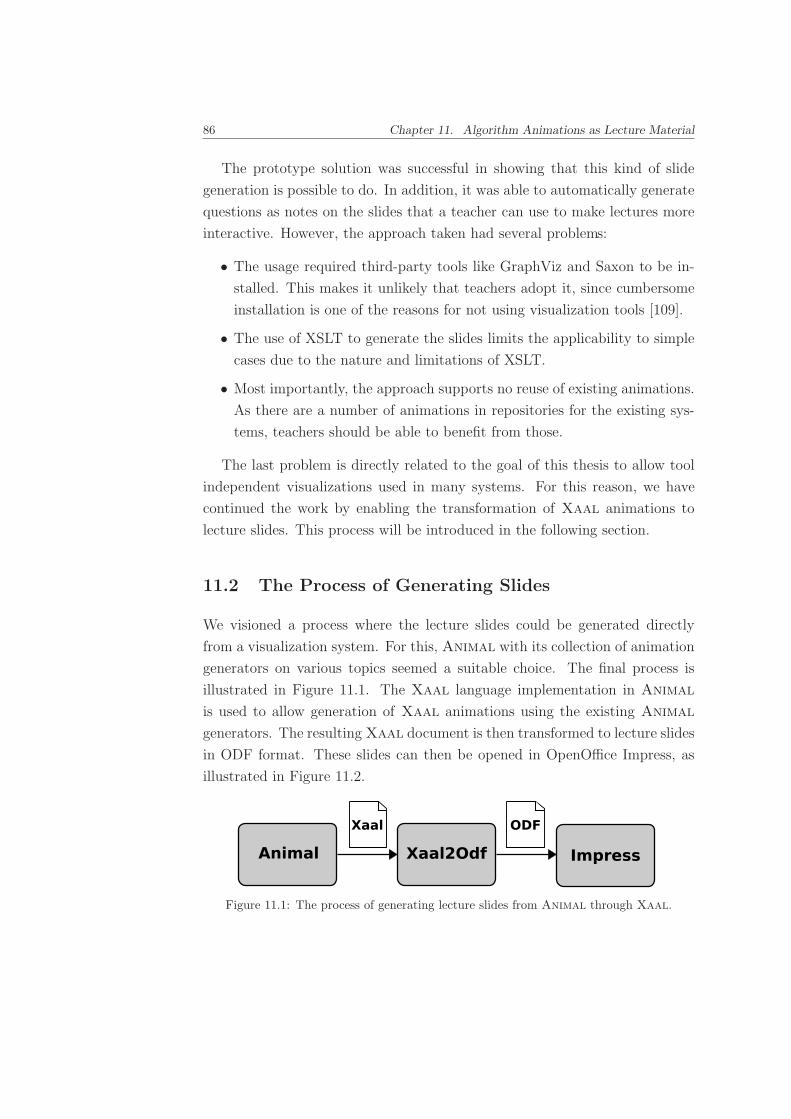
86 Chapter 11. Algorithm Animations as Lecture Material
The prototype solution was successful in showing that this kind of slide
generation is possible to do. In addition, it was able to automatically generate
questions as notes on the slides that a teacher can use to make lectures more
interactive. However, the approach taken had several problems:
• The usage required third-party tools like GraphViz and Saxon to be in-
stalled. This makes it unlikely that teachers adopt it, since cumbersome
installation is one of the reasons for not using visualization tools [109].
• The use of XSLT to generate the slides limits the applicability to simple
cases due to the nature and limitations of XSLT.
• Most importantly, the approach supports no reuse of existing animations.
As there are a number of animations in repositories for the existing sys-
tems, teachers should be able to benefit from those.
The last problem is directly related to the goal of this thesis to allow tool
independent visualizations used in many systems. For this reason, we have
continued the work by enabling the transformation of Xaal animations to
lecture slides. This process will be introduced in the following section.
11.2 The Process of Generating Slides
We visioned a process where the lecture slides could be generated directly
from a visualization system. For this, Animal with its collection of animation
generators on various topics seemed a suitable choice. The final process is
illustrated in Figure 11.1. The Xaal language implementation in Animal
is used to allow generation of Xaal animations using the existing Animal
generators. The resulting Xaal document is then transformed to lecture slides
in ODF format. These slides can then be opened in OpenO"ce Impress, as
illustrated in Figure 11.2.
Figure 11.1: The process of generating lecture slides from Animal through Xaal.
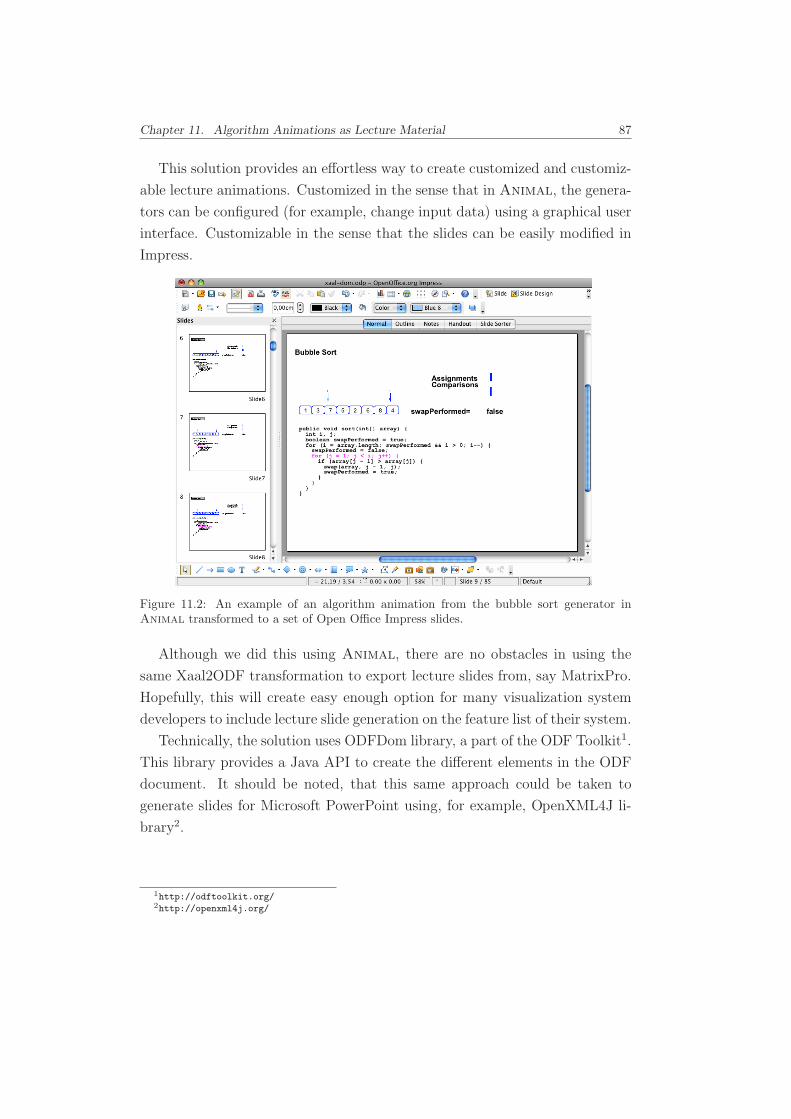
Chapter 11. Algorithm Animations as Lecture Material 87
This solution provides an e!ortless way to create customized and customiz-
able lecture animations. Customized in the sense that in Animal, the genera-
tors can be configured (for example, change input data) using a graphical user
interface. Customizable in the sense that the slides can be easily modified in
Impress.
Figure 11.2: An example of an algorithm animation from the bubble sort generator inAnimal transformed to a set of Open O"ce Impress slides.
Although we did this using Animal, there are no obstacles in using the
same Xaal2ODF transformation to export lecture slides from, say MatrixPro.
Hopefully, this will create easy enough option for many visualization system
developers to include lecture slide generation on the feature list of their system.
Technically, the solution uses ODFDom library, a part of the ODF Toolkit1.
This library provides a Java API to create the di!erent elements in the ODF
document. It should be noted, that this same approach could be taken to
generate slides for Microsoft PowerPoint using, for example, OpenXML4J li-
brary2.
1http://odftoolkit.org/2http://openxml4j.org/

88 Chapter 11. Algorithm Animations as Lecture Material
Part V
Discussion and Conclusions
89

Chapter 12
Discussion
In this chapter, we will summarize our work and address the research ques-
tion “How can we develop algorithm animations and AA systems further to
better facilitate the creation and adoption of AA in education?”. We start by
revisiting the four sub-questions set in the introduction and discuss how they
contribute to solving the research problem. We end this chapter with a critical
overview of this work.
12.1 Research Questions Revisited
12.1.1 E!ortless creation of AV
To make the algorithm animation production more e!ortless, we started re-
searching what is e!ortless production. In the first step we identified that there
are either specific, low e!ort systems or general, high e!ort systems [59]. This
research was, however, only our subjective view of the subject. The next step
was a survey targeting computer science educators [60]. The survey resulted
in an initial set of measures for e!ortlessness. Finally, in Publication [P1] we
introduced a taxonomy of e!ortless creation of algorithm animations and we
now have knowledge of what makes an AV system e!ortless.
In the first step of the research on e!ortlessness, we found that Matrix [66]
allowed e!ortless creation of animations. However, it was a research proto-
type demonstrating the features of the framework and not suitable for end-
users. Thus, we developed a Matrix-based application, MatrixPro (see Pub-
lication [P2]). MatrixPro was designed to support on-the-fly demonstrations
91
92 Chapter 12. Discussion
without the need to prepare all the examples before lectures. The most im-
portant feature supporting this was the automatic animation of several ready
made data structures, thus the system is e!ortless to use for the narrow scope
it was designed, namely in math examples.
12.1.2 System independent description of AVI
To answer the question of how to develop a system independent description of
algorithm visualization information (AVI), we first developed a taxonomy of
algorithm animation languages presented in Publication [P3]. The taxonomy
is based on the features of the existing algorithm animation languages.
Combining the work of a report of an international working group presented
in Publication [P4] and the taxonomy, we designed a new animation language
called Xaal (eXtensible Algorithm Animation Language). The use of these
two elements as source ensured that the language is not designed from the
view point of one system. Thus, what distinguishes Xaal from many of the
existing AA languages is that it supports both of the two main approaches in
the existing AA languages: graphical primitives and data structures. Thus, it
is the first and only animation language at the moment that can be considered
as a complete visualization specification.
Furthermore, the language has a modular design and consists of several
XML Schemas. This makes it possible to use only parts of the language and
to extend it. Finally, the language has already been used in mathematics
outside of its intended scope of data structures and algorithm. We see this as
an important indication of its suitability to algorithm animation.
12.1.3 Processes to use the AVI in AA systems
To support the usage of Xaal in existing algorithm animation systems, we
have implemented a modular and extensible parser. In addition, we have im-
plemented various adapters and generators between Xaal and other algorithm
animation languages. The current selection of formats was presented in Fig-
ure 9.2 on page 73. As can be seen, AV systems that can be used to create
Xaal animations are MatrixPro, Animal, and JHAVE. In addition, we have
a limited transformation from SVG to Xaal. Xaal documents can then be
transformed to Open Document Format, AnimalScript, JAWAA, and SVG,
Chapter 12. Discussion 93
viewed with a JHAVE visualization plugin, or opened in MatrixPro. Thus, we
already have several di!erent formats available for the same animation.
When considering the current implementation from the e!ortlessness point
of view, we can say that we have made it possible to transform animations from
an e!ortless system (MatrixPro) to a more general purpose tool (Animal).
This allows us, for example, to easily create an example of a complex topic,
say B-Tree in MatrixPro, transform it to AnimalScript and customize the
animation with Animal. In addition, as the JHAVE system is intended as a
visualization platform, Xaal implementation for that platform is a good step
towards more general tool integration.
In Section 9.2, we introduced two di!erent processing pipelines to imple-
ment Xaal support: 1) parsing the Xaal document into a set of (Java)
objects and transforming that, and 2) transforming the Xaal document us-
ing XSLT. A future challenge is to implement Xaal support and thus data
exchange among more systems. Thus, the following considers the suitability of
the two processing pipelines for the di!erent visualization specification styles
introduced in Section 3.2.4.
Topic-Specific Animation As topic-specific animations are not animation
systems, it probably is not worth the e!ort to implement any data ex-
change with such animations.
Direct Manipulation Direct manipulation as a visual specification style can
be implemented in a multitude of ways. Thus, it is not feasible to spec-
ulate how the data exchange with such a system could be implemented
as it depends completely on the system architecture. For example, the
Xaal import/export in MatrixPro is implemented by transforming an an-
imation between the internal object hierarchy of Matrix and the Xaal ob-
ject hierarchy.
API-based Generation In API-based generation there is some program-
ming API that can be used to generate the animations. Thus, the natural
method for implementing data exchange in such cases is to transform the
Java object hierarchy to suitable method calls of the API.
Scripting-based Generation In scripting-based generation, the animation
system has some scripting language (or, algorithm animation language)
that it understands. Thus, using XSLT to transform Xaal documents
94 Chapter 12. Discussion
into this scripting language is the most sensible option. However, trans-
forming the object hierarchy might be a useful solution as well, especially
if there are significant di!erences between Xaal and the target language.
When transforming an animation from the scripting language to Xaal,
XSLT is a suitable solution if the scripting language is XML. Otherwise,
it requires a parser of the scripting language.
Declarative Visualization In declarative visualization, the visualization is
specified by declaring a mapping between a program state and a graph-
ical representation. Generally, transforming between this mapping and
Xaal is not a suitable approach, since Xaal does not have a program
state attached. Thus, the best approach is again completely dependent
on the system architecture.
Code Interpretation Implementing data exchange with a tool that uses
code interpretation is not meaningful from Xaal to the system. The
other way around it could be beneficial. However, the implementation
depends completely on the architecture of the system.
From the discussion above, we can summarize that it is not obvious in most
of the cases how the data exchange is best implemented. The best approach
is typically dependent on the architecture of the animation system. However,
in the case of API-based generation and Scripting-based generation, natural
choices are transforming the Java object hierarchy and XSLT transformations,
respectively. It should be noted, that often systems have more than one visu-
alization specification style so there will be di!erent possibilities to implement
Xaal support as well.
12.1.4 Processing the AVI for di!erent learning situations.
The last question was how to process the same animation for di!erent learn-
ing situations. With the same source animation, the coherency of learning
materials can be ensured.
Our goal was to support both hypertext materials and lecture slides. The
seamless integration of Xaal animations into hypertext was presented in
Chapter 10. This purely JavaScript and HTML based animation viewer of-
fers better interaction between the hypertext and animation than any of the
Chapter 12. Discussion 95
existing AV systems. In Chapter 11, we introduced a process and tools to
e!ortlessly create lecture slides from Xaal animations.
12.2 Critical Overview
Both of the taxonomies presented in this work can be criticized by claims of
misplaced subcategories that should be under some other category. In addi-
tion, the labels of the categories are easy to pick on. For this, our defense
is that all the categories arose from the data collected. Furthermore, no tax-
onomy can be correct and is always bound to be an objective interpretation
of the topic. There are more than one way to create the characterization,
ours being one way. The important point to consider is whether or not the
taxonomy is suitable for the task, and we feel both of them are.
It would be easy to criticize the taxonomy of e!ortless creation of AV by
stating that the categories do not measure the e!ort required to create an
animation with a system. In a sense this is true and the taxonomy measures
more like applicability. However, choosing the right tool that can be applied to
the task at hand is important from the e!ortlessness point of view. As stated
in Publication [P1], in the future the taxonomy should be extended to contain
more categories. These should include topics like usability.
Similar criticism can be pointed towards the taxonomy of algorithm ani-
mation languages. Some features of the existing languages might require their
own subcategory. However, we have included categories for the main features
leaving out some of the most detailed ones. Furthermore, the taxonomy is
intended to be extended in the future as it will be outdated at some point as
AA languages are further developed.
The usefulness of the Xaal language itself can be questioned as well.
Whether or not it is useful remains to be seen, but the large number of suc-
cessful prototypes supports its applicability. In addition, having Xaal already
incorporated in two other systems besides our MatrixPro is an indication of it
being useful. Finally, we must mention that Xaal is the first implementation
of a vision of a working group of AV system developers.
The number of other options is limited. The obvious one is to continue
as before by having every system have its own AA language and, in some
rare cases, make 1-to-1 mappings between languages. This means reinventing
96 Chapter 12. Discussion
the wheel by always starting from scratch. Other option would have been to
develop further some of the existing languages. However, the working group
consisting of many AV system developers made the decision to work towards
a new language.
A more detailed question about Xaal asked by the careful reader could
be: where are the abstract data structures? At its current state, the language
has only basic data structures and the underlying data structure has to be
specified as a property. This was a design choice at this point to limit the
scope of this work, but in the future we see there being many data structures
added as extensions.
What would we do now di!erently? For the graphical primitives specification
of the working group, the choice of using SVG [141] to specify the graphical
primitives could have been a more beneficial way. The choice of developing
our own specification was taken perhaps too hastily. As Duval and Verbert
state, “the decision to develop a new standard[s] is sometimes taken too quickly
and that, when possible, existing generic standards should be profiled” [34].
Using SVG would have the benefit of having many people already familiar
with the specification. However, the choice of using our own specification can
be defended by the fact that we now have a consistent specification where all
parts use the same conventions. Having, for example, the coordinates specified
di!erently for graphical primitives than data structures would be confusing.
Furthermore, the SVG specification is so extensive that an AA language would
only need a fraction of its capabilities.
Another matter that, in hindsight, might have been solved di!erently is
related to the status of the implemented tools. Currently, most of the tools are
on prototype level. Thus, instead of trying out so many transformations, we
might have benefited from concentrating on few and make them more complete
and well documented. The clear benefit of trying out many di!erent format
transformations is that we now know Xaal is suitable for many di!erent uses.
Where is the evaluation? The introduction of new educational tools typically
requires an evaluation of whether or not they are useful for the learners, that
is, are the learning results better with the tools than without them or with
another tool. In our case, however, we have introduced enabling technology
Chapter 12. Discussion 97
to ”do the old thing” – visualize algorithms – that can be used to more easily
create visualization and merge them with online learning material and lecture
material. Thus, we see that the results of the previous studies (see Chapter 3)
gives guidelines on whether or not this is pedagogically sensible. In addition,
we believe that the educational e!ectiveness of an algorithm visualization de-
pends more on the content of the visualization than on the system used to
view it.
Whether or not our solution better facilitates creation and adoption of AA
in education remains to be seen. There is no way to evaluate the possible
increase in usage of visualizations by teachers due to this work, although it
would have been a suitable evaluation for this research.
The Bigger Problems with Dissemination There are still bigger problems in
the dissemination of algorithm visualization tools. Most of the tools have
been developed in a research project and end up being research prototypes.
Typically, they add some new feature compared to the existing systems, or
simply combine the tried and tested features. And most of the time the work
is started from scratch instead of continuing the work by others. This has
resulted in an increasing number of AV tools, making it di"cult for teachers
to choose the best tool for their need.
The nature of academic funding makes it di"cult to get resources for pol-
ishing a research prototype to become a software product. When the funding
for the project ends or the student working on the project graduates, the de-
velopment of the tool often ends as well. Thus, many of the AV systems are
not developed further after the required articles have been published. Clearly,
there is a risk of that happening with the tools developed in this work as well.
Some of the successful education tools such as JFLAP [106] and BlueJ [5]
come with a supporting book and resources for teachers. This help in inte-
grating tools into teaching might be crucial in the dissemination of the tools.
The lack of pedagogical guidelines in adopting the tools can possibly be ex-
plained that many of the AV tools are developed by software engineers instead
of people with pedagogical background. Thus, a future challenge of this work
is to create documentation on how to create pedagogically e!ective animations
using Xaal and the related tools.

98 Chapter 12. Discussion
Chapter 13
Conclusions
We will conclude this work by summarizing the benefits of this work for three
parties concerned: teachers, AV system developers, and students. Finally, we
will introduce some future ideas and directions.
13.1 Benefits of This Work
In addition to discussing how this work has met the original goals, it is impor-
tant to have some benefits for the possible end-users of the products of this
work. The following subsections will discuss the benefits for three groups of
end-users: teachers, AV system developers, and students.
Benefits for Teachers For teachers, we see clear benefits. With MatrixPro
and Animal generators, teachers can e!ortlessly create algorithm animations
for the topics supported by the tools. The animations can then be included
in slides to be used on lectures, a feature mentioned to be beneficial for both
teachers and students. In addition, teachers can give the animations to stu-
dents to work on outside of class, for example, by integrating them into hyper-
text learning materials with the tool presented in this work. Naturally, lecture
slides and hypertext integration can be achieved from any of the systems that
now (and in the future) support Xaal. Furthermore, the possibility to reuse
visualizations is beneficial for teachers, since the technology presented here
enables choosing from a wider range of ready-made visualizations for various
AV systems.
99
100 Chapter 13. Conclusions
Benefits for AV System Developers At the current state, we see AV system
developers as the group benefiting most of this work. The taxonomy of AA
languages can be used to compare the properties of existing AA languages and
to get ideas for future directions of AA languages.
The Xaal language and the supporting tools provide a way to add import
and export support of di!erent formats into existing systems with manageable
e!ort. These formats naturally include the lecture slide generation which can
be a good way to promote an AV system. Furthermore, the Xaal anima-
tions can be used in hypertext, providing AV systems a way to integrate their
animations in electronic learning material more seamlessly.
In the long run, having a common core that many authors contribute ex-
tensions would be an ideal situation. However, acceptance of Xaal needs
marketing and promotion, as well as a more polished implementation of the
tools. Still, having two AV systems other than the author’s supporting Xaal is
a good start to the right direction.
Benefits for Students Students are the end-users of educational materials such
as algorithm animations. Hopefully, they are the ones who eventually benefit
from this work. The way we see it, better lecture material for teachers will
benefit the students. In addition, engaging online learning material using the
JavaScript viewer can aid students learning the topics. However, the work pre-
sented here is mainly enabling technology, and it is up to teachers/visualizers
to use and create high quality content that benefits the students.
13.2 Future Work
As can be seen in the evaluation of Xaal in the Section 8.2.1, it does not
have all the necessary features at this point. We have numerous improvements
and ideas for the future of the language, and here we will write down some
of the most interesting ones. The most urgent requirement is naturally to
finish the prototype implementation of the parser and the adapters and gen-
erators. This includes creating documentation for the language specification
with rich examples. This would enable others to more easily use/implement
the language.
Chapter 13. Conclusions 101
The language itself could be extended to include programming concepts
and thus allow the definition of algorithms and program visualization. This
could be achieved, for example, by allowing o:XML1 notation to be included
in Xaal documents. Another alternative would be to allow JavaScript to be
included into the document and o!er DOM bindings for the di!erent Xaal ob-
jects. Furthermore, the high-level data structures should be created as exten-
sions to the language. Another direction for the language would be to specify
light-weight variations of the language that could more easily be implemented
by di!erent tools. This approach has been taken, for example, with SVG by
specifying SVG Tiny [143] for cellphones.
On a wider perspective, it would be good to see a community of visualization
tool developers/visualizers working more together. Things that the community
could develop include reusable modules for common features for AV systems
to use. A good example of this is the AVInteraction package [116] that has
been used in other systems as well. Other possible modules are, for example,
graph drawing and animation information storing.
The last interesting future direction would be to get insight whether or
not visualizations are so unused as AV system developers think. The existing
usage surveys are over five years old. The question is, have the extensive
e!orts changed the situation? Collecting such data is always tricky. Some
ways to do that would be to trace the usage of the AV systems by enabling, for
example, automatic updates. Furthermore, a good repository with advanced
search functionality, usage logging, and aggressive marketing would gain some
insights into this. This is something the AlgoViz project2 is already aiming
at.
1o:XML is an XML language for object-oriented programming, see http://www.o-xml.org/.2http://algoviz.org/

102 Chapter 13. Conclusions
Bibliography
[1] Ayonike Akingbade, Thomas Finley, Diana Jackson, Pretesh Patel, and
Susan H. Rodger. JAWAA: easy web-based animation from CS0 to ad-
vanced CS courses. In Proceedings of the 34th SIGCSE technical sympo-
sium on Computer science education, SIGCSE’03, pages 162–166. ACM
Press, 2003.
[2] Ronald M. Baecker. Two systems which produce animated represen-
tations of the execution of computer programs. In Proceedings of
the fifth SIGCSE technical symposium on Computer science education,
SIGCSE’75, pages 158–167. ACM Press, 1975.
[3] Ronald M. Baecker. Sorting out sorting. Narrated colour videotape, 30
minutes, 1981.
[4] Ryan Shaun Baker. PILOT: An interactive tool for learn-
ing and grading, 2000. Senior Thesis. Available online at
http://www.cs.cmu.edu/~rsbaker/pilot.pdf (November 10, 2009).
[5] David J. Barnes and Michael Kolling. Objects First with Java - A Prac-
tical Introduction using BlueJ, Fourth edition. Prentice Hall / Pearson
Education, 2008.
[6] Sarita Bassil and Rudolf K. Keller. Software visualization tools: Sur-
vey and analysis. In Proceedings of the 9th International Workshop on
Program Comprehension, IWPC’01, pages 7–17, Washington, DC, USA,
2001. IEEE Computer Society.
[7] Anna O. Bilska, Kenneth H. Leider, Magdalena Procopiuc, Octavian
Procopiuc, Susan H. Rodger, Jason R. Salemme, and Edwin Tsang. A
103
104 Bibliography
collection of tools for making automata theory and formal languages
come alive. SIGCSE Bulletin, 29(1):15–19, 1997.
[8] Marina Blumenkrants, Hilla Starovisky, and Ariel Shamir. Narrative
algorithm visualization. In Proceedings of the 2006 ACM symposium on
Software visualization, SoftVis’06, pages 17–26, New York, NY, USA,
2006. ACM.
[9] Giancarlo Bongiovanni, Pierluigi Crescenzi, and Gabriella Rago. JAZ:
Java Algorithm visualiZer. a multi-platform collaborative tool for teach-
ing and testing graph algorithms. In Sixth International Conference in
Central Europe on Computer Graphics and Visualization, pages 73–80,
1998.
[10] Vincenzo Bonifaci, Camil Demetrescu, Irene Finocchi, Giuseppe F. Ital-
iano, and Luigi Laura. Portraying algorithms with Leonardo Web. In
Mike Dean, Yuanbo Guo, Woochun Jun, Roland Kaschek, Shonali Krish-
naswamy, Zhengxiang Pan, and Quan Z. Sheng, editors, Web Informa-
tion Systems Engineering, WISE’05 Workshops, volume 3807 of Lecture
Notes in Computer Science, pages 73–83. Springer, 2005.
[11] Marc H. Brown. Perspectives on algorithm animation. In Proceed-
ings of the ACM Conference on Human Factors in Computing Systems,
SIGCHI’88, pages 33–38, Washington DC, USA, May 1988. ACM Press.
[12] Marc H. Brown. Zeus: a system for algorithm animation and multi-view
editing. In Proceedings of IEEE Workshop on Visual Languages, pages
4–9, Kobe, Japan, October 1991.
[13] Marc H. Brown and John Hershberger. Color and sound in algorithm
animation. Computer, 25(12):52–63, 1992.
[14] Marc H. Brown and Marc A. Najork. Algorithm animation using 3D in-
teractive graphics. In Proceedings of the 6th annual ACM symposium on
User interface software and technology, UIST’93, pages 93–100, Atlanta,
Georgia, United States, 1993. ACM Press.
[15] Marc H. Brown and R. Raisamo. JCAT: Collaborative active textbooks
using Java. Computer Networks and ISDN Systems, 29(14):1577–1586,
1997.
Bibliography 105
[16] Marc H. Brown and Robert Sedgewick. A system for algorithm anima-
tion. In Proceedings of the 11th annual conference on Computer graphics
and interactive techniques, SIGGRAPH’84, pages 177–186. ACM Press,
1984.
[17] Marc H. Brown and Robert Sedgewick. Techniques for algorithm anima-
tion. IEEE Software, 2(1):28–39, January 1985.
[18] Michael Bruce-Lockhart, Theodore Norvell, and Pierluigi Crescenzi.
Adding test generation to the Teaching Machine. ACM Transactions
on Computing Education, 9(2):1–14, 2009.
[19] Peter Brusilovsky. Explanatory visualization in an educational pro-
gramming environment: Connecting examples with general knowledge.
Human-Computer Interaction. Lecture Notes in Computer Science.,
876:202–212, 1994.
[20] Peter Brusilovsky. Adaptive hypermedia. User Modeling and User-
Adapted Interaction, 11(1–2):87–110, March 2001.
[21] Peter Brusilovsky, Jonathan Grady, Michael Spring, and Chul-Hwan Lee.
What should be visualized?: faculty perception of priority topics for
program visualization. SIGCSE Bulletin, 38(2):44–48, 2006.
[22] Peter Brusilovsky and Tomasz D. Loboda. WADEIn II: a case for adap-
tive explanatory visualization. In Proceedings of the 11th annual SIGCSE
conference on Innovation and Technology in Computer Science Educa-
tion, ITICSE’06, pages 48–52, New York, NY, USA, 2006. ACM.
[23] Michael D. Byrne, Richard Catrambone, and John T. Stasko. Evaluating
animations as student aids in learning computer algorithms. Computers
& Education, 33(4):253–278, 1999.
[24] Justin Cappos and Patrick Homer. DsCats: Animat-
ing data structures for CS2 and CS3 courses. Techni-
cal paper published online, 2002. Available online at
http://www.cs.arizona.edu/dscats/dscatstechnical.pdf (Novem-
ber 10, 2009).
106 Bibliography
[25] Stuart K. Card, Jock D. Mackinlay, and Ben Shneiderman, editors. Read-
ings in information visualization: using vision to think. Morgan Kauf-
mann Publishers Inc., San Francisco, CA, USA, 1999.
[26] Kenneth C. Cox and Gruia-Catalin Roman. An evaluation of the Pa-
vane visualization system. Technical Report WUCS-94-09, Washington
University in St Louis, 1994.
[27] Pierluigi Crescenzi, Camil Demetrescu, Irene Finocchi, and Rossella
Petreschi. Reversible execution and visualization of programs with
LEONARDO. Journal of Visual Languages and Computing, 11(2):125–
150, April 2000.
[28] Pierluigi Crescenzi, Giorgio Gambosi, and Roberto Grossi. Strutture di
dati e algoritmi. Progettazione, analisi e visualizzazione. Pearson Edu-
cation Italia, 2006.
[29] Pierluigi Crescenzi and Carlo Nocentini. Fully integrating algorithm
visualization into a CS2 course.: a two-year experience. In Proceedings
of the 12th annual SIGCSE conference on Innovation and Technology
in Computer Science Education, ITiCSE’07, pages 296–300, New York,
NY, USA, 2007. ACM Press.
[30] Camil Demetrescu and Irene Finocchi. Smooth animation of algorithms
in a declarative framework. Journal of Visual Languages and Computing,
12(3):253–281, 2001.
[31] Camil Demetrescu, Irene Finocchi, and Giuseppe F. Italiano. Algorithms
and Data Structures (in Italian). McGraw Hill, 2004.
[32] Stephan Diehl. Software visualization: Visualizing the Structure, Be-
haviour, and Evolution of Software. Springer New York, 2007.
[33] Robert A. Duisberg. Animated graphical interfaces using temporal con-
straints. In Proceedings of the SIGCHI conference on Human factors in
computing systems, CHI’86, pages 131–136, New York, NY, USA, 1986.
ACM.
[34] Erik Duval and Katrien Verbert. On the role of technical standards
for learning technologies. Learning Technologies, IEEE Transactions on,
1(4):229–234, Oct.-Dec. 2008.
Bibliography 107
[35] Ecma International. ECMAScript language specification, 3rd ed. Tech-
nical report, Ecma International, December 1999.
[36] John Ellson, Emden Gansner, Lefteris Koutsofios, Stephen C. North,
and Gordon Woodhull. Graphviz – open source graph drawing tools.
Lecture Notes in Computer Science, 2265/2002:594–597, 2002.
[37] David Furcy, Thomas Naps, and Jason Wentworth. Sorting out sorting:
the sequel. In Proceedings of the 13th annual conference on Innovation
and Technology in Computer Science Education, ITiCSE’08, pages 174–
178, New York, NY, USA, 2008. ACM.
[38] R. L. Glass, I. Vessey, and V. Ramesh. Research in software engineer-
ing: an analysis of the literature. Information and Software Technology,
44(8):491 – 506, 2002.
[39] Scott Grissom, Myles F. McNally, and Tom Naps. Algorithm visual-
ization in CS education: comparing levels of student engagement. In
Proceedings of the 2003 ACM symposium on Software visualization, Soft-
Vis’03, pages 87–94, New York, NY, USA, 2003. ACM Press.
[40] Judith S. Gurka and Wayne Citrin. Testing e!ectiveness of algorithm
animation. In Proceedings of the 1996 IEEE Symposium on Visual Lan-
guages, pages 182–189, Washington, DC, USA, 1996. IEEE Computer
Society.
[41] Steven R. Hansen, N. Hari Narayanan, and Dan Schrimpsher. Helping
learners visualize and comprehend algorithms. Interactive Multimedia
Electronic Journal of Computer-Enhanced Learning, 2(1), May 2000.
[42] T. Dean Hendrix, James H. Cross, II, and Larry A. Barowski. An exten-
sible framework for providing dynamic data structure visualizations in a
lightweight ide. In Proceedings of the 35th SIGCSE technical symposium
on Computer Science Education, SIGCSE’04, pages 387–391, New York,
NY, USA, 2004. ACM.
[43] Ivan Herman and M. Scott Marshall. GraphXML - an XML-based graph
description format. In Graph Drawing, pages 52–62, 2000.
108 Bibliography
[44] F. R. A. Hopgood. Computer animation used as a tool in teaching
computer science. In Proceedings of the IFIP Congress, pages 889–892,
1974.
[45] Teresa Hubscher-Younger and N. Hari Narayanan. Dancing hamsters
and marble statues: characterizing student visualizations of algorithms.
In Proceedings of the 2003 ACM symposium on Software Visualization,
SoftVis’03, pages 95–104, New York, NY, USA, 2003. ACM.
[46] Christopher D. Hundhausen. Integrating algorithm visualization tech-
nology into an undergraduate algorithms course: ethnographic studies
of a social constructivist approach. Computers & Education, 39(3):237
– 260, 2002.
[47] Christopher D. Hundhausen and Jonathan L. Brown. Designing, visu-
alizing, and discussing algorithms within a CS 1 studio experience: An
empirical study. Computers & Education, 50(1):301 – 326, 2008.
[48] Christopher D. Hundhausen and Jonathan Lee Brown. What you see is
what you code: A ”radically-dynamic” algorithm visualization develop-
ment model for novice learners. In Proceedings IEEE 2005 Symposium
on Visual Languages and Human-Centric Computing, 2005.
[49] Christopher D. Hundhausen and Sarah A. Douglas. Low-fidelity al-
gorithm visualization. Journal of Visual Languages and Computing,
13(5):449–470, October 2002.
[50] Christopher D. Hundhausen, Sarah A. Douglas, and John T. Stasko. A
meta-study of algorithm visualization e!ectiveness. Journal of Visual
Languages and Computing, 13(3):259–290, June 2002.
[51] The EDUCAUSE Learning Initiative. 7 things you
should know about screencasting. Technical report, ED-
UCAUSE Learning Initiative, 2006. Available online at
http://www.educause.edu/ir/library/pdf/ELI7012.pdf (November
10, 2009).
[52] Jhilmil Jain, James H. Cross II, T. Dean Hendrix, and Larry A.
Barowski. Experimental evaluation of animated-verifying object viewers
Bibliography 109
for Java. In Proceedings of the 2006 ACM Symposium on Software Vi-
sualization, SoftVis’06, pages 27–36, New York, NY, USA, 2006. ACM
Press.
[53] Duane J. Jarc, Michael B. Feldman, and Rachelle S. Heller. Assessing the
benefits of interactive prediction using web-based algorithm animation
courseware. In The proceedings of the thirty-first SIGCSE technical sym-
posium on Computer science education, pages 377–381, Austin, Texas,
2000. ACM Press, New York.
[54] Duane Je!rey Jarc. Assessing the Benefits of Interactivity and the In-
fluence of Learning Styles on the E!ectiveness of Algorithm Animation
using Web-based Data Structures Courseware. Doctoral dissertation, The
George Washington University, 1999.
[55] Ville Karavirta. XAAL - extensible algorithm animation language.
Master’s thesis, Department of Computer Science and Engineering,
Helsinki University of Technology, December 2005. Available online
at http://www.cs.hut.fi/Research/SVG/publications/karavirta-
masters.pdf (November 10, 2009).
[56] Ville Karavirta and Ari Korhonen. Automatic tutoring question gen-
eration during algorithm simulation. In Anders Berglund and Mattias
Wiggberg, editors, Proceedings of the 6th Finnish/Baltic Sea Conference
on Computer Science Education, pages 95–100, 2006.
[57] Ville Karavirta, Ari Korhonen, and Lauri Malmi. Taxonomy of algorithm
animation languages. In Proceedings of the 2006 ACM symposium on
Software Visualization, SoftVis’06, pages 77–85, New York, NY, USA,
September 2006. ACM Press.
[58] Ville Karavirta, Ari Korhonen, Lauri Malmi, and Kimmo Stalnacke. Ma-
trixPro – A tool for on-the-fly demonstration of data structures and al-
gorithms. In Proceedings of the Third Program Visualization Workshop,
PVW’04, pages 26–33, The University of Warwick, UK, July 2004.
[59] Ville Karavirta, Ari Korhonen, Jussi Nikander, and Petri Tenhunen. Ef-
fortless creation of algorithm visualization. In Proceedings of the Second
110 Bibliography
Annual Finnish / Baltic Sea Conference on Computer Science Educa-
tion, pages 52–56, October 2002.
[60] Ville Karavirta, Ari Korhonen, and Petri Tenhunen. Survey of e!ort-
lessness in algorithm visualization systems. In Proceedings of the Third
Program Visualization Workshop, PVW’04, pages 141–148, The Univer-
sity of Warwick, UK, July 2004.
[61] Colleen Kehoe, John T. Stasko, and Ashley Taylor. Rethinking the
evaluation of algorithm animations as learning aids: an observational
study. International Journal of Human-Computer Studies, 54(2):265–
284, 2001.
[62] Sami Khuri and Klaus Holzapfel. Evega: an educational visulalization
environment for graph algorithms. In Proceedings of the 6th annual con-
ference on Innovation and Technology in Computer Science Education,
ITiCSE’01, pages 101–104, New York, NY, USA, 2001. ACM.
[63] Sami Khuri and Hsiu-Chin Hsu. Interactive packages for learning image
compression algorithms. SIGCSE Bulletin, 32(3):73–76, 2000.
[64] Kenneth C. Knowlton. L6: Bell telephone laboratories low-level linked
list language. 16 mm black and white sound film, 16 minutes, 1966.
[65] Ari Korhonen. Visual Algorithm Simulation. Doctoral dissertation (tech
rep. no. TKO-A40/03), Helsinki University of Technology, 2003.
[66] Ari Korhonen and Lauri Malmi. Matrix — Concept animation and algo-
rithm simulation system. In Proceedings of the Working Conference on
Advanced Visual Interfaces, AVI’02, pages 109–114, Trento, Italy, May
2002. ACM Press, New York.
[67] Ari Korhonen, Erkki Sutinen, and Jorma Tarhio. Understanding al-
gorithms by means of visualized path testing. In Stephan Diehl, ed-
itor, Software Visualization: International Seminar, pages 256–268,
Dagstuhl, Germany, 2002. Springer.
[68] Eileen Kraemer and John T. Stasko. The visualization of parallel sys-
tems: An overview. Journal of Parallel and Distributed Computing,
18(2):105 – 117, 1993.
Bibliography 111
[69] Markus Krebs, Tobias Lauer, Thomas Ottmann, and Stephan Trahasch.
Student-built algorithm visualizations for assessment: flexible genera
tion, feedback and grading. In Proceedings of the 10th annual SIGCSE
conference on Innovation and Technology in Computer Science Educa-
tion, ITiCSE’05, pages 281–285, New York, NY, USA, 2005. ACM Press.
[70] Mikko-Jussi Laakso, Niko Myller, and Ari Korhonen. Analyzing the ex-
tended engagement taxonomy in collaborative algorithm visualization.
Journal of Educational Technology & Society, 2008. Accepted for publi-
cation.
[71] Essi Lahtinen. Integrating the use of visualizations to teaching pro-
gramming. In H.-M. Jarvinen and K. Alamutka, editors, Proceedings of
Methods, Materials and Tools for Programming Education Conference,
pages 7–13, Tampere, Finland, 2006.
[72] Essi Lahtinen, Hannu-Matti Jarvinen, and Suvi Melakoski-Vistbacka.
Targeting program visualizations. In Proceedings of the 12th annual
SIGCSE conference on Innovation and Technology in Computer Science
Education, ITiCSE’07, pages 256–260, New York, NY, USA, 2007. ACM.
[73] Jill H. Larkin and Herbert A. Simon. Why a diagram is (sometimes)
worth ten thousand words. Cognitive Science, 11(1):65–100, 1987.
[74] Tobias Lauer. Learner interaction with algorithm visualizations: view-
ing vs. changing vs. constructing. In Proceedings of the 11th annual
SIGCSE conference on Innovation and Technology in Computer Science
Education, ITiCSE’06, pages 202–206, New York, NY, USA, 2006. ACM
Press.
[75] Tobias Lauer. Reevaluating and refining the engagement taxonomy. In
Proceedings of the 13th annual conference on Innovation and Technology
in Computer Science Education, ITiCSE’08, page 355, New York, NY,
USA, 2008. ACM.
[76] Andrea Lawrence, Albert Badre, and John T. Stasko. Empirically eval-
uating the use of animations to teach algorithms. In Proceedings of the
1994 IEEE Symposium on Visual Languages, St. Louis, MO, pages 48–
54, 1994.
112 Bibliography
[77] Tomasz D. Loboda, Atanas Frengov, Amruth N. Kumar, and Peter
Brusilovsky. Distributed framework for adaptive explanatory visualiza-
tion. In Proceedings of the Fourth Program Visualization Workshop,
PVW’06, volume 178 of Electronic Notes in Theoretical Computer Sci-
ence, pages 145–152, Amsterdam, The Netherlands, 2007. Elsevier Sci-
ence Publishers B. V.
[78] Jan Lonnberg, Ari Korhonen, and Lauri Malmi. MVT — a system for
visual testing of software. In Proceedings of the Working Conference on
Advanced Visual Interfaces, AVI’04, pages 385–388, May 2004.
[79] Jonathan I. Maletic, Andrian Marcus, and Michael L. Collard. A task
oriented view of software visualization. Proceedings of First Interna-
tional Workshop on Visualizing Software for Understanding and Analy-
sis, pages 32–40, 2002.
[80] Lauri Malmi, Ville Karavirta, Ari Korhonen, Jussi Nikander, Otto
Seppala, and Panu Silvasti. Visual algorithm simulation exercise sys-
tem with automatic assessment: TRAKLA2. Informatics in Education,
3(2):267–288, 2004.
[81] Myles McNally, Thomas Naps, David Furcy, Scott Grissom, and Chris-
tian Tre!tz. Supporting the rapid development of pedagogically e!ective
algorithm visualizations. Journal of Computing Sciences in Colleges,
23(1):80–90, 2007.
[82] Andres Moreno. Program animation activities in moodle. In Proceedings
of the 13th annual conference on Innovation and Technology in Computer
Science Education, ITiCSE’08, pages 361–361, New York, NY, USA,
2008. ACM.
[83] Andres Moreno, Niko Myller, Erkki Sutinen, and Mordechai Ben-Ari.
Visualizing programs with Jeliot 3. In Proceedings of the International
Working Conference on Advanced Visual Interfaces, AVI’04, pages 373
– 376, Gallipoli (Lecce), Italy, May 2004. ACM.
[84] Brad A. Myers. Visual programming, programming by example, and
program visualization: a taxonomy. SIGCHI Bulletin, 17(4):59–66, 1986.
Bibliography 113
[85] Brad A. Myers. Taxonomies of visual programming and program visu-
alization. Journal of Visual Languages and Computing, 1:97–123, 1990.
[86] Niko Myller. Automatic generation of prediction questions during pro-
gram visualization. In Proceedings of the Fourth Program Visualization
Workshop, PVW’06, volume 178 of Electronic Notes in Theoretical Com-
puter Science, pages 43–49, Amsterdam, The Netherlands, 2007. Elsevier
Science Publishers B. V.
[87] Niko Myller, Roman Bednarik, Erkki Sutinen, and Mordechai Ben-Ari.
Extending the engagement taxonomy: Software visualization and col-
laborative learning. ACM Transactions on Computing Education, 9(1),
March 2009.
[88] Niko Myller, Mikko Laakso, and Ari Korhonen. Analyzing engagement
taxonomy in collaborative algorithm visualization. In Proceedings of
the 12th annual SIGCSE conference on Innovation and Technology in
Computer Science Education, ITiCSE’07, pages 251–255. ACM, 2007.
[89] Fernando Naharro-Berrocal, Cristobal Pareja-Flores, J. Angel Velazquez-
Iturbide, and Margarita Martınez-Santamarta. Automatic web publish-
ing of algorithm animation. Upgrade, II(2):41–45, 2001.
[90] Marc Najork. Web-based algorithm animation. In Proceedings of the 38th
conference on Design automation, DAC’01, pages 506–511, Las Vegas,
Nevada, United States, 2001. ACM Press.
[91] Thomas Naps, Myles McNally, and Scott Grissom. Realizing XML-
driven algorithm visualization. In Proceedings of the Fourth Program
Visualization Workshop, PVW’06, volume 178 of Electronic Notes in
Theoretical Computer Science, pages 129–135, Amsterdam, The Nether-
lands, 2007. Elsevier Science Publishers B. V.
[92] Thomas L. Naps. JHAVE: Supporting Algorithm Visualization. Com-
puter Graphics and Applications, IEEE, 25(5):49–55, 2005.
[93] Thomas L. Naps, James R. Eagan, and Laura L. Norton. JHAVE: An
environment to actively engage students in web-based algorithm visual-
izations. In Proceedings of the SIGCSE Session, pages 109–113, Austin,
Texas, March 2000. ACM Press, New York.
114 Bibliography
[94] Thomas L. Naps and Guido Roßling. JHAVE – more visualizers (and
visualizations) needed. In Proceedings of the Fourth Program Visualiza-
tion Workshop, PVW’06, volume 178 of Electronic Notes in Theoretical
Computer Science, pages 33–41, Amsterdam, The Netherlands, 2007.
Elsevier Science Publishers B. V.
[95] Thomas L. Naps, Guido Roßling, Vicki Almstrum, Wanda Dann, Rudolf
Fleischer, Chris Hundhausen, Ari Korhonen, Lauri Malmi, Myles Mc-
Nally, Susan Rodger, and J. Angel Velazquez-Iturbide. Exploring the role
of visualization and engagement in computer science education. SIGCSE
Bulletin, 35(2):131–152, June 2003.
[96] Thomas L. Naps, Guido Roßling, Jay Anderson, Stephen Cooper, Wanda
Dann, Rudolf Fleischer, Boris Koldehofe, Ari Korhonen, Marja Kuitti-
nen, Charles Leska, Lauri Malmi, Myles McNally, Jarmo Rantakokko,
and Rockford J. Ross. Evaluating the educational impact of visualiza-
tion. SIGCSE Bulletin, 35(4):124–136, December 2003.
[97] Thomas L. Naps, Guido Roßling, Peter Brusilovsky, John English, Duane
Jarc, Ville Karavirta, Charles Leska, Myles McNally, Andres Moreno,
Rockford J. Ross, and Jaime Urquiza-Fuentes. Development of XML-
based tools to support user interaction with algorithm visualization.
SIGCSE Bulletin, 37(4):123–138, December 2005.
[98] Tom Noda and Shawn Helwig. Rich internet applications, best
practices report. Technical report, UW E-Business Consor-
tium, University of Wisconsin-Madison, 2005. Available online at
http://www.uwebc.org/opinionpapers/docs/RIA.pdf (November 10,
2009).
[99] Object Management Group. Unified Modeling Language (UML), version
1.5, 2003.
[100] Cristobal Pareja-Flores, Jamie Urquiza-Fuentes, and J. Angel Velazquez-
Iturbide. WinHIPE: an ide for functional programming based on rewrit-
ing and visualization. ACM SIGPLAN Notices, 42(3):14–23, 2007.
[101] Willard C. Pierson and Susan H. Rodger. Web-based animation of data
structures using JAWAA. In Proceedings of the 29th SIGCSE Technical
Bibliography 115
Symposium on Computer Science Education, SIGCSE’98, pages 267–
271, Atlanta, GA, USA, 1998. ACM Press, New York.
[102] Blaine A. Price, Ronald M. Baecker, and Ian S. Small. A principled
taxonomy of software visualization. Journal of Visual Languages and
Computing, 4(3):211–266, 1993.
[103] Teemu Rajala, Mikko-Jussi Laakso, Erkki Kaila, and Tapio Salakoski.
ViLLE — a language-independent program visualization tool. In Ray-
mond Lister and Simon, editors, Seventh Baltic Sea Conference on Com-
puting Education Research, volume 88 of CRPIT, pages 151–159, Koli
National Park, Finland, 2007. ACS.
[104] Teemu Rajala, Mikko-Jussi Laakso, Erkki Kaila, and Tapio Salakoski.
E!ectiveness of program visualization: A case study with the ViLLE
tool. Journal of Information Technology Education: Innovations in Prac-
tice, 7:15–32, 2008.
[105] Philippa Rhodes, Eileen Kraemer, Ashley Hamilton-Taylor, Sujith
Thomas, Matthew Ross, Elizabeth Davis, Kenneth Hailston, and Keith
Main. Vizeval: An experimental system for the study of program visu-
alization quality. In Proceedings of the Visual Languages and Human-
Centric Computing, pages 55–58, Washington, DC, USA, 2006. IEEE
Computer Society.
[106] Susan H. Rodger and Thomas W. Finley. JFLAP: An Interactive Formal
Languages and Automata Package. Jones & Bartlett Publishers, 2006.
[107] Gruia-Catalin Roman and Kenneth C. Cox. A taxonomy of program
visualization systems. IEEE Computers, pages 97–123, December 1993.
[108] Gruia-Catalin Roman, Kenneth C. Cox, C. Donald Wilcox, and
Jerome Y. Plun. Pavane: A system for declarative visualization of
concurrent computations. Journal of Visual Languages and Computing,
3(2):161–193, 1992.
[109] Rockford J. Ross and Michael T. Grinder. Hypertextbooks: Animated,
active learning, comprehensive teaching and learning resources for the
web. In Stephan Diehl, editor, Software Visualization: International
Seminar, pages 269–283, Dagstuhl, Germany, 2002. Springer.
116 Bibliography
[110] Guido Roßling. Animal-Farm: An Extensible Framework for Algorithm
Visualization. Phd thesis, University of Siegen, Germany, 2002. Available
online at http://www.ub.uni-siegen.de/epub/diss/roessling.htm
(November 10, 2009).
[111] Guido Roßling. A first set of design patterns for algorithm animation.
In Proceedings of the Fifth Program Visualization Workshop, PVW’08,
volume 224 of Electronic Notes in Theoretical Computer Science, pages
67–76, Amsterdam, The Netherlands, 2009. Elsevier Science Publishers
B. V.
[112] Guido Roßling and Tobias Ackermann. A Framework for Generating
AV Content on-the-fly. In Proceedings of the Fourth Program Visual-
ization Workshop, PVW’06, volume 178, pages 23–31, Amsterdam, The
Netherlands, 2007. Elsevier Science Publishers B. V.
[113] Guido Roßling and Bernd Freisleben. Program visualization using An-
imalScript. In Proceedings of the First Program Visualization Work-
shop, PVW’00, pages 41–52, University of Joensuu, Finland, 2000.
[114] Guido Roßling and Bernd Freisleben. ANIMAL: A system for supporting
multiple roles in algorithm animation. Journal of Visual Languages and
Computing, 13(3):341–354, 2002.
[115] Guido Roßling, Felix Gliesche, Thomas Jajeh, and Thomas Widjaja. En-
hanced expressiveness in scripting using AnimalScript 2. In Proceedings
of the Third Program Visualization Workshop, PVW’04, pages 10–17,
The University of Warwick, UK, July 2004.
[116] Guido Roßling and Gina Haussage. Towards tool-independent interac-
tion support. In Proceedings of the Third Program Visualization Work-
shop, PVW’04, pages 110–117, The University of Warwick, UK, July
2004.
[117] Guido Roßling, Lauri Malmi, Michael Clancy, Mike Joy, Andreas Kerren,
Ari Korhonen, Andres Moreno, Thomas Naps, Rainer Oechsle, Atanas
Radenski, Rockford J. Ross, and J. Angel Velazquez Iturbide. Enhanc-
ing learning management systems to better support computer science
education. SIGCSE Bulletin, 40(4):142–166, 2008.
Bibliography 117
[118] Guido Roßling, Stephan Mehlhase, and Jens Pfau. A java API for cre-
ating (not only) AnimalScript. In Proceedings of the Fifth Program
Visualization Workshop, PVW’08, volume 224 of Electronic Notes in
Theoretical Computer Science, pages 15 – 25, Amsterdam, The Nether-
lands, 2009. Elsevier Science Publishers B. V.
[119] Guido Roßling, Thomas Naps, Mark S. Hall, Ville Karavirta, An-
dreas Kerren, Charles Leska, Andres Moreno, Rainer Oechsle, Susan H.
Rodger, Jaime Urquiza-Fuentes, and J. Angel Velazquez-Iturbide. Merg-
ing interactive visualizations with hypertextbooks and course manage-
ment. SIGCSE Bulletin, 38(4):166–181, 2006.
[120] Guido Roßling and Thomas L. Naps. A testbed for pedagogical re-
quirements in algorithm visualizations. In Proceedings of the 7th An-
nual SIGCSE Conference on Innovation and Technology in Computer
Science Education, ITiCSE’02, pages 96–100, Aarhus, Denmark, 2002.
ACM Press, New York.
[121] Guido Roßling and Thomas L. Naps. Towards intelligent tutoring in
algorithm visualization. In Second International Program Visualization
Workshop, PVW’02, pages 125–130, Aarhus, Denmark, 2002. University
of Aarhus, Department of Computer Science.
[122] Guido Roßling and Teena Vellaramkalayil. First steps towards a
visualization-based computer science hypertextbook as a moodle module.
In Proceedings of the Fifth Program Visualization Workshop, PVW’08,
volume 224 of Electronic Notes in Theoretical Computer Science, pages
47 – 56, 2009.
[123] Purvi Saraiya, Cli!ord A. Sha!er, D. Scott McCrickard, and Chris
North. E!ective features of algorithm visualizations. In Proceedings of
the 35th SIGCSE technical symposium on Computer Science Education,
SIGCSE’04, pages 382–386, New York, NY, USA, 2004. ACM.
[124] Otto Seppala and Ville Karavirta. Work in progress: Automatic genera-
tion of algorithm animations for lecture slides. In Proceedings of the Fifth
Program Visualization Workshop, PVW’08, volume 224 of Electronic
Notes in Theoretical Computer Science, pages 97–103, Amsterdam, The
Netherlands, 2009. Elsevier Science Publishers B. V.
118 Bibliography
[125] Cli!ord A. Sha!er, Matthew Cooper, and Stephen H. Edwards. Algo-
rithm visualization: a report on the state of the field. In Proceedings of
the 38th SIGCSE technical symposium on Computer Science Education,
SIGCSE’07, pages 150–154, New York, NY, USA, 2007. ACM Press.
[126] Maria Shneerson and Ayellet Tal. GASP-II: a geometric algorithm an-
imation system for an electronic classroom. In Proceedings of the thir-
teenth annual symposium on Computational Geometry, SCG’97, pages
379–381, New York, NY, USA, 1997. ACM.
[127] Ben Shneiderman. Direct manipulation: A step beyond programming
languages. IEEE Computer, 16(8):57–69, Aug. 1983.
[128] John T. Stasko. Jsamba – java version of the SAMBA anima-
tion program. Available online at http://www.cc.gatech.edu/gvu/
softviz/algoanim/jsamba/.
[129] John T. Stasko. TANGO: A framework and system for algorithm ani-
mation. IEEE Computer, 23(9):27–39, 1990.
[130] John T. Stasko. Using direct manipulation to build algorithm animations
by demonstration. In Proceedings of Conference on Human Factors and
Computing Systems, pages 307–314, New Orleans, Louisiana, USA, 1991.
ACM, New York.
[131] John T. Stasko. Using student-built algorithm animations as learning
aids. In The Proceedings of the 28th SIGCSE Technical Symposium on
Computer Science Education, pages 25–29, San Jose, CA, USA, 1997.
ACM Press, New York.
[132] John T. Stasko, Albert Badre, and Clayton Lewis. Do algorithm anima-
tions assist learning? An empirical study and analysis. In Proceedings of
the INTERCHI Conference on Human Factors on Computing Systems,
pages 61–66, Amsterdam, Netherlands, 1993. ACM Press, New York.
[133] John T. Stasko and Eileen Kraemer. A methodology for building
application-specific visualizations of parallel programs. Journal of Par-
allel and Distributed Computing, 18(2):258–264, 1993.
Bibliography 119
[134] John T. Stasko and Charles Patterson. Understanding and character-
izing software visualization systems. In The Proceedings of the IEEE
Workshop on Visual Languages, pages 3–10, Seattle, WA, USA, 1992.
[135] John T. Stasko and Joseph F. Wehrli. Three-dimensional computation
visualization. Proceedings of the 1993 IEEE Symposium on Visual Lan-
guages, pages 100–107, Aug 1993.
[136] David Scot Taylor, Andrei F. Lurie, Cay S. Horstmenn, Menko B. John-
son, Sean K. Sharma, and Edward C. Yin. Predictive vs. passive anima-
tion learning tools. In Proceedings of the 40th ACM technical symposium
on Computer Science Education, SIGCSE’09, pages 494–498, New York,
NY, USA, 2009. ACM.
[137] Jaime Urquiza-Fuentes and J. Angel Velazquez-Iturbide. An evaluation
of the e!ortless approach to build algorithm animations with WinHIPE.
In Proceedings of the Fourth Program Visualization Workshop, PVW’06,
volume 178 of Electronic Notes in Theoretical Computer Science, pages
3–13, Amsterdam, The Netherlands, 2007. Elsevier Science Publishers
B. V.
[138] Jaime Urquiza-Fuentes and J. Angel Velazquez-Iturbide. Pedagogical ef-
fectiveness of engagement levels - a survey of successful experiences. In
Proceedings of the Fifth Program Visualization Workshop, PVW’08, vol-
ume 224 of Electronic Notes in Theoretical Computer Science, pages 169
– 178, Amsterdam, The Netherlands, 2009. Elsevier Science Publishers
B. V.
[139] J. Angel Velazquez-Iturbide, Cristobal Pareja-Flores, and Jaime
Urquiza-Fuentes. An approach to e!ortless construction of program an-
imations. Computers & Education, 50(1):179 – 192, 2008.
[140] W3C. XSL Transformations (XSLT) 1.0 specification. W3C Recommen-
dation, World Wide Web Consortium, 1999.
[141] W3C. Scalable Vector Graphics (SVG) 1.0 specification. W3C Recom-
mendation, World Wide Web Consortium, 2001.
[142] W3C. Cascading Style Sheets, CSS 2.1 specification. W3C Candidate
Recommendation, World Wide Web Consortium, July 2007.
120 Bibliography
[143] W3C. Scalable Vector Graphics (SVG) Tiny 1.2 specification. W3C
Recommendation, World Wide Web Consortium, 2008.
[144] Mingshen Wu. Teaching graph algorithms using online java package
IAPPGA. SIGCSE Bulletin, 37(4):64–68, 2005.