Embed Size (px)
Citation preview
FacetAtlas: Multifaceted Visualization for Rich Text Corpora
Nan Cao, Jimeng Sun, Yu-Ru Lin, David Gotz, Shixia Liu, and Huamin Qu, Member, IEEE
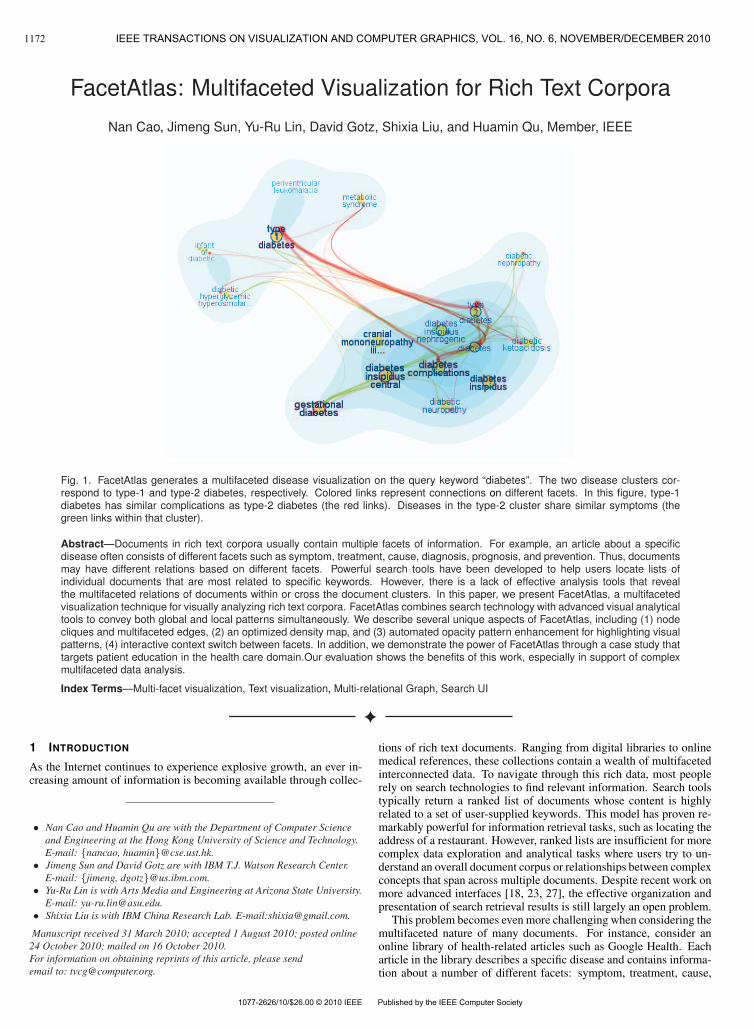
Fig. 1. FacetAtlas generates a multifaceted disease visualization on the query keyword “diabetes”. The two disease clusters cor-respond to type-1 and type-2 diabetes, respectively. Colored links represent connections on different facets. In this figure, type-1diabetes has similar complications as type-2 diabetes (the red links). Diseases in the type-2 cluster share similar symptoms (thegreen links within that cluster).
Abstract—Documents in rich text corpora usually contain multiple facets of information. For example, an article about a specificdisease often consists of different facets such as symptom, treatment, cause, diagnosis, prognosis, and prevention. Thus, documentsmay have different relations based on different facets. Powerful search tools have been developed to help users locate lists ofindividual documents that are most related to specific keywords. However, there is a lack of effective analysis tools that revealthe multifaceted relations of documents within or cross the document clusters. In this paper, we present FacetAtlas, a multifacetedvisualization technique for visually analyzing rich text corpora. FacetAtlas combines search technology with advanced visual analyticaltools to convey both global and local patterns simultaneously. We describe several unique aspects of FacetAtlas, including (1) nodecliques and multifaceted edges, (2) an optimized density map, and (3) automated opacity pattern enhancement for highlighting visualpatterns, (4) interactive context switch between facets. In addition, we demonstrate the power of FacetAtlas through a case study thattargets patient education in the health care domain.Our evaluation shows the benefits of this work, especially in support of complexmultifaceted data analysis.
Index Terms—Multi-facet visualization, Text visualization, Multi-relational Graph, Search UI
1 INTRODUCTION
As the Internet continues to experience explosive growth, an ever in-creasing amount of information is becoming available through collec-
• Nan Cao and Huamin Qu are with the Department of Computer Scienceand Engineering at the Hong Kong University of Science and Technology.E-mail: {nancao, huamin}@cse.ust.hk.
• Jimeng Sun and David Gotz are with IBM T.J. Watson Research Center.E-mail: {jimeng, dgotz}@us.ibm.com.
• Yu-Ru Lin is with Arts Media and Engineering at Arizona State University.E-mail: [email protected].
• Shixia Liu is with IBM China Research Lab. E-mail:[email protected].
Manuscript received 31 March 2010; accepted 1 August 2010; posted online24 October 2010; mailed on 16 October 2010.For information on obtaining reprints of this article, please sendemail to: [email protected].
tions of rich text documents. Ranging from digital libraries to onlinemedical references, these collections contain a wealth of multifacetedinterconnected data. To navigate through this rich data, most peoplerely on search technologies to find relevant information. Search toolstypically return a ranked list of documents whose content is highlyrelated to a set of user-supplied keywords. This model has proven re-markably powerful for information retrieval tasks, such as locating theaddress of a restaurant. However, ranked lists are insufficient for morecomplex data exploration and analytical tasks where users try to un-derstand an overall document corpus or relationships between complexconcepts that span across multiple documents. Despite recent work onmore advanced interfaces [18, 23, 27], the effective organization andpresentation of search retrieval results is still largely an open problem.
This problem becomes even more challenging when considering themultifaceted nature of many documents. For instance, consider anonline library of health-related articles such as Google Health. Eacharticle in the library describes a specific disease and contains informa-tion about a number of different facets: symptom, treatment, cause,
1172
1077-2626/10/$26.00 © 2010 IEEE Published by the IEEE Computer Society
IEEE TRANSACTIONS ON VISUALIZATION AND COMPUTER GRAPHICS, VOL. 16, NO. 6, NOVEMBER/DECEMBER 2010
diagnosis, prognosis, and prevention. A search engine allows users tofind a page describing a specific disease, and links allow users to nav-igate to a small set of predefined related pages. However, answeringsome basic self-care questions remains very difficult. For example:What are the general classes of diseases that can lead to the symptomsI’m experiencing? Which of those diseases have a similar prognosis?How do those diseases relate to each other in terms of treatment alter-natives?
These questions require an understanding of complex correlationsacross documents and across multiple facets of the contained informa-tion. To answer these questions, users need to examine both high-leveloverviews and fine-grained local-level relationships. For instance, auser in the scenario above would need to both explore clusters of re-lated diseases and uncover pairwise relationships based on specificfacets of information such as prognosis and treatment.
Information visualization technologies, when used in conjunctionwith data mining and text analysis tools, can be of great value forthese sorts of tasks. For this reason, several visualizations have beendesigned for either high-level corpora summarizations (e.g., [13]) orlow-level structure analysis (e.g., [27, 30]). See Section 2 for a morecomprehensive survey of related techniques.
Although many existing techniques provide valuable insight intothe visualized data, none of them offers a complete solution with thefollowing key features: (1) interactive visualization of local data rela-tionships within the context of global document patterns, (2) dynamiccontext control so that users can pivot between different facets of in-formation, and (3) an integrated approach to multifaceted search andvisualization.
To bridge this gap, we propose FacetAtlas, a new interactive visu-alization technique that enables users to navigate and analyze largemultifaceted text corpora with complex cross-document relationships.Specifically, FacetAtlas provides the following key features:
• Visualization of both global and local patterns. FacetAtlasemploys a multifaceted graph visualization to visualize local re-lations and a density map to portray a global context.
• Integrating unstructured search with visualization. FacetAt-las automatically converts search results from a one-dimensionallist into a visual graph-based representation that is renderedwithin a global context. This enables an interactive explorationof multifaceted relationships.
• Dynamic facet-based context switching. In addition to basicinteractions such as zooming, filtering and highlighting, FacetAt-las supports dynamic context switching. This allows a user topivot the primary visualization layout arrangement across differ-ent facets while maintaining his/her analytic focus.
In this paper, we describe both the design and implementation ofFacetAtlas. In addition, we demonstrate the power of our approachthrough a case study of FacetAtlas applied to a healthcare application1.Initial user feedback confirms the effectiveness and general applicabil-ity of FacetAtlas for searching and exploring rich text corpora.
The rest of paper is organized as follows: Section 2 reviews severalareas of related work; Section 3 introduces the data model used inour work; Section 4 presents the visualization design of FacetAtlasand describes how users interact with the system; Section 5 includes adetailed description of our implementation; Section 6 presents a casestudy in the healthcare domain; Section 7 evaluates FacetAtlas througha formal user study; finally, the paper concludes in Section 8 with areview and discussion of future work.
2 RELATED WORK
In this section, we first review text visualizations that have focused onglobal patterns. Then we discuss work on visualizing local relationalpatterns in text. Finally, we survey related work on using visualizationas a search interface.
1The screen capture video is available at: http://www.cse.ust.hk/∼nancao/
movie/facetatlas.mov
2.1 Visualizing Global Patterns in Text CorporaContent level: Many conventional text visualizations are designed toreveal global patterns in content from single or multiple documents.Perhaps most common is the tag cloud [12] which displays a set ofwords in rows with font sizes that correspond to statistics such as termfrequency. More advanced tag clouds such as Wordle [29], and WordCloud [9] enhance the appearance through more sophisticated lay-outs. In other work, document cards [24] present the content of a doc-ument collection using summary cards that include highlighted figuresand content topics. Topic Islands [20] uses wavelets to summarize thethematic characteristics of a single document. ThemeRiver [13] visu-alizes topic evolution using a temporal plot showing the ebb and flowof topic themes over time. FacetAtlas goes beyond global patterns bydisplaying both global and local patterns.
Document level: In contrast to content-level visualization meth-ods, document-level tools use projection-based techniques to visualizerelationships between documents in a collection. Many of these visu-alizations [1, 7, 31] map a set of documents to a 2D display accord-ing to document similarity. Other projections, such as probabilisticlatent semantic model [17], can reveal topic clusters. However, be-cause of information lost when projecting from a high dimensionalspace to 2D coordinates, it is often hard for users to understand thesemantic meaning of the resulting clusters. In FacetAtlas, we follow aprojection-based approach to render document-level relationships. Wecombat the information lost due to dimensionality reduction by pro-viding a novel multifaceted graph-based display that is integrated withan optimized density map.
2.2 Visualizing Local Relational PatternsVisualizing local relational patterns has received significant attentionin recent years, specifically in the context of text and graph visualiza-tion.
Text Visualization: Text visualizations such as WordTree [30]and PhraseNet [28] focus on relational word patterns in text. In par-ticular, WordTree considers the prefix relation between words at thesyntax level. PhraseNet allows users to define relationships. How-ever, these systems do not focus on multifaceted relations as we dowith FacetAtlas. In other work, Collins et al. [8] introduce paralleltag clouds (PTCs) to visualize text along multiple facets arranged ascolumns of words. Links across columns represent co-occurrence re-lationships. In contrast to the word-level focus of PTCs, FacetAtlascan visualize more complex latent relationships.
Graph Visualization Various network visualizations [15] havebeen designed to analyze relational patterns. However, many of these,such as Vizster [14], consider only one type of relationship. In orderto visualize multiple types of relationships, Shen et al. [21] introduceOntoVis which uses nodes and links to represent various concepts andrelations for large and heterogeneous social networks. In particular,OntoVis connects each entity in the focused concepts with its relatedentities from both focused and unfocused concepts. Compared to On-toVis, our FacetAtlas adopts a completely different visual design topresent multifaceted relations which can easily convey both global andlocal patterns in one visual metaphor. In addition, it also provides sev-eral novel visual interaction to facilitate users to identify outliers andco-occurrences.
In other work, SocialAction [22] supports relational pattern detec-tion for social networks through smart filtering of important nodes,clusters and outliers. Similarly, FacetAtlas provides users with richinteraction tools that allow them to further interpret and examine mul-tifaced interconnected data from multiple perspectives. In additionFacetAtlas includes automated pattern detection to support the visual-ization of clusters, co-occurrences and outliers.
2.3 Visual Search InterfacesTraditional search interfaces for text corpora present a ranked list ofsearch results. Recognizing the limitations of this approach, some re-searchers have explored visualization-based search interfaces. For ex-ample, van Ham et al. [27] present a visual search tool to allow users
1173CAO ET AL: FACETATLAS: MULTIFACETED VISUALIZATION FOR RICH TEXT CORPORA
to navigate through a subgraph in a huge document network. Smithet al. [23] introduce FacetMap and FacetLens [18] which provide avisualization-based interface for multifaceted document search. Com-mercially, Grokker (http://www.grokker.com/) is notable for its use ofa circular Treemap visualization to dynamically generate topic clus-ters on web search results. However, these systems do not considermultifaceted relationships as is the focus of FacetAtlas.
3 DATA MODEL AND TRANSFORMATION
In this section, we introduce the multifaceted entity-relational datamodel used by FacetAtlas. We first define the core data model con-structs. We then discuss how a set of documents is transformed fromraw text to fit this model.
3.1 Multifaceted entity-relational data modelThe FacetAtlas data model is a multifaceted representation that cap-tures entities and their relationships. The model consists of the fol-lowing abstract data :
• Entities are instances of a particular concept from the data. Forexample, “Type-1-Diabetes” is a disease entity.
• Facets are classes of entities. For example, “disease” is afacet which contains both the “Type-1-Diabetes” and “Type-2-Diabetes” entities.
• Relations are connections between pairs of entities. There aretwo types of relations. Internal relations are connections be-tween entities or entity groups within the same facet. For ex-ample, “Type-1- Diabetes” has an internal relation to “Type-2-Diabetes” because both are diseases. External relations are con-nections between entities of different facets. For example, thedisease entity “Type-1-Diabetes” has several external relations tosymptom entities such as“increased thirst” and “blurred vision.”
• Clusters are groups of similar entities within a single facet. Forexample, a group of diseases related to “Type-1-Diabetes” formsa cluster on the disease facet.
• Life Each entity and relations are assigned
A simple example of the data model is illustrated in Fig. 2(a). Thefigure shows three facets—Disease, Symptom and Treatment—eachrepresented as a separate layer. Nodes on each layer represent enti-ties within the corresponding facet. Edges within a layer are internalrelations, while edges across layers are external relations.
3.2 TransformationBefore FacetAtlas can be used to visualize a corpus of text documents,the raw text material needs to be transformed to fit into the multi-faceted entity relational data model described above. The transforma-tion process consists of the following key steps: multifaceted entityextraction, similarity measurement, and index building.
First, we extract the multifaceted entities by either applying a stan-dard name entity recognition (NER)2 based on some domain-specificmodel, such as the medical model, or rely on topic modeling (e.g.,ContexTour [19]). The former approach, NER, can easily extract en-tities in facets like organization, location and time. The latter one an-alyzes topic threads from documents that are used as facets with theirkeywords being used as entities in FacetAtlas.
Second, we construct a similarity graph for the extracted entities.In this step, we use either standard information retrieval measures(e.g., cosine similarity) or topic-level similarity through topic mod-eling. This step may be skipped when topic information is availablefrom the text corpus such as in the Google Health case.
Finally we use Lucene3 to build a separate search indices for eachfacet. FacetAtlas leverages these indices for online queries. As a re-sult, user-supplied query keywords can be used at runtime to access
2Stanford name entity recognizer, http://nlp.stanford.edu/software/CRF-
NER.shtml3http://lucene.apache.org/java/docs/
targeted portions of the data model. When a query is issued, FacetAt-las retrieves and visualizes the most relevant entities and their corre-sponding relations.
4 VISUALIZATION DESIGN OF FACETATLAS
Based on the multifaceted entity-relational data model we design aninteractive visualization for the exploration and analysis of multi-faceted interconnected data. In this section, we describe in detail howFacetAtlas visualizes such data.
4.1 Overall Visual DesignTo encode both global cluster information as well as detailed pairwiserelationships in multifaceted interconnected data, we combine a den-sity map with a multifaceted graph. As show in Fig. 1, the clustercontext is displayed as a density map in the background layer. In themultifaceted graph, entities are represented by circles, color-coded bytheir facets.
In the following sections, we introduce three key aspects of theFacetAtlas design including: (1) the visual encoding adopted to rep-resent elements of the FacetAtlas data model, (2) the visual patternsemployed to facilitate data exploration; and (3) the user interactionsthat allow users to examine data from multiple perspectives.
4.2 Visual EncodingThe facet, entity, and relation are the abstract elements in our datamodel. In this section, we describe in detail how FacetAtlas employsvisual elements (e.g., point, link, area, and color [4, 6]) to encodethese abstract elements.
Facet Encoding. Facets are encoded by different colors. Cate-gorical colors are selected for facets based on the CIELAB model sothat facets can be easily differentiated. The facet colors are consis-tently used for both points and links, with the colors remaining con-stant across views as users navigate the visualization. In addition, thevisualization differentiates between a single primary facet and othersecondary facets by sizes and colors. The interactive facet legend dis-plays the primary facet as the leftmost circle and uses entities from thisfacet to build the base graph of the visualization.
Entity Encoding. An entity is represented as circles colored byits facet. For primary entities (entities that belong to the primaryfacet), circle size is used to represent an entity’s degree-of-interest(DOI) [25]. More specifically, DOI determines to what extent a userwill be interested in a certain entity. In our search-oriented applicationarea, users’ interests become clear when they issue a query. Therefore,DOI is defined as the relevancy of an entity to a user’s query.
Secondary entities (entities that belong to one of the secondaryfacets) are rendered together with primary entities as compound nodes.Each compound node contains a single large circle (representing a pri-mary entity), surrounded by small nodes (representing secondary en-tities invisibly connected by external relations). We call these nodesentity node and facet nodes, respectively. For example, in Fig. 2(b),the disease “Diabetes-Type-1” has a symptom facet node drawn in redwhich corresponds to a set of symptom entities such as “increased-thirst” and “blurred-vision” that have external relations to the disease.
This design also collapses multiple secondary entities into a sin-gle facet node to reduce visual clutter. As a result, the visualizationbecomes more consistent since only primary entities are displayed indetail. We argue this simplification is one of the key design elementsthat enables the successful display of both global and local patterns ina clear fashion.
Relation Encoding Two different visual encodings are used toencode relations within FacetAtlas, one for each of the two relationtypes: internal relations and external relations.
Internal relations are encoded using links between correspondingfacet nodes of two different compound nodes. Once again, color cod-ing is used to illustrate which facet the link represents. For exam-ple, Fig. 2(b) shows a red link representing an internal relation be-tween the symptom nodes of two different diseases. The thicknessof a link indicates how related two entities are along a specific facet.
1174 IEEE TRANSACTIONS ON VISUALIZATION AND COMPUTER GRAPHICS, VOL. 16, NO. 6, NOVEMBER/DECEMBER 2010
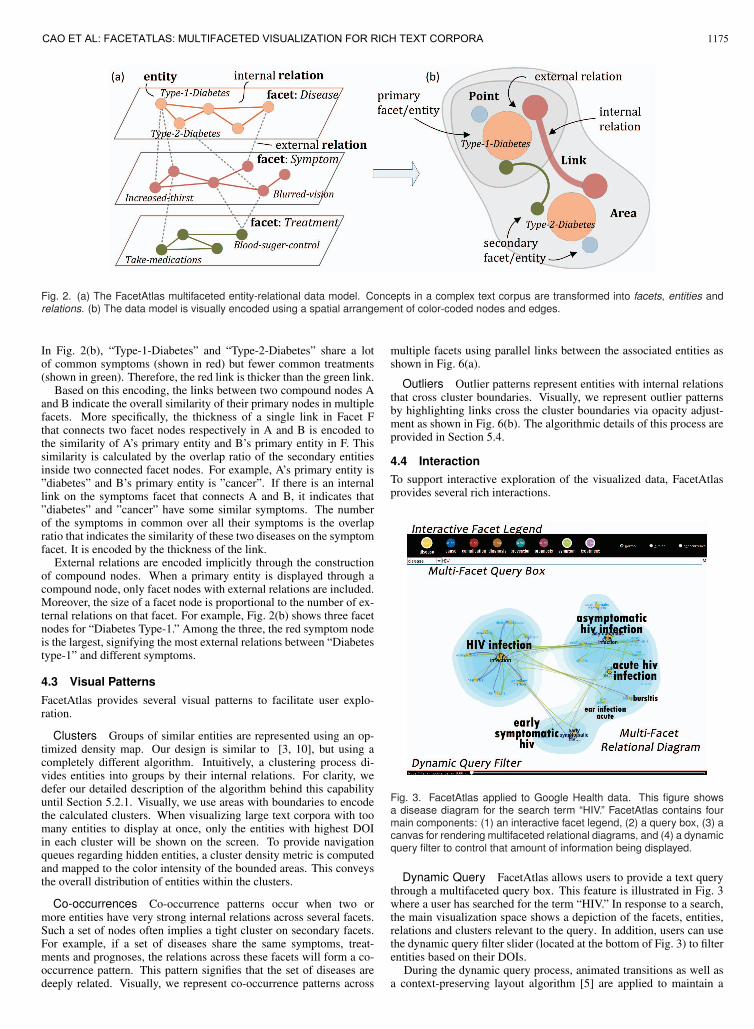
Fig. 2. (a) The FacetAtlas multifaceted entity-relational data model. Concepts in a complex text corpus are transformed into facets, entities andrelations. (b) The data model is visually encoded using a spatial arrangement of color-coded nodes and edges.
In Fig. 2(b), “Type-1-Diabetes” and “Type-2-Diabetes” share a lotof common symptoms (shown in red) but fewer common treatments(shown in green). Therefore, the red link is thicker than the green link.
Based on this encoding, the links between two compound nodes Aand B indicate the overall similarity of their primary nodes in multiplefacets. More specifically, the thickness of a single link in Facet Fthat connects two facet nodes respectively in A and B is encoded tothe similarity of A’s primary entity and B’s primary entity in F. Thissimilarity is calculated by the overlap ratio of the secondary entitiesinside two connected facet nodes. For example, A’s primary entity is”diabetes” and B’s primary entity is ”cancer”. If there is an internallink on the symptoms facet that connects A and B, it indicates that”diabetes” and ”cancer” have some similar symptoms. The numberof the symptoms in common over all their symptoms is the overlapratio that indicates the similarity of these two diseases on the symptomfacet. It is encoded by the thickness of the link.
External relations are encoded implicitly through the constructionof compound nodes. When a primary entity is displayed through acompound node, only facet nodes with external relations are included.Moreover, the size of a facet node is proportional to the number of ex-ternal relations on that facet. For example, Fig. 2(b) shows three facetnodes for “Diabetes Type-1.” Among the three, the red symptom nodeis the largest, signifying the most external relations between “Diabetestype-1” and different symptoms.
4.3 Visual PatternsFacetAtlas provides several visual patterns to facilitate user explo-ration.
Clusters Groups of similar entities are represented using an op-timized density map. Our design is similar to [3, 10], but using acompletely different algorithm. Intuitively, a clustering process di-vides entities into groups by their internal relations. For clarity, wedefer our detailed description of the algorithm behind this capabilityuntil Section 5.2.1. Visually, we use areas with boundaries to encodethe calculated clusters. When visualizing large text corpora with toomany entities to display at once, only the entities with highest DOIin each cluster will be shown on the screen. To provide navigationqueues regarding hidden entities, a cluster density metric is computedand mapped to the color intensity of the bounded areas. This conveysthe overall distribution of entities within the clusters.
Co-occurrences Co-occurrence patterns occur when two ormore entities have very strong internal relations across several facets.Such a set of nodes often implies a tight cluster on secondary facets.For example, if a set of diseases share the same symptoms, treat-ments and prognoses, the relations across these facets will form a co-occurrence pattern. This pattern signifies that the set of diseases aredeeply related. Visually, we represent co-occurrence patterns across
multiple facets using parallel links between the associated entities asshown in Fig. 6(a).
Outliers Outlier patterns represent entities with internal relationsthat cross cluster boundaries. Visually, we represent outlier patternsby highlighting links cross the cluster boundaries via opacity adjust-ment as shown in Fig. 6(b). The algorithmic details of this process areprovided in Section 5.4.
4.4 InteractionTo support interactive exploration of the visualized data, FacetAtlasprovides several rich interactions.
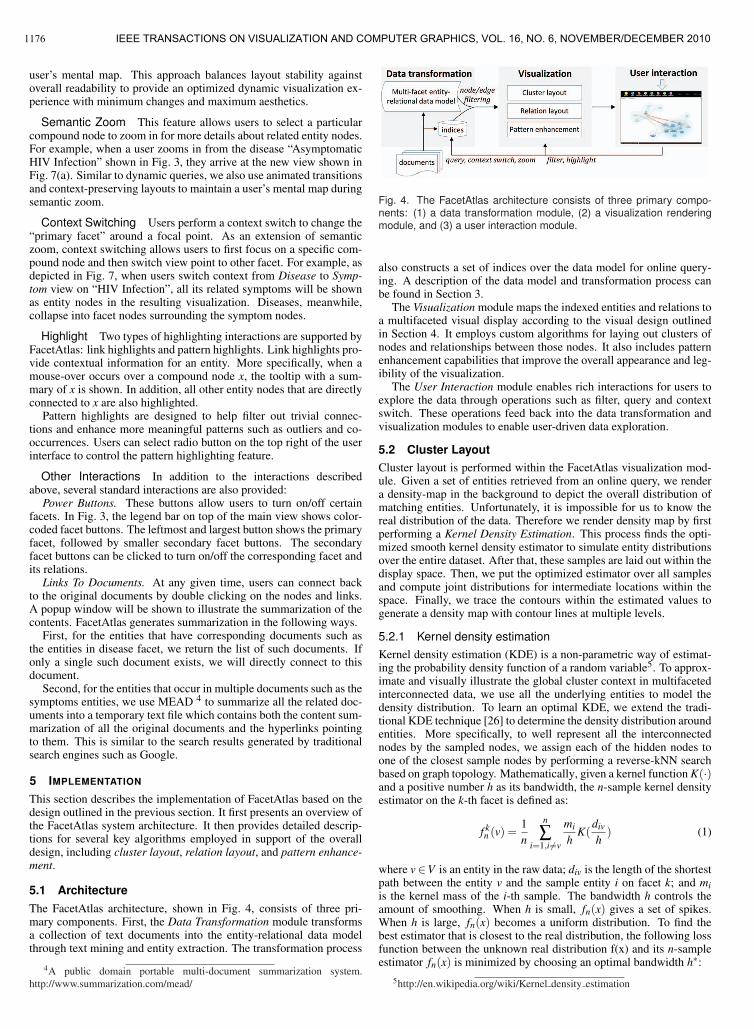
Fig. 3. FacetAtlas applied to Google Health data. This figure showsa disease diagram for the search term “HIV.” FacetAtlas contains fourmain components: (1) an interactive facet legend, (2) a query box, (3) acanvas for rendering multifaceted relational diagrams, and (4) a dynamicquery filter to control that amount of information being displayed.
Dynamic Query FacetAtlas allows users to provide a text querythrough a multifaceted query box. This feature is illustrated in Fig. 3where a user has searched for the term “HIV.” In response to a search,the main visualization space shows a depiction of the facets, entities,relations and clusters relevant to the query. In addition, users can usethe dynamic query filter slider (located at the bottom of Fig. 3) to filterentities based on their DOIs.
During the dynamic query process, animated transitions as well asa context-preserving layout algorithm [5] are applied to maintain a
1175CAO ET AL: FACETATLAS: MULTIFACETED VISUALIZATION FOR RICH TEXT CORPORA
user’s mental map. This approach balances layout stability againstoverall readability to provide an optimized dynamic visualization ex-perience with minimum changes and maximum aesthetics.
Semantic Zoom This feature allows users to select a particularcompound node to zoom in for more details about related entity nodes.For example, when a user zooms in from the disease “AsymptomaticHIV Infection” shown in Fig. 3, they arrive at the new view shown inFig. 7(a). Similar to dynamic queries, we also use animated transitionsand context-preserving layouts to maintain a user’s mental map duringsemantic zoom.
Context Switching Users perform a context switch to change the“primary facet” around a focal point. As an extension of semanticzoom, context switching allows users to first focus on a specific com-pound node and then switch view point to other facet. For example, asdepicted in Fig. 7, when users switch context from Disease to Symp-tom view on “HIV Infection”, all its related symptoms will be shownas entity nodes in the resulting visualization. Diseases, meanwhile,collapse into facet nodes surrounding the symptom nodes.
Highlight Two types of highlighting interactions are supported byFacetAtlas: link highlights and pattern highlights. Link highlights pro-vide contextual information for an entity. More specifically, when amouse-over occurs over a compound node x, the tooltip with a sum-mary of x is shown. In addition, all other entity nodes that are directlyconnected to x are also highlighted.
Pattern highlights are designed to help filter out trivial connec-tions and enhance more meaningful patterns such as outliers and co-occurrences. Users can select radio button on the top right of the userinterface to control the pattern highlighting feature.
Other Interactions In addition to the interactions describedabove, several standard interactions are also provided:
Power Buttons. These buttons allow users to turn on/off certainfacets. In Fig. 3, the legend bar on top of the main view shows color-coded facet buttons. The leftmost and largest button shows the primaryfacet, followed by smaller secondary facet buttons. The secondaryfacet buttons can be clicked to turn on/off the corresponding facet andits relations.
Links To Documents. At any given time, users can connect backto the original documents by double clicking on the nodes and links.A popup window will be shown to illustrate the summarization of thecontents. FacetAtlas generates summarization in the following ways.
First, for the entities that have corresponding documents such asthe entities in disease facet, we return the list of such documents. Ifonly a single such document exists, we will directly connect to thisdocument.
Second, for the entities that occur in multiple documents such as thesymptoms entities, we use MEAD 4 to summarize all the related doc-uments into a temporary text file which contains both the content sum-marization of all the original documents and the hyperlinks pointingto them. This is similar to the search results generated by traditionalsearch engines such as Google.
5 IMPLEMENTATION
This section describes the implementation of FacetAtlas based on thedesign outlined in the previous section. It first presents an overview ofthe FacetAtlas system architecture. It then provides detailed descrip-tions for several key algorithms employed in support of the overalldesign, including cluster layout, relation layout, and pattern enhance-ment.
5.1 ArchitectureThe FacetAtlas architecture, shown in Fig. 4, consists of three pri-mary components. First, the Data Transformation module transformsa collection of text documents into the entity-relational data modelthrough text mining and entity extraction. The transformation process
4A public domain portable multi-document summarization system.
http://www.summarization.com/mead/
Fig. 4. The FacetAtlas architecture consists of three primary compo-nents: (1) a data transformation module, (2) a visualization renderingmodule, and (3) a user interaction module.
also constructs a set of indices over the data model for online query-ing. A description of the data model and transformation process canbe found in Section 3.
The Visualization module maps the indexed entities and relations toa multifaceted visual display according to the visual design outlinedin Section 4. It employs custom algorithms for laying out clusters ofnodes and relationships between those nodes. It also includes patternenhancement capabilities that improve the overall appearance and leg-ibility of the visualization.
The User Interaction module enables rich interactions for users toexplore the data through operations such as filter, query and contextswitch. These operations feed back into the data transformation andvisualization modules to enable user-driven data exploration.
5.2 Cluster LayoutCluster layout is performed within the FacetAtlas visualization mod-ule. Given a set of entities retrieved from an online query, we rendera density-map in the background to depict the overall distribution ofmatching entities. Unfortunately, it is impossible for us to know thereal distribution of the data. Therefore we render density map by firstperforming a Kernel Density Estimation. This process finds the opti-mized smooth kernel density estimator to simulate entity distributionsover the entire dataset. After that, these samples are laid out within thedisplay space. Then, we put the optimized estimator over all samplesand compute joint distributions for intermediate locations within thespace. Finally, we trace the contours within the estimated values togenerate a density map with contour lines at multiple levels.
5.2.1 Kernel density estimationKernel density estimation (KDE) is a non-parametric way of estimat-ing the probability density function of a random variable5. To approx-imate and visually illustrate the global cluster context in multifacetedinterconnected data, we use all the underlying entities to model thedensity distribution. To learn an optimal KDE, we extend the tradi-tional KDE technique [26] to determine the density distribution aroundentities. More specifically, to well represent all the interconnectednodes by the sampled nodes, we assign each of the hidden nodes toone of the closest sample nodes by performing a reverse-kNN searchbased on graph topology. Mathematically, given a kernel function K(·)and a positive number h as its bandwidth, the n-sample kernel densityestimator on the k-th facet is defined as:
f kn (v) =
1
n
n
∑i=1,i �=v
mi
hK(
div
h) (1)
where v ∈V is an entity in the raw data; div is the length of the shortestpath between the entity v and the sample entity i on facet k; and miis the kernel mass of the i-th sample. The bandwidth h controls theamount of smoothing. When h is small, fn(x) gives a set of spikes.When h is large, fn(x) becomes a uniform distribution. To find thebest estimator that is closest to the real distribution, the following lossfunction between the unknown real distribution f(x) and its n-sampleestimator fn(x) is minimized by choosing an optimal bandwidth h∗:
5http://en.wikipedia.org/wiki/Kernel density estimation
1176 IEEE TRANSACTIONS ON VISUALIZATION AND COMPUTER GRAPHICS, VOL. 16, NO. 6, NOVEMBER/DECEMBER 2010
L(h) =∫
( f (v)− fn(v))2dv
=∫
fn(v)2dv−2
∫fn(v) f (v)dv+
∫f (v)2dv
(2)
Considering that∫
f (x)2dx is not dependent on h, we can reformu-late Eq. 2 as
J(h) =∫
fn(v)2dv−2
∫fn(v) f (v)dv (3)
Empirically, this can be trained using leave-one-out cross-validation [26] over the training samples. Thus we effectively put asmooth mass over all data points through the best n-sample estimator.
5.2.2 Density map layout and estimationWe generate the density map based on the sample node locationswithin the display space, and use the optimized density estimator tosimulate entity distribution of the entire data corpus.
A base layout is first computed by mapping samples to the displayspace. To stabilize the layout of visible nodes during animated transi-tions, we use a context preserving stress majorization algorithm [5].In this algorithm, we balance between the readability and stability ofthe density diagram by taking the dynamics of data exploration intoaccount. Furthermore, we preserve layout relationships between indi-vidually connected components by adding virtual connections amongthe most related nodes in different components respectively. The re-latedness is computed using internal relations on the secondary facets.
After the base layout is obtained, the optimized density estimator isapplied over all the samples. Joint distributions are computed in real-time according to the sample locations. Contour lines of the densitymap are then generated by tracing the gradient of the joint densitiesacross the display space. To accelerate the density map generation, wegrid the screen into a low resolution density matrix. Finally we use theestimated density values to determine the color transparency of areasin the density map to complete this portion of the visualization.
5.3 Relation LayoutWe implement two types of link layouts to represent both internal andexternal relations between facets simultaneously. As described in Sec-tion 4.2, we represent external relations with facet nodes by placingthem around a central entity node. This arrangement forms a singlecompound node. Internal links are represented as edges that connecttwo facet nodes from different compound nodes. To reduce line cross-ings and facilitate relational pattern search, a custom layout algorithmis used to arrange the visual presentation of these elements.
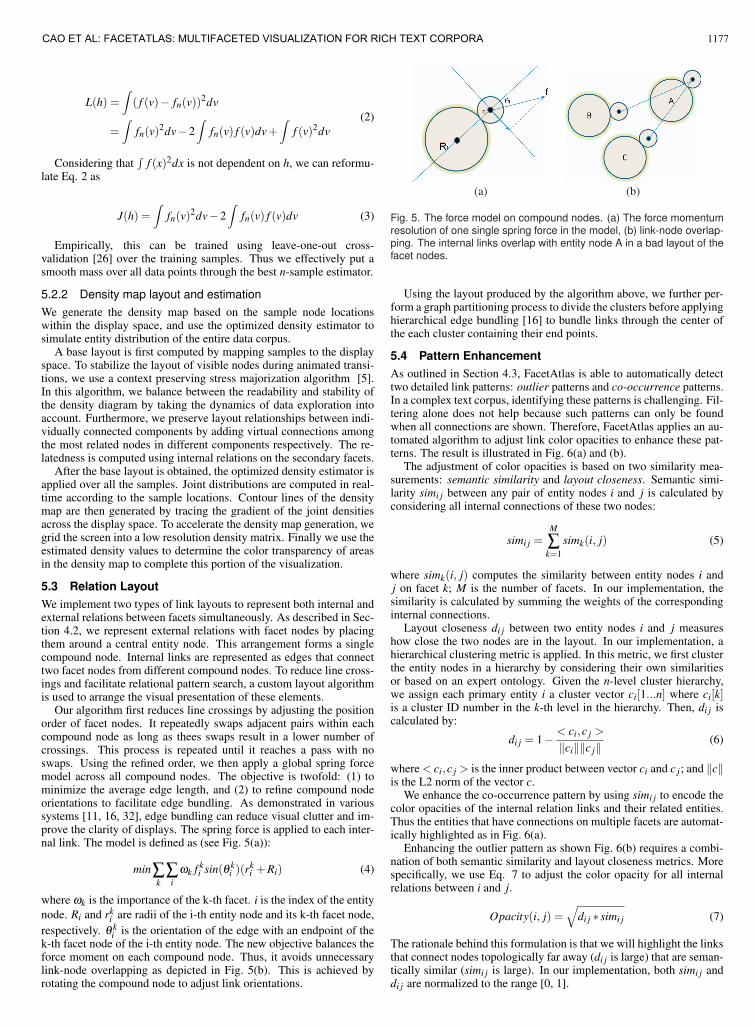
Our algorithm first reduces line crossings by adjusting the positionorder of facet nodes. It repeatedly swaps adjacent pairs within eachcompound node as long as thees swaps result in a lower number ofcrossings. This process is repeated until it reaches a pass with noswaps. Using the refined order, we then apply a global spring forcemodel across all compound nodes. The objective is twofold: (1) tominimize the average edge length, and (2) to refine compound nodeorientations to facilitate edge bundling. As demonstrated in varioussystems [11, 16, 32], edge bundling can reduce visual clutter and im-prove the clarity of displays. The spring force is applied to each inter-nal link. The model is defined as (see Fig. 5(a)):
min∑k
∑i
ωk f ki sin(θ k
i )(rki +Ri) (4)
where ωk is the importance of the k-th facet. i is the index of the entity
node. Ri and rki are radii of the i-th entity node and its k-th facet node,
respectively. θ ki is the orientation of the edge with an endpoint of the
k-th facet node of the i-th entity node. The new objective balances theforce moment on each compound node. Thus, it avoids unnecessarylink-node overlapping as depicted in Fig. 5(b). This is achieved byrotating the compound node to adjust link orientations.
(a) (b)
Fig. 5. The force model on compound nodes. (a) The force momentumresolution of one single spring force in the model, (b) link-node overlap-ping. The internal links overlap with entity node A in a bad layout of thefacet nodes.
Using the layout produced by the algorithm above, we further per-form a graph partitioning process to divide the clusters before applyinghierarchical edge bundling [16] to bundle links through the center ofthe each cluster containing their end points.
5.4 Pattern EnhancementAs outlined in Section 4.3, FacetAtlas is able to automatically detecttwo detailed link patterns: outlier patterns and co-occurrence patterns.In a complex text corpus, identifying these patterns is challenging. Fil-tering alone does not help because such patterns can only be foundwhen all connections are shown. Therefore, FacetAtlas applies an au-tomated algorithm to adjust link color opacities to enhance these pat-terns. The result is illustrated in Fig. 6(a) and (b).
The adjustment of color opacities is based on two similarity mea-surements: semantic similarity and layout closeness. Semantic simi-larity simi j between any pair of entity nodes i and j is calculated byconsidering all internal connections of these two nodes:
simi j =M
∑k=1
simk(i, j) (5)
where simk(i, j) computes the similarity between entity nodes i andj on facet k; M is the number of facets. In our implementation, thesimilarity is calculated by summing the weights of the correspondinginternal connections.
Layout closeness di j between two entity nodes i and j measureshow close the two nodes are in the layout. In our implementation, ahierarchical clustering metric is applied. In this metric, we first clusterthe entity nodes in a hierarchy by considering their own similaritiesor based on an expert ontology. Given the n-level cluster hierarchy,we assign each primary entity i a cluster vector ci[1...n] where ci[k]is a cluster ID number in the k-th level in the hierarchy. Then, di j iscalculated by:
di j = 1− < ci,c j >
‖ci‖‖c j‖ (6)
where < ci,c j > is the inner product between vector ci and c j; and ‖c‖is the L2 norm of the vector c.
We enhance the co-occurrence pattern by using simi j to encode thecolor opacities of the internal relation links and their related entities.Thus the entities that have connections on multiple facets are automat-ically highlighted as in Fig. 6(a).
Enhancing the outlier pattern as shown Fig. 6(b) requires a combi-nation of both semantic similarity and layout closeness metrics. Morespecifically, we use Eq. 7 to adjust the color opacity for all internalrelations between i and j.
Opacity(i, j) =√
di j ∗ simi j (7)
The rationale behind this formulation is that we will highlight the linksthat connect nodes topologically far away (di j is large) that are seman-tically similar (simi j is large). In our implementation, both simi j anddi j are normalized to the range [0, 1].
1177CAO ET AL: FACETATLAS: MULTIFACETED VISUALIZATION FOR RICH TEXT CORPORA
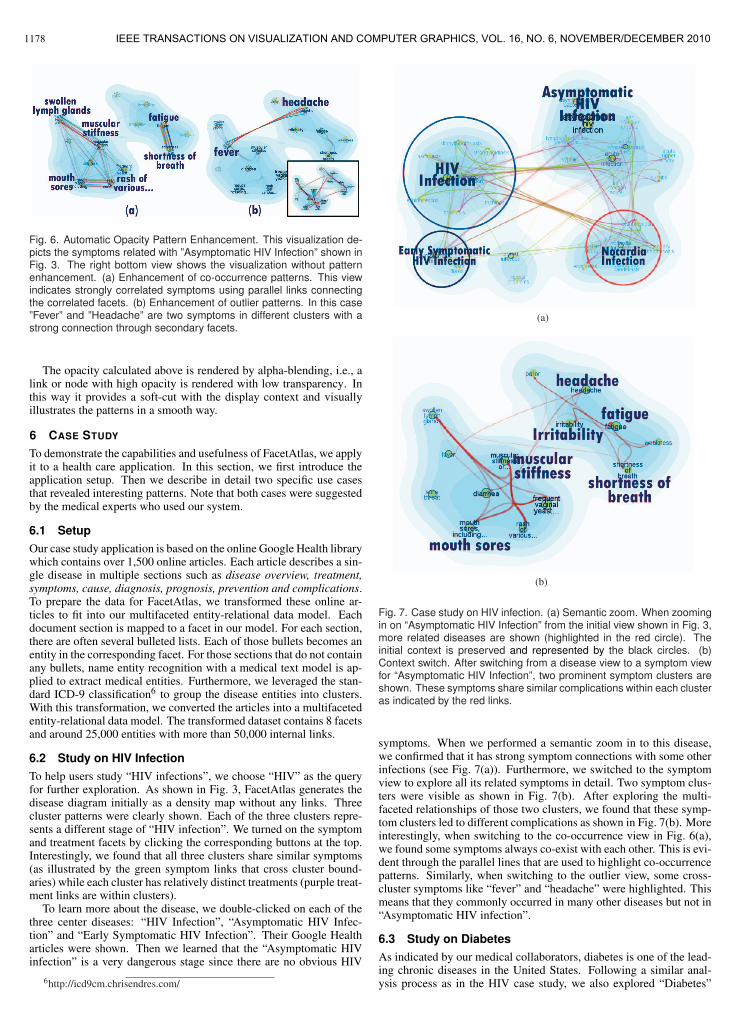
Fig. 6. Automatic Opacity Pattern Enhancement. This visualization de-picts the symptoms related with ”Asymptomatic HIV Infection” shown inFig. 3. The right bottom view shows the visualization without patternenhancement. (a) Enhancement of co-occurrence patterns. This viewindicates strongly correlated symptoms using parallel links connectingthe correlated facets. (b) Enhancement of outlier patterns. In this case”Fever” and ”Headache” are two symptoms in different clusters with astrong connection through secondary facets.
The opacity calculated above is rendered by alpha-blending, i.e., alink or node with high opacity is rendered with low transparency. Inthis way it provides a soft-cut with the display context and visuallyillustrates the patterns in a smooth way.
6 CASE STUDY
To demonstrate the capabilities and usefulness of FacetAtlas, we applyit to a health care application. In this section, we first introduce theapplication setup. Then we describe in detail two specific use casesthat revealed interesting patterns. Note that both cases were suggestedby the medical experts who used our system.
6.1 SetupOur case study application is based on the online Google Health librarywhich contains over 1,500 online articles. Each article describes a sin-gle disease in multiple sections such as disease overview, treatment,symptoms, cause, diagnosis, prognosis, prevention and complications.To prepare the data for FacetAtlas, we transformed these online ar-ticles to fit into our multifaceted entity-relational data model. Eachdocument section is mapped to a facet in our model. For each section,there are often several bulleted lists. Each of those bullets becomes anentity in the corresponding facet. For those sections that do not containany bullets, name entity recognition with a medical text model is ap-plied to extract medical entities. Furthermore, we leveraged the stan-dard ICD-9 classification6 to group the disease entities into clusters.With this transformation, we converted the articles into a multifacetedentity-relational data model. The transformed dataset contains 8 facetsand around 25,000 entities with more than 50,000 internal links.
6.2 Study on HIV InfectionTo help users study “HIV infections”, we choose “HIV” as the queryfor further exploration. As shown in Fig. 3, FacetAtlas generates thedisease diagram initially as a density map without any links. Threecluster patterns were clearly shown. Each of the three clusters repre-sents a different stage of “HIV infection”. We turned on the symptomand treatment facets by clicking the corresponding buttons at the top.Interestingly, we found that all three clusters share similar symptoms(as illustrated by the green symptom links that cross cluster bound-aries) while each cluster has relatively distinct treatments (purple treat-ment links are within clusters).
To learn more about the disease, we double-clicked on each of thethree center diseases: “HIV Infection”, “Asymptomatic HIV Infec-tion” and “Early Symptomatic HIV Infection”. Their Google Healtharticles were shown. Then we learned that the “Asymptomatic HIVinfection” is a very dangerous stage since there are no obvious HIV
6http://icd9cm.chrisendres.com/
(a)
(b)
Fig. 7. Case study on HIV infection. (a) Semantic zoom. When zoomingin on “Asymptomatic HIV Infection” from the initial view shown in Fig. 3,more related diseases are shown (highlighted in the red circle). Theinitial context is preserved and represented by the black circles. (b)Context switch. After switching from a disease view to a symptom viewfor “Asymptomatic HIV Infection”, two prominent symptom clusters areshown. These symptoms share similar complications within each clusteras indicated by the red links.
symptoms. When we performed a semantic zoom in to this disease,we confirmed that it has strong symptom connections with some otherinfections (see Fig. 7(a)). Furthermore, we switched to the symptomview to explore all its related symptoms in detail. Two symptom clus-ters were visible as shown in Fig. 7(b). After exploring the multi-faceted relationships of those two clusters, we found that these symp-tom clusters led to different complications as shown in Fig. 7(b). Moreinterestingly, when switching to the co-occurrence view in Fig. 6(a),we found some symptoms always co-exist with each other. This is evi-dent through the parallel lines that are used to highlight co-occurrencepatterns. Similarly, when switching to the outlier view, some cross-cluster symptoms like “fever” and “headache” were highlighted. Thismeans that they commonly occurred in many other diseases but not in“Asymptomatic HIV infection”.
6.3 Study on DiabetesAs indicated by our medical collaborators, diabetes is one of the lead-ing chronic diseases in the United States. Following a similar anal-ysis process as in the HIV case study, we also explored “Diabetes”
1178 IEEE TRANSACTIONS ON VISUALIZATION AND COMPUTER GRAPHICS, VOL. 16, NO. 6, NOVEMBER/DECEMBER 2010
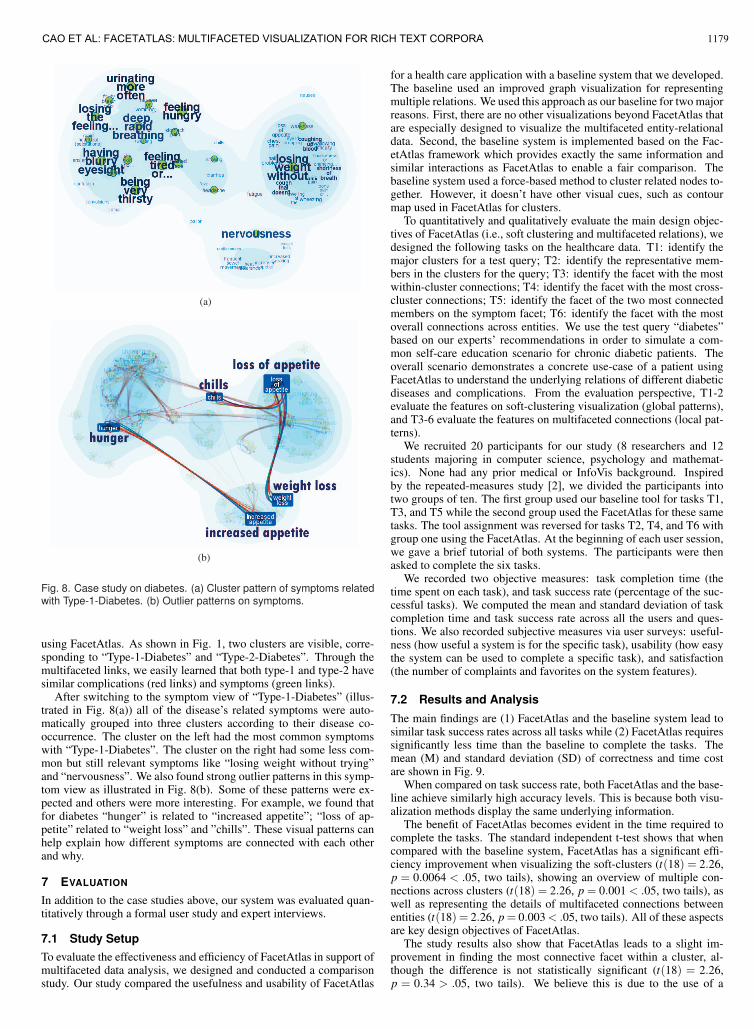
(a)
(b)
Fig. 8. Case study on diabetes. (a) Cluster pattern of symptoms relatedwith Type-1-Diabetes. (b) Outlier patterns on symptoms.
using FacetAtlas. As shown in Fig. 1, two clusters are visible, corre-sponding to “Type-1-Diabetes” and “Type-2-Diabetes”. Through themultifaceted links, we easily learned that both type-1 and type-2 havesimilar complications (red links) and symptoms (green links).
After switching to the symptom view of “Type-1-Diabetes” (illus-trated in Fig. 8(a)) all of the disease’s related symptoms were auto-matically grouped into three clusters according to their disease co-occurrence. The cluster on the left had the most common symptomswith “Type-1-Diabetes”. The cluster on the right had some less com-mon but still relevant symptoms like “losing weight without trying”and “nervousness”. We also found strong outlier patterns in this symp-tom view as illustrated in Fig. 8(b). Some of these patterns were ex-pected and others were more interesting. For example, we found thatfor diabetes “hunger” is related to “increased appetite”; “loss of ap-petite” related to “weight loss” and ”chills”. These visual patterns canhelp explain how different symptoms are connected with each otherand why.
7 EVALUATION
In addition to the case studies above, our system was evaluated quan-titatively through a formal user study and expert interviews.
7.1 Study SetupTo evaluate the effectiveness and efficiency of FacetAtlas in support ofmultifaceted data analysis, we designed and conducted a comparisonstudy. Our study compared the usefulness and usability of FacetAtlas
for a health care application with a baseline system that we developed.The baseline used an improved graph visualization for representingmultiple relations. We used this approach as our baseline for two majorreasons. First, there are no other visualizations beyond FacetAtlas thatare especially designed to visualize the multifaceted entity-relationaldata. Second, the baseline system is implemented based on the Fac-etAtlas framework which provides exactly the same information andsimilar interactions as FacetAtlas to enable a fair comparison. Thebaseline system used a force-based method to cluster related nodes to-gether. However, it doesn’t have other visual cues, such as contourmap used in FacetAtlas for clusters.
To quantitatively and qualitatively evaluate the main design objec-tives of FacetAtlas (i.e., soft clustering and multifaceted relations), wedesigned the following tasks on the healthcare data. T1: identify themajor clusters for a test query; T2: identify the representative mem-bers in the clusters for the query; T3: identify the facet with the mostwithin-cluster connections; T4: identify the facet with the most cross-cluster connections; T5: identify the facet of the two most connectedmembers on the symptom facet; T6: identify the facet with the mostoverall connections across entities. We use the test query “diabetes”based on our experts’ recommendations in order to simulate a com-mon self-care education scenario for chronic diabetic patients. Theoverall scenario demonstrates a concrete use-case of a patient usingFacetAtlas to understand the underlying relations of different diabeticdiseases and complications. From the evaluation perspective, T1-2evaluate the features on soft-clustering visualization (global patterns),and T3-6 evaluate the features on multifaceted connections (local pat-terns).
We recruited 20 participants for our study (8 researchers and 12students majoring in computer science, psychology and mathemat-ics). None had any prior medical or InfoVis background. Inspiredby the repeated-measures study [2], we divided the participants intotwo groups of ten. The first group used our baseline tool for tasks T1,T3, and T5 while the second group used the FacetAtlas for these sametasks. The tool assignment was reversed for tasks T2, T4, and T6 withgroup one using the FacetAtlas. At the beginning of each user session,we gave a brief tutorial of both systems. The participants were thenasked to complete the six tasks.
We recorded two objective measures: task completion time (thetime spent on each task), and task success rate (percentage of the suc-cessful tasks). We computed the mean and standard deviation of taskcompletion time and task success rate across all the users and ques-tions. We also recorded subjective measures via user surveys: useful-ness (how useful a system is for the specific task), usability (how easythe system can be used to complete a specific task), and satisfaction(the number of complaints and favorites on the system features).
7.2 Results and AnalysisThe main findings are (1) FacetAtlas and the baseline system lead tosimilar task success rates across all tasks while (2) FacetAtlas requiressignificantly less time than the baseline to complete the tasks. Themean (M) and standard deviation (SD) of correctness and time costare shown in Fig. 9.
When compared on task success rate, both FacetAtlas and the base-line achieve similarly high accuracy levels. This is because both visu-alization methods display the same underlying information.
The benefit of FacetAtlas becomes evident in the time required tocomplete the tasks. The standard independent t-test shows that whencompared with the baseline system, FacetAtlas has a significant effi-ciency improvement when visualizing the soft-clusters (t(18) = 2.26,p = 0.0064 < .05, two tails), showing an overview of multiple con-nections across clusters (t(18) = 2.26, p = 0.001 < .05, two tails), aswell as representing the details of multifaceted connections betweenentities (t(18) = 2.26, p = 0.003 < .05, two tails). All of these aspectsare key design objectives of FacetAtlas.
The study results also show that FacetAtlas leads to a slight im-provement in finding the most connective facet within a cluster, al-though the difference is not statistically significant (t(18) = 2.26,p = 0.34 > .05, two tails). We believe this is due to the use of a
1179CAO ET AL: FACETATLAS: MULTIFACETED VISUALIZATION FOR RICH TEXT CORPORA
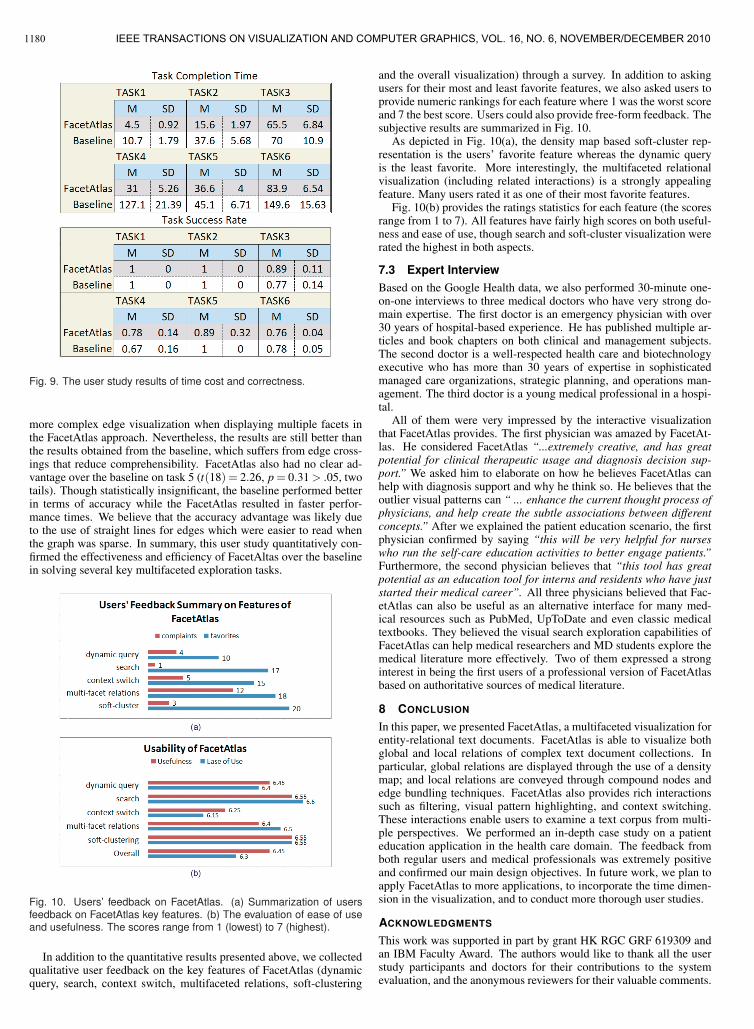
Fig. 9. The user study results of time cost and correctness.
more complex edge visualization when displaying multiple facets inthe FacetAtlas approach. Nevertheless, the results are still better thanthe results obtained from the baseline, which suffers from edge cross-ings that reduce comprehensibility. FacetAtlas also had no clear ad-vantage over the baseline on task 5 (t(18) = 2.26, p = 0.31 > .05, twotails). Though statistically insignificant, the baseline performed betterin terms of accuracy while the FacetAtlas resulted in faster perfor-mance times. We believe that the accuracy advantage was likely dueto the use of straight lines for edges which were easier to read whenthe graph was sparse. In summary, this user study quantitatively con-firmed the effectiveness and efficiency of FacetAltas over the baselinein solving several key multifaceted exploration tasks.
Fig. 10. Users’ feedback on FacetAtlas. (a) Summarization of usersfeedback on FacetAtlas key features. (b) The evaluation of ease of useand usefulness. The scores range from 1 (lowest) to 7 (highest).
In addition to the quantitative results presented above, we collectedqualitative user feedback on the key features of FacetAtlas (dynamicquery, search, context switch, multifaceted relations, soft-clustering
and the overall visualization) through a survey. In addition to askingusers for their most and least favorite features, we also asked users toprovide numeric rankings for each feature where 1 was the worst scoreand 7 the best score. Users could also provide free-form feedback. Thesubjective results are summarized in Fig. 10.
As depicted in Fig. 10(a), the density map based soft-cluster rep-resentation is the users’ favorite feature whereas the dynamic queryis the least favorite. More interestingly, the multifaceted relationalvisualization (including related interactions) is a strongly appealingfeature. Many users rated it as one of their most favorite features.
Fig. 10(b) provides the ratings statistics for each feature (the scoresrange from 1 to 7). All features have fairly high scores on both useful-ness and ease of use, though search and soft-cluster visualization wererated the highest in both aspects.
7.3 Expert InterviewBased on the Google Health data, we also performed 30-minute one-on-one interviews to three medical doctors who have very strong do-main expertise. The first doctor is an emergency physician with over30 years of hospital-based experience. He has published multiple ar-ticles and book chapters on both clinical and management subjects.The second doctor is a well-respected health care and biotechnologyexecutive who has more than 30 years of expertise in sophisticatedmanaged care organizations, strategic planning, and operations man-agement. The third doctor is a young medical professional in a hospi-tal.
All of them were very impressed by the interactive visualizationthat FacetAtlas provides. The first physician was amazed by FacetAt-las. He considered FacetAtlas “...extremely creative, and has greatpotential for clinical therapeutic usage and diagnosis decision sup-port.” We asked him to elaborate on how he believes FacetAtlas canhelp with diagnosis support and why he think so. He believes that theoutlier visual patterns can “ ... enhance the current thought process ofphysicians, and help create the subtle associations between differentconcepts.” After we explained the patient education scenario, the firstphysician confirmed by saying “this will be very helpful for nurseswho run the self-care education activities to better engage patients.”Furthermore, the second physician believes that “this tool has greatpotential as an education tool for interns and residents who have juststarted their medical career”. All three physicians believed that Fac-etAtlas can also be useful as an alternative interface for many med-ical resources such as PubMed, UpToDate and even classic medicaltextbooks. They believed the visual search exploration capabilities ofFacetAtlas can help medical researchers and MD students explore themedical literature more effectively. Two of them expressed a stronginterest in being the first users of a professional version of FacetAtlasbased on authoritative sources of medical literature.
8 CONCLUSION
In this paper, we presented FacetAtlas, a multifaceted visualization forentity-relational text documents. FacetAtlas is able to visualize bothglobal and local relations of complex text document collections. Inparticular, global relations are displayed through the use of a densitymap; and local relations are conveyed through compound nodes andedge bundling techniques. FacetAtlas also provides rich interactionssuch as filtering, visual pattern highlighting, and context switching.These interactions enable users to examine a text corpus from multi-ple perspectives. We performed an in-depth case study on a patienteducation application in the health care domain. The feedback fromboth regular users and medical professionals was extremely positiveand confirmed our main design objectives. In future work, we plan toapply FacetAtlas to more applications, to incorporate the time dimen-sion in the visualization, and to conduct more thorough user studies.
ACKNOWLEDGMENTS
This work was supported in part by grant HK RGC GRF 619309 andan IBM Faculty Award. The authors would like to thank all the userstudy participants and doctors for their contributions to the systemevaluation, and the anonymous reviewers for their valuable comments.
1180 IEEE TRANSACTIONS ON VISUALIZATION AND COMPUTER GRAPHICS, VOL. 16, NO. 6, NOVEMBER/DECEMBER 2010
REFERENCES
[1] K. Andrews, W. Kienreich, V. Sabol, J. Becker, G. Droschl, F. Kappe,
M. Granitzer, P. Auer, and K. Tochtermann. The infosky visual explorer:
exploiting hierarchical structure and document similarities. InformationVisualization, 1(3/4):166–181, 2002.
[2] R. Bakeman and B. Robinson. Understanding statistics in the behavioral
sciences. pages 246–247, 2005.
[3] M. Balzer and O. Deussen. Level-of-detail visualization of clustered
graph layouts. In the 6th International Asia-Pacific Symposium on Vi-sualization., pages 133–140, 2007.
[4] J. Bertin. Semiology of graphics. University of Wisconsin Press, 1983.
[5] N. Cao, S. Liu, L. Tan, and X. Zhou. Interactive Poster : Context-
Preserving Dynamic Graph Visualization. In IEEE Symposium on In-formation Visualization, 2008.
[6] S. Card, J. Mackinlay, and B. Shneiderman. Readings in informationvisualization: using vision to think. Morgan Kaufmann, 1999.
[7] Y. Chen, L. Wang, M. Dong, and J. Hua. Exemplar-based Visualiza-
tion of Large Document Corpus. IEEE Transactions on Visualization andComputer Graphics, 15(6):1161–1168, 2009.
[8] M. W. Christopher Collins, Fernanda B. Viegas. Parallel Tag Clouds to
Explore and Analyze Faceted Text Corpora. In IEEE Symposium on Vi-sual Analytics Science and Technology (VAST), pages 91 – 98, 2009.
[9] J. Clark. http://neoformix.com/. Neoformix Blog, March 2009.
[10] P. Cortese, G. Di Battista, A. Moneta, M. Patrignani, and M. Pizzonia.
Topographic Visualization of Prefix Propagation in the Internet. IEEETransactions on Visualization and Computer Graphics, 12(5):725–732,
2006.
[11] W. Cui, H. Zhou, H. Qu, P. C. Wong, and X. Li. Geometry-based edge
clustering for graph visualization. IEEE Transactions on Visualizationand Computer Graphics, 14(6):1277–1284, 2008.
[12] Y. Hassan-Montero and V. Herrero-Solana. Improving tag-clouds as
visual information retrieval interfaces. In International Conference onMultidisciplinary Information Sciences and Technologies, pages 25–28,
2006.
[13] S. Havre, B. Hetzler, and L. Nowell. ThemeRiver: Visualizing theme
changes over time. In IEEE Symposium on Information Vizualization,
pages 115–123, 2000.
[14] J. Heer and D. Boyd. Vizster: Visualizing online social networks. In
IEEE Symposium on Information Visualization, pages 32–39, 2005.
[15] I. Herman, G. Melancon, and M. Marshall. Graph visualization and nav-
igation in information visualization: A survey. IEEE Transactions onVisualization and Computer Graphics, 6(1):24–43, 2000.
[16] D. Holten. Hierarchical edge bundles: Visualization of adjacency rela-
tions in hierarchical data. IEEE Transactions on Visualization and Com-puter Graphics, 12(5):741–748, 2006.
[17] T. Iwata, T. Yamada, and N. Ueda. Probabilistic latent semantic visualiza-
tion: topic model for visualizing documents. In the 14th ACM SIGKDDinternational conference on Knowledge discovery and data mining, pages
363–371. ACM, 2008.
[18] B. Lee, G. Smith, G. G. Robertson, M. Czerwinski, and D. S. Tan.
Facetlens: exposing trends and relationships to support sensemaking
within faceted datasets. In CHI 09: the 27th international conferenceon Human factors in computing systems, 2009.
[19] Y.-R. Lin, J. Sun, N. Cao, and S. Liu. Contextour: Contextual contour
visual analysis on dynamic multi- relational clustering. In SIAM DataMining Conference(accepted), 2010.
[20] N. Miller, P. Wong, M. Brewster, and H. Foote. TOPIC ISLANDS - a
wavelet-based text visualization system. In IEEE Visualization, pages
189–196, 1998.
[21] Z. Shen, K. Ma, and T. Eliassi-Rad. Visual analysis of large hetero-
geneous social networks by semantic and structural abstraction. IEEETransactions on Visualization and Computer Graphics, 12(6):1427–
1439, 2006.
[22] O. Side, H. Store, V. Us, H. Page, P. Alumni, H. Studying, V. Scholars,
C. Websites, and A. Sponsorship. Balancing systematic and flexible ex-
ploration of social networks. IEEE Transactions on Visualization andComputer Graphics, 12(5):693–700, 2006.
[23] G. Smith, M. Czerwinski, B. Meyers, D. Robbins, G. Robertson, and
D. Tan. FacetMap: A Scalable Search and Browse Visualization. IEEETransactions on Visualization and Computer Graphics, 12(5):797–804,
2006.
[24] H. Strobelt, D. Oelke, C. Rohrdantz, A. Stoffel, D. Keim, and O. Deussen.
Document Cards: A Top Trumps Visualization for Documents. IEEETransactions on Visualization and Computer Graphics, 15(6):1145–
1152, 2009.
[25] J. Thomas and M. Schneider. Human factors in computer systems. Ablex
Pub, 1984.
[26] B. Turlach. Bandwidth selection in kernel density estimation: A review.
CORE and Institut de Statistique, pages 23–493, 1993.
[27] F. van Ham and A. Perer. Search, Show Context, Expand on Demand
: Supporting Large Graph Exploration with Degree-of-Interest. IEEETransactions on Visualization and Computer Graphics, 15(6):953–960,
2009.
[28] F. van Ham, M. Wattenberg, and F. Viegas. Mapping text with phrase nets.
IEEE transactions on visualization and computer graphics, 15(6):1169–
1176, 2009.
[29] F. Viegas, M. Wattenberg, and J. Feinberg. Participatory Visualization
with Wordle. IEEE Transactions on Visualization and Computer Graph-ics, 15(6):1137–1144, 2009.
[30] M. Wattenberg and B. Fernanda. The word tree, an interactive visual con-
cordance. IEEE Transactions on Visualization and Computer Graphics,
14(6):1221–1228, 2008.
[31] J. Wise, J. Thomas, K. Pennock, D. Lantrip, M. Pottier, A. Schur,
V. Crow, and W. Richland. Visualizing the Non-Visual: Spatial analysis
and interaction with information from text documents. In IEEE Sympo-sium on Information Visualization, page 51, 1995.
[32] H. Zhou, X. Yuan, H. Qu, W. Cui, and B. Chen. Visual clustering in
parallel coordinates. Comput. Graph. Forum, 27(3):1047–1054, 2008.
1181CAO ET AL: FACETATLAS: MULTIFACETED VISUALIZATION FOR RICH TEXT CORPORA