Embed Size (px)
Citation preview

2013
BIOMETRICS
Facial Recognition System Developing an algorithm for facial recognition
system using Image processing in Matlab
T. Lavanya,EEE,NITK
Under the guidance of Professor DR. K.B.Raja, Department of Electronics and
Communication, UVCE, Bangalore.
1
1.INTRODUCTION
Biometrics:
Biometrics or biometric authentication refers to the identification of
humans by their characteristics or traits (distinguishing features). It is
used as a form of identification, and access control, also to identify
individuals in groups that are under surveillance. Biometric identifiers
are the distinctive, measurable characteristics used to label and describe
individuals. They are often categorized as physiological versus
behavioral characteristics.
1. Physiological characteristics are related to the shape of the body.
Examples include fingerprint, face recognition, DNA, Palm print,
hand geometry, iris recognition, retina and odour /scent.
2. Behavioral characteristics are related to the behavior of a person,
including typing rhythm, gait, and voice.
Behaviometrics has been coined by researchers to describe the latter
class of biometrics.
What is the need for Biometrics?
Access control through token based identification systems, such as a
driver's license or passport, and knowledge based identification systems,
such as a password or personal identification number have become
traditional ways and turned to be inefficient. Since biometric identifiers
are unique to individuals, they are more reliable in verifying identity
than token and knowledge based methods leads to opt biometrics
2
How does Biometrics function?
Different aspects of human physiology, chemistry or behavior can be
used for biometric authentication. The selection of a particular biometric
for use in a specific application involves a weighting of several factors.
Jain et al. (1999) has identified seven such factors to be used when
assessing the suitability of any trait for use in biometric authentication.
1. Universality means that every person using a system should
possess the trait.
2. Uniqueness means the trait should be sufficiently different for
individuals in the relevant population such that they can be
distinguished from one another.
3. Permanence relates to the manner in which a trait varies over
time. More specifically, a trait with 'good' permanence will be
reasonably invariant over time with respect to the specific
matching algorithm.
4. Measurability (collectability) relates to the ease of acquisition or
measurement of the trait. In addition, acquired data should be in a
form that permits subsequent processing and extraction of the
relevant feature sets.
5. Performance relates to the accuracy, speed, and robustness of
technology used.
6. Acceptability relates to how well individuals in the relevant
population accept the technology such that they are willing to have
their biometric trait captured and assessed.
7. Circumvention relates to the ease with which a trait might be
imitated using an artifact or substitute.
No single biometric will meet all the requirements of every
possible application.

3
Basic block diagram of a biometric system in 2 modes
In verification mode the system performs a one-to-one comparison of a
captured biometric with a specific template stored in a biometric
database in order to verify the individual is the person they claim to be.
Three steps involved in person verification.
In the first step, reference models for all the users are generated and
stored in the model database.
In the second step, some samples are matched with reference models to
generate the genuine and impostor scores and calculate the threshold.
Third step is the testing step. This process may use a smart card,
username or ID number (e.g. PIN) to indicate which template should be
used for comparison. 'Positive recognition' is a common use of
verification mode, "where the aim is to prevent multiple people from
using same identity".

4
The first time an individual uses a biometric system is called enrollment.
During the enrollment, biometric information from an individual is
captured and stored. In subsequent uses, biometric information is
detected and compared with the information stored at the time of
enrollment. Note that it is crucial that storage and retrieval of such
systems themselves be secure if the biometric system is to be robust.
The first block (sensor) is the interface between the real world and the
system; it has to acquire all the necessary data.
The second block performs all the necessary pre-processing: it has to
remove artifacts from the sensor, to enhance the input (e.g. removing
background noise), to use some kind of normalization, etc.
In the third block necessary features are extracted. This step is an
important step as the correct features need to be extracted in the optimal
way. A vector of numbers or an image with particular properties is used
to create a template. A template is a synthesis of the relevant
characteristics extracted from the source.
Elements of the biometric measurement that are not used in the
comparison algorithm are discarded in the template to reduce the file
size and to protect the identity of the enrollee.
If enrollment is being performed, the template is simply stored
somewhere (within a database). If a matching phase is being performed,
the obtained template is passed to a matcher that compares it with other
existing templates, estimating the distance between them using any
algorithm (e.g. Hamming distance). The matching program will analyze
the template with the input. This will then be output for any specified
use or purpose (e.g. entrance in a restricted area)

5
Performance:
The following are used as performance metrics for biometric systems:
False Accept Rate Or False Match Rate (FAR or FMR): The
probability that the system incorrectly matches the input pattern to a
non-matching template in the database. It measures the percent of
invalid inputs which are incorrectly accepted. In case of similarity scale,
if the person is imposter in real, but the matching score is higher than the
threshold then he is treated as genuine and that increases the FAR and
hence performance also depends upon the selection of threshold value.
False Reject Rate Or False Non-Match Rate (FRR Or FNMR): The
probability that the system fails to detect a match between the input
pattern and a matching template in the database. It measures the percent
of valid inputs which are incorrectly rejected.
Receiver Operating Characteristic Or Relative Operating
Characteristic (ROC): The ROC plot is a visual characterization of the
trade-off between the FAR and the FRR. In general, the matching
algorithm performs a decision based on a threshold which determines
how close to a template the input needs to be for it to be considered a
match. If the threshold is reduced, there will be fewer false non-matches
but more false accepts. Correspondingly, a higher threshold will reduce
the FAR but increase the FRR. A common variation is the Detection
error trade-off (DET), which is obtained using normal deviate scales on
both axes. This more linear graph illuminates the differences for higher
performances (rarer errors).
Equal Error Rate Or Crossover Error Rate (EER Or CER): The rate
at which both accept and reject errors are equal. The value of the EER
can be easily obtained from the ROC curve. The EER is a quick way to

6
compare the accuracy of devices with different ROC curves. In general,
the device with the lowest EER is most accurate.
Failure To Enroll Rate (FTE Or FER): The rate at which attempts to
create a template from an input is unsuccessful. This is most commonly
caused by low quality inputs.
Failure To Capture Rate (FTC): Within automatic systems, the
probability that the system fails to detect a biometric input when
presented correctly.
Template Capacity: The maximum number of sets of data which can
be stored in the system.
Selection of biometrics in any practical application depending upon the
characteristic measurements and user requirements We should consider
Performance, Acceptability, Circumvention, Robustness, Population
coverage, Size, Identity theft deterrence in selecting a particular
biometric. Selection of biometric based on user requirement considers
Sensor availability, Device availability, Computational time and
reliability, Cost, Sensor area and power consumption.
As a proverb says, “face is the index of mind”, face is the first and
foremost feature in a human being which distinguishes one from
another. A person is identified or remembered by his face which is
unique for every person (except in some cases). Using biometrics of
facial recognition is preferred since many systems which require
access control has the identity as the image of face of the person rather
than signature, palm or finger print and if surveillance cameras are
being used it is easy to capture ones face without the person knowing
it, which is not possible with signature, palm or finger print.

7
2. FACIAL RECOGNITION SYSTEM
A facial recognition system is a computer application for
automatically identifying or verifying a person from a digital image
or a video frame from a video source. One of the ways to do this is by
comparing selected facial features from the image and a facial
database. It is typically used in security systems.
Facial recognition algorithms identify facial features by extracting
landmarks, or features, from an image of the subject's face. For
example, an algorithm may analyze the relative position, size, and/or
shape of the eyes, nose, cheekbones, and jaw. These features are then
used to search for other images with matching features. Other
algorithms normalize a gallery of face images and then compress the
face data, only saving the data in the image that is useful for face
detection. A probe image is then compared with the face data. One of
the earliest successful systems is based on template matching
techniques applied to a set of salient facial features, providing a sort
of compressed face representation. Recognition algorithms can be
divided into two main approaches, geometric, which look at
distinguishing features, or photometric, which is a statistical approach
that distills an image into values and compares the values with
templates to eliminate variances.
In the present world face recognition finds it use in every walk of life.
Starting with smart phones, digital cameras, tabs, laptops and
televisions, all are coming with this feature of face recognition
enabling their use in more personalized way. Almost every place
either a public place like banks, airports, government offices,
universities or private (business) places like shopping malls are being
watched by surveillance cameras which can be used for tracking a
suspicious person or in general anyone using face recognition.

8
Google's Picasa digital image organizer has a built in face recognition
system.
Sony's Picture Motion Browser (PMB) analyses photo, associates
photos with identical faces so that they can be tagged accordingly,
and differentiates between photos with one person, many persons and
nobody.
Windows Live Photo Gallery includes face recognition
Apple's iPhoto image organizer has a feature named Faces which
allows users to associate names to faces in a series of photographs.
The software then proposes other matching faces it locates in the
photo library and gradually refines its recognition, according to the
user's acceptance, denial or renaming of the proposed face.
Even social networking sites like facebook use tagging photos of a
person based on this facial recognition
This technology could be used as a security measure at ATM’s; where
the ATM would capture an image of your face, and compare it to your
photo in the bank database to confirm your identity.
This same concept is being used in computers by using a webcam to
capture a digital image of your face which replaces the necessity of
password as a means to log-in.
Another use could be a portable device to assist people with
prosopagnosia in recognizing their acquaintances.
COMPARITIVE STUDY: Though facial recognition is used widely,
among the different biometric techniques, facial recognition may not be
the most reliable and efficient. However, one key advantage is that it
does not require aid (or consent) from the test subject. Properly designed
systems installed in airports, multiplexes, and other public places can
identify individuals among the crowd. Other biometrics like fingerprints,
iris scans, and speech recognition cannot perform this kind of mass
identification. However, questions have been raised on the effectiveness
of facial recognition software in cases of railway and airport security.

9
Two algorithms are being used in this project, first is using preprocessed
image, i.e. comparison of images in spatial domain by considering the
pixel values.
Algorithm 1: Spatial domain
In general the face recognition is carried out in four phases
a) Image Acquisition
b) Preprocessing
c) Feature Extraction and
d) Matching
Database Face images Text face images
Resize (128*128)
Co-efficient vector
Euclidian Distance classifier
Face image match/non match
a) Image Acquisition: Images are acquired from open source
databases like ORL, JAFFE, Indian male, Indian female and more.
Images in each database consist of various images of each person
taken at different modes such as variation in pose, illumination,
facial expressions and with different accessories

10
i) At variety of pose angles to permit testing of pose invariance
ii) With a wide variety of illumination angles to permit testing of
illumination invariance and
iii) Under a variety of commonly encountered illumination color
temperatures to permit testing of illumination color invariance.
b) Preprocessing: Preprocessing is done to extract the features of the image with minimal
difficulties such as resizing the image. Resizing makes all the images in
the database into a particular size which is common to all the images.
c) Feature Extraction:
From the preprocessed images features are extracted, in this project, the
pixel values of each image are stored in a vector and all the images to be
considered in the database are stored in the form of vector of size equal
to the total number of images.
If a database is considered with n persons and m images of each person,
a database should be created which contains x (say x<n) persons and y
(say y<m) images of each person and the remaining persons and images
are considered for test database.
The first three steps are common for both database and test database.
d) Matching: The features of database and test database are compared by using a
classifier which in this case is Euclidean distance. Each test image is
compared with every image present in the database. The Euclidean
distance is zero if same image is considered. If test image belongs to a
person whose images are already there in database, then the resulting
Euclidean distance should be minimum or else it should be maximum.
Implementation using Matlab: Based on the above algorithm, a matlab code has been developed to
calculate, plot the performance parameters namely FAR,FRR,TSR and
obtain EER from the results. JAFFE Database is being considered.
Results for one test case are shown below:
No of persons in database=7; No of persons in test database=10;
No of images of each person in database=12; Test image=17;
Image size = 128*128;

11
1. FRR versus Threshold
2. FAR versus Threshold

12
3. TSR versus Threshold
4. FAR, FRR and TSR versus threshold

13
The EER is 0.142857 corresponding to the optimum threshold of
0.449611
The TSR is 0.857143 corresponding to the optimum threshold of
0.449611
Database: JAFFE
The following table gives the details of results when the same algorithm
and Matlab code applied on various test images by changing number of
persons in database, number of images of each person and test image.
No. of
persons
in
database
No. of
persons
out of
database
Number
of
images
of each
person
Number
of the
test
image
EER TSR Optimum
threshold
preprocessed
5 5 15 17 0.100000 0.900000 0.432737
5 5 15 18 0.000000 1.000000 0.411111
5 5 15 19 0.200000 0.800000 0.455770
5 5 15 20 0.200000 0.800000 0.458616
7 3 15 17 0.000000 1.000000 0.444960
7 3 15 18 0.000000 1.000000 0.459256
7 3 15 19 0.142857 0.857143 0.462261
7 3 15 20 0.142857 0.857143 0.482867
6 4 15 17 0.000000 1.000000 0.452415
6 4 15 18 0.000000 1.000000 0.441222
6 4 15 19 0.181818 0.818182 0.455621
6 4 15 20 0.166667 0.833333 0.464738
7 3 12 13 0.000000 1.000000 0.445503
7 3 12 15 0.000000 1.000000 0.477148
7 3 12 17 0.142857 0.857143 0.452712
It has been observed the algorithm gives EER values in the range of 0.20
to 0.00 and TSR values in range of 0.80 to 1.00 for this database.

14
Algorithm 2: Using DWT on preprocessed image (Discrete wavelet
transform)
Discrete Wavelet Transform:
The transform of a signal is just another form of representing the signal.
It does not change the information content present in the signal. The
Wavelet Transform provides a time-frequency representation of the
signal. It was developed to overcome the short coming of the Short Time
Fourier Transform (STFT), which can also be used to analyze non
stationary signals. While STFT gives a constant resolution at all
frequencies, the Wavelet Transform uses multi-resolution technique by
which different frequencies are analyzed with different resolutions.
A wave is an oscillating function of time or space and is periodic. In
contrast, wavelets are localized waves. The figure shown below gives
the demonstration of a wave and a wavelet. They have their energy
concentrated in time or space and are suited to analysis of transient
signals. While Fourier Transform and STFT use waves to analyze
signals, the Wavelet Transform uses wavelets of finite energy.
Demonstration of Wave

15
Demonstration of Wavelet
The wavelet analysis is done similar to the STFT analysis. The signal to
be analyzed is multiplied with a wavelet function just as it is multiplied
with a window function in STFT, and then the transform is computed for
each segment generated. However, unlike STFT, in Wavelet Transform,
the width of the wavelet function changes with each spectral component.
The Wavelet Transform, at high frequencies, gives good time resolution
and poor frequency resolution, while at low frequencies the Wavelet
Transform gives good frequency resolution and poor time resolution.
The Wavelet Series is just a sampled version of CWT and its
computation may consume significant amount of time and resources,
depending on the resolution required. The Discrete Wavelet Transform
(DWT), which is based on sub-band coding is found to yield a fast
computation of Wavelet Transform. It is easy to implement and reduces
the computation time and resources required. In CWT, the signals are
analyzed using a set of basis functions which relate to each other by
simple scaling and translation. In the case of DWT, a time-scale
representation of the digital signal is obtained using digital filtering
techniques. The signal to be analyzed is passed through filters with
different cutoff frequencies at different scales

16
One Dimensional Discrete Wavelet Transform Two-Channel Perfect Reconstruction Filter Bank: The analysis filter bank decomposes the input signal x (n) into two sub
band signals, L (n) and H (n). The signal L (n) represents the low
frequency (coarse) part of x (n), while the signal H (n) represents the
high frequency (or detail) part of x (n). The analysis filter bank first
filters x (n) using a low pass and a high pass filter. We denote the low
pass filter by af1 (analysis filter 1) and the high pass filter by af2
(analysis filter 2). As shown in the figure 3.2, the output of each filter is
then down-sampled by 2 to obtain the two sub band signals, L (n) and
H (n).
Reconstruction filter band
The synthesis filter bank combines the two sub band signals L (n) and
H (n) to obtain a single signal y(n). The synthesis filter bank first up-
samples each of the two sub band signals. The signals are then filtered
using a low pass and a high pass filter. We denote the low pass filter by
sf1 (synthesis filter 1) and the high pass filter by sf2 (synthesis filter 2).
The signals are then added together to obtain the signal y (n). If the four
filters are designed so as to guarantee that the output signal y (n) equals
the input signal x (n), then the filters are said to satisfy the perfect
reconstruction condition.

17
Assume the input signal x (n) is of length N. For convenience, we will
like the sub-band signals L (n) and H (n) to each be of length N/2.
However, these sub-band signals will exceed this length by L1/2, where
L1 is the length of the analysis filters. To avoid this excessive length, the
last L1/2 samples of each sub-band signal is added to the first L1/2
samples. This procedure (periodic extension) can create undesirable
artifacts at the beginning and end of the sub-band signals, however, it is
the most convenient solution. When the analysis and synthesis filters are
exactly symmetric, a different procedure (symmetric extension) can be
used, that avoids the artifacts associated with periodic extension. A
second detail also arises in the implementation of the perfect
reconstruction filter bank. If all four filters are causal, then the output
signal y(n) will be a translated (or circularly shifted) version of x(n). To
avoid this, we perform a circular shift operation in both the analysis and
synthesis filter banks.
Discrete Wavelet Transform (Iterated Filter Banks)
The Discrete Wavelet Transform (DWT) gives a multiscale
representation of a signal x(n). The DWT is implemented by iterating
the 2-channel analysis filter bank described above. Specially, the DWT
of a signal is obtained by recursively applying the lowpass/highpass
frequency decomposition to the lowpass output as illustrated in the
diagram 3.3. The diagram illustrates a 3-scale DWT. The DWT of the
signal x is the collection of subband signals. The inverse DWT is
obtained by iteratively applying the synthesis filter bank.

18
2-Dimensional Discrete Wavelet Transform
2-D Filter Banks
To use the wavelet transform for image processing we must implement a
2D version of the analysis and synthesis filter banks. In the 2D case, the
1D analysis filter bank is first applied to the columns of the image and
then applied to the rows. If the image has M rows and N columns, then
after applying the 1D analysis filter bank to each column we have two
sub-band images, each having M/2 rows and N columns; after applying
the 1D analysis filter bank to each row of both of the two sub-band
images, we have four sub-band images, each having M/2 rows and N/2
columns. This is illustrated in the diagram below. The 2D synthesis filter
bank combines the four sub-band images to obtain the original image of
size M by N.
One stage in multi-resolution wavelet decomposition of an image
2D Discrete Wavelets
Like in the 1D case, the 2D discrete wavelet transform of a signal x is
implemented by iterating the 2D analysis filter bank on the low pass

19
sub-band image. In this case, at each scale there are three sub-bands
instead of one.
There are three wavelets associated with the 2D wavelet transform. The
following figure illustrates three wavelets as gray scale images.
Note that the first two wavelets are oriented in the vertical and
horizontal directions; however, the third wavelet does not have a
dominant orientation. The third wavelet mixes two diagonal orientations,
which gives rise to the checkerboard artifact.
Advantages of Discrete wavelet transform
1. It gives information about both time and frequency of the signal.
2. Transform of a non stationary signal is efficiently obtained.
3. Reduces the size without losing much of resolution
4. Reduces redundancy.
5. Reduces computational time
Disadvantages of DWT:
1. Lack of shift invariance.
2. Lack of directional selectivity for higher dimensionality.
3. Unsatisfactory reconstruction.
4. It has more redundancy compare to DTCWT
20
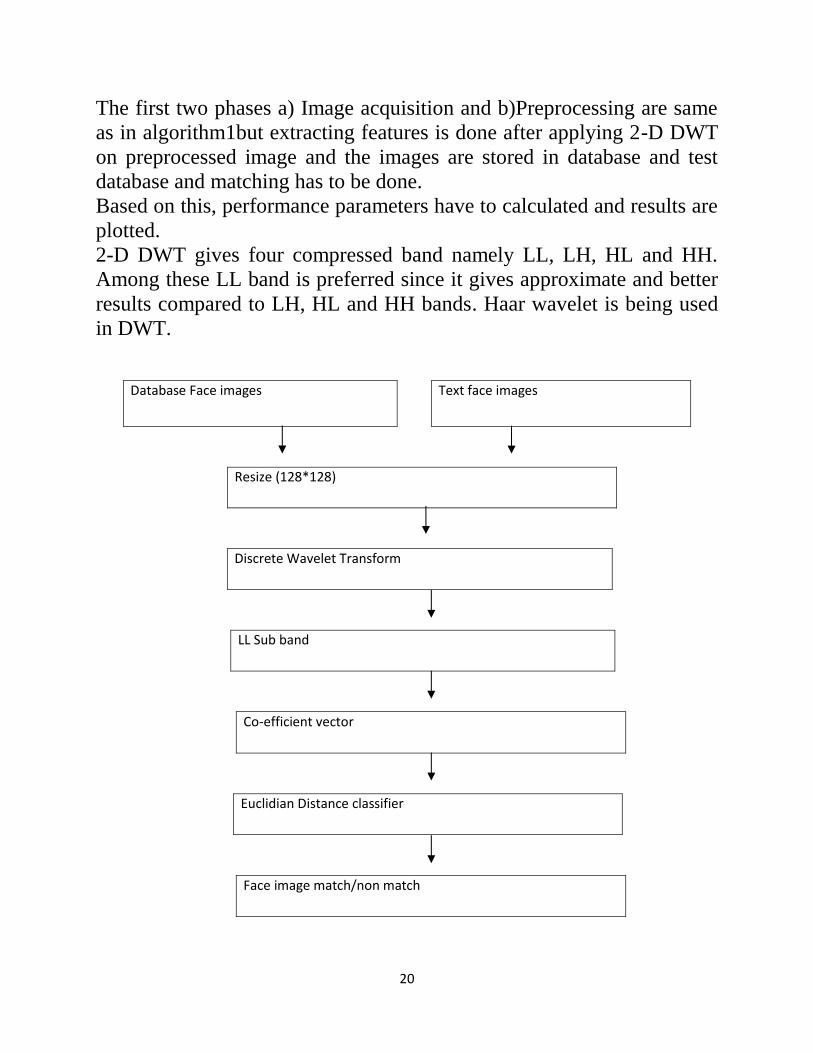
The first two phases a) Image acquisition and b)Preprocessing are same
as in algorithm1but extracting features is done after applying 2-D DWT
on preprocessed image and the images are stored in database and test
database and matching has to be done.
Based on this, performance parameters have to calculated and results are
plotted.
2-D DWT gives four compressed band namely LL, LH, HL and HH.
Among these LL band is preferred since it gives approximate and better
results compared to LH, HL and HH bands. Haar wavelet is being used
in DWT.
Database Face images Text face images
Resize (128*128)
Discrete Wavelet Transform
LL Sub band
Co-efficient vector
Euclidian Distance classifier
Face image match/non match

21
Implementation with matlab: 2-D Dwt can be calculated in matlab
using an inbuilt command by choosing required wavelet/ wave filter.
In this test case2-D Dwt is calculated using ‘haar’ wavelet for JAFFE
Database choosing No of persons in database=7;
No of persons in test database=10;
No of images of each person in database=15; Test image=19
FRR versus Threshold

22
FAR versus Threshold
TSR versus Threshold

23
The EER is 0.200000 corresponding to the optimum threshold of
0.432602
The TSR is 0.800000 corresponding to the optimum threshold of
0.432602

24
DATABASE: JAFFE No. of
persons in
database
No. of
persons
out of
database
Number
of images
of each
person
Number
of the test
image
Optimum
threshold
2-D DWT
EER TSR
5 5 15 17 0.408196 0.100000 0.900000
5 5 15 18 0.383855 0.000000 1.000000
5 5 15 19 0.429051 0.200000 0.800000
5 5 15 20 0.432277 0.200000 0.800000
7 3 15 17 0.428339 0.000000 1.000000
7 3 15 18 0.431603 0.000000 1. 000000
7 3 15 19 0.432602 0.200000 0.800000
7 3 15 20 0.462472 0.142857 0.857143
6 4 15 17 0.426365 0.000000 1.000000
6 4 15 18 0.414367 0.000000 1.000000
6 4 15 19 0.432112 0.166667 0.833333
6 4 15 20 0.435446 0.166667 0.833333
7 3 12 20 0.473635 0.142857 0.857143
7 3 12 13 0.429423 0.000000 1.000000
7 3 12 15 0.450294 0.000000 1.000000
7 3 12 16 0.471678 0.000000 1.000000
7 3 12 18 0.431603 0.000000 1.000000
7 3 12 17 0.431552 0.100000 0.900000
7 3 12 19 0.441888 0.142857 0.857143
By varying the number of persons in database, number of images of each
person and test images, the values of EER and TSR are being calculated.
EER is the point of intersection of FAR and FRR at optimal
threshold, the lower the value of EER, the better is the algorithm
Also higher TSR value at EER shows how adaptable and robust
the algorithm is.
Creating a database and test database with images is demonstrated by
an example, consisting of 3 persons each with 8 images in database
and test database with 9th
image of 4 persons among which 3 are in
database and 1 out of database.

25
JAFFE Database: Images in database
Person 1:
Person 2:
Person 3:

26
Test database:
RESULTS ON DIFFERENT DATABASES:
ORL-FACES
No. of
persons
in
database
No. of
persons
out of
database
Number
of
images
of each
person
Number
of the
test
image
Optimum
threshold
EER TSR
20 20 8 10 0.403162 0.050000 0.950000
20 20 8 9 0.440096 0.100000 0.900000
20 20 7 8 0.426077 0.100000 0.900000
20 20 7 9 0.440096 0.100000 0.900000
20 20 7 10 0.397508 0.050000 0.950000
25 15 7 8 0.392461 0.123077 0.876923
25 15 7 9 0.404316 0.133333 0.866667
25 15 7 10 0.387847 0.075000 0.925000
30 10 7 10 0.371744 0.066667 0.933333
30 10 7 9 0.373902 0.183333 0.816667
30 10 7 8 0.388620 0.114286 0.885714
27
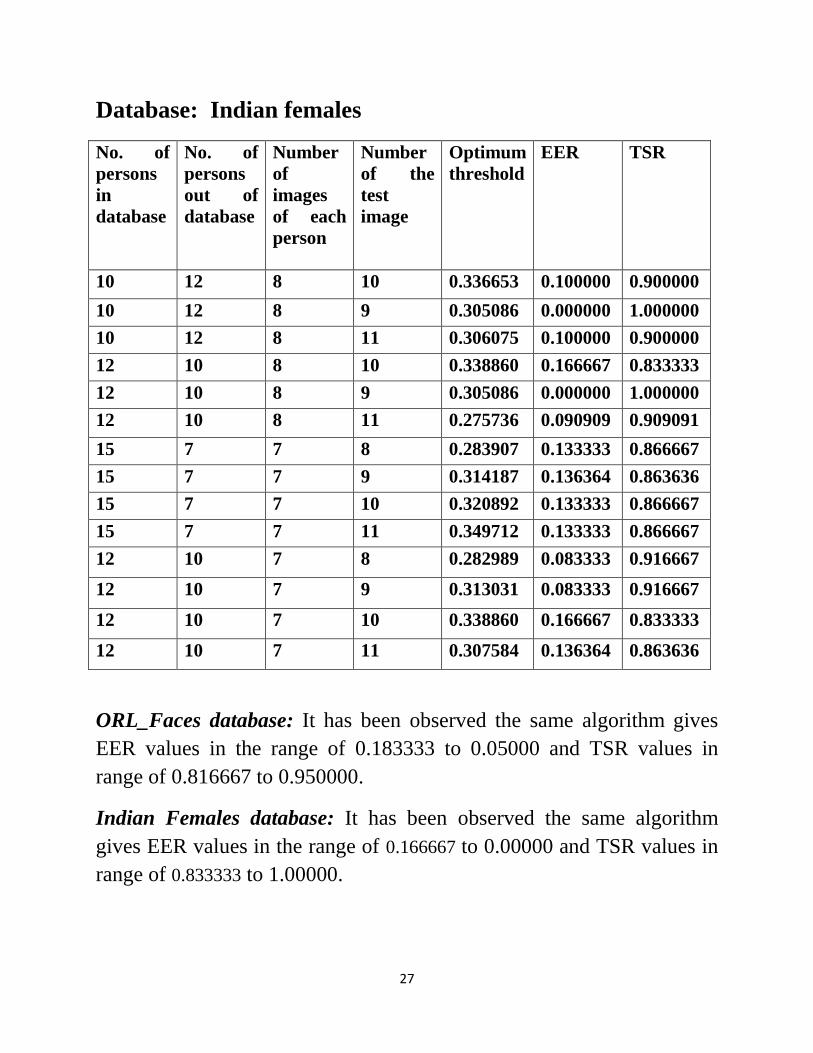
Database: Indian females
No. of
persons
in
database
No. of
persons
out of
database
Number
of
images
of each
person
Number
of the
test
image
Optimum
threshold
EER TSR
10 12 8 10 0.336653 0.100000 0.900000
10 12 8 9 0.305086 0.000000 1.000000
10 12 8 11 0.306075 0.100000 0.900000
12 10 8 10 0.338860 0.166667 0.833333
12 10 8 9 0.305086 0.000000 1.000000
12 10 8 11 0.275736 0.090909 0.909091
15 7 7 8 0.283907 0.133333 0.866667
15 7 7 9 0.314187 0.136364 0.863636
15 7 7 10 0.320892 0.133333 0.866667
15 7 7 11 0.349712 0.133333 0.866667
12 10 7 8 0.282989 0.083333 0.916667
12 10 7 9 0.313031 0.083333 0.916667
12 10 7 10 0.338860 0.166667 0.833333
12 10 7 11 0.307584 0.136364 0.863636
ORL_Faces database: It has been observed the same algorithm gives
EER values in the range of 0.183333 to 0.05000 and TSR values in
range of 0.816667 to 0.950000.
Indian Females database: It has been observed the same algorithm
gives EER values in the range of 0.166667 to 0.00000 and TSR values in
range of 0.833333 to 1.00000.

28
Indian Males
No. of
persons
in
database
No. of
persons
out of
database
Number
of images
of each
person
Number
of the test
image
Optimum
threshold
EER TSR
10 10 7 8 0.355908 0.100000 0.900000
10 10 7 9 0.378676 0.300000 0.700000
10 10 6 9 0.382884 0.250000 0.750000
10 10 6 8 0.373269 0.200000 0.800000
10 10 6 7 0.410954 0.300000 0.700000
15 5 7 8 0.285325 0.600000 0.400000
15 5 7 9 0.424989 0.500000 0.500000
12 8 7 8 0.318291 0.083333 0.916667
12 8 7 9 0.326656 0.431818 0.568182
15 5 5 6 0.325532 0.466667 0.533333
15 5 5 7 0.351491 0.457143 0.542857
15 5 5 8 0.286484 0.600000 0.400000
15 5 5 9 0.305127 0.500000 0.500000
The same algorithm is being applied on different databases such as
ORL_Faces, Indian Male and Indian female. Better results are observed
in case of ORL_Faces and not so good results on Indian Males.
Improvement of the algorithm can be done by applying more levels of
DWT or using advanced techniques like DTCWT i.e. Dual Tree
Continuous Wavelet Transform and Complex DTCWT.

29
The following table gives the results of a test case when DWT is applied
using different filters are used such as haar, Daubechies, Coiflets,
Symlets and Discrete Meyer. The values of some of the filters are
similar and that is due to the similarity in the wave function of the
wavelet. The feature size of the DWT may differ for different wavelet
like symlets give feature size of 129 whereas all Daubechies give
feature size as half of the preprocessed image size
Wavelet
filter
No. of
persons
in
database
No. of
persons
out of
database
Number
of
images
of each
person
Number
of the
test
image
Optimum
threshold
EER TSR
‘Haar’
or ‘db1’
7 3 12 17 0.431552 0.100000 0.900000
‘db2’ 7 3 12 17 0.439712 0.142857 0.857143
‘db3’ 7 3 12 17 0.443662 0.100000 0.900000
‘db5’ 7 3 12 17 0.444544 0.142857 0.857143
‘db10’ 7 3 12 17 0.461352 0.100000 0.900000
'coif1 7 3 12 17 0.443977 0.142857 0.857143
'sym2' 7 3 12 17 0.439712 0.142857 0.857143
'dmey' 7 3 12 17 0.770870 0.000000 1.000000

30
These are the results obtained when different bands such as LL, LH, HL
and HH bands are considered for feature extraction and matching. It has
been observed that better results are obtained for LL i.e. low-low band
which is generally used and good results for HL i.e. High-Low band.
The above plotted table is by considering HL band
No. of
persons
in
database
No. of
persons
out of
database
Number
of
images
of each
person
Number
of the
test
image
EER TSR
5 5 15 17 0.000000 1.000000
5 5 15 18 0.100000 0.900000
5 5 15 19 0.200000 0.800000
5 5 15 20 0.200000 0.800000
7 3 15 17 0.000000 1.000000
7 3 15 18 0.142857 0.857143
7 3 15 19 0.333333 0.666667
7 3 15 20 0.142857 0.857143
6 4 15 17 0.000000 1.000000
6 4 15 18 0.000000 1.000000
6 4 15 19 0.250000 0.750000
6 4 15 20 0.166667 0.833333
7 3 12 20 0.285714 0.714286
7 3 12 13 0.100000 0.900000
7 3 12 15 0.200000 0.800000
7 3 12 16 0.142857 0.857143
7 3 12 18 0.142857 0.857143
7 3 12 17 0.000000 1.000000
7 3 12 19 0.333333 0.666667

31
REFERENCES
1. W. Zhao, R. Chellappa, P.J. Phillips and A. Rosenfeld,
“Face recognition: A literature survey,” ACM Comput.
Surv.,vol. 35, no. 4, pp 399–458 (2003).
2. Digital Image Processing Using MATLAB 2nd Ed. by
Gonzalez, Woods, and Eddin © 2009
3. Second edition, Digital Signal Processing using Matlab and
Wavelet Micheal Week, Georgia state university
4. Ramesh K , KB Raja, “Gram-schmidt orthoganalisation
based face recognition using DWT”, proceedings of
International Journal of engineering science and Technology
(IJEST), vol.3,No.1,Jan 2011.
5. N.V.S.L. Swarupa, D.Supriya, “face recognition system”,
Proceedings of International Journal of computer applications,
vol.1,No.29,2010.
6. Sulochana Sonkamble, Dr. Ravindra Thool, Balwant
sonkamble , “the survey of biometric recognition system and
their applications”, proceedings of Journal of Theoratical and
applied information Technology, 2005-2010.
7. http://en.wikipedia.org/wiki/DWT
8. http://en.wikipedia.org/wiki/Biometrics