Embed Size (px)
Citation preview
FACE Network*
Presented by: Bob NowakStan Smith
Assistance from: Hormoz BassiriRadTerri CharletDave EllsworthDave EvansLynn FenstermakerEric KnightPeter ReichParticipants of FACE 2000 Conference
* aka FACE Universal Network (Norby 2000)

F.U.N. Charges
1. How do the various experiments work together as a network?
2. Can we increase the efficiency of CO2 use?
3. What measurements are being conducted and can they be critically compared?
4. What general ecological principles are being discovered?
5. What is the value-added from the network?
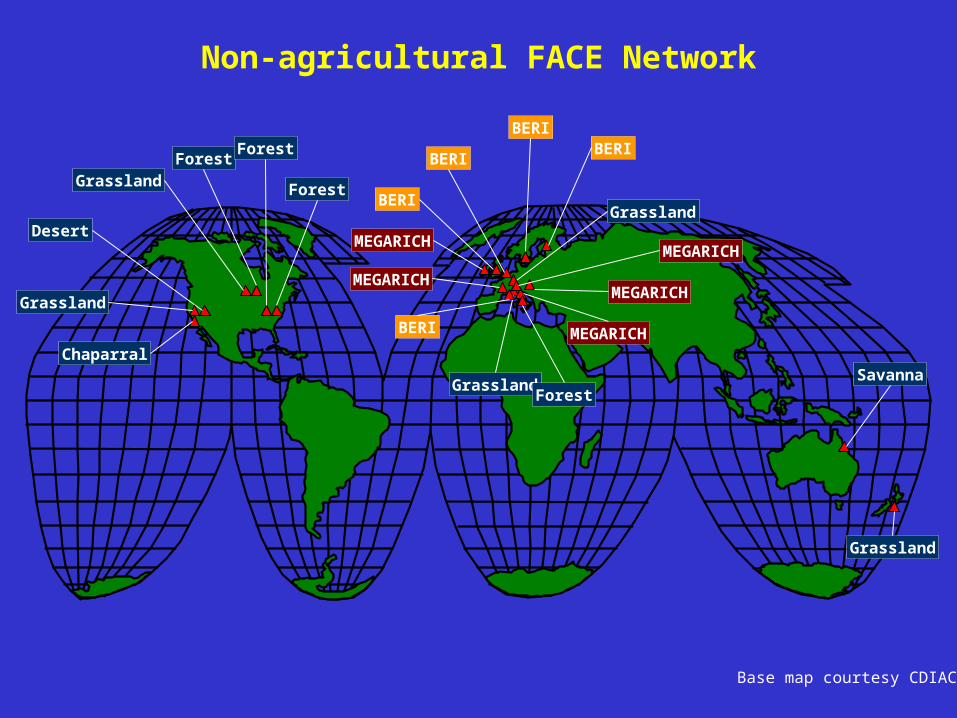
Non-agricultural FACE Network
ForestGrassland
Desert
Forest
Forest
Grassland
Chaparral
Grassland
Grassland
MEGARICH
Grassland
MEGARICH
BERI
BERI
MEGARICH
MEGARICH
BERI
MEGARICH
BERIBERI
ForestSavanna
Base map courtesy CDIAC
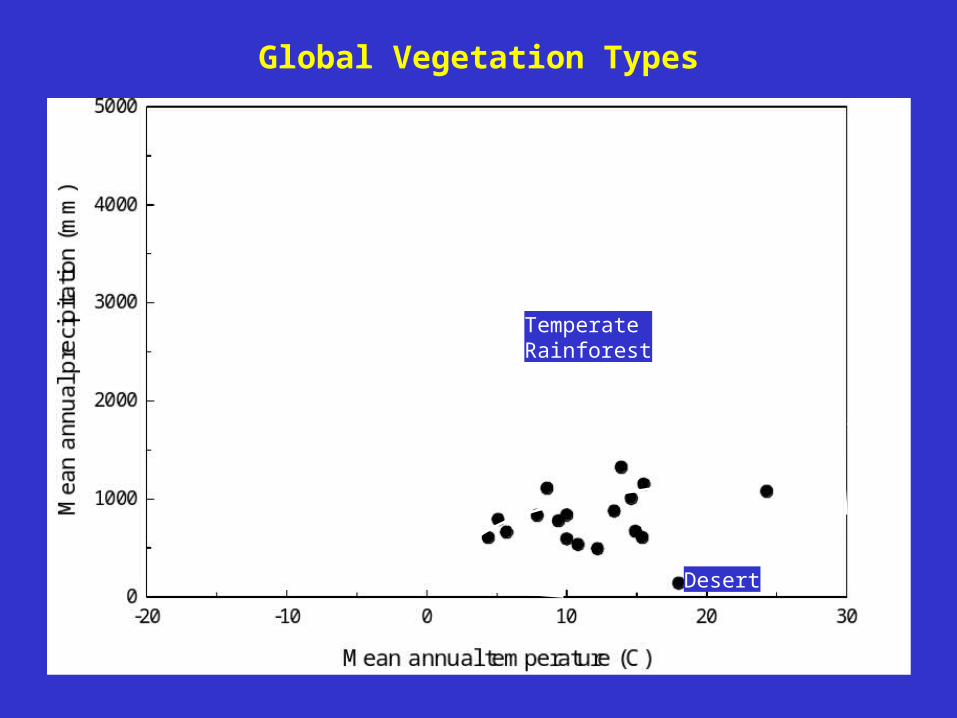
Global Vegetation Types
Tundra
Taiga
TemperateForest
Desert
Savanna
TropicalSeasonal Forest
TropicalRainforest
Grassland
TemperateRainforest
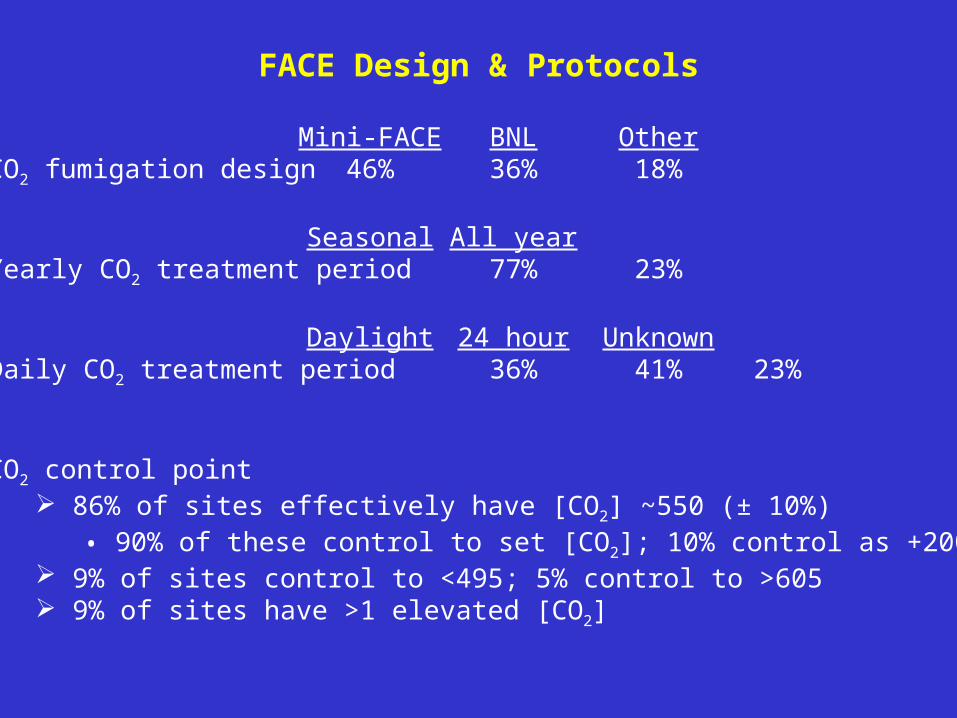
FACE Design & Protocols
Mini-FACE BNL OtherCO2 fumigation design 46% 36% 18%
Seasonal All yearYearly CO2 treatment period 77% 23%
Daylight 24 hour UnknownDaily CO2 treatment period 36% 41% 23%
CO2 control point 86% of sites effectively have [CO2] ~550 (± 10%)
• 90% of these control to set [CO2]; 10% control as +200 9% of sites control to <495; 5% control to >605 9% of sites have >1 elevated [CO2]
Increasing Efficiency of CO2 Use
Preventative maintenance• Keep CO2 delivery system sealed and fully operational
Potential design enhancements• Improve response time of system• Increase turbulence mixing

Turbulent Mixing: Vortex Generators
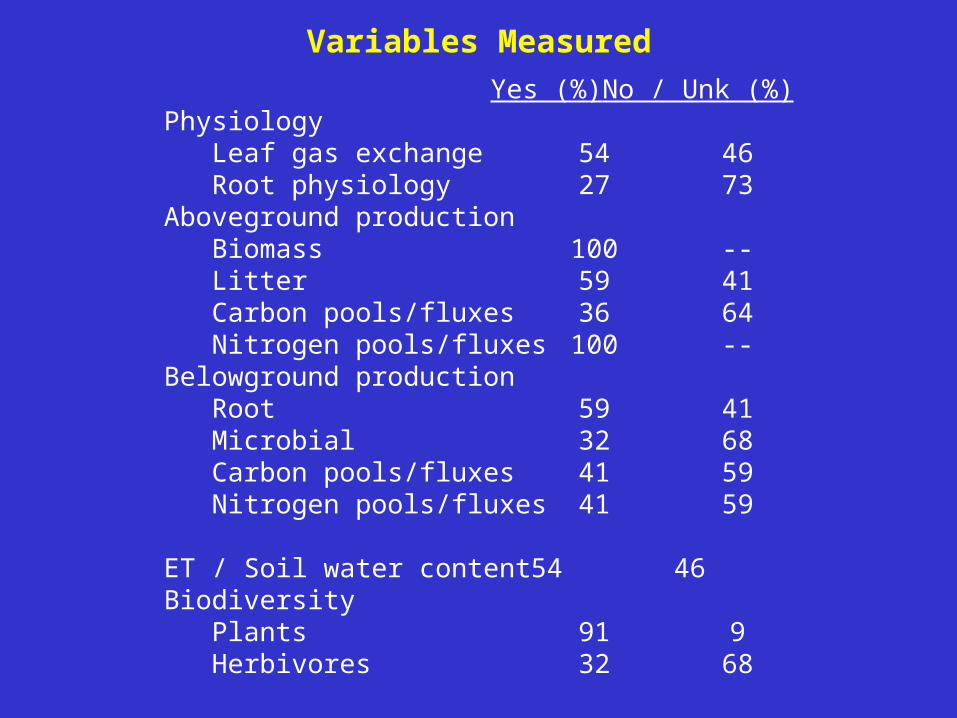
Variables Measured
Yes (%) No / Unk (%)Physiology
Leaf gas exchange 54 46Root physiology 27 73
Aboveground productionBiomass 100 --Litter 59 41Carbon pools/fluxes 36 64Nitrogen pools/fluxes 100 --
Belowground productionRoot 59 41Microbial 32 68Carbon pools/fluxes 41 59Nitrogen pools/fluxes 41 59
ET / Soil water content 54 46Biodiversity
Plants 91 9Herbivores 32 68
Predictions: Leaf physiology
Leaf photosynthesis increases under elevated CO2, although down-regulation may or may not occur
Stomatal conductance decreases under elevated CO2
Consequently, water use efficiency at the leaf level increases
Bet
ula
Pop
ulus
Ace
rB
rom
usA
grop
yron
Sol
idag
oP
inus
Liqu
idam
bar
Larr
eaA
mbr
osia
Sw
eetg
umC
otto
n
Rye
Pop
lar
Enh
ance
men
t of A
net b
y C
O2
(Ele
v/A
mb)
0.0
0.6
0.8
1.0
1.2
1.4
1.6
1.8
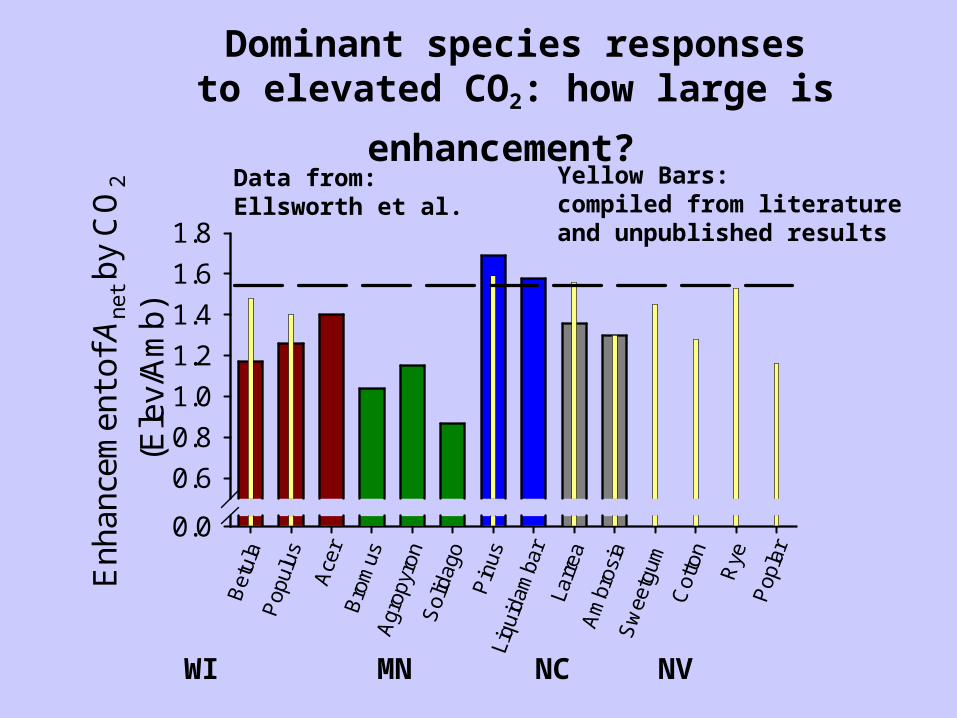
Dominant species responses
to elevated CO2: how large is enhancement? Data from:Ellsworth et al.
Yellow Bars:compiled from literatureand unpublished results
WI MN NC NV
Elev Na/Amb Na
0.6 0.8 1.0 1.2 1.4
Enh
ance
men
t,E
lev
A/A
mb
A
0.8
1.0
1.2
1.4
1.6
1.8BromusPoaLupinus
Achillea
Solidago
Anemone
Agropyron
Oenothera
Betula
Populus
Acer
Pinus
Liquidambar
Larrea
Ambrosia
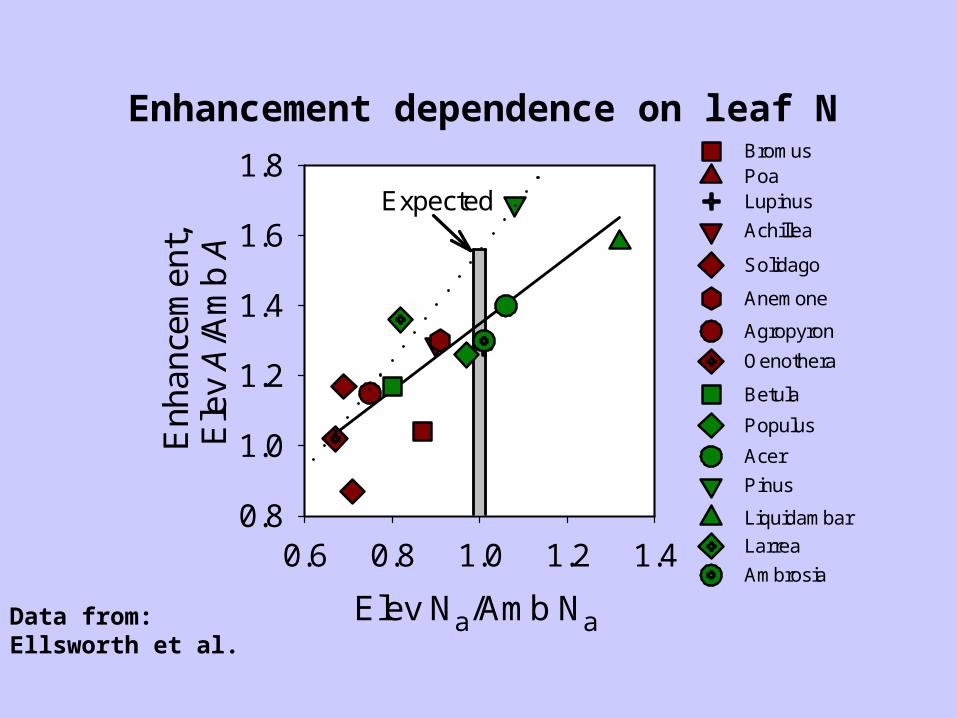
Expected
Enhancement dependence on leaf N
Data from:Ellsworth et al.
Elev N / Amb N
0.6 0.8 1.0 1.2 1.4
Enc
hanc
emen
t,E
lev
A /
Am
b A
0.8
1.0
1.2
1.4
1.6
1.8
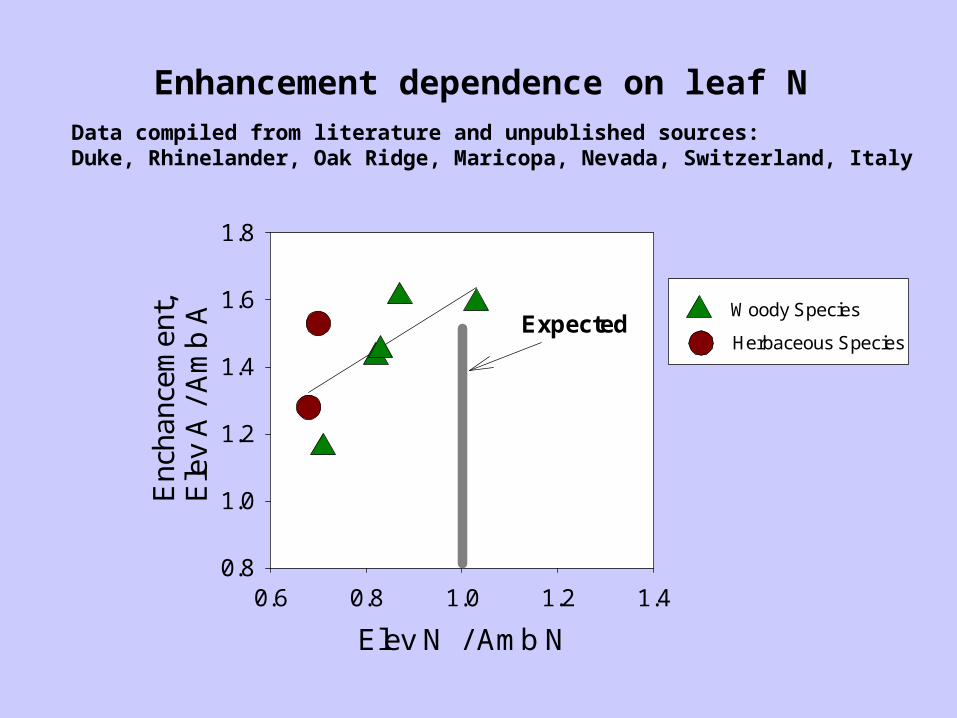
Woody Species
Herbaceous SpeciesExpected
Enhancement dependence on leaf NData compiled from literature and unpublished sources:Duke, Rhinelander, Oak Ridge, Maricopa, Nevada, Switzerland, Italy
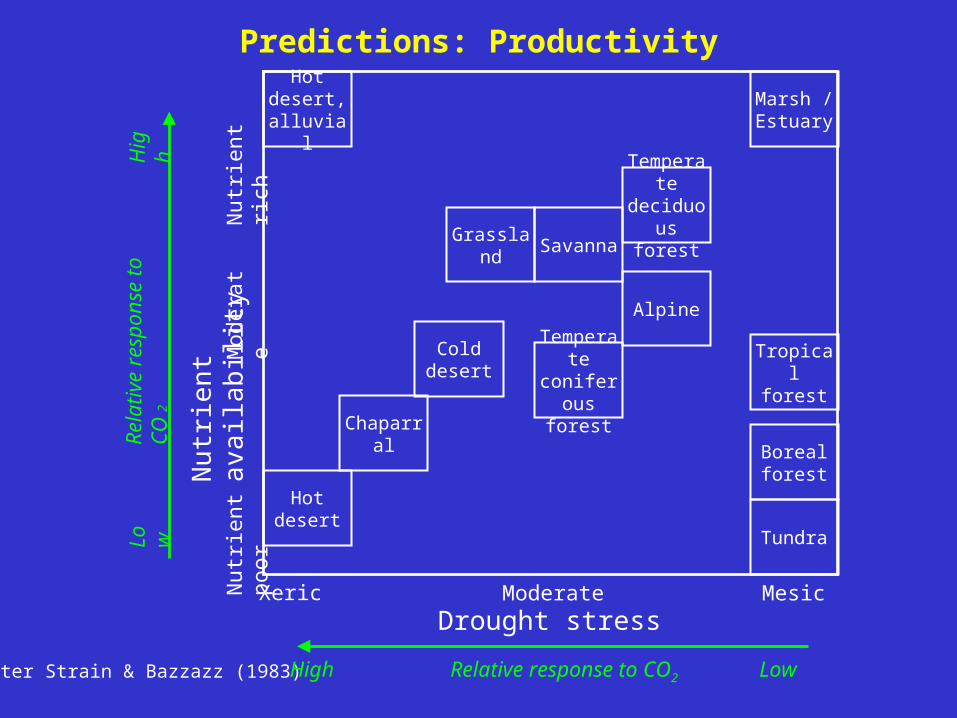
Predictions: Productivity
After Strain & Bazzazz (1983)
Xeric Moderate MesicDrought stress
Relative response to CO2High Low
Nut
rien
t po
orM
oder
ate
Nut
rien
t ri
ch
Nut
rien
t av
aila
bilit
y
Rel
ativ
e re
spon
se to
C
O2
Lo
wH
igh
Hot desert, alluvial
Hot desert
Alpine
Temperate deciduous
forest
Chaparral
Tropical forest
Boreal forest
Tundra
Marsh / Estuary
SavannaGrassland
Cold desert
Temperate coniferous
forest
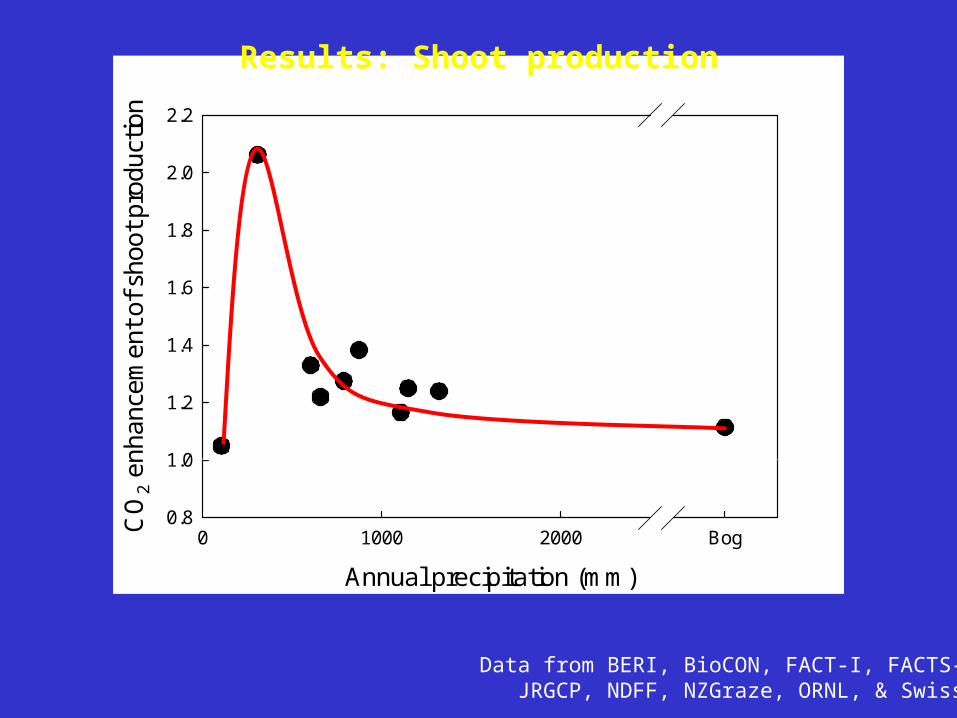
Data from BERI, BioCON, FACT-I, FACTS-II,JRGCP, NDFF, NZGraze, ORNL, & Swiss
Annual precipitation (mm)
0 1000 2000 Bog
CO
2 en
hanc
emen
t of
sho
ot p
rodu
ctio
n
0.8
1.0
1.2
1.4
1.6
1.8
2.0
2.2
Results: Shoot production
Predictions: Root processes
Because of greater carbon assimilation rates, root processes (growth, turnover, or exudation) increase under elevated CO2
Because of increased plant size (and despite decreased nutrient concentrations per unit tissue weight), whole-plant nutrient uptake increases
• BUT nutrient uptake per unit root length/biomass may or may not increase
Results: Root processes
Some sites have increased root biomass• Grasslands (BioCON, JRGC, Swiss)• Forests (FACTS-I, ORNL)
Some sites have no change in root biomass• Desert (NDFF)
Predictions: Water balance
Reduced stomatal conductance under elevated CO2 reduces leaf water use
If reduced conductance scales to the canopy, then canopy transpiration decreases and soil moisture is conserved under elevated CO2
• BUT increased growth (shoot and root) and increased canopy temperature at least partially offsets this conservation of soil moisture
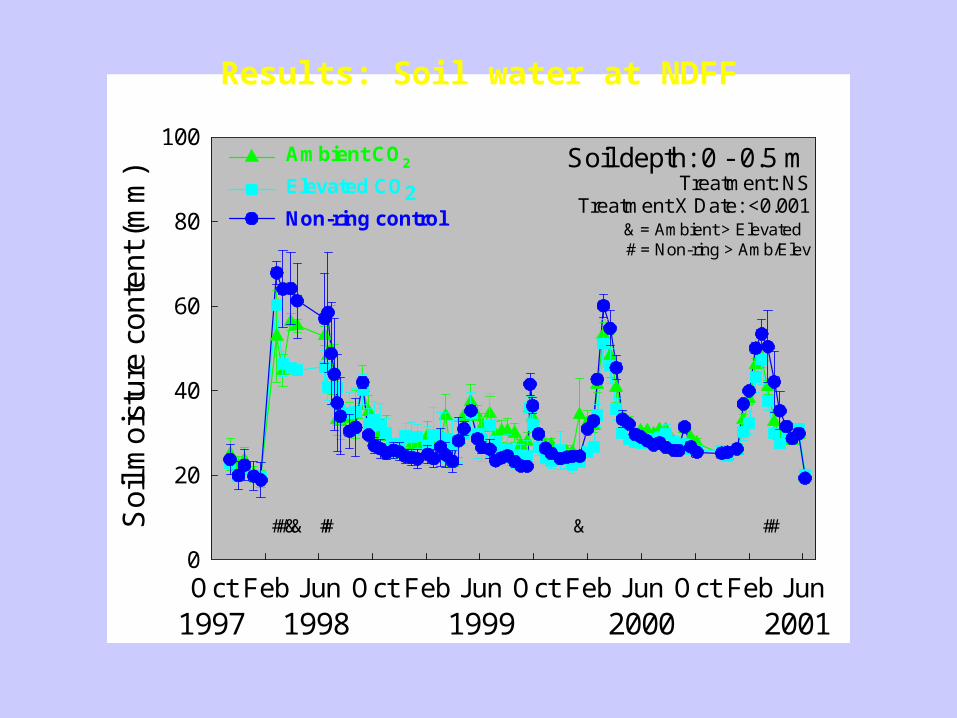
##&& ## & ##
Soil depth: 0 - 0.5 m
Oct Feb Jun Oct Feb Jun Oct Feb Jun Oct Feb Jun
Soi
l moi
stur
e co
nten
t (m
m)
0
20
40
60
80
100Ambient CO2
Elevated CO2Non-ring control
1997 1998 1999 2000 2001
Treatment: NSTreatment X Date: <0.001
& = Ambient > Elevated # = Non-ring > Amb/Elev
Results: Soil water at NDFF
Predictions: Nutrient cycling
Because of increased availability of carbon substrates, microbial activity, including N-fixers and mycorrhizae, increases, and thus alters N cycling
• BUT effects on N availability could be positive or could be negative
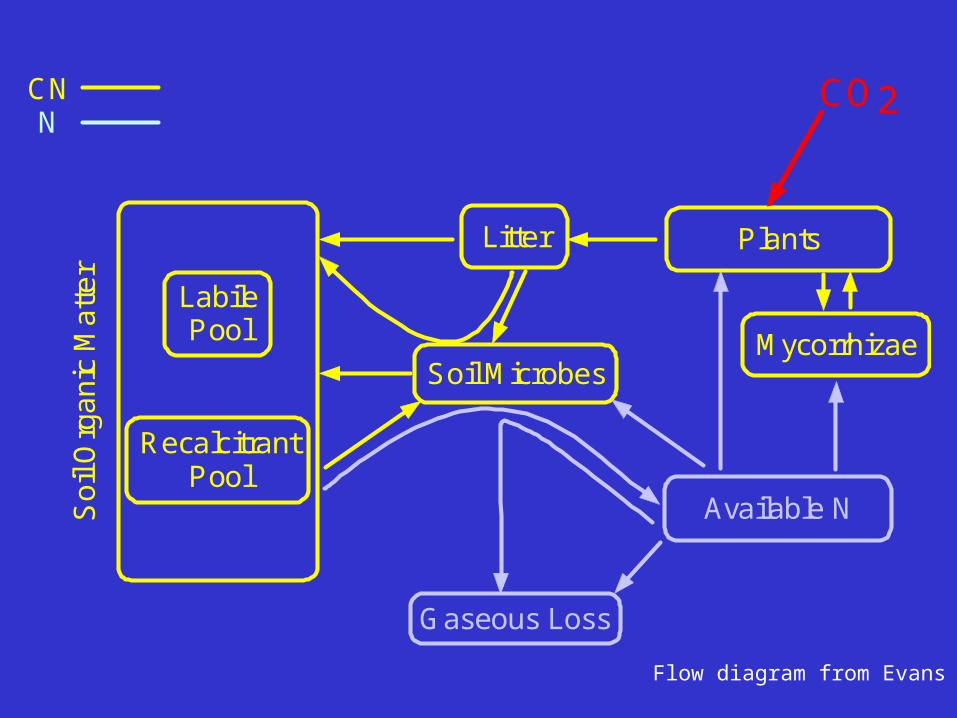
Soil Microbes
So
ilO
rga
nic
Ma
tter
LabilePool
RecalcitrantPool
Available N
Gaseous Loss
PlantsLitter
CO2CNN
Mycorrhizae
Flow diagram from Evans
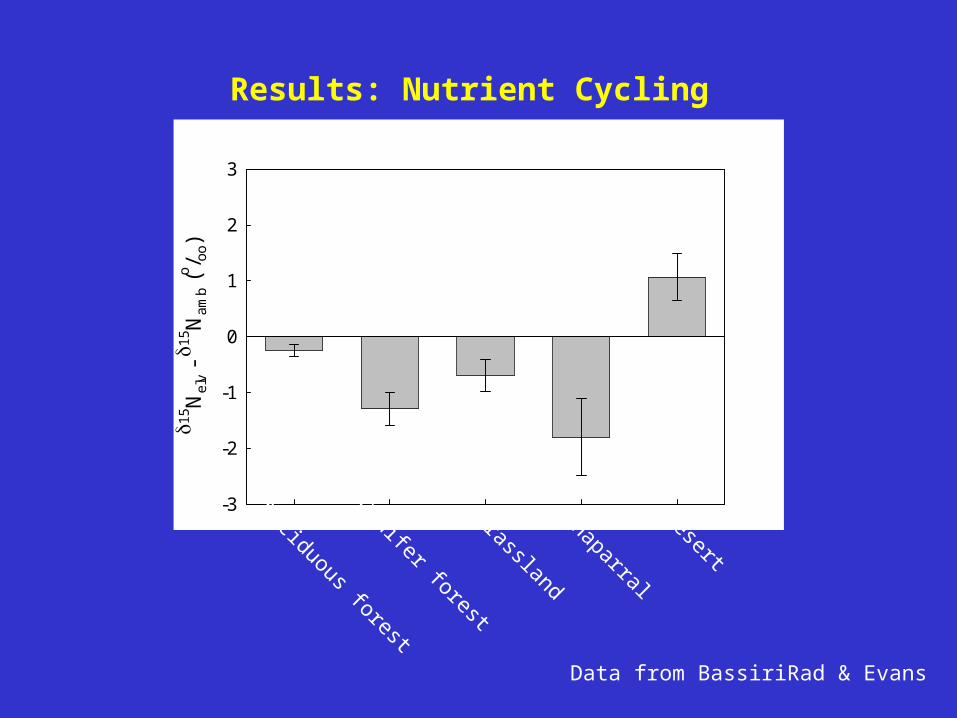
Results: Nutrient Cycling
15 N
elv
- 1
5 Nam
b (o / oo
)
-3
-2
-1
0
1
2
3
Deciduous forest
Conifer forest
Grassland
Chaparral
Desert
Data from BassiriRad & Evans
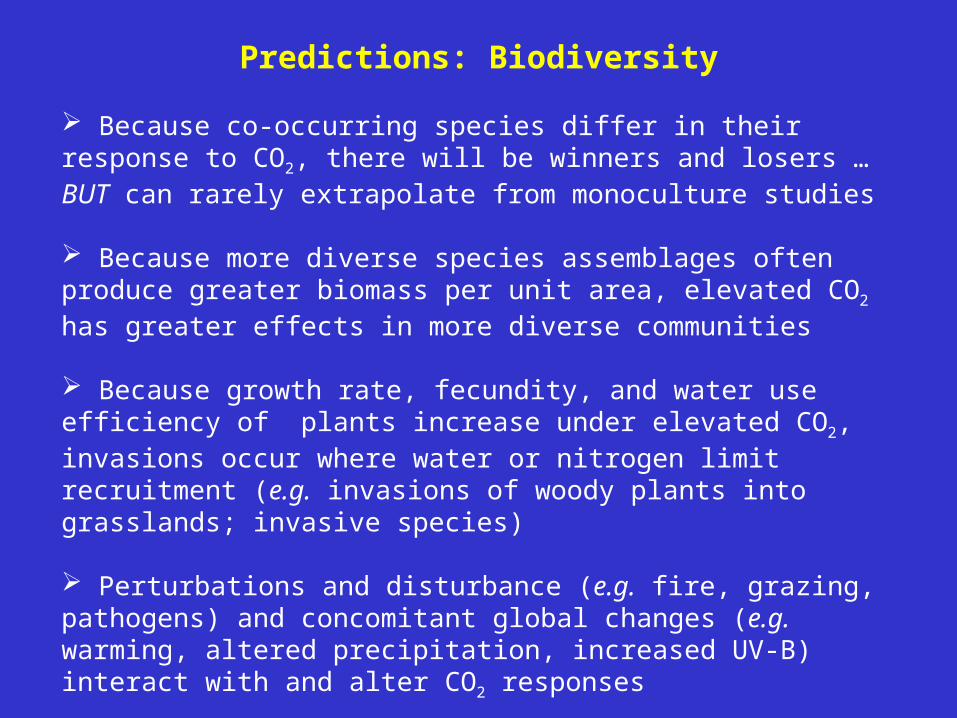
Predictions: Biodiversity
Because co-occurring species differ in their response to CO2, there will be winners and losers … BUT can rarely extrapolate from monoculture studies
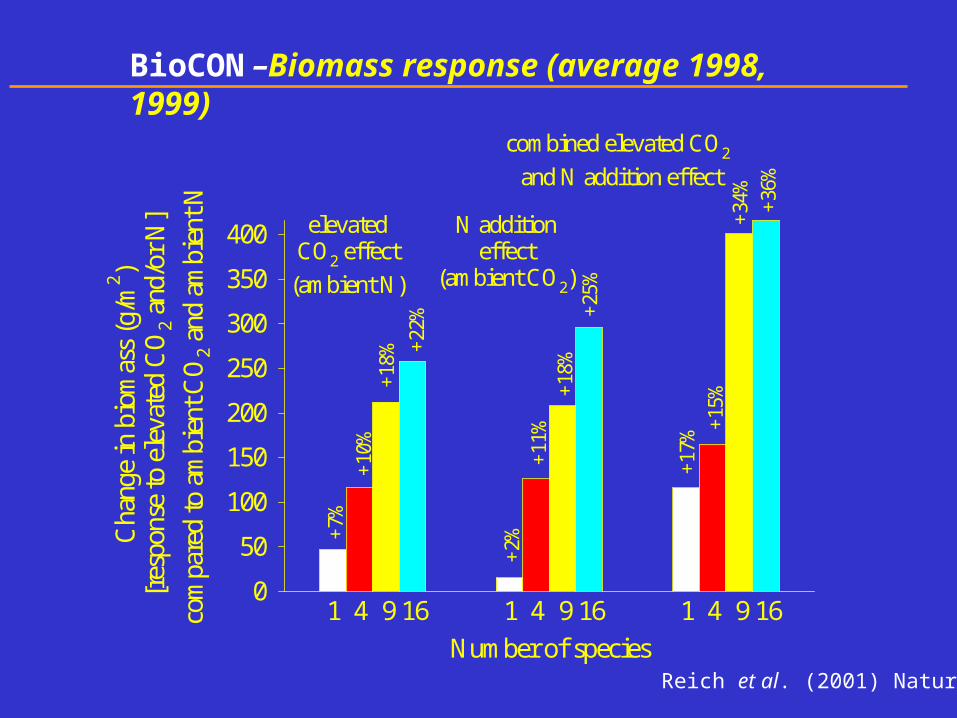
Because more diverse species assemblages often produce greater biomass per unit area, elevated CO2 has greater effects in more diverse communities
Because growth rate, fecundity, and water use efficiency of plants increase under elevated CO2, invasions occur where water or nitrogen limit recruitment (e.g. invasions of woody plants into grasslands; invasive species)
Perturbations and disturbance (e.g. fire, grazing, pathogens) and concomitant global changes (e.g. warming, altered precipitation, increased UV-B) interact with and alter CO2 responses
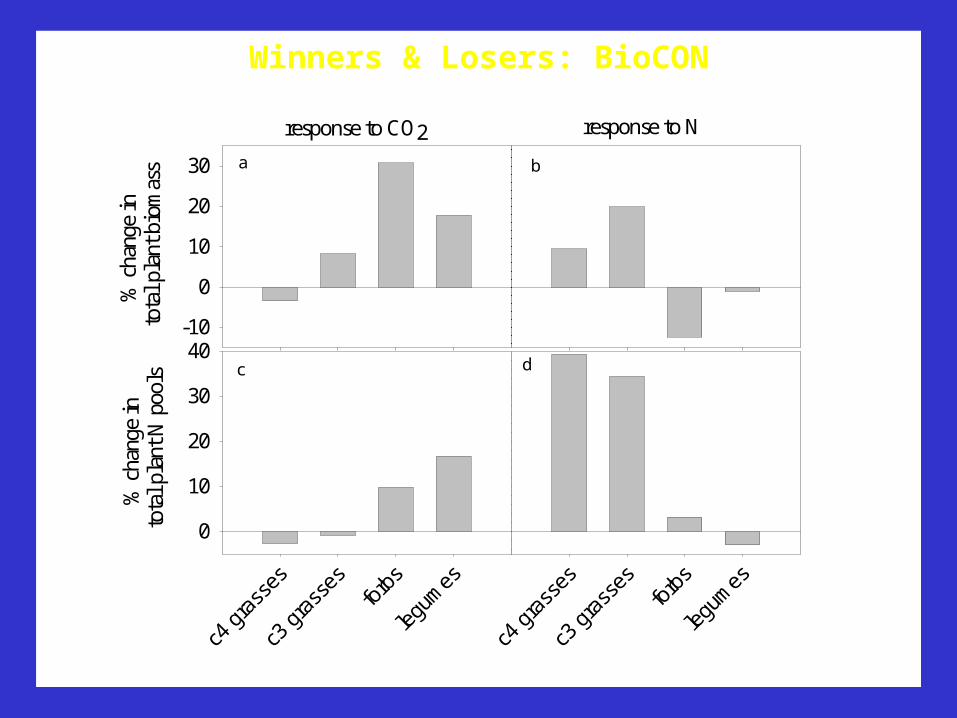
response to CO2%
cha
nge
in
tota
l pla
nt b
iom
ass
-10
0
10
20
30
response to N
c4 g
rass
es
c3 g
rass
esfo
rbs
legum
es
c4 g
rass
es
c3 g
rass
esfo
rbs
legum
es
% c
hang
e in
tota
l pla
nt N
poo
ls
0
10
20
30
40
a b
c d
Winners & Losers: BioCON
Data from Reich
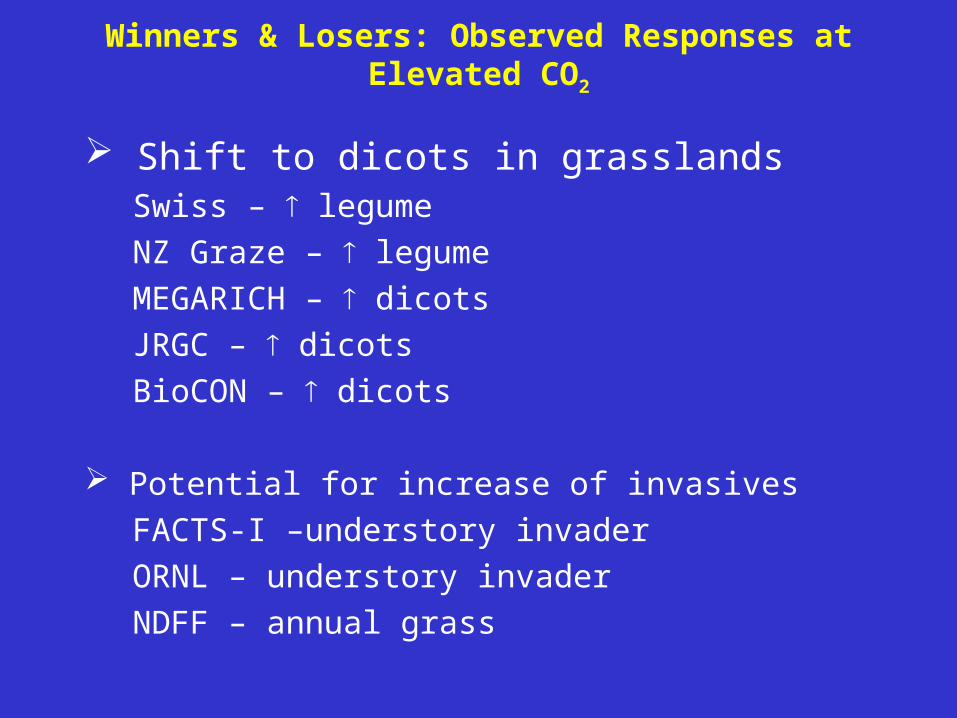
Winners & Losers: Observed Responses at Elevated CO2
Shift to dicots in grasslandsSwiss – legume
NZ Graze – legume
MEGARICH – dicots
JRGC – dicots
BioCON – dicots
Potential for increase of invasives
FACTS-I –understory invader
ORNL – understory invader
NDFF – annual grass
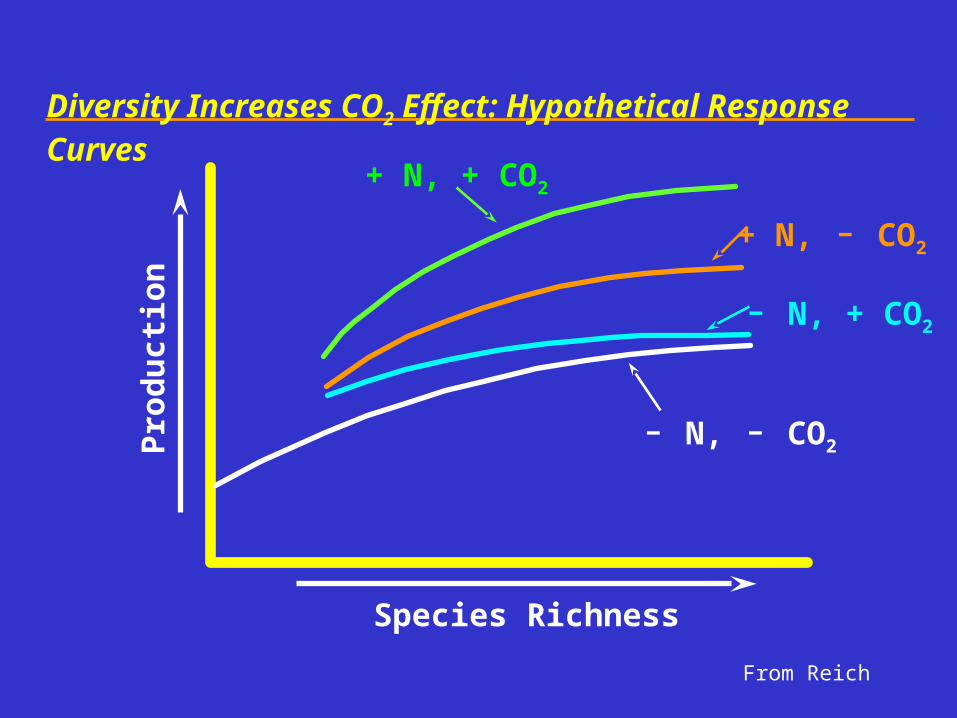
Species Richness
Pro
du
ctio
n+ N, + CO2
+ N, - CO2
- N, - CO2
- N, + CO2
Diversity Increases CO2 Effect: Hypothetical Response Curves
From Reich
Number of species
Cha
nge
in b
iom
ass
(g/m
2 )[r
espo
nse
to e
leva
ted
CO
2 an
d/or
N]
com
pare
d to
am
bien
t CO
2 an
d am
bien
t N
0
50
100
150
200
250
300
350
400
1 4 9 16 1 4 9 16 1 4 9 16
elevatedCO2 effect
(ambient N)
N additioneffect
(ambient CO2)
combined elevated CO2
and N addition effect
+18
%
+7%
+10
%+
18% +
22%
+2%
+11
%
+17
%+
15%
+34
%+
36%
+25
%
BioCON –Biomass response (average 1998, 1999)
Reich et al. (2001) Nature
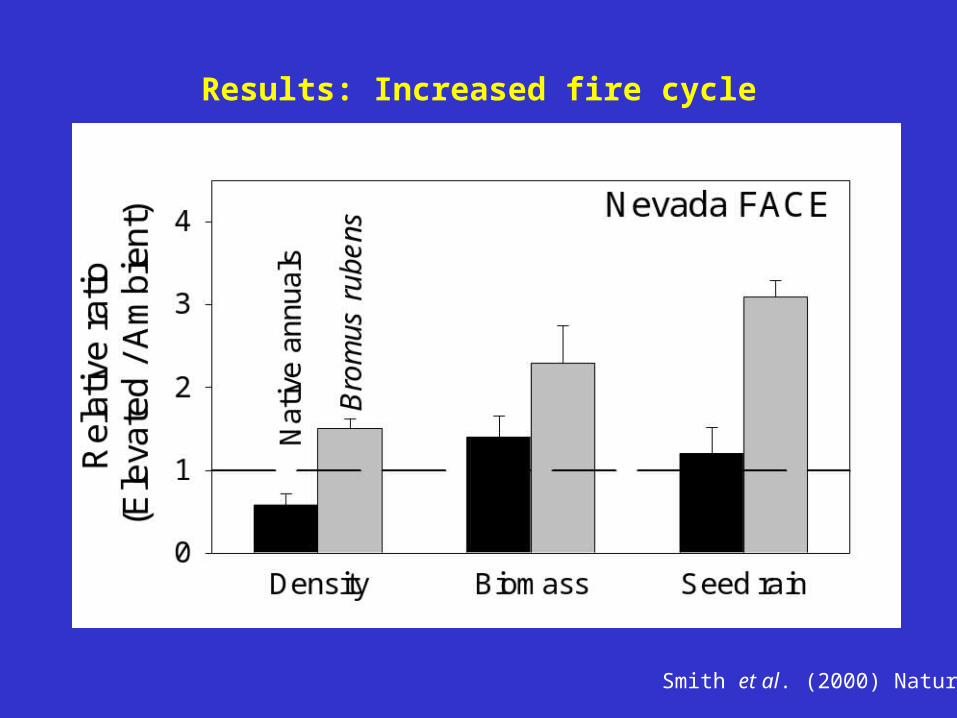
Results: Increased fire cycle
Smith et al. (2000) Nature
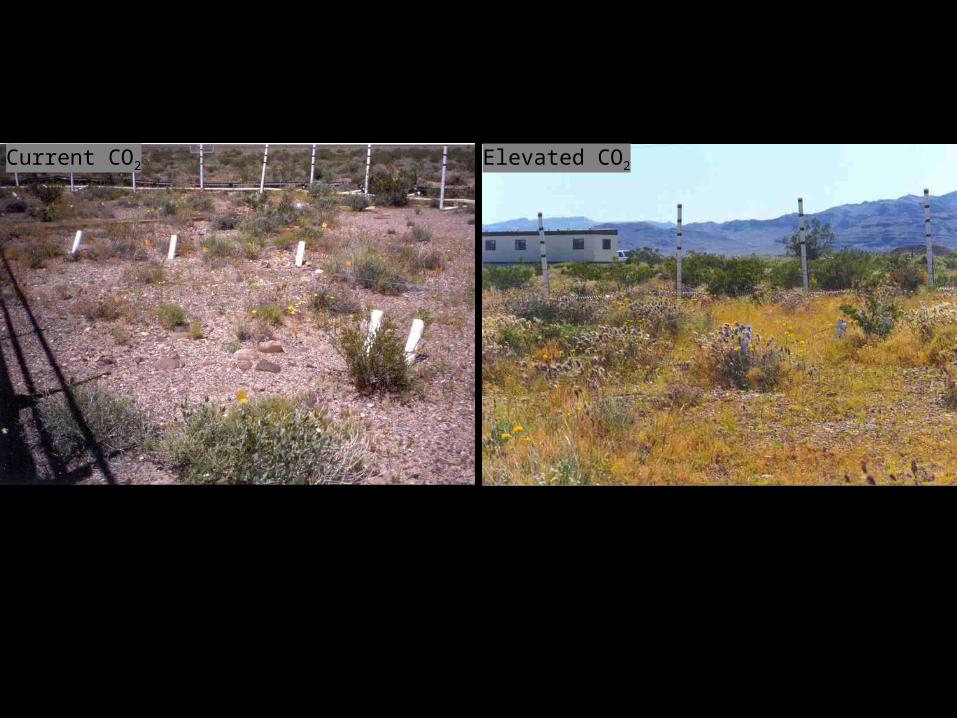
Elevated CO2Current CO2
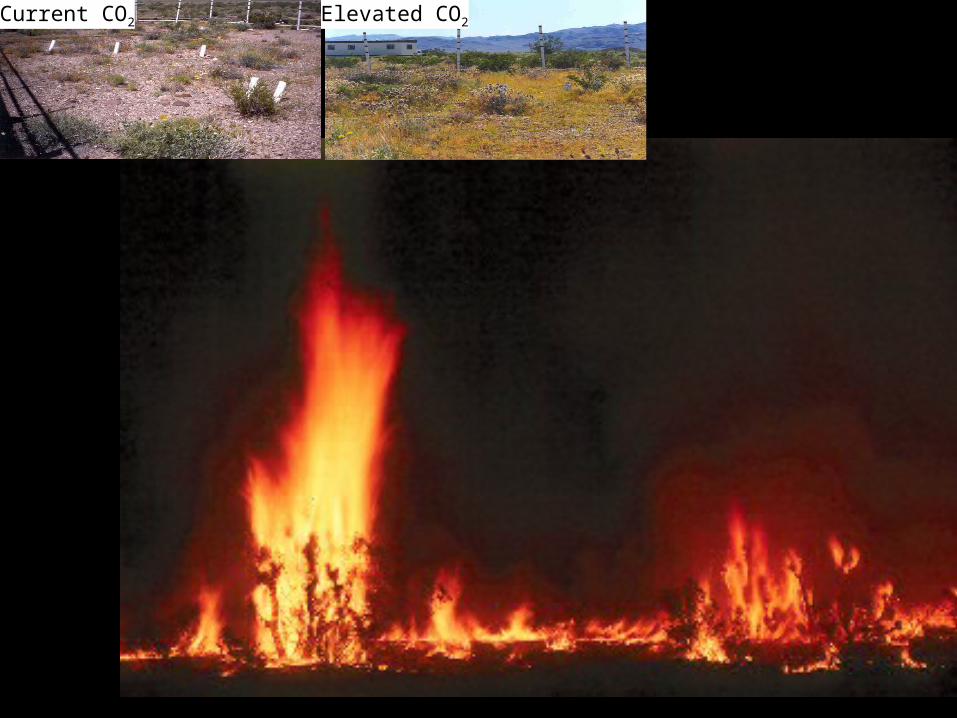
Elevated CO2Current CO2
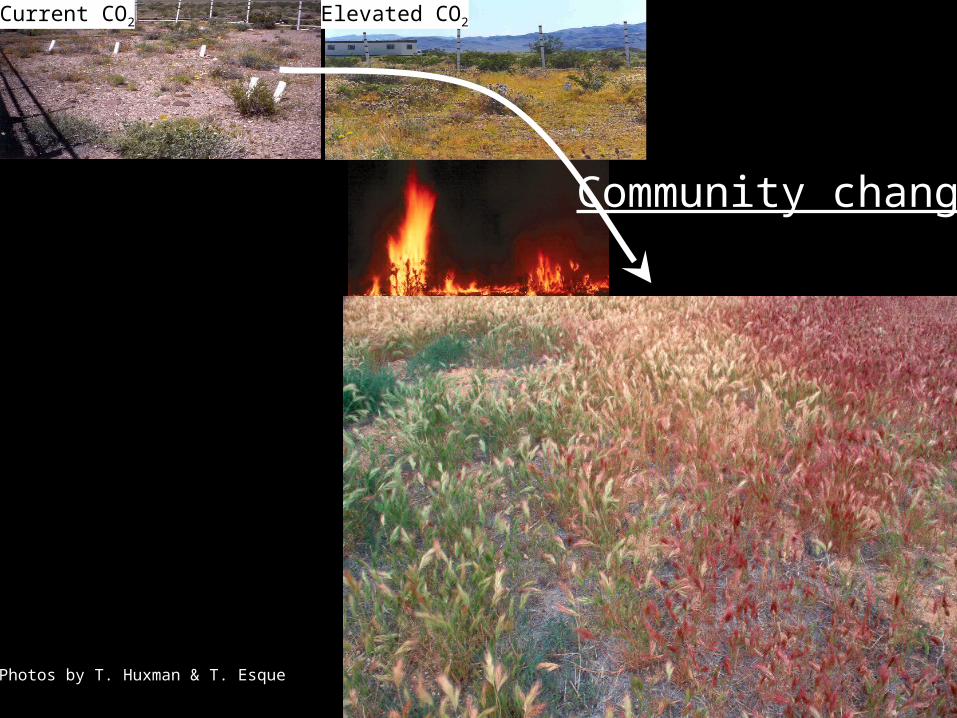
Community change
Photos by T. Huxman & T. Esque
Elevated CO2Current CO2
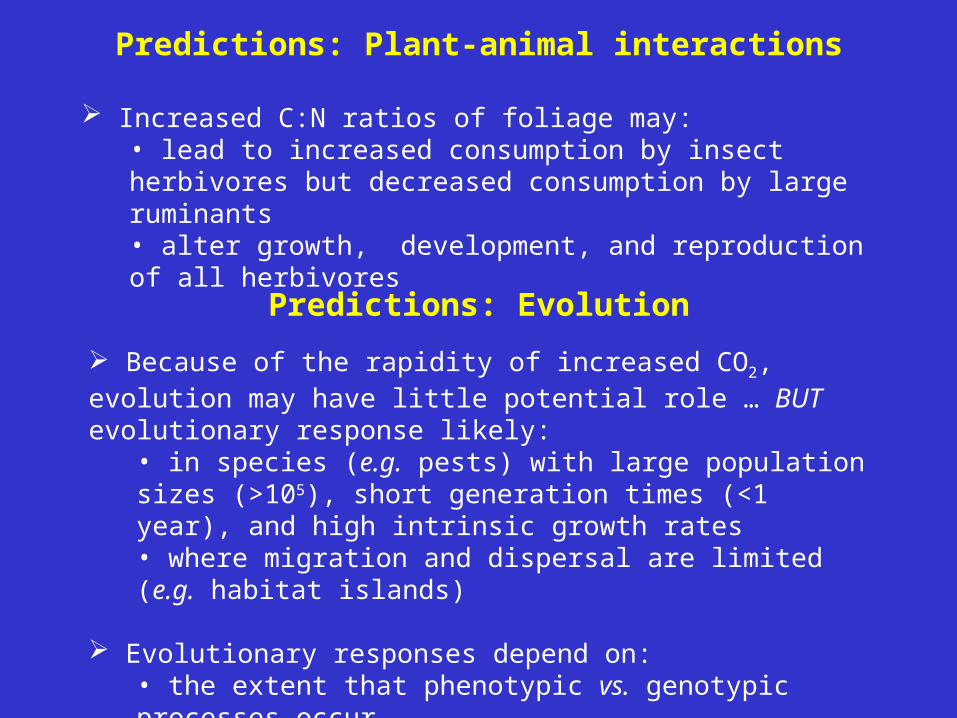
Predictions: Evolution
Because of the rapidity of increased CO2, evolution may have little potential role … BUT evolutionary response likely:
• in species (e.g. pests) with large population sizes (>105), short generation times (<1 year), and high intrinsic growth rates• where migration and dispersal are limited (e.g. habitat islands)
Evolutionary responses depend on:• the extent that phenotypic vs. genotypic processes occur• resource availability, including population density• level of intraspecific variation, especially compared to interspecific variation
Predictions: Plant-animal interactions
Increased C:N ratios of foliage may:• lead to increased consumption by insect herbivores but decreased consumption by large ruminants• alter growth, development, and reproduction of all herbivores
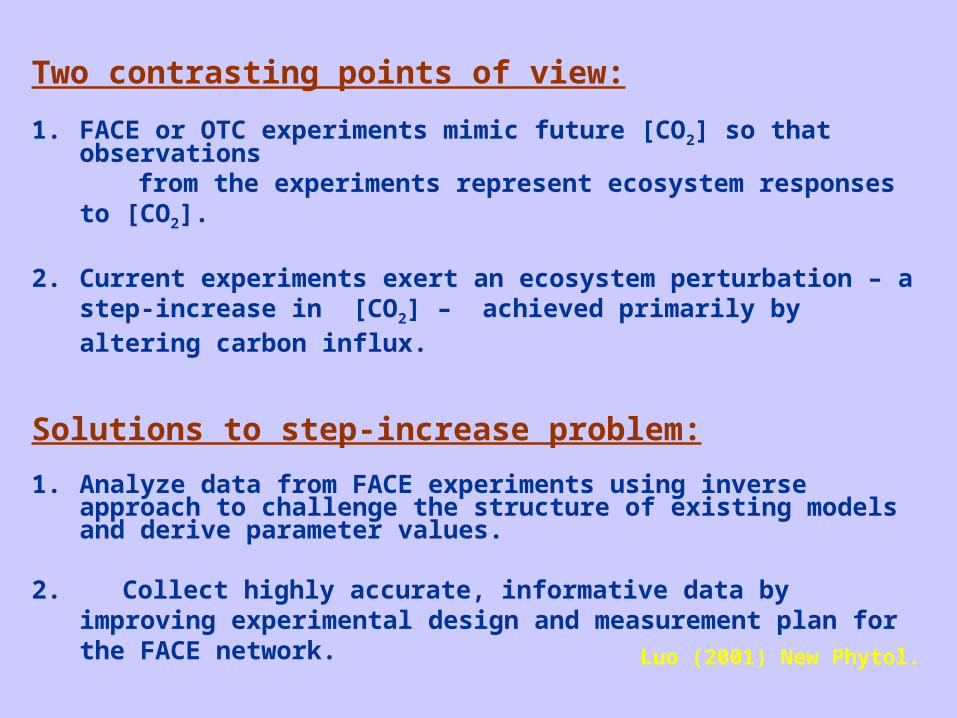
Two contrasting points of view:
1. FACE or OTC experiments mimic future [CO2] so that observations from the experiments represent ecosystem responses to [CO2].
2. Current experiments exert an ecosystem perturbation – a step-increase in [CO2] – achieved primarily by altering carbon influx.
Solutions to step-increase problem:
1. Analyze data from FACE experiments using inverse approach to challenge the structure of existing models and derive parameter values.
2. Collect highly accurate, informative data by improving experimental design and measurement plan for the FACE network.
Luo (2001) New Phytol.

Need for Data Archives
Facilitate cross-site comparisons Compiled results
data means, relative enhancements with SE, in data base, spreadsheet, or ASCII format
New ways to analyze old data Raw data sets
quality checked, quality controlled
FACE NETWORK Should some measurements be taken at every site? Can we standardize measurement protocols? How and where to archive the data?
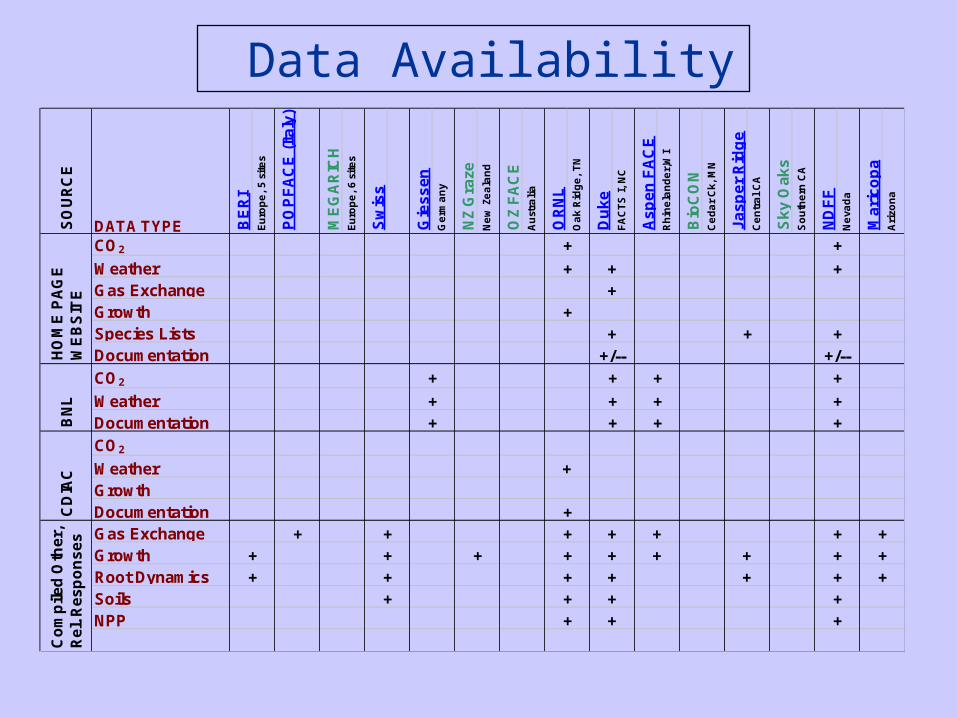
Data Availability
CO2
WeatherGas ExchangeGrowthSpecies ListsDocumentation
CO2
WeatherDocumentation
CO2
WeatherGrowthDocumentationGas ExchangeGrowthRoot DynamicsSoilsNPP
DATA TYPE BE
RI
Eu
rop
e,
5 si
tes
OR
NL
Ne
w Z
ea
lan
d
ME
GA
RIC
H
PO
PF
AC
E (
Ita
ly)
Sw
iss
As
pe
n F
AC
E
Oa
k R
idg
e,
TN
Du
ke
FA
CT
S I
, N
C
Ma
ric
op
aA
rizo
na
Ce
ntr
al
CA
Sk
y O
ak
sS
ou
the
rn C
A
ND
FF
SO
UR
CE
Ne
vad
a
Eu
rop
e,
6 si
tes
Bio
CO
NC
ed
ar
Ck,
MN
Ja
sp
er
Rid
ge
Rh
ine
lan
de
r,W
I
NZ
Gra
ze
+/-- +/--
+ ++ + +
++
+ + +
HO
ME
PA
GE
W
EB
SIT
E
++
CD
IAC
+
+
Gie
ss
en
Ge
rma
ny
OZ
FA
CE
Au
stra
lia
+
BN
L + +++ +
+ ++ +
Co
mp
iled
Oth
er,
R
el.
Re
sp
on
se
s +++
+ + + + + ++ + + + + + + ++ + + + + ++ + + +
+ + +
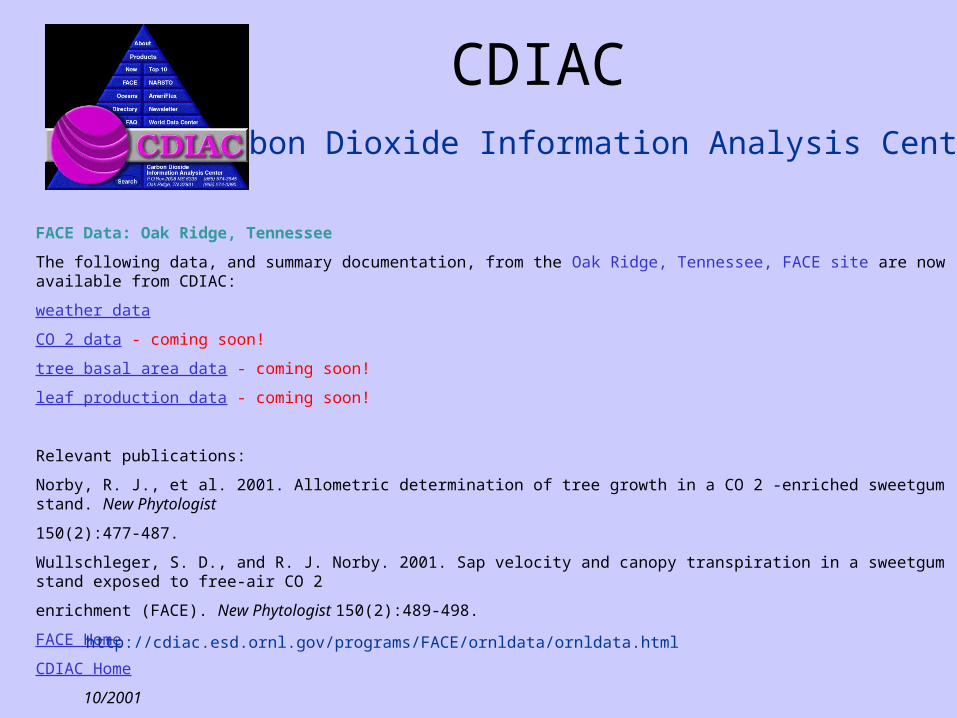
CDIAC Carbon Dioxide Information Analysis Center
FACE Data: Oak Ridge, Tennessee
The following data, and summary documentation, from the Oak Ridge, Tennessee, FACE site are now available from CDIAC:
weather data
CO 2 data - coming soon!
tree basal area data - coming soon!
leaf production data - coming soon!
Relevant publications:
Norby, R. J., et al. 2001. Allometric determination of tree growth in a CO 2 -enriched sweetgum stand. New Phytologist
150(2):477-487.
Wullschleger, S. D., and R. J. Norby. 2001. Sap velocity and canopy transpiration in a sweetgum stand exposed to free-air CO 2
enrichment (FACE). New Phytologist 150(2):489-498.
FACE Home
CDIAC Home
10/2001 http://cdiac.esd.ornl.gov/programs/FACE/ornldata/ornldata.html
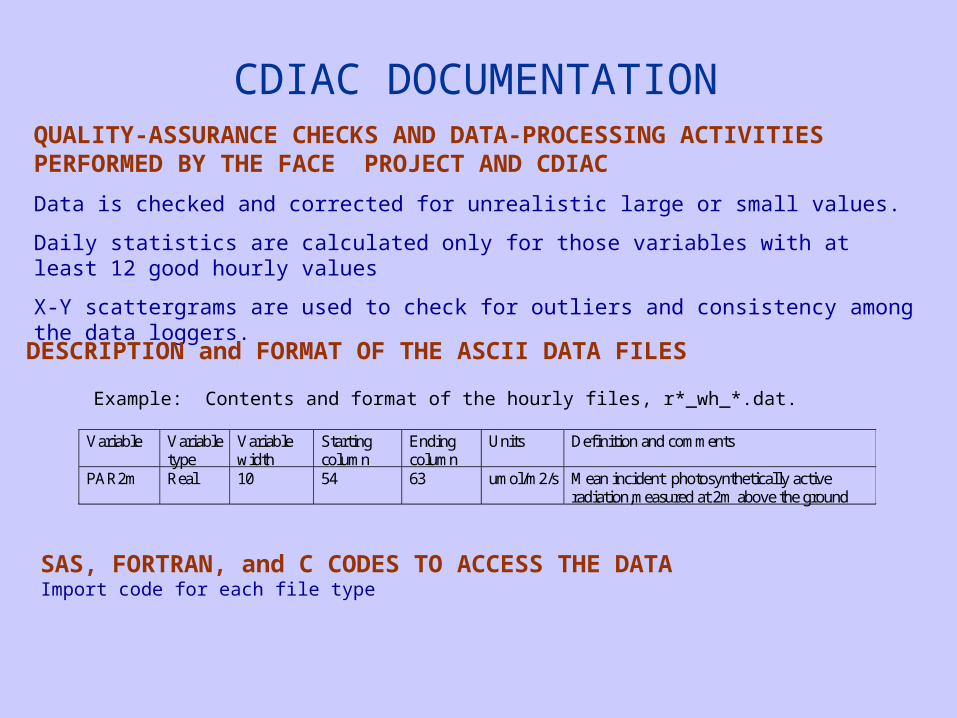
QUALITY-ASSURANCE CHECKS AND DATA-PROCESSING ACTIVITIES PERFORMED BY THE FACE PROJECT AND CDIAC
Data is checked and corrected for unrealistic large or small values.
Daily statistics are calculated only for those variables with at least 12 good hourly values
X-Y scattergrams are used to check for outliers and consistency among the data loggers.
Example: Contents and format of the hourly files, r*_wh_*.dat.
CDIAC DOCUMENTATION
DESCRIPTION and FORMAT OF THE ASCII DATA FILES
Variable Variable
type Variable width
Starting column
Ending column
Units Definition and comments
PAR2m Real 10 54 63 umol/m2/s Mean incident photosynthetically active radiation,measured at 2m above the ground
SAS, FORTRAN, and C CODES TO ACCESS THE DATAImport code for each file type

F.U.N. Charges
1. How do the various experiments work together as a network?
2. Can we increase the efficiency of CO2 use?
3. What measurements are being conducted and can they be critically compared?
4. What general ecological principles are being discovered?
5. What is the value-added from the network?