Embed Size (px)
Citation preview

1The Sentencing Project • 1705 DeSales Street NW, 8th Floor • Washington, D.C. 20036 • sentencingproject.org
FACT SHEET: TRENDS IN U.S. CORRECTIONS
Trends in U.S. CorrectionsU.S. State and Federal Prison Population, 1925-2019
Source: Bureau of Justice Statistics Prisoners Series.
International Rates of Incarceration per 100,000
Data sourced from the World Prison Brief website, compiled and hosted by the Institute of Crime and Justice Policy Research at Birckbeck, University of London.
2019: 1,380,427
India
Sweden
Denmark
Germany
France
Canada
China
Spain
Australia
Russia
Brazil
Rwanda
El Salvador
United States 639
511
572
357
331
160
122
121
104
93
69
68
68
35
0
200,000
400,000
600,000
800,000
1,000,000
1,200,000
1,400,000
1,600,000
Num
ber o
f Peo
ple
2019
2016
2012
2008
2004
2000
1996
1992
1988
1984
1980
1976
1972
1968
1964
1960
1956
1952
1948
1944
1940
1936
1932
1925
2The Sentencing Project • 1705 DeSales Street NW, 8th Floor • Washington, D.C. 20036 • sentencingproject.org
FACT SHEET: TRENDS IN U.S. CORRECTIONS
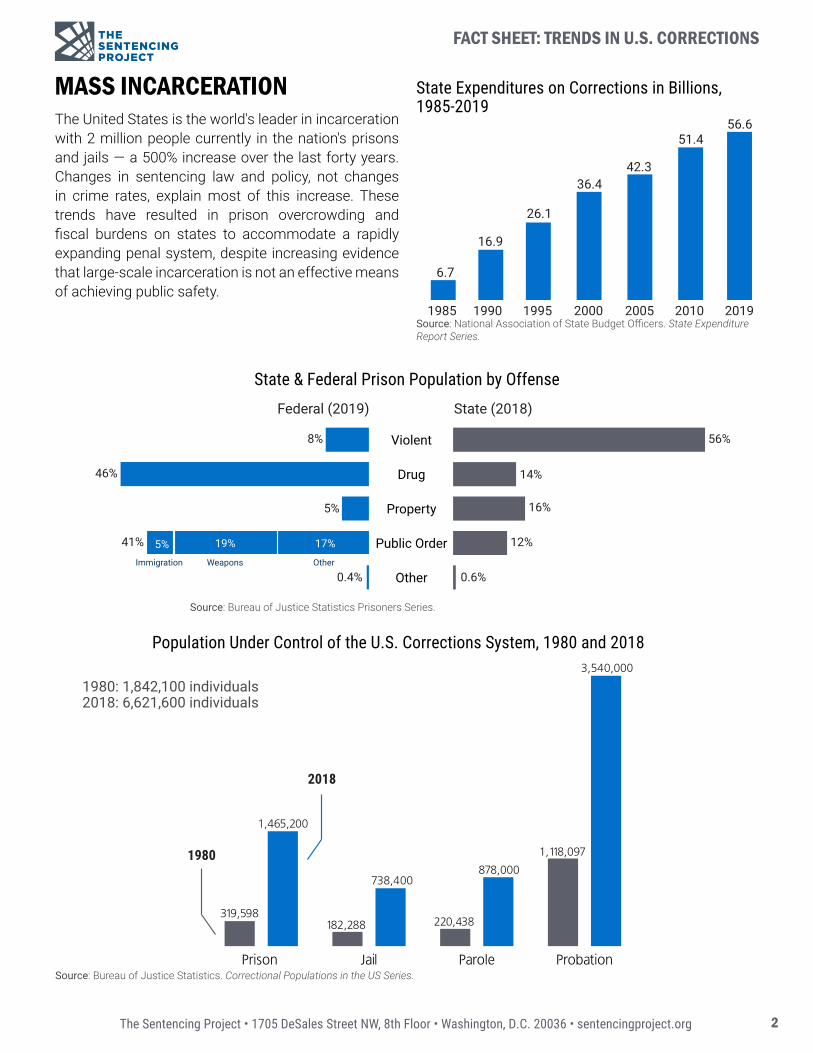
State Expenditures on Corrections in Billions, 1985-2019
Source: National Association of State Budget Officers. State Expenditure Report Series.
Population Under Control of the U.S. Corrections System, 1980 and 2018
Source: Bureau of Justice Statistics. Correctional Populations in the US Series.
MASS INCARCERATIONThe United States is the world's leader in incarceration with 2 million people currently in the nation's prisons and jails — a 500% increase over the last forty years. Changes in sentencing law and policy, not changes in crime rates, explain most of this increase. These trends have resulted in prison overcrowding and fiscal burdens on states to accommodate a rapidly expanding penal system, despite increasing evidence that large-scale incarceration is not an effective means of achieving public safety.
State & Federal Prison Population by Offense
Source: Bureau of Justice Statistics Prisoners Series.
1980: 1,842,100 individuals2018: 6,621,600 individuals
ProbationParoleJailPrison
319,598
1,465,200
182,288
738,400
220,438
878,000
1,118,097
3,540,000
2018
1980
36.4
6.7
16.9
26.1
51.4
42.3
56.6
2019201020052000199519901985
Other
Public Order
Property
Drug
Violent
Weapons Other
8%
46%
5%
41%
0.4%
Federal (2019) State (2018)
56%
14%
16%
12%
0.6%Immigration
5% 19% 17%

3The Sentencing Project • 1705 DeSales Street NW, 8th Floor • Washington, D.C. 20036 • sentencingproject.org
FACT SHEET: TRENDS IN U.S. CORRECTIONS
Number of Sentenced People in Federal Prisons for Drug Offenses, 1980-2019
Sources: Bureau of Justice Statistics Prisoners Series.
Number of People in Prisons and Jails for Drug Offenses, 1980 and 2019
Sources: Carson, E.A. (2021). Prisoners in 2019. Washington, DC: Bureau of Justice Statistics; James, D.J. (2004). Profile of Jail Inmates, 2002. Washington, DC: Bureau of Justice Statistics; Zeng, Z. (2020). Jail Inmates in 2018. Washington, DC: Bureau of Justice Statistics.
Sentencing policies of the War on Drugs era resulted in dramatic growth in incarceration for drug offenses. Since its official beginning in the 1980s, the number of Americans incarcerated for drug offenses has skyrocketed from 40,900 in 1980 to 430,926 in 2019. Furthermore, harsh sentencing laws such as mandatory minimums keep many people convicted of drug offenses in prison for longer periods of time: in 1986, people released after serving time for a federal drug offense had spent an average of 22 months in prison. By 2004, people convicted on federal drug offenses were expected to serve almost three times that length: 62 months in prison.
At the federal level, people incarcerated on a drug conviction make up nearly half the prison population. At the state level, the number of people in prison for drug offenses has increased nine-fold since 1980, although it has begun declining in recent years. Most are not high-level actors in the drug trade, and most have no prior criminal record for a violent offense.
DRUG POLICY
1980: 40,900 individuals2019: 430,926 individuals
JailsFederal PrisonsState Prisons
19,000
176,300
73,204
4,70017,200
181,422
1980
2019
20192010200520001995199019851980
4,749
22,037 30,470
56,989
74,276
131,739
97,800
186,545
9,491
35,555
52,782
88,658 87,800
160,524
73,204
158,107
Drug offensesAll offenses

4The Sentencing Project • 1705 DeSales Street NW, 8th Floor • Washington, D.C. 20036 • sentencingproject.org
FACT SHEET: TRENDS IN U.S. CORRECTIONS
Highest and Lowest State Incarceration Rates (per 100,000), 2019
Source: Carson, E.A. (2021). Prisoners in 2019. Washington, DC: Bureau of Justice Statistics.
WOMENNumber of Women in State and Federal Prisons, 1980-2019
Sources: Bureau of Justice Statistics Prisoners Series; Minor-Harper, S. (1986). State and Federal Prisoners, 1925-1985. Washington, DC: Bureau of Justice Statistics.
Overall (All States = 371)State RateHIGHEST
Louisiana 680
Oklahoma 639
Mississippi 636
Arkansas 586
Arizona 558
LOWEST
Massachusetts 133
Maine 146
Rhode Island 156
Minnesota 176
Vermont 182
Women (All States = 54)State Rate
HIGHEST
Idaho 138
Oklahoma 129
Kentucky 128
South Dakota 127
Wyoming 118
LOWEST
Massachusetts 10
Rhode Island 11
New Jersey 15
New York 19
Maine 22
Men (All States = 698)State RateHIGHEST
Louisiana 1,320
Oklahoma 1,158
Mississippi 1,224
Arkansas 1,089
Arizona 1,010
LOWEST
Massachusetts 263
Maine 275
Rhode Island 309
Minnesota 331
Vermont 341
State Prison
Federal Prison201920152010200520001995199019851980
13,25823,099
68,468
43,845
93,234
107,518112,822
107,955111,491
5The Sentencing Project • 1705 DeSales Street NW, 8th Floor • Washington, D.C. 20036 • sentencingproject.org
FACT SHEET: TRENDS IN U.S. CORRECTIONS
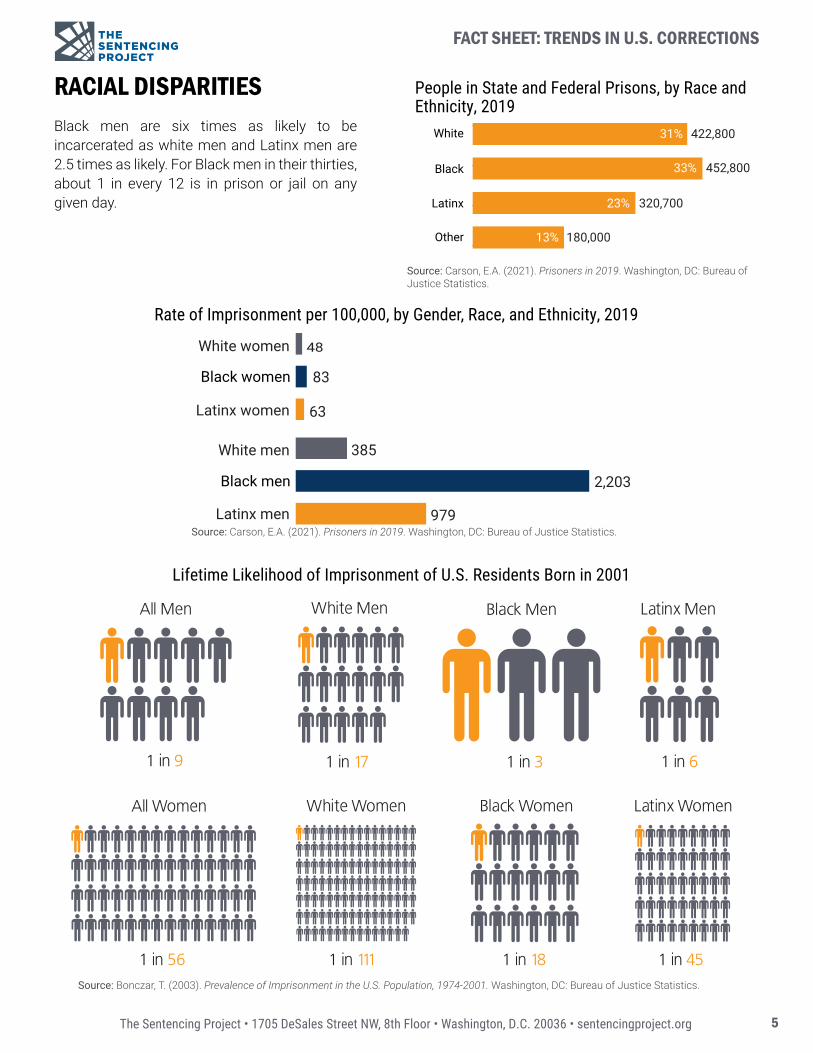
Lifetime Likelihood of Imprisonment of U.S. Residents Born in 2001
Source: Bonczar, T. (2003). Prevalence of Imprisonment in the U.S. Population, 1974-2001. Washington, DC: Bureau of Justice Statistics.
Rate of Imprisonment per 100,000, by Gender, Race, and Ethnicity, 2019
Source: Carson, E.A. (2021). Prisoners in 2019. Washington, DC: Bureau of Justice Statistics.
People in State and Federal Prisons, by Race and Ethnicity, 2019
Source: Carson, E.A. (2021). Prisoners in 2019. Washington, DC: Bureau of Justice Statistics.
RACIAL DISPARITIESBlack men are six times as likely to be incarcerated as white men and Latinx men are 2.5 times as likely. For Black men in their thirties, about 1 in every 12 is in prison or jail on any given day.
Other
Latinx
Black
White 422,800
452,800
320,700
180,000
31%
33%
23%
13%
Black men
Black women
White women
Latinx women
White men
Latinx men
48
83
63
979
385
2,203
White Women Latinx WomenBlack Women
White Men Latinx MenBlack Men
1 in 111 1 in 451 in 18
1 in 17 1 in 61 in 3
All Women
1 in 56
All Men
1 in 9

6The Sentencing Project • 1705 DeSales Street NW, 8th Floor • Washington, D.C. 20036 • sentencingproject.org
FACT SHEET: TRENDS IN U.S. CORRECTIONS
Number of Youth Confined in Jails and State Prisons, 1985-2019
Sources: Austin, J., Johnson, K. D., & Gregoriou, M. (2000). Juveniles in Adult Prisons and Jails: A National Assessment. Washington, DC: Bureau of Justice Assistance; Bureau of Justice Statistics Prison and Jail Inmates at Midyear Series; Bureau of Justice Statistics Prisoner Series; Strom, K. J. (2000). Profile of State Prisoners under Age 18, 1985-1997. Washington, DC: Bureau of Justice Statistics.
YOUTHSince 1999, commitment to secure juvenile facilities for youth who have been adjudicated delinquent has been steadily declining from a high point of 77,835 in 1999 to 26,972 in 2017. Still, troubling problems remain. Youth of color enter the system much more frequently than white youth and are more likely to be sentenced to harsher terms of punishment. In addition, young people are transferred to the adult system each year and tried as if they were adults, and many are sent to adult prisons and jails to serve their sentences.
Number of Youth Committed to Juvenile Facilities, 1999-2017
Source: Sickmund, M., Sladky, T.J., Kang, W., & Puzzanchera, C. (2019). Easy Access to the Census of Juveniles in Residential Placement. Available: http://www.ojjdp.gov/ojstatbb/ezacjrp.
Rate of Secure Placement of Juveniles per 100,000, by Race and Ethnicity, 2017
Source: Sickmund, M., Sladky, T.J., Kang, W., & Puzzanchera, C. (2019). Easy Access to the Census of Juveniles in Residential Placement. Available: http://www.ojjdp.gov/ojstatbb/ezacjrp.
20172015201320112010200720062003200119991997
75,406
48,423
64,53268,982
76,19077,835
60,412
41,934
31,48735,246
26,972
Asian
American Indian
Latinx
Black
White 55
226
71
149
11
2011
2009
2007
2005
2003
2001
1997
1995
1993
1991
1989
1987
1985
2013
Youth in adult prisons: 653
Youth in adult jails: 2,900
1999
3,000
6,000
9,000
12,000
15,000
2015
2019

7The Sentencing Project • 1705 DeSales Street NW, 8th Floor • Washington, D.C. 20036 • sentencingproject.org
FACT SHEET: TRENDS IN U.S. CORRECTIONS
In 48 states, a felony conviction can result in the loss of an individual’s voting rights. The period of disenfranchisement varies by state, with some states restoring the vote upon completion of a prison term, and others effectively disenfranchising for life. As a result of the dramatic expansion of the criminal justice system in the last 40 years, felony disenfranchisement has affected the political voice of many communities. As of 2020, 5.2 million Americans were unable to vote due to state felony disenfranchisement policies.
FELONY DISENFRANCHISEMENT
No restriction Prison Prison & parole
Prison, parole& probation
Prison, parole, probation& post-sentence
Felony Disenfranchisement Restrictions by State, 2021
Disenfranchised Population by Incarceration Status, 2020
Source: Uggen, C., Larson, R., Shannon, S, & Pulido-Navo, A. (2020). Locked Out 2020: Estimates of People Denied Voting Rights Due to a Felony Conviction. Washington, DC: The Sentencing Project.
Uggen, C., Larson, R., Shannon, S, & Pulido-Navo, A. (2020). Locked Out 2020: Estimates of People Denied Voting Rights Due to a Felony Conviction. Washington, DC: The Sentencing Project.
Rate of Disenfranchisement, by Race/Ethnicity, 2020
Source: Uggen, C., Larson, R., Shannon, S, & Pulido-Navo, A. (2020). Locked Out 2020: Estimates of People Denied Voting Rights Due to a Felony Conviction. Washington, DC: The Sentencing Project.
All Others
Latinx
African American 6.3%
2%
1.6%
Completed sentence
On probation or parole
In prison or jail 25%
32%
43%

8The Sentencing Project • 1705 DeSales Street NW, 8th Floor • Washington, D.C. 20036 • sentencingproject.org
FACT SHEET: TRENDS IN U.S. CORRECTIONS
8
This fact sheet was updated May 2021.
The Sentencing Project works for a fair and effective U.S. justice system by promoting reforms in sentencing policy, addressing unjust racial disparities and practices, and advocating for alternatives to incarceration.1705 DeSales Street NW, 8th Floor
Washington, D.C. 20036
sentencingproject.org
The number of people serving life sentences endures even while serious, violent crime has been declining for the past 20 years and little public safety benefit has been demonstrated to correlate with increasingly lengthy sentences. This population has nearly quintupled since 1984. One in seven people in prison are serving life with parole, life without parole, or virtual life (50 years or more).
Number of People Serving Life Sentences, 1984-2020
Relative Expansion of Life Without Parole, 2003-2020
LIFE SENTENCES
0%
20%
40%
60%
80%
Life Without ParoleLife With Parole
12%
66%
20202016201220082005200319921984
34,000
69,845
127,677132,000
142,727
157,966
204,191 203,865
Age 55 or more
Less than 55
30%
70%
Source: Nellis, A. (2021). No End In Sight: America’s Enduring Reliance on Life Imprisonment. Washington, DC: The Sentencing Project.
Percent of Life Sentenced Population Who Are 55 and Older